Article

Quantitative Evaluation of Soil Erosion in Loess Hilly Area of Western Henan Based on Sampling Approach

1
School of Geographical Sciences, Xinyang Normal University, Xinyang 464000, China
2
North–South Transitional Zone Typical Vegetation Phenology Observation and Research Station of Henan Province, Xinyang 464000, China
3
Soil and Water Conservation Monitoring Station of Henan Province, Zhengzhou 450008, China
4
Institute of International Rivers and Eco-Security, Yunnan University, Kunming 650500, China
*
Author to whom correspondence should be addressed.
Water 2024, 16(20), 2895; https://doi.org/10.3390/w16202895
Submission received: 14 September 2024 / Revised: 5 October 2024 / Accepted: 9 October 2024 / Published: 12 October 2024
(This article belongs to the Special Issue Soil Erosion and Soil and Water Conservation)

Abstract

:
The terrain in the loess hilly area of western Henan is fragmented, with steep slopes and weak soil erosion resistance. The substantial soil erosion in this region results in plenty of problems, including decreased soil productivity and ecological degradation. These problems significantly hinder the social and economic development in the region. Soil conservation planning and ecological development require accurate soil erosion surveys. However, the studies of spatio-temporal patterns, evolution, and the driving force of soil erosion in this region are insufficient. Therefore, based on a multi-stage, unequal probability, systematic area sampling method and field investigation, the soil erosion of the loess hilly area of western Henan was quantitatively evaluated by the Chinese Soil Loss Equation (CSLE) in 2022. The impact forces of soil erosion were analyzed by means of a geographic detector and multiple linear regression analysis, and the key driving factors of the spatio-temporal evolution of soil erosion in this region were revealed. The results were as follows. (1) The average soil erosion rate of the loess hilly area in western Henan in 2022 was 5.94 t⋅ha−1⋅a−1, with a percentage of soil erosion area of 29.10%. (2) High soil erosion rates mainly appeared in the west of Shangjie, Xingyang, and Jiyuan, which are related to the development of production and construction projects in these areas. The areas with a high percentage of soil erosion area were in the north (Xinan and Yima), west (Lushi), and southeast (Songxian and Ruyang) of the study area. Moreover, areas with the most erosion were found in forest land, cultivated land, and areas with a slope above 25°. (3) At the landscape level, the number and density of patches of all land types, except orchard land, increased significantly, and the boundary perimeter, landscape pattern segmentation, and degree of fragmentation increased. (4) The geographical detector and multiple linear regression analysis indicated that the driving forces of soil erosion are mainly topographic and climatic (slope length, elevation, precipitation, and temperature). Soil erosion was significantly influenced by the density of landscape patches. These maps and factors influencing soil erosion can serve as valuable sources of information for regional soil conservation plans and ecological environment improvements.

1. Introduction

Soil erosion, which is the main contributor to soil degradation and pollution, severely restricts sustainable development in terms of resources, environment, and socio-economic aspects [1]. As stated in the China Soil and Water Conservation Bulletin (2023), in the past few decades, China has faced severe soil erosion, placing it among the countries with the highest levels globally. Soil erosion can be attributed to various factors, such as agricultural activities, mining operations, urban development, and road construction. In 2023, the total soil erosion area was 2.6276 million square kilometers. It was found that the area impacted by water erosion encompassed 1.0714 million square kilometers, representing approximately 40.77% of the overall erosion area; among the areas of soil erosion, wind erosion affected a vast area, covering approximately 1.5562 million square kilometers, which represented 59.23% [2].
The soil erosion evaluation serves as the foundation for soil degradation control and is an effective method for measuring the effects of soil and water conservation [3]. The models that estimate and predict soil erosion are divided into three categories: empirical statistical model, physical genetic model, and distributed model [4]. The Universal Soil Loss Equation (USLE) and Revised Universal Soil Loss Equation (RUSLE) are typical empirical statistical models [5,6]. Chinese scholars have also created empirical statistical models, including the Chinese Soil Loss Equation (CSLE) [7]. The CSLE is an improved version of the USLE and was developed to quantitatively evaluate soil erosion by considering the characteristics of landforms and soil conservation practices in China. After parameter calibration, the CSLE performed better than the USLE/RUSLE for soil erosion assessments in China [8]. Due to its high data accessibility, sufficient information basis, and extensive use of data, these models have gained widespread recognition and global application. At the regional scale, two main approaches (grid-based surveys and sampling-based surveys) were applied in soil erosion surveys [9]. The 2011 national soil erosion survey of China applied a stratified unequal probability system sampling method [10]. Sampling-based surveys were sourced from the National Resources Inventory of the United States. The sample units were selected by a stratified two-stage spatial sampling approach. Based on the field survey and USLE/RUSLE, the soil loss rate of each sample point was calculated and reflected the soil loss on the nation’s non-federal lands [11,12]. In addition, a separate study discovered that sampling methods are more precise than grid methods when estimating soil erosion rates. It was also observed that grid methods tend to significantly overestimate soil erosion rates [13].
Henan is a significant province known for its agricultural prowess and grain production in the Central Plains. Henan Province is a province with a large population and serious soil erosion in China, and soil erosion is mainly concentrated in the loess hilly areas of western Henan [14]. The quantitative assessment of soil erosion in the loess hilly area of western Henan was carried out to analyze its spatio-temporal variation characteristics and explore the factors associated with soil erosion so as to provide a scientific basis for the better protection of limited cultivated land resources, the realization of regional high-quality development, and soil conservation. Scholars have studied soil erosion in the loess hilly area of western Henan and have put forward some countermeasures and suggestions to return farmland to forests and grasslands according to site conditions [15]. Some scholars used 3S technology to reveal spatial evolution and distribution characteristics of erosion gullies and found that the erosion phenomenon was serious in Lushi County and Song County, among which Lingbao City and Ruyang County possessed the most extensive soil erosion region [16]. Based on the analysis of physical and geographical conditions, the situation of soil erosion, its causes, and its adverse effects on sustainable socio-economic development, strategies for soil and water conservation in the loess hilly area of western Henan have been put forward [17].
Further studies about the characteristics, distribution, type, and influence of soil erosion were needed in the loess hilly area of western Henan. There has been a scarcity of quantitative analysis regarding the spatial distribution of soil erosion using sampling methods in the loess hilly region of Western Henan since 2011. Research on the driving force analysis of soil erosion is insufficient. During the field survey conducted in the loess hilly area in western Henan, a stratified unequal probability systematic sampling method was utilized to select the units for study. Through the field investigation of soil erosion indicators, we calculated soil erosion rates in the investigation units and obtained the soil erosion status in 2022 based on the CSLE model. On this basis, the driving forces behind the evolution of soil erosion were analyzed by using geographic detectors and multiple linear regression analysis [18,19,20], and the main factors that contribute to soil erosion have been identified. These findings can provide a theoretical foundation for soil erosion conservation management, soil conservation planning, and ecological system protection in this area.

2. Materials and Methods

2.1. Study Region

The study area is situated in northeastern China (38°42′–53°36′ N, 115°24′–135°12′ E) and occupies an expansive area of about 1.25 × 10⁶ km², with a fragile ecological environment (Figure 1). The elevation of this area gradually decreases from southwest to northeast, and the overall terrain is very undulating, with an altitude ranging from 78 to 2398 m. The area is dominated by low mountains and hilly plains. Another characteristic of this area is the high density of gullies, which make up approximately 5–15%. The soils are mainly brown soil, cinnamon soil, and alluvial soil. Moreover, brown soil is the predominant soil, which accounts for 46%. The primary land-use types in this region consist of forested areas and cultivated land. The climate is a temperate semi-humid and semi-arid climate, with an annual average temperature ranging from 8 to 15 °C, as well as a large gap between high and low temperatures. The annual precipitation is between 574 mm and 634 mm, and drought and flood disasters occur frequently, resulting in serious soil erosion.

2.2. Sample and Field Survey

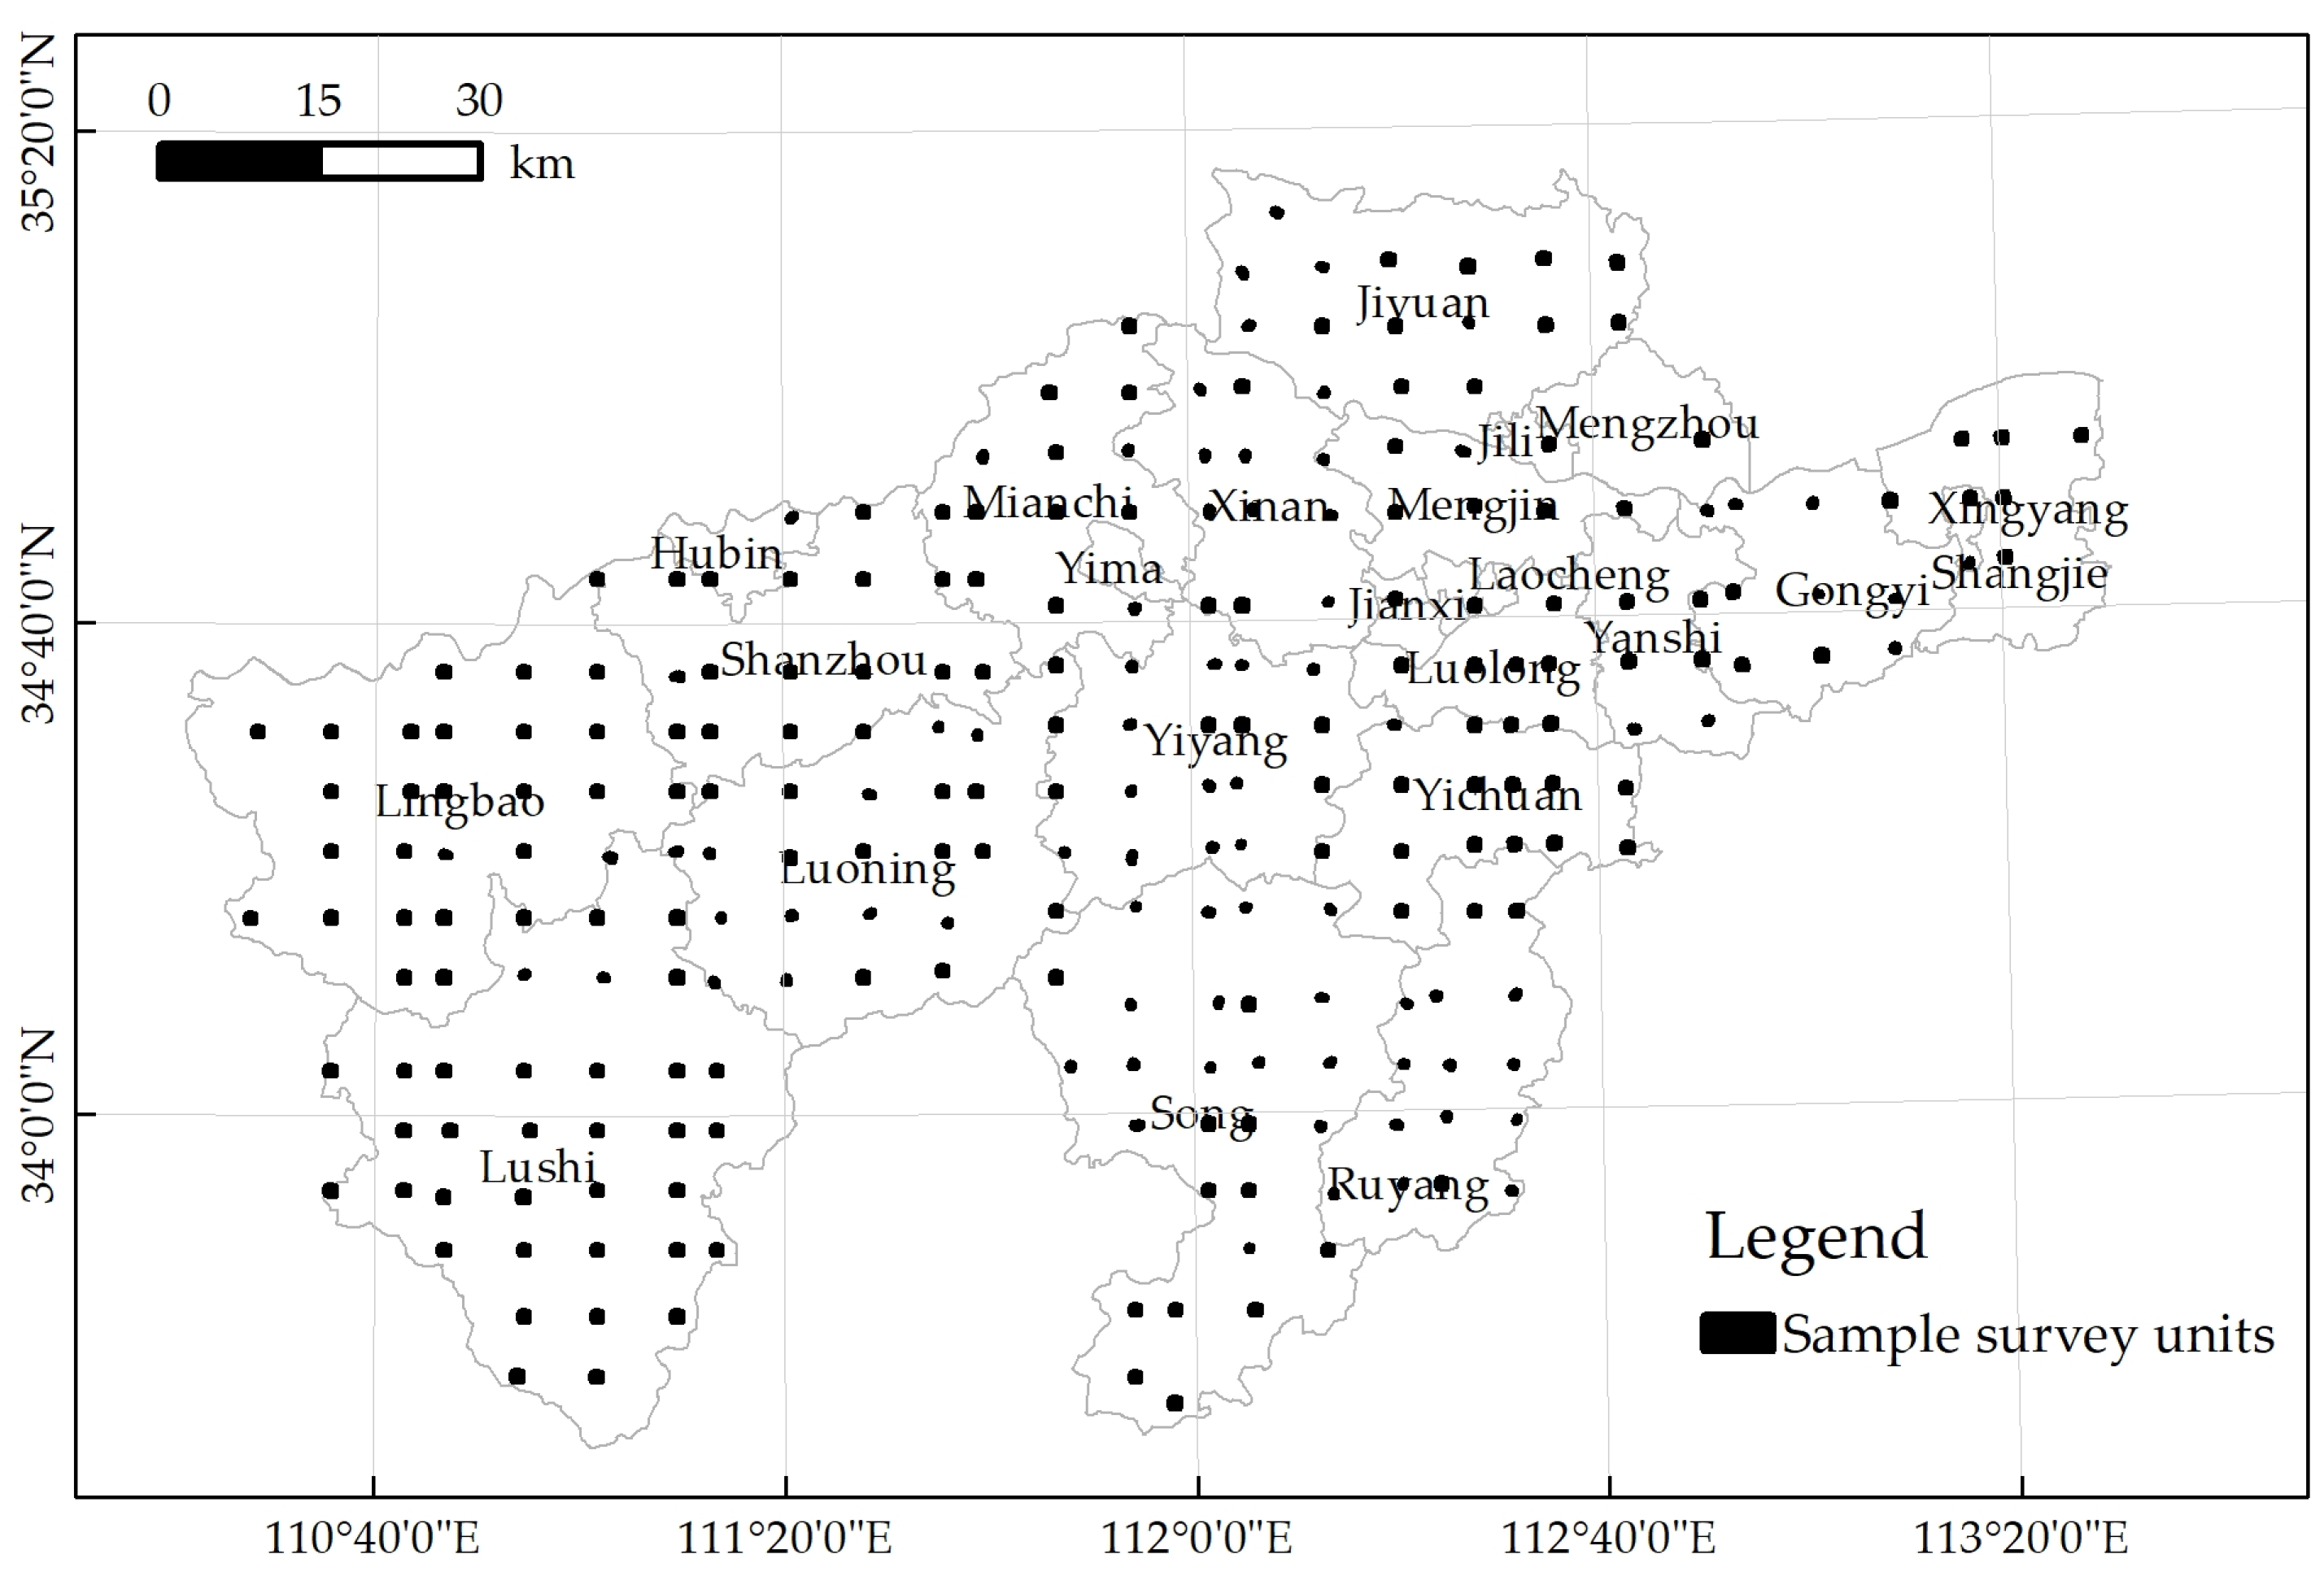
In this study, the stratified unequal probability system sampling method proposed by Liu Baoyuan is adopted, taking into account the design principles of the initial work in China’s inaugural national water conservancy survey [8]. Firstly, this research area is divided into 40 km × 40 km grids by using the Gauss–Kruger projection 3° zoning method, representing county-level units. Secondly, the grid of 10 km × 10 km is divided on the 40 km grid, representing the township-level units. On this basis, a 5 km × 5 km grid is divided, which is called the control area. To ensure the randomness of sampling, the central grid 1 km × 1 km of each control area was selected as the basic sampling unit as far as possible according to the sampling proportion of 1% so as to avoid the subjectivity of selection. According to the above principles, 256 sample survey units were selected within the study area to investigate the soil erosion situation, particularly focusing on the land-use status and soil conservation practices (Figure 2).
The steps of the field survey refer to the investigation process of the first national water conservancy survey, which mainly includes taking identification photos, taking landscape photos of the unit, drawing the boundary of the unit, and filling in the water erosion field survey form. The survey scope of vegetation coverage is typical forest land, grassland, and garden land. It is necessary to investigate not only the status of understory coverage but also the canopy density. For each unit, land-use types and areas, biological measures, engineering measures, and tillage measures were also adopted.

2.3. Data Source

Rainfall erosivity was calculated from daily rainfall collected from 1991 to 2020. The soil erodibility factor of the study area is derived from the soil erodibility results obtained during the first national water conservancy survey conducted in 2011. Terrain contour map data with a 1:10,000 scale for sample survey units were collected and counted to obtain the slope data, slope length factor, and slope steepness factor. Land-use type, biological measures, engineering measures, and tillage measures of the area were used to calculate vegetation cover factors of soil conservation practices.
Physical, climate, economic data, and landscape index were used to detect influencing factors of soil erosion. The information comes from the Data Center for Resources and Environmental Sciences, Chinese Academy of Sciences (https://www.resdc.cn/). The gross domestic product (GDP) and population (POP) data for 2022 are not available, so the 2019 China spatial distribution kilometers grid data are used as a basis for estimating them. The night light data (Light) are the 2021 NPP-VIRS data.

2.4. CSLE Model

The soil erosion rate is calculated using the CSLE model, which is suitable for capturing soil erosion characteristics and is widely used in China. The formula is detailed below:
A = R × K × L × S × B × E × T
where A represents the yearly average soil erosion in tons per hectare per year (t⋅ha−1⋅a−1); R represents the rainfall erosivity in MJ⋅mm⋅ha−1⋅h−1⋅a−1, reflecting the degree of soil erosion caused by rainfall; while K represents the soil erodibility in t⋅h⋅MJ−1⋅mm−1; L is the dimensionless factor of slope length; S is the dimensionless factor of slope steepness; B is the dimensionless factor of biomass-control; E is the dimensionless factor of engineering-control; T is the dimensionless factor of tillage practices. The model has the capability to comprehensively forecast the soil erosion process in different regions, effectively matching the specific type and current state of soil and water conservation measures in China. Furthermore, it can accurately reflect the mean annual soil loss on slopes. Table 1 provides the classification criteria for soil erosion rates.
Rainfall erosivity was calculated using daily rainfall data from 1991 to 2020 in the study area. The soil erodibility factor was estimated using the USLE model, and the calculated results were modified by using observed data from runoff plot data. The slope length and steepness factors were calculated within the sample survey units from the Digital Elevation Model by using digital contour maps at 1:10,000 scale. Fraction of vegetation cover and ground cover, including green vegetation and liters within the sample survey units, were used to obtain biological factors. Engineering practices and tillage practices within the sample survey units were used to calculate the E and T factors. All the digital factor maps were transformed into grid maps with 10 m resolution for all the sample survey units.

2.5. Selection of Driving Factors

Modifying the arrangement and spatial configuration of the landscape pattern can influence surface retention and nutrient storage, leading to a decrease in soil and water conservation as well as productivity. These changes have a great influence on shaping the pattern and evolution of soil erosion [21]. The landscape pattern index serves as a fundamental measure for characterizing landscapes, encompassing both the landscape structure and function [22,23]. The fragmentation of landscape refers to the process of breaking down larger patches of land cover into smaller ones, with the aim of quantitatively describing the structure of the landscape. Landscape patterns not only directly affect soil characteristics, vegetation replacement, growth process, and other micro-ecological patterns but also affect local land-use characteristics and indirectly affect the regional soil erosion process. The process of rapid urbanization has caused significant alterations in landscape patterns, resulting in an expanded focus from the central city to encompass a wider range of physical geographical units such as forests, wetlands, and oases.
The number of patches (NP) and patch density (PD) were selected as area indicators. Edge density (ED), mean shape index (SHAPE_MN), and perimeter area fractal dimension (PAFRAC) were selected as edge-shape indexes. The Agglomeration index (AI) and Contagion index (CONTAG) were selected as the index of agglomeration and dispersion. Shannon`s diversity index (SHDI) and Shannon’s evenness index (SHEI) were chosen as indicators of diversity. Elevation (ELE), slope (S), slope length (SL), temperature (T), precipitation (PRE), and soil organic matter (SOM) were selected as the natural environment index. Gross domestic product (GDP), population (POP), and night light (Light) data were added as socio-economic factors to analyze their impact on soil erosion.

2.6. Geographical Detector

Geographic data have two attributes; one is spatial autocorrelation, and the other is spatial heterogeneity (the phenomenon of intra-layer variance being less than inter-layer variance [20]. The geographic detector is an innovative statistical theory and methodology designed to assess spatial heterogeneity and examine its characteristics. It was originally used to study the mechanism by which local factors affect disease risk [24]. The method does not consider linearity and makes no linear assumptions about variables, so it is more intuitive, faster, and more efficient to measure the contribution of each factor. The geographic detector’s factor detector is utilized to identify the spatial variation in the dependent variable Y, and the contribution capacity of each variable X to the degree of influence on Y can also be obtained. The measurement of its influence degree is determined by the q value, with a higher q value indicating a greater capacity of X to influence the degree of variable Y. The formula is detailed below:
q = 1 1 N S 2 h = 1 L h N h S h 2
where q is the spatial heterogeneity of an index, q ∈ [0, 1]; h indicates the partition, L indicates the number of partitions, h = 1, 2, …; Lh, N and Nh represent the sample numbers of the whole region and subregion h, respectively; S2 and S2h is the variance of the whole area and the subarea h; NS2 and h = 1 L h N h S h 2 represent the total variance of the entire region and the sum of the variance within the region. If q ≠ 0, the formula is valid.
The interaction detector examines an interaction by comparing the Q values of the interaction with those of two individual variables (Table 2). The interaction detector investigates five different types of interactions, including nonlinear-weaken, uni-variable weaken, bi-variable enhance, independent, and nonlinear-enhance [18,24].
The ecological detector is utilized to assess if there is a notable disparity in the spatial arrangement of the two explanatory variables X1 and X2 concerning the dependent variable Y, as indicated by the F statistic.
F = N u ( N v 1 ) h = 1 L u N h S h 2 N v ( N u 1 ) h = 1 L v N h S h 2
where Nu and Nv are quantities of observations; h indicates the partition; L indicates the number of partitions, h = 1, 2, …, Lu. h = 1 L u N h S h 2 and h = 1 L v N h S h 2 are sums of variance within sub-regions of variables u and v, respectively. Therefore, with a given significant level, the null hypothesis H0: h = 1 L u N h S h 2 = h = 1 L v N h S h 2 is detected with the F-distribution table [18,24].
The risk detector is utilized to evaluate the statistical significance of spatial patterns, as indicated, specifically mean values of sub-regions that are classified based on a categorical or stratified variable [18,24].
t Y ¯ h = 1 Y ¯ h = 2 = Y ¯ h = 1 Y ¯ h = 2 [ V a r ( Y ¯ h = 1 ) n h = 1 + V a r ( Y ¯ h = 2 ) n h = 2 ] 1 2
where Y ¯ h = 1 and Y ¯ h = 2 are mean values of observations sub-regions h, V a r ( Y ¯ h = 1 ) and V a r ( Y ¯ h = 2 ) are the sample variance, and n h = 1 and n h = 2 are numbers of observations, respectively.

2.7. Multiple Linear Regression Analysis

Soil erosion influencing factors have different degrees of impact on soil erosion. Some factors have lower degrees of influence, but their importance cannot be ignored. Therefore, in order to elucidate the changing features of the dependent variable, it is necessary to have two or more independent variables that influence it.
In fact, it is more effective and practical to predict the dependent variable by combining several optimal independent variables together than by using only one. The multiple linear regression algorithm is one of the basic regression analysis methods employed to depict the random linear relationship between the variable y and x in scenarios where there are greater or equal to two independent variables [25,26]. If the variables y and x are observed n times, we can obtain n sets of observations yi, X1, X2, …, Xk, which satisfy the following formula:
y = β 0 + β 1 × X 1 + β 2 × X 2 + + β k × X k + ε
where β0, β1, β2, …, βk are the average unknow parameters, ε is the linear random error.
Multiple linear regression algorithms involve many independent variables, and their representational meanings and units are different, so the analysis of regression equations is complicated. You can directly compare the size of the regression coefficients to determine the relative importance of each factor in multiple linear regression. It is also possible to check the regression coefficient of each independent variable to determine which factors are important.

3. Results

3.1. Spatial Distribution of Soil Erosion

According to the Standard for Classification and Grading of Soil Erosion Intensity (SL190-2007) issued by the Ministry of Water Resources, PRC, the soil erosion rates in the loess hilly area of western Henan were classified into slight, low, moderate, high, extremely high, and severe soil erosion (Table 3). The soil erosion rates of 256 sample survey units in 2022 have been calculated. In the meantime, analyzing the distribution and intensity of soil erosion can also provide insights into the current situation of soil erosion.
The mean soil loss rate in the investigation units was 5.94 t⋅ha−1⋅a−1 in 2022. The total area affected by soil erosion was 29.10%. The distribution of severe soil erosion was scattered, mainly concentrated in the west of Shangjie District, Xingyang, and Jiyuan (Figure 3), which was related to the development of production and construction projects in these areas in recent years.
The researchers conducted an analysis to reveal the soil erosion rate and area eroded by each type of land-use. According to the findings, forest land was identified as the primary location for soil erosion occurrences, and cultivated land was followed by construction land, orchard land, and grassland (Figure 4). The highest soil erosion rate was in construction land, followed by cropland. Although the average soil erosion rate was relatively low, the area of forest land was the largest (accounting for 45.26% of the study area). Therefore, the soil erosion area that occurred on forest land was largest.
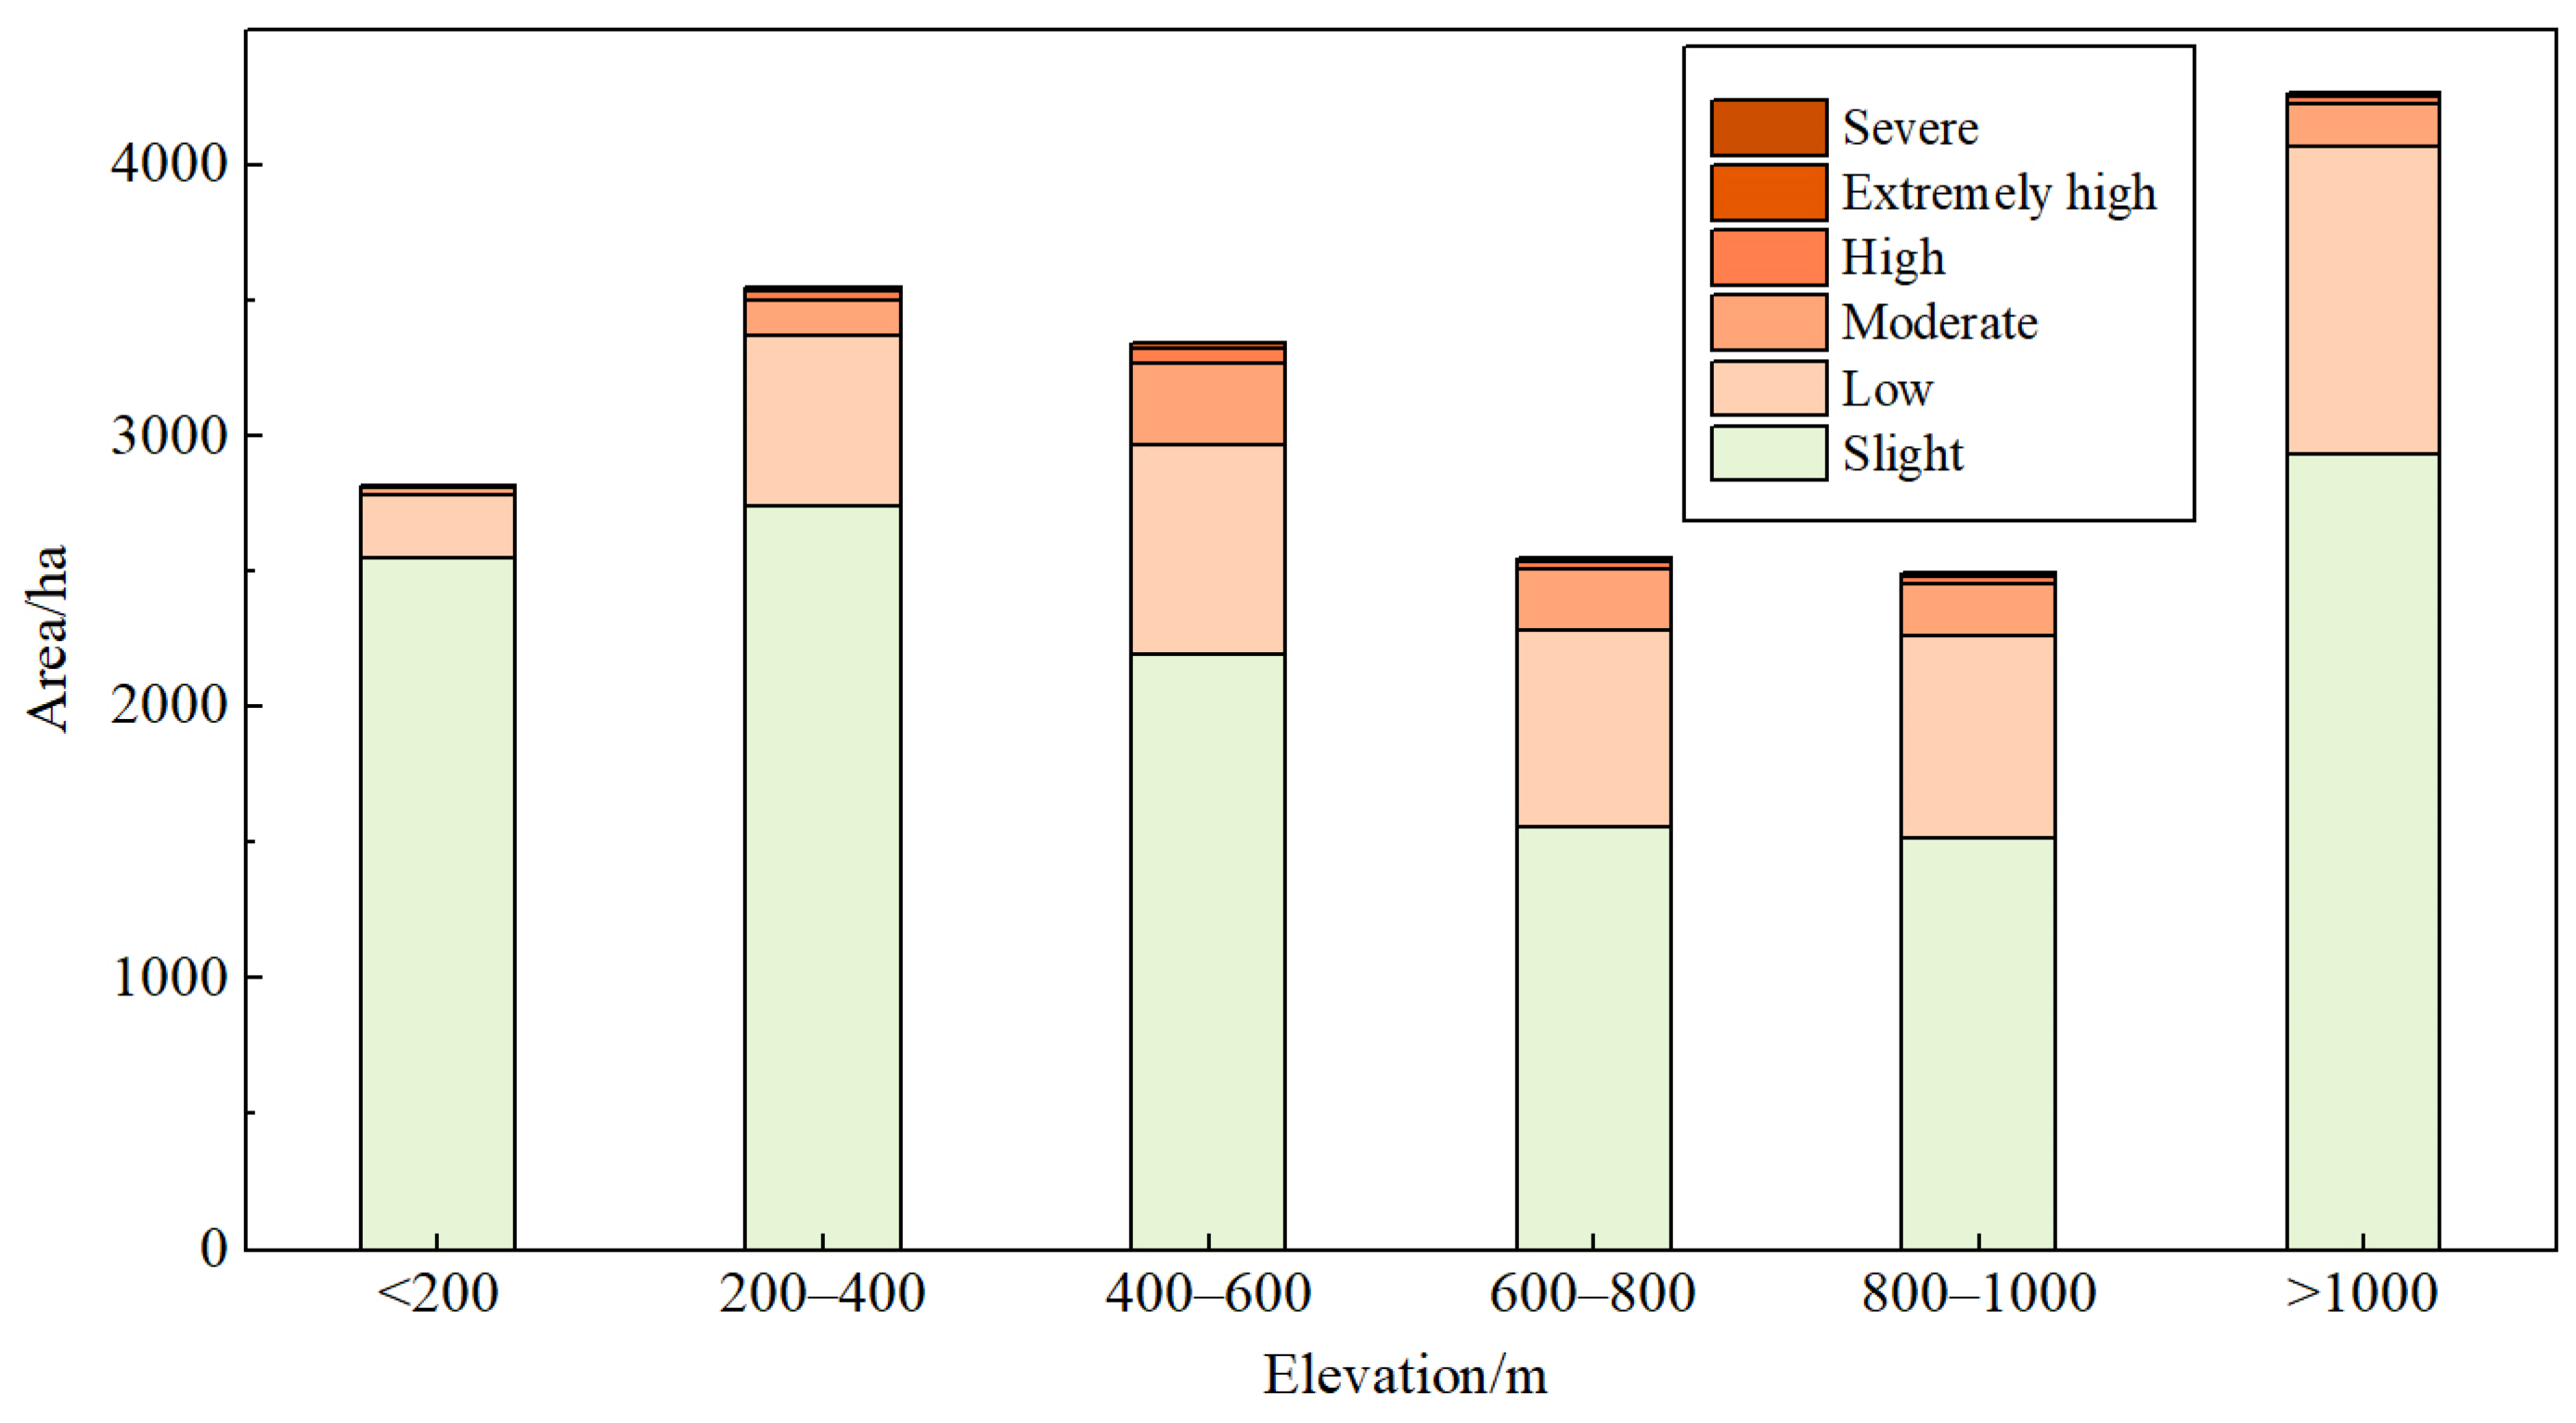
Slight erosion was predominantly observed in the region with an altitude exceeding 1000 m, covering an area of 11.38 km2. This area accounted for approximately 26.85% of the total slight erosion region. The majority of moderate erosion occurred at an altitude from 400 to 600 m, comprising 29.21% of the area affected by moderate erosion. The high erosion was also concentrated at an altitude of 400–600 m, with a distribution area of 0.55 km2, accounting for 31.46%. The distribution of extremely high erosion was 21.30% and 21.41% at altitudes ranging from 400 to 600 m to 1000 m, respectively. The altitude of severe erosion occurred mainly in the area lower than 200 m, covering a distribution area of 0.05 km2, accounting for 60.55% of the severe erosion. Based on the above results, it can be seen that soil erosion in the loess hilly area of western Henan mainly occurred below an altitude of 200 m and between 400 and 600 m (Figure 5).
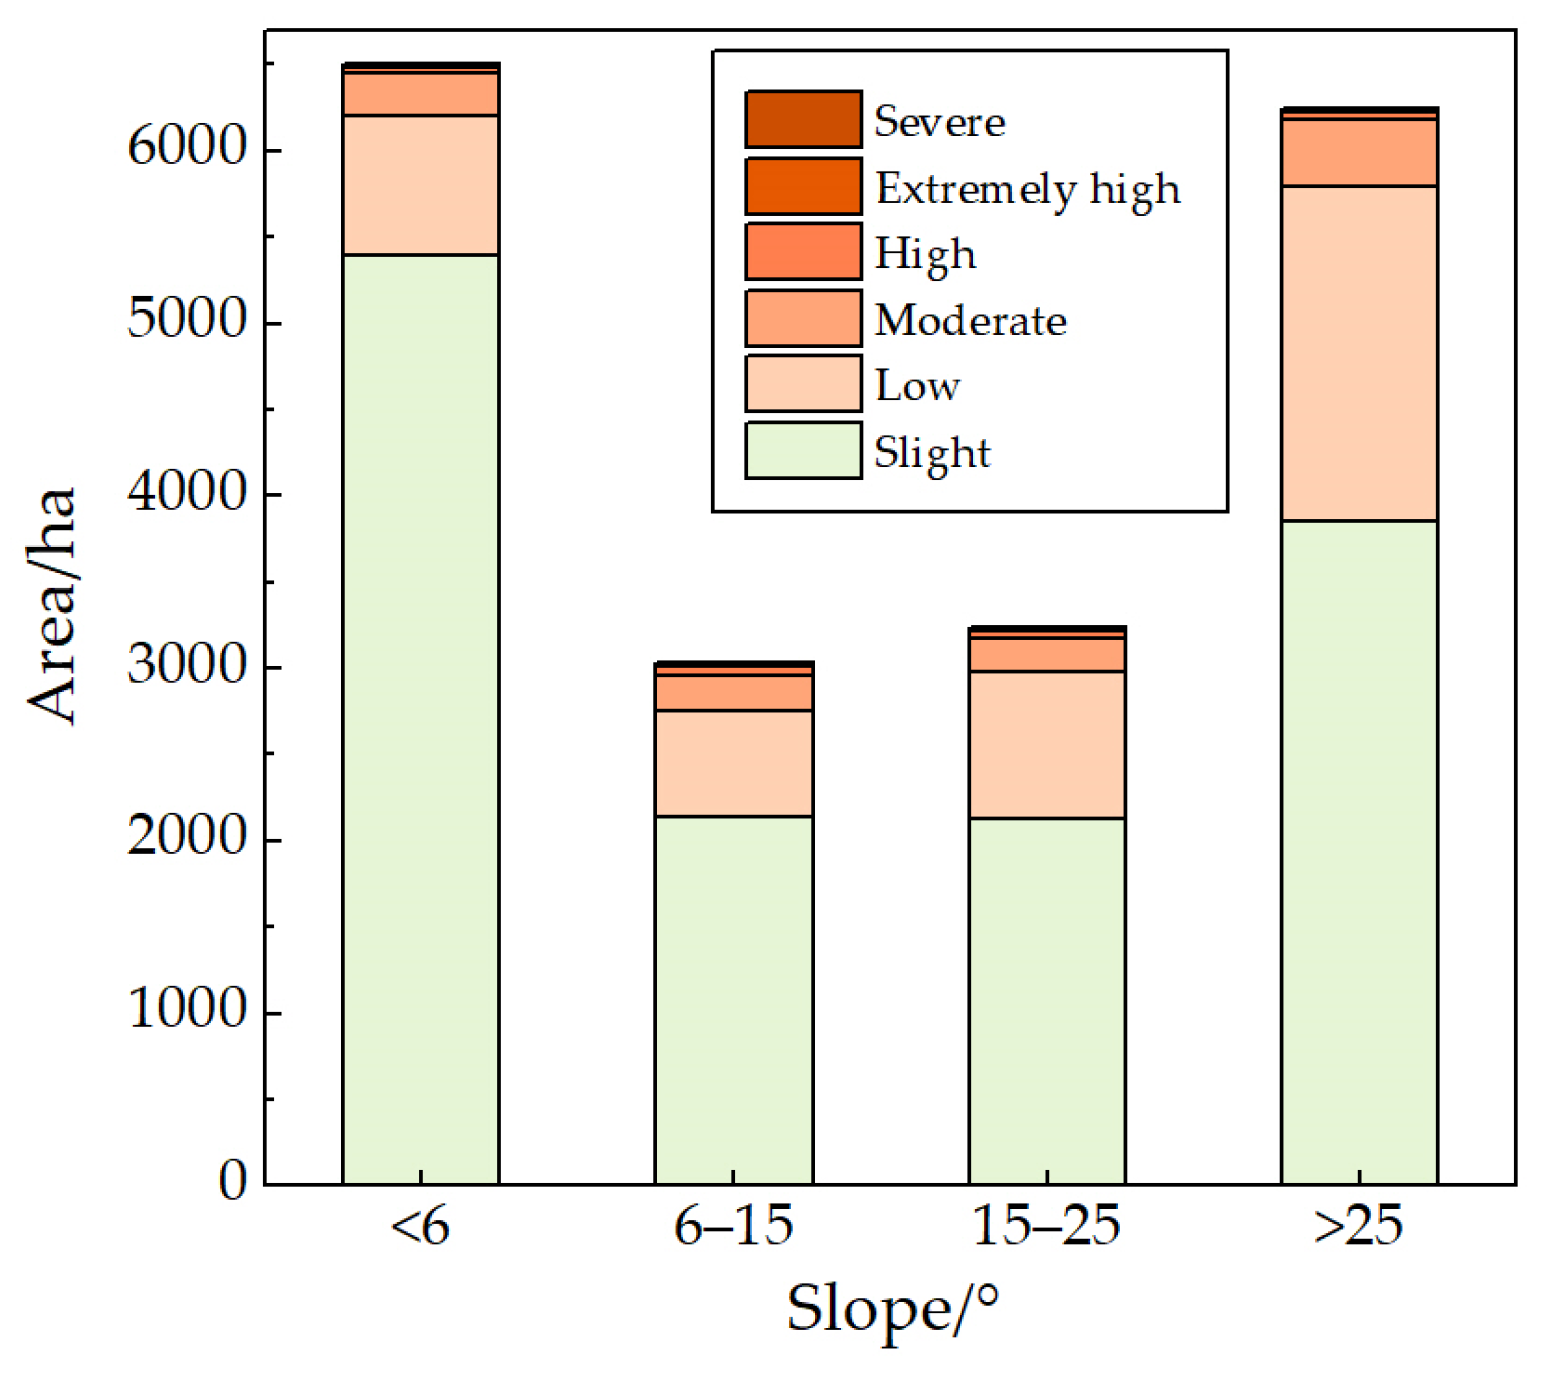
The slope is divided into <6°, 6°–15°, 15°–25° and >25°. An analysis was performed on the soil erosion grades in each slope range (Figure 6). Soil erosion rate above 25° was still the largest, accounting for 43.38%, followed by the slope range from 15° to 25° and below 6°, accounting for 20.24% and 20.17%, respectively. The slope range below 6° is more suitable for human activities such as agriculture and cultivation and is subject to large human disturbance, and the soil erosion area has little change.

3.2. Spatial Distribution of Soil Erosion Area

To obtain the soil erosion status of the entire area form from the point survey results of the investigation units, it is necessary to extrapolate the results of the investigation unit to a regional scale using specific methods. The regional soil erosion status is determined in this paper using the geostatistical spatial interpolation method. The mean soil erosion rates of the surveyed units may not provide an accurate representation of the overall soil erosion condition within the investigation unit. Soil erosion rates are not an effective parameter for characterizing the spatial distribution of soil erosion, particularly when considering the regional scale and in the context of planning for regional soil conservation. Therefore, for the purpose of knowing the evaluation status of regional soil erosion, the percentage of soil erosion area of the sample investigation units was interpolated [8]. Luolong, Laocheng, and Mengzhou were the areas with the lowest percentage area. Additionally, the eastern and southwestern areas of the study area also exhibited a low percentage. The southeastern region of Song and the southern region of Ruyang, the southern and western of Xinan, as well as Yima and Mianchi in the east, were predominantly affected by high-grade soil erosion (Figure 7).

3.3. Driving Force Analysis of Soil Erosion

3.3.1. Landscape Pattern Characteristics

Cropland has the highest value of NP and PD, followed by transportation land, forest land, and orchards. The larger NP and PD are, the more widely distributed and the more fragmented patches are. Therefore, cropland is a diverse and extensively distributed land type in the study area. ED varies greatly across various types of land-use. The forest land has a larger area compared to cropland. A high ED value suggests that the shape of farmland was greatly affected by natural and anthropogenic factors. Except for transportation land, the difference in ED and NP parameters for other land types was not significant (Table 4). According to the Agglomeration index, the forest land was found to be concentrated in its distribution, whereas the transportation land exhibited a scattered distribution.

3.3.2. Geodetector Analysis

The dependent variables in the study area were soil erosion area and rates of 256 sample survey units. The landscape index (NP, PD, CONTAG, SHDI, and SHEI) and regional natural factors (elevation, slope, slope length, temperature, precipitation, and soil organic matter) of the corresponding investigation units are taken as independent variables. The study area incorporated gross domestic product (GDP), light (Light), and population (POP) as social and economic factors to examine the driving causes of soil erosion.
  • Factor detector
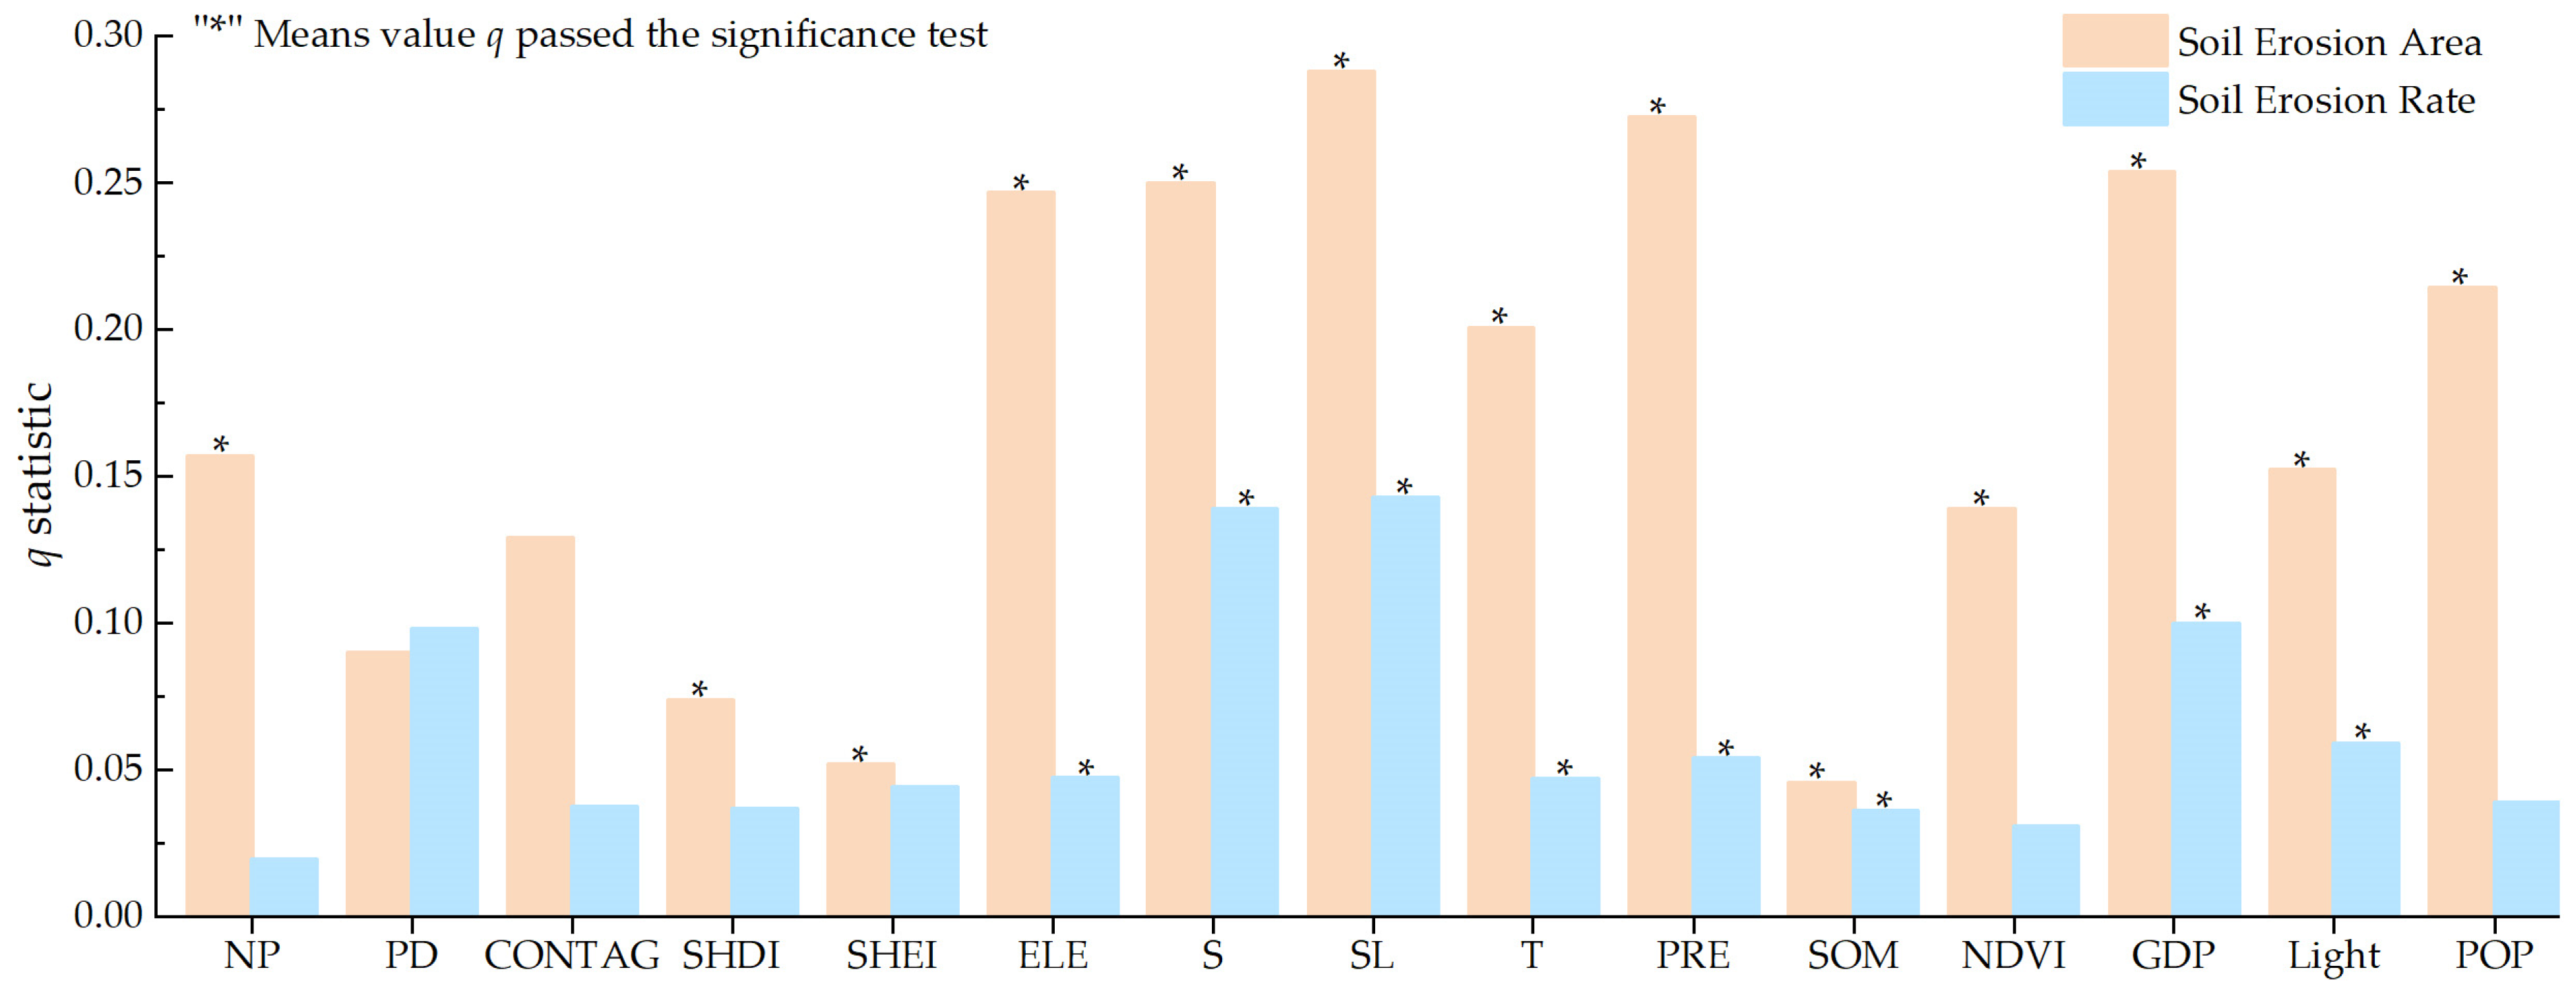
Figure 8 demonstrates that the primary factors influencing the extent of soil erosion are mainly slope and slope length, and their explanatory power to soil erosion area was the highest, with q values of 25% and 28.8%. The dominant factor of the survey region was the slope length factor, and the explanatory power was more than 14%, which is basically consistent with the influence factor of erosion area. Moreover, the soil erosion rate was closely related to social and economic development, such as GDP and POP. People’s land planning and soil conservation measures greatly affect the local soil erosion rates. Rational planning of land-use patterns and improvement of regional landscape pattern distribution are the main ways to effectively control soil erosion in the study area.
2.
Interaction detector
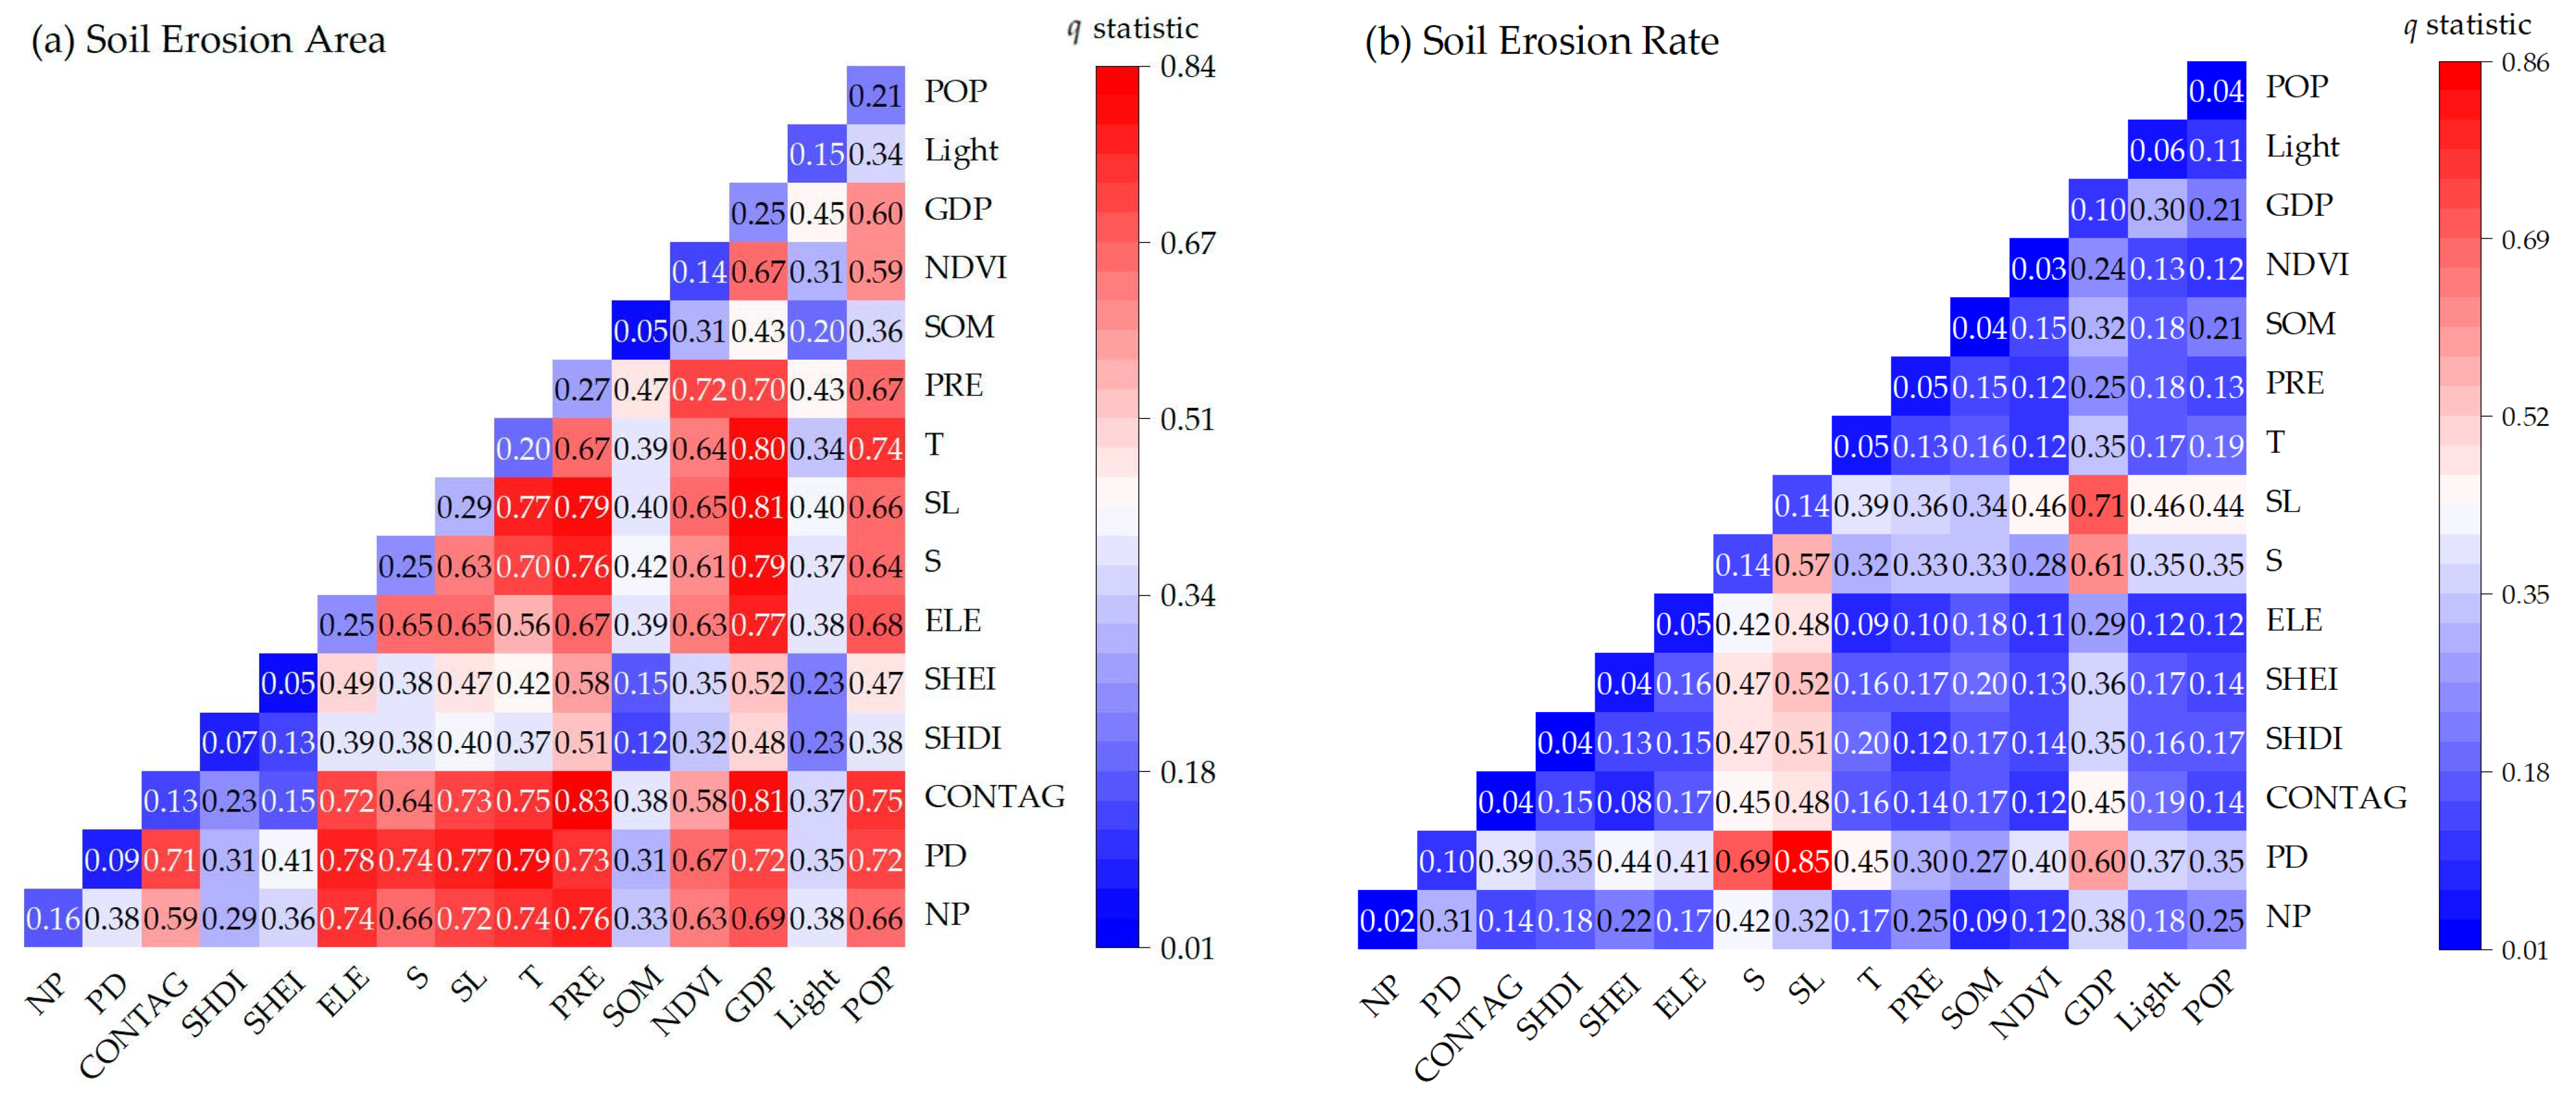
Figure 9 displays the results of the interactive detection. While some factors didn’t exhibit significant explanatory power individually during the factor detection test, the explanatory power was greatly improved after interacting with two factors. The factors with strong interaction mainly focus on the interaction between natural factors and other factors. For soil erosion area proportion, the maximum interaction occurred in CONTAG ∩ PRE, with a q value of 83.4%. This indicated that the erosion area was affected by slope, precipitation, and landscape connectivity, as well as the change in land-use pattern connectivity caused by human activities. Human activities can change the number of patches in different places, resulting in the fragmentation of landscape patterns and further affecting the soil erosion area.
For soil erosion rates, the maximum interaction occurred in PD ∩ SL, with a q value of 85%. The findings indicated that human activities in the natural environment are responsible for the variability in soil erosion rates, especially regional economic development, combined with landscape density and connectivity.

3.3.3. Results of Multiple Linear Regression Analysis

The importance of the soil erosion factors affecting the loess hilly area in western Henan was ranked, as shown in Table 5. Multiple linear regression analysis showed that elevation was the primary factor influencing both soil erosion rate and area. The higher the elevation in the survey region, the greater the slope and the more cropland was distributed, resulting in a significant impact on human activities. In addition to elevation, temperature and SHEI were important factors affecting soil erosion rate; the density, mobility, and distribution of POP also had an impact on soil erosion.
The proportion of eroded soil area was significantly under the influence of precipitation and slope, which were identified as important factors. As the precipitation increased and the duration of rainfall extended, the erosion and transportation effects of the surface runoff on the surface soil became stronger, leading to a sudden increase in soil erosion. Overall, terrain and climate were the primary factors that influenced soil erosion in the research area. Furthermore, the spatial distribution of POP and GDP in the research area was found to have the second-highest impact on soil erosion, just after natural forces.

4. Discussion

The average soil erosion rate of the loess hilly area of western Henan in 2022 was 5.94 t⋅ha−1⋅a−1. The percentage of soil erosion area was 29.10%, which is higher than the percentage of soil erosion area of Henan. Topography is one of the factors determining the amount of soil erosion [27,28]. The loess hilly area in western Henan is characterized by rugged terrain. In the study, results of multiple linear regression analysis also showed elevation and slope play an important role in increasing soil loss. Loess is widely distributed in the study area. The ability of the loess layer to resist impact is weak. Due to the fact that more than 50% of the particles in loess are composed of silt particles with uniform texture and lack of aggregate structure, the soil particles are mainly cemented by carbonates, which are easily dispersed and disintegrated in water. Therefore, the properties of loess are one of the basic reasons for soil erosion. The terrain is rugged, and the density of valleys is high, reaching 1–3 km/km2. The area of valleys accounts for about 5% to 15% of the total area, and areas with a slope of 45° or more (some even exceed 80°) account for 60% of the total area [17]. The development mechanism of soil erosion is significantly influenced by the formation and expansion of gullies [29]. The primary origin of sediment in the hilly and gully region is gully erosion [30,31]. In particular, the landform of the study area belongs to the loess region, where gullies are dense, and the Yellow River network is well-developed. Due to the inherent complexity of soil erosion, the persuasiveness of a single factor is limited. Among the influencing factors of soil erosion, natural factors such as slope length have a slightly higher explanatory power compared to other factors. Several factors in the study were found to be significant after undergoing the significance test, but the q value was not high. The complexity of the soil erosion process, which is impacted by some interrelated factors, is the reason for the limited explanatory power [32]. In addition, the results also showed that temperature and precipitation were the important factors influencing soil erosion rate and area. Actually, the region has experienced frequent floods and intense soil erosion due to heavy and concentrated rainfall in recent years.
Simultaneously, this study found that the influence of changes in landscape patterns significantly increased the ability of each landscape index to explain variations in soil erosion area and rate when combined with natural factors, which is consistent with previous research [14]. Regional landscape pattern stability decreased, the connectivity between patches was weakened, and the heterogeneous landscapes near the boundary interacted with each other, reducing the regional soil and water conservation ability [33]. Human activities often result in the simplification and alteration of landscape structure [34,35,36], resulting in the rise of landscape ecological risk. Modifications in the composition and spatial organization of landscape patterns can impact surface interception and nutrient retention, leading to a decline in soil and water conservation as well as productivity. Previous studies have found that the landscape pattern index was highly correlated with soil conservation [37,38]. The demand for food due to urbanization and population growth in the study area is causing a land-use function change, as well as raising the soil erosion risk [39]. In order to effectively implement the soil protection efforts in this region, it is crucial to plan land-use in accordance with the requirements of national spatial planning. According to this study, it is recommended that soil conservation planning prioritize regional linkage governance, minimize landscape fragmentation, enhance landscape aggregation and connectivity, and improve the overall soil conservation capacity in the region.
When managing severely eroded areas, it is important to consider the feasibility, scientific basis, and sustainability of the management methods. To effectively minimize soil erosion, it is necessary to construct slope cropland and orchard land in a scientifically tailored manner that takes into account local conditions [40]. Cropland was widely distributed in the study area, and agricultural management measures such as no-tillage can better control soil loss [41,42]. Moreover, improving the accuracy of soil erosion assessment is the foundation for soil erosion prevention and soil conservation planning.

5. Conclusions

This study employed a multi-stage, systematic area sampling method with unequal probabilities to identify the sample survey units in the loess hilly area of western Henan. Subsequently, the soil erosion rates were assessed in 2022 employing the CSLE model, aiming to evaluate the current soil erosion status. The spatial pattern of soil erosion was examined, and the factors causing soil erosion were identified through the application of a geographical detector and multiple linear regression analysis techniques. The results can provide certain references for soil conservation planning. The primary conclusions can be summarized as follows:
  • The average soil erosion rate of the loess hilly area of western Henan in 2022 was 5.94 t⋅ha−1⋅a−1, and the soil erosion area represented 29.10%. High soil erosion rates were observed in various locations, primarily in the western regions of Zhengzhou Shangjie District, Xingyang, and Jiyuan. This phenomenon has been attributed to the extensive implementation of production and construction projects in these areas over the past few years. Soil erosion mainly occurred in forest land and cultivated land, followed by construction land, orchard land, and grassland. Soil erosion occurred below 200 m and the range from 200 to 400m. The slope range above 25° still had the largest erosion proportion, followed by the slope range from 15° to 25° and below 6°.
  • In the loess hilly area of western Henan, the values of NP and PD of cropland were the largest, followed by transportation land and forest land. The NP and PD of the orchard were the smallest. ED varied greatly among all land-use types. Although the whole shape of patches in different regions was more regular, the boundary circumference increased, and the boundary shape was more tortuous.
  • The significance test was passed by certain factors in both the geodetector analysis and multiple linear regression analysis. However, it is worth mentioning that the q value was not particularly high. The limited ability of these factors to provide a comprehensive explanation can be put down to the intricate of the soil loss process, which was complicated and influenced by numerous interconnected factors. The slope length factor had the highest explanatory power on soil erosion area and rates. Moreover, this study found that the interaction between landscape index and natural factors greatly improved the explanatory power of the soil erosion area and rate.

Author Contributions

Conceptualization, Z.G. and K.J.; methodology, Z.G.; software, K.J.; validation, Q.Y., S.C. and P.L.; formal analysis, D.F.; investigation, K.J.; resources, Q.Y.; data curation, P.L.; writing—original draft preparation, K.J.; writing—review and editing, Z.G.; visualization, Q.Y.; supervision, S.C.; project administration, D.F.; funding acquisition, D.F. All authors have read and agreed to the published version of the manuscript.

Funding

This research was funded by Joint Funds of the National Natural Science Foundation of China, grant number U2002209 and Nanhu Scholars Program for Young Scholars of XYNU, grant number 2019046.

Data Availability Statement

The data that support the findings of this study are available on request from the corresponding author, [Z.G.], upon reasonable request.

Conflicts of Interest

The authors declare no conflicts of interest.

References

  1. Wang, Z.; Hoffmann, T.; Six, J.; Kaplan, J.O.; Govers, G.; Doetterl, S.; Van Oost, K. Human-induced erosion has offset one-third of carbon emissions from land cover change. Nat. Clim. Chang. 2017, 7, 345–349. [Google Scholar] [CrossRef]
  2. Ministry of Water Resources, the People’s Republic of China. Chinese Soil and Water Conservation Bulletin. Available online: http://swcc.mwr.gov.cn/law/202404/t20240407_1741956.htm (accessed on 7 April 2024).
  3. Gu, Z.J.; Feng, D.T.; Duan, X.W.; Gong, K.F.; Yue, T.Y. Spatial and temporal patterns of rainfall erosivity in the tibetan plateau. Water 2020, 12, 200. [Google Scholar] [CrossRef]
  4. Senanayake, S.; Pradhan, B.; Huete, A.; Brennan, J. A Review on Assessing and Mapping Soil Erosion Hazard Using Geo-Informatics Technology for Farming System Management. Remote Sens. 2020, 12, 4063. [Google Scholar] [CrossRef]
  5. Wischmeier, W.H.; Smith, D.D. Predicting Rainfall Erosion Losses: A Guide to Conservation Planning; Department of Agriculture Agricultural Handbook: Washington, DC, USA, 1978; p. 14. [Google Scholar]
  6. Renard, K.G.; Foster, G.R.; Weeies, G.A. Predicting Soil Erosion by Water: A Guide to Conservation Planning with the Revised Universal Soil Loss Equation (RUSLE); Department of Agriculture Agricultural Handbook: Washington, DC, USA, 1997; p. 375. [Google Scholar]
  7. Liu, B.Y.; Zhang, K.L.; Xie, Y. An empirical soil loss equation. In Proceedings of the 12th International Soil Conservation Organization Conference; Tsinghua University Press: Beijing, China, 2002; Volume III. [Google Scholar]
  8. Liu, B.Y.; Guo, S.Y.; Li, Z.G.; Xie, Y.; Zhang, K.L.; Liu, X.C. Sampling survey of water erosion in China. Soil Water Conserv. China 2013, 10, 26–34. (In Chinese) [Google Scholar]
  9. Dong, L.X.; Fu, S.H.; Liu, B.Y.; Yin, B. Comparison and quantitative assessment of two regional soil erosion survey approaches. Int. Soil Water Conserv. Res. 2023, 11, 660–668. [Google Scholar] [CrossRef]
  10. Liu, B.Y.; Xie, Y.; Li, Z.G.; Liang, Y.; Zhang, W.B.; Fu, S.H.; Yin, S.Q.; Wei, X.; Zhang, K.L.; Wang, Z.Q.; et al. The assessment of soil loss by water erosion in China. Int. Soil Water Conserv. Res. 2020, 8, 430–439. [Google Scholar] [CrossRef]
  11. Nusser, S.M.; Breidt, F.J.; Fuller, W.A. Design and estimation for investigating the dynamics of natural Resources. Ecol. Appl. 1988, 8, 234–245. [Google Scholar] [CrossRef]
  12. USDA. Summary Report: 2015 National Resources Inventory, Natural Resources Conservation Service, Washington, DC, and Center for Survey Statistics and Methodology; Iowa State University: Ames, IA, USA, 2018.
  13. Polyakov, V.; Baffaut, C.; Ferro, V.; Van Pelt, S. Advances in soil erosion research: Mechanisms, modeling and applications—A special issue in honor of Dr. Mark Nearing. Int. Soil Water Conserv. Res. 2023, 11, 589–591. [Google Scholar] [CrossRef]
  14. Du, J.; Zhao, S.C.; Xu, J.Z.; Guo, L. Temporal and spatial changes of soil and water conservation function in Loess Hilly Region of western Henan Province from 2015 to 2020. Henan Sci. 2021, 39, 1802–1808. (In Chinese) [Google Scholar]
  15. Liu, Z.J.; Li, B.P.; Du, M.X. Discussion on countermeasures of returning farmland to forest and grassland in loess hilly area of Western Henan Province. Yellow River 2023, 25, 23–26. (In Chinese) [Google Scholar]
  16. Yi, Q.; Zhang, Y.; Zhang, H.F.; Zhang, P.P.; Ma, S.Z.; Yao, G.Q. Study on the spatial distribution characteristics of the eroded gully in gullied rolling loess area of west Henan Province. Yellow River 2016, 38, 85–88. (In Chinese) [Google Scholar]
  17. Zhu, L.Q. Study on soil erosion and its affects on agriculture sustainable development in west Henan Province loess hilly and mountainous areas. J. Soil Water Conserv. 2001, 15, 41–49. (In Chinese) [Google Scholar]
  18. Wang, J.F.; Li, X.H.; Christakos, G.; Liao, Y.L.; Zhang, T.; Gu, X.; Zheng, X.Y. Geographical detectors-based health risk assessment and its application in the neural tube defects study of the Heshun region, China. Int. J. Geogr. Inf. Sci. 2010, 24, 107–127. [Google Scholar] [CrossRef]
  19. Wang, J.F.; Xu, C.D. Geodetector: Principle and prospective. Acta Geogr. Sin. 2017, 72, 116–134. (In Chinese) [Google Scholar]
  20. Chen, F.H.; Wu, S.H.; Cui, P.; Cai, Y.; Zhang, Y.; Yin, Y.; Liu, G.; Ouyang, Z.; Ma, W.; Yang, L.; et al. Progress and prospects of applied research on physical geography and the living environment in China over the past 70 years (1949–2019). J. Geogr. Sci. 2021, 31, 3–45. [Google Scholar] [CrossRef]
  21. Xie, X.; Wang, X.; Wang, Z.; Lin, H.; Xie, H.; Shi, Z.; Hu, X.; Liu, X. Influence of Landscape Pattern Evolution on Soil Conservation in a Red Soil Hilly Watershed of Southern China. Sustainability 2023, 15, 1612. [Google Scholar] [CrossRef]
  22. Gustafson, E.J.; Jay, R.L.; Leefers, L.A. Linking linear programming and spatial simulation models to predict landscape effects of forest management alternatives. J. Environ. Manag. 2006, 81, 339–350. [Google Scholar] [CrossRef] [PubMed]
  23. Robinson, L.; Newell, J.P.; Marzluff, J.A. Twenty-five years of sprawl in the Seattle region: Growth management responses and implications for conservation. Landsc. Urban Plan. 2005, 71, 51–72. [Google Scholar] [CrossRef]
  24. Wang, J.F.; Zhang, T.L.; Fu, B.J. A Measure of Spatial Stratified Heterogeneity. Ecol. Indic. 2016, 67, 250–256. [Google Scholar] [CrossRef]
  25. Koksal, B.A. 1 Statistik Analiz Metodlar; Caglayan Kitabevi: Istanbul, Turkey, 1985. [Google Scholar]
  26. Tabachnick, B.G.; Fidell, S.L. Using Multivariate Statisics, 3rd ed.; Harper Collins College Publishers: New York, NY, USA, 1996. [Google Scholar]
  27. Zhang, P.; Yao, W.; Liu, G.; Xiao, P. Experimental study on soil erosion prediction model of loess slope based on rill morphology. Catena 2019, 173, 424–432. [Google Scholar] [CrossRef]
  28. Hu, S.; Li, L.; Chen, L.; Cheng, L.; Yuan, L.; Huang, X.; Zhang, T. Estimation of soil erosion in the Chaohu lake basin through modified soil erodibility combined with gravel content in the RUSLE model. Water 2019, 11, 1806. [Google Scholar] [CrossRef]
  29. Vanmaercke, M.; Panagos, P.; Vanwalleghem, T.; Hayas, A.; Foerster, S.; Borrelli, P.; Rossi, M.; Torri, D.; Casali, J.; Borselli, L.; et al. Measuring, modelling and managing gully erosion at large scales: A state of the art. Earth Sci. Rev. 2021, 218, 103637. [Google Scholar] [CrossRef]
  30. Li, Y.; Poesen, J.; Yang, J.; Fu, B.; Zhang, J. Evaluating gully erosion using 137Cs and 210Pb/137Cs ratio in a reservoir catchment. Soil Tillage Res. 2003, 69, 107–115. [Google Scholar] [CrossRef]
  31. Yibeltal, M.; Tsunekawa, A.; Haregeweyn, N.; Adgo, E.; Meshesha, D.T.; Masunaga, T.; Tsubo, M.; Billi, P.; Ebabu, K.; Fenta, A.A.; et al. Morphological characteristics and topographic thresholds of gullies in different agro-ecological environments. Geomorphology 2019, 341, 15–27. [Google Scholar] [CrossRef]
  32. Jia, L.; Yao, S.B.; Deng, Y.J.; Li, Y.Y.; Hou, M.Y.; Gong, Z.W. Temporal and spatial characteristics of soil erosion risk in Weihe river basin and its geographical exploration. J. Ecol. Rural Environ. 2021, 37, 305–314. [Google Scholar]
  33. Li, Y.B. The Impact of Land Use Landscape Pattern Evolution on Soil Erosion in Jiang Han Plain. Master’s Thesis, Huazhong Agricultural University, Wuhan, China, 2023. (In Chinese). [Google Scholar]
  34. Forman, R.T.; Gordron, M. Landscape Ecology; Wiley: New York, NY, USA, 1986; p. 620. [Google Scholar]
  35. Krummel, J.R.; Gardner, R.H.; Sugihara, G.; O’Neill, R.V.; Coleman, P.R. Landscape pattern in a disturbed environment. Environ. Oikos 1987, 48, 321–324. [Google Scholar] [CrossRef]
  36. Odum, E.P.; Turner, M.G. Georgia Landscape: A Changing Resource; An Ecological Perspective; Springer: New York, NY, USA, 1989; pp. 137–146. [Google Scholar]
  37. Li, J.Z.; Yong, L.Q.; Yi, S.Q.; Peng, L.A. Exploring the Effects of Land Use Changes on the Landscape Pattern and Soil Erosion of Western Hubei Province from 2000 to 2020. Int. J. Environ. Res. Public Health 2022, 19, 1571. [Google Scholar] [CrossRef]
  38. Mirghaed, F.A.; Souri, B. Effect of landscape fragmentation on soil quality and ecosystem services in land use and landform types. Environ. Earth Sci. 2022, 81, 330. [Google Scholar] [CrossRef]
  39. Kemp, D.B.; Sadler, P.M.; Vanacker, V. The human impact on North American erosion, sediment transfer, and storage in a geologic context. Nat. Commun. 2020, 11, 6012. [Google Scholar] [CrossRef]
  40. Cui, H.W.; Wang, Z.; Yan, H.; Li, C.; Jiang, X.; Wang, L.; Liu, G.; Hu, Y.C.; Yu, S.X.; Shi, Z.H. Production-Based and Consumption-Based Accounting of Global Cropland Soil Erosion. Environ. Sci. Technol. 2022, 56, 10465–10473. [Google Scholar] [CrossRef]
  41. He, S.L.; He, X.W.; Li, F.Y.; Guo, X.J. Causes of undergrowth erosion and its control in southern red soil regions. Soil Water Conserv. China 2017, 3, 16–19. (In Chinese) [Google Scholar]
  42. Dai, T.Y.; Wang, L.Q.; Li, T.N.; Qiu, P.P.; Wang, J. Study on the Characteristics of Soil Erosion in the Black Soil Area of Northeast China under Natural Rainfall Conditions: The Case of Sunjiagou Small Watershed. Sustainability 2022, 14, 8284. [Google Scholar] [CrossRef]
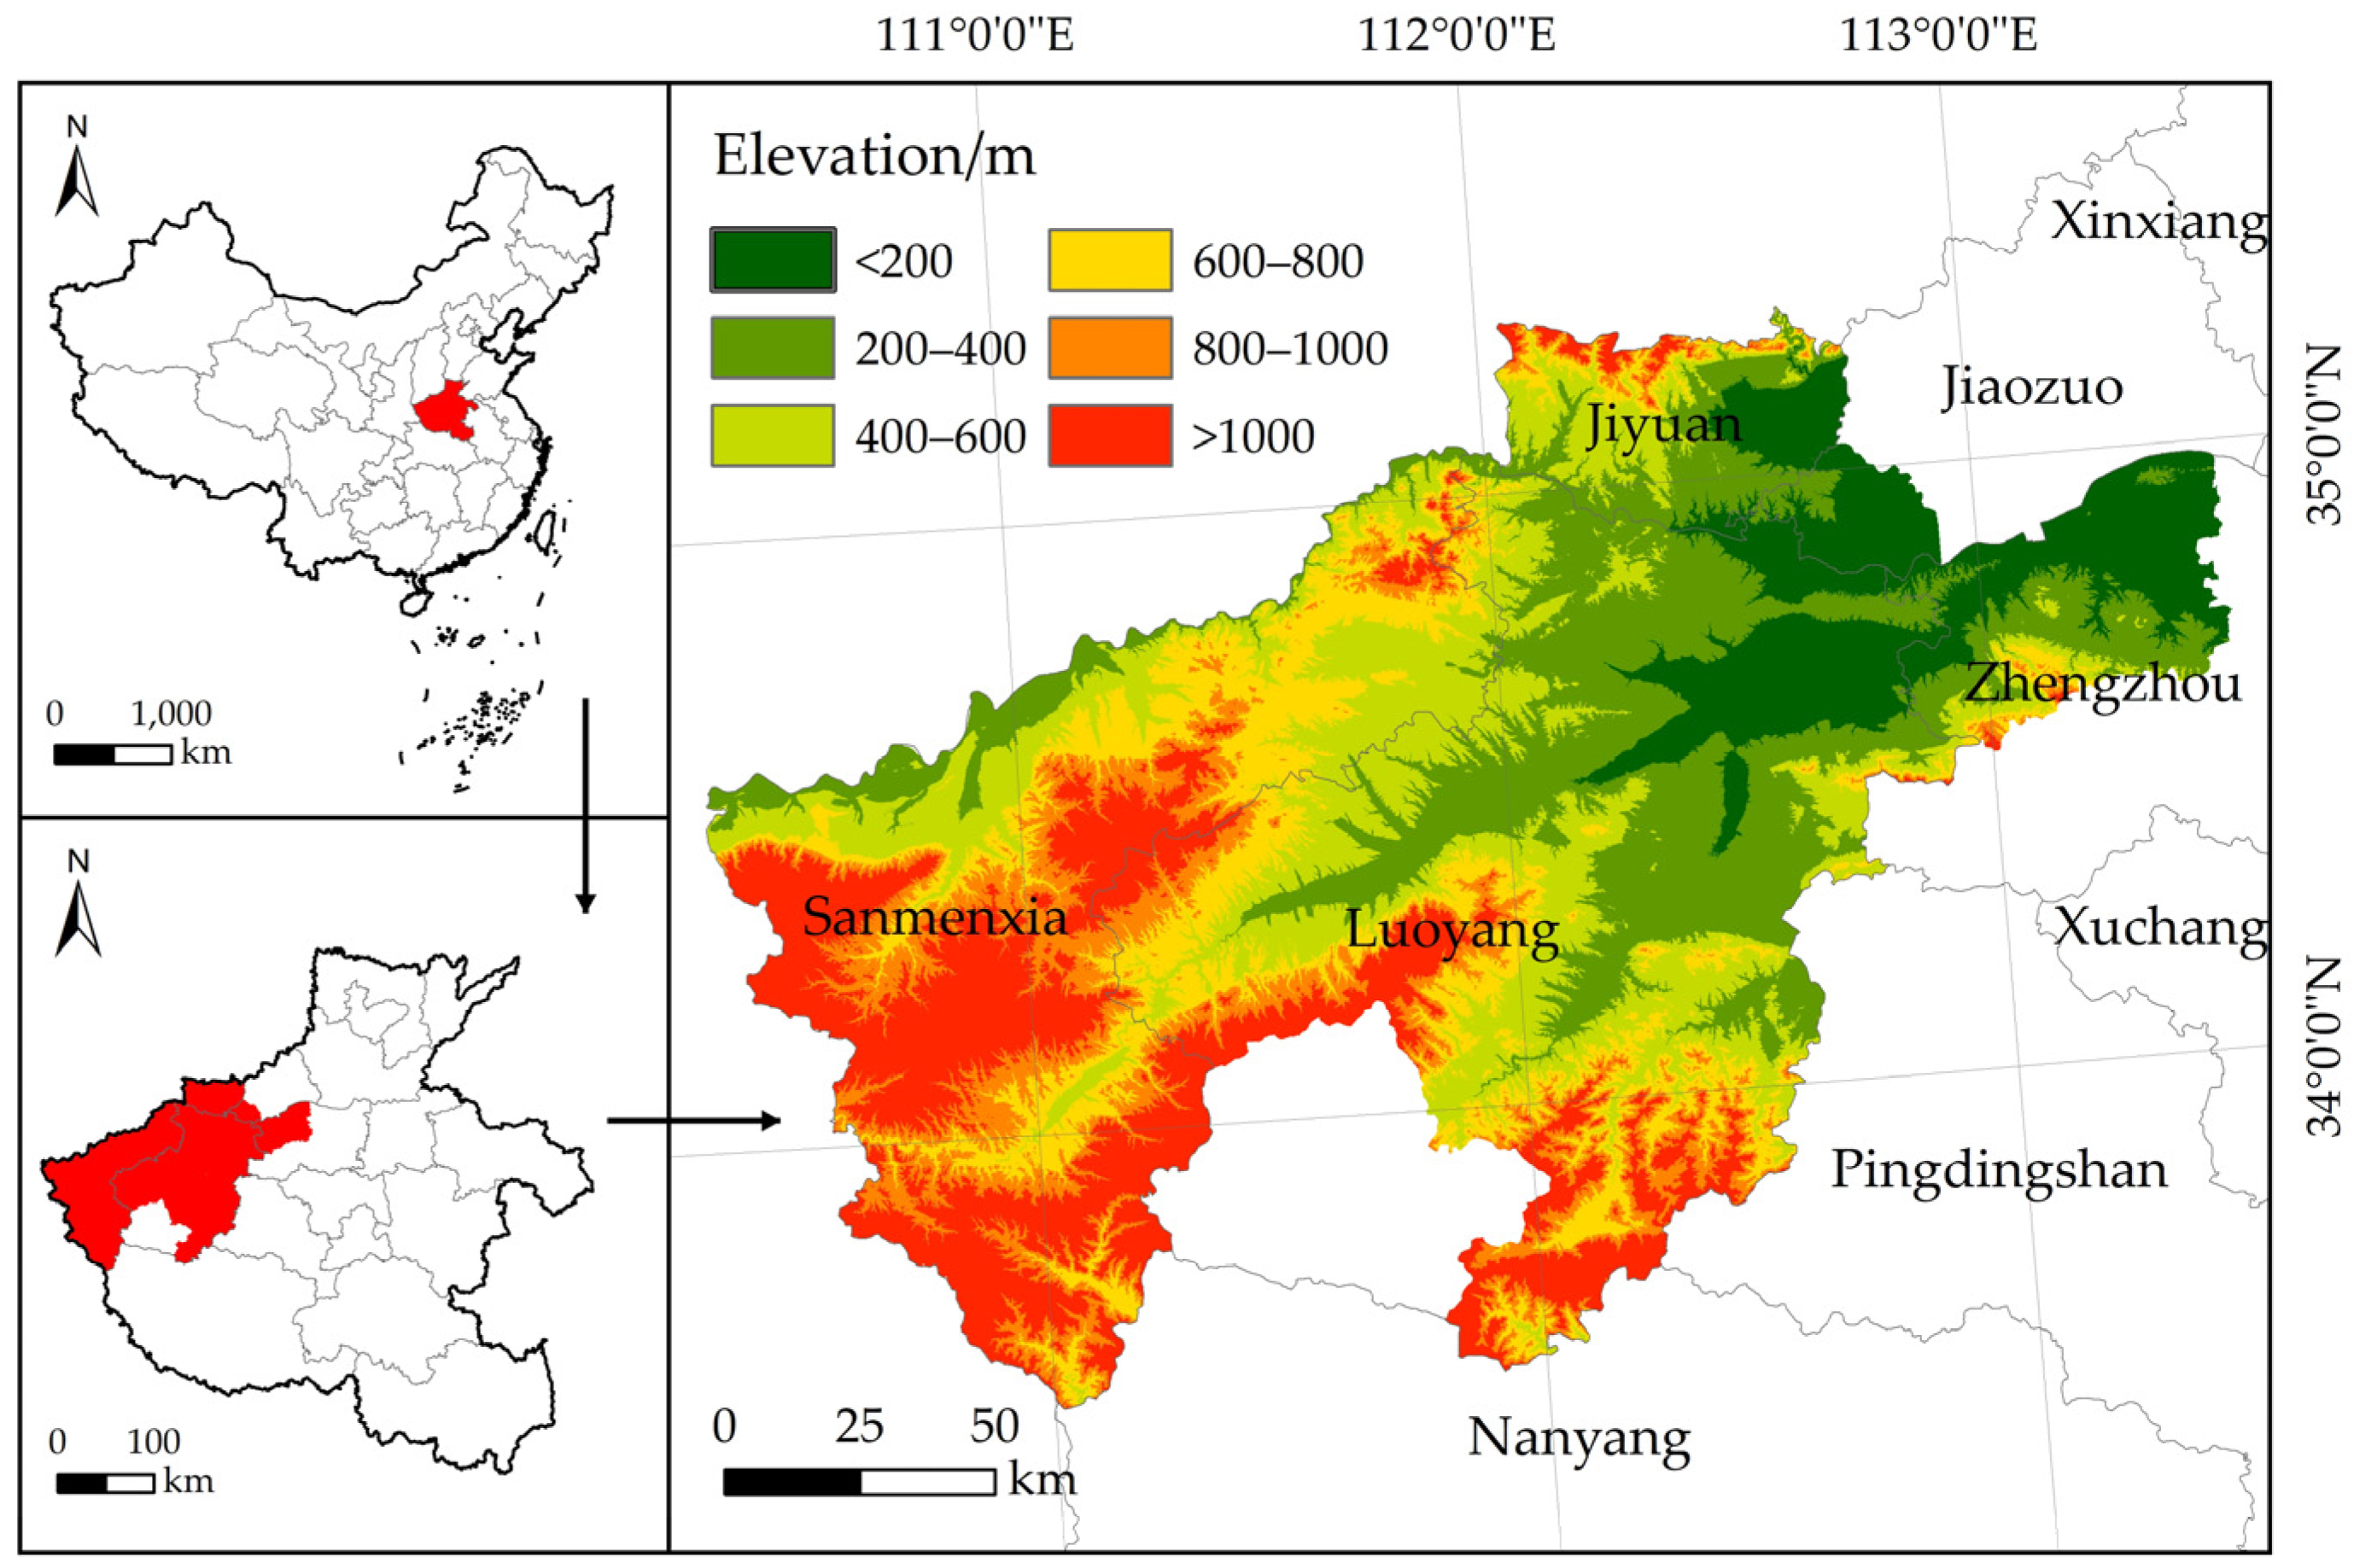
Figure 1. Location of the study area.
Water 16 02895 g001
Figure 2. Distribution of sample survey units.
Water 16 02895 g002
Figure 3. Soil erosion rates of sample survey units.
Water 16 02895 g003
Figure 4. Soil erosion area of different land-use types.
Water 16 02895 g004
Figure 5. Soil erosion area distribution at different elevations.
Water 16 02895 g005
Figure 6. Soil erosion distribution of different grade of slope.
Water 16 02895 g006
Figure 7. Percentage of soil erosion area in the study area.
Water 16 02895 g007
Figure 8. Factor geographical detection results in the study area.
Water 16 02895 g008
Figure 9. Interactive geographical detection results: (a) Soil erosion area; (b) Soil erosion rate.
Water 16 02895 g009
Table 1. Classification standard of soil erosion.
GradeAverage Erosion Rate
/t⋅ha−1⋅a−1
Mean Loss Thickness
/mm⋅a−1
Slight<2<0.15
Low2–250.15–1.9
Moderate25–501.9–3.7
High50–803.7–5.9
Extremely high80–1505.9–11.1
Severe>150>11.1
Table 2. Different forms of interaction between two covariates.
Interaction RelationshipInteraction
Qu∩v < min(Qu,Qv)Nonlinear-weaken: The interaction of two variables nonlinearly weakens the impacts of single variables.
min(Qu,Qv) ≤ Qu∩v ≤ max(Qu,Qv)Uni-variable weaken: The impacts of individual variables are weakened by the interaction, resulting in a uni-variable effect.
max(Qu,Qv) ≤ Qu∩v ≤ (Qu,Qv)Bi-variable enhance: The impact of single variables is enhanced by the interaction, resulting in a bi-variable effect.
Qu∩v = (Qu,Qv)Independent: The impacts of variables are assumed to be independent.
Qu∩v > (Qu,Qv)Nonlinear-enhance: The effects of variables are enhanced in a non-linear manner.
Table 3. The area and percentage of soil erosion in 2022.
Intensity2022
Area/km2Proportion/%
Slight134.8870.90
Low42.4222.30
Moderate10.375.40
High1.720.90
Extremely high0.710.40
Severe0.090.10
Table 4. Landscape index of different land-use in 2022.
Land-UseNPPDEDSHAPE_MNPAFRACAI/%
Cropland6583.46040.2881.5551.29995.618
Orchard land450.2371.7491.4351.29793.925
Forest land6033.17035.9351.5671.22397.109
Grassland1340.7055.5961.4951.32792.760
Construction land4942.59719.3051.3481.24594.909
Transportation land6423.37611.4471.2801.57081.550
Table 5. Comprehensive rank of soil erosion influencing factors based on multiple linear regression model.
RankSoil Erosion RatePercentage of Soil Erosion Area
1ELEELE
2TPRE
3SHEIS
4SHDIT
5POPSHEI
6LightSL
7PREGDP
8SLSHDI
9SPOP
10NDVINDVI
11SOMLight
12CONTAGNP
13NPSOM
14PDCONTAG
15GDPPD
Disclaimer/Publisher’s Note: The statements, opinions and data contained in all publications are solely those of the individual author(s) and contributor(s) and not of MDPI and/or the editor(s). MDPI and/or the editor(s) disclaim responsibility for any injury to people or property resulting from any ideas, methods, instructions or products referred to in the content.