Abstract
To address the problems of salinization of the soil in gully control and land-making projects, the formation mechanism of soil interflow from a gully valley on the Loess Plateau was investigated, regarding its interface, water source, and spatial-temporal distribution characteristics, through field location monitoring and isotope tracer technique. The results showed the following: (1) there are two types of soil interflow in the Loess Plateau, namely soil interflow in slope and in gully, with interflow in gully being the main form; (2) adequate water supply, layered soil structure, and geographic disparity are conditions for the formation of soil interflow in the gully; (3) soil water is recharged by precipitation, surface water, and groundwater. Surface water is an important source of soil water recharge at the 0–100 cm depth, whereas groundwater is an important source of soil water recharge at the 100–200 cm depth. The results provide a basis for the regulation of the soil interflow, resource utilization, and land quality improvement in the Loess Plateau.
1. Introduction
The Loess Plateau is located in the northern part of Central China and is one of the four plateaus in China. The Loess Plateau covers an area of approximately 640,000 km2 and contains approximately 270,000 gullies greater than 500 m in length. The average soil water content of the gullies is nearly three times higher than that of the slopes [1,2,3,4]. The gully’s arable land reserve resources are abundant, water and heat conditions are good, and food production potential is high. However, rainfall in the Loess Plateau is relatively concentrated, and low-lying gullies, drought, flooding, salinization, soil erosion, and other disasters occur frequently. Due to these problems, there is an urgent need to comprehensively improve the site conditions and ecological environment of the gullies and improve the comprehensive productivity of the cultivated land [5,6]. In 2013, China proposed the implementation of a major project involving 33,333 hm2 for gully control and land construction. This new model of gully governance includes gully land creation, dam system construction, dam repair, saline and alkaline land transformation, idle barren gully land development and utilization, and ecological construction. It is a systematic project to increase good land, protect ecology, and benefit people’s livelihoods through measures such as gating gullies to create land, damming and repairing gullies, padding gullies, and mulching to realize the benefit of early utilization of the dam system project in small watersheds [7,8]. This can increase the area of cultivated land, ensure food security, protect the ecological environment, and promote the construction of a better countryside.
The soil interflow is the portion of rainfall which infiltrates the hillslope and percolates through the soil till it reaches less permeable layers, on which it flows in saturated and unsaturated conditions downslope, seeping either directly or via the groundwater aquifer into the river [9]. It is the soil interflow that exists in the gullies and valleys which has directly or indirectly caused soil salinization, waterlogging disasters, and soil erosion [10]. But it plays important roles in water conservation, runoff regulation, nutrient loss control [11], and water circulation in watersheds in arid areas [12]. And it is one of the potential water resources in the gully of the Loess Plateau. So, the key question is how to regulate and utilize soil interflow. Therefore, it is necessary for us to investigate the mechanism of soil interflow. Ma et al. [13] pointed out that the weathered granite soil in Southeastern China has a distinct layered structure characteristic of “upper-soil, lower-sand, and bottom-rock”. Such soil properties are conducive to the infiltration of rainfall and the development of soil interflow. Du et al. [14] pointed out that there are the following four steps in the process of interflow generation across a hillslope: (1) infiltrated water brings the A and E horizons to field capacity, (2) the active portion of the argillic layer saturates and perching begins, (3) depressional storage in the argillic layer surface is filled, and (4) the depressions connect across the slope as infiltration continues. The hydraulic conductivities and thicknesses of topsoil and subsoil layers and the leakage rate of a compact base material affects the generation of the soil interflow [15]. It mainly occurs at the discontinuous interface of the soil at different layers. The soil layer below the interface is a relatively impervious layer with poor water permeability. The infiltration flow is blocked and accumulated on the discontinuous interface, forming a temporary saturation zone and resulting in soil interflow. In addition, rainfall is another important condition for the formation of soil interflow. As the rainfall increases, the interflow also increases [16]. The rainfall in the black soil area is mostly concentrated in summer and autumn, which is prone to rainstorms, and the black soil layer is mostly loess-like sub-clay with a relatively viscous texture. After long-term cultivation, a hard plough bottom is formed, with poor water permeability. When the summer precipitation is concentrated, it is easy to form a soil interflow in the lower part of the slope [17]. In the Loess Plateau, the precipitation is relatively concentrated and heavy rainfall or rainstorm is obvious. At the same time, the soil profile has a clear layered structure, and the terrain has a slope, forming a potential energy difference. These conditions are conducive to the formation of soil interflow. However, the formation mechanism of interflow in the gully areas of the Loess Plateau has rarely been studied.
On the basis of the above information, the objective of this study was to investigate the formation mechanism, sources, and distribution of soil interflow in the gullies of the Loess Plateau through field location monitoring. Finally, the study can provide a basis for the control of the interflow and resource utilization, as well as enhance the quality of land consolidation engineering.
2. Materials and Methods
2.1. Study Area
Jiulongquan gully land reclamation area (N36°14′40″~36°19′25″, E109°35′50″~109°39′50″) of a gully land reclamation project in Nanniwan Town, Baota District, Yan’an City, was taken as the research object. The Jiulongquan gully is 9.8 km long and the width of the valley generally ranges from 250 to 500 m. Construction of the Jiulongquan gully control and land reclamation project began in early 2013 and was completed in early 2014. It belongs to the hilly gully area of the Loess Plateau in Northern Shaanxi Province, where the terrain is high in the north and low in the south, with an average elevation of 1230 m above sea level. Its terrain is eroded by the dendritic river system, gullies, and ridge relief and is dominated by loess beams and hills. It belongs to the warm temperate continental monsoon climate. The average annual temperature is 6 °C. The average annual frost-free period is approximately 140 days. Rainfall is unevenly distributed in space and time, with large seasonal variations and low utilization rates. The average annual precipitation is 600 mm, and the rainfall is mainly concentrated from July to September. The soil in the watershed is dominated by loess and brown soil with obvious soil profile layers, and soil erosion is relatively severe in the area. The location of the study area is shown in Figure 1.
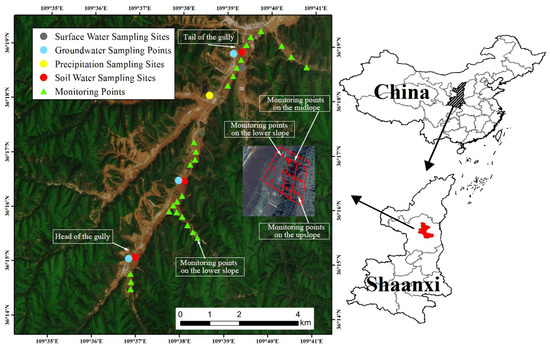
Figure 1.
Layout of soil water monitoring and sampling points.
2.2. Test Design and Monitoring
2.2.1. Layout of Moisture Monitoring Test
Along the upstream and downstream directions of the Jiulongquan gully, 10 sections were selected to monitor the soil moisture and temperature of the soil in gully and 2–3 monitoring points were set up along the vertical gully direction in each section, for a total of 26 monitoring points. On six typical slopes in the study area, the upper, middle, and lower areas were studied for long-term soil moisture observation, for a total of 18 monitoring points (Figure 1). The vegetation on the slope is mainly grassland and natural shrubs, and the gullies are mainly farmland. The soil type is Loessial soil. The mean soil grain size distributions from 18 samples were described as follows: clay (<0.002 mm; 6.3%), silt (0.002–0.05 mm; 66.3%), and sand (>0.05 mm; 127.4%).
This study sampled precipitation, groundwater, and surface water in the 0–200 cm soil layer of the gully to determine the concentration of hydrogen and oxygen isotopes in each water body and analyze the composition of the soil water source. Water samples were collected in April 2021 and July 2022 at three typical points selected from upstream to downstream along the gully. Soil water content in the upper 0–100 cm soil depth was calculated as the mean water content of data recorded at 0–10, 10–20, 20–30, 30–40, 40–50, 50–60, 60–70, 70–80, 80–90, and 90–100 cm intervals, while soil water content of the 100–200 cm soil depth was calculated as the mean water content of 100–120, 120–140, 140–160, 160–180, and 180–200 cm. Groundwater samples were collected from nearby civil wells in the upstream and downstream areas. Surface water was collected from a drainage gully in the gully, and the precipitation samples were obtained from natural rainfall. Soil samples were partly encapsulated in 10 mL brown glass bottles (to prevent the effect of evaporation on the isotopes of water) and used for soil water extraction indoors through an evaporative extraction device (LI-2000 liquid water vacuum extraction system) to determine the soil water hydroxide isotope concentration. A portion was preserved in sealed plastic bags to determine the wet soil weight in the field, soil water content, soil bulk weight, infiltration coefficient, and soil texture.
H and O isotopes in water samples were determined using the TC-EA high-temperature cracking method. An AS3000 autosampler was used to move 0.1 microliters of each of the water samples into a reaction tube at about 1400 °C. The water reacted with an excess of pure carbon to produce H2 and CO, which then entered a Delta V Advantage or MAT253 mass spectrometer for isotope determination. The soil bulk weight was determined using the ring-knife method; the soil percolation coefficient (Soil saturation water conductivity coefficient) was determined using the single-ring quantitative addition method; and the soil texture was determined using the densitometer method.
2.2.2. Calculation of Water Source in Soil Flow
A three-source linear mixed model was used to resolve the sources of soil moisture and their proportions in farmlands using the following equations:
where δD and δ18O represent the values of stable hydrogen and oxygen isotopes in soil moisture; δD1 (δ18O1), δD2 (δ18O2), δD3 (δ18O3) are the values of stable hydrogen (oxygen) isotopes in three different water sources; and F1, F2, and F3 are the proportions of the three water sources corresponding to the total amount of soil water.
δD = F1δD1 + F2δD2 + F3δD3
δ18O = F1δ18O1 + F2δ18O2 + F3δ18O3
F1 + F2 + F3 = 1
3. Results and Analysis
3.1. Interface of Flow in Soil
The soil moisture localization observation showed that at a soil depth >60 cm in slope, the soil moisture content of the lower slope was significantly higher than that of the middle and upper slopes, as well as higher than the regional standard for water-holding capacity of loess soil in the field (20–22%) (Figure 2). The samples at different locations of the slope revealed that the soil texture within 2 m depth in the upper and middle of the slope was relatively stable. There was no difference in the content of the clay, powder, and sand, and the soil types were all loess soils. However, near the lower area of the slope, there were obvious soil stratification characteristics at the 60–70 cm depth (Figure 3). Laboratory texture analysis revealed that the soil texture at 0–70 cm was consistent with the parameter characteristics of yellow soil, whereas the content of clay particles in the soil increased significantly at depths below 70 cm. The color of the soil was dark brown, which was significantly different from the characteristics of the surface layer of yellow soil.
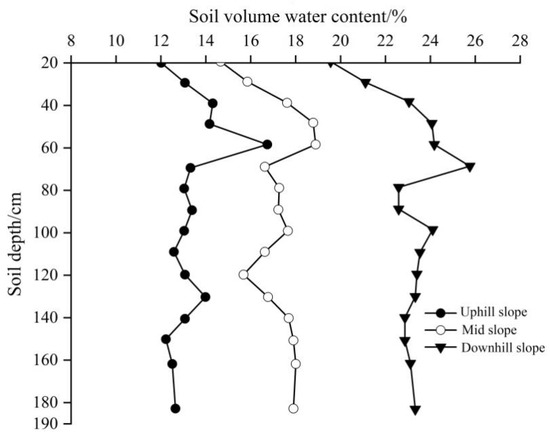
Figure 2.
Distribution of soil moisture content at different depths of slopes.
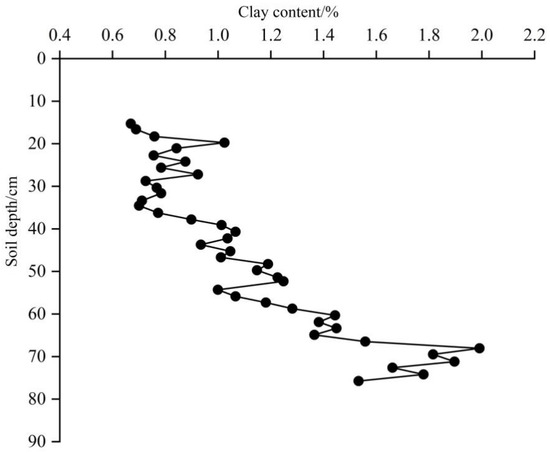
Figure 3.
Soil clay content at a depth of 70–100 cm along the slope.
The results showed that when the soil profile depth was >60 cm in the gully, the soil moisture content at the gully tail was significantly higher than at the gully head and higher than the field water capacity standard (20–22%) (Figure 4). The thickness of the soil layer in the gully showed a clear slope decrease from the head to the tail of the gully. The thickness of the soil layer was approximately 4–6 m at the head of the gully and 0.4–0.7 m at the tail of the gully, and the bedrock was exposed in some areas. Under the soil layer, there were gravel and calcareous layers.
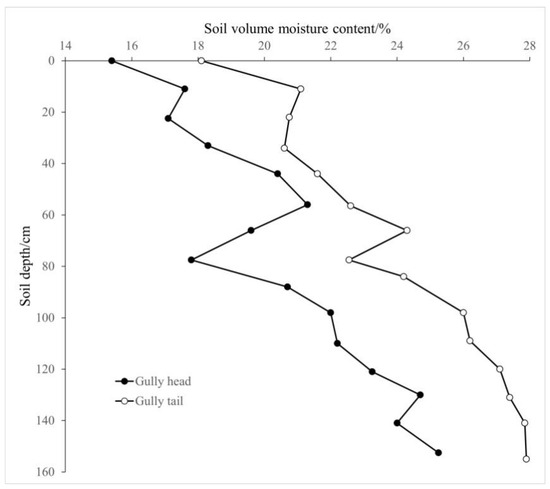
Figure 4.
Vertical distribution of soil moisture in gully of the study area.
3.2. Analysis of Water Sources in Soil Flow
The conversion ratios among precipitation, surface water, groundwater, and soil water were calculated using a three-component model (Equations (1)–(3)). δD and δ18O were used as tracers for calculation, and the results are shown in Table 1.

Table 1.
Conversion ratio of different water bodies.
Precipitation, surface water, and groundwater recharged the soil water, and there were differences in the recharge proportions between the 0–100 and 100–200 cm depth. At 0–100 cm, 20.57% of the soil water was recharged by precipitation, 78.32% by surface water, and 1.11% by groundwater, indicating that surface water was the main source of soil water recharge. At the 100–200 cm depth, 10.87% of the soil water was recharged by precipitation, 50.81% surface water, and 38.32% by groundwater, indicating that the importance of surface water and groundwater for soil water recharge increased at the 100–200 cm depth.
3.3. Analysis of Temporal and Spatial Distribution Characteristics of Soil Flow
By analyzing the change process of the relative soil water content (soil water content/field water holding capacity) (Figure 5 and Figure 6), it was found that on a spatial scale, the water content of slopes was in the order top-slope < mid-slope < bottom-slope, with the highest chances of loamy neutrophilic flow at the bottom of the slope. On a temporal scale, the relative soil water content at the bottom of the slope was greater than one in July–December, in which loam flow was generated in July–September when the rainfall was concentrated, and in October–December, when the rainfall was low and the soil at a depth of 30–70 cm at the foot of the slope could still generate loam flow, lagging behind the rainy season. On a spatial scale, loamy streams were common in the gullies and increased in frequency downstream. On a temporal scale, loamy streams were formed in the soil layer at a depth of below 80 cm at the head of the gully during March–November and in the soil layer at a depth of below 40 cm in the middle and lower reaches of the gully during April–December.

Figure 5.
Contour diagram of relative water content of soil at different locations of slopes.
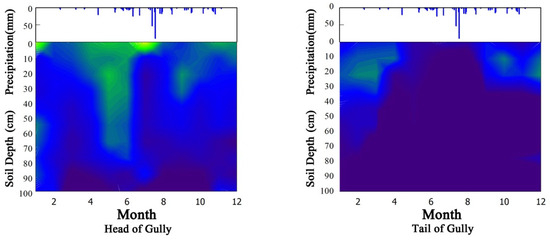
Figure 6.
Contour diagram of relative water content of soil at different locations of valleys.
3.4. Analysis of Soil Interflow Formation Mechanism in Gully
In the Loess Plateau region, the deep loess soil layer formed by wind deposition has good water storage properties and the water table is generally deep, making it difficult for underground runoff to enter through seepage after rainfall. Therefore, the discussion of rainfall runoff in this study mainly focuses on surface runoff and soil flow. Assuming that there is stratified soil, a certain rainfall intensity in a gully slope of the Loess Plateau, and a soil infiltration rate of i0, the following may be observed: when i < i0, all the precipitation enters the soil through infiltration; when the rainfall intensity i > i0, part of the precipitation enters the soil through vertical infiltration and part of the precipitation forms surface runoff owing to over-infiltration. In addition to the above rainfall conditions, we assumed the following conditions (Figure 7):
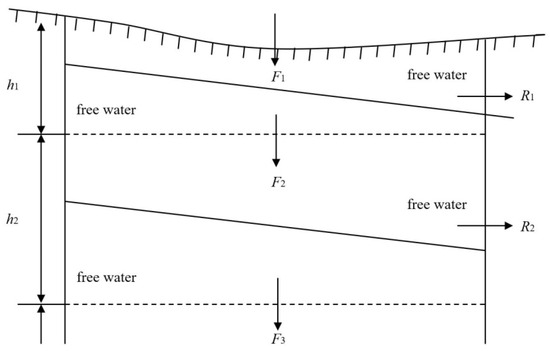
Figure 7.
Analysis of formation conditions of interflow.
- (1)
- According to the basic flow conditions of the soil, the soil was divided into two layers. The thicknesses of each layer from top to bottom were h1 and h2, respectively, the infiltration volumes were F1 and F2, respectively, and the corresponding flow rates of each layer were R1 and R2. F3 was the amount of water that continued to infiltrate downward.
- (2)
- For each layer, the initial water content of the soil was considered uniform, and the soil texture, field water capacity, and saturated water content remained unchanged throughout the flow generation process.
- (3)
- Soil layer 1 was the loose layer and soil layer 2 was the compact layer; the corresponding soil bulk density (ρ) saturated water conductivity Ks and infiltration rate have the following relationship:ρ1 < ρ2; Ks1 > Ks2; f1 > f2
- (4)
- The infiltration process was demarcated before and after the moisture infiltration front.
Based on the above assumptions, a discussion on the formation mechanism of loam mesocosms in the Loess valleys was initiated. Water in soil can be categorized into two forms—capillary tension water and free water. During rainfall, rainwater infiltrates from the soil surface and first replenishes the tension water of the upper soil layer; when it exceeds the field holding capacity of the soil layer, free water will appear in the soil pore space and, as the infiltration process continues, this part of the free water begins to drain to the bottom and the side with corresponding amounts of water of F1 and R1, respectively.
4. Discussion
4.1. The Mechanism of Soil Interflow of on Loess Plateau
Horton first proposed the theory of flow production, which stated that rainfall runoff is controlled by the following two conditions: the intensity of rainfall exceeds the infiltration capacity of the ground and the water content of the soil in the air-packed zone exceeds the field-holding capacity, that is, the super-permeable rainfall forms the surface runoff and the stable infiltration volume forms the subsurface runoff after the field-holding capacity is satisfied. Kirkby et al. proposed a new theory of flow production based on hillslope hydrology and a large number of hydrological experimental studies. Owing to the heterogeneity of the rock and soil layers, relatively temporary saturated zones may be formed at different downward seepage interfaces, which will produce lateral runoff that is the interflow. When the saturated zone develops upward such that the upper soil layer reaches the saturated water content, surface runoff is generated, which is different from the traditional hyperpermeable surface runoff called saturated slope interflow [18]. The proposed theory of hillslope hydrological flow production provides a basis for the specific division of surface runoff, interflow, and underground runoff, as well as a further understanding of the flow production mechanism containing different runoff components, which supplements Horton’s theory of flow production [19]. At present, there is abundant research on the interflow in the southern purple and red soil areas [20,21,22,23,24].
The Loess Plateau is arid and water scarce. It has deep soil and is not prone to producing interflow. However, the rainfall-producing flow process in the Loess Plateau gully is easily affected by the climatic and vegetation conditions of the watershed, particularly the water-storage characteristics of the loess. According to the monitoring results, there were three main conditions for the formation of interflow in the loess hill gully. The first condition was that the precipitation was concentrated, such that the modulus of flow production was large. The rainfall was strong and concentrated in the gully, the shallow depth of the water table (0.5–1.5 m) converged in the low-lying area of the gully valley, and the average flow production modulus for many years could reach 267,600 m3/km2. Precipitation in this area was 573 mm on average and mainly concentrated in July–September. The intensity of rainfall and yield flow were high, which were the water source conditions for the formation of interflow. The second condition was the layered soil structure. For the upper soil, the lower bedrock showed a layered structure. The layered structure forms different permeability interfaces and influences the formation of interflow. The third condition was a sloped terrain. From the head of the gully to the tail of the gully in the gully, the topography changed, which was a dynamic condition for the occurrence of interflow.
4.2. Types of Soil Interflow in Gully on the Loess Plateau
The analysis of the formation elements of soil interflow in the gully of the Loess Plateau revealed that, owing to the exposure of the leaching layer and bedrock at the bottom of the loess layer and under the action of the underlying impermeable layer, when rainfall is high, the basic elements of interflow exist and they easily form on the side slopes; however, they generally have a short duration. This type of interflow is not obvious 1–2 days after precipitation [25,26].
There was another type of soil interflow in gully farmlands formed along the gully. From the head to the tail of the gully, the thickness of the soil layer gradually decreased and some areas of the gully tail, including the bedrock, were exposed. Gravel and calcium accumulation layers under the soil layer effectively prevented the infiltration of surface water and a relatively saturated layer was often formed at the bottom of the soil layer, which could be maintained for a long time. Therefore, rice planting has become a common way of land use in some gullies in Yan’an. The soil water in the gully and groundwater exchange frequently, especially when the groundwater level rises after precipitation. Thus, the interflow in the gully and groundwater are difficult to distinguish. Therefore, although the total amount of runoff in the gully is greater than in the slope soil, it is difficult to observe, such that few studies have been conducted on this. If the soil interflow in gully cannot be controlled and utilized effectively, it will waste water resources, cause degradation, and hinder project implementation results.
The interflow across the slope and in the gully together constitutes the soil interflow production system in the loess hill gully. The interflow in the gully is characterized by a wide range of abundant water, covering the entire reproductive period of crops, and is the main form of interflow. Although there are differences in the formation mechanisms of both, they will have different degrees of influence on the gully and land consolidation projects and should be emphasized.
4.3. Multi-Water Source Recharge Transformation and Source Ratio of Gully and Valley
Different water bodies in the Loess Plateau constantly undergo transmission, exchange, and transformation. Precipitation falls to the surface to form surface runoff, and this surface runoff converges to form surface water. Surface water and shallow groundwater exchanges occur at any time. Surface runoff will also infiltrate the soil to form soil water, which can eventually form deep groundwater through the slow infiltration process. In different bodies, soil water is replenished through the exchange of different media. The soil water cycle is characterized by an annual cycle in time and differences in the depth and intensity in space and is closely related to factors such as climate, soil, topography (including slope, slope direction, slope position, and slope shape), and vegetation [27]. Studies have shown that the spatial variability of surface soil moisture in the rainy season is closely related to soil porosity and hydraulic conductivity, while the spatial variability of surface soil moisture in the dry season is closely related to slope position, slope orientation, and clay content. The main sources of soil moisture in the hilly and gully areas of the Loess Plateau are precipitation and groundwater recharge. Soil moisture expenditure mainly involves transpiration and evaporation [28].
The Loess Plateau is a huge reservoir with strong water storage capacity, but the distribution of precipitation is uneven in season. The annual precipitation is about 400 mm, more than 60% of which is concentrated from June to September, and the evaporation is between 1400 and 2000 mm. Therefore, the soil layer within 2 m is in a state of water deficit in most areas all year [29]. Affected by canopy interception, soil evapotranspiration, and soil water infiltration and redistribution [30], rainfall is less likely to recharge the soil water in the 0–100 cm soil layer, while surface water recharges the soil water by storing water during concentrated rainfall periods, so surface water becomes the main source of shallow soil water recharge [31]. The soil in the gully is stratified, and the confined water head in the bedrock of the gully is exposed or buried shallowly, forming spring holes in the gully to supplement the soil water in the gully. However, due to the existence of a weak permeable layer, groundwater gives priority to recharge the soil water in the 100–200 cm soil layer [32], and the recharge of surface water to deep soil water is also limited to a certain extent. It can still recharge deep groundwater, so groundwater and surface water become the main water source for the 100–200 cm recharge.
5. Conclusions
In this study, we discovered that there is an abundant soil interflow in the gully of the Loess Plateau. The main conditions for the formation of soil interflow in the Loess Plateau are concentrated and high-intensity rainfall resources, loose upper soil, compact lower soil structure, and obvious terrain differences. This study has filled the gap in the theory of hydrology and water resources in the gully of the Loess Plateau, but there is a lack of research on the further efficient utilization of soil interflow, which can be further strengthened in future research.
Author Contributions
N.L. wrote the main manuscript. J.H. conceived the overall framework of the manuscript. Y.Z. conceived the study and conducted experimentation. Z.S. analyzed the data. Y.L. and L.X. drew some charts. All authors have read and agreed to the published version of the manuscript.
Funding
This work was supported by the Scientific Research Item of Shaanxi Provincial Land Engineering Construction Group (DJNY2024-38, DJTD-2023-1 and DJNY-ZD-2023-3), Xi’an Science and Technology Plan Project (22NYGG0001) and Key Research and Development Program of Shaanxi, China (Program No. 2022ZDLNY02-01, 2023-ZDLNY-52).
Data Availability Statement
The data presented in this study are available on request from the corresponding author.
Conflicts of Interest
The authors declare that the research was conducted in the absence of any commercial or financial relationships that could be construed as a potential conflict of interest.
References
- Zhao, Y.; Wang, Y.; Wang, L.; Zhang, X.; Yu, Y.; Jin, Z.; Lin, H.; Chen, Y.; Zhou, W.; An, Z. Exploring the role of land restoration in the spatial patterns of deep soil water at watershed scales. Catena 2019, 172, 387–396. [Google Scholar] [CrossRef]
- Wang, T.; Xiao, W.; Huang, Z.; Zeng, L. Interflow pattern govern nitrogen loss from tea orchard slopes in response to rainfall pattern in three gorges reservoir area. Agric. Water Manag. 2022, 269, 107684. [Google Scholar] [CrossRef]
- Xie, M.; Zhang, P.; He, Y.; Hong, D. Combined effects of rainfall pattern and fertilization on subsurface nitrogen transport and loss from sloped soil: A laboratory experiment. Arab. J. Geosci. 2023, 16, 31. [Google Scholar] [CrossRef]
- Xie, M.; Zhang, Z.; Zhang, P.; Xu, J.; Lin, Q. Migration and loss law of nitrate nitrogen in cultivated land on purple soil slope and its numerical simulation. J. Agric. Eng. 2018, 34, 147–154. [Google Scholar]
- Xie, M.; Hong, D.; Fu, J.; Zhang, Z.; Zheng, C.; Zhang, P. Nitrate migration characteristics in soil on purple soil slopes under single and intermittent rainfall. J. Soil Water Conserv. 2022, 36, 24–29. [Google Scholar]
- Meng, Z.J.; Ma, P.H.; Peng, J.B. Characteristics of loess landslides triggered by different factors in the Chinese Loess Plateau. J. Mt. Sci.-Engl. 2021, 18, 3218–3229. [Google Scholar] [CrossRef]
- An, L.; Zheng, Z.; Wang, Y.; Li, T.; Yang, L. Effects of tillage practices on cultivated land runoff and loss of soluble organic carbon in yellow soil slope during maize growing period. J. Soil Water Conserv. 2022, 36, 75–81. [Google Scholar]
- Hua, K.; Zhu, B.; Wang, X.; Tian, L. Forms and fluxes of soil organic carbon transport via overland flow, interflow, and soil erosion. Soil Sci. Soc. Am. J. 2016, 80, 1011–1019. [Google Scholar] [CrossRef]
- Flügel, W.A. Hangentwasserung durch interflow und seine regionalisierung Einzugsgebiet der Elsenz (Kraichgau). Berliner Geogr. Arbeiten. 1993, 78, 68–94. [Google Scholar]
- Zheng, F.L.; Huang, C.H.; Norton, L.D. Effects of near-surface hydraulic gradients on nitrate and phosphorus losses in surface runoff. J. Environ. Qual. 2004, 33, 2174–2182. [Google Scholar] [CrossRef]
- Wang, T.; Zhu, B.; Zhou, M.; Hu, L.; Jiang, S.; Wang, Z. Nutrient loss from slope cropland to water in the riparian zone of the Three Gorges Reservoir: Process, pathway, and flux. Agric. Ecosyst. Environ. 2020, 302, 107108. [Google Scholar] [CrossRef]
- Liu, Y.; Liu, F.; Xu, Z.; Zhang, J.; Wang, L.; An, S. Variations of soil water isotopes and effective contribution times of precipitation and throughfall to alpine soil water, in Wolong Nature Reserve, China. Catena 2015, 126, 201–208. [Google Scholar] [CrossRef]
- Ma, Y.; Li, Z.; Tian, L.; Yang, Y.; Li, W.; He, Z.; Liu, Y. Erosion of granite red soil slope and processes of subsurface flow generation, prediction, and simulation. Int. J. Environ. Res. Public Health 2023, 20, 2104. [Google Scholar] [CrossRef] [PubMed]
- Du, E.; Jackson, C.R.; Klaus, J.; McDonnell, J.J.; Griffiths, N.A.; Williamson, M.F.; Bitew, M. Interflow dynamics on a low relief forested hillslope: Lots of fill, little spill. J. Hydrol. 2016, 534, 648–658. [Google Scholar] [CrossRef]
- Ahuja, L.R.; Ross, J.D. Effect of subsoil conductivity and thickness on interflow pathways, rates and source areas for chemicals in a slopling layered soil with seepage face. J. Hydrol. 1983, 64, 189–204. [Google Scholar] [CrossRef]
- He, S.; Rui, M.; Wang, N.; Shuang, W.; Li, T.; Zhang, Z. Comparison of nitrogen losses by runoff from two different cultivating patterns in sloping farmland with yellow soil during maize growth in Southwest China. J. Integr. Agric. 2022, 21, 222–234. [Google Scholar] [CrossRef]
- An, J.; Zheng, F.; Römkens, M.J.; Li, G.; Yang, Q.; Wen, L.; Wang, B. The role of soil surface water regimes and raindrop impact on hillslope soil erosion and nutrient losses. Nat. Hazards 2013, 67, 411–430. [Google Scholar] [CrossRef]
- Xie, Z.; Su, F.; Liang, X.; Zeng, Q.; Guo, Y. Applications of a surface runoff model with horton and dunne runoff for VIC. Adv. Atmos. Sci. 2003, 20, 165–172. [Google Scholar]
- Mario, P.; Massimo, I.; Roberto, M.; Di Prima Simone Filippo, G.; Hassan, A. Large-scale lateral saturated soil hydraulic conductivity as a metric for the connectivity of subsurface flow paths at hillslope scale. Hydrol. Process 2022, 36, 14649. [Google Scholar]
- Ding, X.; Xue, Y.; Lin, M.; Jiang, G. Influence mechanisms of rainfall and terrain characteristics on total nitrogen losses from regosol. Water 2017, 9, 167. [Google Scholar] [CrossRef]
- Kanthle, A.K.; Lenka, N.K.; Lenka, S.; Tedia, K. Biochar impact on nitrate leaching as influenced by native soil organic carbon in an inceptisol of central India. Soil Tillage Res. 2016, 157, 65–72. [Google Scholar] [CrossRef]
- Li, Q.; Ding, W.; Xie, M. Dynamic characteristics of nitrogen concentration in interflow of purple soil slope under simulating rainfall condition. Soil Water Conserv. China 2019, 9, 51–55. [Google Scholar]
- Liu, Y.J.; Tang, C.J.; Zheng, H.J.; Jian, M.; Yang, J. Characteristics of the surface-subsurface flow generation and sediment yield to the rainfall regime and land-cover by long-term in-situ observation in the red soil region, southern China. J. Hydrol. 2016, 539, 457–467. [Google Scholar] [CrossRef]
- Wu, L.; Peng, M.; Qiao, S.; Ma, X.Y. Effects of rainfall intensity and slope gradient on runoff and sediment yield characteristics of bare loess soil. Environ. Sci. Pollut. R 2018, 25, 3480–3487. [Google Scholar] [CrossRef]
- Tokunaga, T.K.; Tran, A.P.; Wan, J.; Dong, W.; Newman, A.W.; Beutler, C.A.; Brown, W.; Henderson, A.N.; Williams, K.H. Quantifying subsurface flow and solute transport in a snowmelt-recharged hillslope with multiyear water balance. Water Resour. Res. 2022, 58, e2022WR032902. [Google Scholar] [CrossRef]
- Zhou, R.X.; Wang, J.; Tang, C.J.; Zhang, Y.P.; Chen, X.A.; Li, X.; Shi, Y.Y.; Wang, L.; Xiao, H.B.; Shi, Z.H. Identifying soil water movement and water sources of subsurface flow at a hillslope using stable isotope technique. Agric. Ecosyst. Environ. 2023, 343, 108286. [Google Scholar] [CrossRef]
- Saeid, N.; William, I.; Kevin, W. Impact of flow pathway and source water connectivity on subsurface sediment and particulate phosphorus dynamics in tile-drained agroecosystems. Agric. Water Manag. 2022, 269, 107641. [Google Scholar]
- Jin, Z.; Li, G.; Wang, Y.; Yu, Y.; Lin, H.; Chen, Y.; Chu, G.; Zhang, J.; Zhang, N. Valley reshaping and damming induce water table rise and soil salinization on the Chinese loess plateau. Geoderma 2019, 339, 115–125. [Google Scholar] [CrossRef]
- Lv, X.; Zuo, Z.; Juan, S.; Ni, Y.; Wang, Z. Climatic and human-related indicators and their implications for evapotranspiration management in a watershed of Loess Plateau, China. Ecol. Indic. 2019, 101, 143–149. [Google Scholar] [CrossRef]
- Chen, L.; Huang, Z.; Gong, J.; Fu, B.; Huang, Y. The effect of land cover/vegetation on soil water dynamic in the hilly area of the loess plateau, China. Catena 2007, 70, 200–208. [Google Scholar] [CrossRef]
- Ma, J.; Han, J.; Zhang, Y.; Lei, N.; Liu, Z.; Du, Y. Temporal stability of soil water content on slope during the rainy season in gully regulation watershed. Environ. Earth Sci. 2020, 79, 173–186. [Google Scholar] [CrossRef]
- Liu, W.; Zhang, X.; Dang, T.; Zhu, O.; Zhi, L.; Wang, J.; Rui, W.; Gao, C. Soil water dynamics and deep soil recharge in a record wet year in the southern loess plateau of China. Agric. Water Manag. 2010, 97, 1133–1138. [Google Scholar] [CrossRef]
Disclaimer/Publisher’s Note: The statements, opinions and data contained in all publications are solely those of the individual author(s) and contributor(s) and not of MDPI and/or the editor(s). MDPI and/or the editor(s) disclaim responsibility for any injury to people or property resulting from any ideas, methods, instructions or products referred to in the content. |
© 2024 by the authors. Licensee MDPI, Basel, Switzerland. This article is an open access article distributed under the terms and conditions of the Creative Commons Attribution (CC BY) license (https://creativecommons.org/licenses/by/4.0/).