Article

Impact of Fluid Migration Conditions on Hydrate Accumulation in the Shenhu Area: Insights from Thermo-Flow-Chemical Simulation

1
Key Laboratory of Shale Gas and Geoengineering, Institute of Geology and Geophysics, Chinese Academy of Sciences, Beijing 100029, China
2
College of Earth and Planetary Sciences, University of Chinese Academy of Sciences, Beijing 100049, China
*
Author to whom correspondence should be addressed.
Water 2024, 16(19), 2822; https://doi.org/10.3390/w16192822
Submission received: 10 September 2024 / Revised: 27 September 2024 / Accepted: 3 October 2024 / Published: 4 October 2024
(This article belongs to the Special Issue Advances in Marine Sedimentation and Geological Processes)

Abstract

:
Natural gas hydrates are a clean and efficient new energy source with the potential to replace conventional energy, holding significant production value. Studying hydrate accumulation systems is fundamental for hydrate resource evaluation and target reservoir selection. The Shenhu area of the South China Sea has abundant hydrate resources, and drilling data show that the hydrate distribution in this area exhibits noticeable heterogeneity. Aiming at this phenomenon, we used a novel thermo-flow/chemical coupled simulator to simulate the hydrate accumulation system based on the actual geological strata and provide a detailed depiction of the evolution of components in the process. The results indicate that favorable migration conditions can accelerate hydrate formation. However, to achieve the rapid formation of thick, high-saturation hydrate layers, the fluid migration conditions must be complemented by effective fluid aggregation conditions. Furthermore, a sensitivity analysis of the fault morphology was conducted, revealing that larger-scale faults are more conducive to rapid hydrate accumulation. In summary, this study provides a quantitative analysis of the hydrate accumulation process and its key influence factors using a novel simulator, offering theoretical support for resource evaluation and an exploration of hydrate distribution.

1. Introduction

Natural gas hydrates (hereinafter referred to as hydrates) are solid crystalline clathrate compounds composed of water molecules and natural gas molecules. The primary gas is CH4, but it can also include other gases, such as CO2, N2, H2S, and C2H6. In nature, hydrates are predominantly found in marine environments and permafrost regions on land [1,2]. Hydrates play a crucial role in the global carbon cycle. Meanwhile, as a new type of clean and efficient energy, they have vast reserves and widespread distribution worldwide. The total volume of hydrate resources is estimated to be twice that of coal, oil, and natural gas combined [3]. Hydrates are a promising substitution for conventional energy sources, with significant exploitation potential.
Hydrate accumulation refers to the process by which hydrates are stored within a reservoir and reach an exploitable saturation under specific conditions. This process typically requires the coordination of various accumulation factors, including a hydrocarbon supply system, fluid migration pathways, and a hydrate formation zone (HFZ). Consequently, the hydrate accumulation process is often studied as a comprehensive system [4,5,6]. Understanding the patterns of hydrate accumulation is fundamental for the assessment of hydrate resources and the selection of optimal target reservoirs. Clarifying how hydrates naturally accumulate under specific conditions will aid in improving the accuracy of identifying and evaluating high-quality hydrate layers. This, in turn, is crucial for optimizing extraction strategies, promoting safe and efficient hydrate development, and ultimately overcoming the challenges of hydrate commercialization.
The Shenhu area in the South China Sea is a key region for hydrate research in China, with abundant hydrate resources and promising exploration prospects. The Guangzhou Marine Geological Survey (GMGS) has conducted several hydrate drilling expeditions in the Shenhu area, including GMGS1 and GMGS3, which have yielded extensive resource information and hydrate samples. In 2017, the first trial production of hydrate took place in the Shenhu area [7], followed by a second trial in 2020. These operations confirmed the presence of hundreds of billions of cubic meters of hydrate reserves and the vast potential for hydrate development in the Shenhu area [8]. Therefore, this region was selected as the focus of this study.
Seismic data and physical samples from the drilling area in the Shenhu region indicate the presence of high-saturation hydrates with a distinctly heterogeneous distribution [9]. Su et al. [10] clarified the various elements of the hydrate accumulation system in the Shenhu area, noting that it is characterized by a “dual-source, multi-flow, multi-phase” system. Wu et al. [11] focused on studying the geological structures of the Shenhu area, revealing that the widely developed diapir structures, high-angle faults, and vertical fracture systems are the primary pathways for fluid migration. Zhang et al. [9] conducted a detailed characterization of the hydrate accumulation features in the high-saturation hydrate reservoirs within the siltstone at the W19 site in the GMGS3 drilling area of the Shenhu region, using well log data. They analyzed the controlling effects of the migration pathways, such as faults, mud diapirs, and gas chimneys on hydrate accumulation. Zhu et al. [12] used the TOUGH+HYDRATE to model the hydrate accumulation at the SH2 site in the Shenhu area, analyzing the effects of factors, such as the proportion of CH4 from different gas sources in mixed-source hydrates and the salt diffusion coefficient on the hydrate saturation. He et al. [13] constructed a two-dimensional numerical model to simulate the hydrate accumulation process in the Shenhu area, as well as the relationships among mud diapirs, gas chimneys, and hydrate reservoirs. They concluded that the flow rate of water plays a crucial role in the formation of natural gas hydrates; hydrate formation only occurs when the CH4 flow matches the water flow. Lei et al. [14] identified the primary causes of the heterogeneous distribution of natural gas hydrates, including factors such as faults, fault activity timing, the gas source supply, the thickness of the HFZ, and the reservoir grain size and physical properties. They concluded that high-saturation hydrate zones are mainly located near the structural traps, open faults, and diapir structures, with substantial thermogenic gas sources typically present at the base. In summary, the heterogeneity of the hydrate distribution in the Shenhu area of the South China Sea is a result of the combined influence of the gas supply conditions, fluid migration conditions, and hydrate reservoir conditions within the hydrate resource. However, there is still a lack of specific quantitative analysis of how these controlling factors influence hydrate accumulation and an insufficient understanding of the combined effects of multiple controlling conditions on hydrate accumulation.
Building on the aforementioned research on hydrate accumulation systems, this paper further summarizes the factors influencing the heterogeneous distribution of hydrates. The authors posit that the formation of high-saturation hydrates requires the fulfillment of fluid migration conditions, primarily governed by faults and gas chimneys, in conjunction with fluid aggregation conditions controlled by the hydrate reservoir and cap rock. Based on this, this study employs a newly developed thermo-flow/chemical (THC) coupled simulator to establish a geological model that details the evolution of various components during hydrate accumulation. A quantitative analysis is conducted to assess the impact of the fluid migration conditions on hydrate accumulation, further elucidating the causes of hydrate distribution heterogeneity. Finally, a sensitivity analysis is performed on factors such as the fault width. The goal is to provide theoretical support for the evaluation of hydrate resources and the exploration of hydrate distribution in marine sediments.

2. Modeling Approach

This study utilized a newly developed THC coupled simulator, which has been validated across multiple scales using classical models, laboratory experiments, and field conditions [15,16,17,18,19,20], to establish a geological model of the Shenhu area. The simulator can simulate chemical reactions among various components during the hydrate accumulation process (such as hydrate formation and dissociation), fluid flow, heat exchange, and the inhibitory effects of substances like sodium chloride on hydrate formation within the strata. The simulator has a high degree of flexibility and can define the components and phase transitions in the model according to the actual situation, which has universal implications for the simulation of underground multiphase flow. It has already been applied in several studies related to unconventional oil and gas [15,16,17,18,19,20].
The model established in this study comprehensively considers the five components involved in the hydrate accumulation process (hydrate, methane, water, and salinity) and the three phases (gas, liquid, and solid). The entire system adheres to the principles of mass conservation and energy conservation [21]:
d d t V n   M κ d V = Γ n   F κ · n d Γ + d d t V n   q κ d V ,
where t is the time, V is the volume, Γ is the surface area, M κ is the mass accumulation term of component κ , F κ is the flux term of component κ , q κ is the source/sink term of component κ , and n is the inward unit normal vector. Energy is treated as a pseudo-component (denoted by the superscript θ ). For κ = θ , M κ is the energy accumulation term per unit volume of the porous medium, F κ is the energy flux term, and q κ is the rate of heat generation/consumption per unit volume.
Under equilibrium conditions, the three components (water, CH4, and salinity) can exist in four phases (water, gas, solid hydrates, and solid ice). The mass accumulation terms for these phases can be described as follows [21]:
M κ = β = A , G , I , H ϕ S β ρ β X β κ                   κ = ω ,     m ,     i ,
where ϕ is the porosity of the porous medium, S β is the saturation of phase β , ρ β is the density of phase β , and X β κ is the mass fraction of component κ in phase β . The symbols A, G, H, and I represent the aqueous phase, gas phase, hydrate phase, and ice phase, respectively. The symbols ω ,   m ,   a n d   i are the water, CH4, and salinity components, respectively.
The energy accumulation term includes contributions from the porous medium and all four phases [21]:
M θ = ( 1 ϕ ) ρ R C R T + β = A , G , H , I ϕ S β ρ β U β + Δ ( ϕ ρ H S H Δ H 0 ) ,
where ρ R is the density of the porous medium, C R is the specific heat capacity of the porous medium, T is the temperature, U β is the specific internal energy of phase β , Δ H 0 is the specific enthalpy of hydrate decomposition/formation, and Δ ( ϕ ρ H S H Δ H 0 ) is the reaction heat during natural gas hydrate formation/decomposition.
Since hydrates and solid ice are immobile, the contribution of the two solid phases ( β   = H, I) to the flux term is zero. The flux term is contributed by the mobile aqueous and gas phases.
The energy flux term considers both heat conduction and heat convection, as follows [18]:
F θ = k ¯ θ T + β = A , G h β F β ,
where k ¯ θ is the heat conductivity of the medium, and h β is the specific enthalpy of phase β .
The physical property equations related to hydrates are as follows:
  • The reaction equation for hydrate formation is as follows [22]:
CH 4 ( w ) + n H 2 O ( w )     CH 4 · n H 2 O ( s ) ,
2.
The reaction heat of hydrate formation is as follows [22]:
Q d i s s = Δ ( ϕ ρ h S h Δ H 0 ) ,
where  ρ h is the density of the hydrate, and S h is the saturation of the hydrate.
3.
The phase equilibrium equation of natural gas hydrate is as follows [23]:
P e q = e x p ( e 1 + e 2 T e q ) ,
when  T e q = 273.15 ~ 298.15 K   248.15 ~ 273.15 K :
e 1 = 38.980   14.717         e 2 = 8533.80   1886.79 ,
where P e q is the phase equilibrium pressure, T e q is the phase equilibrium temperature, and e 1 and e 2 are fitting coefficients.
The permeability of the reservoir is constantly undergoing dynamic changes. This necessitates a correction to the permeability, as follows [24]:
k r , α = [ S a S i r , a 1 S i r , a ] n H ,
where k r S is the relative permeability, S a is the saturation, S i r , a is the residual saturation, and n H is the attenuation exponent, whose value is determined based on the properties of the reservoir.

3. Model Setup

3.1. Geological Background
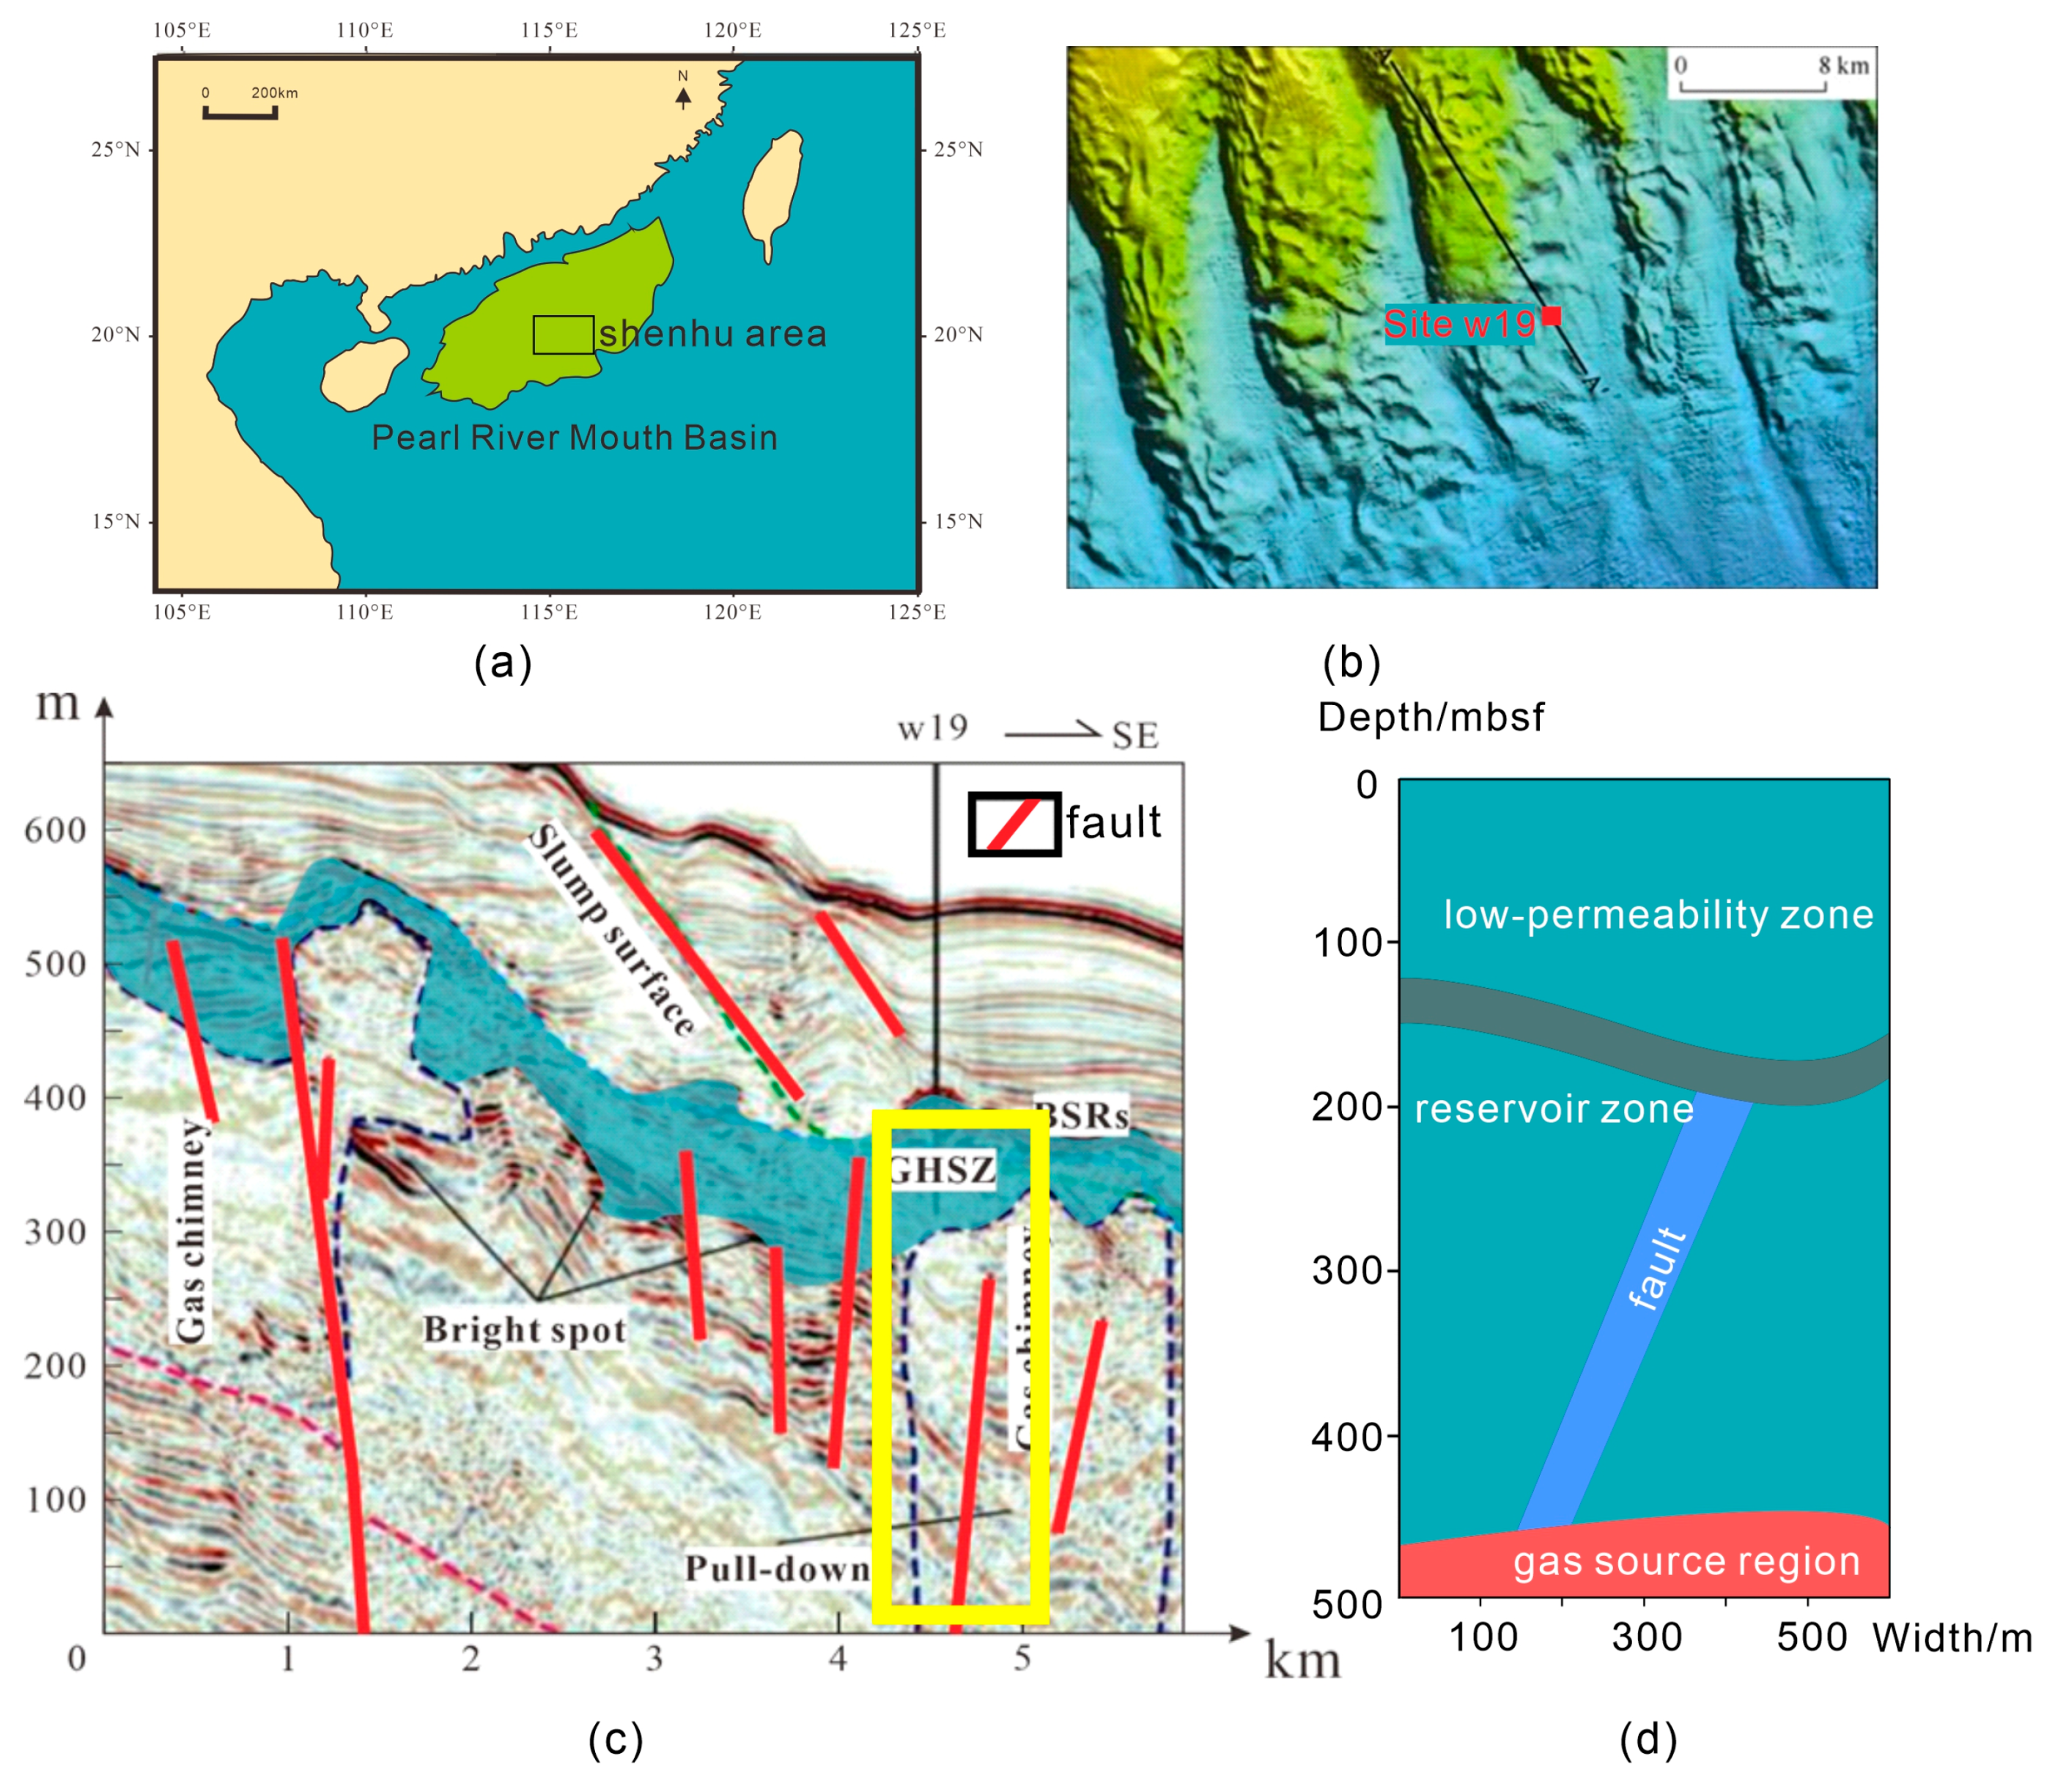
The research area, the Shenhu area, is located within the Baiyun Sag of the Pearl River Mouth Basin (Figure 1a). The seafloor topography is highly undulating, featuring various landforms such as trenches, sea hills, and erosion troughs [25], with water depths ranging between 1000 and 1700 m. The sedimentary layers primarily formed during the Cenozoic, with thicknesses reaching 1000 to 7000 m, high sedimentation rates, and organic carbon content ranging from 0.46% to 1.9%. Since the Miocene, the region has entered a stage of tectonic subsidence, resulting in regional sedimentary layers of predominantly marine origin, providing favorable reservoir conditions for hydrate accumulation. Additionally, the seafloor temperature in the Shenhu area ranges from 276.45 to 278.85 K, the geothermal gradient is between 44 and 67 K/km, and the seafloor pressure exceeds 10 MPa, meeting the temperature and pressure conditions required for hydrate accumulation [26].
The Shenhu Sea area in the South China Sea has undergone long-term tectonic movements and sedimentary processes. Since the Paleozoic era, this region has served as a transitional zone between two continental plates, significantly influenced by crustal movements and magmatic activities [27]. The Shenhu area is characterized by numerous faults, with Cenozoic faults becoming increasingly developed from the bottom to the top. The basal Paleogene faults are primarily developed along the current observable boundaries between uplifts and depressions, segmenting the Paleogene strata [28]. A peak in fault activity occurred between 1.5 Ma and 2 Ma, giving rise to numerous NWW and near-EW trending faults. Neotectonic movements resulted in the formation of numerous late-stage structural traps and triggered the plastic flow of deeper marine overpressure mud rock, creating a large-scale mud diapir activity zone [29]. These geological structures, such as faults and mud diapirs, provide excellent fluid migration conditions for the accumulation of hydrates.
In the Shenhu area, the gas source for hydrate formation is a mixed genetic gas source, consisting of both deep thermal origin gas and in situ biogenic gas that, together, supply natural gas for hydrate formation. The Baiyun Sag is a hydrocarbon-rich sag with high-maturity source rocks in the deep strata that produce abundant thermal origin gas. Additionally, the relatively low-maturity shallow sediment layers serve as biogenic gas source rocks. Together, these sources provide ample gas for natural gas hydrate formation in the study area [30]. Furthermore, the gas source contains various gas components, with CH4 exceeding 92% of the total, greatly surpassing the other components [9].
Figure 1. Schematic diagram of the research area location and geologic model. (a) Geographic location of the Shenhu area. (b) Location of the W19 well logging [31]. (c) Seismic profile of the W19 point (the yellow frame indicates the actual simulation area) [8]. (d) Geological model of hydrate accumulation.
Water 16 02822 g001

3.2. Initial Geological Parameters

This study used the numerical simulator described above to establish a model. The modeling was based on the seismic profiles from the GMGS3 drilling area in the Shenhu region, including the W19 site (Figure 1b,c). A 600 m-long and 500 m-high region was selected to construct a two-dimensional geological model with a thickness of 1 m.
The model was divided into four sections from top to bottom: the cap rock zone, hydrate reservoir zone, fluid migration zone, and gas source zone (Figure 1d). The cap rock zone provides a trapping environment for hydrate accumulation. The fluid migration zone transports gas of deep thermal origin to the HFZ, with geological structures such as faults, folds, diapiric structure, and gas chimneys serving as migration pathways. Given the active tectonic movements and prominent fault development in the Shenhu area, the fluid migration pathways in the model are represented by faults. The gas source zone simulates gas reservoirs of deep thermal origin. Although the gas source in the Shenhu area is a mixed genetic source, previous research indicates that in situ biogenic CH4 contributes minimally to hydrate saturation [12]. Therefore, only CH4 from deep thermal origin gas is considered as the gas source. The model calculates pore pressure using hydrostatic equilibrium, with the pressure at the top of the model set at 10.00 MPa and at the bottom set at 15.00 MPa. The pressure is linearly related to depth. The initial seafloor temperature is set at 278 K, with the temperature at the bottom of the model set to 300.15 K. To account for temperature increases due to subsidence, the temperature is calculated by multiplying the real-time burial depth of the strata by the geothermal gradient. More specific parameter settings in Table 1.

4. Process of Hydrate Accumulation

As the overpressure at the gas source zone is released, CH4 begins to migrate, primarily moving vertically along the fault pathways in the early stages, with limited lateral migration. When the CH4 reaches the cap rock, the low permeability of the cap rock impedes the vertical migration of the gas, increasing the lateral migration (Figure 2(a1–a3)). Upon reaching the HFZ, characterized by low temperature and high pressure (in the model, the bottom of the HFZ is located at around 210 mbsf), the gas reacts with pore water under suitable temperature and pressure conditions, forming low-saturation hydrates at the bottom of the HFZ. When the CH4 reaches the cap rock and starts migrating laterally, the hydrate formation area expands horizontally, increasing both the lateral extent and thickness of the hydrate layer and eventually forming a thick hydrate layer beneath the cap rock (Figure 2(b1–b3)). In this process, the formation of hydrates can be divided into three stages: before the CH4 has migrated to the HFZ, when the CH4 has entered the HFZ but has not yet reached the reservoir zone, and after CH4 has entered the reservoir zone. In the first stage, no hydrate formation occurs because the temperature and pressure conditions do not meet the requirements for hydrate formation. Once the CH4 enters the HFZ, hydrate formation begins immediately. However, since the area where the CH4 and water can react is limited to the fault at this stage, the rate of hydrate formation is relatively slow. When the CH4 reaches the reservoir zone, it reacts with water over a larger area, leading to rapid hydrate formation. Most of the hydrates form during this stage.
The range of the HFZ is directly controlled by the temperature, pressure, and the hydrate phase equilibrium curve. The seafloor surface typically represents the top of the HFZ, while the intersection of the sediment geothermal gradient curve and the hydrate phase equilibrium curve indicates the bottom of the HFZ. Factors such as salinity and gas composition indirectly affect the hydrate formation by influencing the range of the HFZ. For instance, salinity can inhibit hydrate formation, reducing the thickness of the HFZ, while increases in heavy hydrocarbons and carbon dioxide in the gas can increase the thickness of the HFZ, thereby promoting hydrate formation. Within the HFZ range, conditions are suitable for hydrate formation, so hydrates are not confined solely to the reservoir zone. Additionally, the thickness of the hydrate layer is affected by its distance from the intersections of faults and reservoirs. The farther the hydrate layer extends outward, the thinner it becomes. This phenomenon becomes very apparent after 10 years of simulation. The hydrate layer thickness above the central gas source can reach 25 m, while at the model’s edge, the thickness of the hydrate layer is only half of this. However, when the CH4 migrates to the boundary of the reservoir zone and lateral migration is no longer possible, the CH4 is forced into lateral migration in the opposite direction, replenishing the hydrate layer thickness. Therefore, over a larger time scale, the thickness of the hydrate layer becomes approximately the same, primarily depending on the thickness of the reservoir.
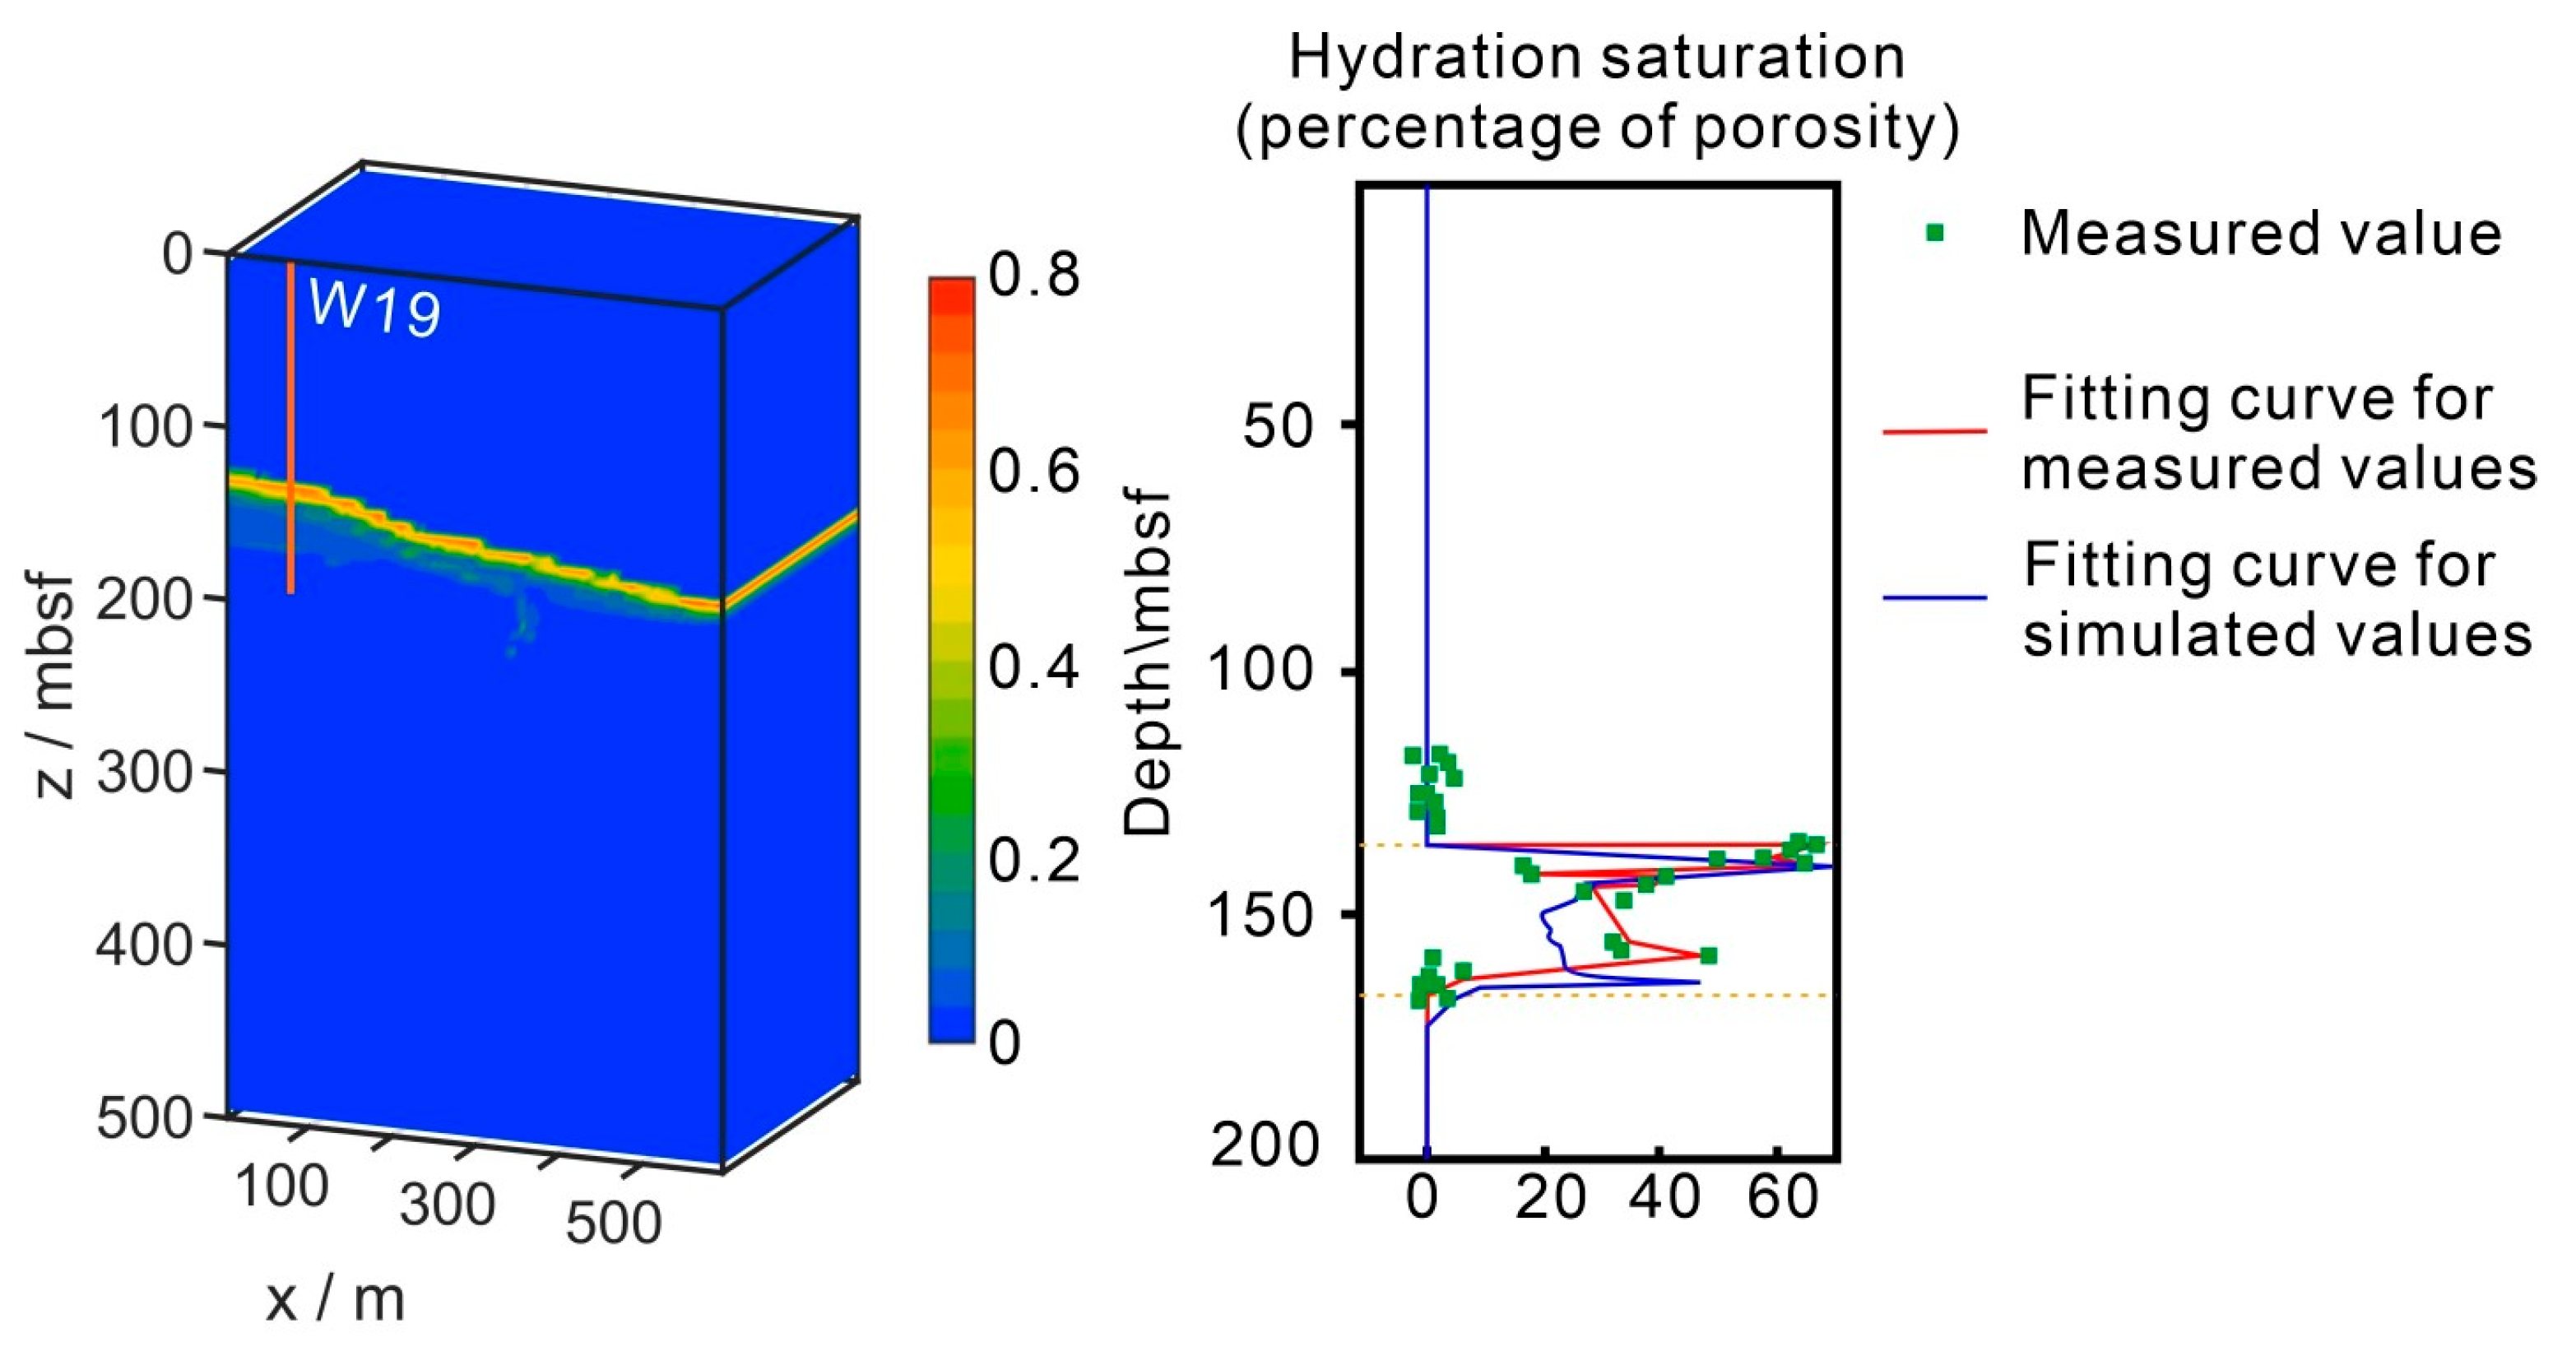
According to seismic and well logging data, there is no high-permeability fault below the W19 site, and the hydrates there were formed by the reaction between laterally migrating natural gas and water. The high-saturation hydrate layer is 17.59 m thick, with an average hydrate saturation of 46.2%. An increase in the hydrate saturation can be observed at both the top and bottom of the hydrate layer, with a maximum saturation of about 68% [9]. The simulation results show that the simulator used in this study can adequately reproduce the hydrate saturation trends observed in the reservoir. The peak hydrate saturation generated in the model is roughly equivalent to the measured values, and the average hydrate saturation in the model is about 30%, slightly lower than the measured value (Figure 3) and further validating the reliability of the simulation.
CH4 migration and hydrate formation primarily alter the environmental temperature and pressure conditions. Initially, significant pressure anomalies can be observed at the bottom gas source (Figure 2(c1–c3)). This overpressure is also the main driving force for the upward migration of deep gas sources. Subsequently, the vertical migration of CH4 increases pressure along the migration pathway, and the pressure increase along the pathway becomes more pronounced over time due to the continuous gas migration. When the CH4 reaches the cap layer, the cap layer restricts the vertical movement of gas, causing the CH4 to accumulate beneath the cap layer, where a notable pressure anomaly can be observed. However, as the CH4 combines with water to form denser hydrates, the volume of fluids in the pores decreases. The high pressure gradually dissipates, and the pressure distribution in the reservoir becomes more uniform. Additionally, the temperature of the sediments is influenced by the heat carried by migrating CH4, resulting in a noticeable temperature increase along the gas migration path. The formation of hydrates, which release heat, further raises the surrounding temperature, so the temperature distribution shows a shape similar to the distribution of hydrate formation (Figure 2(d1–d3)).

5. Sensitivity Analysis

At the beginning of the accumulation process, CH4 mainly migrates vertically through faults generated by geological activity. Once the CH4 reaches the gas hydrate stability zone under low-temperature and high-pressure conditions, it combines with pore water to form hydrates under suitable temperature and pressure conditions [37]. This highlights the crucial role that fluid migration conditions play in the hydrate accumulation process. Therefore, in this section, we conduct a sensitivity analysis on fault permeability and width to explore the potential impact that the properties of faults may have on hydrate accumulation.

5.1. Fault Permeability

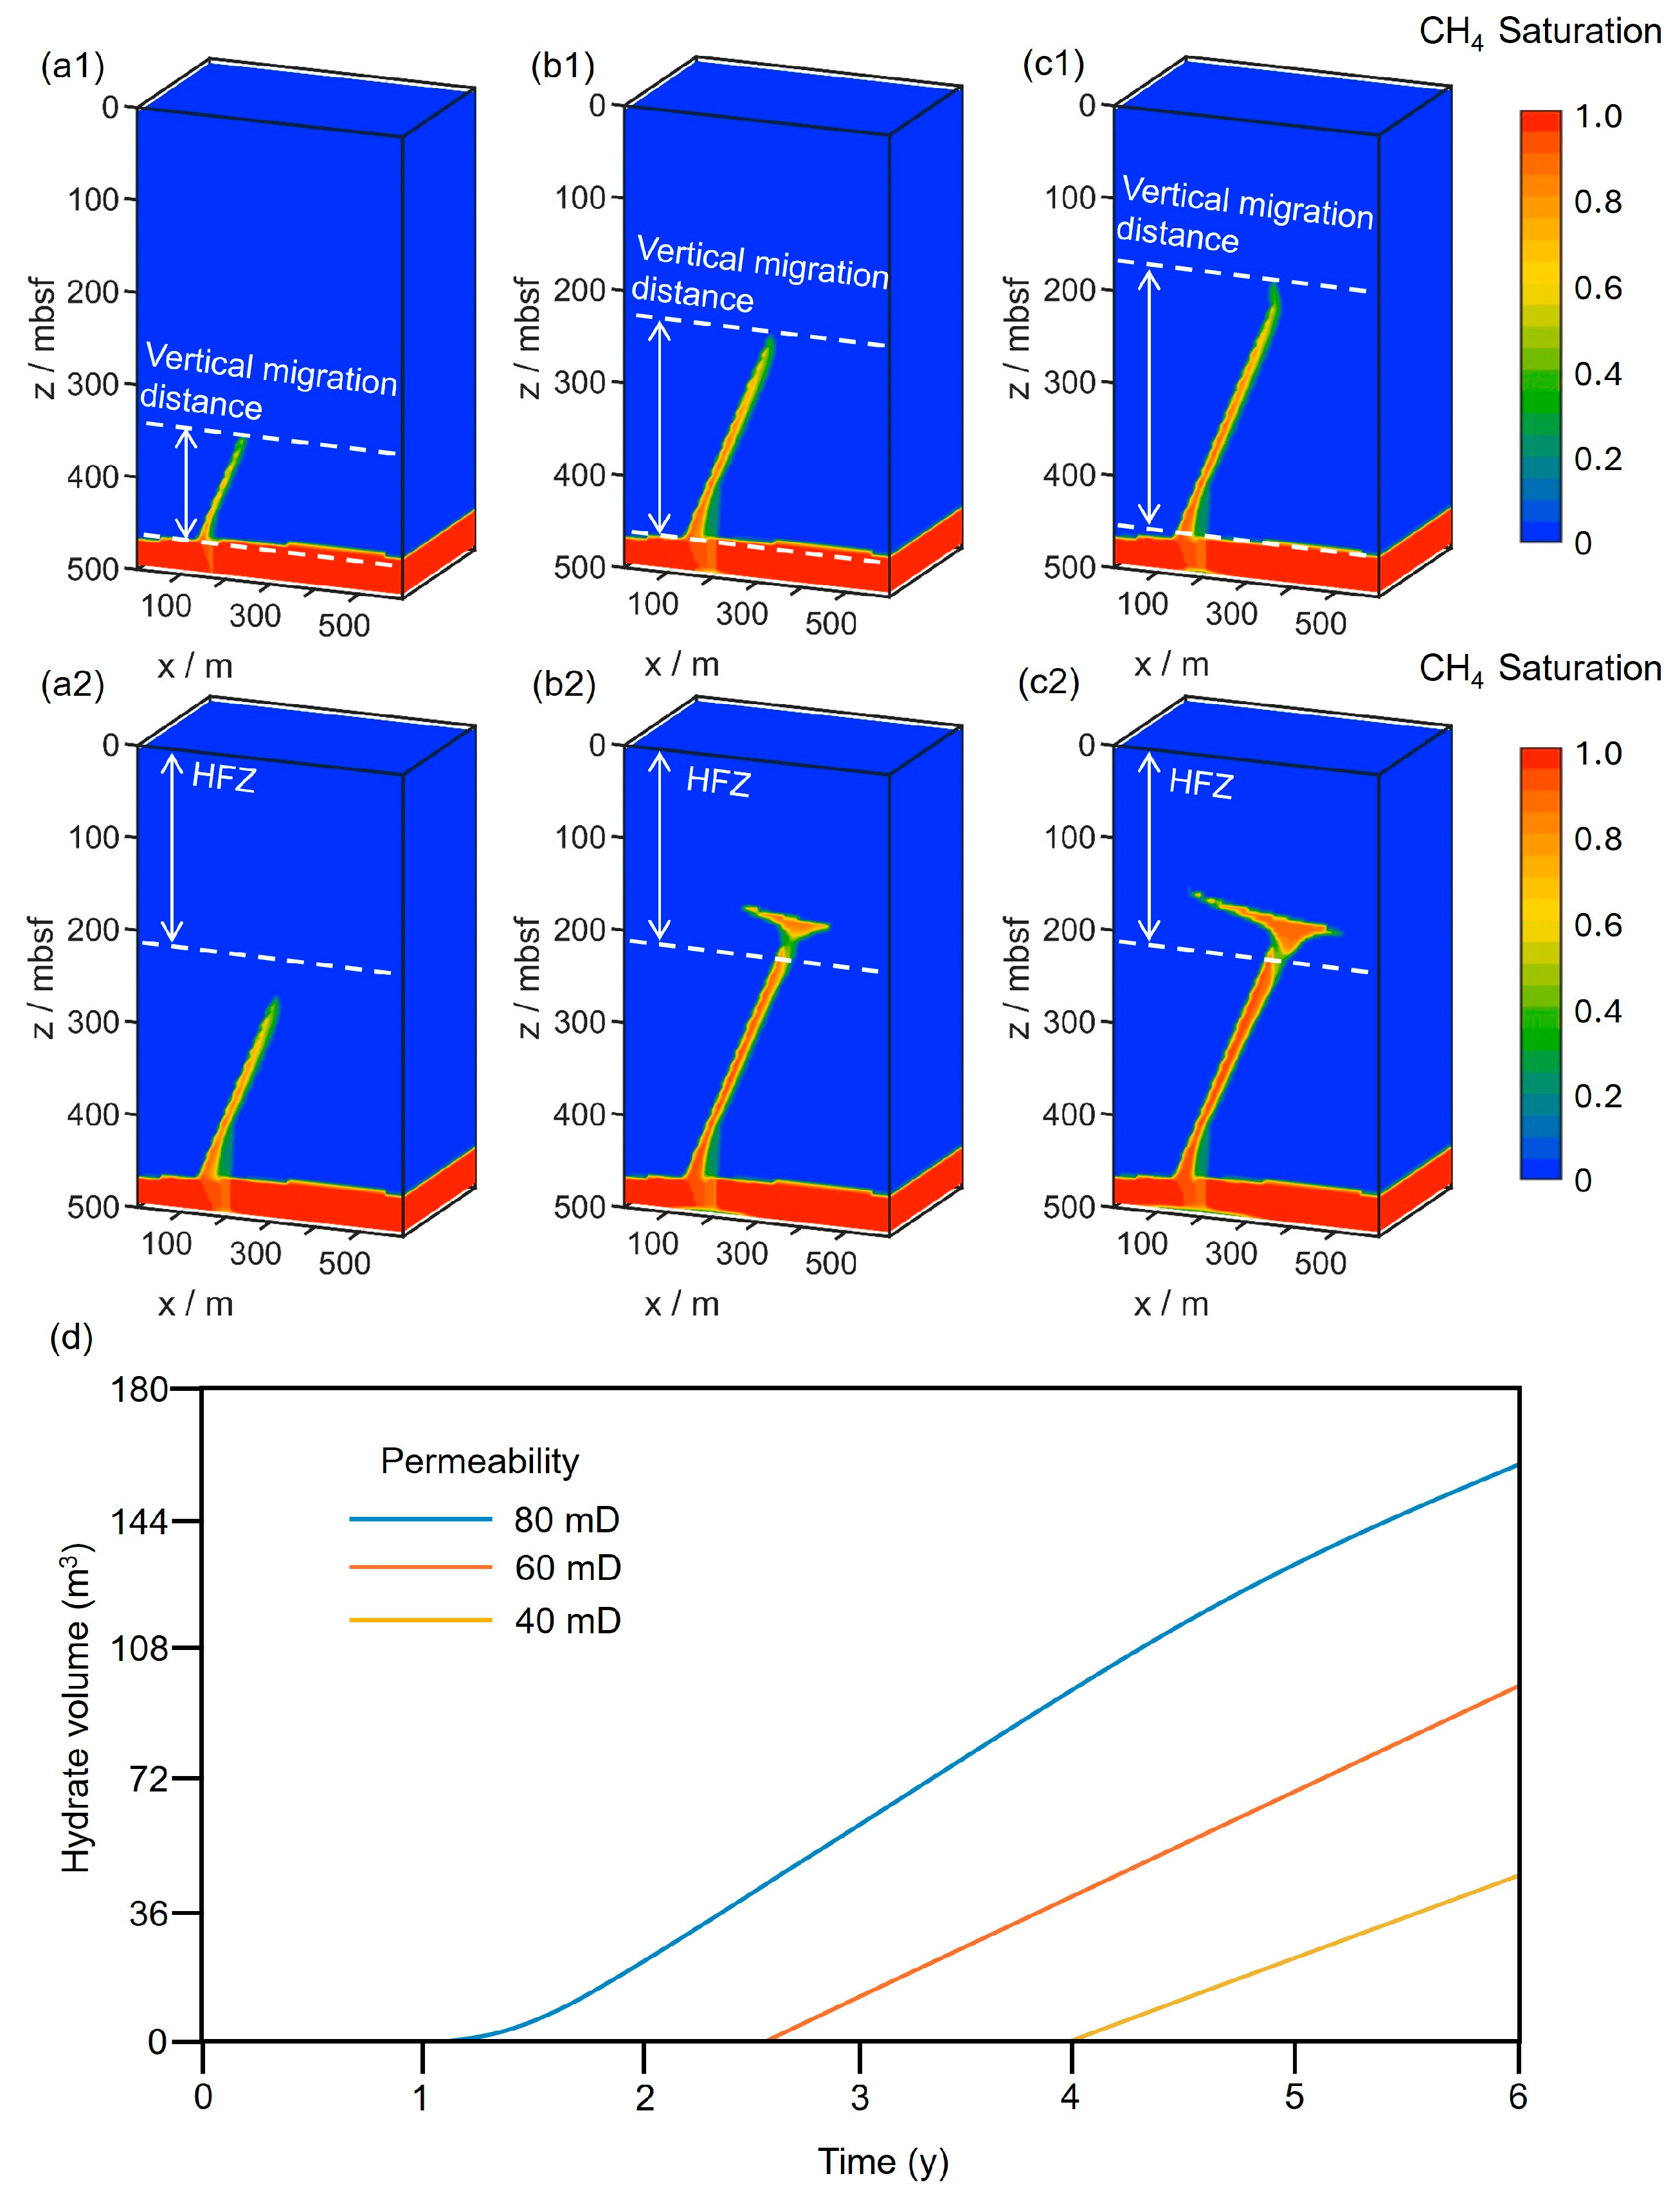
The fluid migration system composed of faults and other structures essentially acts as a high-permeability migration channel, where the internal permeability significantly impacts fluid migration. Therefore, in this section, all other model parameters were kept consistent with the base model, while the internal permeability of the fault was set to 80 mD, 60 mD, and 40 mD for the simulation. It can be clearly observed that as the permeability increased, the vertical migration speed of the CH4 accelerated (Figure 4(a1–c2)). When the permeability was 80 mD, the maximum vertical migration distance of the CH4 reached 300 m within 3 years; however, when the permeability was 40 mD, the maximum vertical migration distance of the CH4 was only 100 m within the same period. For every 20 mD increase in permeability, the vertical migration speed of the fluid increased by 100%. Once the CH4 migrates into the HFZ and reaches the appropriate temperature and pressure conditions for hydrate formation, it can react with water to form hydrates. Due to the decrease in the vertical migration speed of the CH4, the time it took to reach the HFZ was delayed. Therefore, when the permeability decreased, the time for hydrate formation was also correspondingly delayed. According to the simulation results (Figure 4d), when the permeability was 80 mD, hydrates began to form around 1 year after the simulation starts; when the permeability was 40 mD, hydrate formation started around 4 years into the simulation. This demonstrates that permeability can affect the timing of hydrate formation by influencing the fluid migration speed. Additionally, permeability has a certain impact on the final hydrate saturation. In reservoirs with lower permeability, CH4 migrates more slowly, allowing more time for it to fully react with water. Therefore, within the same time, if there is a continuous gas supply, hydrate layers with higher saturation can form in lower-permeability sediments.

5.2. Fault Width

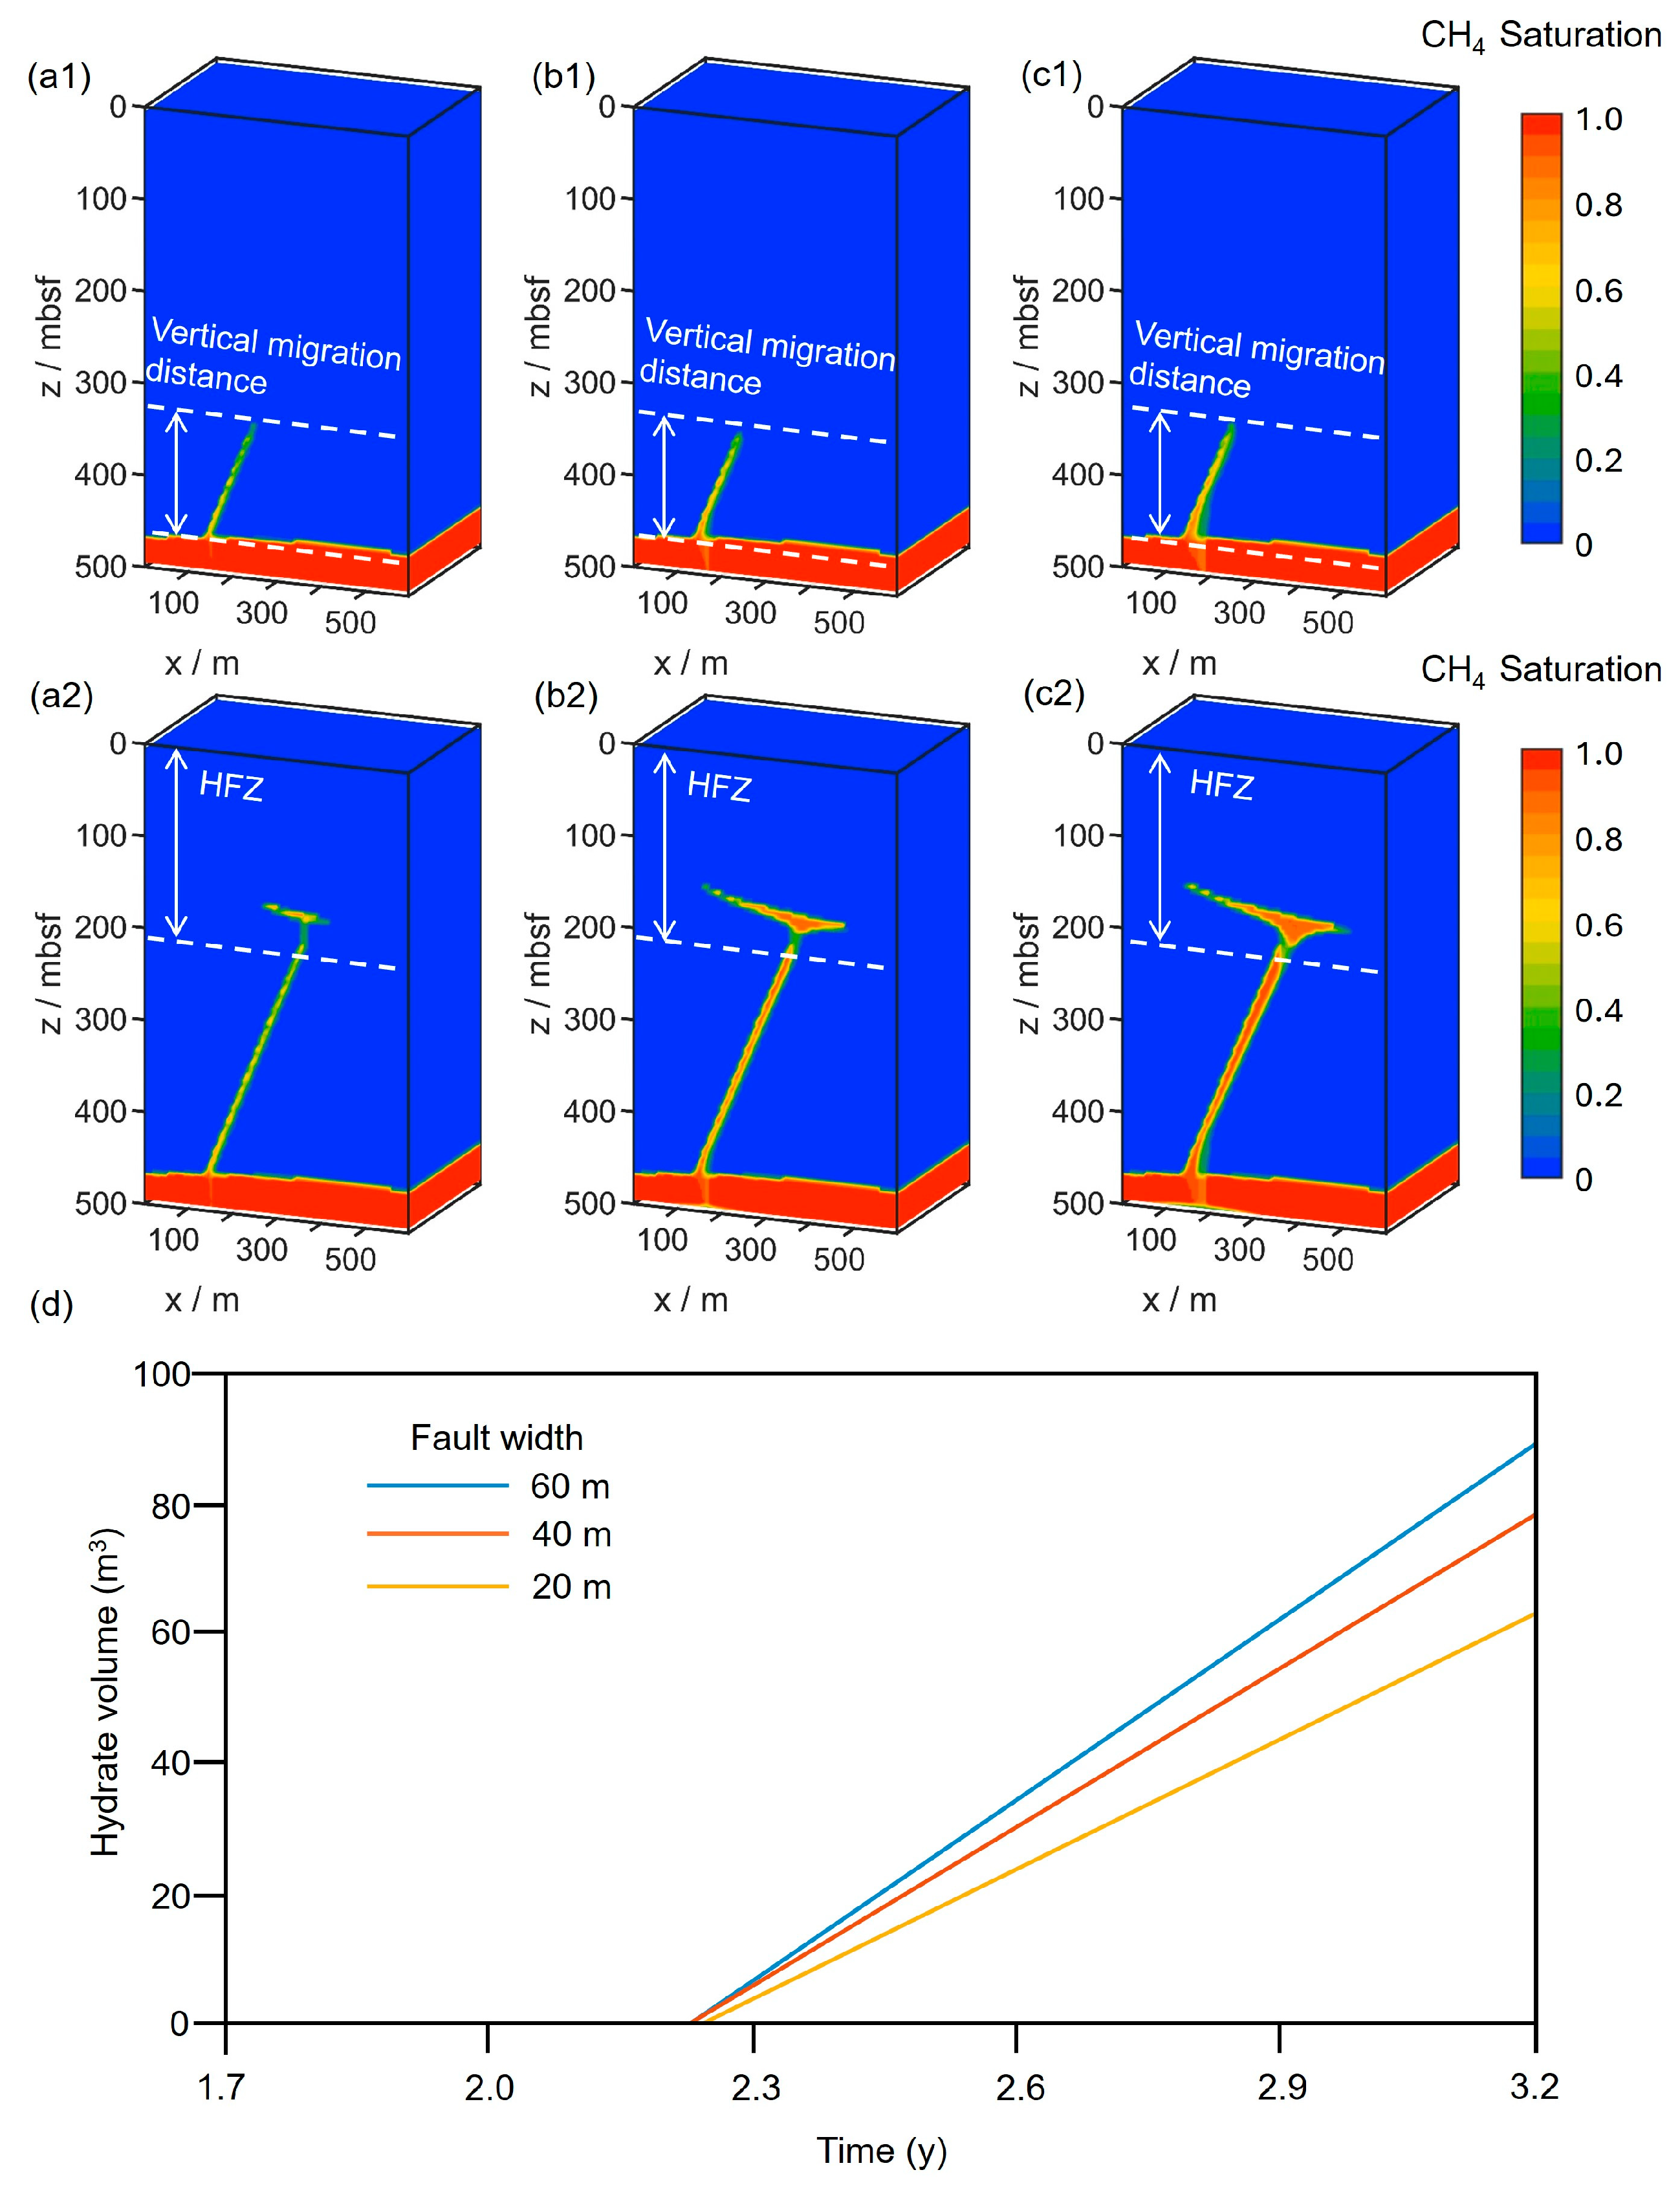
In the Shenhu Sea area of the South China Sea, the fluid migration pathways within the hydrate accumulation system primarily consist of faults and gas chimneys. The morphology of gas chimneys is relatively simple—typically, vertical columnar channels—and they are usually classified based on the shape and thickness of their tops. However, faults, due to their complex formation processes, exhibit various morphologies influenced by factors such as the dip angle, width, and secondary faults. Different fault morphologies have a significant impact on the final accumulation state, with fault width being particularly crucial. Therefore, in this section, all other parameters of the model are kept consistent with the base case, while the fault width is varied at 20 m, 40 m, and 60 m to investigate its effect on the hydrate accumulation system (Figure 5).
According to the simulation results, all three models started generating hydrates at almost the same time, after around 2.2 years. This indicates that the time it takes for CH4 to vertically migrate into the HFZ is consistent across different fault widths. It is evident that altering the fault width did not affect the CH4 migration speed in the same way as changing the fault permeability did. However, the simulation results also show that increasing the fault width allowed for the formation of more hydrates within the same period. Specifically, increasing the fault width by 20 m led to an approximately 20% increase in hydrate formation. This demonstrates that the fault width can control the CH4 migration flux; larger faults can allow more CH4 to enter the reservoir zone, thereby influencing hydrate formation.

6. Discussions

Based on the exploration of the base case, for marine sediment with relatively stable factors, such as temperature, pressure, and gas source, actual geological conditions may significantly impact hydrate accumulation, leading to considerable differences in the final hydrate accumulation state across different regions. Since hydrate accumulation requires the cooperation of various elements within the entire system. it is possible that achieving the effect of forming a thick layer of high-saturation hydrates in a short time not only requires favorable fluid migration conditions but also needs to be complemented by good fluid aggregation conditions. The quality of fluid aggregation conditions in a hydrate accumulation system primarily depends on whether a trapping environment provided by a low-permeability cap rock exist, which can prevent vertical fluid migration and allow fluid to aggregate.
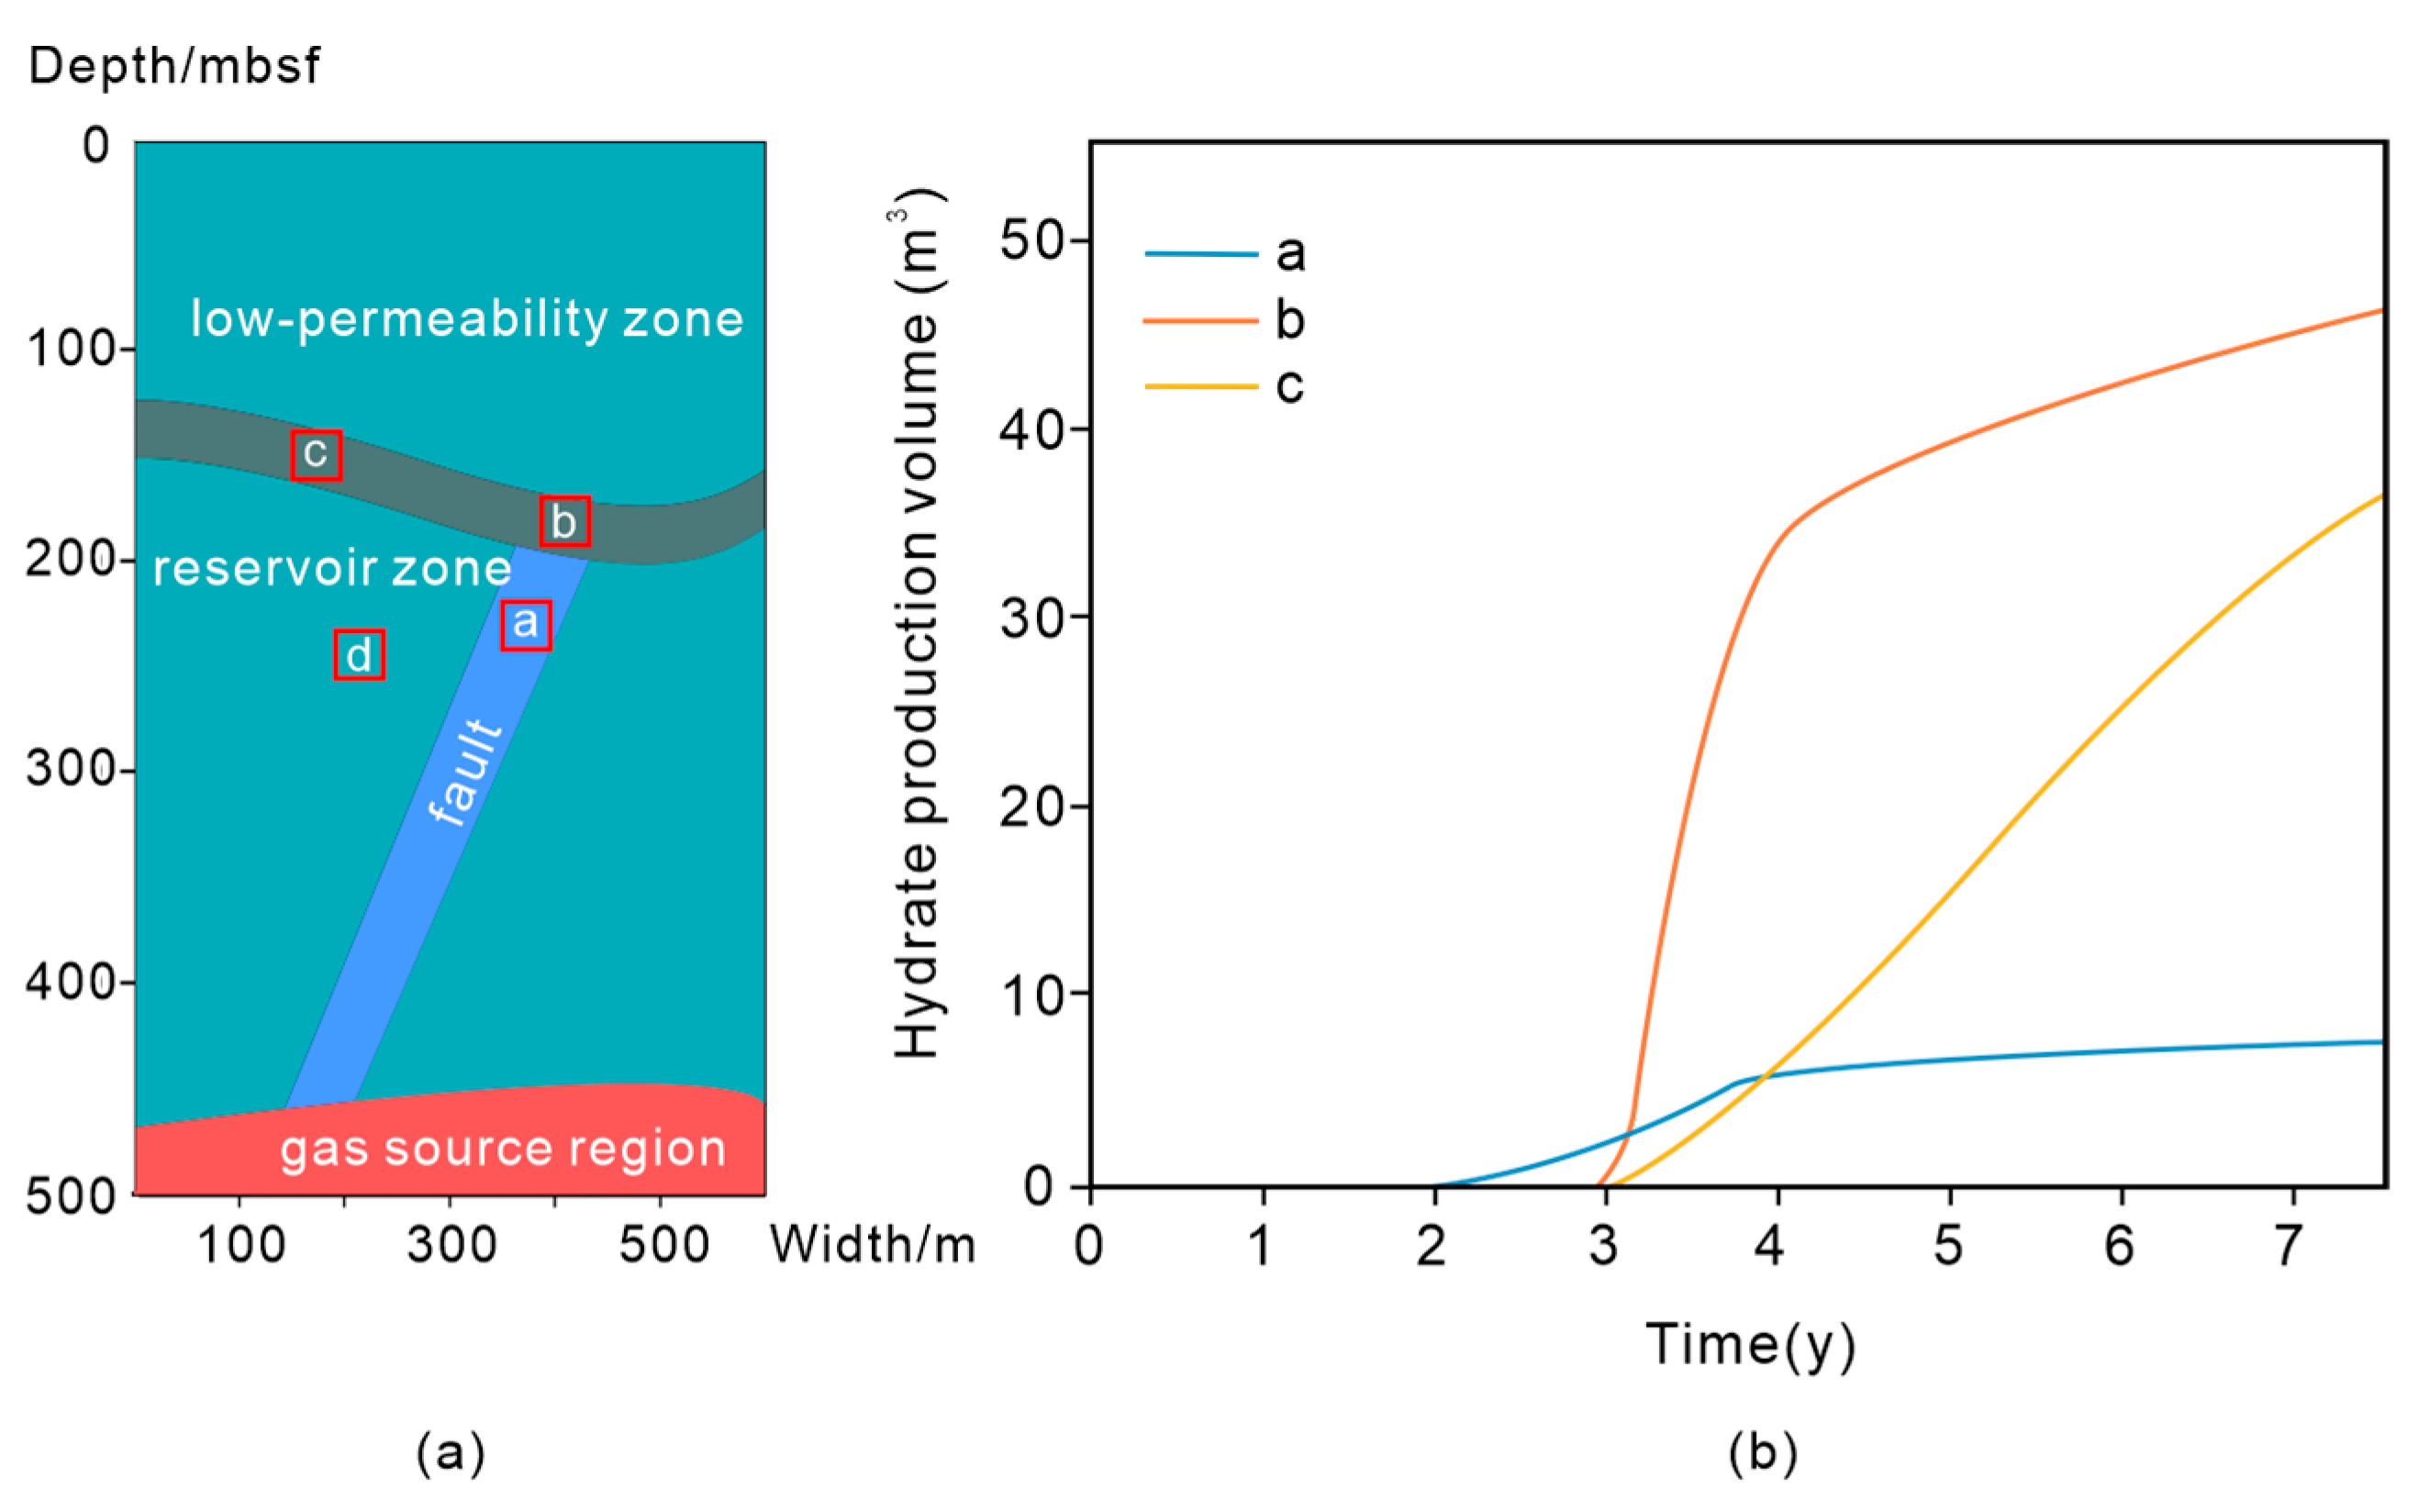
To explore the combined impact of fluid migration and aggregation conditions on hydrate accumulation, the authors analyzed the amount of hydrate formation at various locations within the same model, each with different fluid migration and aggregation conditions. Specifically, four regions of 80 × 40 m were defined in the model (Figure 6a): Region A is located directly above the fault but lacks an overlying cap rock to provide a trapping environment. It has excellent fluid migration conditions but poor aggregation conditions. Region B is also located above the fault and has an overlying cap rock that provides a trapping environment, combining both excellent fluid migration and aggregation conditions. Region C is underlain by no fault but has a cap rock above, offering a trapping environment. Thus, it has average migration conditions and good aggregation conditions. Region D has neither an underlying fault for fluid migration nor an overlying cap rock for trapping, meaning that both the fluid migration and aggregation conditions are poor. The changes in hydrate formation over time in these four regions were quantitatively analyzed.
Hydrates began to form first in Region A, with the formation starting after around two years. However, due to the lack of a trapping environment, the CH4 could not continuously react with water. As a result, even though hydrate formation started earlier, the total amount of hydrates produced remained low. Region B was the most favorable location for hydrate formation. Although hydrate formation started later than in Region A, at around three years into the simulation, the formation rate was much faster, reaching a high hydrate yield in a relatively short time. In Region C, due to the absence of a fluid migration channel beneath, hydrate formation only began after Region B was filled with CH4, allowing the gas to gradually migrate laterally. Consequently, hydrate formation in Region C started slightly later than in Region B. However, as long as the formation time is long enough and the gas supply remains sufficient, it is still possible for high-saturation hydrate to form at a later stage. No hydrate formation occurred in Region D. In summary, hydrate formation began the earliest in Region A, followed by Region B, and then Region C, which started slightly later than Region B. By the end of the simulation, Region B had the highest hydrate yield, with Region C’s yield exceeding that of Region A (Figure 6b). In summary, if the time scale is sufficiently long and there is a continuous CH4 supply, even in the case of poor fluid migration conditions, a substantial number of high-saturation hydrates can still form if a trapping environment is present, though the hydrate formation will begin later. This demonstrates that favorable migration conditions allow hydrates to form earlier, while good aggregation conditions facilitate the formation of a high-saturation hydrate layer.

7. Conclusions

This study used a newly developed THC simulator to establish a model based on the actual geological structure of the Shenhu area, providing a quantitative analysis of hydrate accumulation under different fluid migration conditions. Additionally, a sensitivity analysis was conducted on the key factors affecting fault morphology. Based on the results, the following conclusions can be drawn:
  • The most favorable region for hydrate accumulation within the reservoir requires both excellent fluid migration and aggregation conditions to form thick, high-saturation hydrate layers in a relatively short period. If the timescale is sufficiently long and there is a continuous supply of gas, high-saturation hydrate layers can still form under poor fluid migration conditions, provided there is a trapping environment. However, the formation of hydrates will begin later in this case.
  • The essence of fluid migration systems, such as faults, lies in their function as high-permeability migration channels. Permeability influences hydrate accumulation by affecting fluid flow velocity. Higher permeability facilitates the vertical migration of fluids, allowing them to enter the HFZ more quickly, and leading to faster hydrate formation. However, lowering the permeability reduces the fluid flow velocity, thereby extending the reaction time between the CH4 and water, which increases the hydrate saturation within the reservoir.
  • The morphology of faults has a significant impact on the final state of hydrate accumulation. As the fault width increases, while the vertical flow velocity of the fluid remains unchanged, the vertical CH4 migration flux can increase, leading to the formation of a larger amount of hydrate.

Author Contributions

Conceptualization, Z.Z. and S.L.; methodology, Z.Z.; software, Z.Z.; validation, Z.X., S.L. and X.L.; data curation, Z.X.; writing—original draft preparation, Z.X., Z.Z., Y.L. and T.X. writing—review and editing, Z.X. and Z.Z.; visualization, Z.X.; supervision, X.L. All authors have read and agreed to the published version of the manuscript.

Funding

This research was funded by the Joint Geological Funds of the National Natural Science Foundation of China (U2244223), the Guangdong Major Project of Basic and Applied Basic Research (2020B0301030003), the China Geological Survey Project (DD20211350), the Key Deployment Program of Chinese Academy of Sciences (YJKYYQ20190043, ZDBS-LY-DQC003, KFZD-SW-422, ZDRW-ZS-2021-3-1), the Scientific Research and Technology Development Project of China National Petroleum Corporation (2022DJ5503), and the CAS Key Technology Talent Program.

Data Availability Statement

The data presented in this study are available in the result sections in this article.

Conflicts of Interest

The authors declare no conflicts of interest.

References

  1. Collett, T.S. Natural gas hydrates of the Prudhoe Bay and Kuparuk River area, north slope, Alaska. AAPG Bull. 1993, 77, 793–812. [Google Scholar]
  2. Changyu, S.; Wen, L.; Xin, Y.; Feng, L.; Qing, Y.; Liang, M.; Jun, C.; Bei, L.; Guang, C. Progress in research of gas hydrate. Chin. J. Chem. Eng. 2011, 19, 151–162. [Google Scholar]
  3. Boswell, R.; Collett, T.S. Current perspectives on gas hydrate resources. Energy Environ. Sci. 2011, 4, 1206–1215. [Google Scholar] [CrossRef]
  4. Guang, Z.; Yo, Z.; Jin, L.; Shi, W.; Mu, Y.; Zhi, S. Tectonic controls on gas hydrate deposits and their characteristics. Geoscience 2006, 20, 605. [Google Scholar]
  5. Jin, C.; Wang, J.; Zhang, G. Factors affecting natural gas hydrate stability zone in the South China Sea. Miner. Depos.-BeiJing 2005, 24, 388. [Google Scholar]
  6. Neng, W.; Li, H.; Gao, H.; Yan, L.; Qiang, C.; Chang, L. Geological controlling factors and scientific challenges for offshore gas hydrate exploitation. Mar. Geol. Quat. Geol. 2017, 37, 1–11. [Google Scholar]
  7. Li, J.-f.; Ye, J.-l.; Qin, X.-w.; Qiu, H.-j.; Wu, N.-y.; Lu, H.-l.; Xie, W.-w.; Lu, J.-a.; Peng, F.; Xu, Z.-q. The first offshore natural gas hydrate production test in South China Sea. China Geol. 2018, 1, 5–16. [Google Scholar] [CrossRef]
  8. Zhang, W.; Liang, J.; Wei, J.; Su, P.; Lin, L.; Huang, W.; Guo, Y.; Deng, W.; Yang, X.; Wan, Z. Geological and geophysical features of and controls on occurrence and accumulation of gas hydrates in the first offshore gas-hydrate production test region in the Shenhu area, Northern South China Sea. Mar. Pet. Geol. 2020, 114, 104191. [Google Scholar] [CrossRef]
  9. Zhang, W.; Liang, J.; Lu, J.; Wei, J.; Sun, P.; Fang, Y.; Guo, Y.; Yang, S.; Zhang, G. Accumulation features and mechanisms of high saturation natural gas hydrate in Shenhu Area, northern South China Sea. Pet. Explor. Dev. 2017, 44, 708–719. [Google Scholar] [CrossRef]
  10. Su, P.; Liang, J.; Zhang, W.; Liu, F.; Wang, F.; Li, T. Natural gas hydrate accumulation system in the Shenhu sea area of the northern South China Sea. Nat. Gas Ind. 2020, 40, 77–89. [Google Scholar]
  11. Wu, N.; Yang, S.-X.; Wang, H.-B.; Liang, J.-Q.; Gong, Y.-H.; Lu, Z.-Q.; Wu, D.; Guan, H. Gas-bearing fluid influx sub-system for gas hydrate geological system in Shenhu Area, Northern South China Sea. Chin. J. Geophys. 2009, 52, 1641–1650. [Google Scholar]
  12. Zhu, H.; Xu, T.; Zhu, Z.; Yuan, Y.; Tian, H. Numerical modeling of methane hydrate accumulation with mixed sources in marine sediments: Case study of Shenhu Area, South China Sea. Mar. Geol. 2020, 423, 106142. [Google Scholar] [CrossRef]
  13. HE, L.J.; LEI, X.L.; Zhang, Y. Numerical modeling of gas hydrate accumulation in the marine sediments of Shenhu Area, Northern South China Sea. Chin. J. Geophys. 2011, 54, 299–306. [Google Scholar]
  14. Lei, Y.; Song, Y.; Zhang, L.; Miao, L.; Cheng, M.; Liu, N. Research progress and development direction of reservoir-forming system of marine gas hydrates. Acta Pet. Sin. 2021, 42, 801. [Google Scholar]
  15. Zhang, Z.; Montilla, M.J.B.; Li, S.; Li, X.; Xing, J.; Hu, Y. Numerical evaluations on the fluid production in the in-situ conversion of continental shale oil reservoirs. Pet. Sci. 2024, 21, 2485–2501. [Google Scholar] [CrossRef]
  16. Tao, X.; Zhao, Z.; Shou, L.; Xiao, L.; Cheng, L. 3D numerical evaluation of gas hydrate production per formance of the depressurization and backfilling with in-situ supplemental heat method. J. Eng. Geol. 2021, 29, 1926–1941. [Google Scholar]
  17. Zhang, Z.; Xie, Z.; Montilla, M.J.B.; Li, Y.; Xu, T.; Li, S.; Li, X. Feasibility and recovery efficiency of in-situ shale oil conversion in fractured reservoirs via steam heating: Based on a coupled thermo-flow-chemical model. J. Anal. Appl. Pyrolysis 2024, 183, 106787. [Google Scholar] [CrossRef]
  18. Zhang, Z.; Xu, T.; Li, S.; He, J.; Li, X.; Li, Y.; Lu, C.; Qin, X. Optimizing fracturing techniques for enhanced hydrate dissociation in low-permeability reservoirs: Insights from numerical simulation. Gas Sci. Eng. 2024, 125, 205309. [Google Scholar] [CrossRef]
  19. Zhang, Z.; Li, Y.; Li, S.; He, J.; Li, X.; Xu, T.; Lu, C.; Qin, X. Optimization of the natural gas hydrate hot water injection production method: Insights from numerical and phase equilibrium analysis. Appl. Energy 2024, 361, 122963. [Google Scholar] [CrossRef]
  20. Li, Y.; Zhang, Z.; Li, S.; Li, X.; Lu, C. Numerical investigation of the depressurization exploitation scheme of offshore natural gas hydrate: Enlightenments for the depressurization amplitude and horizontal well location. Energy Fuels 2023, 37, 10706–10720. [Google Scholar] [CrossRef]
  21. Zhang, Z.; Xu, T.; Li, S.; Li, X.; Montilla, M.J.B.; Lu, C. Comprehensive effects of heat and flow on the methane hydrate dissociation in porous media. Energy 2023, 265, 126425. [Google Scholar] [CrossRef]
  22. Narasimhan, T.; Witherspoon, P. An integrated finite difference method for analyzing fluid flow in porous media. Water Resour. Res. 1976, 12, 57–64. [Google Scholar] [CrossRef]
  23. Kamath, V.A. Study of Heat Transfer Characteristics during Dissociation of Gas Hydrates in Porous Media; University of Pittsburgh: Pittsburgh, PA, USA, 1984. [Google Scholar]
  24. Masuda, Y. Modeling and experimental studies on dissociation of methane gas hydrates in Berea sandstone cores. In Proceedings of the Third International Gas Hydrate Conference, Salt Lake City, UT, USA, 18–22 July 1999. [Google Scholar]
  25. Li, S.J.; Chu, F.Y.; Fang, Y.X.; Wu, Z.Y. Associated interpretation of sub-bottom and single-channel seismic profiles from Shenhu area in the north slope of South China Sea-characteristic of gas hydrate sediment. Adv. Mater. Res. 2011, 217, 1430–1437. [Google Scholar] [CrossRef]
  26. Su, M.; Wang, H.; Sha, Z.; Liang, J.; Wu, N.; Qiao, S.; Cong, X.; Yang, R. Gas hydrates distribution in the Shenhu Area, northern South China Sea: Comparisons between the eight drilling sites with gas-hydrate petroleum system. Geol. Acta 2016, 14, 0079–0100. [Google Scholar]
  27. Zhong, Z.; Shi, H.; Zhu, M.; Pang, X.; He, M.; Zhao, Z.; Liu, S.; Wang, F. A discussion on the tectonic-stratigraphic framework and its origin mechanism in Pearl River Mouth Basin. China Offshore Oil Gas 2014, 26, 20–29. [Google Scholar]
  28. Zhang, W.; Liang, J.; He, J.; Cong, X.; Su, P.; Lin, L.; Liang, J. Differences in natural gas hydrate migration and accumulation between GMGS1 and GMGS3 drilling areas in the Shenhu area, northern South China Sea. Nat. Gas Ind. 2018, 38, 138–149. [Google Scholar]
  29. Shi, W.; Song, Z.; Wang, X.; Kong, M. Diapir structure and its origin in the Baiyun depression. Pearl River Mouth Basin China. J. Earth Sci. 2009, 34, 778–784. [Google Scholar]
  30. He, J.; Yan, W.; Zhu, Y.; Zhang, W.; Gong, F.; Liu, S.; Zhang, J.; Gong, X. Bio-genetic and sub-biogenetic gas resource potential and genetic types of natural gas hydrates in the northern marginal basins of South China Sea. Nat. Gas Ind. 2013, 33, 121–134. [Google Scholar]
  31. Yang, S.; Liang, J.; Lei, Y.; Gong, Y.; Xu, H.; Wang, H.; Lu, J.; Holland, M.; Schultheiss, P.; Wei, J. GMGS4 gas hydrate drilling expedition in the South China Sea. Fire Ice 2017, 17, 7–11. [Google Scholar]
  32. Wang, X.; Hutchinson, D.R.; Wu, S.; Yang, S.; Guo, Y. Elevated gas hydrate saturation within silt and silty clay sediments in the Shenhu area, South China Sea. J. Geophys. Res. Solid Earth 2011, 116, B05102. [Google Scholar] [CrossRef]
  33. Sun, J.; Ning, F.; Zhang, L.; Liu, T.; Peng, L.; Liu, Z.; Li, C.; Jiang, G. Numerical simulation on gas production from hydrate reservoir at the 1st offshore test site in the eastern Nankai Trough. J. Nat. Gas Sci. Eng. 2016, 30, 64–76. [Google Scholar] [CrossRef]
  34. Tian, M.; Song, Y.; Zheng, J.-n.; Gong, G.; Yang, M. Effects of temperature gradient on methane hydrate formation and dissociation processes and sediment heat transfer characteristics. Energy 2022, 261, 125220. [Google Scholar] [CrossRef]
  35. Liu, J.; Zhang, J.; Ma, F.; Wang, M.; Sun, Y. Estimation of seismic velocities and gas hydrate concentrations: A case study from the Shenhu area, northern South China Sea. Mar. Pet. Geol. 2017, 88, 225–234. [Google Scholar] [CrossRef]
  36. Li, X.; Feng, J.; Li, X.; Wang, Y.; Hu, H. Experimental study of methane hydrate formation and decomposition in the porous medium with different thermal conductivities and grain sizes. Appl. Energy 2022, 305, 117852. [Google Scholar] [CrossRef]
  37. Chen, Z.; Jiang, T.; Kuang, Z.; Cheng, C.; Xiong, P.; Chen, Y. Accumulation characteristics of gas hydrate-shallow gas symbiotic system in Qiongdongnan Basin. Earth Sci. 2022, 47, 1619–1634. [Google Scholar]
Figure 2. The distribution of environmental factors and the saturation of different components in the sediment at 1 year, 10 years, and 20 years. (a1–a3) The distribution of CH4 saturation. The arrows indicate the direction of fluid migration. (b1–b3) The distribution of hydrate saturation. The extent of the HFZ is marked by the dashed line. (c1–c3) The distribution of pressure. The dashed line indicates the areas of pressure increase and the position of the cap rock. (d1–d3) The distribution of temperature. The dashed box indicates the area of temperature increase.
Water 16 02822 g002
Figure 3. Final results of the hydrate saturation in the geologic model and comparison between the simulated and measured hydrate saturation values at W19.
Water 16 02822 g003
Figure 4. (a1–c2) The distribution of CH4 in sediment at 1 and 3 years under different fault permeability levels. (a1,a2) Fault permeability of 40 mD. (b1,b2) Fault permeability of 60 mD. (c1,c2) Fault permeability of 80 mD. (d) The evolution of the hydrate formation amount in the reservoir over time under different fault permeability levels.
Water 16 02822 g004
Figure 5. (a1–c2) The distribution of CH4 in the sediment at 1 and 3 years under different fault widths. (a1,a2) Fault width of 20 m. (b1,b2) Fault width of 40 m. (c1,c2) Fault width of 60 m. (d) The evolution of the hydrate formation amount in the reservoir over time under different fault widths.
Water 16 02822 g005
Figure 6. (a) Selection of regions with different fluid migration and aggregation conditions in the model ((a) good fluid migration conditions, poor aggregation conditions; (b) good fluid migration and aggregation conditions combined; (c) poor fluid migration conditions, good aggregation conditions; (d) both fluid migration and aggregation conditions are poor). (b) Evolution of hydrate generation rates in different regions.
Water 16 02822 g006
Table 1. Main basic parameter settings of the model.
ParameterValueParameterValue
Top initial pressure [32]1 × 10⁷ PaTop initial temperature [32]278 K
Hydrate reservoir permeability [18]60 mDCap rock permeability [33]1 mD
Fault permeability [18]60 mDSediment permeability [33]1 mD
Geothermal gradient [34]44.3 K/kmPorosity [35]0.3
Heat conductivity [36]2 W∙(m∙K)−1Irreducible hydrate saturation0.2
Disclaimer/Publisher’s Note: The statements, opinions and data contained in all publications are solely those of the individual author(s) and contributor(s) and not of MDPI and/or the editor(s). MDPI and/or the editor(s) disclaim responsibility for any injury to people or property resulting from any ideas, methods, instructions or products referred to in the content.