Article

Trend Stability Assessment for Hydrological Drought in Euphrates Basin (Türkiye) Using Triple Wilcoxon Test and Innovative Trend Analysis Methods

by
İbrahim Halil Demirel
1,*,
Erdal Kesgin
2,
Yavuz Selim Güçlü
2,
R. İlayda Tan
3 and
Büşra Başaran
4
1
Construction Division, Kozluk Vocational School, Batman University, 72400 Batman, Türkiye
2
Department of Civil Engineering, İstanbul Technical University, 34469 Istanbul, Türkiye
3
Faculty of Engineering, Department of Civil Engineering, Fatih Sultan Mehmet Vakıf University, 34445 İstanbul, Türkiye
4
Yüksel Proje, 06530 Ankara, Türkiye
*
Author to whom correspondence should be addressed.
Water 2024, 16(19), 2823; https://doi.org/10.3390/w16192823
Submission received: 7 September 2024 / Revised: 22 September 2024 / Accepted: 3 October 2024 / Published: 4 October 2024
(This article belongs to the Section Water and Climate Change)

Abstract

:
This study investigates the stability of hydrological drought trends in the Euphrates Basin from 1960 to 2020 using three-dimensional (3D) graphical representations based on innovative trend analysis (ITA) and triple Wilcoxon test (WT) methods. Unlike traditional ITA and WT, which are widely used for trend identification but do not inherently provide trend stability information, this study employs a novel approach to assess and visualize trend stability. The Triple WT method divides the data into three equal segments, examining differences without altering the time series. Drought indices are calculated for 3-month, 6-month, and 12-month time scales using historical streamflow data from five stations. The research identifies trends and their stabilities across three distinct periods: 1967–1984, 1985–2002, and 2003–2020. Results show that as the time scale increases, trend differences between extreme drought conditions diminish. One station consistently exhibits significantly decreasing trends, while three stations show unstable trends with notable variations in the standardized streamflow index (SSFI). The use of 3D-ITA and Triple WT effectively captures the dynamics and stability of drought trends, offering a deeper understanding of hydrological drought in the Euphrates Basin. These findings provide a reference for future studies on drought trend mechanisms in various climatic regions.

1. Introduction

Drought is a recurring natural disaster characterized by prolonged water shortages in a region, significantly impacting the environment, economy, and ecosystems. Differing from other natural disasters, drought typically develops gradually and expands its area without warning [1,2]. Drought warning systems are less prevalent and limited in regions like the Middle East. Hydrological drought is a condition characterized by insufficient water resources resulting in the depletion of surface and underground water reservoirs due to inadequate precipitation [3]. Various components of the water cycle, such as streamflow, precipitation, and soil moisture, display considerable spatial and temporal variability. Infrequently, these hydrological variables may exhibit extreme behaviors leading to severe repercussions on ecosystems and posing risks to human life and property. The observed changes in the climate system have contributed to the intensification of extreme hydrological events [4,5], accentuating the significance of the hydrological cycle’s impact globally and particularly affecting communities residing in river basins [4].
In recent years, global climate change has significantly impacted the hydrological cycle, leading to an increase in the frequency and severity of drought events worldwide. These changes pose a particular threat to water-scarce regions such as the Euphrates Basin, which plays a critical role in the region’s water resource management. Understanding the stability of drought trends in this basin is essential for developing effective water management strategies.
In light of global climate change, it is anticipated that the severity and frequency of extreme events, including rising temperatures, alterations in precipitation patterns, and drought occurrences, will intensify worldwide [6,7,8,9,10,11]. The analysis of hydro-climatological variables evolution holds paramount importance for hydraulic structure design and water resource management. It serves as a valuable tool for decision-makers to forecast hydrological droughts and formulate effective strategies for water resource management. Additionally, expressing concrete concepts such as drought and wetness in a comprehensible manner fosters better understanding across all segments of society. Consequently, examining drought variability and disseminating its findings can establish rapport and enhance awareness about water scarcity, benefiting diverse segments of society. At the basin scale, water resources managers primarily focus on streamflow as the most crucial concern. Climate anomalies demonstrate a comprehensive response resulting from both the physical processes of the land surface and human activities [12,13]. Consequently, hydrological drought, concerning runoff, incorporates not only the indication of water deficiency in other hydrological parameters [14] but also the influences of human activities [15,16]. The primary objective of this study is to assess the stability of hydrological drought trends in the Euphrates Basin using innovative statistical methods. We hypothesize that the hydrological drought trends in the Euphrates Basin have experienced significant temporal changes due to climatic variations, which can be effectively captured using the innovative trend analysis (ITA) and the triple Wilcoxon signed-rank test (Triple WT).
Drought is commonly assessed with drought indices, which are commonly derived from meteorological and hydrological variables, such as precipitation, evapotranspiration, temperature, and streamflow [17,18]. These indices serve to ascertain the duration, spatial extent, frequency, and intensity of drought events [19]. In the literature, various types of drought indices exist, each with distinct advantages and limitations. The selection of a specific index depends on factors such as the prevalent drought type, hydro-climatological conditions of the region, and the quality of available data [20]. Numerous studies have utilized historical records and model simulation data in conjunction with various drought indices to investigate dry and wet patterns at regional or global scales. For hydrological drought assessment, commonly employed indices include the surface water supply index (SWSI) [21], Palmer hydrological drought index (PHDI) [22], standardized flow index (SSI) [23], streamflow drought index (SDI) [24], and standardized streamflow index (SSFI). Among these, the standardized streamflow index (SSFI) is widely recognized as the most utilized method for measuring runoff-based hydrological droughts due to its simplicity and efficiency advantages. It is a member of the standardized drought index family and was developed assuming that direct streamflow remains statistically constant. However, the presence of non-stationary conditions in long-term observations poses a significant challenge to the validity and applicability of traditional indices in the face of a changing environment. This situation is not overlooked and warrants careful consideration in drought assessment methodologies.
In recent times, there has been a growing concern regarding the existence of climate change-related trends in hydro-meteorological data [25]. To identify trends in climate variables at a global level, researchers have devised various methods [26,27,28]. Among these methods, the non-parametric Wilcoxon Signed Rank Test (WT) [29] is one of the most widely used for trend analysis. This test assesses whether the distributions of two variables are the same by analyzing the differences in the data halves. This test is capable of detecting the presence of a monotonous trend in a time series [30]. However, when dealing with intricate phenomena like drought, determining a monotonous trend in a time series can only offer insights at a macro scale. More comprehensive approaches are required to understand and assess the complex dynamics of drought events. In this context, the innovative trend analysis (ITA) method, developed by Şen [31], stands out as a visual–graphical approach for trend detection with mathematical calculations, allowing the capture of categorical trend behavior in a given time series. Unlike classical methods, ITA does not rely on assumptions such as serial independence, sample size, or the probability distribution function hypothesis. Its flexibility in dividing data into distinct clusters enables the detection of various trend types, including monotonous trends. Due to this adaptability, ITA has been utilized in numerous studies and compared with classical approaches [25,32,33,34,35].
The existing literature indicates that comprehensive studies using these methods to detect drought trends are limited. In particular, there has been insufficient research on trend stability. Güçlü [36] develops the three-dimensional innovative trend analysis (3D-ITA) to detect trend stability over the time series. This model also provides more trend information than the ITA approach by demonstrating the stability of decreasing, increasing, and non-trending conditions. Moreover, the WT accounts for differences between two halves of the time series and determines if any trend exists. The Triple WT is proposed to compare and evaluate the trend stability of drought indices with 3D-ITA. This is a novel application of the WT, and comparisons are made by dividing the time series into three segments instead of two halves. This innovation offers a more detailed and comprehensive evaluation of trend analysis and stability.
This study investigates the temporal evolution of hydrological drought magnitude and extreme events in the Euphrates Basin, Türkiye’s most critical water resource, over the period from 1967 to 2020. Previous research on the basin has primarily focused on traditional drought analysis techniques. However, recent advancements in statistical methods, such as 3D-ITA [36] and the Triple WT [29], offer more robust tools for evaluating trend stability. This study hypothesizes that applying these advanced techniques to the Euphrates Basin will uncover previously undetected trends and provide a more accurate assessment of drought trend stability. To test this hypothesis, trend stability is assessed for the first time in the region using the 3D-ITA method and the Triple WT. The analysis encompasses all stations within the basin, with the SSFI computed at short (3 months), medium (6 months), and long (12 months) time scales using streamflow data from four available stations. Drought trends at these time scales are evaluated by comparing the results from ITA, 3D-ITA, classical WT, and Triple WT. Furthermore, this study explores the reasons for the observed discrepancies in the identified trends. The methodology and findings presented are expected to significantly contribute to future research in the region and enhance trend analysis investigations related to different climate variables.

2. Materials and Methods

2.1. Study Area

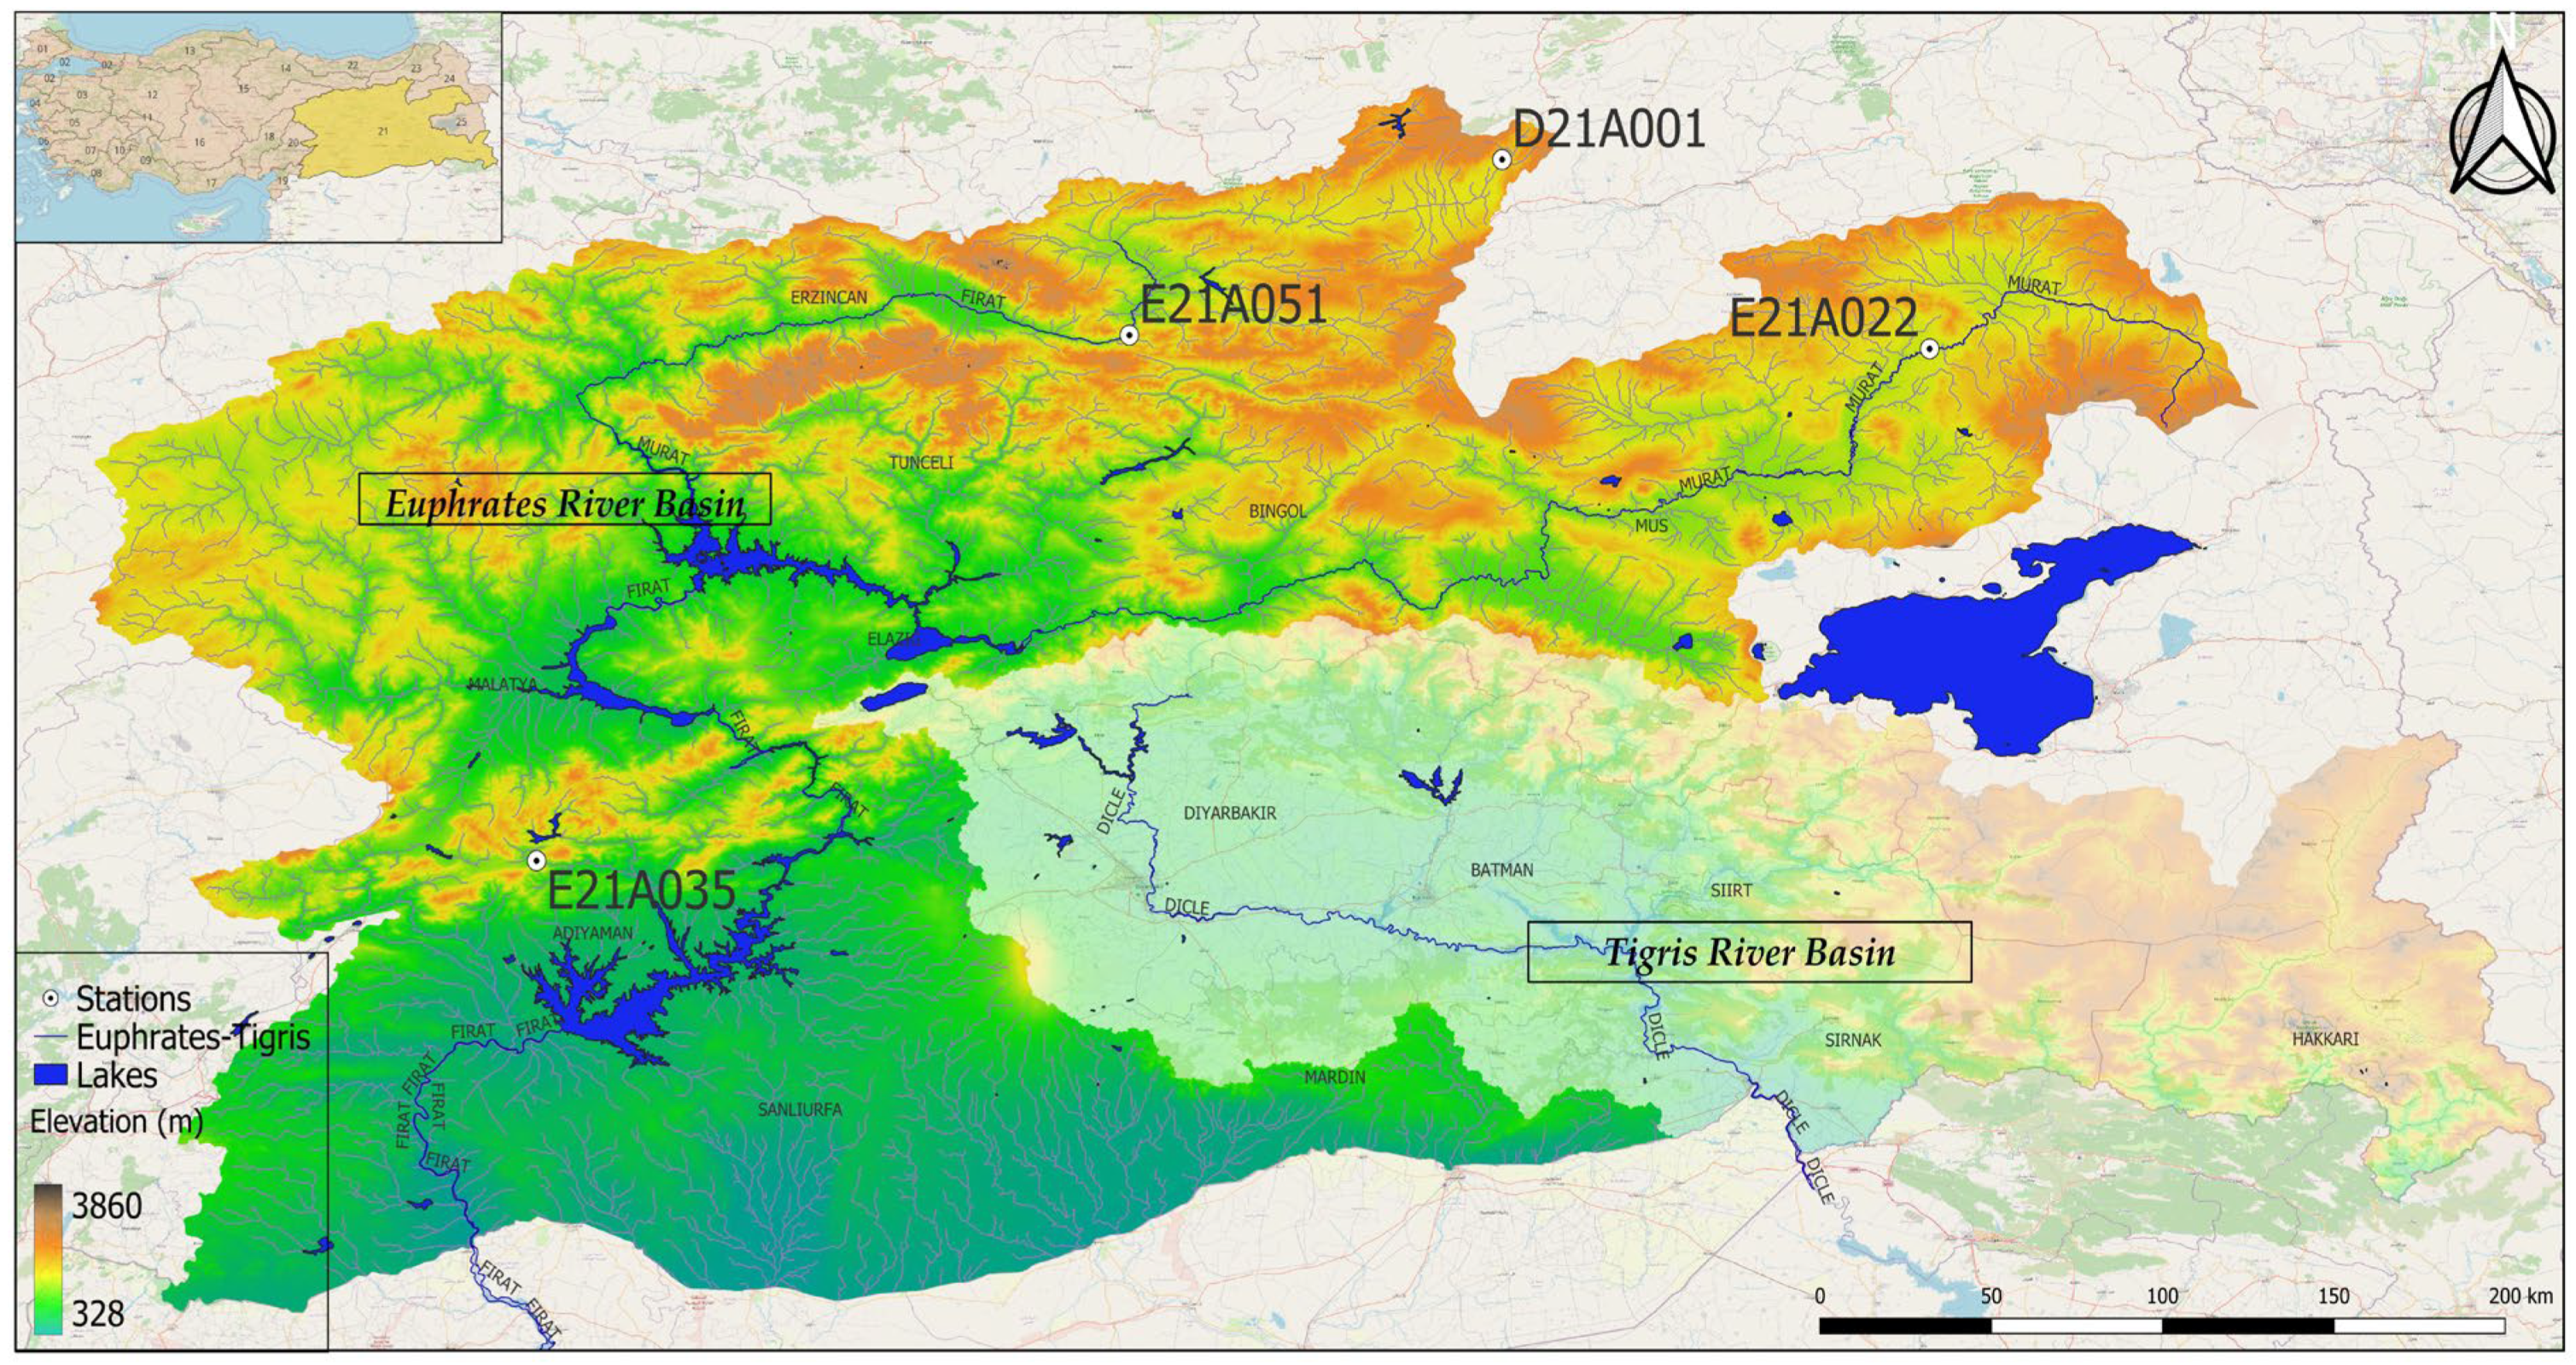
The Euphrates–Tigris Basin represents the largest and most significant water source in the Middle East, covering an area of 879,790 km2 across six different countries [37,38,39]. In the context of Türkiye, the Euphrates-Tigris Basin (Figure 1) is delineated into two distinct basins: the Euphrates Basin and the Tigris Basin. Given the transboundary nature of the Euphrates River, its main channel and tributaries bear substantial influence on the agricultural and industrial sectors of all three countries, namely Syria, Iraq, and Türkiye (Syria and Iraq being downstream countries). Notably, the implementation of the Southeastern Anatolia Project (GAP) by Türkiye, initiated in the 1960s, has engendered noteworthy political tensions with neighboring nations. Specifically, the Turkish segment of the Euphrates Basin is further subdivided into the Upper Euphrates Basin and the Middle Euphrates Basin, while the corresponding Iraqi and Syrian regions are referred to as the Lower Euphrates Basin. The Turkish section of the Euphrates River spans a length of 1263 km, encompasses a drainage area of 52,600 km2, and exhibits a total annual flow rate of 31.13 km3, contributing to 16.80% of Türkiye’s overall water potential.
The upper region of the Euphrates Basin encompasses mountainous terrain that experiences higher precipitation levels when compared to the lower basins, which are characterized by hot and arid climatic conditions. Consequently, the Euphrates River receives a continuous inflow of water from rain and melting snow during spring and especially summer seasons throughout the year. Among the notable contributors to the river’s flow are prominent tributaries, including the Murat River, Karasu River, Tohma River, Peri River, Çaltı River, and Munzur River. Furthermore, several noteworthy dams within Türkiye, such as the Keban Dam, Karakaya Dam, Atatürk Dam, Birecik Dam, and Karkamış Dam, are strategically situated along the main channel of the Euphrates River, reinforcing their significance in the water resource management of the region.
The Euphrates Basin, which spans across southeastern Türkiye, is characterized by a semi-arid climate. The region experiences hot, dry summers and cold, wet winters. The average annual temperature ranges from 10 °C to 18 °C, while the annual precipitation varies between 300 mm and 600 mm, depending on the elevation and location within the basin. The Euphrates River has a mixed regime, greatly affected by snowmelt and seasonal rainfall. While flows increase in spring due to snowmelt, flows decrease in summer due to decreased rainfall.
The land use within the Euphrates Basin is diverse, with significant portions dedicated to agriculture, particularly in the lower basin areas where irrigation is essential. The upper basin is characterized by forested areas and natural vegetation, while urban development is primarily concentrated around key cities and settlements along the river. The soils in the Euphrates Basin vary widely, with the upper basin predominantly consisting of clayey and loamy soils, which have moderate to high water retention capacities. In contrast, the lower basin features more sandy soils, which are less effective at retaining moisture, making these areas more susceptible to drought conditions.

2.2. Streamflow Data and Homogeneity

Within the basin, a network of measurement stations, overseen by the State Hydraulic Works (DSI) in Türkiye, diligently records daily runoff time series. In the present investigation, these daily measurements are utilized to compute average monthly flow values and subsequently conduct an analysis of drought conditions. The study area encompasses a total of 122 measurement stations, with data recording periods ranging from 1937 to 2022. However, to uphold the reliability of the analysis, mitigate errors stemming from inaccurate or corrupted data, and ensure uninterrupted data coverage for ITA and 3D-ITA, the selection is refined to include only 4 stations (Table 1).
The selection process for measurement stations incorporates multiple criteria to ensure robustness. Initially, stations with a recording period of fewer than 50 years are excluded from the analysis. There are no dams or hydraulic structures upstream of any of the stations that could influence the flow regime. Subsequently, the dataset is further refined by limiting it to monthly time series with less than 10% data gaps and no consecutive missing data exceeding 24 months. The data consists of the annual minimum, average, and maximum flow rates in m3/s. The maximum flow rate is recorded instantaneously throughout the year, the annual average value is calculated using the 365 daily averages, and the annual minimum flow rate is selected as the lowest value among these 365 daily averages. This approach aligns with similar methodologies employed in prior studies focusing on the analysis of streamflow time series [30,40]. Detailed technical specifications for the selected stations can be found in Table 1.
To ensure the robustness of our analysis, a homogeneity test was conducted to identify and confirm the homogeneity of the gauging stations before performing the trend analysis. The location of the gauging stations and the flow measurement methods have remained consistent since their establishment. Additionally, the physical environment and conditions surrounding these stations have not changed over the years. Therefore, any variations observed in the time series are assumed to reflect changes in local climatic conditions rather than alterations in measurement conditions, allowing us to consider the dataset as homogeneous [41]. To determine the homogeneity of the flow time series in this study, the runs test [42] was applied. The hypothesis in this test is that the data in the same time series come from the same cluster and are homogeneous.

2.3. Standardized Streamflow Index (SSFI)

Hydrological drought is a phenomenon marked by adverse deviations in groundwater levels [3] and river flow patterns [43]. This form of drought can be quantified through various indices that rely on precipitation, streamflow, low flows, secondary runoff, groundwater levels, and water balance. In this study, the assessment of hydrological drought employs the SSFI, which is a flow-based index specifically designed to characterize and evaluate river flow conditions. It also facilitates the comprehension of whether prevailing flow conditions deviate from the long-term average for a particular location. Positive SSFI values signify above-average wetter (below-average flow drier) flow conditions.
Among several other drought indexes, the SSFI holds widespread global application introduced by Modarres [44] and endorsed by reputable organizations, such as the World Meteorological Organization and the Global Water Partnership [45]. Its ease of use stems from its calculation based on monthly flow data. Specifically, it involves the transformation of the streamflow data from the probability distribution functions.
The study extends the analysis to encompass the total flow series spanning 3 months, 6 months, and 12 months. Consequently, the magnitude of drought is evaluated on temporal scales, enabling the determination of inter-annual fluctuations in rainy and dry seasons [46]. The classification based on the values of the SSFI is presented in Table 2, facilitating the categorization of hydrological conditions as per the SSFI values.

2.4. Trend Analysis Methods

Trend detection in meteorological, hydrological, water, and air quality measurements has been present in the literature for over thirty years [30]. In addition to the Mann–Kendall approach, linear regression, Şen slope trend tests, and the ITA method are widely used in different regions of the world. Şen’s method offers significant advantages in detecting both monotonic and non-monotonic trends. While other methods only identify three types of trends (monotonically increasing, monotonically decreasing, and trendless cases), Şen’s methodology defines five different trend types (monotonically increasing, monotonically decreasing, non-monotonically increasing, non-monotonically decreasing, and trendless cases). Furthermore, the ITA method also provides visual results by showing the distribution of data points on a graph.
In the current literature, comprehensive studies employing methods for detecting drought trends are still limited. Particularly, there is insufficient research on trend stabilities. Based on this gap, this study has, for the first time, identified trend stabilities using ITA, 3D-ITA, and the WTs. The WT is a non-parametric method used to determine whether the differences between two dependent samples are statistically significant. This test can be applied regardless of whether the data distribution is normal, making it a robust alternative, especially for small samples. In this study, the WT has been utilized for the first time to assess differences between two halves by dividing the series into three equal periods (Part 1–Part 2 and Part 2–Part 3), to determine the stability of trends within these time series.
The trend analysis in this study was conducted using MATLAB R2020b. It was also used to visualize the graphs, which facilitated the implementation of the 3D-ITA and the visualization of complex data trends. Moreover, IBM SPSS 20. Statistics, with its extensive library of statistical packages, was utilized for the application of the classical and the Triple WTs. These software platforms were selected for their robustness in handling large datasets and performing intricate computations necessary for the comprehensive analysis presented in this study.

2.4.1. Innovative Trend Analysis (ITA) and 3D-ITA

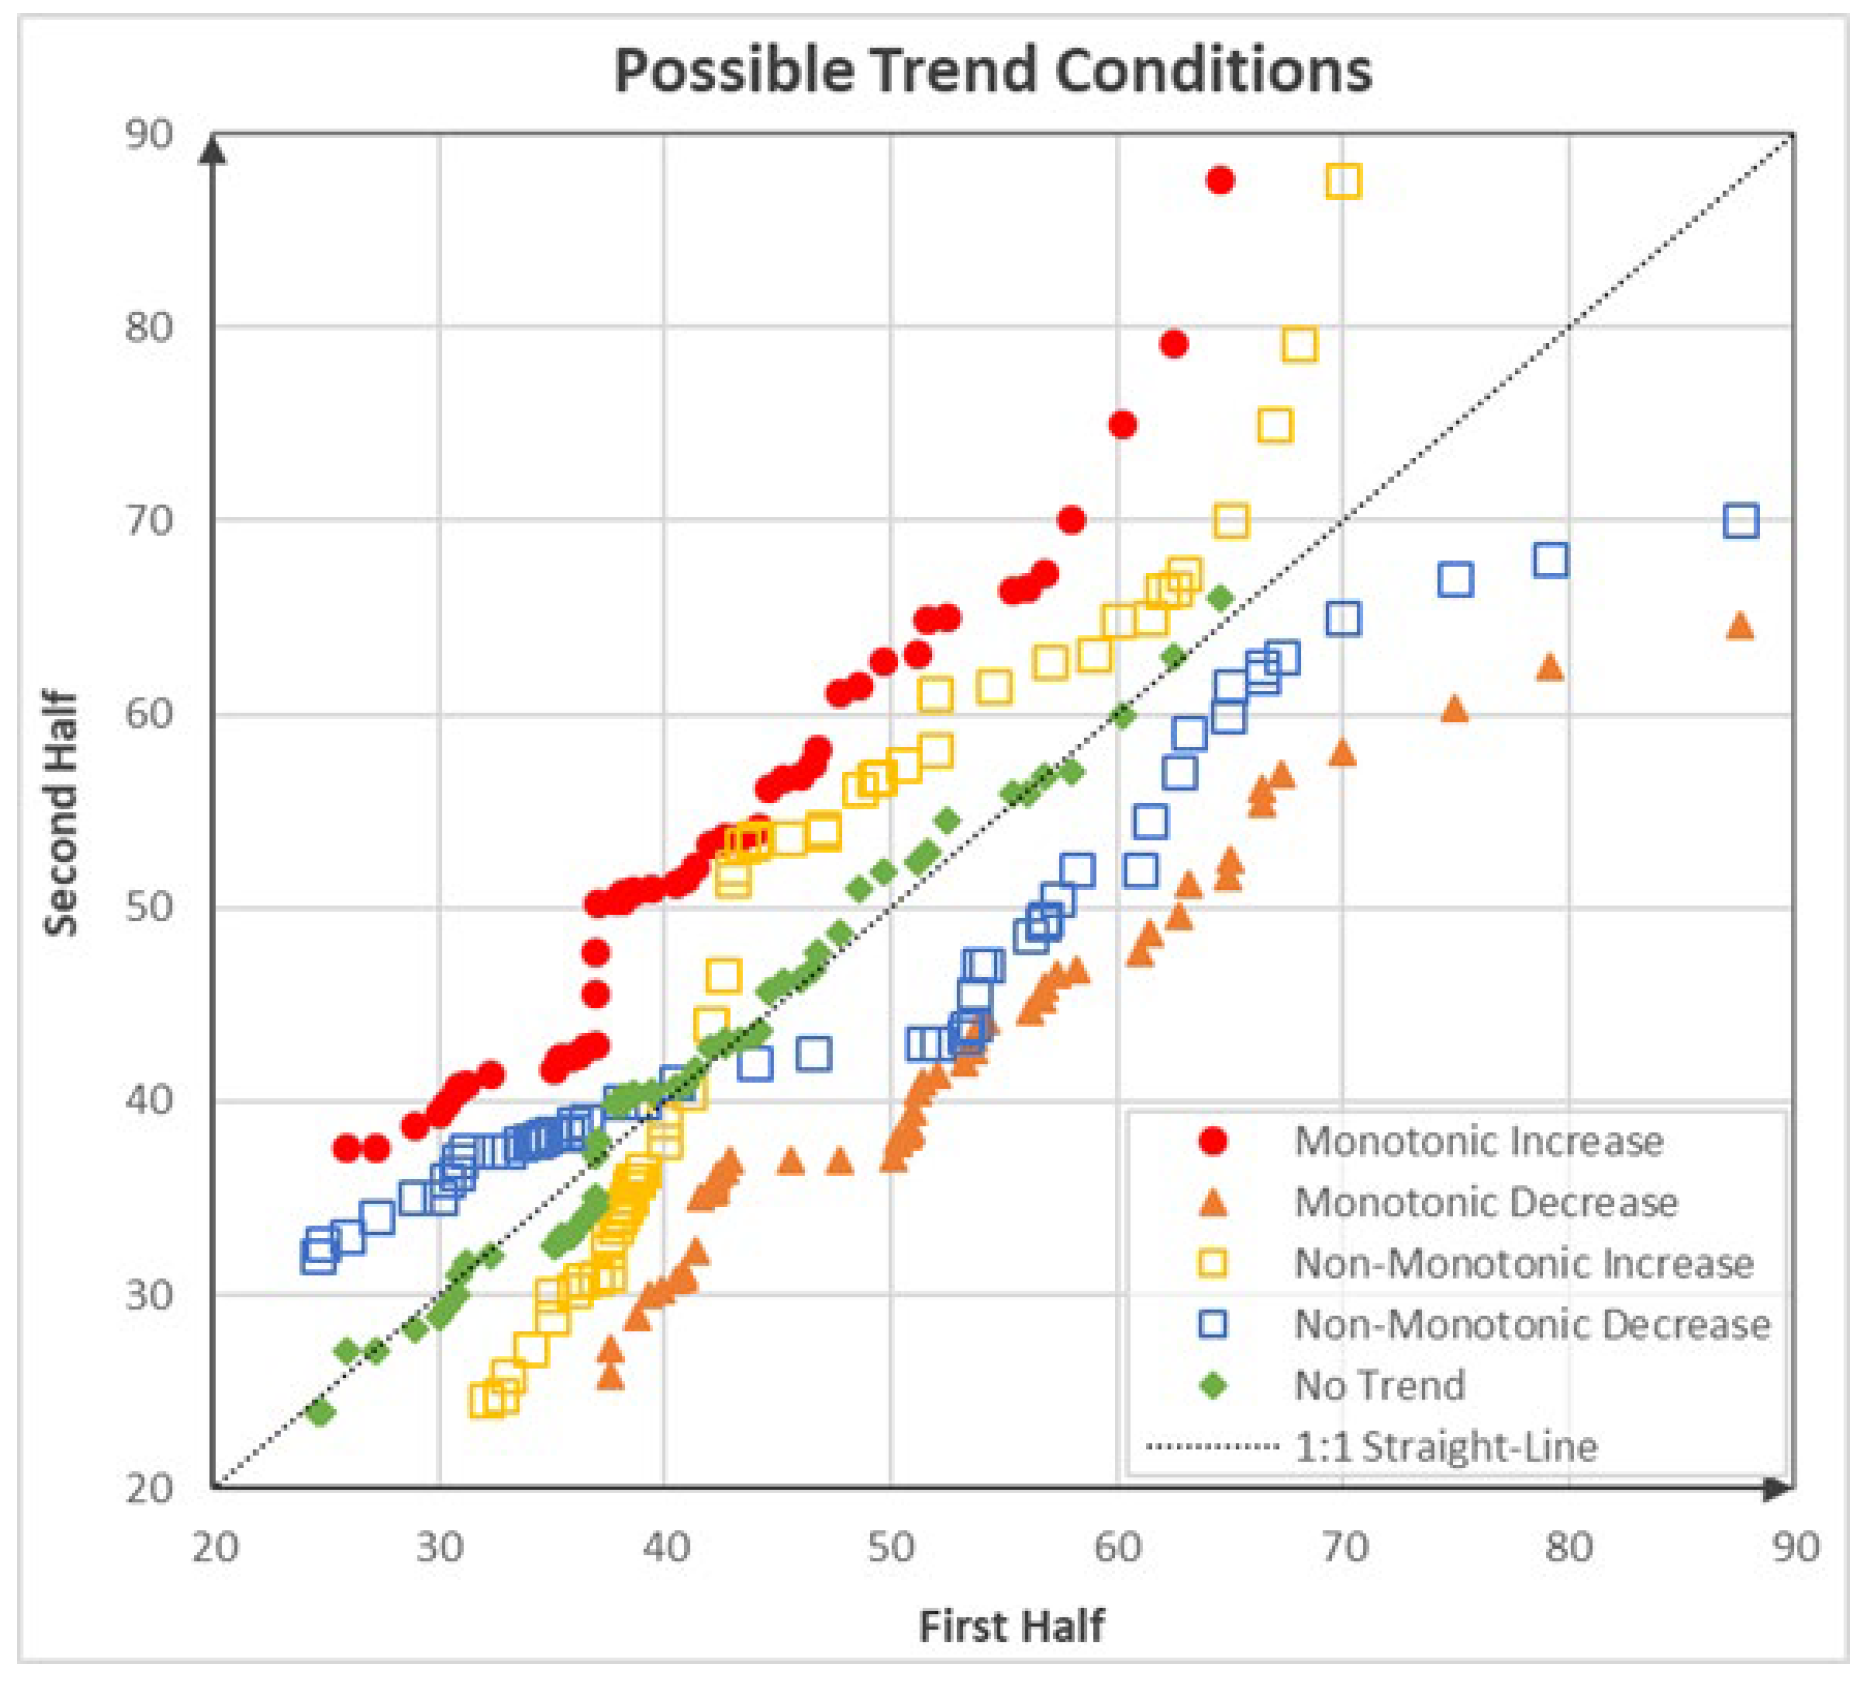
Detection of trends in any hydro-meteorological data has been a prevalent topic in the last decades. Along this line, the ITA approach has gained widespread adoption in recent years due to its distinct advantages. This method offers the ability to identify visually monotonic or non-monotonic trends without relying on underlying assumptions [31]. Additionally, the ITA method facilitates the classification of time series into five distinct trend types (Figure 2). For its application, the data records are initially split into two halves, which are subsequently sorted in ascending order. The sorted data points are then plotted on a cartesian coordinate system and compared with the 1:1 (45°) line drawn on the same graph. If the scattered data points cluster around or align closely with the 1:1 line, then there is no discernible trend in the time series. Conversely, when the scattered data points deviate notably above or below this line, it signifies the presence of an increasing or decreasing trend, respectively.
A monotonic trend is identified when the data exhibits a consistent pattern of either continuous increase, continuous decrease, or no trend at all. In contrast, a non-monotonic trend implies that the data do not exhibit a uniform trend pattern; some data points may decrease while others increase within the same graph, and vice versa (Figure 2). In this study, ITA is organized by dividing three different periods (first, second, and third periods) to assess and compare the streamflow drought in the distant (first–second) and recent (second–third) past. Hence, the trends of SSFI are determined by whether they increased or decreased from the past to the present.
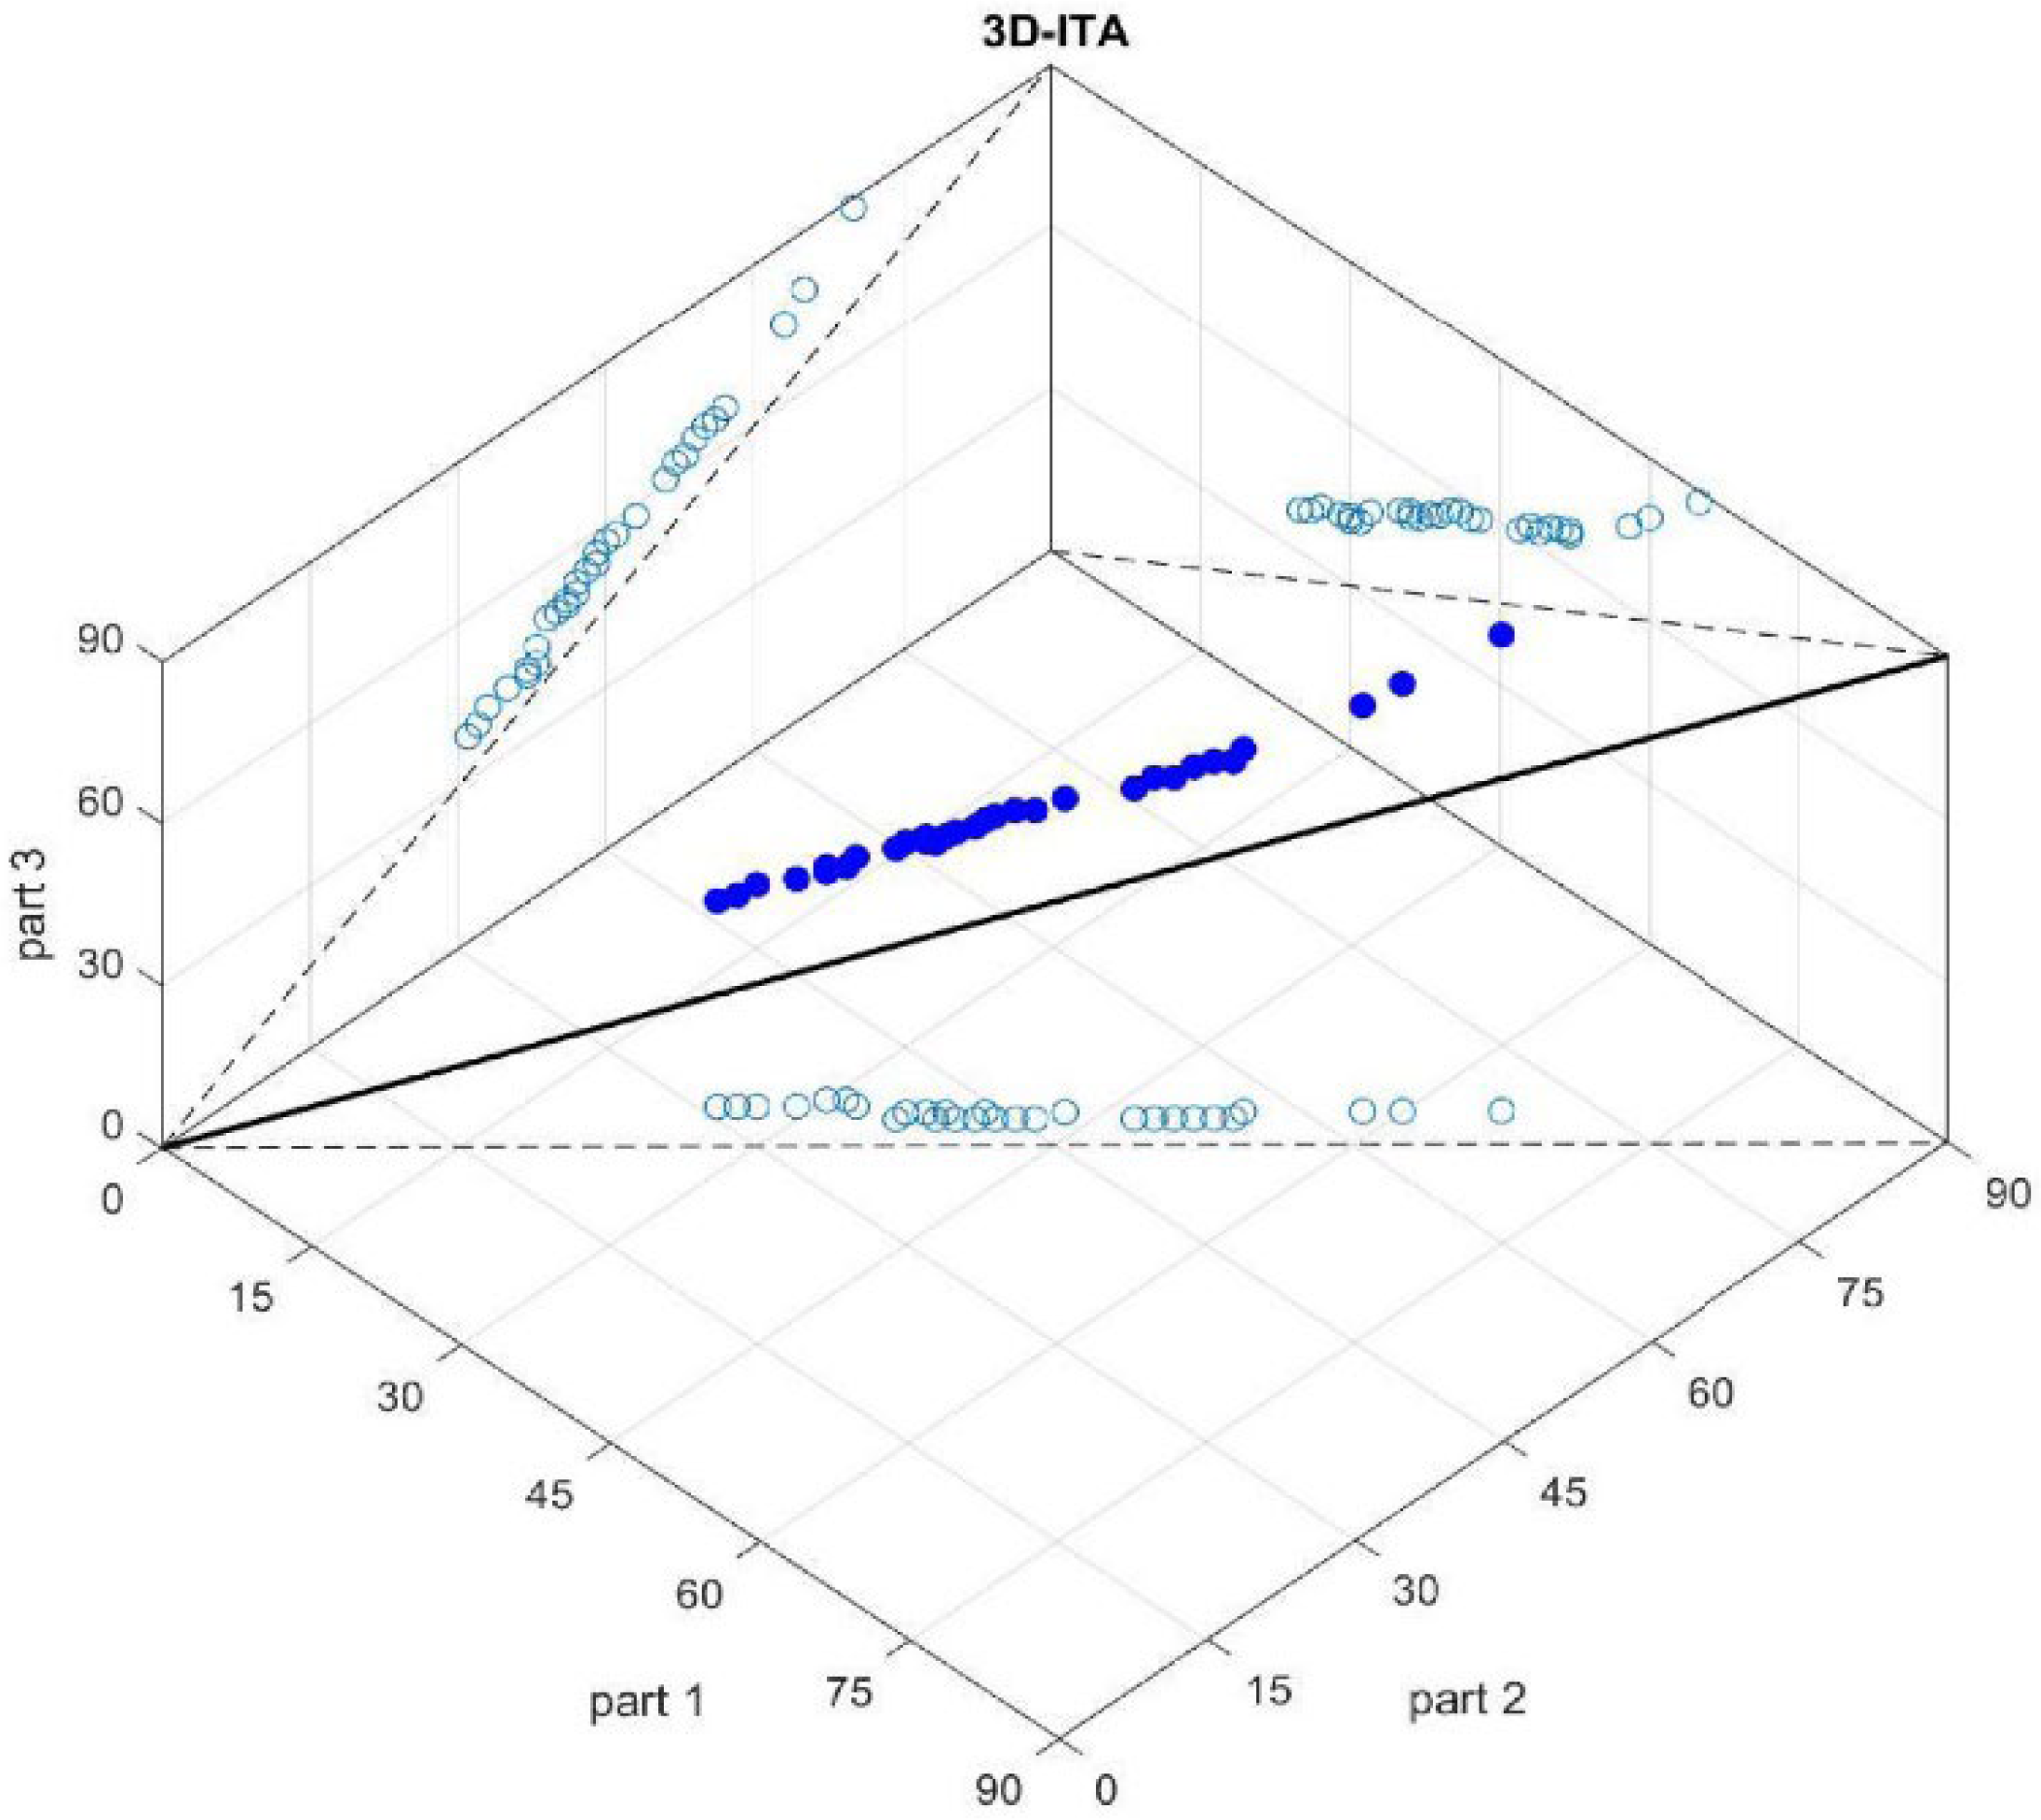
In this study, the proposed three-dimensional model, which includes the 1:1:1 straight line and is an example of the ITA type, not only depicts the specified trend types but also demonstrates trend stabilities (Figure 3). For the 3D-ITA method, similar computational steps to the Şen-ITA test and additional procedures are applied. Trend types with stability can be identified through a visual examination of the scattered data positions about the 1:1:1 straight line in the 3D-ITA graph and the 1:1 straight line in the classical ITA graph. This visual inspection serves as a critical assessment tool to determine whether the trends are stable. Similar calculation steps of the Şen-ITA method and more are as follows for the suggested 3D-ITA method [36]:
  • A given record including n data, x 1 , x 2 , , x n is divided into three parts y 1 , n / 3 , y 2 , n / 3 , and y 3 , n / 3 ;
    y 1 , n 3 = x 1 , x 2 , , x n 3  
    y 2 , n 3 = x n 3 + 1 , x n 3 + 2 , , x 2 n 3
    y 3 , n 3 = x 2 n 3 + 1 , x 2 n 3 + 2 , , x n  
  • All parts are ranked in descending order, hereby, there are three ordered parts with the same number of elements namely {r1}, {r2}, and {r3};
    r 1 = m i n y 1 , n 3 , , y i , , m a x y 1 , n 3 1 < i < n 3
    r 2 = m i n y 2 , n 3 , , y j , , m a x y 2 n 3 1 < j < n 3
    r 3 = m i n y 3 , n 3 , , y k , , m a x y 3 , n 3 1 < k < n 3
  • On the x-z surface, the {r1} values as part 1 on the x-axis versus the {r2} values as part 2 on z-axis are scattered;
  • On the x-y surface, the {r1} values as part 1 on the x-axis versus the {r3} values as part 3 on the y-axis are scattered (Figure 3);
  • On the z-y surface, the {r2} values as part 2 on the x-axis versus the {r3} values as part 3 on the z-axis are scattered (Figure 3);
  • Straight lines that are 1:1 straight (dashed lines) are put on the surfaces as the main structure of ITA (Figure 3);
  • Additionally, a 1:1:1 straight line is drawn in a 3D graph and the values of {r1}, {r2}, and {r3} are scattered against each other as spheres (Figure 3);
  • There is stable no trend condition in the time series if all spheres fall on the 1:1:1 straight line;
  • If the spheres’ projections on the surfaces are above (below) the 1:1 straight line then there is a significant stable increasing (decreasing) trend;
  • If there is any trend type according to the classical ITA but the projections have different trend types, then there is an unstable trend.
Consequently, the trend type with stability can be characterized through a visual inspection of the scattered data positions relative to the 1:1:1 straight line on the 3D-ITA graph and the 1:1 straight line on the classical ITA graph. Hypothetical illustrations using random values for the 3D-ITA method are presented in Figure 3 [36]. The proposed 3D trend model provides additional insights into the stability of various trend types, supplementing the information offered by the classical ITA approach.

2.4.2. Wilcoxon Signed-Rank Test (WT)

The Wilcoxon signed-rank test (WT) is a robust non-parametric method preferred when data do not follow a normal probability distribution function [29]. Due to its rank-based approach, it is less sensitive to the distributional properties of the data, thereby offering a wide range of applications. The classical Wilcoxon test aims to determine whether the distributions of two variables are the same by considering the differences in two paired data sets. For this purpose, the differences between paired observations are calculated according to Equations (7)–(9), and the absolute values of these differences are taken [47]. These absolute values are then ranked in ascending order with ranks. The sum of the ranks corresponding to positive differences ( T ) and the sum of the ranks corresponding to negative differences ( T + ) are calculated. These sums are then used in the relevant equation, as specified by Karagöz [48].
D i = X i Y i
D i = X i Y i  
T = T + + T
where Di represents the difference between the first set of data, Xi, and the second, Yi, and the test statistic value for Wilcoxon is calculated as Z W in Equation (10), which assists in determining trend conditions based on the value of Z a / 2   σ T (for two-tailed tests). The distribution has a standard deviation value of σ T (Equation (11)) and is denoted by the arithmetic mean value μ T . The hypothesis is based on the principle that μ T equals zero [29], it is assumed to be zero. Thus, H 0 : T+ = T, where the sum of positive and negative differences between trial outcomes equals each other.
Z W = T μ T σ T = T σ T
σ T = n n + 1 2 n + 1 6
Furthermore, the trend formation can be understood by comparing the Z W T value with Z a / 2 . If Z W T > Z a / 2 , there is a trend formation. Here, Z a / 2   = ± 2.576 indicates a very strong trend at a 99% confidence interval, Z a / 2   = ± 1.96 indicates a strong trend at a 95% confidence interval, Z a / 2   = ± 1.645 indicates a moderate trend at a 95% confidence interval, and, finally, Z a / 2   = ± 1.282 implies a weak trend at an 80% confidence interval. Confidence intervals of 90% and above are preferred in trend analysis studies [49]. However, in this study, confidence intervals of 90% and above are also used to better compare the proposed method with the classical WT.
This study proposes an improved method by modifying the classical WT. This methodology establishes a similar relationship between classical ITA [31] and 3D-ITA [30]. The Triple WT aims to determine trend stabilities by dividing the data into three equal parts, similar to the 3D-ITA methodology, but without any change. Here, the Triple WT is employed for a stability analysis that considers the differences in data from unsorted parts.

3. Results and Discussion

In this study, the runs test was applied to assess the accuracy of the flow data. The dataset’s homogeneity was evaluated at a 5% significance level, preventing misinterpretation of extreme events. The results in Table 3 show that the homogeneity tests conducted at four stations yielded significant findings, aiding in determining whether the dataset was homogeneous.
Inhomogeneity in a time series can distort the interpretation of extreme events and trends, often resulting in abrupt changes in the mean [50]. The consistent test results underscored the importance of addressing inhomogeneity in monthly flow series. Based on the results presented in Table 3, while certain months exhibited inhomogeneities, the dataset as a whole is considered largely homogeneous. It is important to note that the annual scale is generally more stable in homogeneity studies, as it tends to smooth out seasonal fluctuations. This stability at the annual level provides additional confidence in the reliability of the findings. The accuracy of the measurements, which produced consistent outcomes without being affected by any water structures, further reinforces this assessment. Overall, under stable observation conditions, the data were judged to be homogeneous at the 5% significance level.
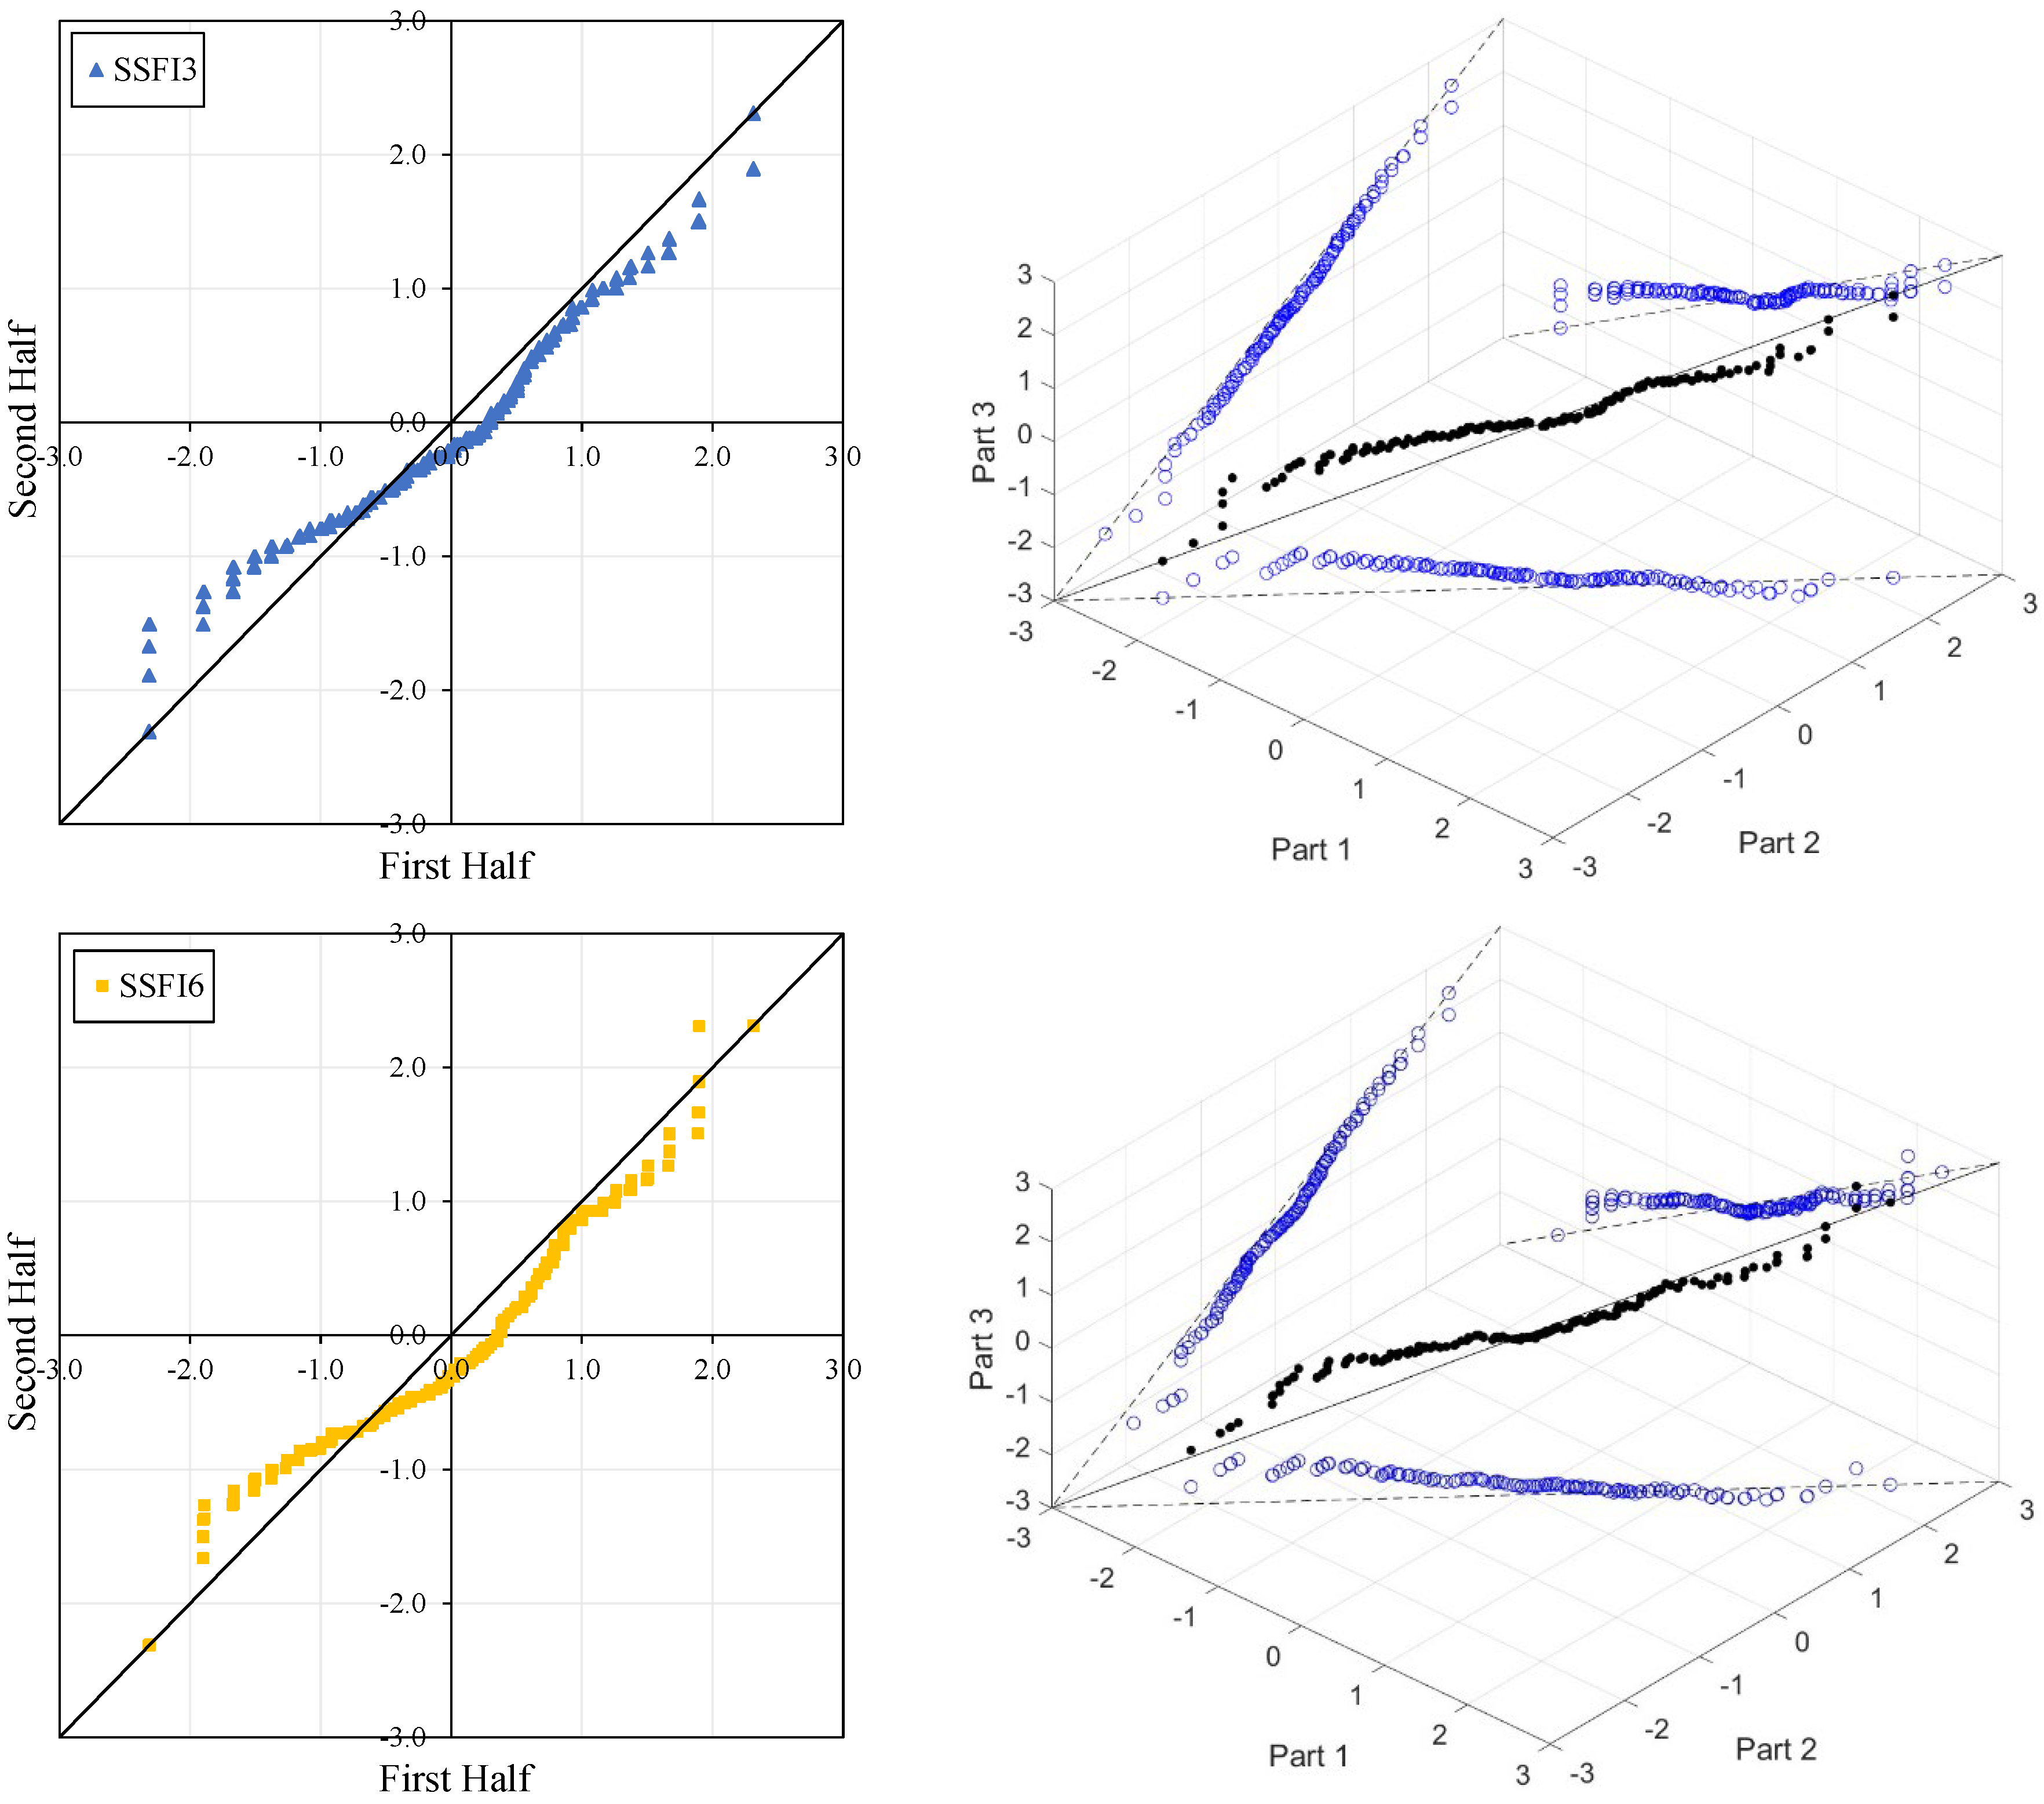
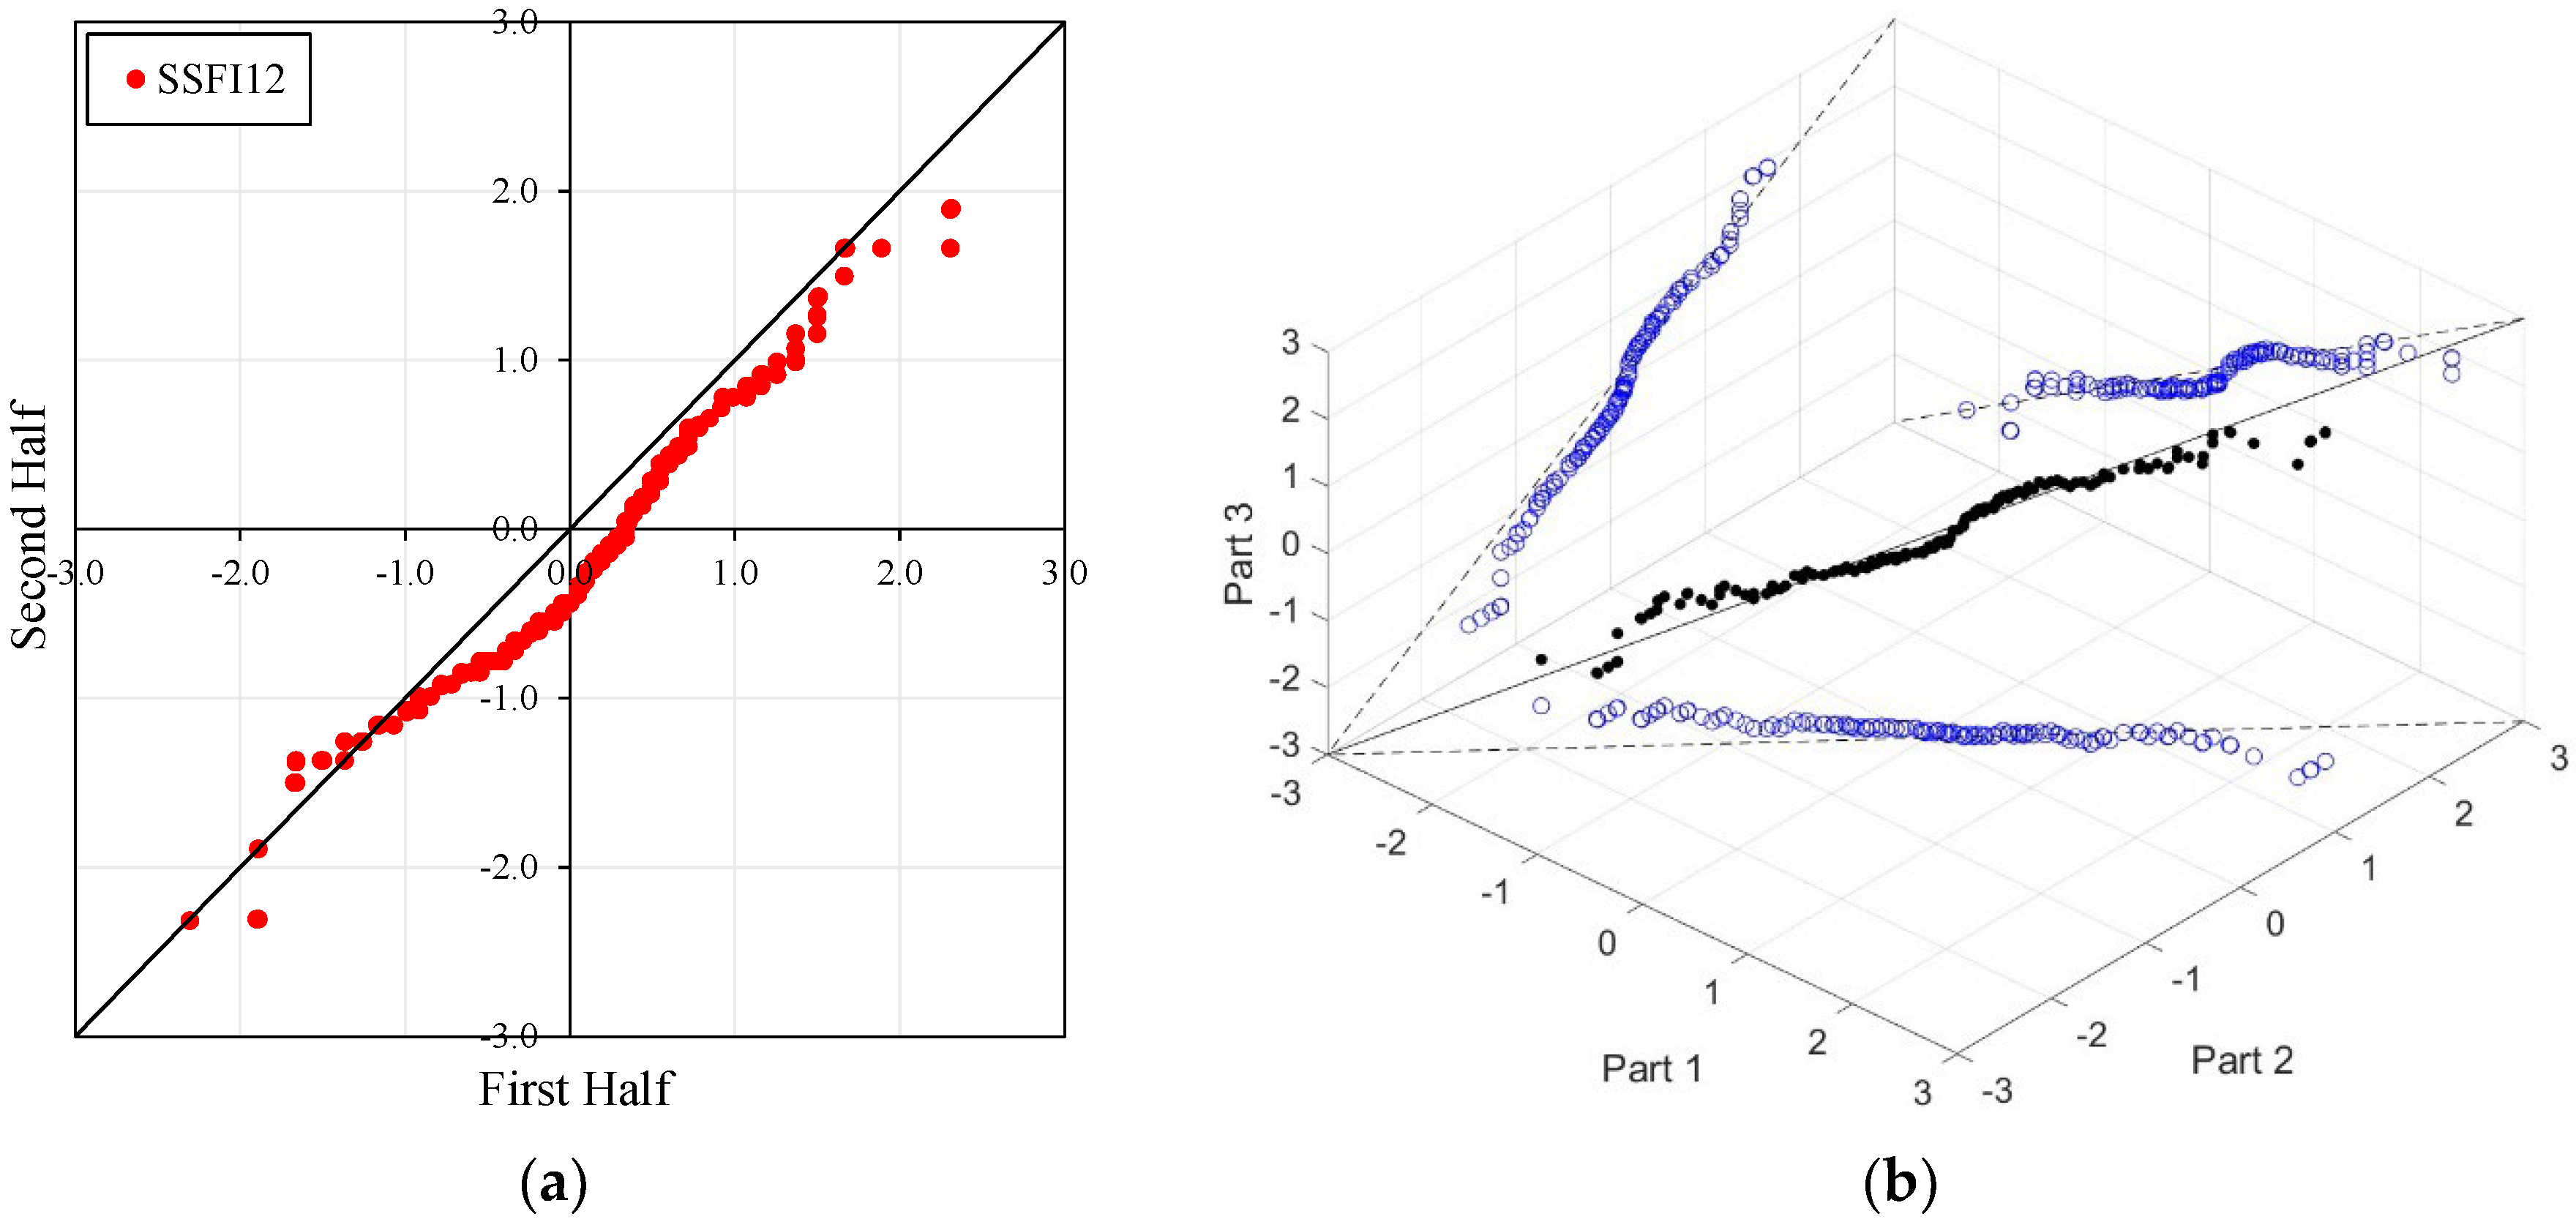
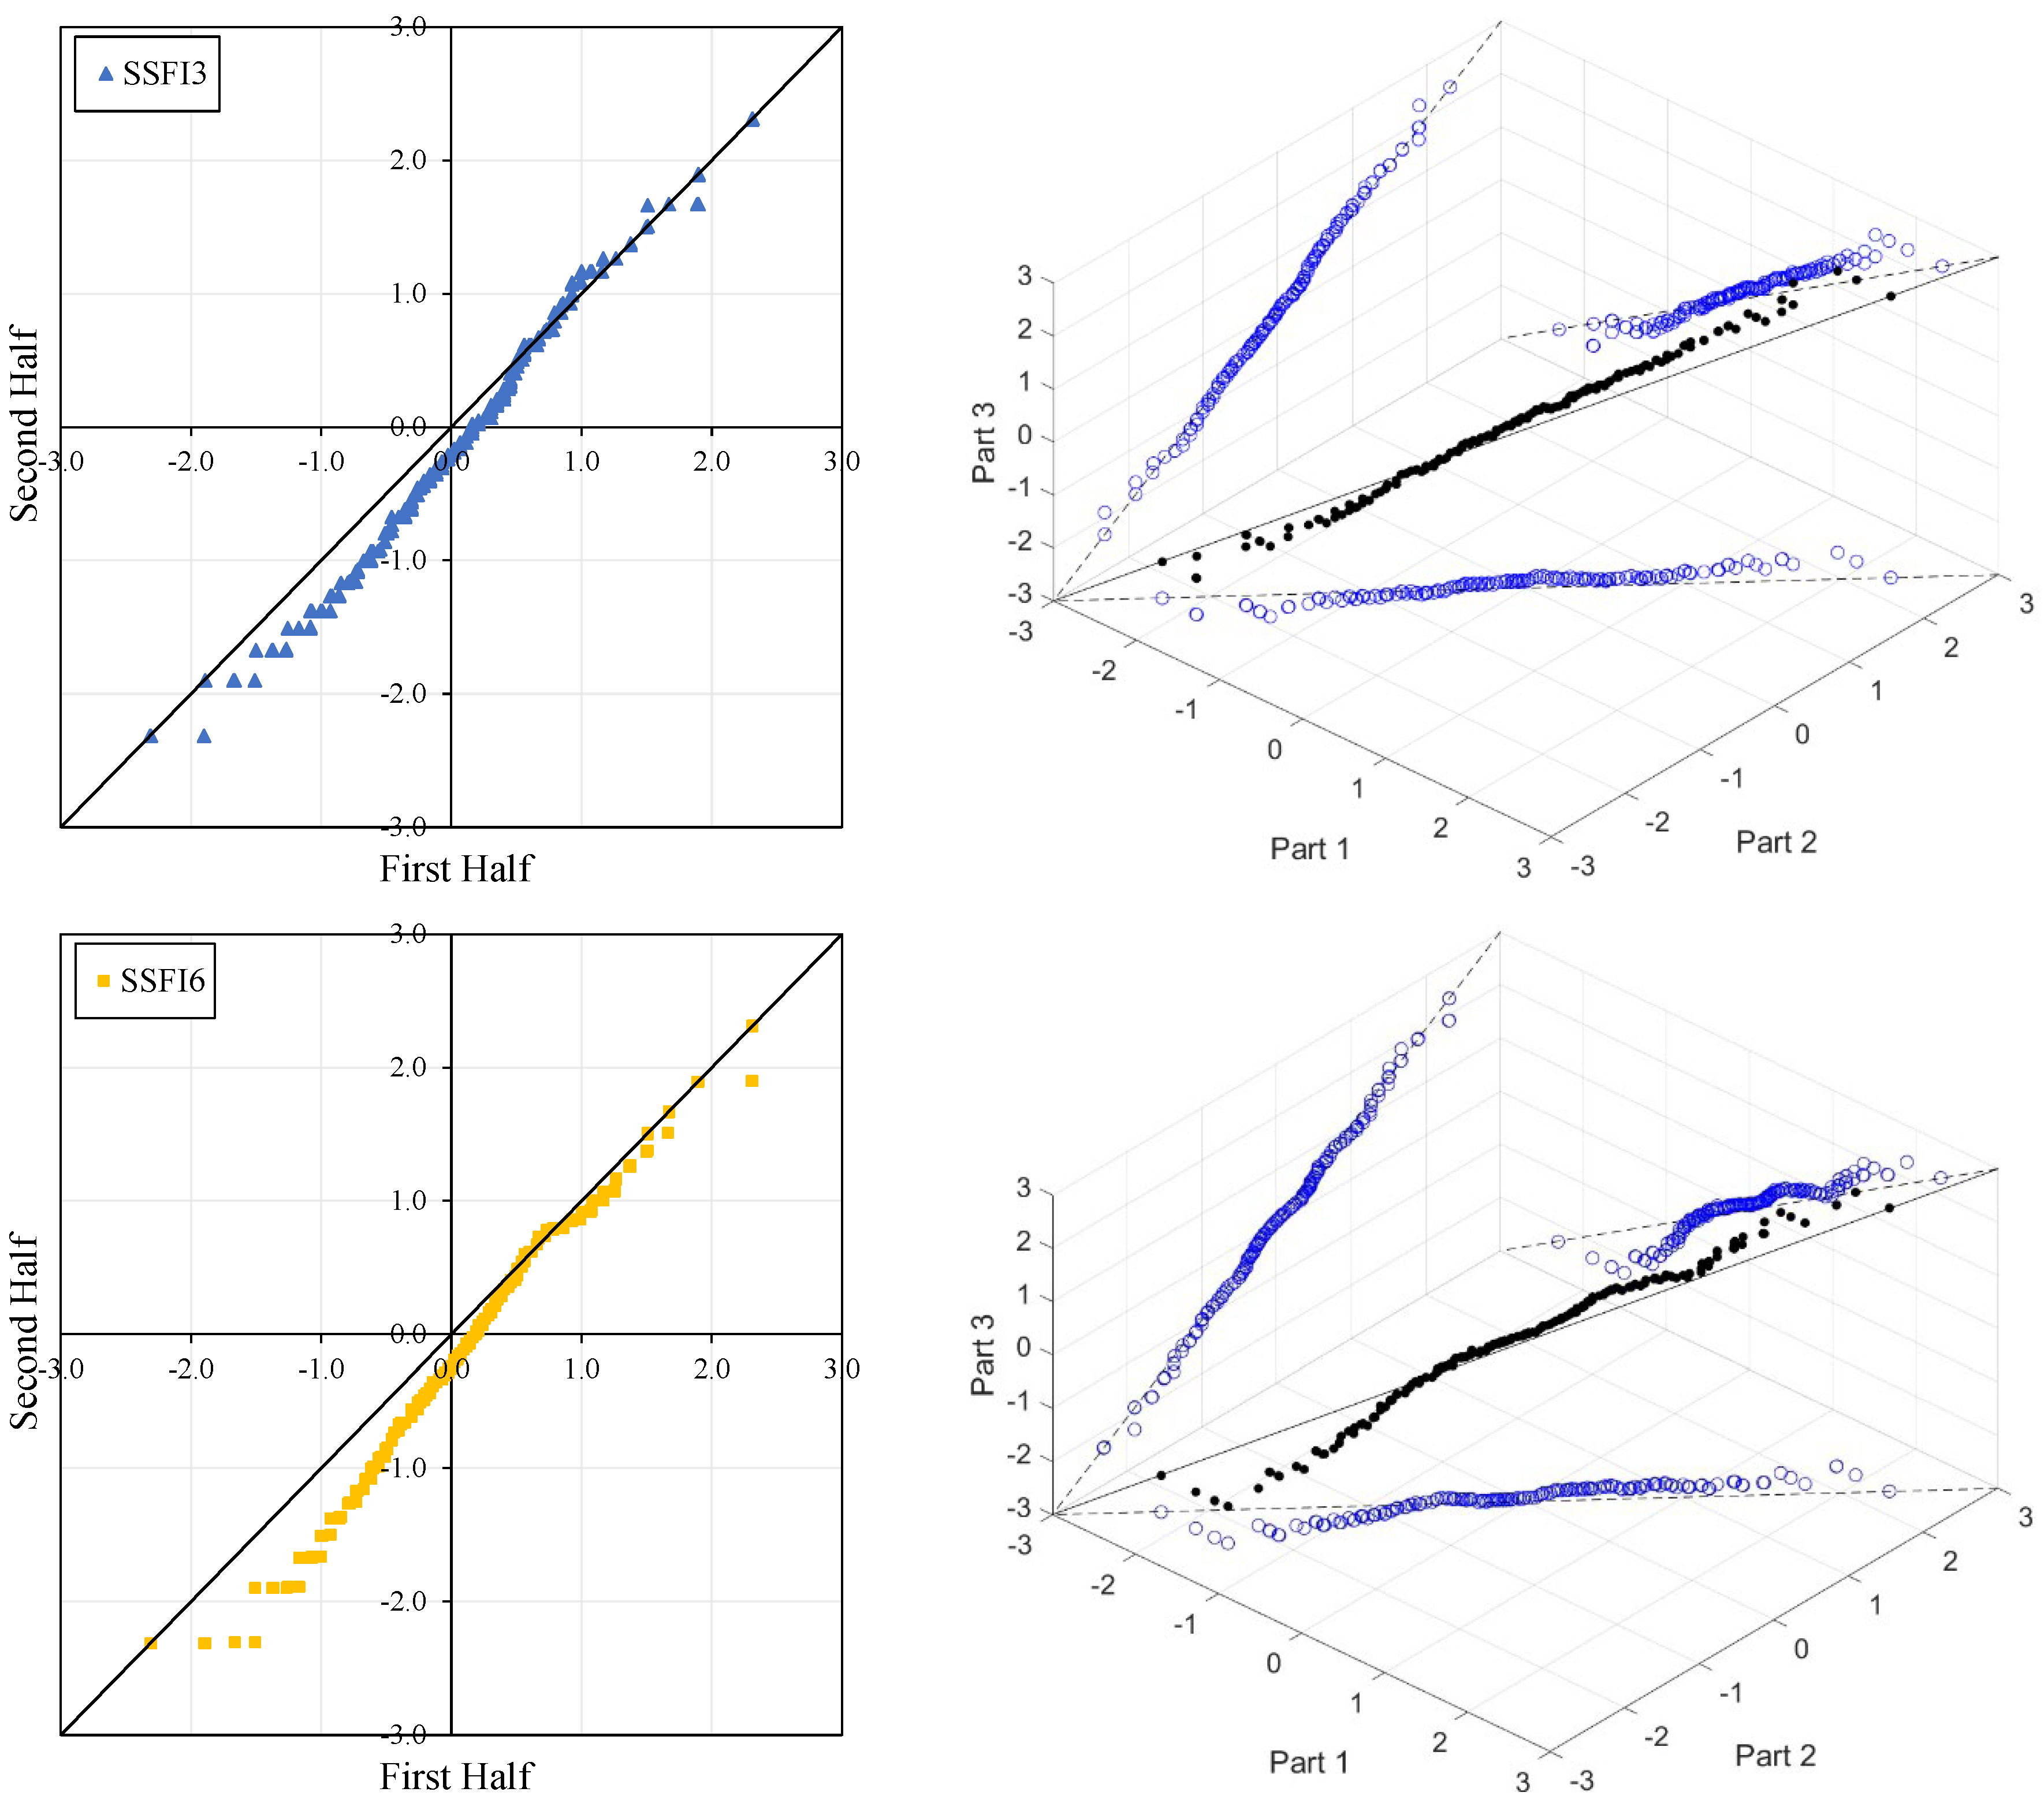
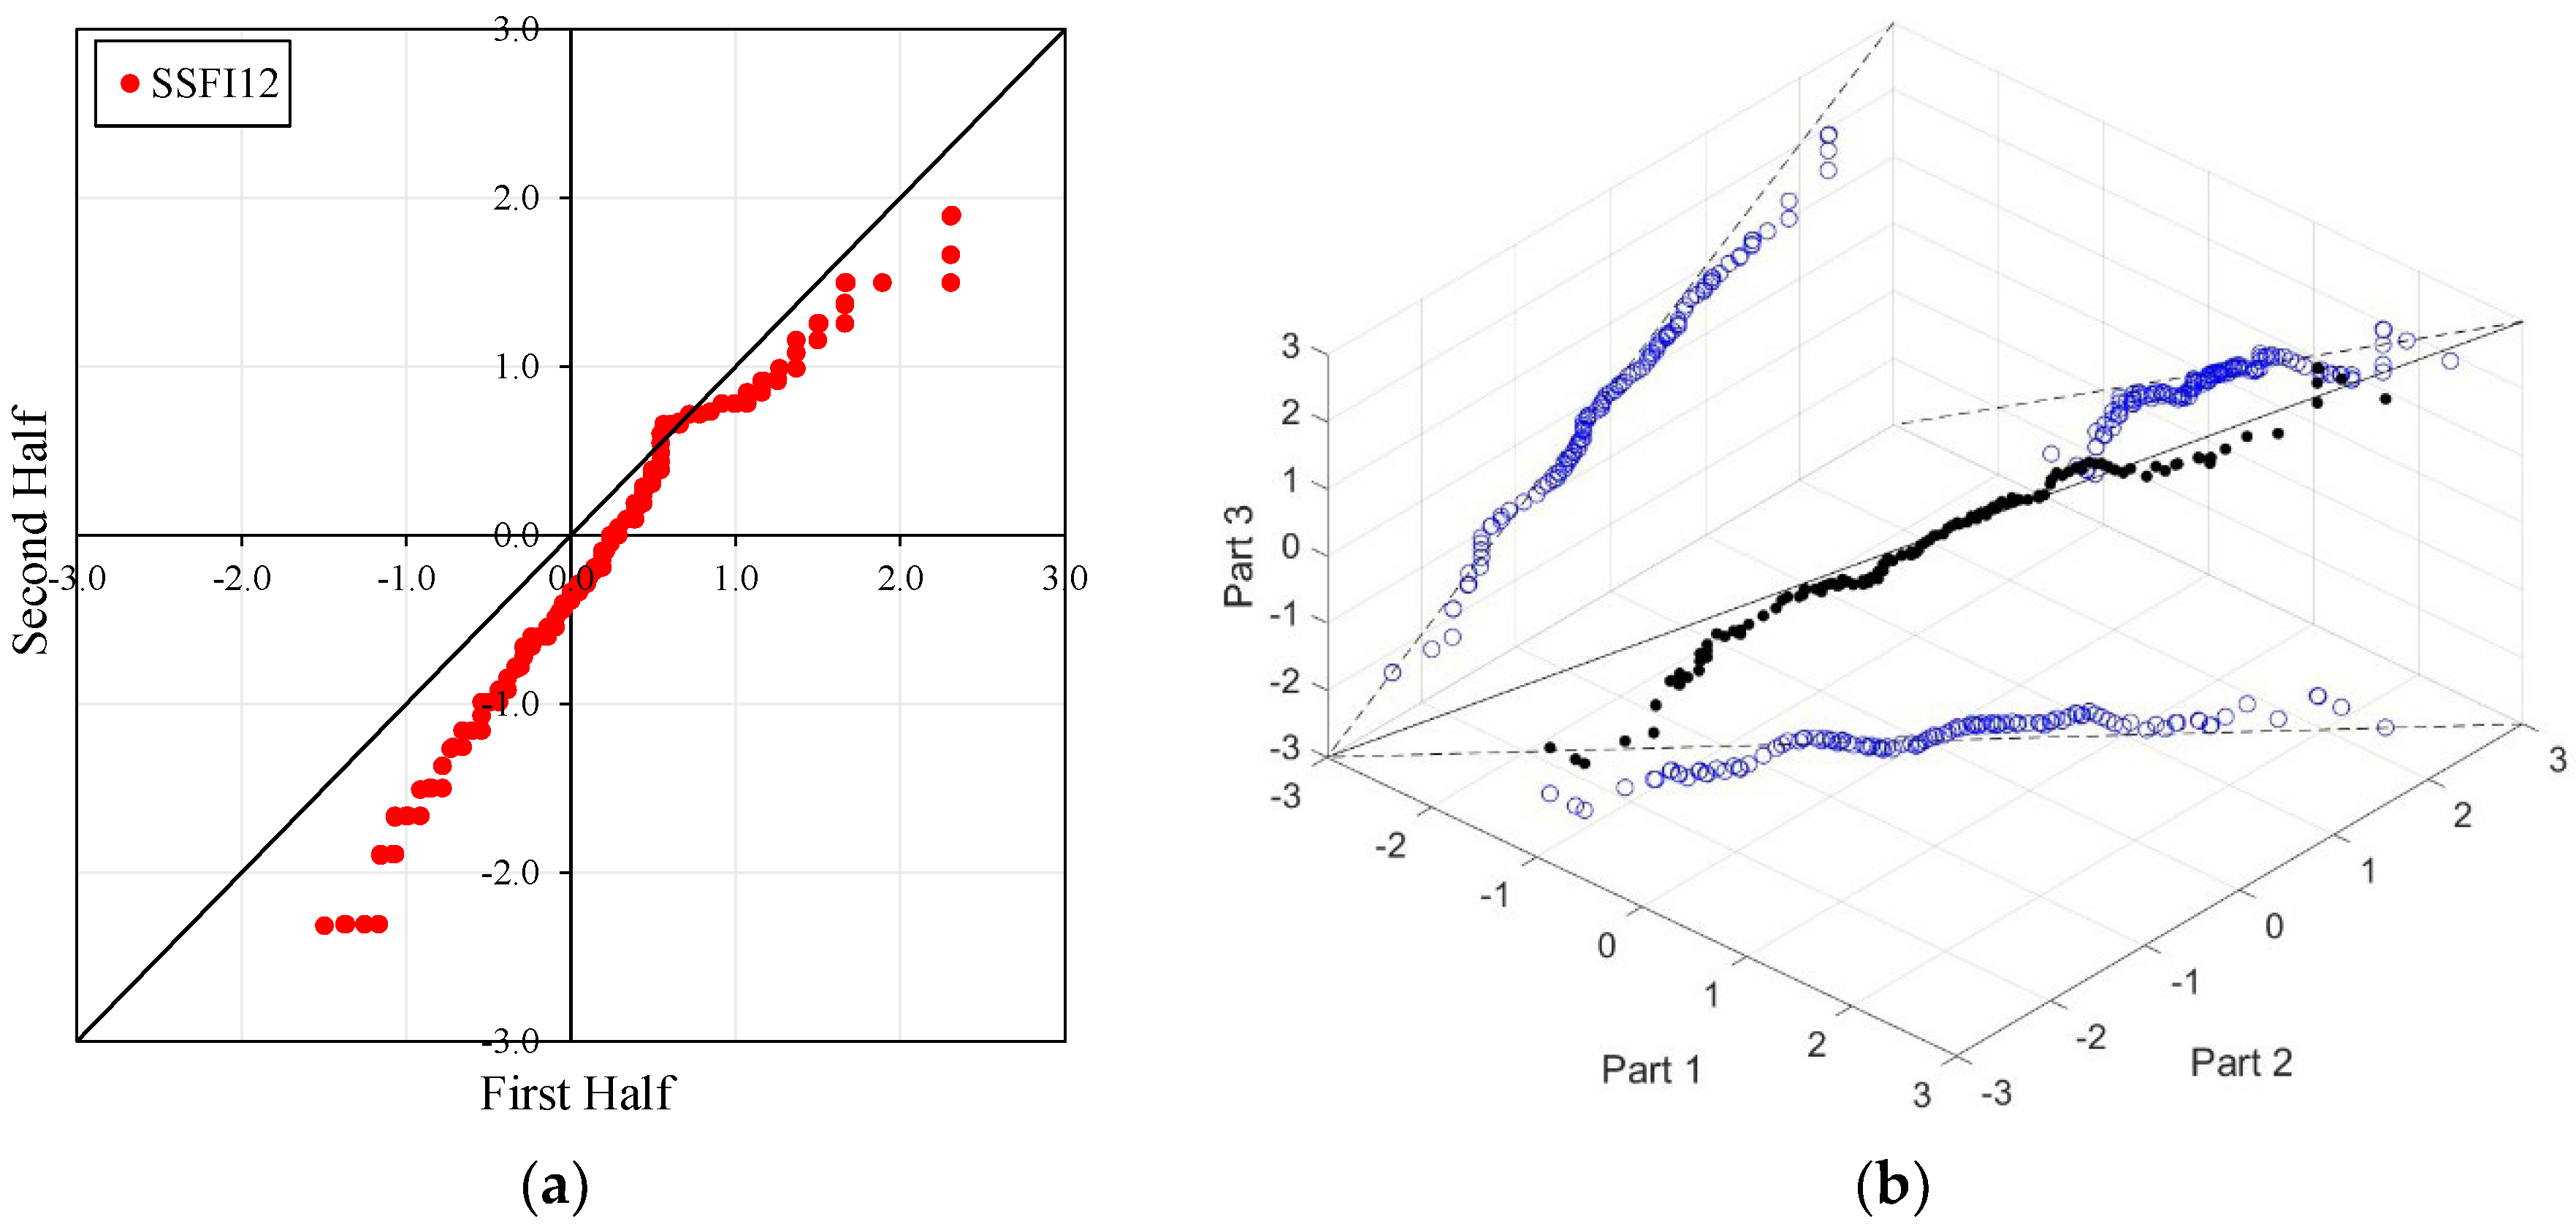
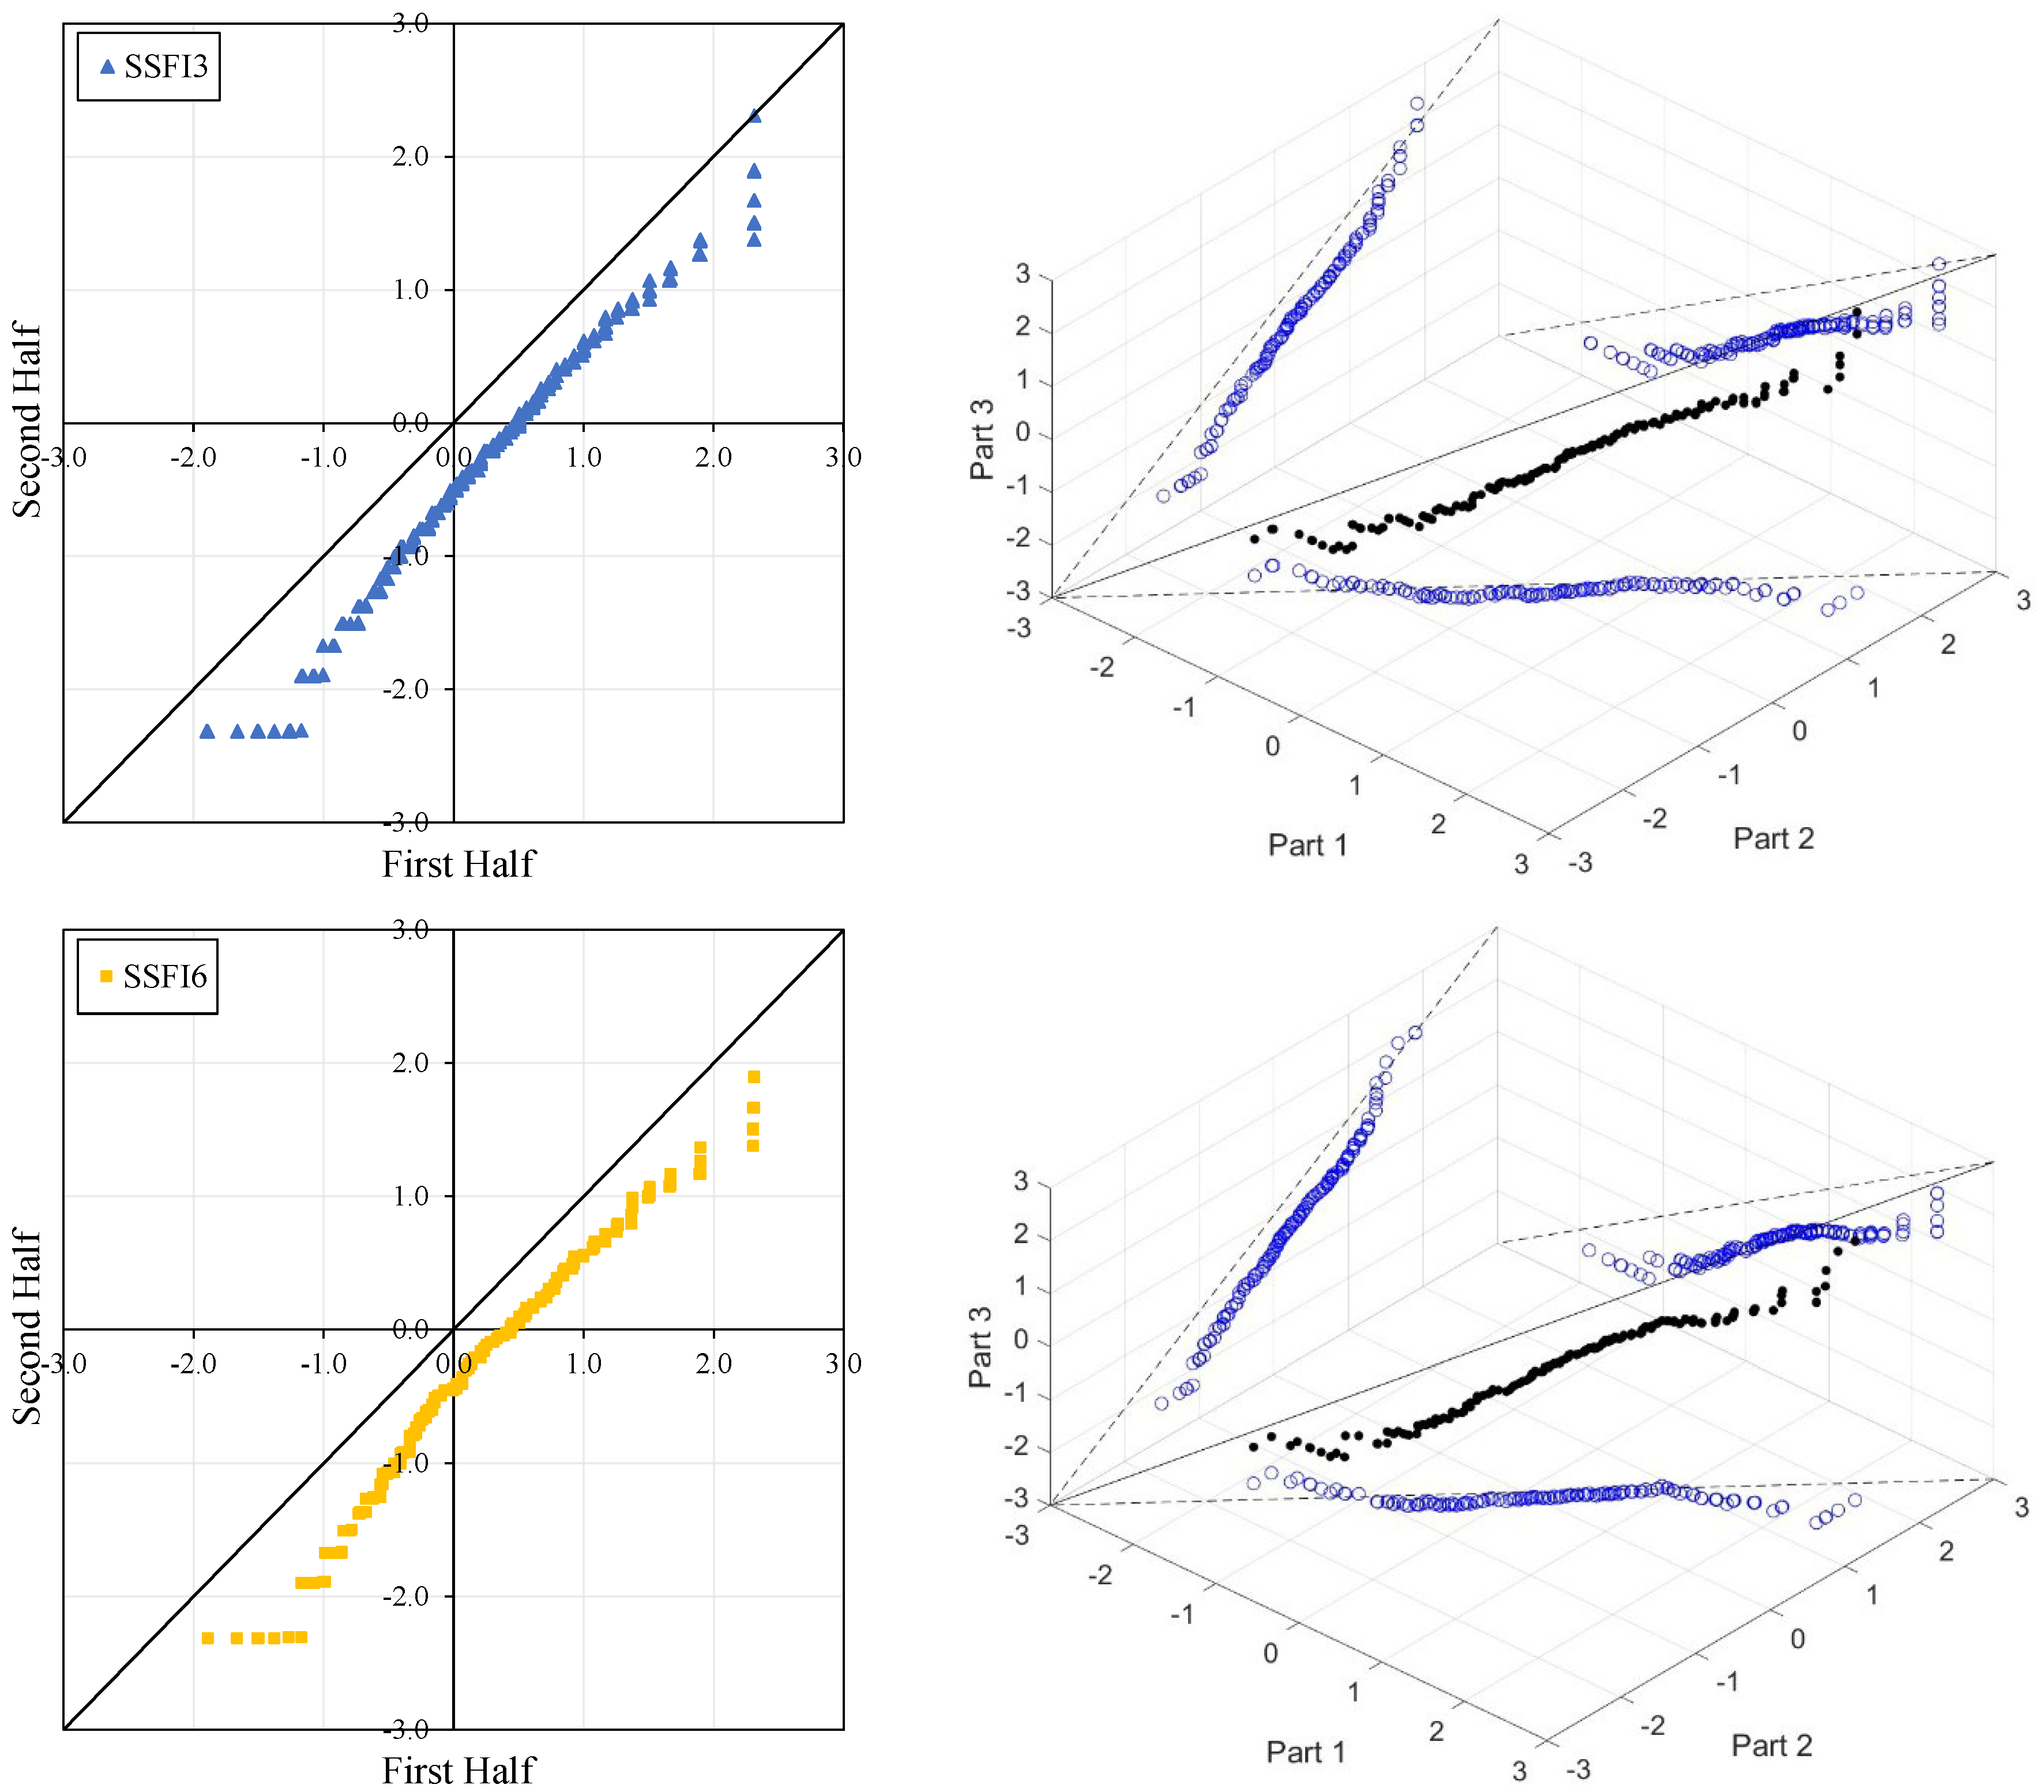
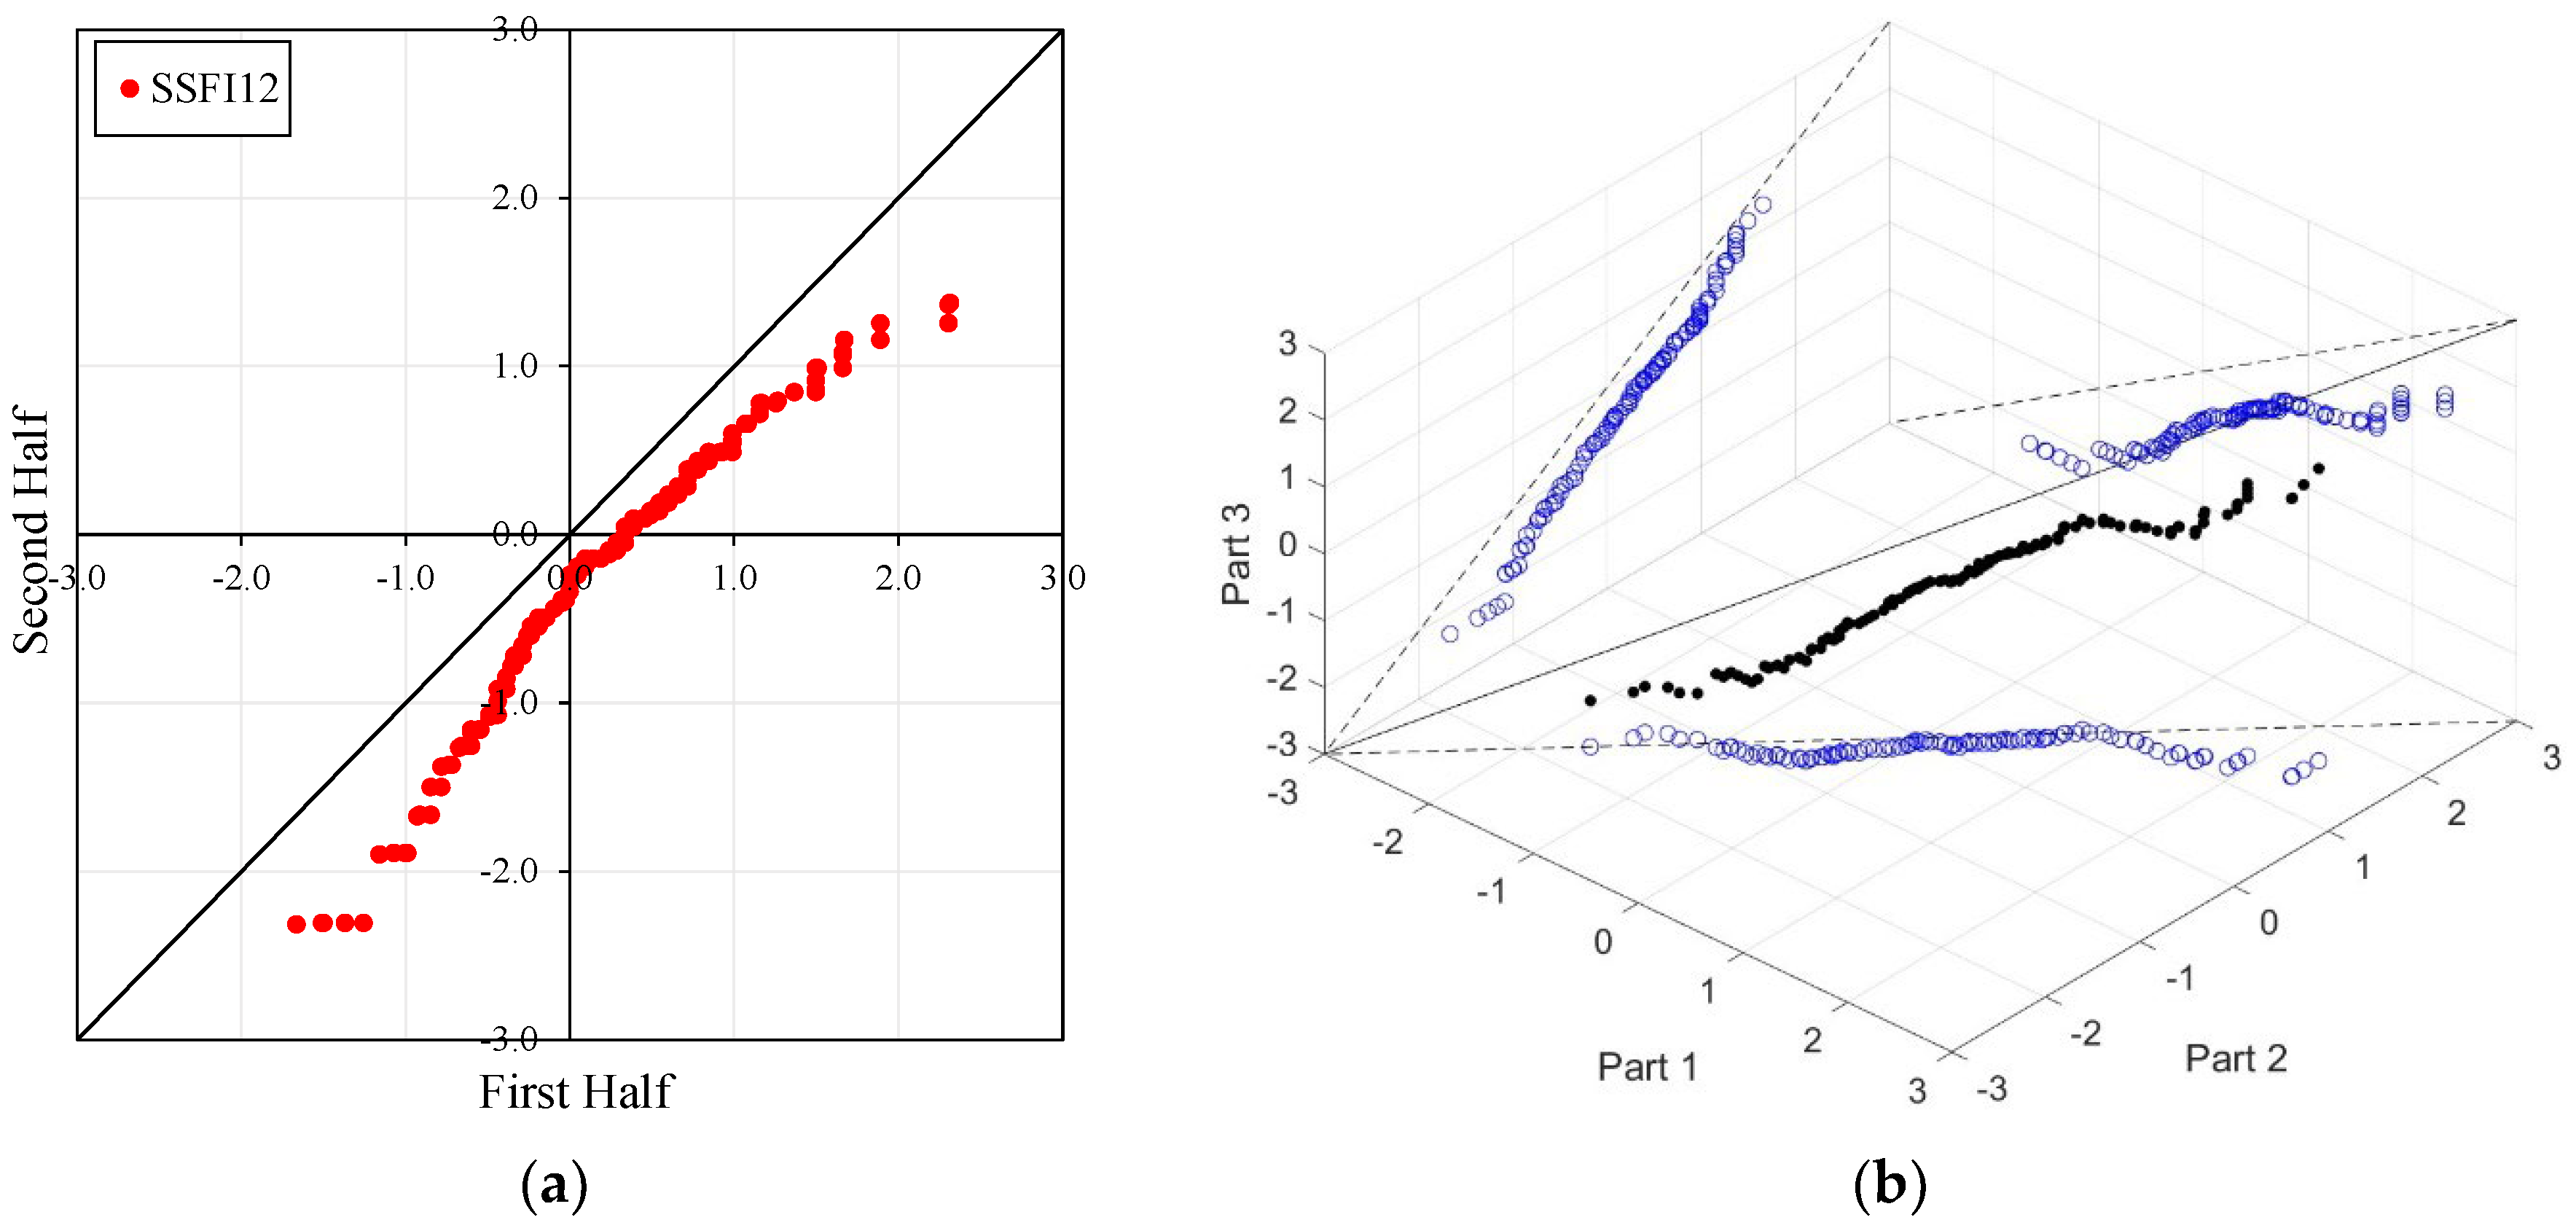
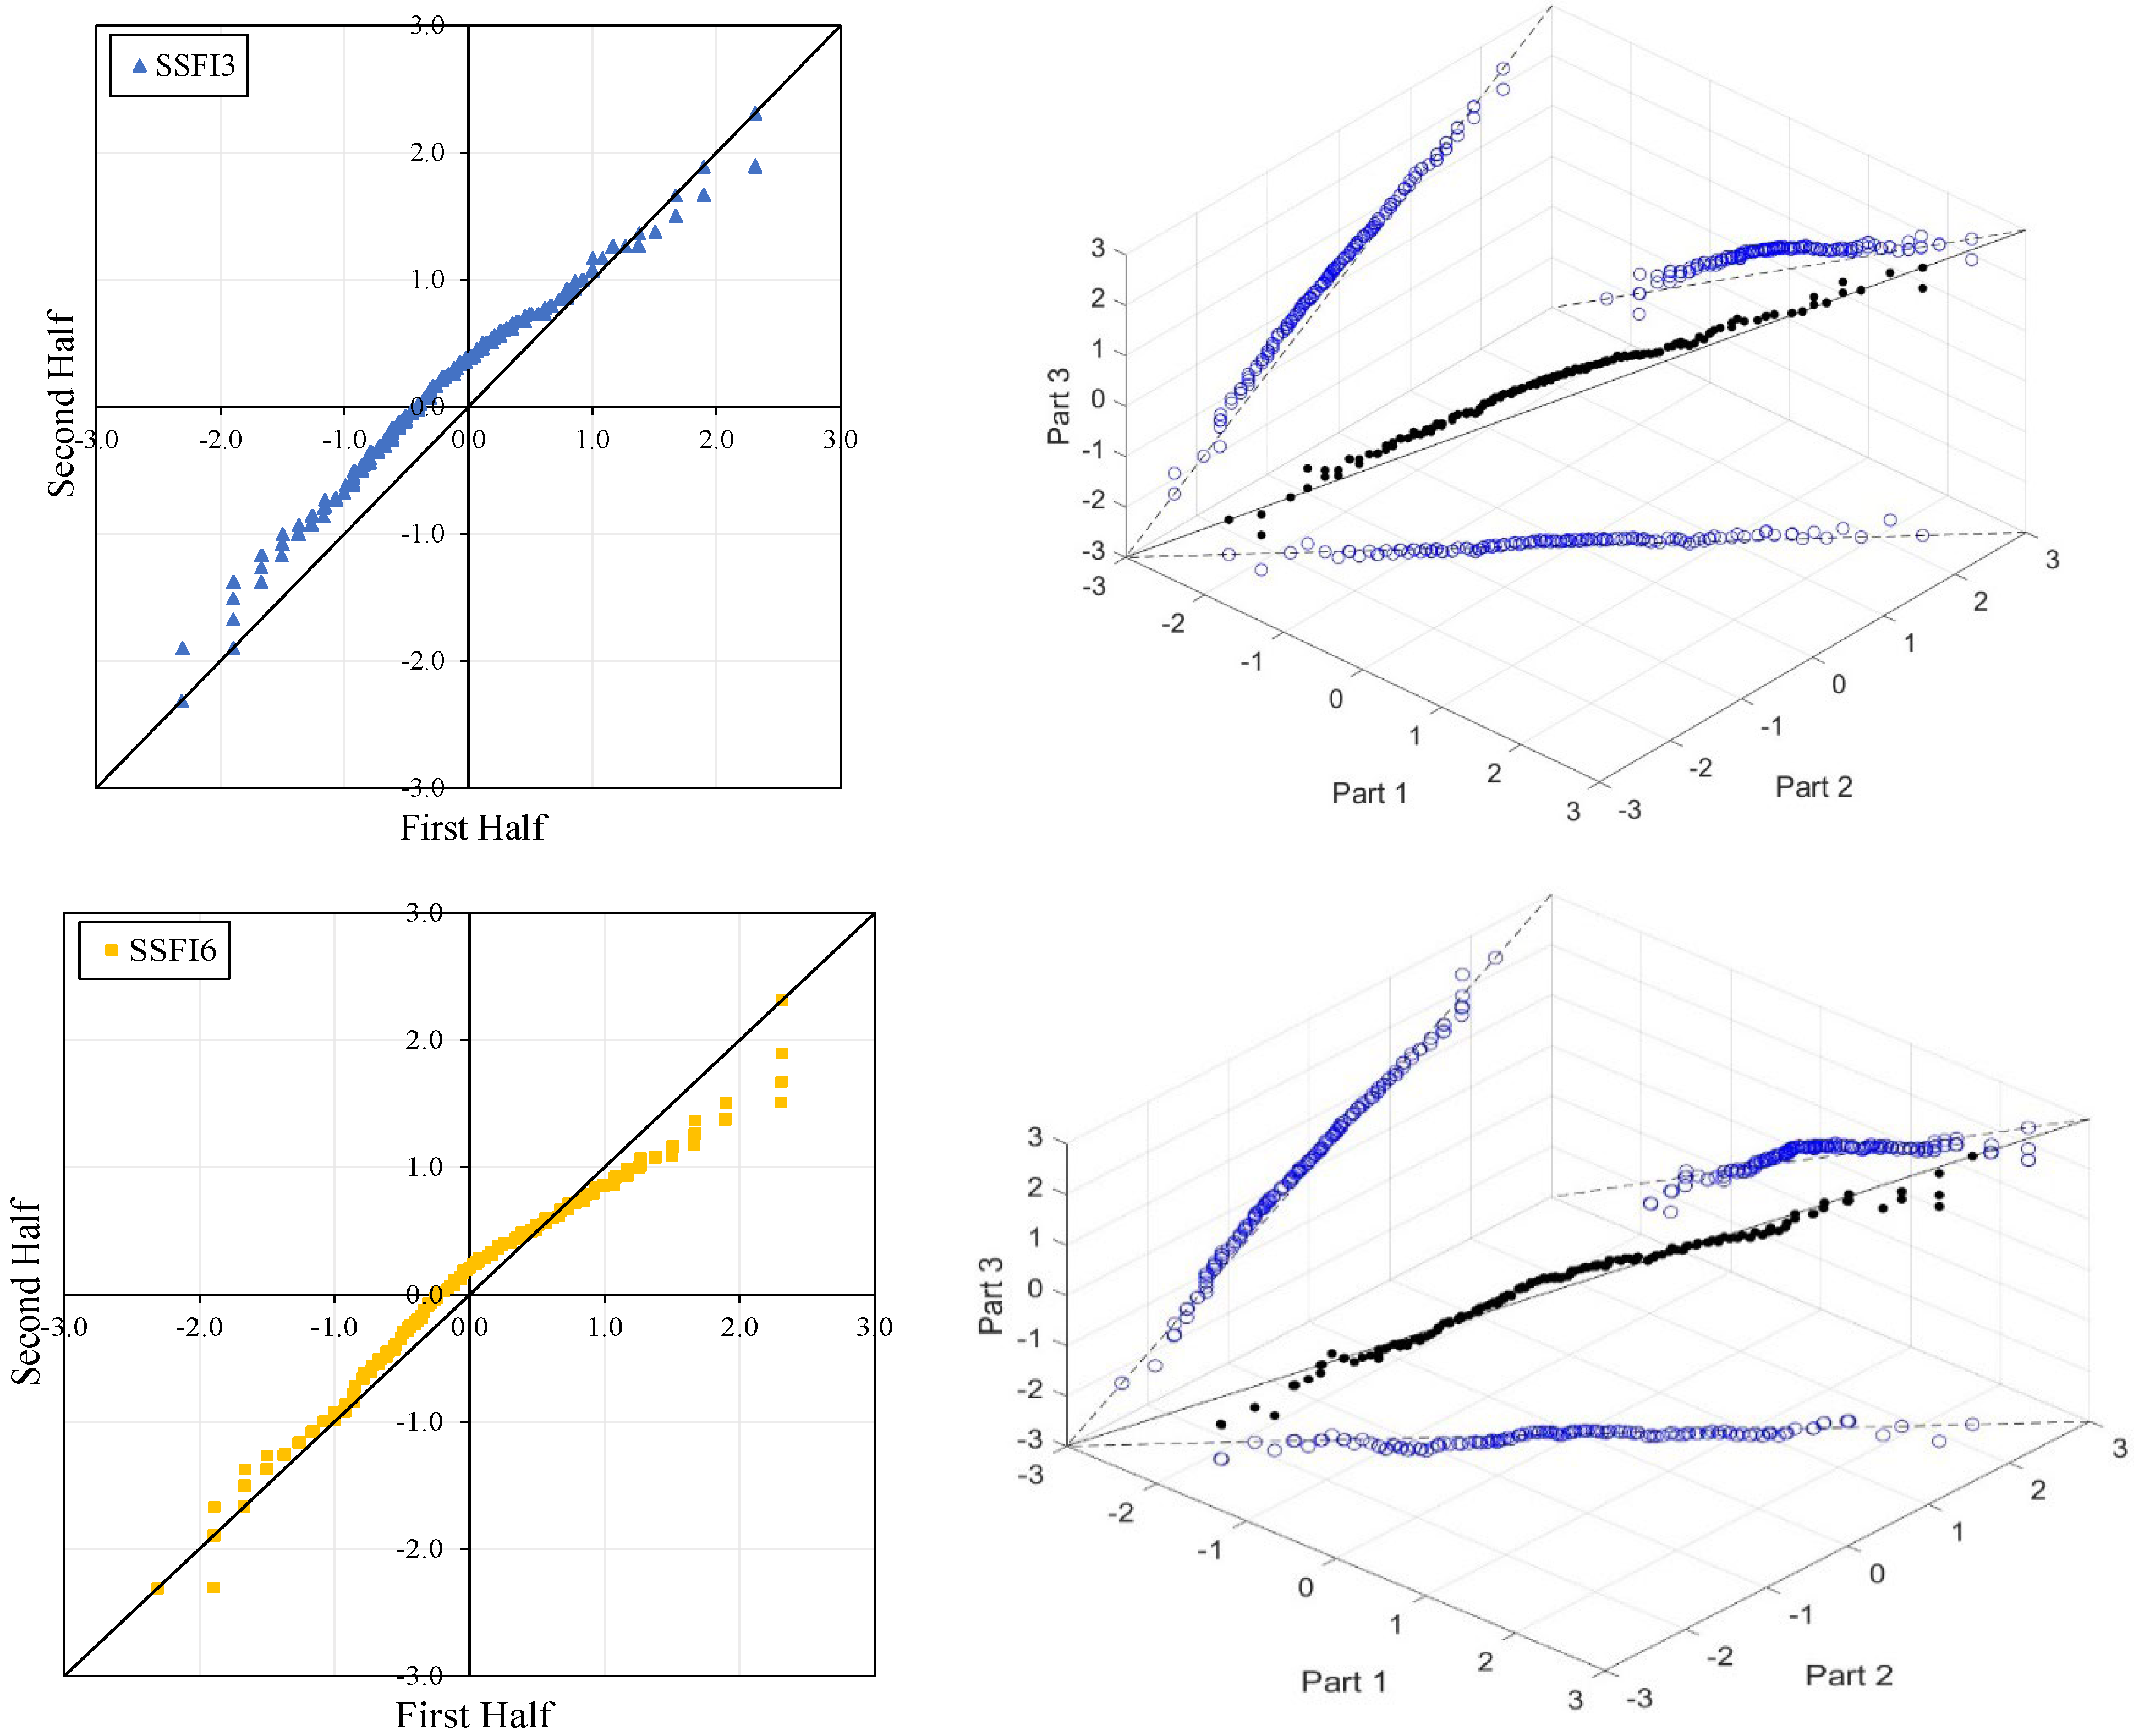
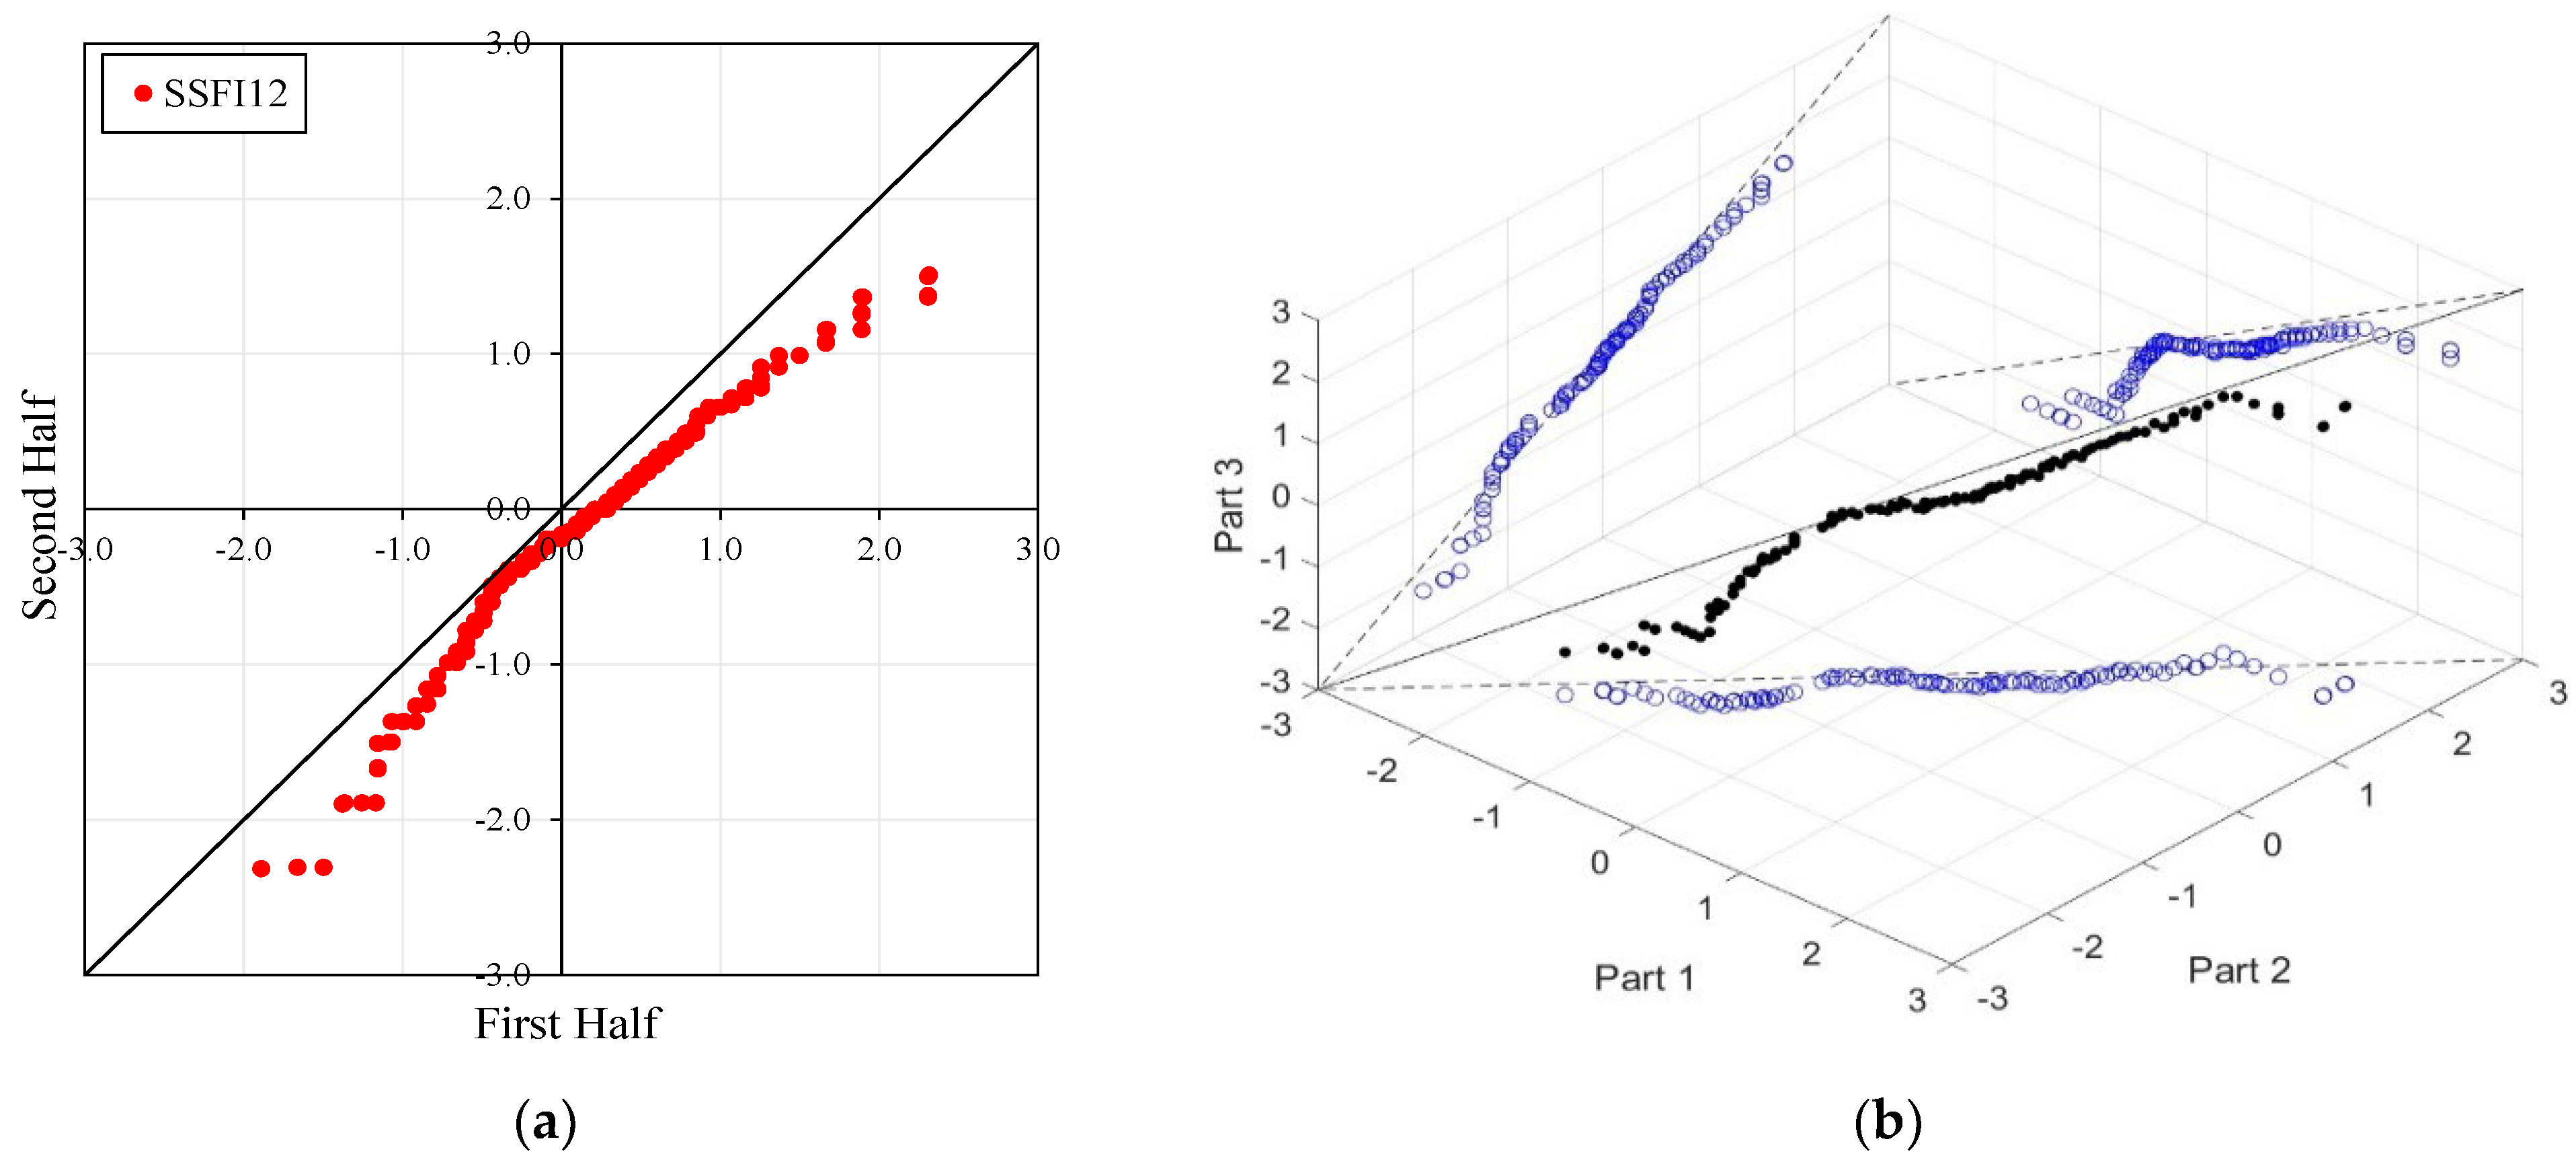
Figure 4, Figure 5, Figure 6 and Figure 7 illustrate the ITA and 3D-ITA graphs for short-, medium-, and long-term droughts as indicated by the SSFI at stations D21A001, E21A022, E21A035, and E21A051. The first column presents ITA graphs with monthly time scales ranging from 3 months to 12 months, while the subsequent columns display the corresponding 3D-ITA graphs for the same intervals. Similarly, Table 4, Table 5, Table 6 and Table 7 provide the results of the WT and the Triple WT for various time scales.
In the ITA and classical WT analyses, the data is divided into two halves: the first half spans 27 years from 1967 to 1993, and the second half covers the period from 1994 to 2020. For the 3D-ITA and Triple WT analyses, the data is divided into three periods: the first period covers 18 years from 1967 to 1984, the second period spans 1985 to 2002, and the third period includes 2003 to 2020. As in the ITA applications, these halves and periods are arranged in ascending order.
When comparing all figures in the ITA and 3D-ITA, as the monthly time scale increases (from 3 months to 12 months), the trend differences between extreme conditions (from extreme drought to extreme wet) notably decrease across all stations. These results are also supported by the WT.
According to ITA applications, the short-, medium-, and long-term drought indices for station E21A035 exhibit significantly decreasing trends in both ITA and 3D-ITA analyses. The 3D-ITA results particularly highlight the stability of these trends, demonstrating consistency across different periods of the data (from the first to the second part and the second to the third part). Conversely, the decreasing trend of the SSFI indices (ED, SD, and MD, see Table 2) at lower values indicates an increasing trend in drought across various time scales. These findings are corroborated by the WT and Triple WT at a 1% significance level; the WT yielded Z w values of −8.037, −7.274, and −6.438 for station E21A035 across increasing time scales. Similarly, the Triple WT results closely matched those of the classical WT, indicating strong trends in the short-, medium-, and long-term drought indices. Overall, while the ITA and WT produced comparable results, the 3D-ITA and the proposed Triple WT are particularly effective in reflecting the stability or instability of trends in drought indices.
The stations D21A001, E21A022, and E21A051 exhibit unstable trends, as demonstrated by the 3D-ITA results (Figure 4, Figure 5 and Figure 7) and Triple WT (Table 5, Table 6 and Table 7), which reveal different trend conditions across various time segments. The SSFI indices for station D21A001 display a monotonic decreasing trend according to the classical ITA (Figure 4). This trend becomes even more pronounced as the time scale increases. Similarly, in 3D-ITA, the trend change within the same segment for different time scales becomes more noticeable, mirroring the WT results.
In Table 4, while the SSFI3 data shows no trend ( Z w = −1.037) at the 10% significance level, SSFI6 and SSFI12 exhibit decreasing trends at the 10% and 1% significance levels, respectively. Furthermore, the Triple WT also confirms the instability of these trends. For SSFI3, there is an increasing trend ( Z w = 2.681) from the first to the second part and a decreasing trend ( Z w = −3.046) from the second to the third part at the 1% significance level. Similarly, SSFI6 shows an increasing trend ( Z w = 2.247) from the first to the second part at the 5% significance level and a decreasing trend ( Z w = −3.762) from the second to the third part at the 1% significance level. Finally, SSFI12 implies no trend ( Z w = 0.788) from the first to the second part at the 10% significance level and a decreasing trend ( Z w = −3.884) from the second to the third part at the 1% significance level.
Low values corresponding to extreme drought, severe drought, and moderate drought (ED, SD, and MD) display an increasing trend for SSFI3 and SSFI6 compared to the classical ITA, but almost no trend for SSFI12. This is particularly evident between the second and third segments in 3D-ITA, where the values exhibit a decreasing trend from the second part to the third part. Consequently, non-monotonic trend types are revealed across all segments and time scales.
Stations E21A022, SSFI3, SSFI6, and SSFI12 exhibit non-monotonic trends according to the ITA method. Additionally, a break around SSFI = 1 is observed in all ITA graphs, and they become more pronounced as the time scale increases. While there is no trend for SSFI values greater than 1 for SSFI3 and SSFI6, a decreasing trend is observed for SSFI12. According to the 3D-ITA results, a generally non-monotonic trend is observed, except for the trend between the second and third periods, where these indices show no trend from the second part to the third part. Although these results generally align with the WT and Triple WT, some differences are noticeable. The trend instability is confirmed with the Triple WT, which shows almost no trend from the first part to the second part and from the second part to the third part across different time scales of SSFI, except for a decreasing trend from the second part to the third part in SSFI12. This is similar to the classical WT results presented in Table 4. While SSFI3 data show a decreasing trend ( Z w = −2.214) at the 5% significance level, SSFI6 and SSFI12 also exhibit decreasing trends ( Z w = −3.176 and Z w = −4.663, respectively) at the 1% significance level.
However, at the 12-month time scale (SSFI12), a distinct trend becomes evident. Surprisingly, at station E21A051, the trend shifts as one moves from a 3-month to a 12-month time scale. There is also an increase in the number of data points showing negative differences during drought periods (ED, SD, and MD), despite extreme drought having only a limited dataset. Additionally, minor fluctuations are observable in these trends, leading to their classification as either increasing or decreasing forms. According to classical ITA results, although there is a monotonically decreasing trend for SSFI3, non-monotonic decreasing trends are observed for other time scales. Considering the instability of trends in 3D-ITA, no trend conditions are observable in many segments across different time scales. However, as the SSFI time scales increase, it can be inferred that trends become more stable. According to the Triple WT results, the SSFI results are dominantly different for SSFI3, SSFI6, and SSFI12. Specifically, SSFI3 shows no trend ( Z w = 0.270) from the first to the second part at the 10% significance level, and an increasing trend ( Z w = 2.531) from the second to the third part at the 5% significance level. For SSFI6, no trend is observed across different segments. Finally, for SSFI12, there are decreasing trends from the first to the second part and no trend from the second to the third part, both at the 10% significance level.
In brief, across all stations, as monthly time scales increase from 3 months to 12 months, trend differences between extreme drought conditions (ED to EW) decrease, as supported by both ITA comparisons and statistical tests. E21A035 consistently shows a significantly decreasing trend across various time segments in ITA and 3D-ITA analyses, corroborated by strong WT results. Conversely, stations D21A001, E21A022, and E21A051 exhibit unstable trends across different time segments, with notable variations observed in SSFI indices confirmed by the Triple WT. Overall, while classical ITA and WTs yield comparable results, 3D-ITA and Triple WTs effectively demonstrate trend stability or instability across diverse time scales and periods, providing valuable insights into drought dynamics at the studied stations.
Hydrological drought can largely be considered as a consequence of meteorological droughts [1]. Due to the impacts of hydrological drought signals, closely monitoring the temporal trends of drought is critical for the planning and management of water resources. There is no comprehensive study covering detailed drought index trends in the Euphrates Basin, which is vital for Türkiye’s water potential. However, fragmented studies have indicated that the drought indices in the region generally show a decreasing trend across all time scales [51,52,53]. The hydrological drought interpolation maps prepared by Boloorani et al. [51] demonstrate that extreme, severe, and moderate droughts prevail throughout the entire Euphrates Basin. Katipoğlu and Acar [54] evaluated the meteorological drought indices of 2014 and the hydrological droughts of 2001 in the Euphrates Basin, finding that severe and extreme droughts covered a large area of the basin.
As the view that climate variability has lost its homogeneity due to climate change has become widespread, researchers have increasingly applied non-parametric methods [35]. In this context, the ITA method has been used to identify trends in drought time series and compared with traditional methods, especially the Mann–Kendall Test [55,56]. The ITA has different applications in the open literature [25,57,58,59,60,61,62]. It is noticed that there are not enough studies on the stability of drought trends in the literature. [30] used the WT to show numerically for the first time whether the distributions of two variables are the same. In this way, it was possible to obtain numerical trend values and graphical representation. In this study, a comprehensive comparison of the stability and variability of drought trends is made using ITA, 3D-ITA, WT [29], and Triple WT. This comprehensive comparison highlights the effectiveness of these methods in analyzing drought trends.
Finally, these findings are crucial for understanding the spatial and temporal distributions of hydrological droughts and their potential impacts on water management. In this context, stable/unstable trends of hydrological drought in the Euphrates Basin provide valuable information for the region’s water resources management and sustainable development strategies. However, future research is essential to assess whether these trends persist and to evaluate the effectiveness of drought management strategies.
4. Conclusions

This study presents a thorough evaluation of drought trend stability using three-dimensional innovative trend analysis (3D-ITA) and the newly proposed triple Wilcoxon signed-rank test (Triple WT) across four monitoring stations in the Euphrates Basin. The results demonstrate considerable variability in drought trend stability among different stations, with a consistent decline in trends observed at station E21A035, indicating increased vulnerability to extended drought periods in these sub-regions. These stable trends are confirmed through both ITA and 3D-ITA methodologies, as well as by significant statistical evidence from the WT and Triple WT analyses.
While these results are consistent with prior studies on the Euphrates Basin, the application of 3D-ITA and Triple WT has provided a more nuanced perspective on trend stability, revealing instabilities that traditional methods may not capture. Notably, stations D21A001, E21A022, and E21A051 exhibit unstable trends with considerable variability and non-monotonic behaviors, particularly across different time scales.
The methodologies applied in this study, particularly 3D-ITA and Triple WT, offer significant adaptability and could be effectively utilized in other regions with comparable climatic conditions. The insights derived from this research are instrumental in informing water management strategies for semi-arid areas, and future research could expand these findings to other geographical contexts, thereby enhancing the applicability of trend analysis in hydrological studies.

Author Contributions

Conceptualization, İ.H.D., E.K. and Y.S.G.; methodology, E.K., Y.S.G., R.İ.T. and B.B.; formal analysis, İ.H.D.; investigation, İ.H.D.; resources, B.B.; writing—original draft preparation, E.K.; writing—review and editing, İ.H.D., E.K., Y.S.G. and R.İ.T.; supervision, R.İ.T. All authors have read and agreed to the published version of the manuscript.

Funding

This research received no external funding.

Data Availability Statement

All data used in this study are available upon request.

Acknowledgments

The authors would like to thank the State Hydraulic Works (DSI) in Türkiye for providing the data.

Conflicts of Interest

The authors declare no conflicts of interest.

References

  1. Van Loon, A.F. Hydrological drought explained. Wiley Interdiscip. Rev. Water 2015, 2, 359–392. [Google Scholar] [CrossRef]
  2. Oñate-Valdivieso, F.; Uchuari, V.; Oñate-Paladines, A. Large-scale climate variability patterns and drought: A case of study in South-America. Water. Resour. Manag. 2020, 34, 2061–2079. [Google Scholar] [CrossRef]
  3. Mishra, A.K.; Singh, V.P. A review of drought concepts. J. Hydrol. 2010, 391, 202–216. [Google Scholar] [CrossRef]
  4. Huntington, T.G. Evidence for intensification of the global water cycle: Review and synthesis. J. Hydrol. 2006, 319, 83–95. [Google Scholar] [CrossRef]
  5. IPCC. Climate Change 2007: The Physical Science Basis: Contribution of Working Group I to the Fourth Assessment Report of the Intergovernmental Panel on Climate Change; Solomon, S., Qin, D., Manning, M., Chen, Z., Marquis, M., Averyt, K.B., Tignor, M., Miller, H.L., Eds.; Cambridge University Press: Cambridge, UK; New York, NY, USA, 2007; 996p. [Google Scholar]
  6. Strzepek, K.; Yohe, G.; Neumann, J.; Boehlert, B. Characterizing changes in drought risk for the United States from climate change. Environ. Res. Lett. 2010, 5, 044012. [Google Scholar] [CrossRef]
  7. Cai, W.; Purich, A.; Cowan, T.; van Rensch, P.; Weller, E. Did climate change–induced rainfall trends contribute to the Australian Millennium Drought? J. Clim. 2014, 27, 3145–3168. [Google Scholar] [CrossRef]
  8. Haile, G.G.; Tang, Q.; Hosseini-Moghari, S.; Liu, X.; Gebremicael, T.G.; Leng, G.; Kebede, A.; Xu, X.; Yun, X. Projected impacts of climate change on drought patterns over East Africa. Earth’s Future 2020, 8, e2020EF001502. [Google Scholar] [CrossRef]
  9. Philip, S.Y.; Kew, S.F.; Van Der Wiel, K.; Wanders, N.; Van Oldenborgh, G.J. Regional differentiation in climate change induced drought trends in the Netherlands. Environ. Res. Lett. 2020, 15, 094081. [Google Scholar] [CrossRef]
  10. Qiu, J.; Shen, Z.; Xie, H. Drought impacts on hydrology and water quality under climate change. Sci. Total Environ. 2023, 858, 159854. [Google Scholar] [CrossRef]
  11. Abu Arra, A.; Birpınar, M.E.; Gazioğlu, S.A.; Şişman, E. Critical Drought Characteristics: A New Concept Based on Dynamic Time Period Scenarios. Atmosphere 2024, 15, 768. [Google Scholar] [CrossRef]
  12. Wang, G.; Liu, S.; Liu, T.; Fu, Z.; Yu, J.; Xue, B. Modelling above-ground biomass based on vegetation indexes: A modified approach for biomass estimation in semi-arid grasslands. Int. J. Remote Sens. 2018, 40, 3835–3854. [Google Scholar] [CrossRef]
  13. Woldesenbet, T.A.; Elagib, N.A.; Ribbe, L.; Heinrich, J. Catchment response to climate and land use changes in the Upper Blue Nile sub-basins. Ethiopia 2018, 644, 193–206. [Google Scholar] [CrossRef] [PubMed]
  14. Fang, Q.; Wang, G.; Liu, T.; Xue, B.-L.; Yinglan, A. Controls of carbon flux in a semiarid grassland ecosystem experiencing wetland loss: Vegetation patterns and environmental variables. Agric. For. Meteorol. 2018, 259, 196–210. [Google Scholar] [CrossRef]
  15. Wang, Y.; Yang, J.; Chang, J.; Zhang, R. Assessing the drought mitigation ability of the reservoir in the downstream of the Yellow River. Sci. Total Environ. 2019, 646, 1327–1335. [Google Scholar] [CrossRef]
  16. Ahmadalipour, A.; Moradkhani, H.; Castelletti, A.; Magliocca, N. Future drought risk in Africa: Integrating vulnerability, climate change, and population growth. Sci. Total Environ. 2019, 662, 672–686. [Google Scholar] [CrossRef]
  17. Zargar, A.; Sadiq, R.; Naser, B.; Khan, F.I. A review of drought indices. Environ. Rev. 2011, 19, 333–349. [Google Scholar] [CrossRef]
  18. Abu Arra, A.; Şişman, E. Innovative Drought Classification Matrix and Acceptable Time Period for Temporal Drought Evaluation. Water. Resour. Manag. 2024, 38, 2811–2833. [Google Scholar] [CrossRef]
  19. Xiao, L.; Chen, X.; Zhang, R.; Zhang, Z. Spatiotemporal evolution of droughts and their teleconnections with large-scale climate indices over Guizhou province in southwest China. Water 2019, 11, 2104. [Google Scholar] [CrossRef]
  20. Svoboda, M.D.; Fuchs, B.A. Handbook of Drought Indicators and Indices; World Meteorological Organization: Geneva, Switzerland, 2016; Volume 2. [Google Scholar]
  21. Shafer, B.A.; Dezman, L.E. Development of a surface water supply index (SWSI) to assess the severity of drought conditions in snowpack runoff areas. In Proceedings of the Western Snow Conference, Colorado State University, Fort Collins, CO, USA, 19–23 April 1982; pp. 164–175. [Google Scholar]
  22. Karl, T.R. The sensitivity of the Palmer drought severity index and Palmer’s Z index to their calibration coefficients including potential evapotranspiration. J. Appl. Meteorol. Climatol. 1986, 25, 77–86. [Google Scholar] [CrossRef]
  23. Shukla, S.; Wood, A. Use of a standardized runoff index for characterizing hydrologic drought. Geophys. Res. Lett. 2008, 35, L02405. [Google Scholar] [CrossRef]
  24. Nalbantis, I.; Tsakiris, G. Assessment of hydrological drought revisited. Water Resour. Manag. 2009, 23, 881–897. [Google Scholar] [CrossRef]
  25. Dabanlı, İ.; Şen, Z.; Yeleğen, M.Ö.; Şişman, E.; Selek, B.; Güçlü, Y.S. Trend assessment by the innovative-Şen method. Water Resour. Manag. 2016, 30, 5193–5203. [Google Scholar] [CrossRef]
  26. Yue, S.; Pilon, P.; Cavadias, G. Power of the Mann–Kendall and Spearman’s rho tests for detecting monotonic trends in hydrological series. J. Hydrol. 2002, 259, 254–271. [Google Scholar] [CrossRef]
  27. Shadmani, M.; Marofi, S.; Roknian, M. Trend analysis in reference evapotranspiration using Mann-Kendall and Spearman’s Rho tests in arid regions of Iran. Water Resour. Manag. 2012, 26, 211–224. [Google Scholar] [CrossRef]
  28. Chen, Y.; Guan, Y.; Shao, G.; Zhang, D. Investigating trends in streamflow and precipitation in Huangfuchuan Basin with wavelet analysis and the Mann-Kendall test. Water 2016, 8, 77. [Google Scholar] [CrossRef]
  29. Wilcoxon, F. Individual comparisons by ranking methods. Biom. Bull. 1945, 1, 80–83. [Google Scholar] [CrossRef]
  30. Saplıoğlu, K.; Güçlü, Y.S. Combination of Wilcoxon test and scatter diagram for trend analysis of hydrological data. J. Hydrol. 2022, 612, 128132. [Google Scholar] [CrossRef]
  31. Şen, Z. Innovative trend analysis methodology. J. Hydrol. Eng. 2012, 17, 1042–1046. [Google Scholar] [CrossRef]
  32. Phuong, D.N.D.; Tram, V.N.Q.; Nhat, T.T.; Ly, T.D.; Loi, N.K. Hydro-meteorological trend analysis using the Mann-Kendall and innovative-Şen methodologies: A case study. Int. J. Glob. Warm. 2020, 20, 145–164. [Google Scholar] [CrossRef]
  33. Gumus, V.; Dinsever, L.D.; Avsaroglu, Y. Analysis of drought characteristics and trends during 1965–2020 in the Tigris River basin, Turkey. Theor. Appl. Climatol. 2023, 151, 1871–1887. [Google Scholar] [CrossRef]
  34. Alashan, S.; Abu Arra, A.; Şişman, E. Standardized Innovative Polygon Trend Analysis for Climate Change Assessment (S-IPTA). Pure Appl. Geophys. 2024, 181, 2277–2295. [Google Scholar] [CrossRef]
  35. Kesgin, E.; Yaldız, S.G.; Güçlü, Y.S. Spatiotemporal variability and trends of droughts in the Mediterranean coastal region of Türkiye. Int. J. Climatol. 2024, 44, 1036–1057. [Google Scholar] [CrossRef]
  36. Güçlü, Y.S. Trend stability identification by three-dimensional model. Model. Earth Syst. Environ. 2022, 8, 4333–4340. [Google Scholar] [CrossRef]
  37. Bozkurt, D.; Şen, O.L. Climate change impacts in the Euphrates-Tigris Basin based on different model and scenario simulations. J. Hydrol. 2013, 480, 149–161. [Google Scholar] [CrossRef]
  38. Al-Ansari, N. Hydro-politics of the Tigris and Euphrates Basins. Engineering 2016, 8, 140–172. [Google Scholar] [CrossRef]
  39. Gumus, V.; Avsaroglu, Y.; Simsek, O. Streamflow trends in the Tigris river basin using Mann−Kendall and innovative trend analysis methods. J. Earth Syst. Sci. 2022, 131, 34. [Google Scholar] [CrossRef]
  40. Hamilton, A.S.; Moore, R.D. Quantifying uncertainty in streamflow records. Can. Water Resour. J. 2012, 37, 3–21. [Google Scholar] [CrossRef]
  41. World Meteorological Organization (WMO). The Role of Climatological Normals in a Changing Climate; Baddour, O., Kontongomde, H., Eds.; World Climate Data and Monitoring Programme (WCDMP), World Meteorological Organization 46; WMO: Geneva, Switzerland, 2007. [Google Scholar]
  42. Swed, F.S.; Eisenhart, C. Tables for testing randomness of grouping in a sequence of alternatives. Ann. Math. Stat. 1943, 14, 66–87. [Google Scholar] [CrossRef]
  43. Smakhtin, V.U. Low flow hydrology. J. Hydrol. 2001, 240, 147–186. [Google Scholar] [CrossRef]
  44. Modarres, R. Streamflow drought time series forecasting. Stoch. Environ. Res. Risk Assess. 2007, 21, 223–233. [Google Scholar] [CrossRef]
  45. World Meteorological Organization (WMO); Global Water Partnership (GWP). Drought Indicators and Indices; Integrated Drought Management Programme (IDMP), Integrated Drought Management Tools and Guidelines Series 2; WMO: Geneva, Switzerland, 2016. [Google Scholar]
  46. Van Oel, P.R.; Martins, E.S.P.R.; Costa, A.C. The effect of reservoir networks on drought propagation. Eur. Water 2017, 60, 287–292. [Google Scholar]
  47. Lee, H.; Kang, K. Interpolation of missing precipitation data using kernel estimations for hydrologic modeling. Adv. Meteorol. 2015, 2015, 935868. [Google Scholar] [CrossRef]
  48. Karagoz, Y. SPSS-AMOS-META Applied Statistical Analysis; Nobel: Ankara, Türkiye, 2019. (In Turkish) [Google Scholar]
  49. Dinpashoh, Y.; Jhajharia, D.; Fakheri-Fard, A.; Singh, V.P.; Kahya, E. Trends in reference crop evapotranspiration over Iran. J. Hydrol. 2011, 399, 422–433. [Google Scholar] [CrossRef]
  50. Rahman, M.A.; Yunsheng, L.; Sultana, N. Analysis and prediction of rainfall trends over Bangladesh using Mann–Kendall, Spearman’s rho tests and ARIMA model. Meteorog Atmos. Phys. 2017, 129, 409–424. [Google Scholar] [CrossRef]
  51. Boloorani, A.D.; Soleimani, M.; Papi, R.; Nasiri, N.; Samany, N.N.; Mirzaei, S.; Al-Hemoud, A. Assessing the role of drought in dust storm formation in the Tigris and Euphrates basin. Sci. Total Environ. 2024, 921, 171193. [Google Scholar] [CrossRef]
  52. Esit, M.; Çelik, R.; Akbaş, E. Long-term meteorological and hydrological drought characteristics on the lower Tigris-Euphrates basin, Türkiye: Relation, impact and trend. Environ. Earth Sci. 2023, 82, 491. [Google Scholar] [CrossRef]
  53. Katipoğlu, O.M.; Acar, R. Space-time variations of hydrological drought severities and trends in the semi-arid Euphrates Basin, Turkey. Stoch. Environ. Res. Risk Assess. 2022, 36, 4017–4040. [Google Scholar] [CrossRef]
  54. Katipoğlu, O.M.; Acar, R. Determination of meteorological and hydrological drought maps with various interpolation methods in the Euphrates Basin. J. Nat. Hazards Environ. 2021, 7, 298–317. [Google Scholar] [CrossRef]
  55. Mann, H.B. Nonparametric tests against trend. Econometrica 1945, 13, 245–259. [Google Scholar] [CrossRef]
  56. Kendall, M.G. Rank Correlation Method; Charless Griffin: London, UK, 1975. [Google Scholar]
  57. Berhail, S.; Tourki, M.; Merrouche, I.; Bendekiche, H. Geostatistical assessment of meteorological drought in the context of climate change: Case of the Macta basin (northwest of Algeria). Model. Earth Syst. Environ. 2021, 8, 81–101. [Google Scholar] [CrossRef]
  58. Elouissi, A.; Benzater, B.; Dabanli, I.; Habi, M.; Harizia, A.; Hamimed, A. Drought investigation and trend assessment in Macta watershed (Algeria) by SPI and ITA methodology. Arab. J. Geosci. 2021, 14, 1329. [Google Scholar] [CrossRef]
  59. Şen, Z. Trend identification simulation and application. J. Hydrol. Eng. 2014, 19, 635–642. [Google Scholar] [CrossRef]
  60. Şen, Z. Innovative trend significance test and applications. Theor. Appl. Climatol. 2017, 127, 939–947. [Google Scholar] [CrossRef]
  61. Şen, Z. Innovative Trend Methodologies in Science and Engineering; Springer: Heidelberg, Germany, 2017. [Google Scholar] [CrossRef]
  62. Alashan, S. An improved version of innovative trend analyses. Arab. J. Geosci. 2018, 11, 50. [Google Scholar] [CrossRef]
Figure 1. Geographical location of the study area.
Water 16 02823 g001
Figure 2. Trend conditions according to Şen’s ITA [30].
Water 16 02823 g002
Figure 3. Sample trend identification by 3D-ITA model.
Water 16 02823 g003
Figure 4. ITA and 3D-ITA results for the D21A001 station. (a) While the first column presents ITA charts ranging from 3 months to 12 months, here the data is divided into two halves: the first half covers 27 years from 1967 to 1993, and the second half covers the period from 1994 to 2020. In the analysis, in the second column, the (b) 3D-ITA (same time intervals from 3 to 12 months) the data are divided into three periods: the first period covers the 18 years between 1967 and 1984; the second period covers 1985–2002; and the third period covers the years 2003–2020.
Water 16 02823 g004aWater 16 02823 g004b
Figure 5. ITA and 3D-ITA results for the E21A022 station. (a) While the first column presents ITA charts ranging from 3 months to 12 months, here the data is divided into two halves: the first half covers 27 years from 1967 to 1993, and the second half covers the period from 1994 to 2020. In the analysis, in the second column, the (b) 3D-ITA (same time intervals from 3 to 12 months) the data are divided into three periods: the first period covers the 18 years between 1967 and 1984; the second period covers 1985–2002; and the third period covers the years 2003–2020.
Water 16 02823 g005aWater 16 02823 g005b
Figure 6. ITA and 3D-ITA results for the E21A035 station. (a) While the first column presents ITA charts ranging from 3 months to 12 months, here the data is divided into two halves: the first half covers 27 years from 1967 to 1993, and the second half covers the period from 1994 to 2020. In the analysis, in the second column, the (b) 3D-ITA (same time intervals from 3 to 12 months) the data are divided into three periods: the first period covers the 18 years between 1967 and 1984; the second period covers 1985–2002; and the third period covers the years 2003–2020.
Water 16 02823 g006aWater 16 02823 g006b
Figure 7. ITA and 3D-ITA results for the E21A051 station. (a) While the first column presents ITA charts ranging from 3 months to 12 months, here the data is divided into two halves: the first half covers 27 years from 1967 to 1993, and the second half covers the period from 1994 to 2020. In the analysis, in the second column, the (b) 3D-ITA (same time intervals from 3 to 12 months) the data are divided into three periods: the first period covers the 18 years between 1967 and 1984; and the second period covers 1985–2002; and the third period covers the years 2003–2020.
Water 16 02823 g007aWater 16 02823 g007b
Table 1. Gauging stations and features.
No.Station No.Lat. (N)Long. (E)Altitude (m)Drainage Area (km2)Recording Period
1D21A00140°6′29″41°23′8″1830233.21967–2020
2E21A02239°32′19″42°46′49″15525882.41967–2020
3E21A03537°59′38″38°14′13″1252154.81967–2020
4E21A05139°34′45″40°10′5″13558185.61967–2020
Table 2. Drought classification is based on SSFI values [44].
SSFI ValueClassification
20.0 +extremely wet (EW)
1.5 to 1.99very wet (VW)
1.0 to 1.49moderately wet (MW)
−0.99 to 0.99near normal (NN)
−1.0 to −1.49moderately dry (MD)
−1.5 to −1.99severely dry (SD)
−2.0 and lessextremely dry (ED)
Table 3. Monthly results of runs homogeneity test.
MonthSignificance Levels (%) According to Cal. Zr for Homogeneity
Station
D21A001E21A022E21A035E21A051
Jan58.90.658.31.3
Feb99.016.999.01.3
Mar58.341.027.258.3
Apr41.041.09.99.9
May58.341.099.058.3
Jun58.378.358.399.0
Jul58.316.99.95.4
Aug27.216.90.60.1
Sep58.39.90.158.3
Oct16.92.80.11.3
Nov27.258.399.041.0
Dec99.05.458.30.3
Table 4. The WT results for different time intervals of SSFI.
StationFirst–Second Halves (SSFI3)First–Second Halves (SSFI6)First–Second Halves (SSFI12)
ZWTrendSig. Levels (%)ZWTrendSig. Levels (%)ZWTrendSig. Levels (%)
D21A001−1.037No>10−1.891-10−2.714-1
E21A022−2.214-5−3.176-1−4.663-1
E21A035−8.037-1−7.274-1−6.438-1
E21A0513.934+10.362No>10−4.344-1
Table 5. Triple WT results for SSFI3.
StationPart 1–Part 2 (SSFI3)Part 2–Part 3 (SSFI3)
ZWTrendSig. Levels (%)ZWTrendSig. Levels (%)
D21A0012.681+1−3.046-1
E21A0221.074No>10−0.237No>10
E21A035−1.703-10−7.050-1
E21A0510.270No>102.531+5
Table 6. Triple WT results for SSFI6.
StationPart 1–Part 2 (SSFI6)Part 2–Part 3 (SSFI6)
ZWTrendSig. Levels (%)ZWTrendSig. Levels (%)
D21A0012.247+5−3.762-1
E21A0220.809No>10−0.780No>10
E21A035−1.663-10−6.824 1
E21A051−0.824No>101.167No>10
Table 7. Triple WT results for SSFI12.
StationPart 1–Part 2 (SSFI12)Part 2–Part 3 (SSFI12)
ZWTrendSig. Levels (%)ZWTrendSig. Levels (%)
D21A0010.788No>10−3.884-1
E21A022−0.341No>10−2.526-1
E21A035−2.588-1−6.803-1
E21A051−1.645-10−1.001No>10
Disclaimer/Publisher’s Note: The statements, opinions and data contained in all publications are solely those of the individual author(s) and contributor(s) and not of MDPI and/or the editor(s). MDPI and/or the editor(s) disclaim responsibility for any injury to people or property resulting from any ideas, methods, instructions or products referred to in the content.