Article

Low Strength Wastewater Treatment Using a Combined Biological Aerated Filter/Anammox Process

by
Wanying Xie
1,2,
Ji Li
2,
Tao Song
2,
Yong Li
2,
Zhenlin Wang
2 and
Xiaolei Zhang
2,*
1
College of Civil Engineering and Architecture, Xinjiang University, Urumqi 830017, China
2
School of Civil and Environmental Engineering, Harbin Institute of Technology (Shenzhen), Shenzhen 518000, China
*
Author to whom correspondence should be addressed.
Water 2024, 16(19), 2821; https://doi.org/10.3390/w16192821
Submission received: 27 August 2024 / Revised: 30 September 2024 / Accepted: 1 October 2024 / Published: 4 October 2024
(This article belongs to the Special Issue Advances in Biological Technologies for Wastewater Treatment)

Abstract

:
To achieve the in situ capacity expansion of the post-denitrification biological aerated filter (BAF-DN), the integration of BAF with the anammox process (BAF/AX) was proposed. With the objective of maximizing retaining ammonia nitrogen, the operational optimization of BAF was achieved by two distinct strategies. The treatment performance of BAF demonstrated that the removal efficiencies of chemical oxygen demand (COD) and ammonia nitrogen ( NH 4 + - N ) was 66.3~67.3% and 4~12%, respectively, under conditions of low aeration intensity (0.4 m3·m−2·h−1) or a shortened empty bed residence time (EBRT) of 30 min. Residual NH 4 + - N in the BAF effluent served as the ammonia substrate for the subsequent anammox process, which was successfully launched by using ceramic particles and sponges as carriers. Notably, the sponge carrier facilitated a shorter start-up period of 41 to 44 days. Furthermore, the sponge-based anammox reactor exhibited a superior NH 4 + - N removal capacity (≥85.7%), under operations of a shorter EBRT of 40 min, low influent NH 4 + - N concentrations (≤30 mg/L), and COD levels of ≤67 mg/L. In addition, a comprehensive evaluation of the BAF/AX process was conducted, which considered performance, cost-effectiveness, and engineering feasibility. The performance results illustrated that the effluent quality met the standard well (with a COD level of ≤ 50 mg/L, and a TN of ≤3.1~10.5 mg/L). Following a comparison against the low aeration intensity operation, it was recommended to operate BAF at a low EBRT within the BAF/AX process. Consequently, the treated volume was double the volume of the standalone BAF-DN, synchronously achieving low costs (0.413 yuan/m3).

1. Introduction

The increased supply of N to water and wastewater systems triggers a series of severe issues, wherein excess nutrient availability induces eutrophication, depletion of dissolved oxygen levels, and the emergence of black, odorous water [1,2]. The availability of efficient technologies for nitrogen removal in wastewater becomes imperative [3,4] and holds paramount significance in preserving the equilibrium and stability of aquatic ecosystems, as well as ensuring safe water quality. Conventional nitrogen removal techniques usually involve converting ammonia nitrogen ( NH 4 + - N ) to nitrate nitrogen ( NO 2 - N ), followed by denitrification to eliminate nitrogen, employing methods such as activated sludge treatment [5] or the biofilm method [6]. The biological aerated filter (BAF) is a prevalent form of the biofilm method. In wastewater treatment, BAFs have been applied in various contexts, including carbon removal, nitrification, and denitrification. BAFs primarily encompass two combined forms: pre-denitrification in the BAF process (DN-BAF) [7] and post-denitrification in the BAF process (BAF-DN) [8]. In the DN-BAF process, raw wastewater undergoes denitrification in an anoxic tank, where denitrifying bacteria utilize organic matter as a substrate to remove COD. Subsequently, the nitrification reaction takes place in the BAF unit, and the effluent nitrified liquid is partially refluxed into the DN unit for denitrification. When treating wastewater with a low C/N ratio, the utilization of carbon sources in the DN-BAF process is restricted to raw wastewater, resulting in unsatisfactory nitrogen removal performance and limited large-scale application [9]. In the BAF-DN process, COD removal and NH 4 + - N conversion occur in the BAF unit, while TN removal is achieved by adding an extra carbon source in the DN unit. The BAF-DN process does not involve nitrified liquid reflux, making it suitable for treating low C/N ratio sewage or for denitrifying high NH 4 + - N content wastewater. However, the BAF-DN process requires a significant amount of additional carbon sources, leading to high operating costs and the risk of COD exceeding the effluent standards. In recent years, the volume of sewage and pollutant content (especially nitrogen) in urban domestic wastewater has gradually increased in China [10]. On the premise of not adding an external carbon source or altering the original structural layout, enabling the BAF-DN process to meet the TN effluent requirements has become an engineering challenge to be addressed.
The anammox process is anticipated to offer fresh perspectives for addressing the challenges inherent in the BAF-DN process. This innovative biological technology harnesses ANAMMOX bacteria to reduce NO 2 - N to N 2 , employing NH 4 + - N as an electron donor under anaerobic and anoxic conditions (Equation (1)) [11]. Notably, the anammox process eliminates both NH 4 + - N and TN without relying on an organic carbon source, and its nitrogen removal efficiency surpasses that of traditional nitrification/denitrification techniques [12]. Furthermore, the anammox process is more environmentally friendly and energy-efficient and generates minimal excess sludge [13,14]. If the anammox process replaces the DN unit in the BAF-DN process, it is hopeful to resolve issues related to carbon source supplementation and inadequate TN removal. Currently, the integration of BAF and anammox typically manifests in two forms: partial nitrification [15,16] or partial denitrification [17] within the BAF unit, supplying nitrite nitrogen to the subsequent anammox unit for effective nitrogen removal. However, achieving stable NO 2 - N accumulation through biological partial nitrification or partial denitrification remains challenging for domestic wastewater with low NH 4 + - N concentrations. If a sustained supply of NO 2 - N can be established to provide stable operating conditions for the BAF/AX process, an in situ capacity expansion modification of the conventional BAF-DN process can be achieved without necessitating additional constructions.
NH 4 + + 1.32 NO 2 + 0.066 HCO 3 + 0.13 H + 1.02 N 2 + 0.26 NO 3 + 0.066 CH 2 O 0.5 N 0.15 + 2.03 H 2 O
This study investigated the feasibility of utilizing the combined BAF/AX process for treating municipal wastewater with a low C/N ratio, achieved through the supplementation of nitrite nitrogen. During the stable operation of the BAF, the study delved into the impact of aeration volume and empty bed residence time (EBRT) on its operational efficiency, ultimately selecting optimal operational parameters to furnish ammonia nitrogen substrate for the subsequent anammox process. Furthermore, this study optimized the startup and operation of the anammox process, examining the effect of carriers on its initiation using ceramic particles and sponges as filter media. It also analyzed the impact of EBRT, influent ammonia nitrogen, and influent COD on the nitrogen removal performance of the anammox process. Additionally, this study conducted a comprehensive evaluation of the BAF/AX combination process, exploring its treatment performance, analyzing its economic cost, and discussing its engineering value for upgrading water treatment processes and in situ capacity expansion.

2. Materials and Methods

2.1. Wastewater Composition and Reactors

Synthesized wastewater was used to simulate domestic sewage, according to the process in a previous study [18]. The composition of synthetic wastewater for the BAF/AX combined process in that previous study is shown in Table 1. The process uses C2H3NaO2 as the carbon source, NH4Cl as the nitrogen source, KH2PO4 as the phosphorus source, and NaHCO3 to provide the alkalinity. Adding an appropriate proportion of actual domestic sewage (5~10%) to the synthetic wastewater can provide the trace elements necessary for the normal growth and reproduction of microorganisms, which is conducive to the stable operation of the BAF reactor. The quality of actual domestic sewage was described in Table S1, and the composition of synthetic wastewater for the anammox reactor in the start-up period was given in Table S2. All the chemicals were purchased from Aladdin Biochemical Technology Co., LTD (Shanghai, China).
The BAF reactor was characterized as shown in Figure S1. The device dimensions were as follows: a height of 700 mm, an inner diameter of 55 mm, and an effective volume of 1 L. The bottom of the BAF was equipped with an aeration disc, possessing a diameter of 60 mm, which was connected to the aeration pump. This disc served multiple functions, including aeration, backwashing, and gas washing. The sewage was continuously introduced through a peristaltic pump via the bottom inlet of the BAF (with a diameter of 10 mm), and on the opposite side of the inlet, a sampling port was provided. Along the upward path from the bottom of the BAF reactor, there were 7 sampling ports, each spaced 60 mm apart and possessing a diameter of 10 mm. The carrier material consisted of ceramic particles, with a particle size ranging from 2 to 3 mm.
The anammox reactor was initiated using the effluent from the BAF reactor, with appropriate NO 2 - N added to the influent prior to entering the anammox reactor (Figure S2). Our group cultivated the seed sludge for the anammox process, and the cultivation procedures were presented in Text S1 (Supplementary Material). The anammox reactor had an inner diameter of 55 mm and a height of 650 mm, with an effective volume of 1 L. The water inlet at the bottom of the reactor was continuously fed through a peristaltic pump, and a sampling port was positioned on the opposite side of the water inlet. Five sampling ports (each with a diameter of 10 mm) were placed along the reactor from bottom to top, with a spacing of 50 mm between each. The outer wall of the anammox reactor was wrapped with insulation material and shading cloth. Both ceramic particles and sponges (Text S2, Supplementary Material) were utilized as carriers within the anammox reactor. For simplicity, these two reactors were designated as the Cp-anammox reactor and Spon-anammox reactor, respectively.
The combined process primarily consisted of two units in series: the BAF unit and the anammox unit, as illustrated in Figure 1. The synthesized wastewater served as the influent and a pump was utilized to transfer the wastewater to the BAF unit initially. An aeration pump was employed to provide oxygen to the BAF unit. Following the treatment in the BAF unit, appropriate amounts of NO 2 - N were added prior to the anammox unit to ensure optimal treatment performance.

2.2. Parameters of Operation Conditions

The operational conditions of the BAF unit during the start-up and operation periods are presented in Table 2. An investigation was conducted to examine the effects of aeration intensity and EBRT on the treatment performance of the BAF. During the operational phase, if the effluent quality deteriorates, the reactor requires backwashing. Briefly, the backwashing process involved water washing for 5 min, air washing for 5 min, and a combined air-water back flushing for 10 min. The intensities for water and gas backwashing were respectively set at 4~5 L/ (m2·s) and 10~12 L/ (m2·s).
The start-up period of the anammox reactor was divided into three stages, and the relevant parameters for each stage are provided in Table 3. For the Cp-anammox reactor in stage I, to facilitate the adaptation of anammox bacteria (AnAOB) to the environment and their rapid enrichment on carriers, the concentrations of NH 4 + - N and NO 2 - N were set at high levels of 100 mg/L and 130 mg/L, respectively. During stages II and III, the NH 4 + - N concentration was gradually decreased to 40 mg/L and 30 mg/L, while the NO 2 - N concentration was correspondingly reduced to 55 mg/L and 40 mg/L. This reduction in NH 4 + - N and NO 2 - N concentrations were beneficial for acclimating and cultivating anammox sludge with biological activity under low-concentration conditions. For the Spon-anammox reactors, two startup modes were employed for better comparison. This was achieved by adjusting the empty bed residence time (EBRT) from 4 h to 1 h while setting the NH 4 + - N and NO 2 - N concentrations at either high or low levels.
After successfully initiating the anammox reactor, single-factor influence experiments were conducted during the operational period, varying the EBRT or influent NH 4 + - N concentration for both Cp-anammox and Spon-anammox reactors. Specifically, the impact of influent COD concentration (using sodium acetate) on the Spon-anammox reactor was investigated. The parameters for these experiments are presented in Table 4. For the combined BAF/AX process, the operational conditions are detailed in Table 5, with the entire operational period being 30 days.

2.3. Measurements and Methods

Based on the American Public Health Association Standard Methods, NH 4 + - N , NO 3 - N , NO 2 - N , TN, and COD concentration were determined [19]. Nessler’s reagent Spectrophotometry Method was employed to detect NH 4 + - N , utilizing an ultraviolet spectrophotometer (UV-2600, Shimadzu, Kyoto, Japan). For NO 3 - N detection, the ultraviolet spectrophotometry method was used. The N-(1-Naphthyl)-ethylenediamine spectrophotometric method was applied to measure NO 2 - N , while the potassium persulfate oxidation ultraviolet spectrophotometry method was used to determine total nitrogen (TN). Additionally, the rapid enclosed catalytic digestion method (SJ-GL600, Genesite, China), was utilized to assess COD concentration.

3. Results and Discussion

3.1. The Operation Strategy of Removing COD While Retaining Ammonia Nitrogen in the BAF Process

The effluent from the BAF unit is directed into the anammox unit to facilitate the combined BAF/AX process. To enhance the nitrogen removal performance of the anammox unit, two crucial conditions must be met within the BAF unit. Firstly, the COD concentration of the BAF effluent should be relatively low. Secondly, excessive oxidation of NH 4 + - N to NO 3 - N must be avoided. Consequently, this section focuses on adjusting the operating conditions of the BAF unit to achieve suitable water quality, thereby optimizing its performance for the anammox unit. Strategies such as reducing aeration intensity or adjusting the EBRT were considered for BAF unit adjustment, and the related results are analyzed in this section.
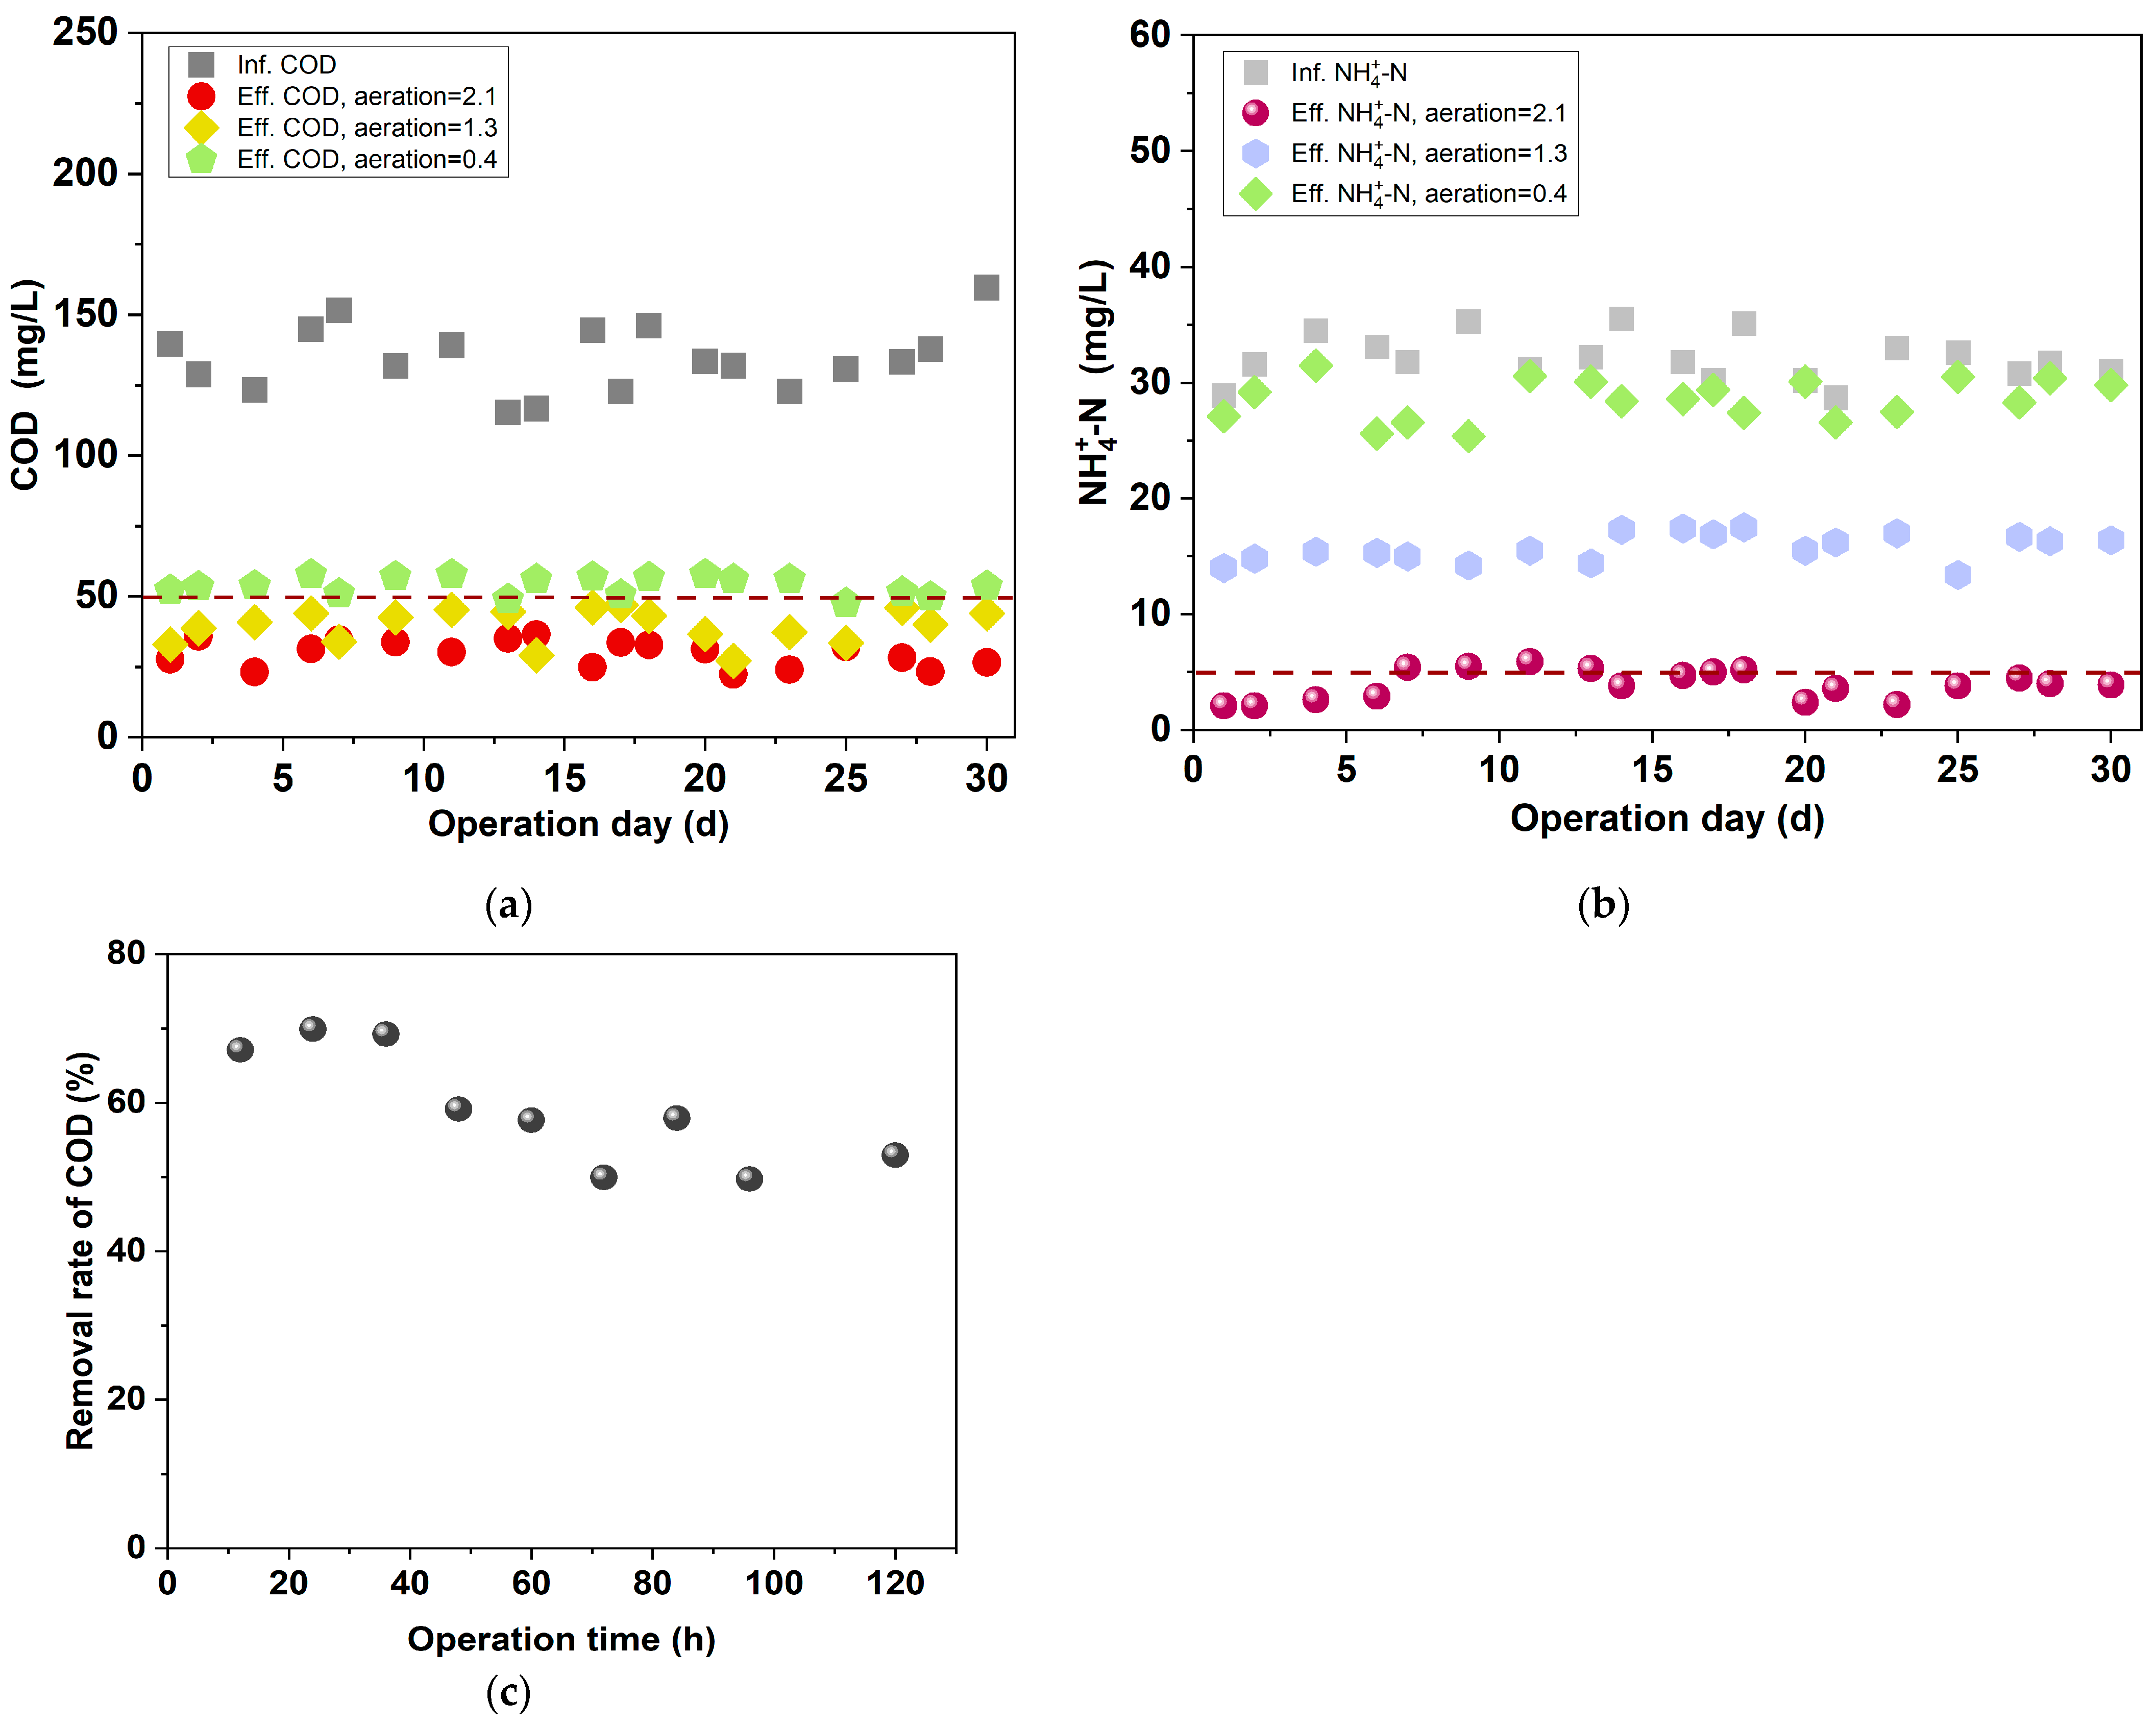
Prior to exploring the specifics, a brief summary of the relevant contents of the BAF during the start-up and stable operation periods is provided. The BAF unit was successfully initiated on the 22nd day of operation, with a COD removal efficiency of 64.3%. Furthermore, during the stable operation period, the COD removal efficiency of the BAF unit improved to 75%. When the aeration intensity was decreased from 2.1 to 0.4 m3/(m2·h), the NH 4 + - N removal capability of the BAF unit was weakened, indicating that the nitrification of NH 4 + - N was significantly inhibited. At the same time, the COD concentration in the effluent of the BAF unit was approximately 55 mg/L. The aeration intensity of the BAF was selected as 0.4 m3/(m2·h) because it ensured COD removal while effectively inhibiting the nitrification of NH 4 + - N , which was beneficial for the subsequent operation of the anammox unit. Additionally, the backwashing parameters of the BAF unit were determined. After backwashing, the BAF operated at 36 h and 48 h, the COD removal efficiency decreased from 69.3% to 59.2%, and it remained below 60% thereafter. Therefore, the backwashing period for the BAF unit in this study was determined to be 36 h.

3.1.1. Effect of Reducing Aeration Intensity on the Treating Performance of BAF

Aeration intensity is a crucial factor influencing COD removal and ammonia nitrification efficiency in the BAF unit. Since heterotrophic bacteria exhibit stronger competition for oxygen compared to autotrophic nitrifying bacteria, adjusting the aeration intensity of the BAF has a significant impact on NH 4 + - N removal performance. As illustrated in Figure 2a,b, the aeration intensity is set at 2.1 m3/(m2·h), the BAF achieves a COD removal efficiency of approximately 83.3% and an NH 4 + - N removal efficiency of about 87.4%. However, when the aeration intensity is reduced to 1.3 m3/(m2·h), the COD removal efficiency decreases to 72.5%, and the NH 4 + - N removal efficiency drops significantly to 47%. Nonetheless, the effluent COD and NH 4 + - N concentrations still meet the class A requirement [20]. These results indicate that by appropriately reducing the aeration intensity of the BAF, effective removal of COD and NH 4 + - N can be achieved. Under the aeration, intensity was further reduced to 0.4 m3/(m2·h), and the COD removal efficiency was about 66.3%, with the effluent COD maintained at approximately 55 mg/L. Meanwhile, the NH 4 + - N removal efficiency is only 4%, suggesting a deterioration in NH 4 + - N removal performance possibly due to the inhibition of the nitrification process of NH 4 + - N . Therefore, when the aeration intensity BAF is 0.4 m3/(m2·h), it ensures suitable COD removal while retaining most of the NH 4 + - N , which is conducive to providing optimal influent conditions for subsequent anammox units.
Over the long-term operation of BAF, the excessive accumulation of pollutants on the carrier surface led to issues such as carrier clogging and compromised effluent quality. Regular backwashing of the BAF became necessary to eliminate aged biofilms and trapped suspended solids adhered to the carrier’s surface. Under a low aeration intensity scenario of 0.4 m3/(m2·h), while maintaining the backwashing intensity constant, the COD concentration of the effluent post-BAF backwashing was monitored over a 12-h detection period. As depicted in Figure 3c, after the BAF had been continuously operational for 36 h, a significant reduction in the COD removal efficiency was observed. Following 96 h of operation, the base of the BAF started to darken, accompanied by the emergence of filamentous bacteria. Presumably, at the lower aeration intensity of 0.4 m3/(m2·h), the BAF was unable to achieve uniform aeration. Consequently, certain areas within the BAF, lack oxygen, and develop into stagnant corners, fostering anaerobic conditions and ultimately leading to sludge discoloration. Hence, a backwashing cycle of 36 h was selected for the BAF.

3.1.2. Effect of Reducing EBRT on the Treating Performance of BAF

The primary objective at this stage was to augment the hydraulic load of the BAF, which was indirectly achieved by decreasing the EBRT. The EBRT typically refers to the duration that sewage resides within the reactor without a carrier, serving as an indicator of the contact time between sludge and sewage. An excessively short EBRT may result in incomplete treatment, whereas an overly long EBRT often necessitates a larger reactor volume, subsequently leading to elevated capital costs. Although appropriately reducing the EBRT of the BAF might potentially lead to incomplete removal of NH 4 + - N by nitrifying bacteria, which was beneficial to remain NH 4 + - N for subsequent anammox unit, the removal capacity of COD and its corresponding impact on biofilm shedding remained uncertain at this stage. Therefore, for the operation of subsequent anammox unit, it was of paramount importance for the BAF to select an appropriate EBRT.
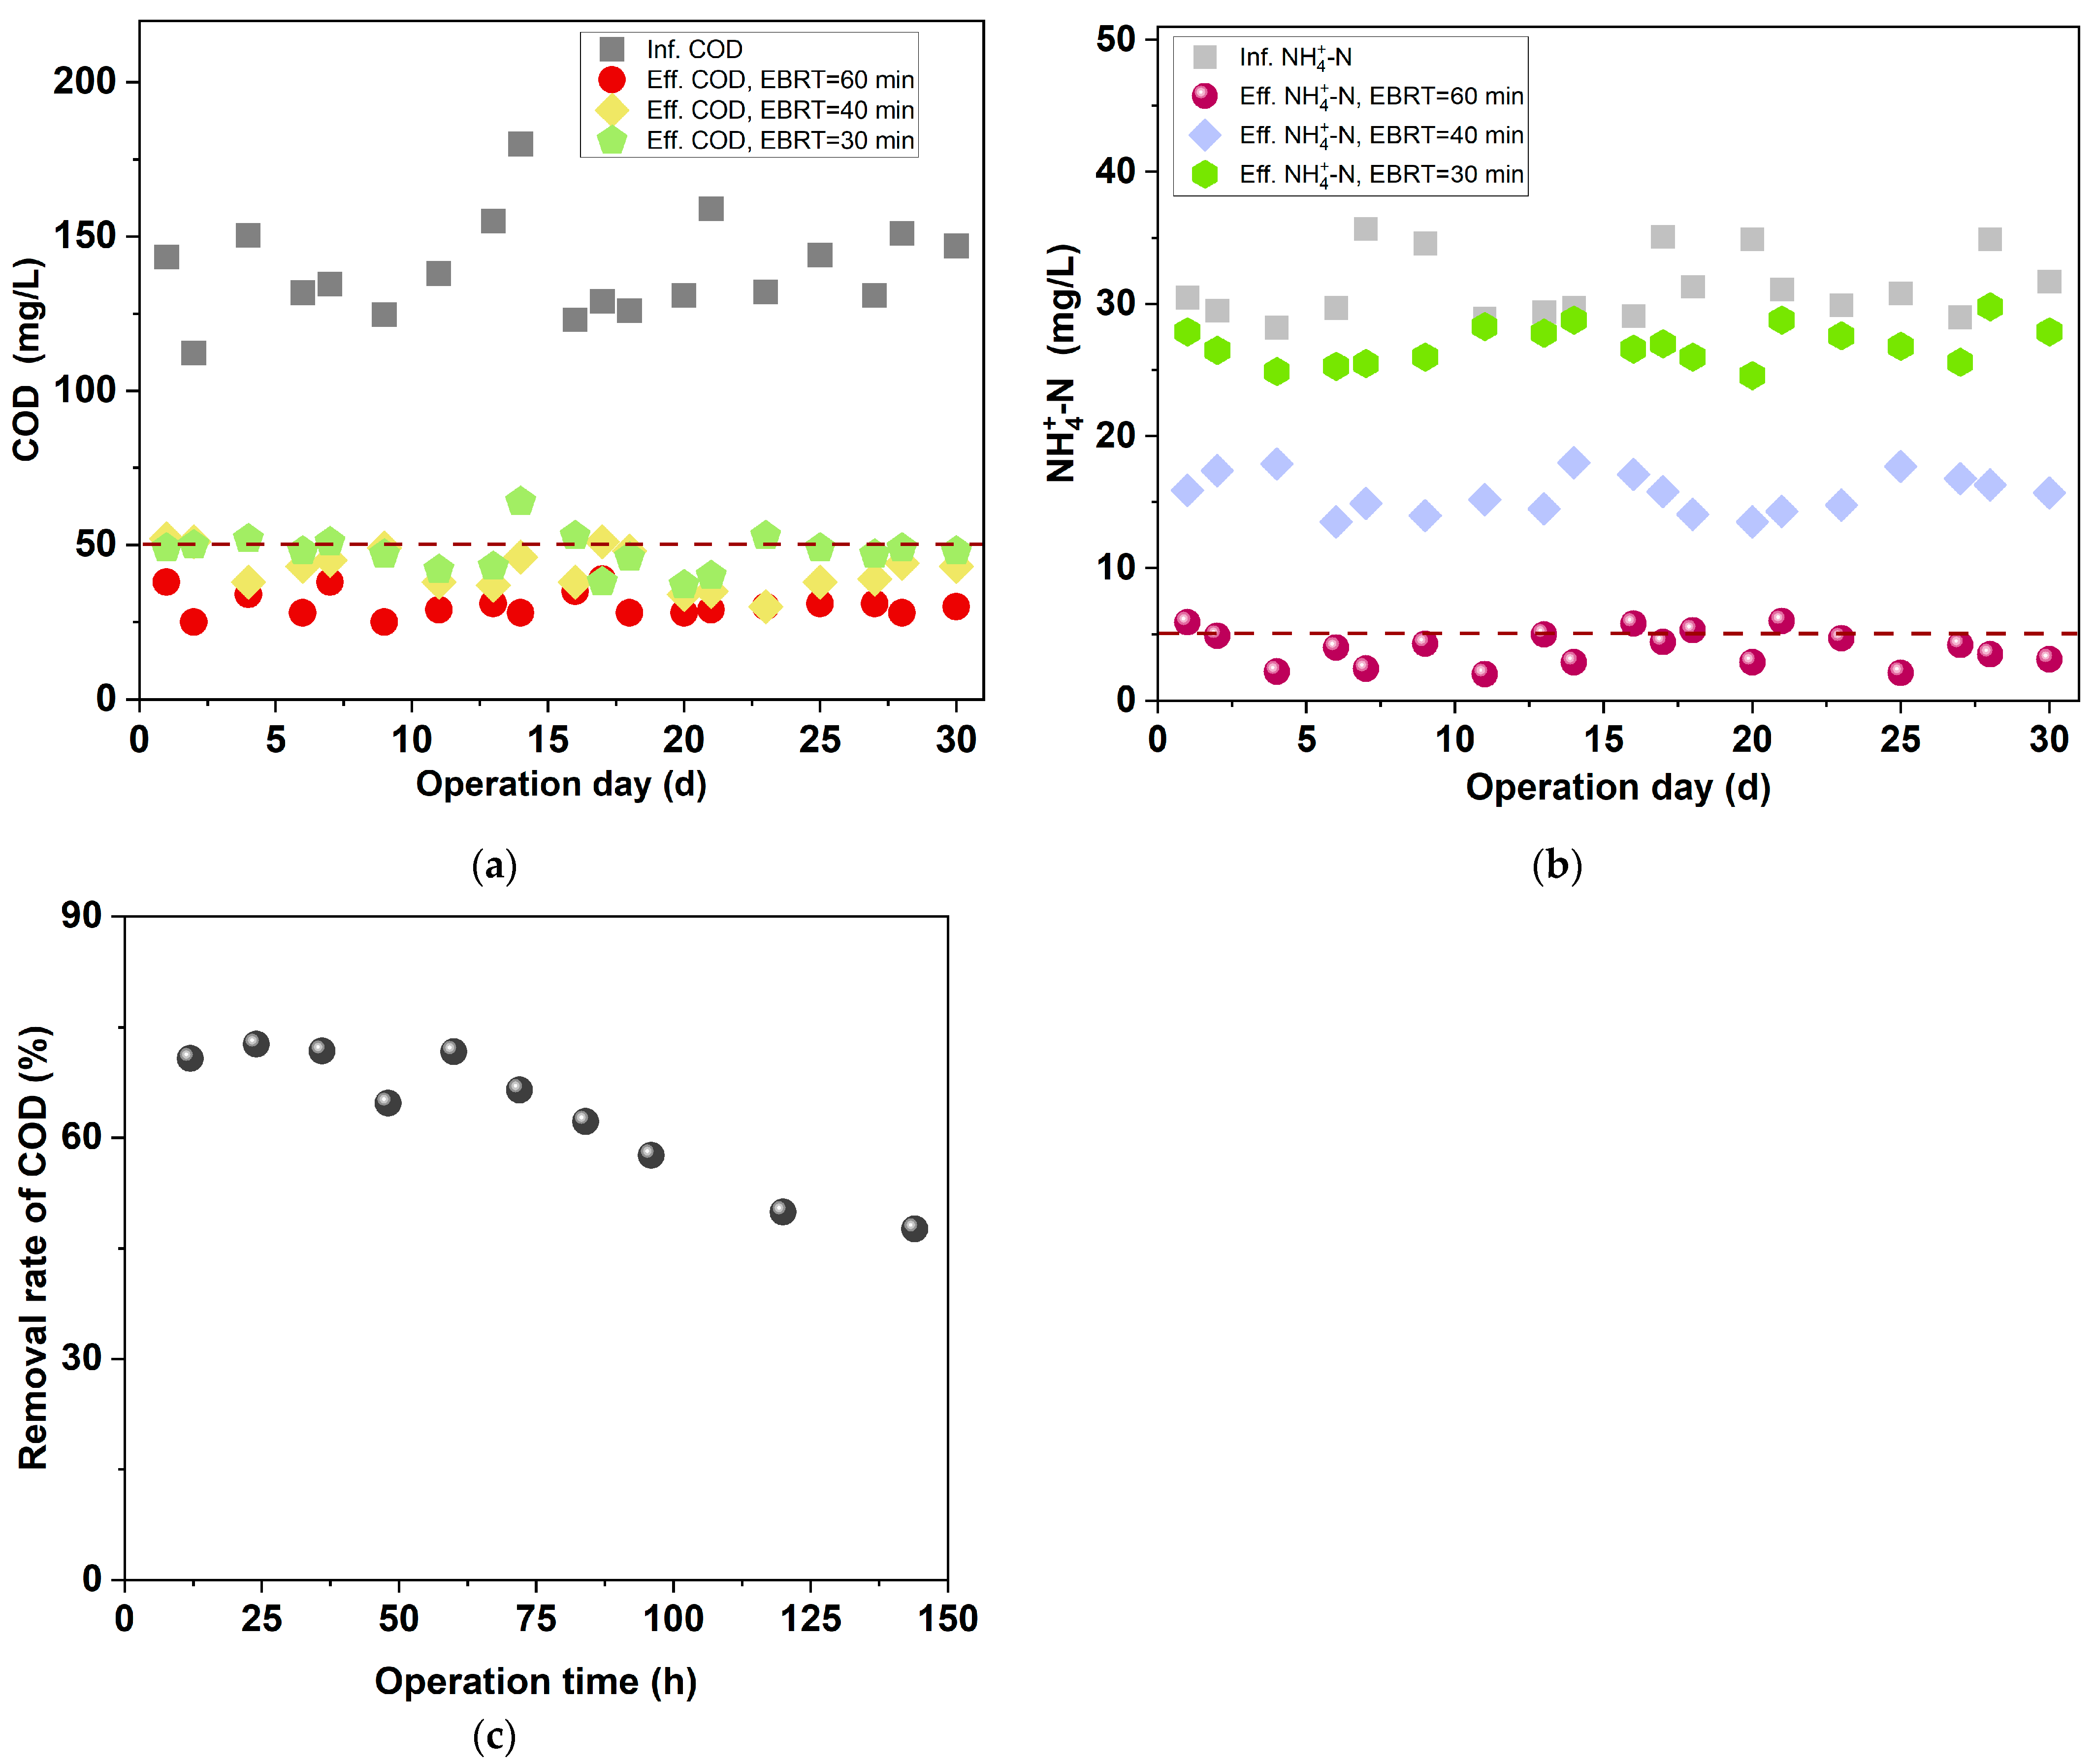
As depicted in Figure 3a,b, when the EBRT was shortened from 1 h to 40 min, the removal efficiency of COD decreased from 79.6% to 70.7%. Concurrently, the removal efficiency of NH 4 + - N decreased from 90.2% to 50.5%. Upon further reducing the EBRT to 30 min, the COD removal efficiency was approximately 67.3% (with an effluent COD of 48 mg/L), and the NH 4 + - N removal efficiency sharply declined to 12.0%. This result was consistent with other studies, that reducing EBRT would significantly decrease the removal efficiency of COD [21] or NH 4 + - N [22], owning to EBRT obviously affected the bacterial species in the microbial communities in BAF reactor. The reduction in EBRT indeed negatively affected the nitrogen removal capacity of the BAF, which contributed to the trouble-free operation of subsequent anammox units. In this scenario, since the effluent COD largely met the Class A requirement [20], it indicated that the impact of reducing EBRT on the COD removal capacity was acceptable. Therefore, the selected EBRT for the BAF was 30 min.
After backwashing the BAF under a low EBRT of 30 min, the effluent COD concentration was monitored every 12 h to determine the appropriate backwashing cycle, as illustrated in Figure 3c. Under the operation for 72 h, the COD removal efficiency gradually decreased to 66.5%. Following the operation of the BAF for 96 h, the aged biofilm was washed out, resulting in opacity of the effluent, and the COD removal efficiency decreasing to 57.6%. Consequently, the backwashing cycle for the BAF at a low EBRT was determined to be 72 h.

3.2. Influence of Carrier Types on the Nitrogen Removal Performance of ANAMMOX Reactors during the Start-Up Period

Ceramic particles, commonly employed in denitrification filters, offer the advantage of eliminating the need for carrier replacement if directly utilized as the carrier in an anammox unit. While sponges are a prevalent carrier choice in anammox reactors within certain lab-scale research, this study selected both ceramic particles and sponges as carriers for the anammox reactor, aiming to investigate the effects of these two carriers on the treatment efficiency of anammox.

3.2.1. Cp-Anammox

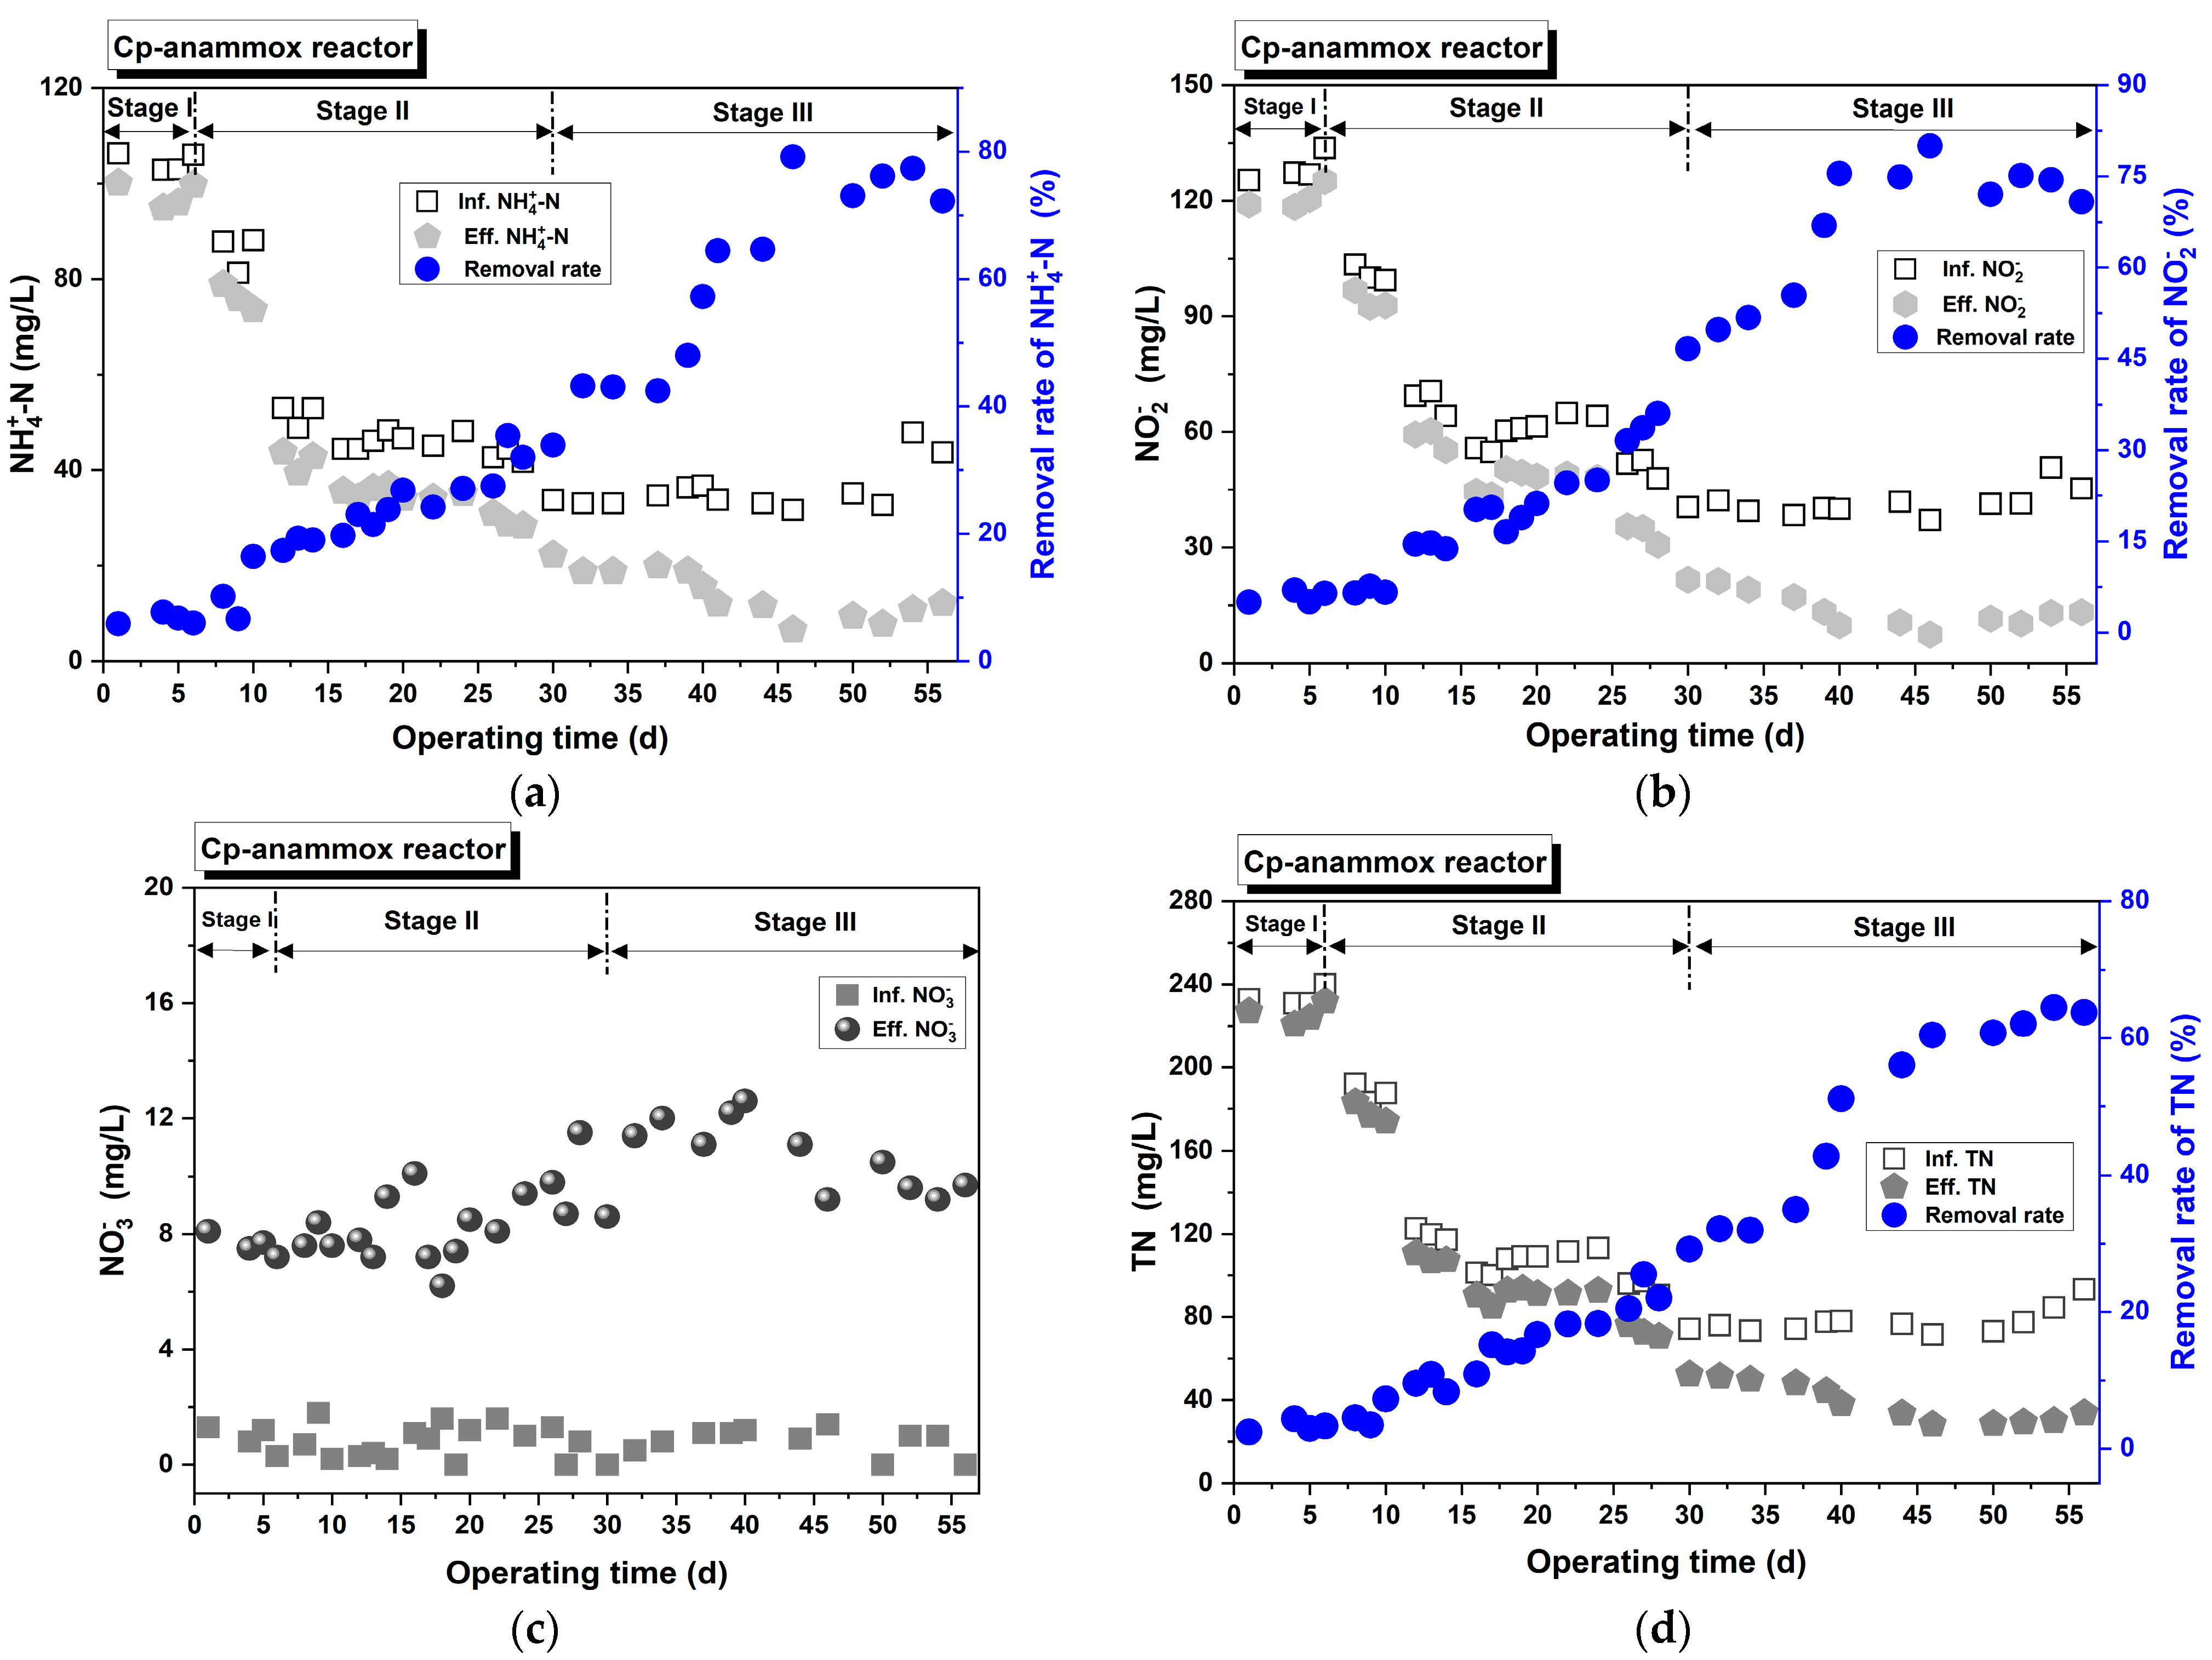
In the initial stage, higher NH 4 + - N concentration and longer EBRT were applied to shorten the startup period, and the nitrogen removal performance of the Cp-anammox reactor is shown in Figure 4. After 6 days of operation (stage I), the removal concentration of NH 4 + - N (Figure 4a) and NO 2 - N (Figure 4b) was 6.3~8.0 mg/L and 6.3~8.6 mg/L. The removed NO 2 - N / NH 4 + - N ratio was only 0.90~1.09, which is visibly lower than the reported metrological ratio of 1.32:1. This observation indicated that the activity of AnAOB was not sufficiently high and that the anammox sludge was still in the adaptation stage, leading to a TN removal efficiency of only 2.5~4.4%. In stage II, the removal concentration of NH 4 + - N and NO 2 - N was 8.9~15.7 mg/L and 6.6~18.9 mg/L, respectively, with corresponding removal efficiency was 6.6~33.9% and 6.5~46.7%. Concurrently, the removal efficiency of TN elevated to 4.5~29.3%. The evident enhancement in pollutant removal efficiency suggested that the activity of anammox sludge was progressively enriching. However, due to the minimum generation cycle of AnAOB being 11 days, the anammox sludge in the Cp-anammox reactor remained in the adaptation period during stage II, causing discernible fluctuations in the removal efficiency of NO 2 - N and NH 4 + - N . Upon shortening the EBRT to stage III, the concentrations of NH 4 + - N and NO 2 - N in the effluent continued to decrease further, and the removal amounts of both pollutants gradually stabilized. From days 46 to 56, the produced concentration of NO 3 - N remained consistent at approximately 7.8~10.5 mg/L (Figure 4c), and the TN removal efficiency sustained above 60.8% (Figure 4d). Meanwhile, the metrological ratio of NH 4 + - N (removal concentration)/ NO 2 - N (removal concentration)/ NO 3 - N (generated concentration) was 1:(1.19 ± 0.09):(0.30 ± 0.04), which was essentially close to the reported metrological ratio (1:1.32:1). According to the removal efficiency of NH 4 + - N , NO 2 - N and TN, as well as the metrological ratio, these observations indicated that the primary characteristic of anammox sludge was manifested, and the Cp-anammox reactor had been successfully initiated.

3.2.2. Spon-ANAMMOX

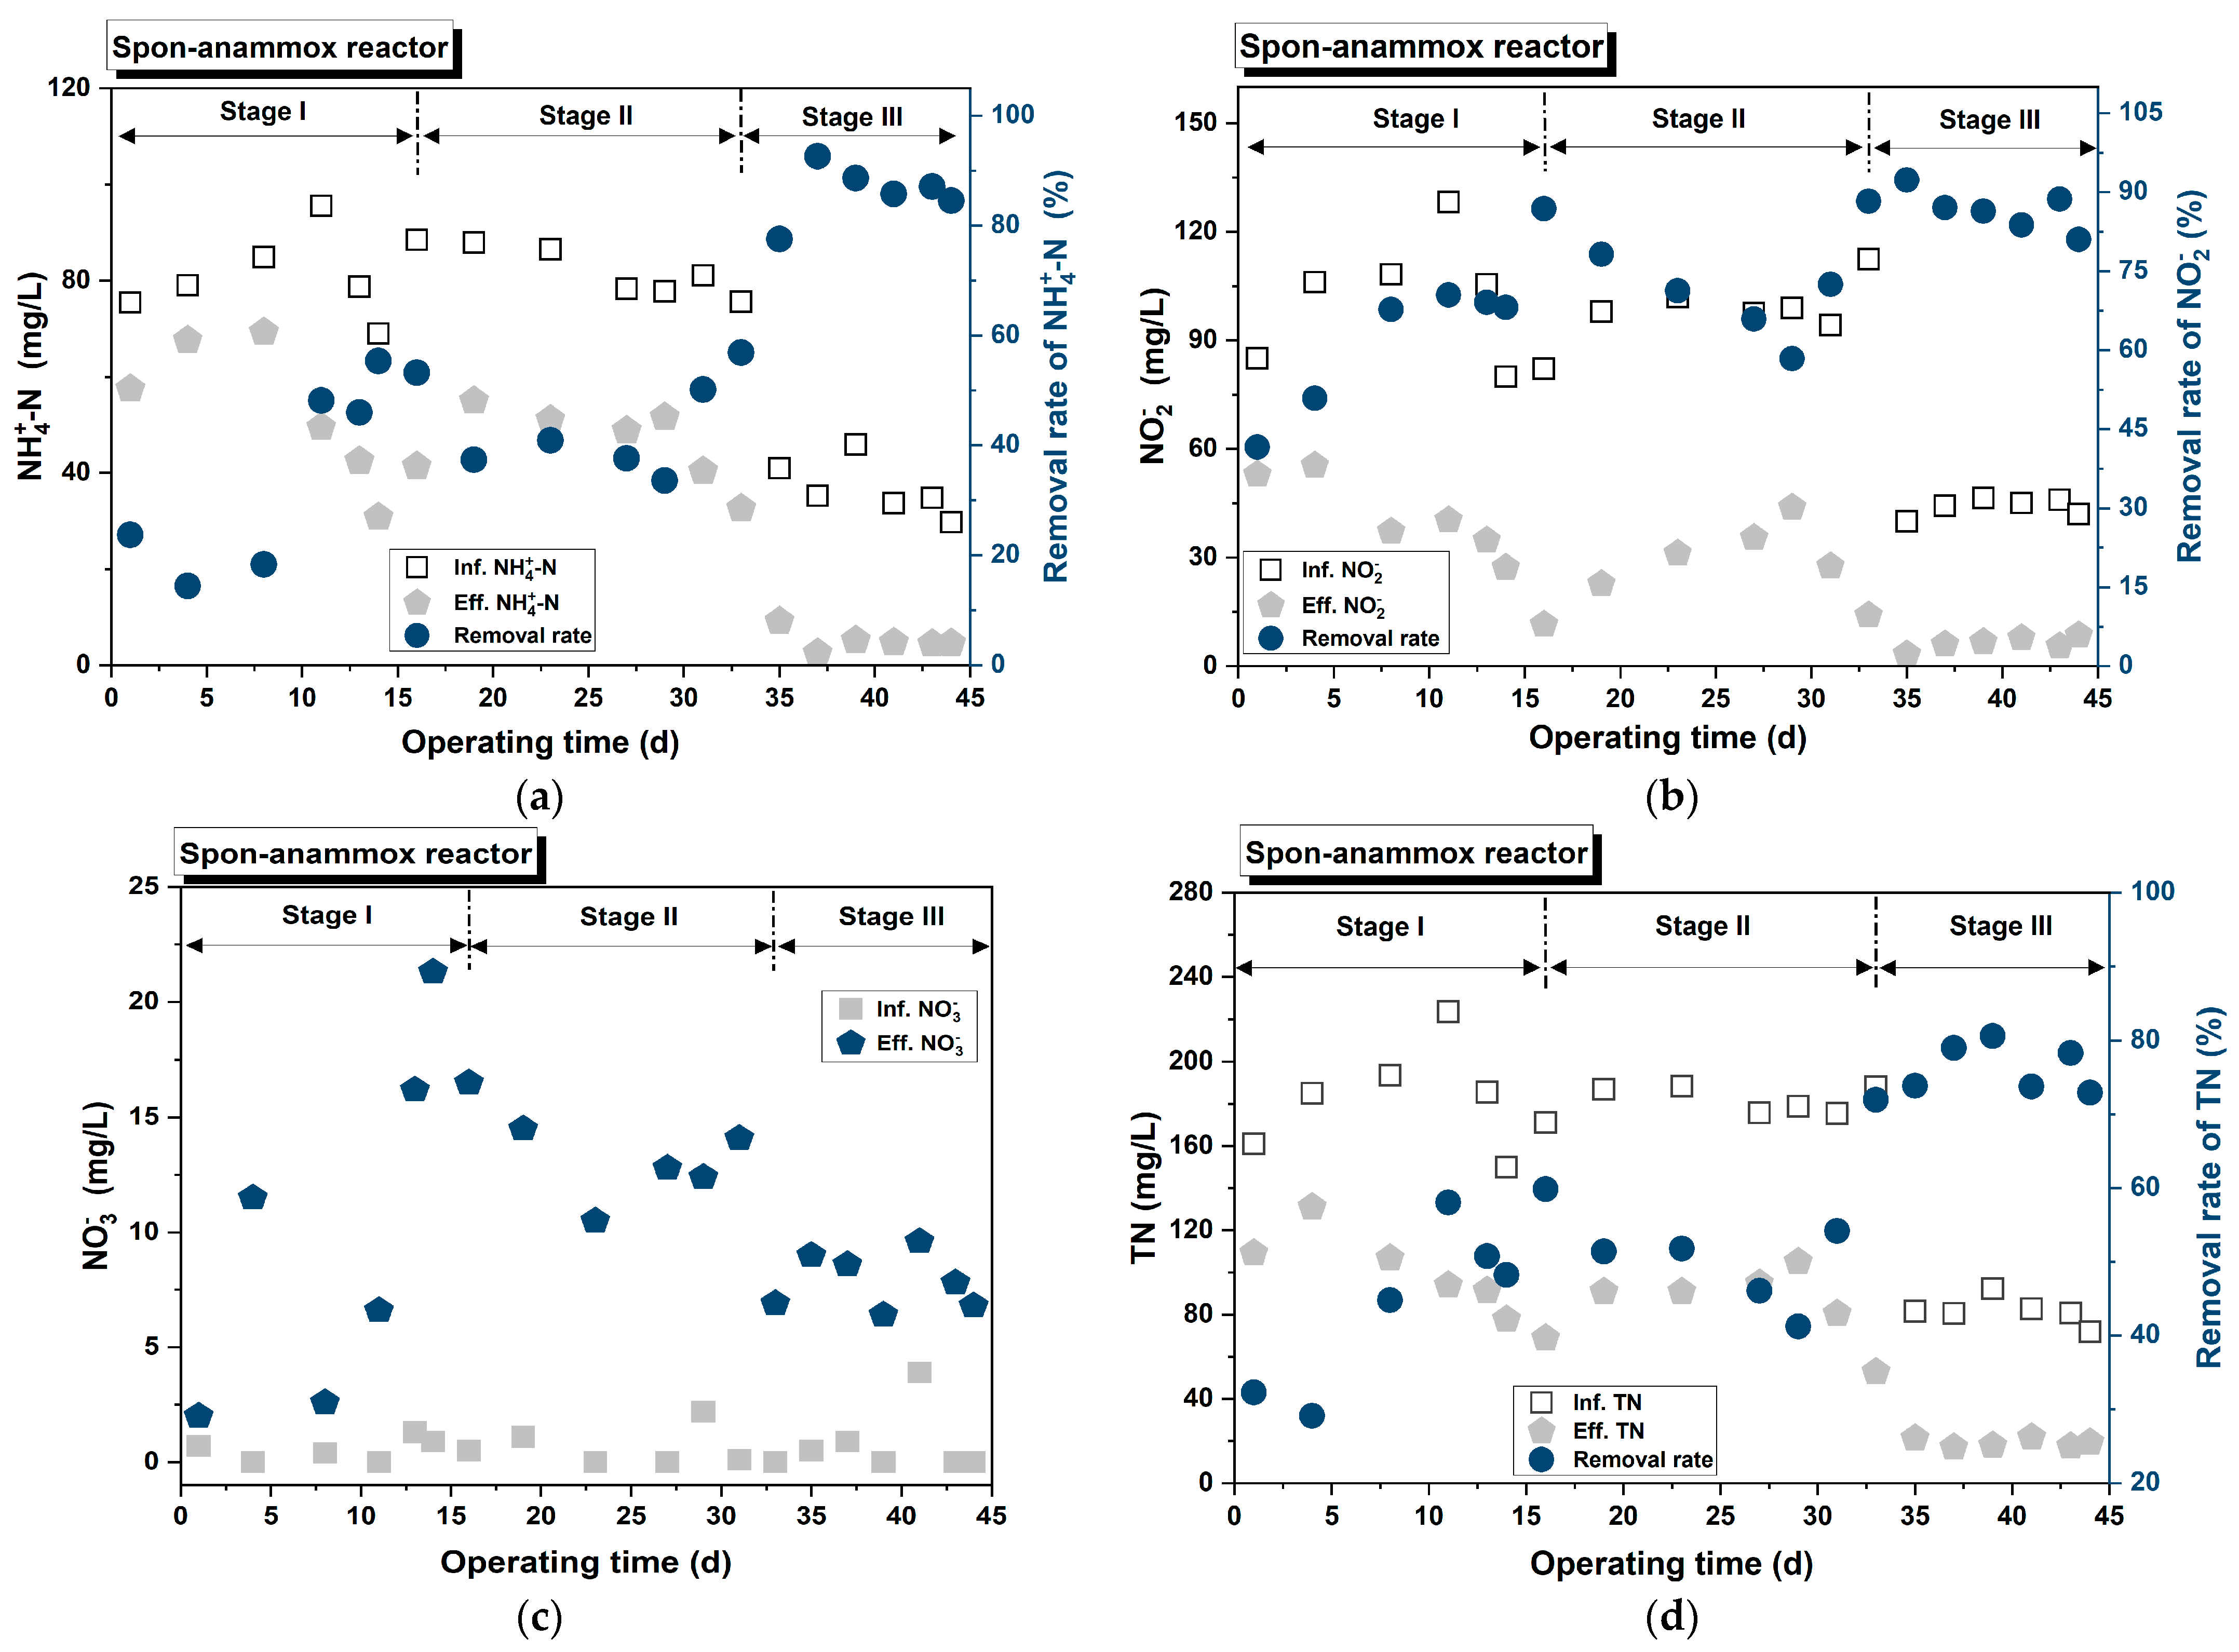
Though initial substrate concentrations of NO 2 - N and NH 4 + - N were high, the nitrogen removal performance of the Spon-anammox reactor is depicted in Figure 5 to assess if the reactor was successfully started. During the high-concentration startup (stage I), the removal concentration of NO 2 - N notably increased from 11.4 mg/L to 47.1 mg/L (Figure 5a). Concurrently, the removed NH 4 + - N ranged between 35.4~90.4 mg/L (Figure 5b). The produced NO 3 - N remained within 1.3~20.4 mg/L (Figure 5c), and the removal efficiency of TN exhibited clear fluctuations around 29.1 to 59.9% (Figure 5d). At the end of stage I, the metrological ratio of NH 4 + - N / NO 2 - N / NO 3 - N was 1:1.52:0.34, indicating that AnAOB in the Spon-anammox reactor was cultivated under high influent concentration. However, the evident fluctuations in removal performance suggested that the anammox sludge was in an adaptation period and lacked stability. This adaption characteristic of anammox sludge was also observed in stage II, as the removal efficiency of NH 4 + - N and NO 2 - N slightly decreased to 26.2~43.0% and 58.4~88.3%, respectively. Upon entering stage III, the removal efficiency of NH 4 + - N and NO 2 - N significantly increased to 77.5~92.6% and 83.8~92.3%, respectively. Meanwhile, the removal efficiency of TN reached 73.0~80.6% (Figure 5d). From day 41 to 44, the corresponding NH 4 + - N / NO 2 - N / NO 3 - N was 1:(1.33 ± 0.02):(0.24 ± 0.03), aligning with the reported metrological ratio (1:1.32:1). Additionally, the sponge reduced the start-up period from 56 days to 41 days.
In this study, carrier types play an important role as both a crucial media and support media for two anammox reactors. The Spon-anammox reactor slightly enhanced the nitrogen removal performance in stage III, encompassing NH 4 + - N , NO 2 - N and TN. It could be that the sponge’s porosity allowed fluid to flow more uniformly through the reactor [23], and its porous structure was conducive to trapping more AnAOB. The pores of the sponge may have contained anammox microorganisms and extracellular polymeric substances. This suggested that the sponge carrier could better achieve the immobilization of AnAOB and reduce microbial mass loss in the reactor. Moreover, the porosity and pore size of the sponge potentially influenced the enrichment and activity of AnAOB, owning to the outstanding adsorption ability of the sponge carrier [24]. It was possible that the sponge’s porosity was slightly higher than ceramic particles, which facilitated substrate transfer and rapid enrichment of AnAOB. It speculated that the sponge’s porosity was slightly higher than ceramic particles, which facilitated substrate transfer and rapid enrichment of AnAOB. The pore size of the sponge was possibly smaller than ceramic particles, which was suitable for protecting AnAOB by preventing DO access. These findings indicated that carrier types obviously had an influence on the performance of anammox reactor in the start-up period, which was consistent with Zhang’s research [25]. It pointed out that carrier types obviously influenced the formation of anammox biofilm, meanwhile, sponges would lead to closer cooperation between different populations. It speculated that AnAOB was more easily domesticated and enriched at high influent concentrations in the Spon-anammox reactor compared to the Cp-anammox reactor. After taking into consideration the start-up speed and nitrogen removal performance, the Spon-anammox reactor demonstrates more advantages than the Cp-anammox reactor.
In recent years, research on the anammox process has primarily focused on treating low C/N wastewater or high NH 4 + - N and high-temperature wastewater, such as sludge digestion [26] and landfill leachate [27]. Advanced sewage treatment and recycling are effective ways to address water resource shortages, and the anammox process is recognized as a suitable option for advanced domestic sewage treatment. Usually, the NH 4 + - N concentration in wastewater after secondary treatment is as low as 30~50 mg/L, or it was usually 15~35 mg/L in municipal domestic sewage in China. However, despite being a promising and potential technology, the start-up characteristics and applicability of the anammox technology at low substrate influent concentrations remain unknown. The nitrogen removal performance of the Spon-anammox reactor at low influent concentration is shown in Figure 6. Similar to high influent concentration, the removal efficiency of NH 4 + - N and NO 2 - N were relatively low in stage I and fluctuated but increased in stage II (Figure 6a,b), if operated at low influent concentrations. At approximately half the high influent concentration, the AnAOB was not well-cultured and did not enrich rapidly in stage I, resulting in poor nitrogen removal performance. In stage II, this fluctuation was caused by reducing EBRT from 4 h to 2 h, while the increasing activity of AnAOB led to increased removal efficiency of NH 4 + - N and NO 2 - N . In stage II, the removed NH 4 + - N was around 20~35 mg/L, which was lower than that operated at the high influent concentration (26~43 mg/L). Simultaneously, the removed NO 2 - N was 22.4~40.5 mg/L. At the end of stage II, the removal efficiency of NH 4 + - N and NO 2 - N ascended to 89.1% and 73.5%, respectively, while the removal efficiency of TN climbed to 72.0%. Concurrently, the calculated ratio of NH 4 + - N / NO 2 - N / NO 3 - N was 1:1.06:0.17, according Figure 6c. Entering stage III, even under the shorter ERBT of 1 h, the removal efficiency e of NH 4 + - N and NO 2 - N persisted within the ranges of 81.3~93.6% and 78.1~92.3%, respectively. Moreover, the removal efficiency of TN remained stable at 73.0~80.6% (Figure 6d). The calculated ratio of NH 4 + - N / NO 2 - N / NO 3 - N was 1:(1.27 ± 0.12):(0.27 ± 0.03), which is close to the reported value (1:1.32:1). Based on the outcomes observed under low substrate influent concentration, the successful launch of the Spon-anammox reactor after a 44-day operational period, underscores the potential application of the anammox process in municipal wastewater treatment.

3.3. Influence of Operating Conditions on Nitrogen Removal Performance of Anammox Reactor during Stable Operation Period

3.3.1. Impact of EBRT

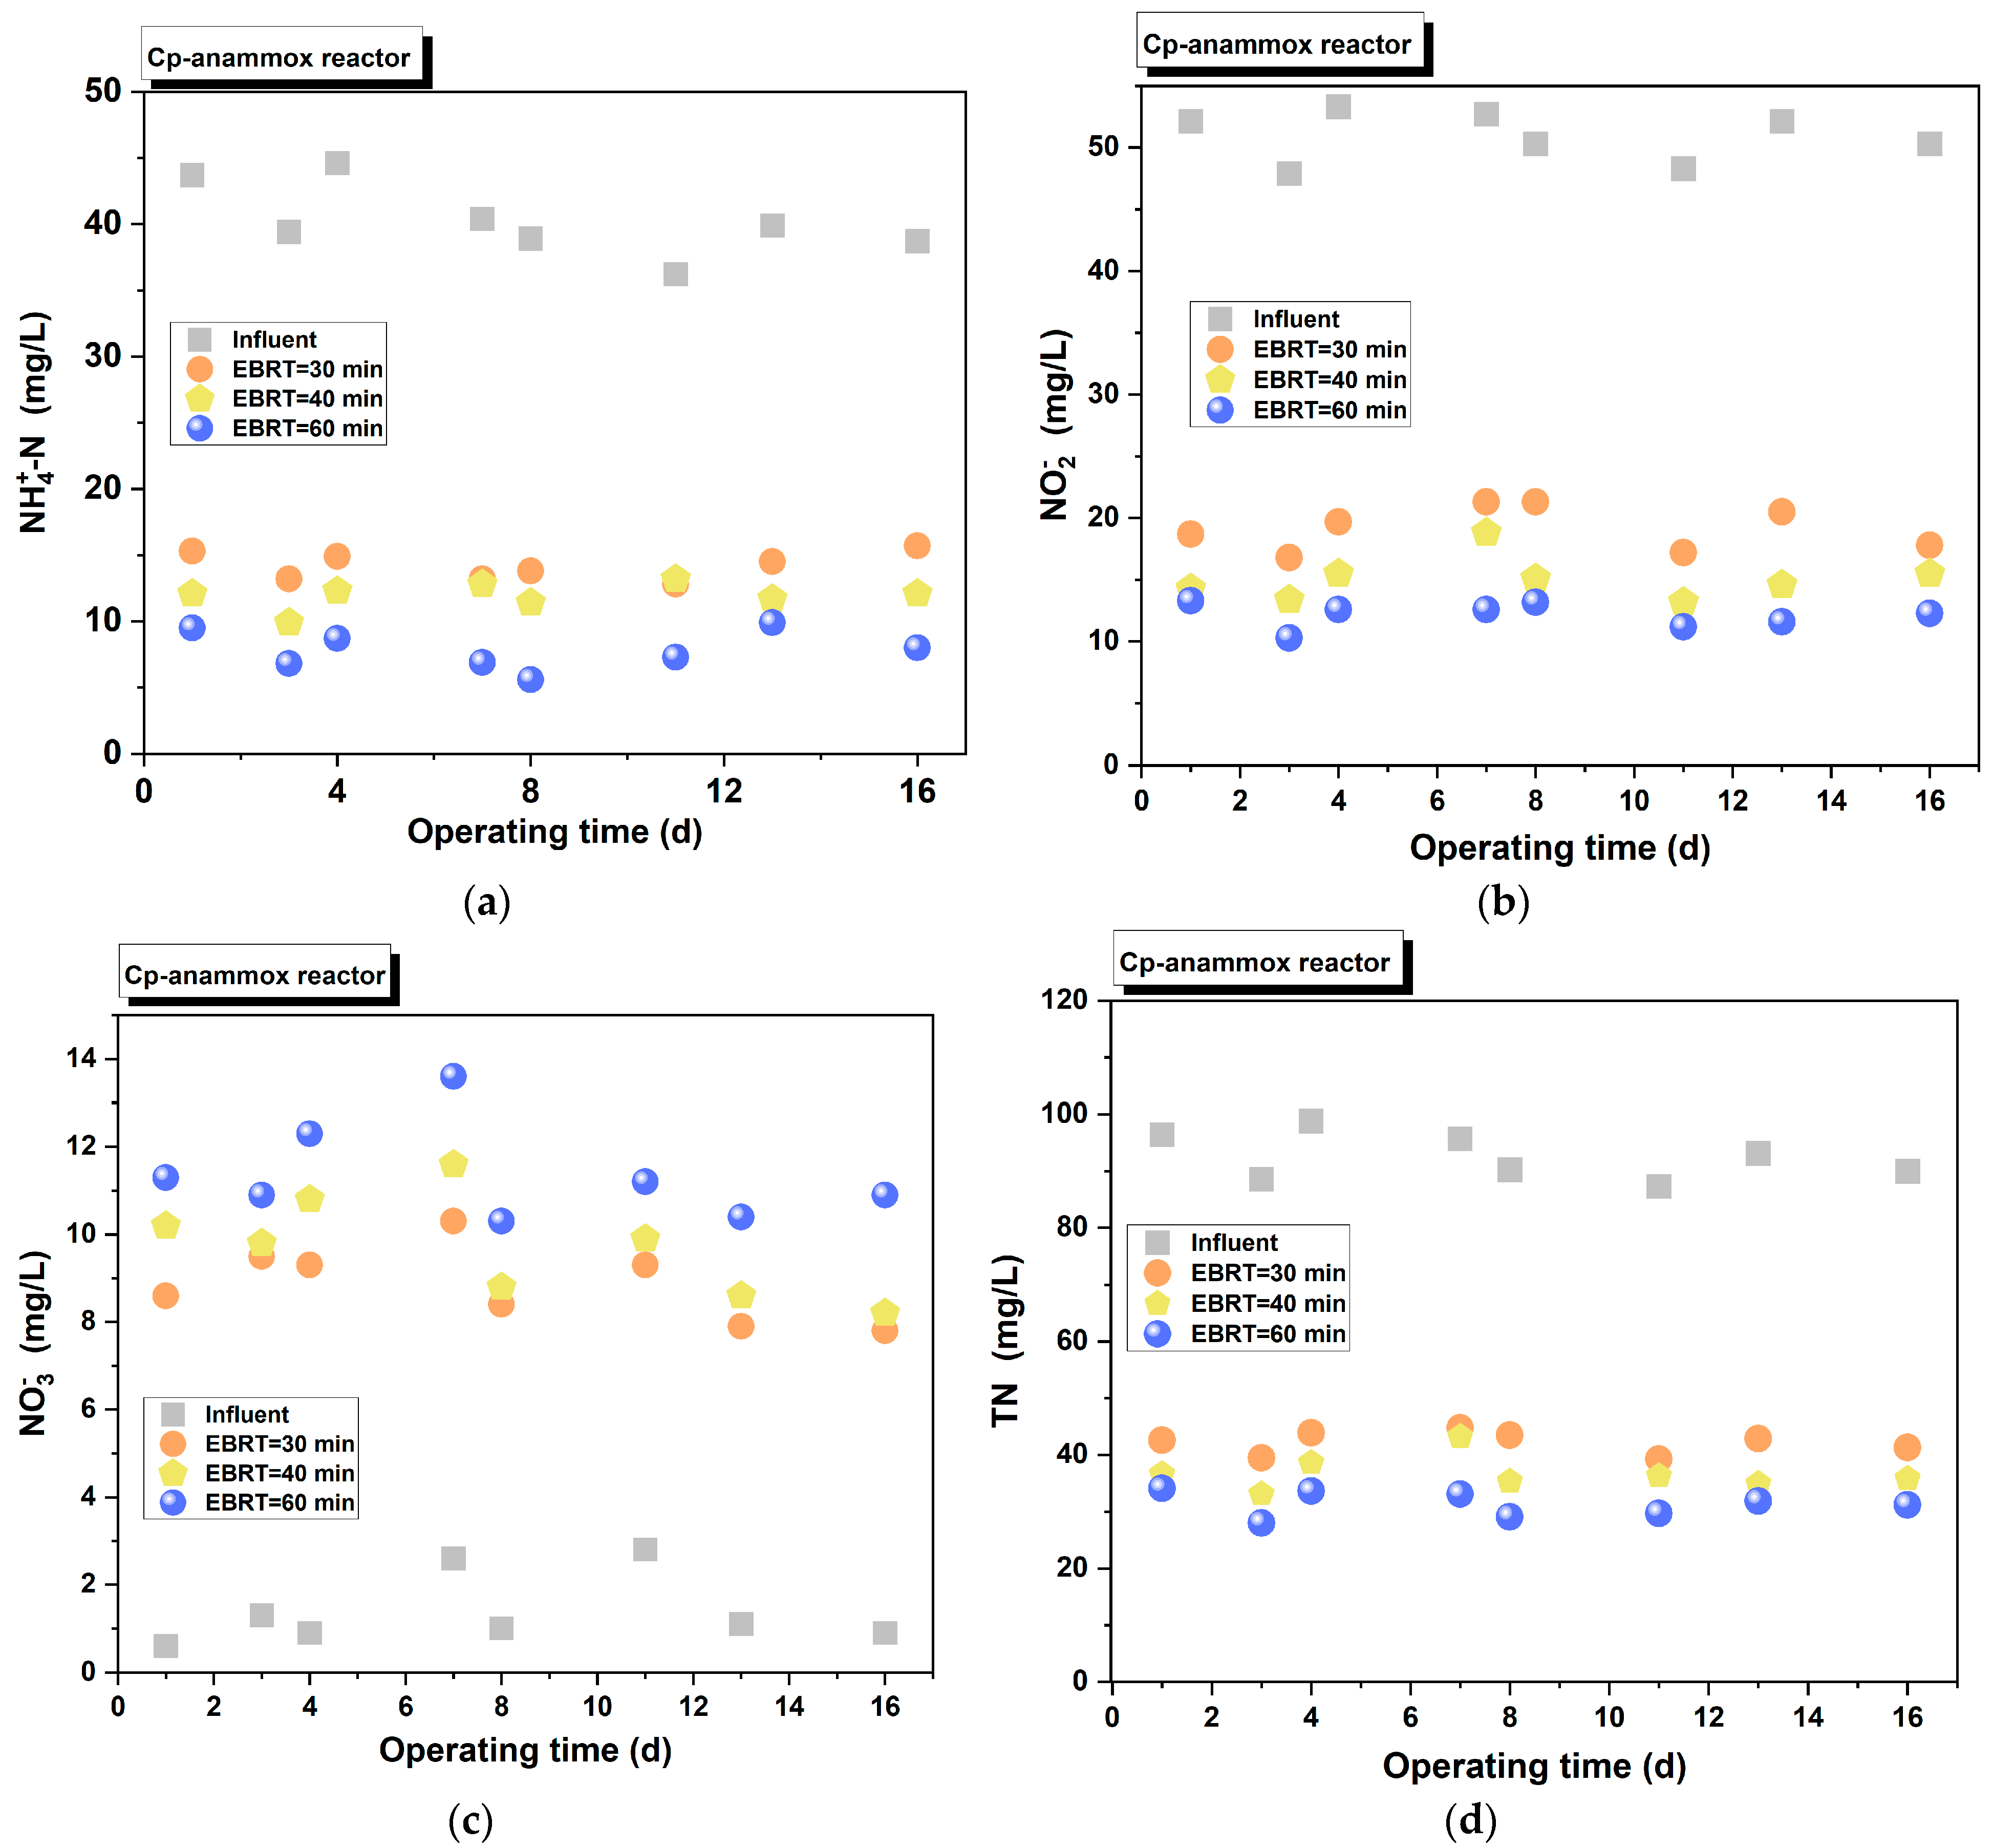
EBRT in an anammox reactor denotes the residence time of fluid in the absence of fillers, which usually reflects the contact time of AnAOB and sewage. In this section, an investigation was conducted to assess the impact of EBRT on nitrogen removal performance under various EBRT conditions, when Cp-anammox reactor operated. As depicted in Figure 7a, the removal efficiency of NH 4 + - N increased from 59.4% to 68.7% and further to 79.3% as the EBRT extended from 30 min to 60 min. Correspondingly, Figure 7b reveals that the removal efficiency of NO 2 - N rose from 64.6% to 69.2% and then to 75.5%. Figure 7c indicates that the accumulated concentration of NO 3 - N was 6.9, 7.3 and 10.0 mg/L, respectively. Moreover, Figure 7d demonstrates that the removal efficiency of TN improved from 54.1% to 60.2% and ultimately to 65.3%. These findings confirmed that operating the Cp-anammox reactor with a longer EBRT (60 min) enhances nitrogen removal performance.
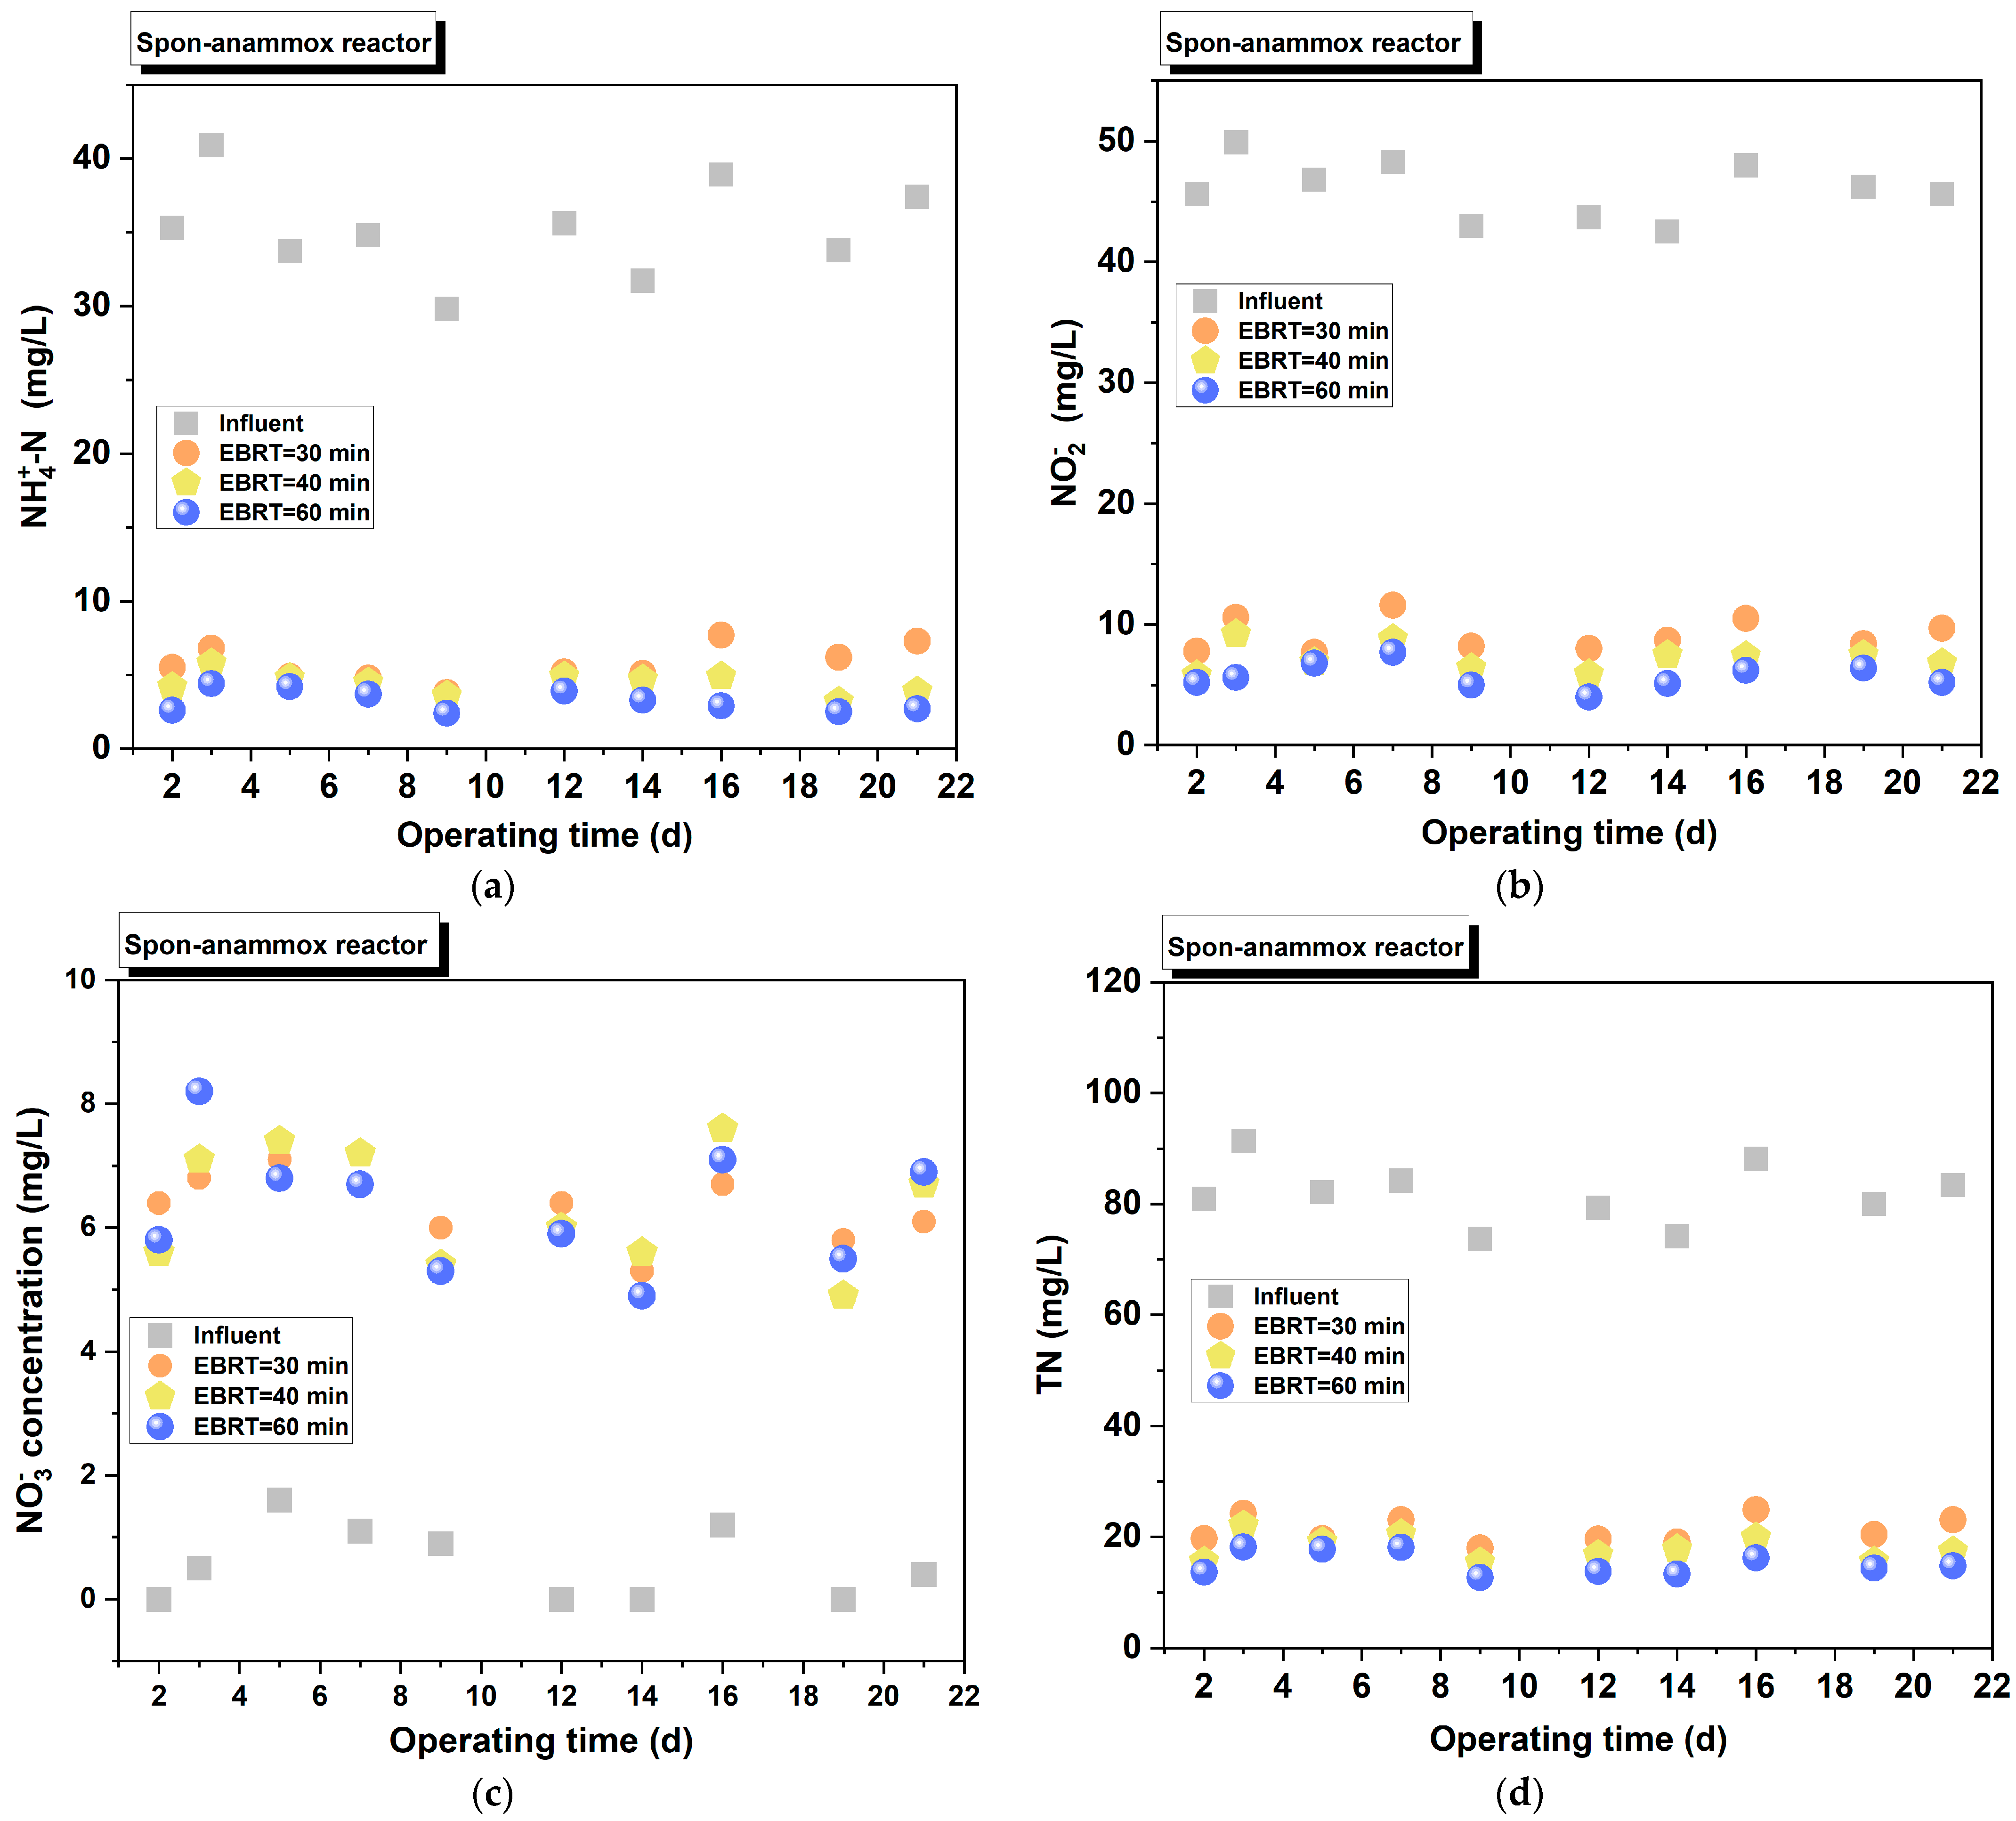
Figure 8 illustrates the impact of EBRT on the Spon-anammox reactor. Specifically, Figure 8a demonstrates that the removal efficiency of NH 4 + - N was 80.5%, 89.6% and 92.8%, when EBRT extended from 30 min to 60 min. Correspondingly, Figure 8b reveals that the removal efficiency of NO 2 - N was 78.7%, 85.1% and 88.6%. Figure 8c indicates that the accumulated concentration of NO 3 - N was 5.8, 4.9 and 5.5 mg/L, respectively. Furthermore, Figure 8d displays that the removal efficiency of TN was 72.3%, 79.1% and 82.3%. These results collectively suggest that extending the EBRT is beneficial for enhancing the nitrogen removal performance of the Spon-anammox reactor, and this positive effect is more pronounced than that observed in the Cp-anammox reactor. It is plausible that the anammox reaction occurs more fully in microorganisms under longer EBRT conditions, such as 60 min in the Spon-anammox reactor, leading to improved nitrogen removal efficiency. From the perspective of meeting the effluent NH 4 + - N concentration requirement of less than 5 mg/L (as per the class A requirement [20], Text S3), the optimal EBRT for the Spon-anammox reactor was determined to be 40 min.

3.3.2. Impact of Influent NH 4 + - N Concentration

The content of free ammonia is related to the influent ammonia nitrogen concentration, which subsequently affects microbial activity. An investigation was conducted into the impact of influent NH 4 + - N on nitrogen removal performance of both the Cp-anammox reactor and the Spon-anammox reactor. The results of this investigation are presented in Figure 9 and Figure 10, respectively.
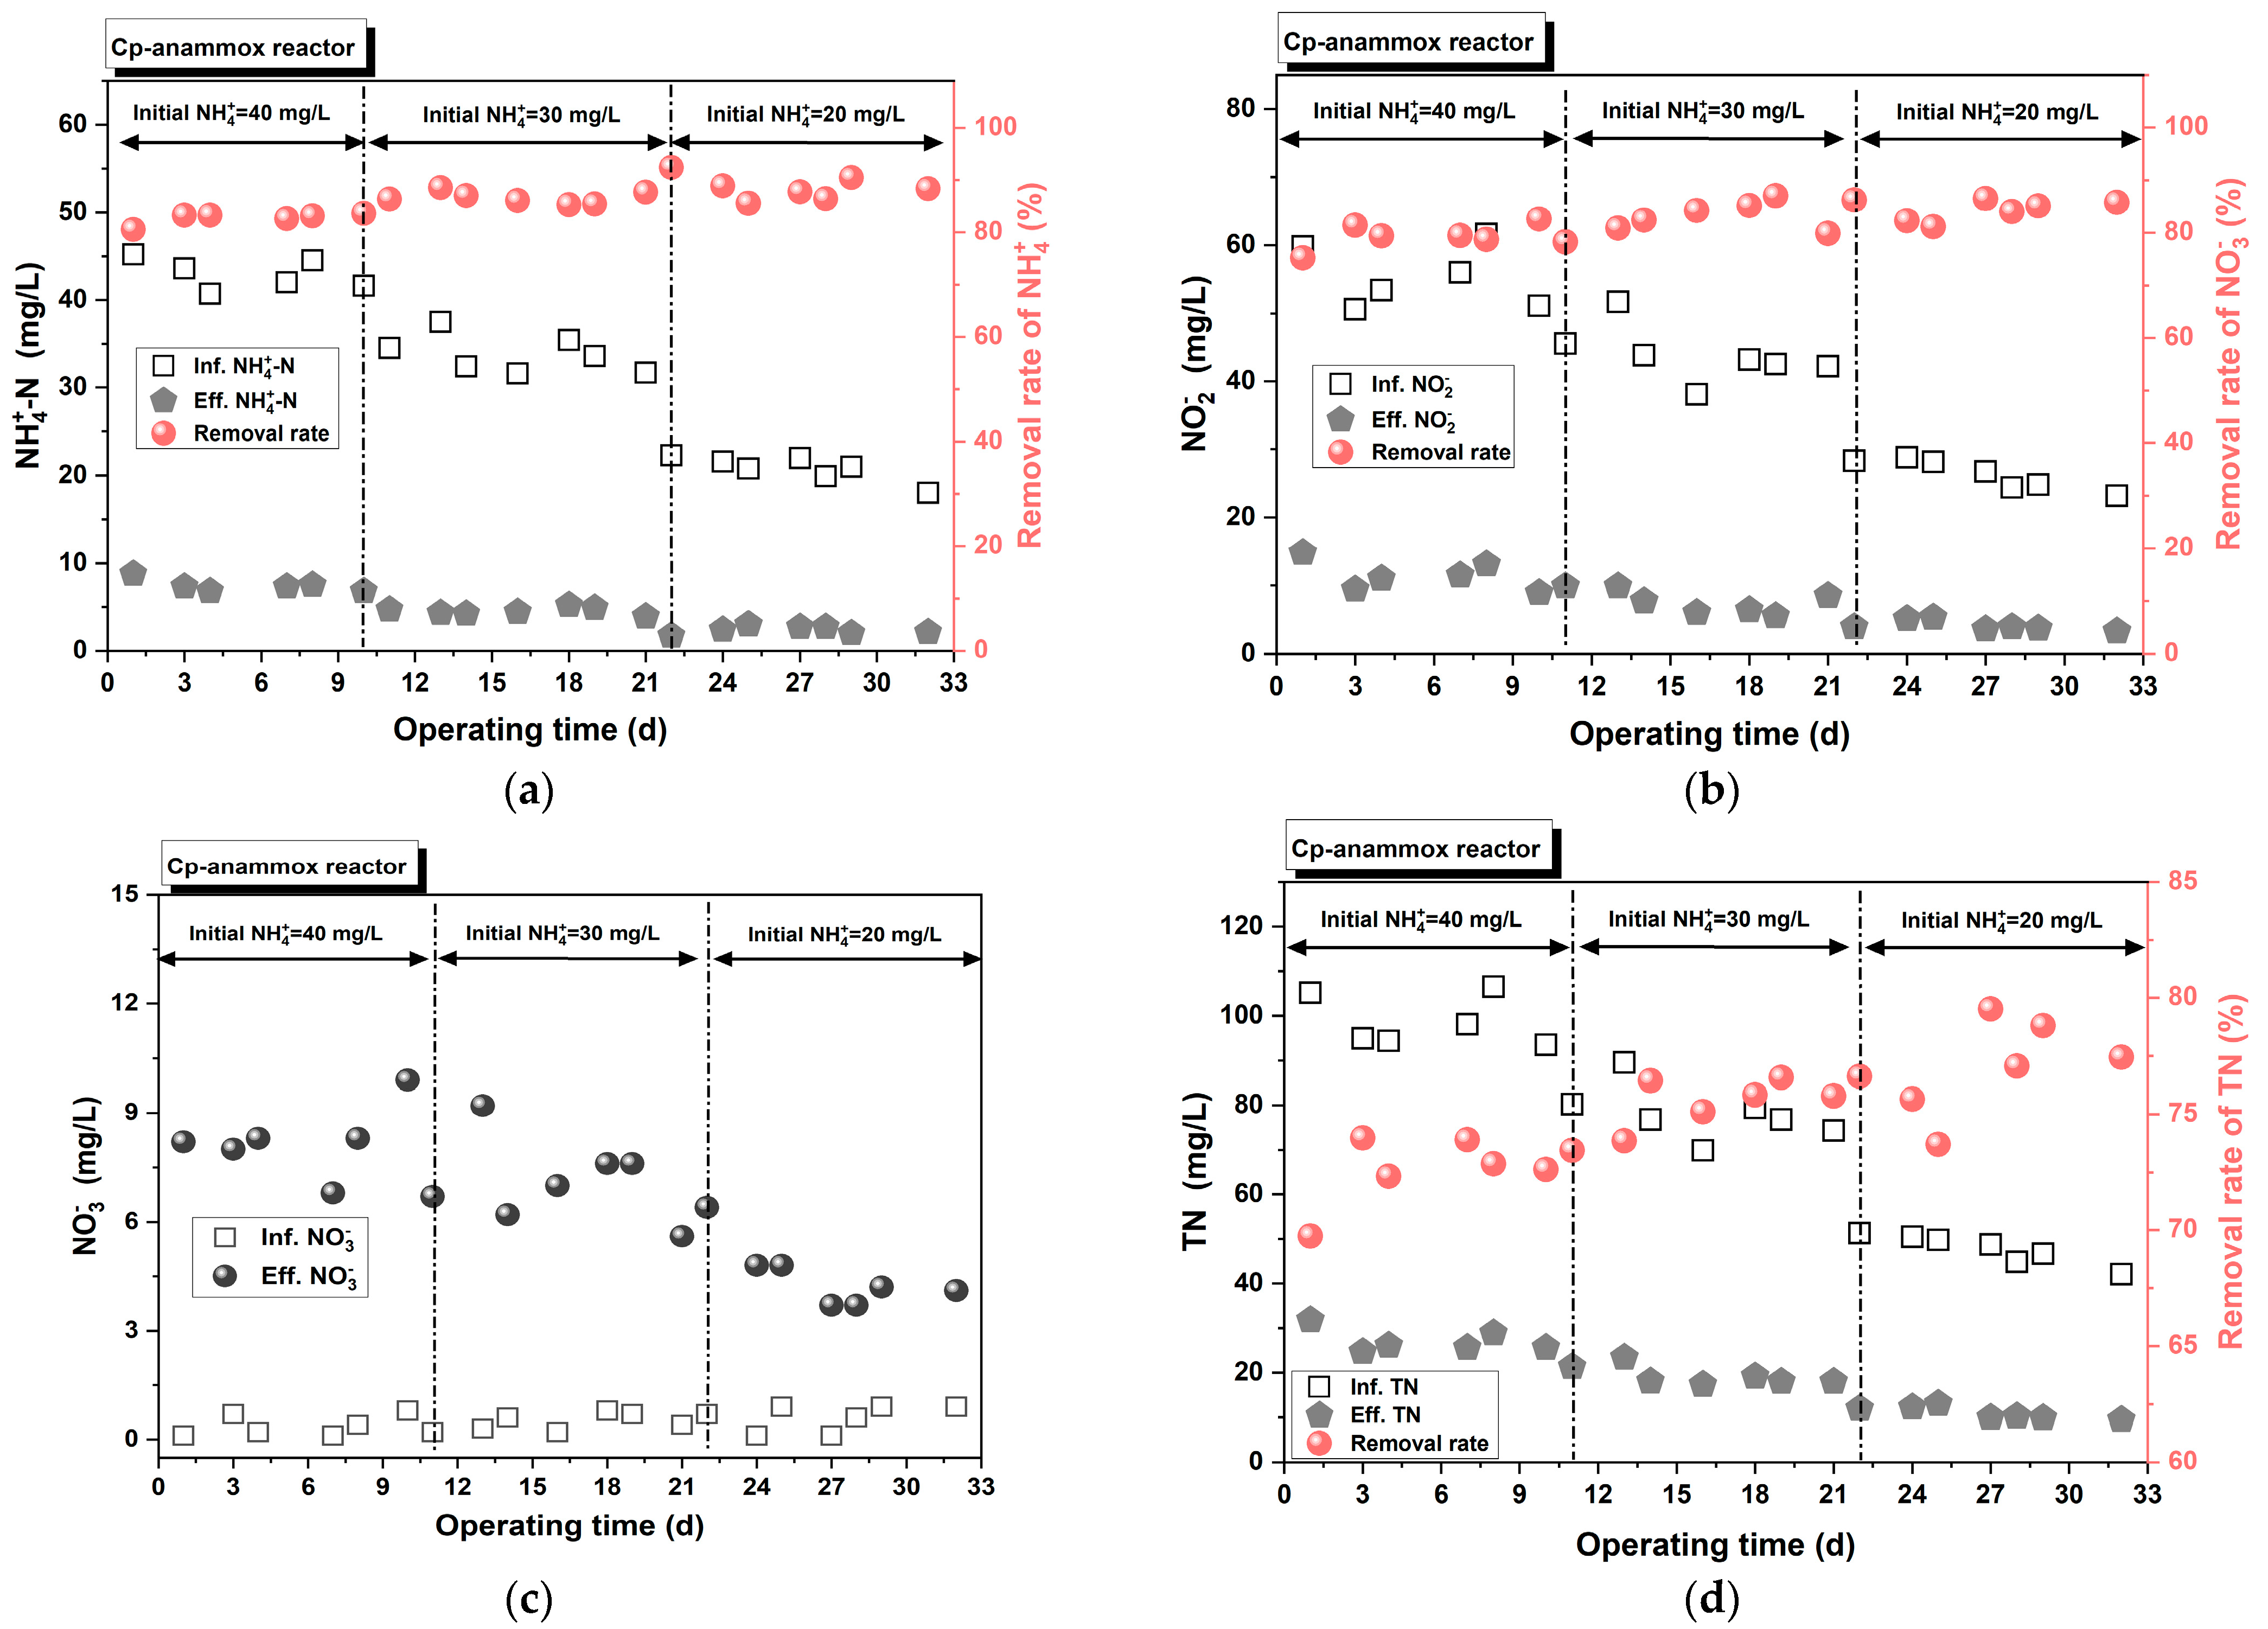
In Figure 9a, if the initial NH 4 + - N decreased from 40 mg/L to 20 mg/L, the NH 4 + - N removal efficiency achieved by the Cp-anammox reactor were 82.7 ± 1%, 86.6 ± 1.1%, 88.5 ± 2.2%, respectively. Concurrently, the consumption rate of NO 2 (Figure 9b) was 79.5 ± 2.3%, 82.6 ± 2.9%, 84.4 ± 1.9%, respectively. In addition, a proportional decrease in NO 3 accumulation was observed in Figure 9c. Correspondingly, the TN removal efficiency (Figure 9d) increased from 72.6 ± 1.4% to 77.0 ± 1.8%. When the initial NH 4 + - N was 30 mg/L, the effluent NH 4 + - N fluctuated between 3.9~5.2 mg/L. Upon further reduction of the initial NH 4 + - N to 20 mg/L, the effluent NH 4 + - N remained below 3 mg/L, which stably meets the class A requirement by the operation of 22 day.
In Figure 10, the removal efficiency of NH 4 + - N , NO 2 - N and TN by the Spon-anammox reactor exhibited a similar trend to those observed in the Cp-anammox reactor. Specifically, under the initial NH 4 + - N concentration decreased from 40 to 20 mg/L, the NH 4 + - N removal efficiency (Figure 10a) were 85.6 ± 2%, 86.4 ± 3.6%, and 90.5 ± 1.3%, respectively. Figure 10b illustrates the corresponding consumption rates of NO 2 - N , which were 81.6 ± 1.7%, 84.0 ± 2.8%, and 85.0 ± 3.2%, respectively. Concurrently, the accumulated concentration of NO 3 - N decreased synchronously from 7.7 ± 1 mg/L to 3.7 ± 0.6 mg/L (Figure 10c), while the TN removal efficiency remained within the range of 74.8 ± 1.9%~78.4 ± 2.6% (Figure 10d). When the initial NH 4 + - N was 30 mg/L, the effluent NH 4 + - N of the Spon-anammox reactor consistently remained below 5 mg/L, stably meeting the class A requirement by the 11th day of operation.
NH 4 + - N and NO 2 - N serve as essential substrates for the anammox process, yet they also exhibit inhibitory effects on AnAOB, with this inhibition being reversible during short-term operation [28]. The impact of NH 4 + - N on anammox process is primarily influenced by three factors: NH 4 + - N concentration, FA concentration, and the relationship of FA and NH 4 + - N . On one hand, one study [29] revealed that the ammonia inhibition in the anammox process is more closely associated with the concentration of unionized FA rather than the total NH 4 + - N concentration. On the other hand, the concentration of FA significantly affects the anammox efficiency [30]. The inhibitory effect of FA on AnAOB is attributed to its ability to easily penetrate the cell membrane and dissolve in lipids. The lipid-soluble FA molecules disrupt the proton balance of AnAOB, ultimately leading to inhibition through the generation of a specific enzyme [29]. There exists both a maximum [31] and minimum [32] threshold concentration of FA; concentrations below or above these thresholds inhibit the cultivation of AnAOB and disturb the stability of the anammox process. Furthermore, if the NH 4 + - N supply exceeds the necessary stoichiometric proportion (e.g., NH 4 + - N / NO 2 - N ratio of 1.85–3.48), NH 4 + - N accumulates in the reactor, which subsequently increases FA levels and hinders the removal efficiency of NO 2 - N [24]. In this study, the initial NH 4 + - N concentration ranged from 40 to 20 mg/L, with the NH 4 + - N / NO 2 - N maintained at 1:1.32 at three stages. The significant removal efficiency of NH 4 + - N and NO 2 - N by both the Cp-anammox reactor and Spon-anammox reactors indicate that NH 4 + - N and NO 2 - N were primarily utilized as substrates in this case, rather than acting as inhibitors for AnAOB. It is speculated that such low concentrations of NH 4 + - N had minimal inhibitory effects on AnAOB in both reactors.
The biological toxicity of NO 2 - N at this concentration was not evident, as it did not reach the threshold for AnAOB inhibition. Additionally, the low NH 4 + - N concentration and appropriate NH 4 + - N / NO 2 - N ratio resulted in less release or accumulation of FA, which did not reach the threshold concentration that would inactivate AnAOB or negatively affect the anammox process. Moreover, the Spon-anammox reactor contained a greater quantity and higher activity of AnAOB compared to the Cp-anammox reactor, resulting in better NH 4 + - N removal efficiency and quicker achievements of the class A requirement.

3.3.3. Impact of Influent COD Concentration

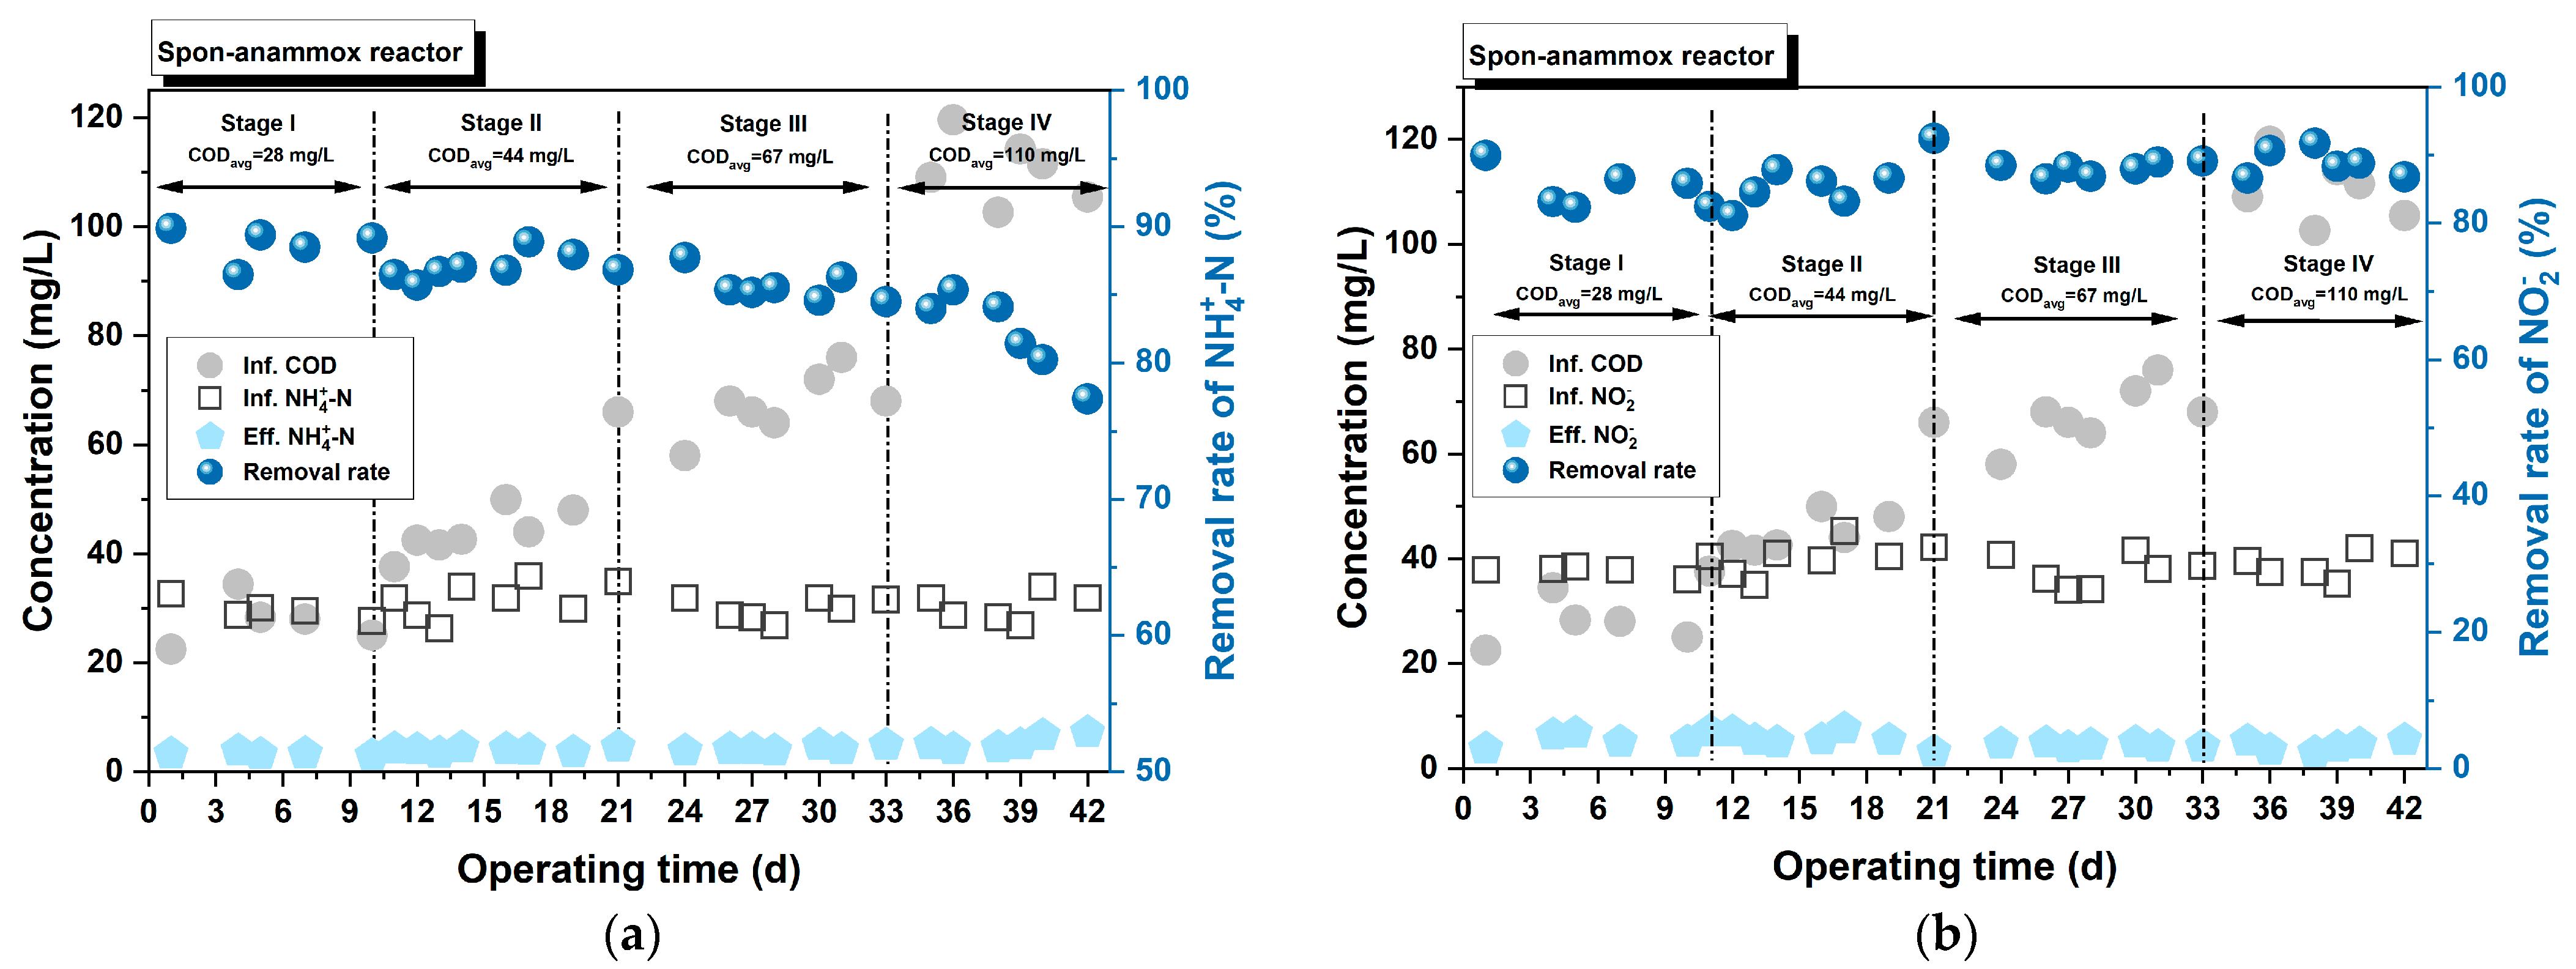
Given the stable operation of the Spon-anammox reactor under shorter EBRT, along with its improved nitrogen removal efficiency across varying influent NH 4 + - N concentrations, an investigation was conducted into the impact of influent COD on the reactor (Figure 11). The influent COD concentration was divided into four stages, with average concentrations of 28, 44, 67, and 110 mg/L, respectively. As depicted in Figure 11a, a gradual increase in influent COD concentration resulted in NH 4 + - N removal efficiency averaging 8.7 ± 1.2%, 87.1 ± 1%, 85.7 ± 1%, and 82.1 ± 2.7%, respectively. Notably, when the influent COD reached 100 mg/L, the effluent NH 4 + - N ranged between 4.2~7.2 mg/L, failing to meet the Class A standard [20]. Figure 11b reveals a marginal elevation in the consumption rate of NO 2 - N , rising from 85% (stages I and II) to 89% (stages III and IV). In Figure 11c, the accumulated concentration of NO 3 - N were 6.5 ± 1 mg/L, 5.5 ± 1.2 mg/L, 4.6 ± 0.5 mg/L and 3.9 ± 0.7 mg/L, respectively. As shown in Figure 11d, the TN removal efficiency mirrored the trend observed for NO 2 - N , averaging 78% (stage I and II) and 80% (stage III and IV), indicating that influent COD had a minimal impact on TN removal efficiency. Overall, these findings suggest that both NH 4 + - N removal and the accumulated concentration of NO 3 - N decreased significantly, while NO 2 - N removal experienced a slight increase, as the influent COD progressively increased to 110 mg/L.
As influent COD concentration ranged between 28~67 mg/L, the NH 4 + - N / NO 2 - N ratio was 1:1.22 ± 0.04~1:1.29 ± 0.05, and the NH 4 + - N / NO 3 - N was 1:0.25 ± 0.04~1:0.18 ± 0.04. Upon a further increase in COD to 110 mg/L, the NH 4 + - N / NO 2 - N ratio elevated to 1:1.39 ± 0.06, while the NH 4 + - N / NO 3 - N ratio decreased to 1:0.16 ± 0.02. These results indicated that a higher COD concentration in influent significantly inhibited the oxidation of NH 4 + - N in anammox process. Additionally, a portion of NO 2 - N was consumed but did not participate in the oxidation of NH 4 + - N . After the addition of more COD to influent, NO 2 - N consumption increased, and NO 3 - N accumulation decreased. This phenomenon could be attributed to both NO 2 - N and NO 3 - N participating in the denitrification process (Equations (2) and (3)).
The impact of COD on AnAOB and the anammox process remains inconclusive. Some research [33] suggested that the anammox process was not affected negatively by a high influent COD concentration of 300 mg/L (the COD/N ratio = 5.0). Conversely, another research [34] indicated that AnAOB contributed more than 50% to N-removal when COD was 220~300 mg/L; the N-removal performance of anammox system deteriorated rapidly when COD > 300 mg/L, owing to severe inhibition of AnAOB activity by high influent COD. One study [35] investigated that an influent COD concentration exceeding 100 mg/L resulted in excessive growth of denitrifying bacteria, which reduced the stability and performance of anammox granular sludge (AnGS), which was consistent with our study. It also observed that influent COD altered the internal microstructure of AnGS, reducing both the abundance and activity of AnAOB, which directly influenced the effectiveness of the anammox process [35]. AnAOB are generally autotrophic bacteria that utilize CO2 or carbonate as carbon sources, ammonium as an electron donor, and nitrite as an electron acceptor [36]. Under hypoxic conditions, denitrifying bacteria, which are facultative heterotrophic bacteria, can perform anaerobic respiration using NO 3 - N as electron acceptor and organic matter (such as COD) as electron donor, ultimately formed organic nitrogen compounds or N2 (Equation (4)) to complete denitrification process. In this study, if influent COD increased to 110 mg/L, it was speculated that abundant COD served as a substrate to promote the growth of denitrifying bacteria. Simultaneously, denitrifying bacteria competed for NO 2 - N substrate with AnAOB, which led to a lower NH 4 + - N removal efficiency and reduced NO 3 - N accumulation. Municipal wastewater contains COD, which inevitably has adverse effects on AnAOB. Therefore, it is recommended to appropriately incorporate pretreatment units (such as BAF) to reduce the impact of COD on the anammox unit in practical engineering applications.
NO 2 + 3 H + 0.5 N 2 + H 2 O + OH
NO 3 + 5 H + 0.5 N 2 + 2 H 2 O + OH
NO 3 + Organic   carbon denitrifying   bacteria N 2 + CO 2 + H 2 O

3.4. Evaluation of BAF/AX Combined Process

3.4.1. Treating Performance

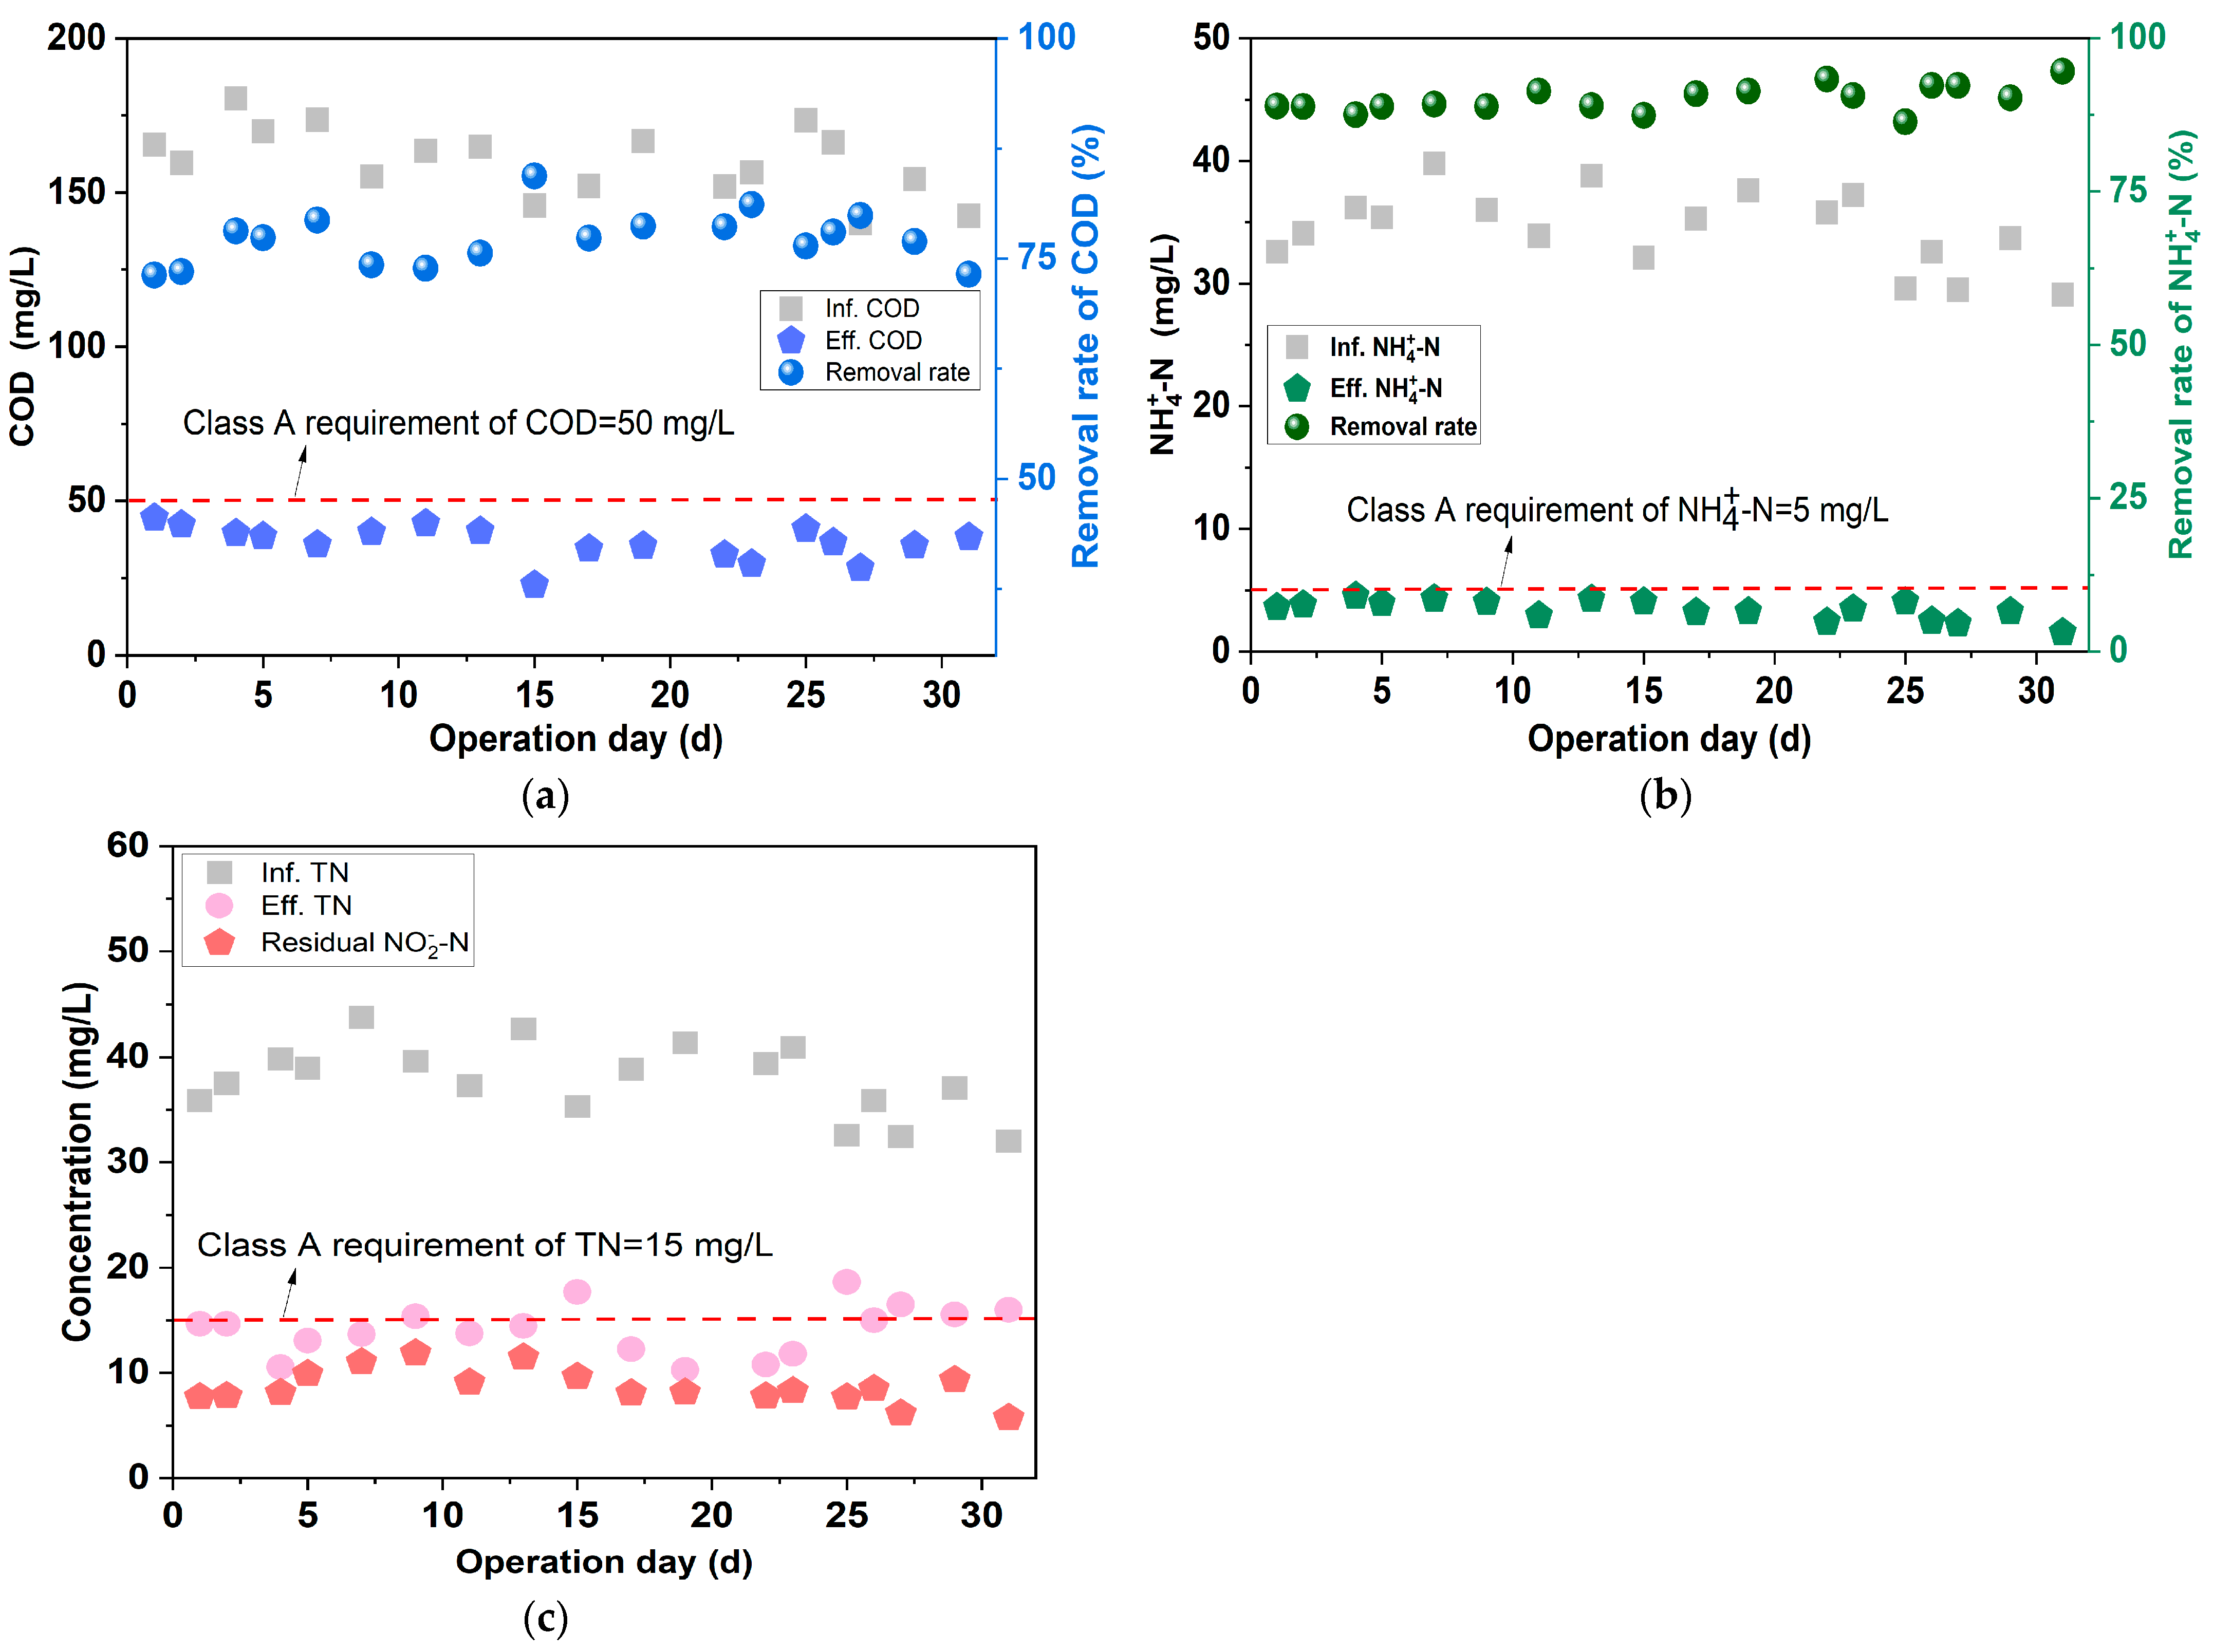
Under low aeration intensity conditions, the BAF/AX process was continuously operated for a duration of 30 days, with its treatment efficiency depicted in Figure 12. As evident from Figure 12a, the COD removal efficiency consistently ranges between 73.2~79.9%, ensuring that the effluent COD complied with Class A standards. Figure 12b illustrates that the NH 4 + - N removal efficiency varied from 90.3% to 94.6%, resulting in an effluent NH 4 + - N concentration of less than 5 mg/L. In Figure 12c, the effluent TN was observed to be 15–18 mg/L. It is noteworthy that the presence of residual NO 2 - N in the effluent was attributed to its deliberate addition during the anammox process. Excluding this residual NO 2 - N , the effluent TN was primarily maintained with the range of 6.3~10.9 mg/L, satisfying the Class A requirement. For practical applications, it is recommended to precisely introduce NO 2 - N into the anammox unit via an online control system, thereby achieving the effluent TN emission standards.
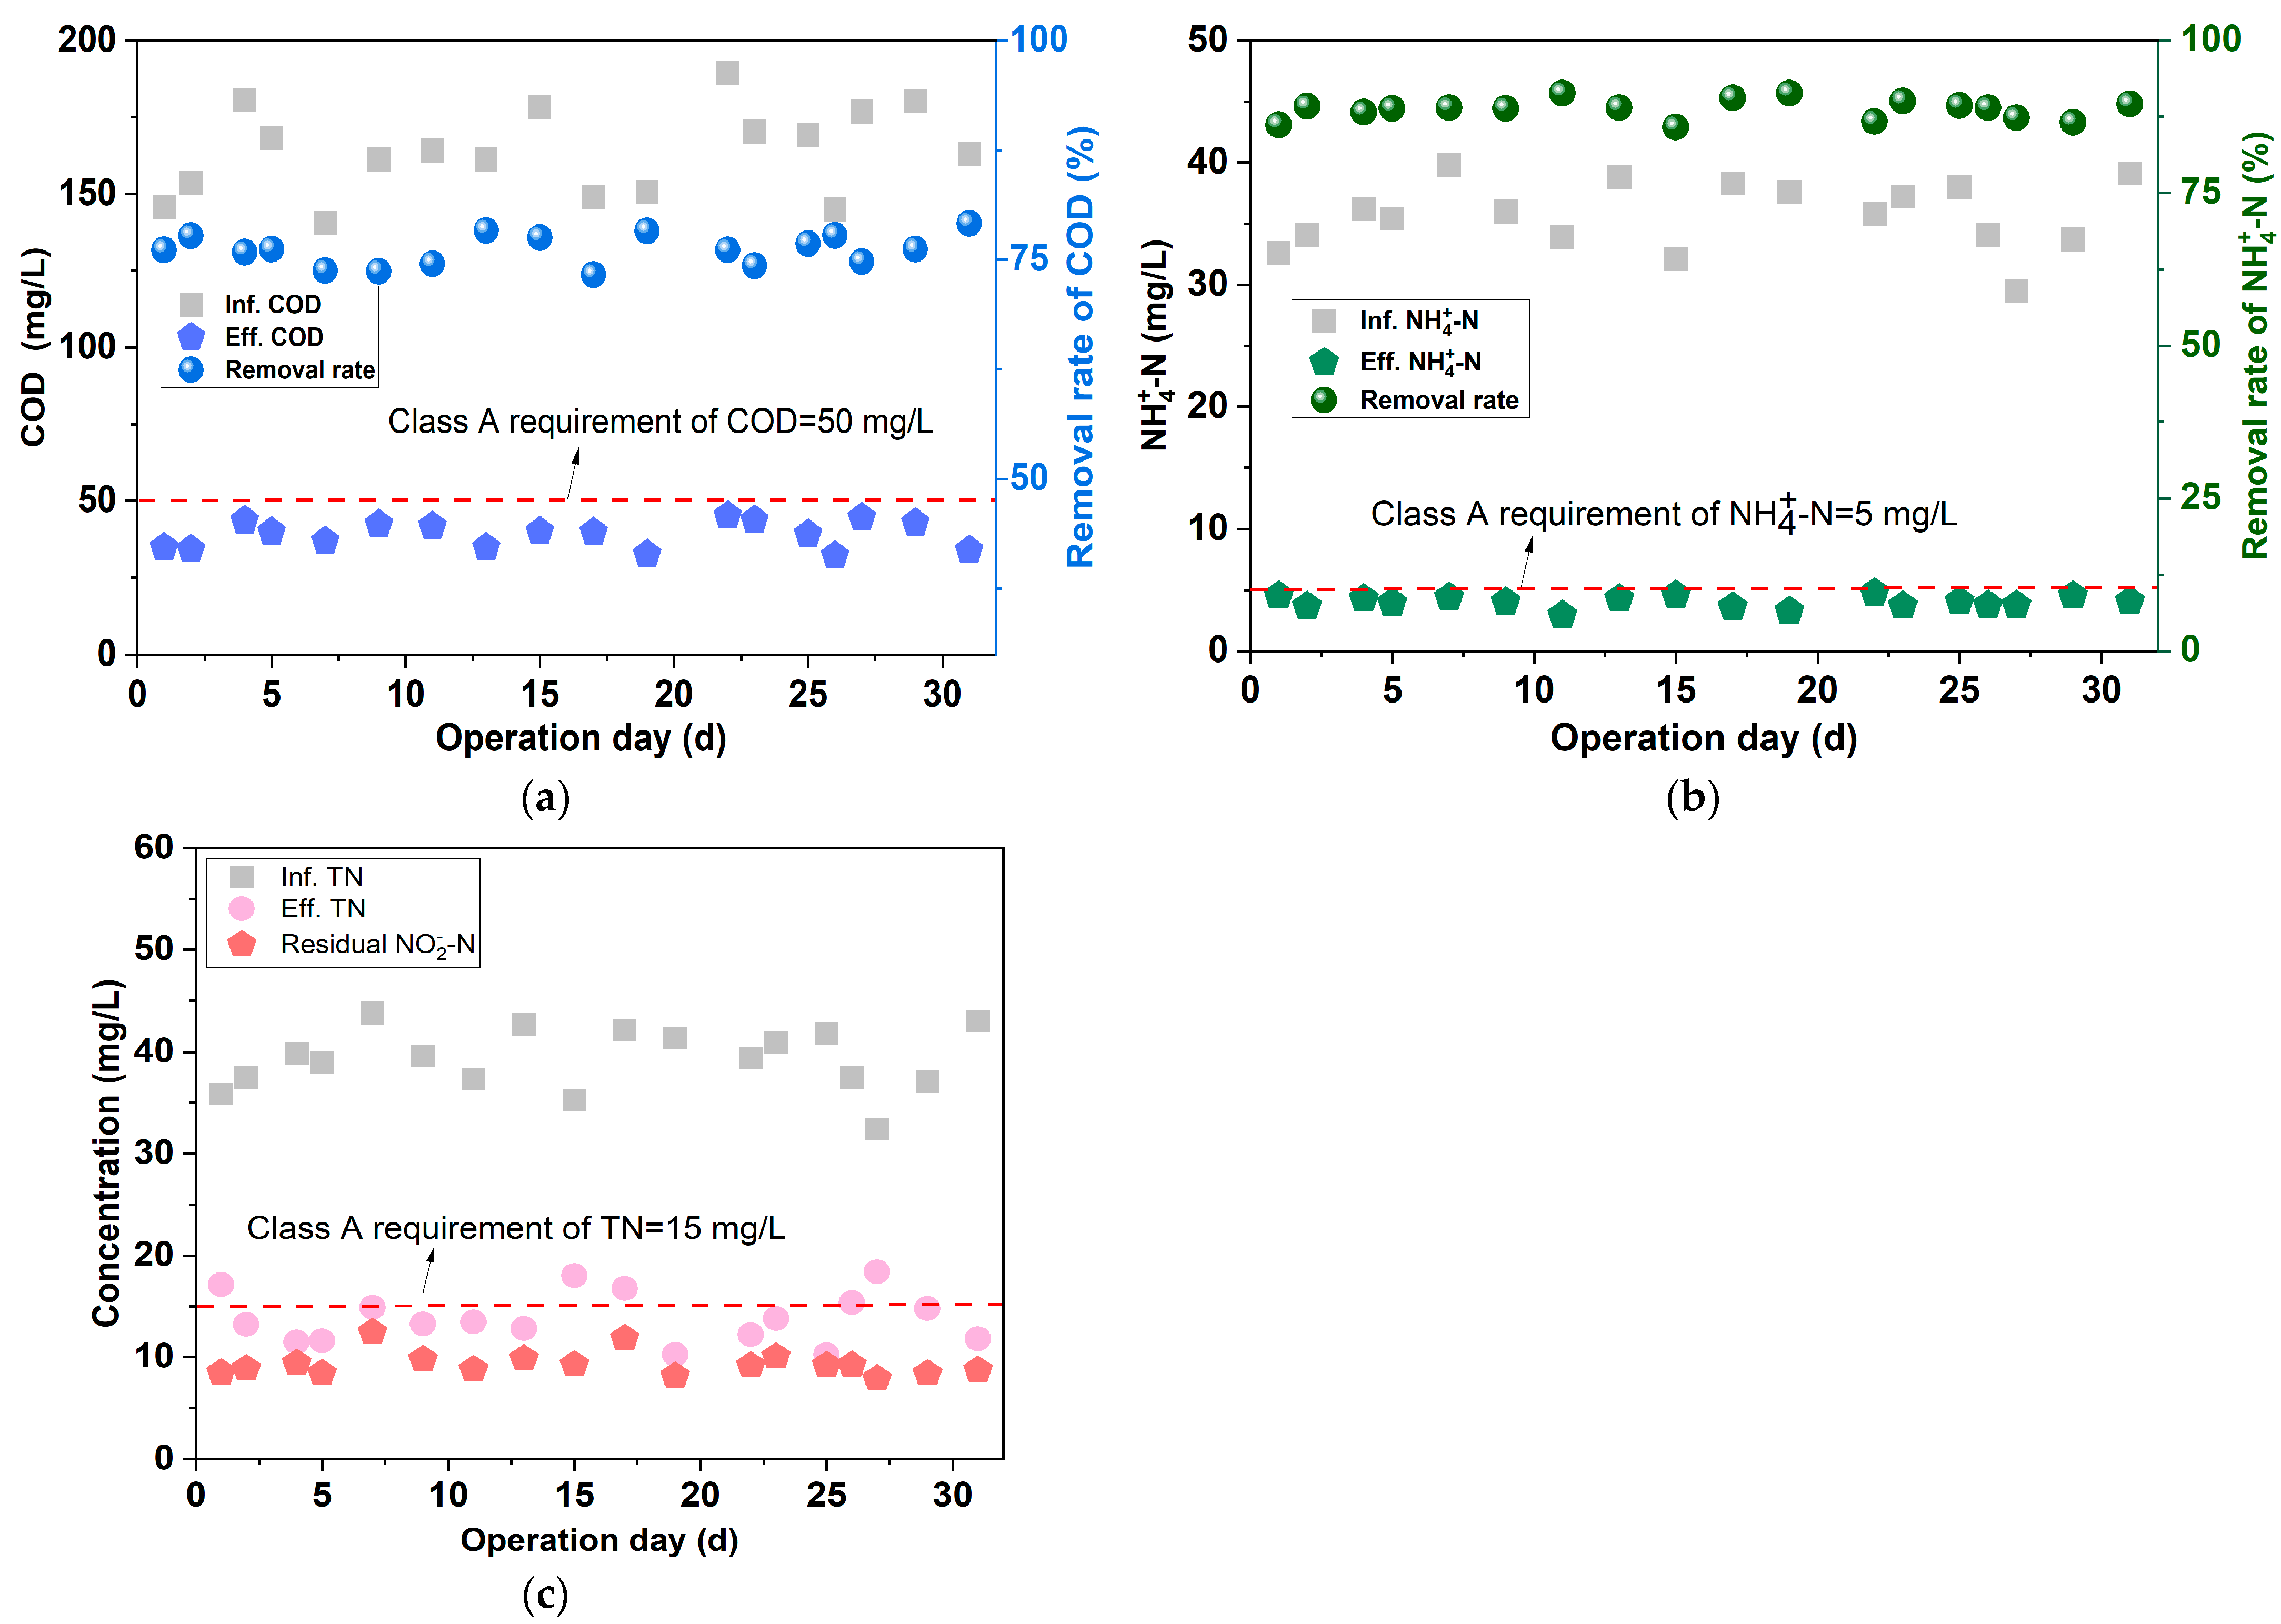
Under the shorter EBRT operation in the BAF unit, the treatment performance of BAF/AX is presented in Figure 13. The removal efficiency of COD (Figure 13a) and NH 4 + - N (Figure 13b) were sustained at 74.8~79.1% and 86.6~89.6%, respectively. After accounting for the residual NO 2 - N , the effluent TN was maintained at approximately 3.1~10.5 mg/L (Figure 13c). In this situation, the effluent quality still met the Class A requirement.

3.4.2. Economic Cost and Engineering Potential Analysis

Under the two operation strategies, the treatment volume load (TVL) of COD and NH 4 + - N by BAF was presented in Table 6. When the BAF was operated at low aeration intensity, the TVL of COD was reduced by 0.41 kg/(m3·d) compared to the original BAF, while the TVL of NH 4 + - N was merely 0.08 kg/(m3·d). Similarly, under low EBRT conditions, the TVL of COD decreased by 0.34 kg/(m3·d), and the TVL of NH 4 + - N was 0.11 kg/(m3·d). In comparison to traditional BAF, both strategies, low aeration intensity and low EBRT, effectively reduce the nitrification of NH 4 + - N while ensuring satisfactory COD removal. Furthermore, these strategies provided an improved ammonia nitrogen substrate for subsequent anammox units. Notably, the low aeration intensity BAF demonstrated remarkable energy-saving performance by reducing aeration requirements compared to conventional ones. Meanwhile, the low EBRT strategy indirectly facilitated the expansion of the BAF’s treatment volume, enabling it to treat twice the concentration of water processed by conventional BAF systems.
The costs associated with three combined processes are presented in Table 7, which include BAF-DN, BAF/AX operating under low aeration intensity (denoted as BAF(lowAI)-anammox) or low EBRT (denoted as BAF(lowEBRT)-anammox). The cost analysis comprised two primary components: chemical consumption and power consumption due to aeration. The BAF-AN process necessitated additional carbon sources for denitrification, with the chemicals’ cost per ton of wastewater treatment calculated using Equation (5). For the BAF/AX processes, the chemicals cost was incurred by the addition of sodium nitrite, calculated by Equation (6). The electrical energy consumption for aeration in the BAF process is given in Equation (7), assuming an aeration intensity of 2.1 m3/(m2·h). The electrical cost for the BAF(lowAI)-anammox process, calculated with an aeration intensity of 0.4 m3/(m2·h), was 0.055 yuan. In comparison to BAF-DN, the BAF(lowEBRT)-anammox process doubled the treated wastewater capacity, thus the electrical cost was calculated as 0.144 yuan. Moreover, the depreciation cost of BAF should be considered, as shown in Equation (8). In brief, the chemicals costs for the two BAF/AX processes (0.616 yuan) were higher than those for BAF-AN process (0.280 yuan). However, the BAF(lowEBRT)-anammox offered a significant advantage in terms of electricity cost and doubled the treatment volume without requiring an additional BAF tank. This translated to savings in depreciation costs of the BAF (0.347 yuan) when the same treatment volume was considered. These findings demonstrate that the low EBRT strategy is advantageous in the BAF/AX process, as it realizes the expansion of treated wastewater capacity while ensuring performance and cost savings.
P 1 = q 1 × m 1 = 0.00008 × 3500 = 0.280
where, P 1 was the chemicals’ cost per ton of wastewater by the BAF-DN process, yuan/m3; q 1 was the dosage of sodium acetate per ton of wastewater, if C/N was 5.0 and removal of TN was 20 mg/L, the dosage of sodium acetate was calculated as 80 mg/L; m 1 was the cost of sodium acetate, which was priced at 3500 yuan/ton.
P 2 = q 2 × m 2 = 0.00022 × 2800 = 0.616
where, P 2 was the chemicals’ cost per ton of wastewater by BAF/AX process, yuan/m3; q 2 was the chemicals cost produced by adding extra NO 2 - N . The dosage of NO 2 - N averaged at 220 mg/L, if NH 4 + - N and TN separately averaged at 30 mg/L and 35 mg/L; m 2 was the cost of sodium nitrite, priced at 2800 yuan/ton.
P 3 = p × t × n Q = 3 × 24 × 0.8 200 = 0.288
where, P 3 was electricity cost per ton of wastewater; p was the power of the aeration pump, set as 3 kW in the BAF process; t was the aeration time, 24 h; n was the price of industrial electricity, 0.8 yuan/(kW·h); and Q was the treating volume of wastewater, 200 m3/d.
P 4 = M × ( 1 i ) Y ×   Q 1 × 365 = 4000 × ( 1 5 % ) 30 × 1 × 365 = 0.347
where, P 4 was the depreciation cost of BAF, in yuan; M was the unit price of construction, 4000 yuan/ton wastewater (including fees for expropriating land); i was the residual value rate, 5%; Y was the depreciation time, 30 years; and Q 1 was the unit treating volume, 1 m3.
In a typical nitrifying and denitrification process, the DNF unit removes TN by supplementing with an additional carbon source. If the DNF unit is replaced by an anammox unit, TN removal can be achieved by adding extra NO 2 - N , which could reduce the dosage cost of chemicals. In addition, it is suggested to use an online dosing system for precise addition of sodium nitrite in practical applications. This aims to avoid chemical waste while meeting the water quality standard for TN. Additionally, for sewage treatment plants with expansion needs, using sponges as a carrier for the anammox unit is proposed, which can save capital costs while ensuring treatment performance. To further reduce the costs of chemicals in the BAF/AX combined process, a strategy is proposed to add an insufficient amount of nitrous nitrogen to the anammox unit. Based on this design concept, the combined process of BAF/AX-BAF is presented in Figure 14a. In this process, the COD in wastewater is primarily removed by the first BAF unit, while ammonia nitrogen is mainly removed in the anammox unit. In the anammox unit, extra nitrite is added according to a concentration ratio ( NO 2 - N / NH 4 + - N ) of 0.7~0.8. This approach prevents the complete removal of ammonia nitrogen from the anammox unit, allowing for the complete removal of nitrous nitrogen. The remaining ammonia nitrogen can then be removed in the second BAF unit, ultimately achieving the goal of higher water quality. For the BAF/AX-BAF process, if half of the BAF volume is used to treat raw water, and the other half is used to treat the anammox effluent, the water quality can be improved without increasing the land occupation (Figure 14b). In this scenario, the capacity expansion of treated water in the BAF unit can be achieved by adopting the low EBRT strategy.

4. Conclusions

In this study, the feasibility of the combined BAF/AX process was systematically evaluated for the treatment of low C/N ratio sewage, such as municipal wastewater:
(1)
To provide suitable influent quality for the anammox unit, the treatment performance of the BAF was investigated under various aeration intensities and EBRTs. In the BAF unit, when the aeration intensity was 0.4 m3·m−2·h−1 or the EBRT was 30 min, the effluent COD was ≤55 mg/L, and the removal efficiency of NH 4 + - N was as low as 4~12%, which provided ammonia nitrogen substrate for the subsequent anammox units.
(2)
The anammox process was successfully launched and operated using two carriers: ceramic particles and sponges. Furthermore, the Spon-anammox reactor displayed superior nitrogen removal capability under the following conditions: a shorter EBRT of 40 min, an initial NH 4 + - N ≤ 30 mg/L, or an influent COD ≤ 67 mg/L.
(3)
When the BAF was operated under the aforementioned condition as the control strategy, the effluent from the combined BAF/AX process met the Class A requirement. Compared to low aeration intensity, a control strategy such as low EBRT in the BAF demonstrated greater advantages for wastewater treatment in the combined BAF/AX process. This was because the treating capacity was expanded without the need for additional treatment units or land, and also reduced costs.

Supplementary Materials

The following supporting information can be downloaded at https://www.mdpi.com/article/10.3390/w16192821/s1: Text S1. The cultivation procedures of anammox inoculated sludge in this study; Text S2. Information of sponge carrier in anammox reactor in this study; Text S3. Discharge standard of pollutants for municipal wastewater (GB18918-2002, China) [20]; Table S1. Quality of actual domestic sewage added in synthetic wastewater for the BAF/anammox combined process; Table S2. Composition of synthetic wastewater for the anammox reactor in start-up period; Figure S1. The BAF reactors used in this study; Figure S2. The anammox reactors used in this study.

Author Contributions

Conceptualization and supervision, J.L. and X.Z.; methodology, Z.W.; validation and formal analysis, W.X. and Z.W.; writing—review and editing, W.X.; review, T.S. and Y.L. All authors have read and agreed to the published version of the manuscript.

Funding

This research was funded by the following funds: Shenzhen Science and Technology Innovation Commission (Grant No.: KCXFZ20211020163404006, Grant No.: GJHZ20220913143007014), National Major Science and Technology Projects of China (Grant No.: 2017ZX07401001-06), and Tianchi Talents Project (Xinjiang, China).

Data Availability Statement

Data are contained within the article and Supplementary Materials.

Conflicts of Interest

The authors declare no conflicts of interest.

Abbreviations

BAF Biological aerated filter
anammoxAnaerobic ammonia oxidation process
NH 4 + - N Ammonia nitrogen
EBRTEmpty bed residence time
CODChemical oxygen demand
TNTotal nitrogen
TPTotal phosphorus
DNDenitrification
NH 4 + - N / NO 2 - N The ratio of NH 4 + - N and NO 2 - N
AnAOBAnaerobic ammonia oxidation bacteria
DODissolved oxygen
NH 4 + - N / NO 2 - N / NO 3 - N The ratio of NH 4 + - N (removal concentration)/ NO 2 - N (removal concentration)/ NO 3 - N (generated concentration)
FAFree ammonia
AnGSANAMMOX granular sludge
TVLTreatment volume load
BAF/AXBAF/ANAMMOX process
lowAILow aeration intensity
Inf.Influent
Eff.Effluent

References

  1. Dong, Y.; Cheng, X.; Li, C.; Xu, L. Spatially eutrophication potential and policy implication of nitrogen emission for surface water: A case study in Guangzhou city, China. Environ. Manag. 2023, 342, 118336. [Google Scholar] [CrossRef] [PubMed]
  2. Dong, Y.; Cheng, X.; Li, C.; Xu, L.; Lin, W. Characterization of nitrogen emissions for freshwater eutrophication modelling in life cycle impact assessment at the damage level and urban scale. Ecol. Indic. 2023, 154, 110598. [Google Scholar] [CrossRef]
  3. Galoppo, S.; Fenti, A.; Falco, G.; Huang, Q.; Chianese, S. Efficient electrochemical removal of ammoniacal nitrogen from livestock wastewater: The role of the electrode material. Heliyon 2024, 10, e36803. [Google Scholar] [CrossRef] [PubMed]
  4. He, T.; Zhang, M.; Chen, M.; Wu, Q.; Yang, L.; Yang, L. Klebsiella oxytoca (EN-B2): A novel type of simultaneous nitrification and denitrification strain for excellent total nitrogen removal during multiple nitrogen pollution wastewater treatment. Bioresour. Technol. 2023, 367, 128236. [Google Scholar] [CrossRef] [PubMed]
  5. Huang, S.; Zhang, B.; Zhao, Z.W. Metagenomic analysis reveals the responses of microbial communities and nitrogen metabolic pathways to polystyrene micro(nano)plastics in activated sludge systems. Water Res. 2023, 241, 120161. [Google Scholar] [CrossRef]
  6. Biase, A.; Kowalski, S.M.; Devlin, T.R.; Oleszkiewicz, J.A. Moving bed biofilm reactor technology in municipal wastewater treatment: A review. J. Environ. Manag. 2019, 247, 849–889. [Google Scholar] [CrossRef]
  7. Hu, H.; Han, H.; Ma, W.; Wang, W.; Wang, B. Research on a pre-denitrification double-layer media biological aerated filter in municipal wastewater treatment. Desalination Water Treat. 2011, 31, 366–371. [Google Scholar] [CrossRef]
  8. Wang, H.; Dong, W.; Li, T.; Liu, T. A modified BAF system configuring synergistic denitrification and chemical phosphorus precipitation: Examination on pollutants removal and clogging development. Bioresour. Technol. 2015, 189, 44–52. [Google Scholar] [CrossRef]
  9. Zhou, H.; Xu, G. Biofilm Characteristics, Microbial Community Structure and Function of an Up-flow Anaerobic Filter-Biological Aerated Filter (UAF-BAF) Driven by COD/N Ratio. Sci. Total Environ. 2020, 708, 134422. [Google Scholar] [CrossRef]
  10. Meng, X.M.; Fan, F.F.; Wu, L.F. Prediction of Major Pollutants Discharge from Wastewater in 31 Cities of China. Sustain. Prod. Consum. 2021, 26, 54–64. [Google Scholar]
  11. Miao, Y.; Zhang, J.; Peng, Y.; Wang, S. An improved start-up strategy for mainstream Anammox process through inoculating ordinary nitrification sludge and a small amount of Anammox sludge. J. Hazard. Mater. 2020, 384, 121325. [Google Scholar] [CrossRef] [PubMed]
  12. Zhang, Y.; Zhang, J.; Yu, D.; Li, J.; Zhao, X.; Ma, G.; Zhi, J.; Dong, G.; Miao, Y. Migration of microorganisms between nitrification–denitrification flocs, anammox biofilms and blank carriers during mainstream anammox start-up. Bioresour. Technol. 2024, 393, 130129. [Google Scholar] [CrossRef] [PubMed]
  13. Xing, B.S.; Tang, X.F.; Li, L.H.; Fu, Y.L.; Liu, J.Y.; Wang, Y.G.; Sun, X.X.; Li, Y.Y.; Chen, R.; Jin, R.C. A new substrate equalization method for optimizing the influent conditions and fluid flow patterns of a multifed upflow anaerobic sludge blanket reactor with mature anammox granules. Bioresour. Technol. 2024, 400, 130700. [Google Scholar] [CrossRef]
  14. Ma, X.; Zhang, X.R.; Sun, Y.J.; Xi, Z.H.; Liu, J.Z.; Feng, Z.T.; Zhou, J.M.; Liu, X.T.; Wang, Y.; Jin, R.C.; et al. Reason and control strategy for denitrification and anammox sludge flotation in nitrogen removal process: Mechanisms, strategies and perspectives. Environ. Res. 2024, 258, 119456. [Google Scholar] [CrossRef]
  15. Chen, G.; Zhang, Y.; Wang, X.; Chen, F.; Lin, L.; Ruan, Q.; Wang, Y.; Wang, F.; Cao, W.; Chiang, P. Optimizing of operation strategies of the single-stage partial nitrification-Anammox process. J. Cleaner Prod. 2020, 256, 120667. [Google Scholar] [CrossRef]
  16. Sui, Q.; Wang, Y.; Wang, H.; Yue, W.; Chen, Y.; Yu, D.; Chen, M.; Wei, Y. Roles of Hydroxylamine and Hydrazine in the In-situ Recovery of One-stage Partial Nitritation-Anammox Process: Characteristics and Mechanisms. Sci. Total Environ. 2020, 707, 135648. [Google Scholar] [CrossRef]
  17. Cui, B.; Yang, Q.; Liu, X.; Wu, W.; Liu, Z.; Gu, P. Achieving Partial Denitrification-Anammox in Biofilter for Advanced Wastewater Treatment. Environ. Int. 2020, 138, 105612. [Google Scholar] [CrossRef]
  18. Chen, S.; Zhang, Q.P.; Zhang, J.S.; An, N.; Yu, H.Y.; Fu, X.; Li, Z.H. Enhanced nitrogen removal for low C/N wastewater via preventing futile carbon oxidation and augmenting anammox. Water Res. X 2024, 25, 100253. [Google Scholar] [CrossRef] [PubMed]
  19. American Public Health Association, American Water Works Association, Water Environment Federation. APHA Standard Methods for the Examination of Water and Wastewater; American Public Health Association: Washington, DC, USA, 2005. [Google Scholar]
  20. GB18918-2002; Discharge Standard of Pollutants for Municipal Wastewater Treatment Plant. National Environmental Protection Administration, General Administration of Quality Supervision, Inspection and Quarantine of China: Beijing, China, 2002.
  21. Wu, Q.; Chen, C.; Zhang, Y.; Tang, P.; Ren, X.; Shu, J.; Liu, X.; Cheng, X.; Tiraferri, A.; Liu, B. Safe purification of rural drinking water by biological aerated filter coupled with ultrafiltration. Sci. Total Environ. 2023, 868, 161632. [Google Scholar] [CrossRef]
  22. Wang, K.; Zhou, Z.; Qiang, J.; Yu, S.; Wang, X.; Yuan, Y.; Zhao, X.; Qin, Y.; Xiao, K. Emerging wastewater treatment strategy for efficient nitrogen removal and compact footprint by coupling mainstream nitrogen separation with chemical coagulation and biological aerated filter. Bioresour. Technol. 2021, 320, 124389. [Google Scholar] [CrossRef]
  23. Hong, H.; Lin, Y.; Ou, Y.; Lin, X.; Chen, B.; Qin, Y. Fast start-up of anammox reactor under high-loading rate shock. Tech. Water Treat. 2023, 49, 97–101. (In Chinese) [Google Scholar]
  24. Zhang, L.; Yang, J.; Hira, D.; Fujii, T.; Zhang, W.; Furukawa, K. High-rate nitrogen removal from anaerobic digester liquor using an up-flow anammox reactor with polyethylene sponge as a biomass carrier. J. Biosci. Bioeng. 2011, 111, 306–311. [Google Scholar] [CrossRef] [PubMed]
  25. Zhang, B.; Zhang, N.; He, A.; Wang, C.; Li, Z.; Zhang, G.; Xue, R. Carrier type affects anammox community assembly, species interactions and nitrogen conversion. Bioresour. Technol. 2023, 369, 128422. [Google Scholar] [CrossRef]
  26. Wang, S.; Gong, H.; Ding, J.; Xu, E.; Cui, R.; Yang, D.; Gu, G.; Dai, X. Unbalanced inhibition on granular and mixed anammox sludge by different molecular weight fractions of unbiodegradable proportion of sludge anaerobic digestion reject water. J. Water Process. Eng. 2021, 42, 102197. [Google Scholar] [CrossRef]
  27. Yan, Y.; Li, X.; Ren, S.; Zhang, Q.; Wu, D.; Zhou, J.; Peng, Y. Efficient nitrogen removal and robustness enhancement of a two-stage partial nitrification-anammox (PN/A) process with low sludge concentration for mature landfill leachate. Bioresour. Technol. 2023, 387, 129573. [Google Scholar] [CrossRef]
  28. Fernández, I.; Dosta, J.; Fajardo, C.; Campos, J.L.; Mosquera-Corral, A.; Méndez, R. Short- and long-term effects of ammonium and nitrite on the Anammox process. J. Environ. Manag. 2012, 95, S170–S174. [Google Scholar] [CrossRef]
  29. Cigdem, K.A.; Kozet, Y.; Bulent, M. Inhibitory effects of free ammonia on Anammox bacteria. Biodegrad. 2012, 23, 751–762. [Google Scholar]
  30. Dosta, J.; Fernández, I.; Vázquez-Padín, J.R.; Mosquera-Corral, A.; Campos, J.L.; Mata-Alvarez, J.; Méndez, R. Short- and long-term effects of temperature on the Anammox process. J. Hazard. Mater. 2008, 154, 688–693. [Google Scholar] [CrossRef] [PubMed]
  31. Yang, J.; Zhang, L.; Hira, D.; Fukuzaki, Y.; Furukawa, K. Highrate nitrogen removal by the Anammox process at ambient temperature. Bioresour. Technol. 2011, 102, 672–676. [Google Scholar] [CrossRef]
  32. Tang, C.J.; Zheng, P.; Mahmood, Q.; Chen, J.W. Start-up and inhibition analysis of the Anammox process seeded with anaerobic granular sludge. J. Ind. Microbiol. Biotechnol. 2009, 36, 1093–1100. [Google Scholar] [CrossRef]
  33. Leal, C.D.; Pereira, A.D.; Nunes, F.T.; Ferreira, L.O.; Coelho, A.C.C.; Bicalho, S.K.; Mac Conell, E.F.A.; Ribeiro, T.B.; de Lemos Chernicharo, C.A.; de Araújo, J.C. Anammox for nitrogen removal from anaerobically pre-treated municipal wastewater: Effect of COD/N ratios on process performance and bacterial community structure. Bioresour. Technol. 2016, 211, 257–266. [Google Scholar] [CrossRef] [PubMed]
  34. Wang, X.; Yang, R.; Guo, Y.; Zhang, Z.; Kao, C.M.; Chen, S. Investigation of COD and COD/N ratio for the dominance of anammox pathway for nitrogen removal via isotope labelling technique and the relevant bacteria. J. Hazard. Mater. 2018, 366, 606–614. [Google Scholar] [CrossRef] [PubMed]
  35. Zhang, X.; Liu, Y.; Li, Z.R.; Zhang, J.; Chen, Y.; Wang, Q. Impact of COD/N on anammox granular sludge with different biological carriers. Sci. Total Environ. 2020, 728, 138557. [Google Scholar] [CrossRef] [PubMed]
  36. Kuypers, M.M.M.; Marchant, H.K.; Kartal, B. The microbial nitrogen-cycling network. Nat. Rev. Microbiol. 2018, 16, 263–276. [Google Scholar] [CrossRef]
Figure 1. BAF/AX combined process in this study.
Water 16 02821 g001
Figure 2. Effect of reducing aeration intensity on the treating performance of BAF, (a) COD (b) NH 4 + - N , and (c) removal efficiency of COD after filler backwashing.
Water 16 02821 g002
Figure 3. Effect of reducing EBRT on the treating performance of BAF, (a) COD (b) NH 4 + - N , and (c) removal efficiency of COD after backwashing filler.
Water 16 02821 g003
Figure 4. Treating performance of Cp-anammox reactor during startup period, when using ceramic particle carrier: (a) NH 4 + - N ; (b) NO 2 ; (c) NO 3 ; (d) TN.
Water 16 02821 g004
Figure 5. Treating performance of Spon-anammox reactor during startup period with high substrate influent concentration: (a) NH 4 + - N ; (b) NO 2 ; (c) NO 3 ; (d) TN.
Water 16 02821 g005
Figure 6. Treating performance of Spon-anammox reactor during startup period with low influent concentration: (a) NH 4 + - N ; (b) NO 2 ; (c) NO 3 ; (d) TN.
Water 16 02821 g006
Figure 7. Treating performance of Cp-anammox reactor under different EBRT, (a) NH 4 + - N ; (b) NO 2 ; (c) NO 3 ; (d) TN.
Water 16 02821 g007
Figure 8. Treating performance of Spon-anammox reactor under different EBRT, (a) NH 4 + - N ; (b) NO 2 ; (c) NO 3 ; (d) TN.
Water 16 02821 g008
Figure 9. Treating performance of Cp-anammox reactor operated under different influent NH 4 + - N concentration, (a) NH 4 + - N ; (b) NO 2 ; (c) NO 3 ; (d) TN.
Water 16 02821 g009
Figure 10. Treating performance of Spon-anammox reactor operated under different influent NH 4 + - N concentration, (a) NH 4 + - N ; (b) NO 2 ; (c) NO 3 ; (d) TN.
Water 16 02821 g010
Figure 11. Treating performance of Spon-anammox reactor under different influent concentrations of COD, (a) NH 4 + - N ; (b) NO 2 ; (c) NO 3 ; (d) TN.
Water 16 02821 g011aWater 16 02821 g011b
Figure 12. The performance of the BAF/AX process operating under low aeration intensity, (a) COD; (b) NH 4 + - N ; and (c) TN in effluent.
Water 16 02821 g012
Figure 13. The performance of the BAF/AX process operating under low EBRT, (a) COD; (b) NH 4 + - N ; and (c) TN.
Water 16 02821 g013
Figure 14. Capacity expansion of treated amount and transformation design of BAF/AX combined process.
Water 16 02821 g014
Table 1. Composition of synthetic wastewater for the BAF/AX combined process used in this study.
CompositionChemicalsConcentration
CODC2H3NaO2120~160 mg/L
NH 4 + - N NH4Cl30~40 mg/L
Total phosphorus (TP)KH2PO42~3 mg/L
Calcium ion Ca2+10 mg/L
Magnesium ion Mg2+25 mg/L
AlkalinityCaCO3600 mg/L
Actual domestic sewage/5~10%
Table 2. The operation condition of the BAF unit during the start-up and operation period.
Operation UnitInfluentOther Condition
BAF NH 4 + - N , 30~40 mg/LAeration intensity, 0.4/1.3/2.1 m3·m−2·h−1;
EBRT, 30/40/60 min;
TN, 30~40 mg/L
COD, 120~160 mg/L
TP, 2~3 mg/L
Table 3. Parameters of anammox reactors during the start-up period.
ReactorStartup PeriodEBRT NH 4 + - N NO 2 - N
Cp-anammoxStage I4 h100 mg/L130 mg/L
Stage II2 h100~40 mg/L130~55 mg/L
Stage III1 h40~30 mg/L50~40 mg/L
Spon-anammoxStage I4 h80 mg/L100 mg/L
Stage II2 h80 mg/L100 mg/L
Stage III1 h80 mg/L100 mg/L
Stage I4 h30~40 mg/L40~50 mg/L
Stage II2 h30~40 mg/L40~50 mg/L
Stage III1 h30~40 mg/L40~50 mg/L
Table 4. Parameters of the anammox reactor during the operation period.
ReactorInfluence FactorEBRTInfluent NH 4 + - N Influent NO 2 - N
Cp-anammoxEBRT
(30/40/60 min)
/35~45 mg/L45~55 mg/L
Influent NH 4 + - N
(40/30/20 mg/L)
60 min/ NH 4 + - N / NO 2 - N
= 1:1.32
Spon-anammoxEBRT
(30/40/60 min)
/30~45 mg/L43~50 mg/L
Influent NH 4 + - N
(40/30/20 mg/L)
40 min/ NH 4 + - N / NO 2 - N
= 1:1.32
Influent COD
(20~110 mg/L)
40 min30~40 mg/L NH 4 + - N / NO 2 - N
= 1:1.32
Table 5. The operation condition of BAF/AX process under low aeration intensity or low EBRT.
Operation ConditionOperation UnitInfluentOther Condition
BAF/anammox under low aeration intensityBAF NH 4 + - N = 30~40 mg/L
TN = 30~40 mg/L
COD = 120~160 mg/L
TP = 2~3 mg/L
Aeration intensity =
0.4 m3·m−2·h−1
EBRT = 60 min
Spon-anammox reactor NO 2 - N = 45 mg/LEBRT = 60 min
BAF/anammox under low EBRTBAF NH 4 + - N = 30~40 mg/L
TN = 30~40 mg/L
COD = 120~160 mg/L
TP = 2~3 mg/L
Aeration intensity =
2.1 m3·m−2·h−1
EBRT = 30 min
Spon-anammox reactor NO 2 - N = 45 mg/LEBRT = 40 min
Table 6. Comparison of volumetric COD and NH 4 + - N loading rate by BAF under different conditions.
ParametersConventional BAF Operation
(kg·m−3·d−1)
BAF Operated under Low Aeration Intensity
(kg·m−3·d−1)
BAF Operated under Low EBRT
(kg·m−3·d−1)
COD2.682.272.34
NH 4 + - N 0.730.080.11
Table 7. Cost analysis of three combined processes, including of BAF-DN, BAF(lowAI)-anammox, and BAF(lowEBRT)-anammox.
ProcessCost of Chemicalss for Nitrogen Removal (yuan/m3)Electricity Costs from Aeration (yuan/m3)Depreciation Costs of BAF (yuan/m3)Total Cost
(yuan/m3)
BAF-DN0.2800.28800.568
BAF(lowAI)-anammox0.6160.05500.671
BAF(lowEBRT)-anammox0.6160.1440.3470.413
Disclaimer/Publisher’s Note: The statements, opinions and data contained in all publications are solely those of the individual author(s) and contributor(s) and not of MDPI and/or the editor(s). MDPI and/or the editor(s) disclaim responsibility for any injury to people or property resulting from any ideas, methods, instructions or products referred to in the content.