Article

The Spatial Evolution Characteristics of Phytoplankton and the Impact of Environmental Factors in a Harbor-Construction-Formed Reservoir

1
State Environmental Protection Key Laboratory of Estuarine and Coastal Environment, Chinese Research Academy of Environment Sciences, Beijing 100012, China
2
Water Environmental Research Department, Ningbo Research Institute of Ecological and Environmental Sciences, Ningbo 315012, China
3
Xiangshan Water Group Co., Ltd., Ningbo 315700, China
*
Author to whom correspondence should be addressed.
Water 2024, 16(19), 2813; https://doi.org/10.3390/w16192813
Submission received: 22 August 2024 / Revised: 23 September 2024 / Accepted: 25 September 2024 / Published: 2 October 2024
(This article belongs to the Section Water Quality and Contamination)

Abstract

:
Phytoplankton are an important part of aquatic ecosystems and substantially contribute to primary productivity. Under certain conditions, phytoplankton can grow or cluster in large numbers, resulting in enormous economic losses and serious threats to human life and health. In this study, complex causative species of algal blooms were examined and regulatory factors were determined in a reservoir formed by harbor construction. The reservoir is isolated from the harbor by sluice gates, forming a separate water region. Twelve species of phytoplankton, including normally and abnormally blooming species, were identified to be causing blooms in this continuous water. Different from the areas where simple algae caused blooms, multiple bloom-causative species, which were completely different, occurred at several stations. In this study area, whereas the abundance of algal cells was above 10 million cells/L, the total phosphorus concentration was higher than 0.2 mg/L. When the total phosphorus concentration was lower than 0.2 mg/L, there was no algal bloom. In waters with total algal cell abundance over 10 million, the N/P ratios were all <8. This study indicates that the occurrence of algal blooms in this water was influenced by the concentrations of total nitrogen and phosphorus, and total phosphorus plays a more important role.

Graphical Abstract

1. Introduction

Freshwater ecosystems are an important part of the Earth’s ecosystem, and they experience a series of problems, such as water quality deterioration, biodiversity decreases, and ecosystem imbalance [1]. Harmful algal blooms in freshwater have become global and local ecological disasters and often negatively impact the ecological environment, human health, and social economy [2,3]. Intense blooms are caused by the rapid growth or aggregation of phytoplankton, including Cyanobacteria, Chlorophyta, Dinophyta, and Bacillariophyta [4]. Generally, blooms caused by Cyanobacteria are directly related to the water quality for recreation, drinking water, fisheries, and human health because most of them are composed of potentially toxic algae [5]. Some Dinophyta produce toxic substances that are capable of forming toxic marine red tides [6]. In contrast, few examples of toxigenic algal species exist in freshwater, with only Dinophyta Peridinium polonicum being accurately documented [7,8]. While other non-toxin-producing Dinophyta and Bacillariophyta will not directly cause several aquatic organism deaths, they may affect the community structure of aquatic organisms and cause ecological disasters [9]. Therefore, studying the mechanisms of algal bloom occurrence is necessary for monitoring, early warning, and prevention to reduce harm.
In the natural environment, algae often cause blooms within a short period under suitable conditions. The main controlling factors of algal blooms and the mechanisms for the growth advantages of Cyanobacteria and other dominant species have been a common concern for scientists worldwide. The occurrence of freshwater algal blooms is mainly affected by the physiological characteristics of the algae, light intensity, temperature, nutrient concentrations, and many other factors [10]. The occurrence of algal blooms is closely related to water eutrophication, and Cyanobacteria are the most common causative species in fresh water, such as Lake Taihu, China [11]. In North America and Europe, Cyanobacterial blooms have occurred in approximately 60% of lakes since the Industrial Revolution, and their abundance is much higher than that of other phytoplankton [12]. For example, Lake Erie, which is the shallowest and warmest of North America’s Great Lakes, experiences serious algal blooms [13]. The nutritional sources of Lake Erie include urban domestic water, industrial wastewater, and agricultural nonpoint source pollution. In the 1960s and the early 1970s, phytoplankton, most commonly nitrogen-fixing Cyanobacteria Dolichospermum spp. and Aphanizomenon flosaquae, were thriving in the lake. The Lake Erie bloom was attenuated by phosphorus control in the 1970s and the 1980s but recurred in the 1990s. In addition to Cyanobacteria, there have been frequent reports of other algal blooms associated with eutrophication in freshwater. For example, in Lake Kinneret, Peridinium gatunense blooms have occurred in spring for many years [14]. Other areas include Lake Tohopekaliga in Florida [15], Lake Albufera in Spain [16], the Scheldt estuary in Belgium [17], and Wuli Lake in China [18]. A series of measures to control eutrophication have been adopted in these waters, and the structure of the phytoplankton community or the scale of algal blooms has changed. However, algal blooms continue to appear repeatedly and have not been completely eliminated.
The controlling factors and mechanisms of algal blooms are complex and require further investigation. In wild freshwater, usually, multiple distributed phytoplankton occur, and the regulatory environmental factors for the growth or aggregation of the dominant species that form algal blooms remain to be clarified. This study focused on a reservoir formed by harbor construction, as algal blooms have been poorly studied in this type of water, and clarified the spatial distribution characteristics of phytoplankton and revealed the differences in species and abundance in each station. The studied reservoir is located in the east of China, isolated from the harbor by sluice gates, forming a separate water region. The significant environmental factors of algal bloom spatial evolution characteristics, especially the influence of total nitrogen and total phosphorus concentration, were also explained.

2. Materials and Methods

2.1. Study Area and Sampling

Our study area was Datanggang Reservoir (121°49′12.81″ E, 29°13′19.73″ N) (Figure 1), located in Zhejiang Province, China. Datanggang Reservoir was built by blocking the harbor during 1971–1975, and it was separated from the East China Sea by a dam. It was used to store fresh water along the coast, with the salinity less than 1‰ all year round, and was classified as a reserve source of drinking water. The length of the Datanggang Reservoir main stream is approximately 21 km, with an average water width of 300–400 m and an average water depth of 5–8 m.

2.2. Analysis of Field Samples

Field surveys were conducted in spring, when algal blooms occur frequently. A total of 24 sampling sites were established along the mainstream. Water (1 L) was collected at a shallow depth (approximately 0.5 m) at each sampling site and fixed with Lugol’s iodine solution at a final concentration of 1.0–1.5%. Phytoplankton were identified and counted using an inverted light microscope (Leica, Wetzlar, Germany) following the Utermöhl method [19,20]. When the sample cell abundance was too high or too low, the method of dilution or settling concentration was used for pretreatment before microscopic observation. Species numbers, the cell abundance of each species, and total cell abundance in each site were calculated.
Water temperature; nutrients, including total nitrogen (TN), total phosphorus (TP), and ammonium nitrogen; chlorophyll a (Chl a); the potassium permanganate index; and dissolved oxygen were assessed at each sampling site. TN was determined using the alkaline potassium persulfate digestion ultraviolet spectrophotometric method, TP was determined using the ammonium molybdate spectrophotometric method, ammonium nitrogen was determined using Nessler’s reagent spectrophotometry method, Chl a was determined using the acetone extraction spectrophotometric method, the potassium permanganate index was determined using the potassium permanganate–sulfuric acid–sodium oxalate method, and dissolved oxygen was determined using the electrochemical probe method [21,22,23,24].

2.3. Data Analysis

The Kolmogorov–Smirnov test (K–S test) and quantile–quantile plot (Q–Q plot) were used to check for normal distribution. If the K–S test result was p > 0.05 and the data in the Q–Q graph were distributed around the reference line, they were considered to be normally distributed [25,26]. The data were not normally distributed, and Spearman correlation analysis was performed using Statistical Product and Service Solutions (SPSS) 19 ((IBM, Armonk, NY, USA)) software (p < 0.05, indicating a significant correlation). The density of phytoplankton–total nitrogen/total phosphorus scatter plots was calculated using MATLAB 9.10 (MathWorks, Natick, MA, USA), and the density plots of various algal cells at each site were calculated using R-Studio (4.1.0). The relationship between algal cell abundance and ecological characteristics was explored using redundancy analysis (RDA) with the CANOCO 5 program after a pre-analysis (Microcomputer Power, Ithaca, NY, USA) [27].

3. Results

3.1. Phytoplankton Distribution Characteristics

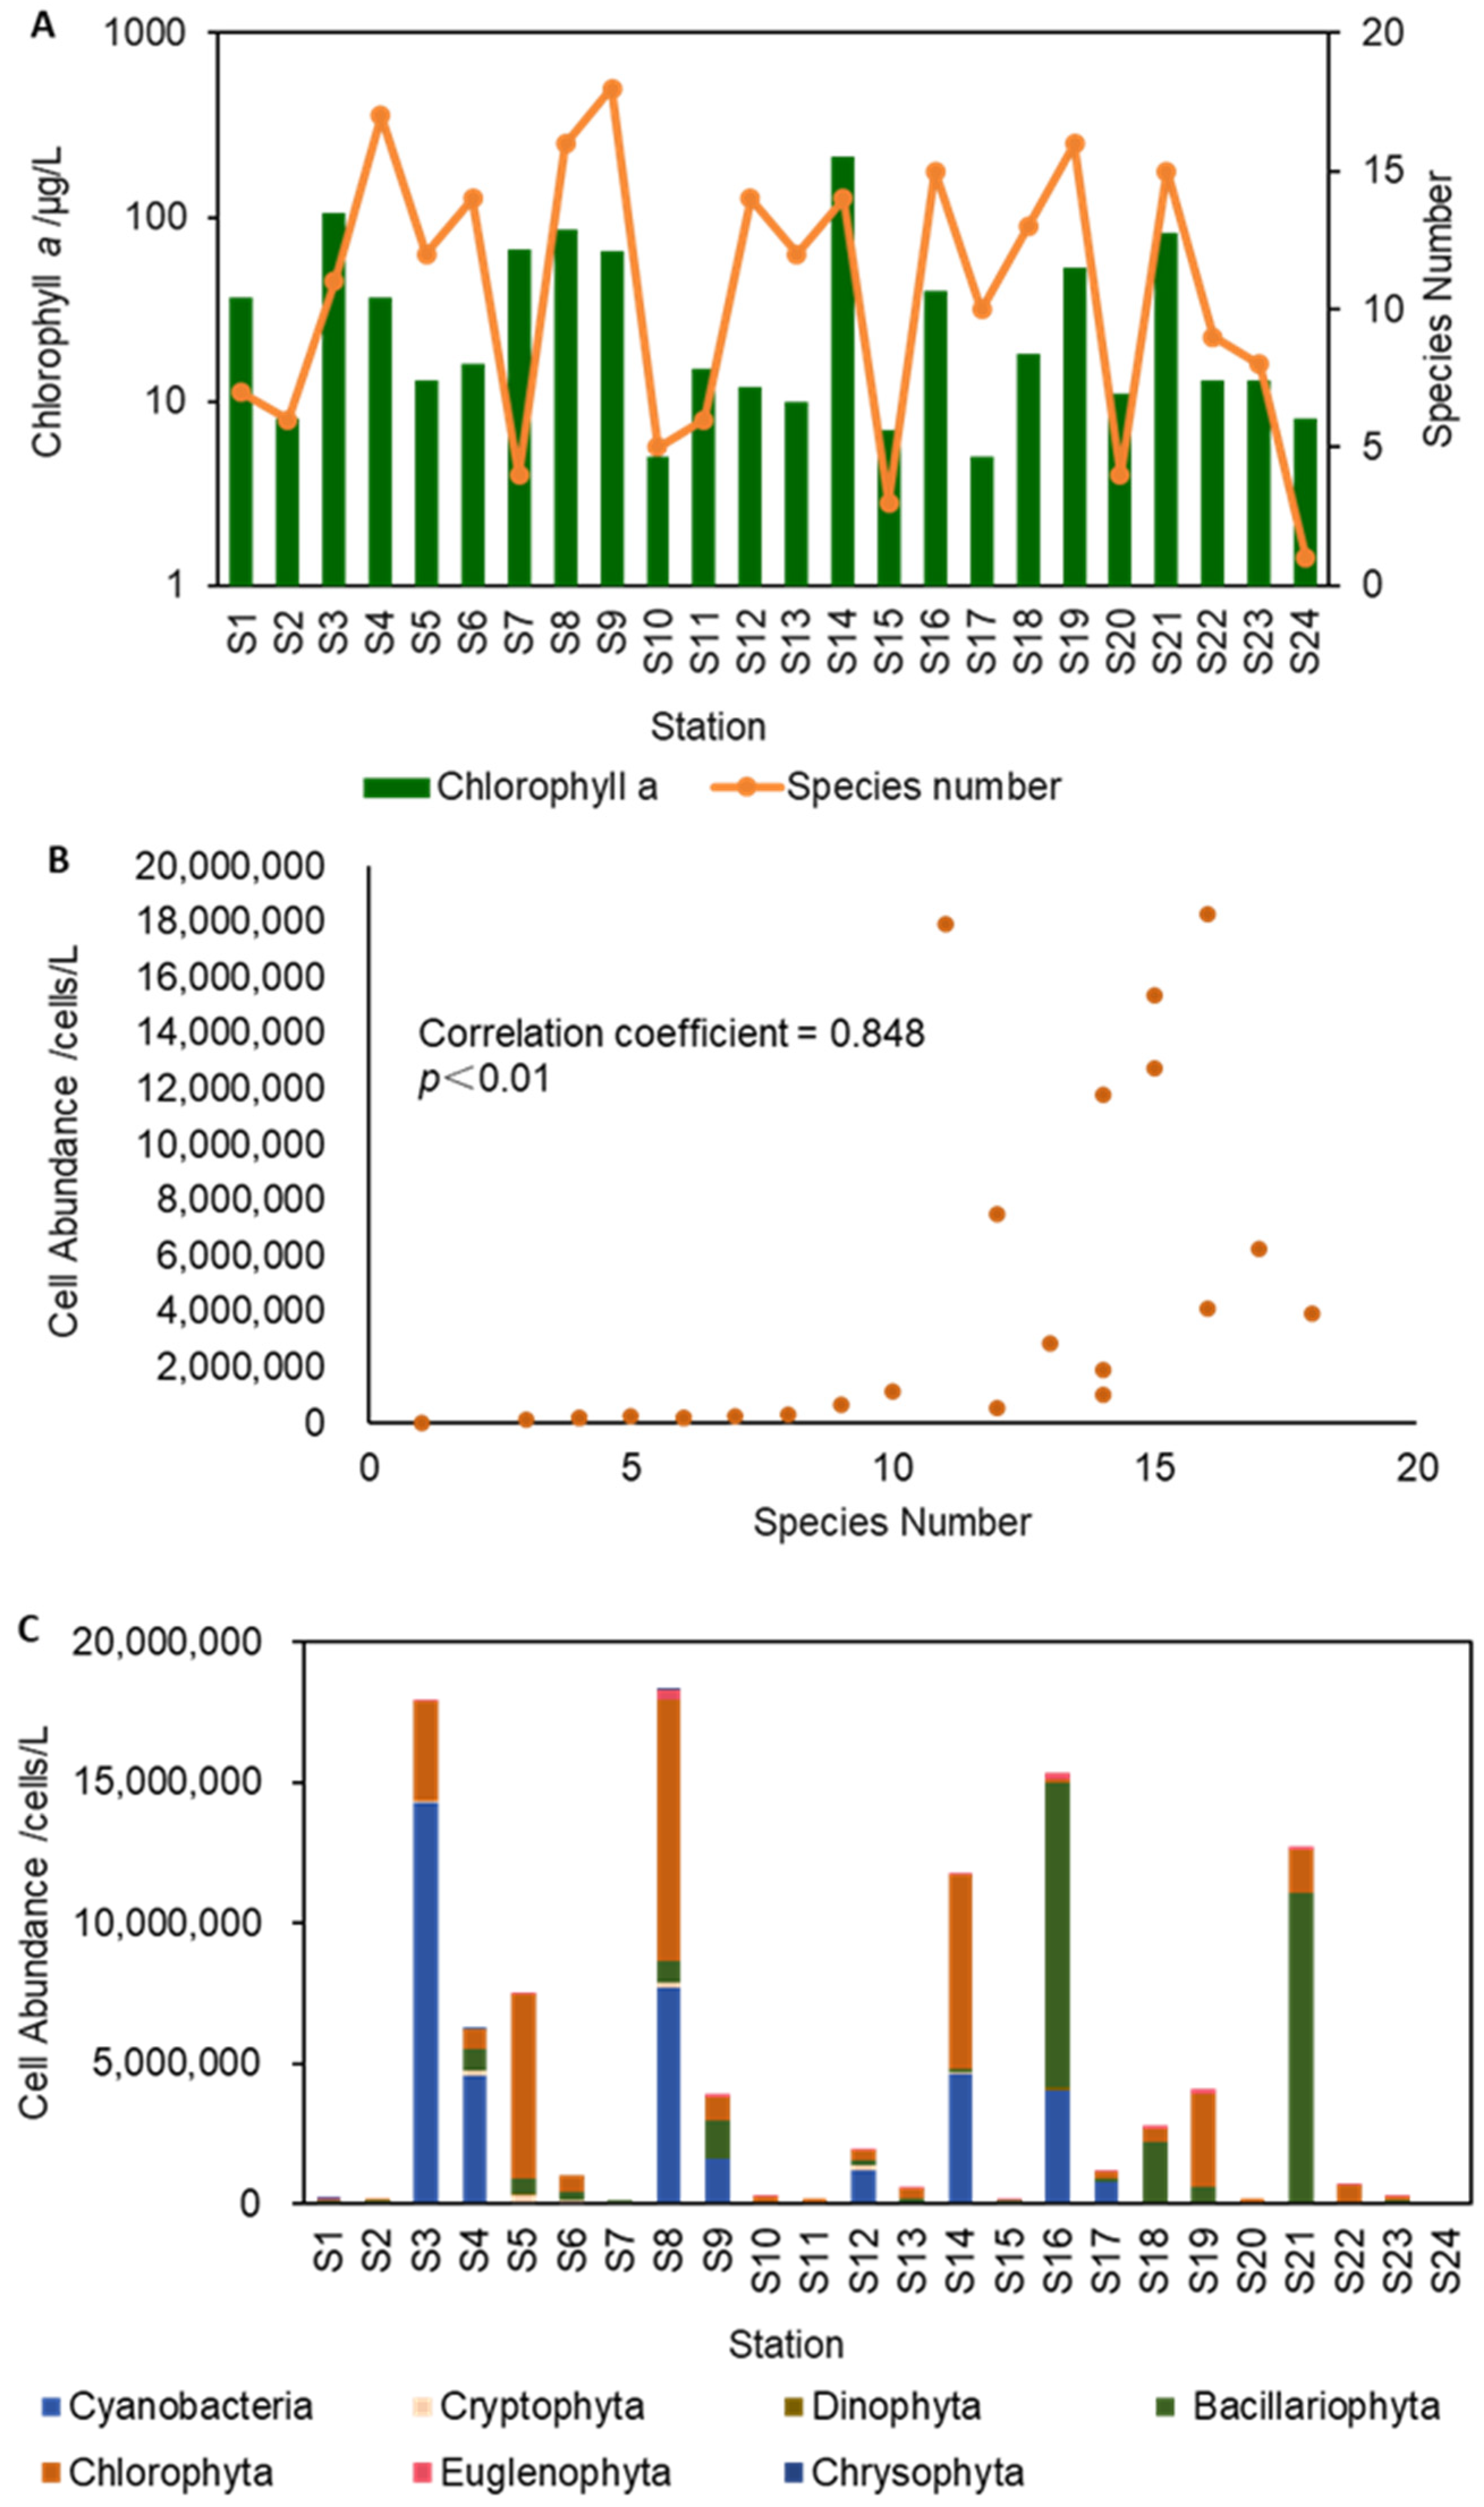
A total of 51 species, in Cyanobacteria, Chlorophyta, Bacillariophyta, Dinophyta, Euglenophyta, Cryptophyta, and Chrysophyta, were detected at different sites (Figure 2). Among these, Bacillariophyta were the most widely distributed and detected at 22 sites. Chlorophyta and Euglenophyta were detected in more than half of the 24 sites and in 21 and 15 sites, respectively. Cyanobacteria and Cryptophyta were found in 12 and 11 sites, respectively. Dinophyta and chrysophyta were distributed in two but in different sites.
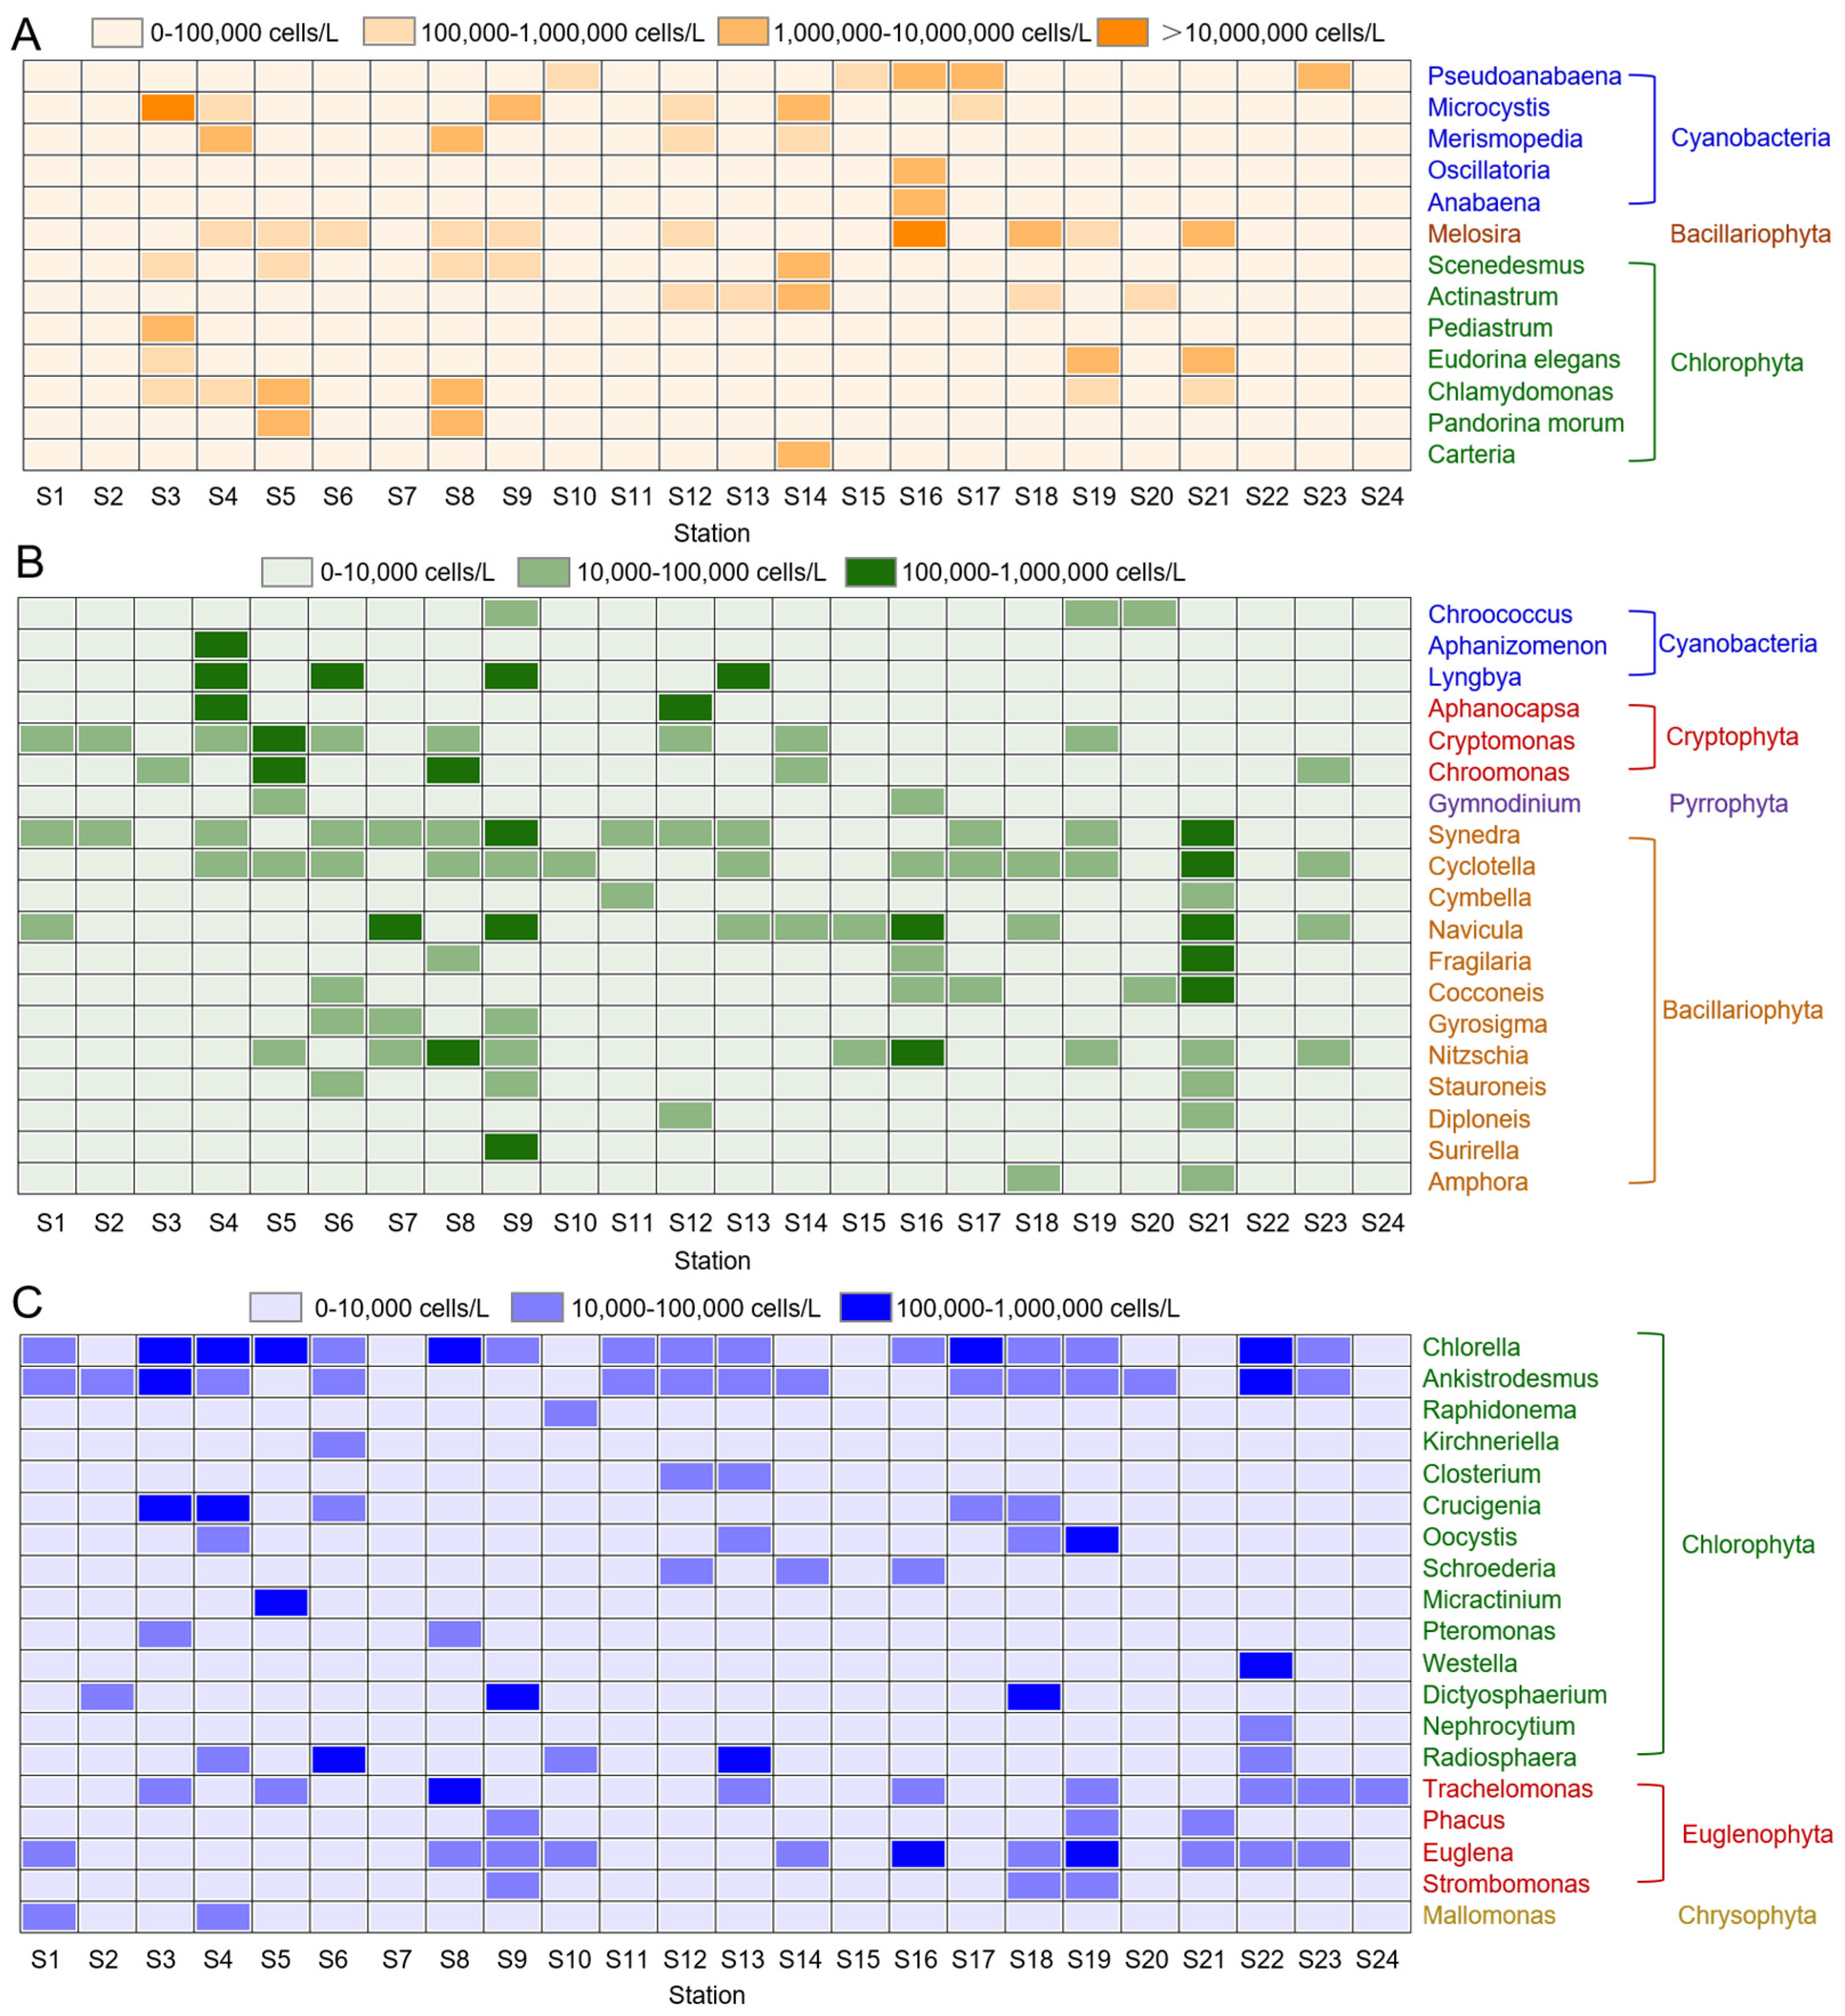
The distribution characteristics of phytoplankton differed at each station, and the total cell abundance and chl a concentration were segmented. As described in Figure 3, total cell abundance was 20,400–18,299,200 cells/L when the chl a concentration was 5–213 mg/L, indicating that algal bloom occurred in certain waters and fewer algae were present in some other waters. The cell abundance was much higher than 10 million cells/L at stations S3, S8, S14, S16, and S21; between 1 million and 10 million cells/L at stations S4, S5, S6, S9, S12, S17, S18, and S19; and lower than 1 million cells/L in other areas. Thirteen bloom-causative species were identified, including Cyanobacteria, Bacillariophyta, and Chlorophyta. The blooms at stations S4 and S9 caused by only one species of Cyanobacteria were Pseudoanabaena sp. and Microcystis sp., respectively. Blooms at stations S19 and S5 were caused by Chlorophyta, and the species were Eudorina elegans at station S19 and Chlamydomonas sp. and Pandorina morum at station S5. Cyanobacteria and Chlorophyta, including Pseudoanabaena sp., Microcystis sp., Merismopedia sp., Scenedesmus sp., Actinastrum sp., Pediastrum sp., Chlamydomonas sp., Pandorina sp., and Carteria sp., caused blooms at stations S3, S14, and S8. The bloom at station S18 was caused by Melosira sp., a Bacillariophyta; at station S19, by Eudorina sp., a Chlorophyta; and station S21, by both Melosira sp. and Eudorina sp. Pseudoanabaena sp., Oscillatoria sp., Anabaena sp., and Melosira sp. caused blooms at station S16. The algal bloom-causative species presented a successive trend from north to south. Cyanobacteria and Chlorophyta occurred in the northern study area, Bacillariophyta and Chlorophyta in the middle, and Cyanobacteria and Chlorophyta in the southern area.
Differences were observed in phytoplankton community characteristics at each station. The number of species ranged from 1 to 17, evenness ranged from 0.36 to 1, and species diversity index in terms of Shannon ranged from 0 to 2.195. A positive correlation was observed between cell abundance and species number (p < 0.01), and Spearman’s rank correlation coefficient was 0.848 (Figure 2).

3.2. Spatial Variability in Physicochemical Parameters of Water

During the survey period, the water temperature in the study area was 31.8–34.6 °C, and the areas with the lowest water temperature were stations S19 and S21, where it was less than 32 °C, and in stations S7, S1, S5, and S8, the water temperature was higher than 34 °C. The detection limits of total phosphorus and total nitrogen were 0.01–0.6 mg/L and 0.05–4 mg/L, respectively. In the study area, the total phosphorus concentration was 0.124–0.468 mg/L, which in 12 stations was lower than 0.2 mg/L, and in stations S3, S19, and S16, it was much higher than 0.4 mg/L. Total nitrogen content was 0.77–2.40 mg/L. The concentrations at four stations, including S3, were higher than 2 mg/L, and those at S16 and S19 were lower than 1 mg/L. The nitrogen and phosphorus ratios during the study were 1.60–17.18 mg/L, with the lowest in S16 and the highest in S6.

3.3. Relationship between Phytoplankton Distribution and Physicochemical Environmental Factors

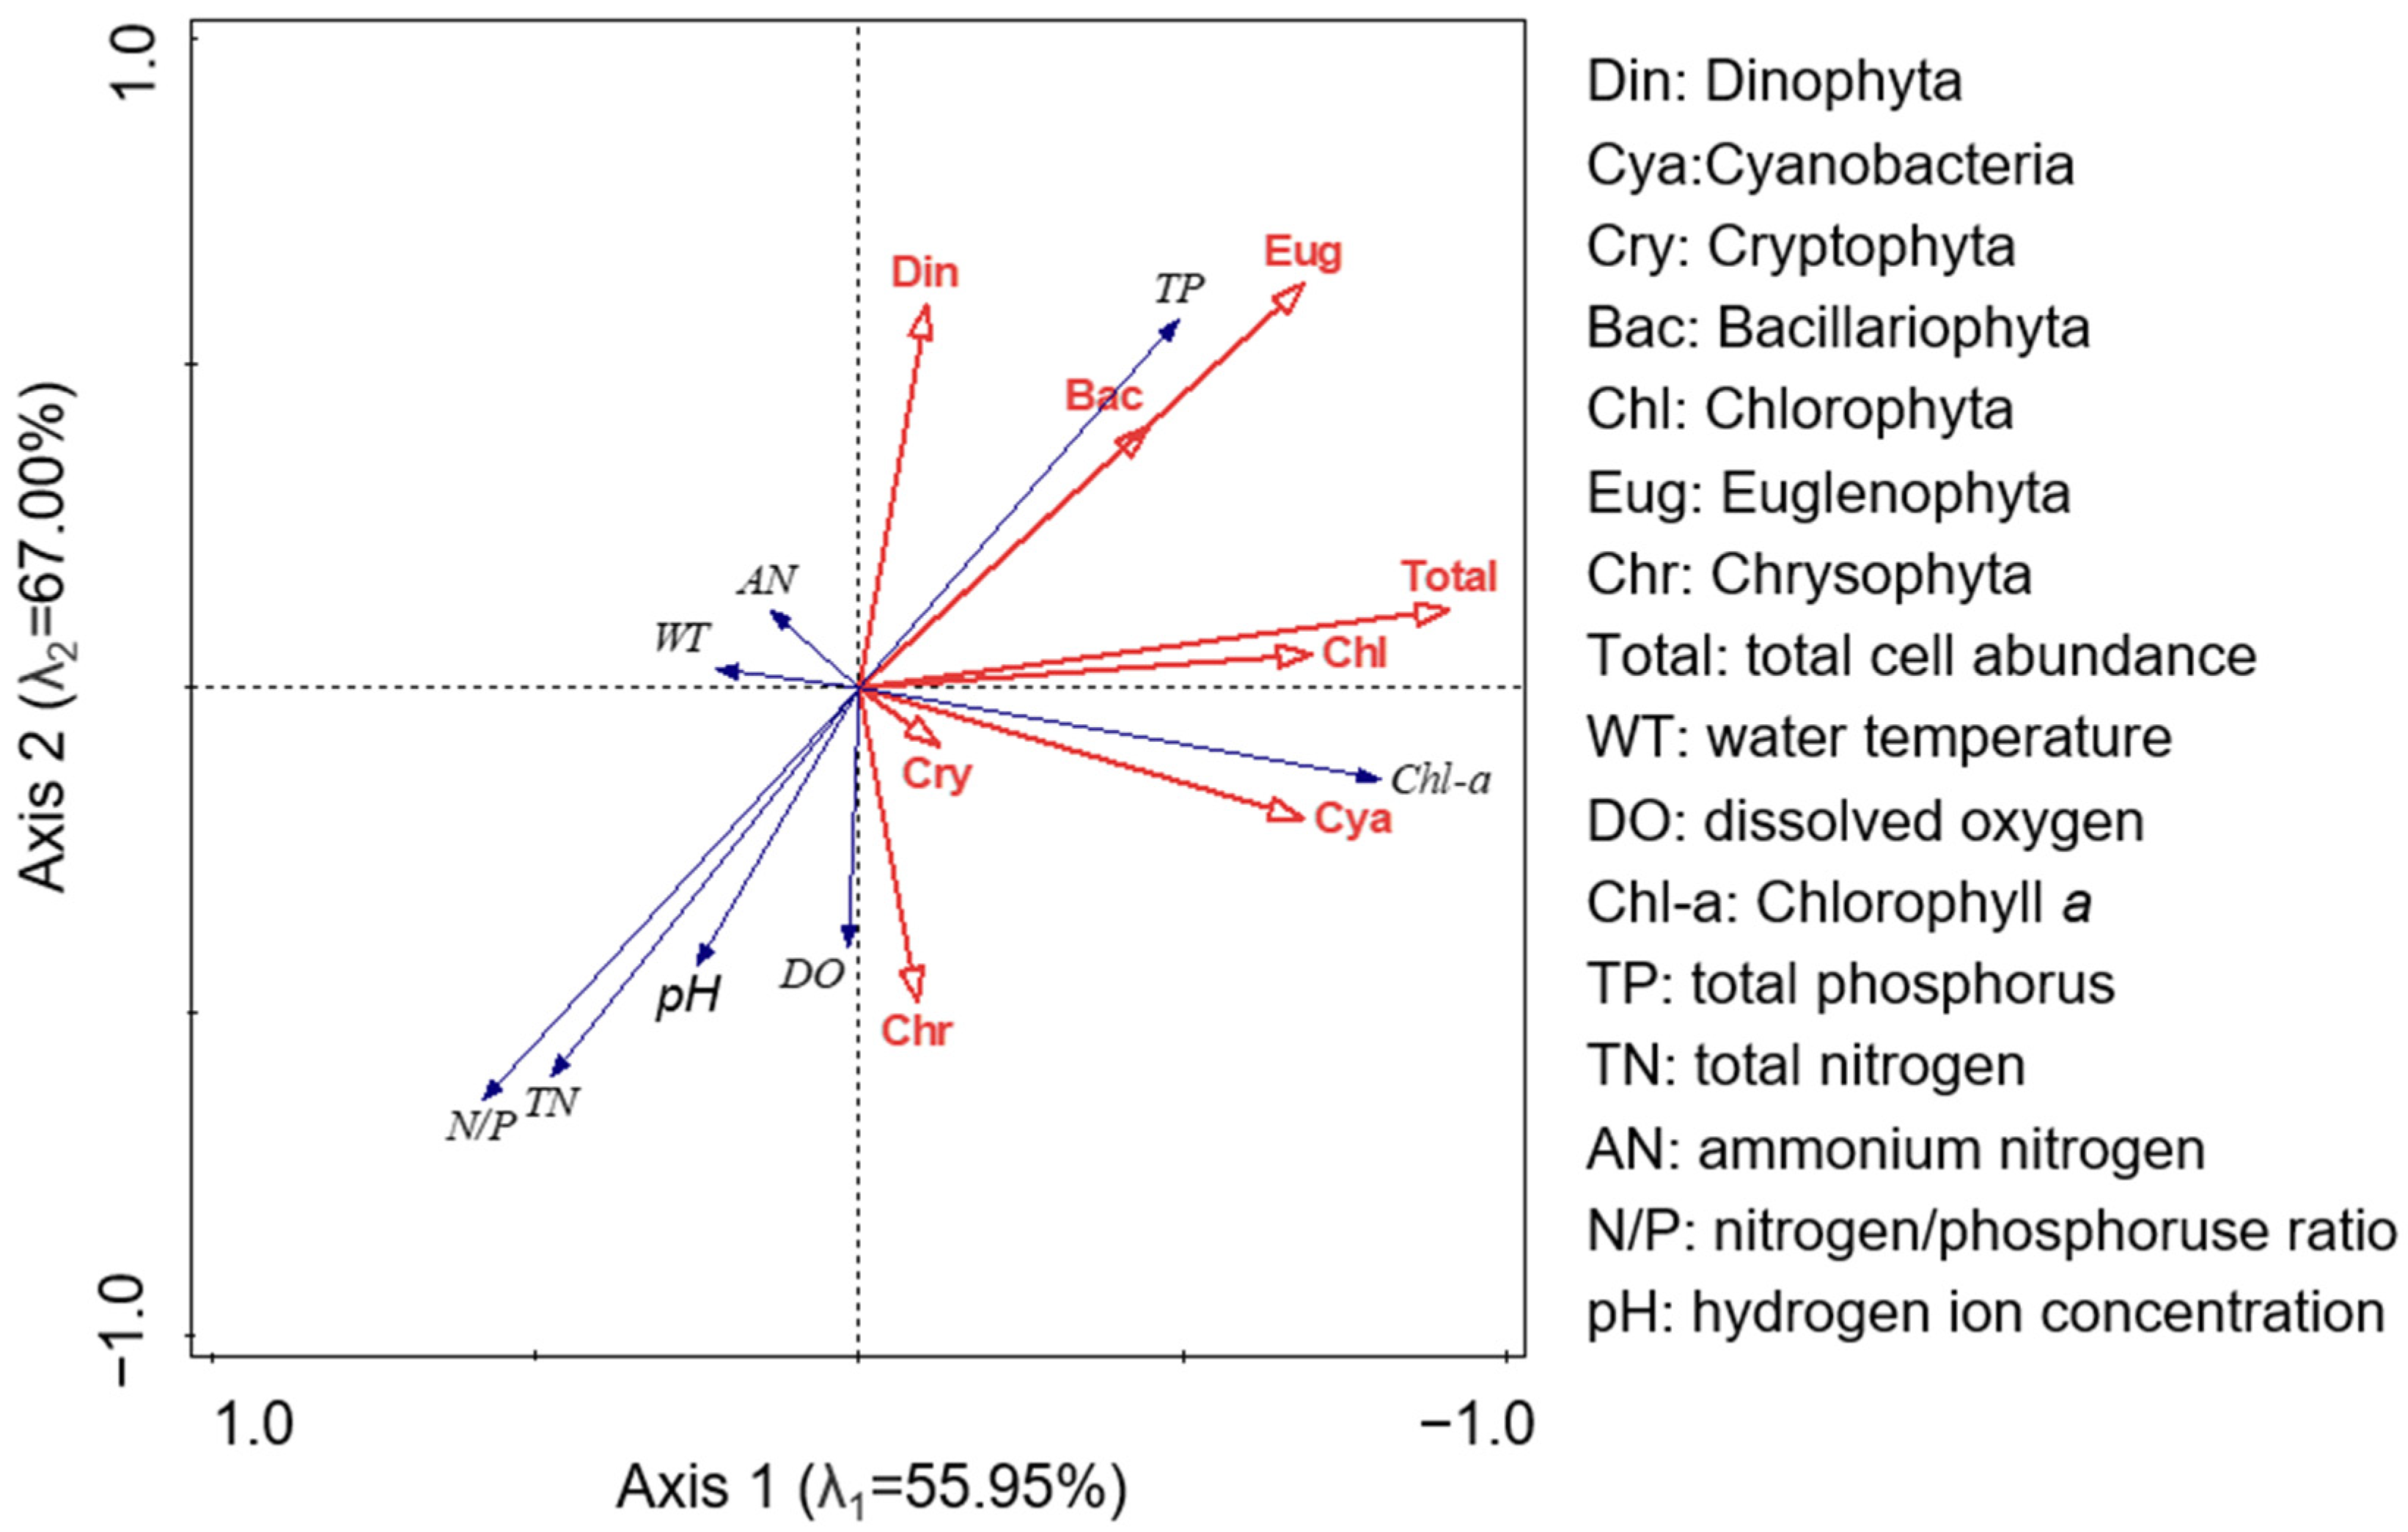
Overall, according to the RDA results, total nitrogen and total phosphorus were important regulatory factors affecting phytoplankton distribution, and total phosphorus was a crucial factor (Figure 4). The total phosphorus concentration is a crucial environmental factor affecting the total algae abundance and chl a concentration.
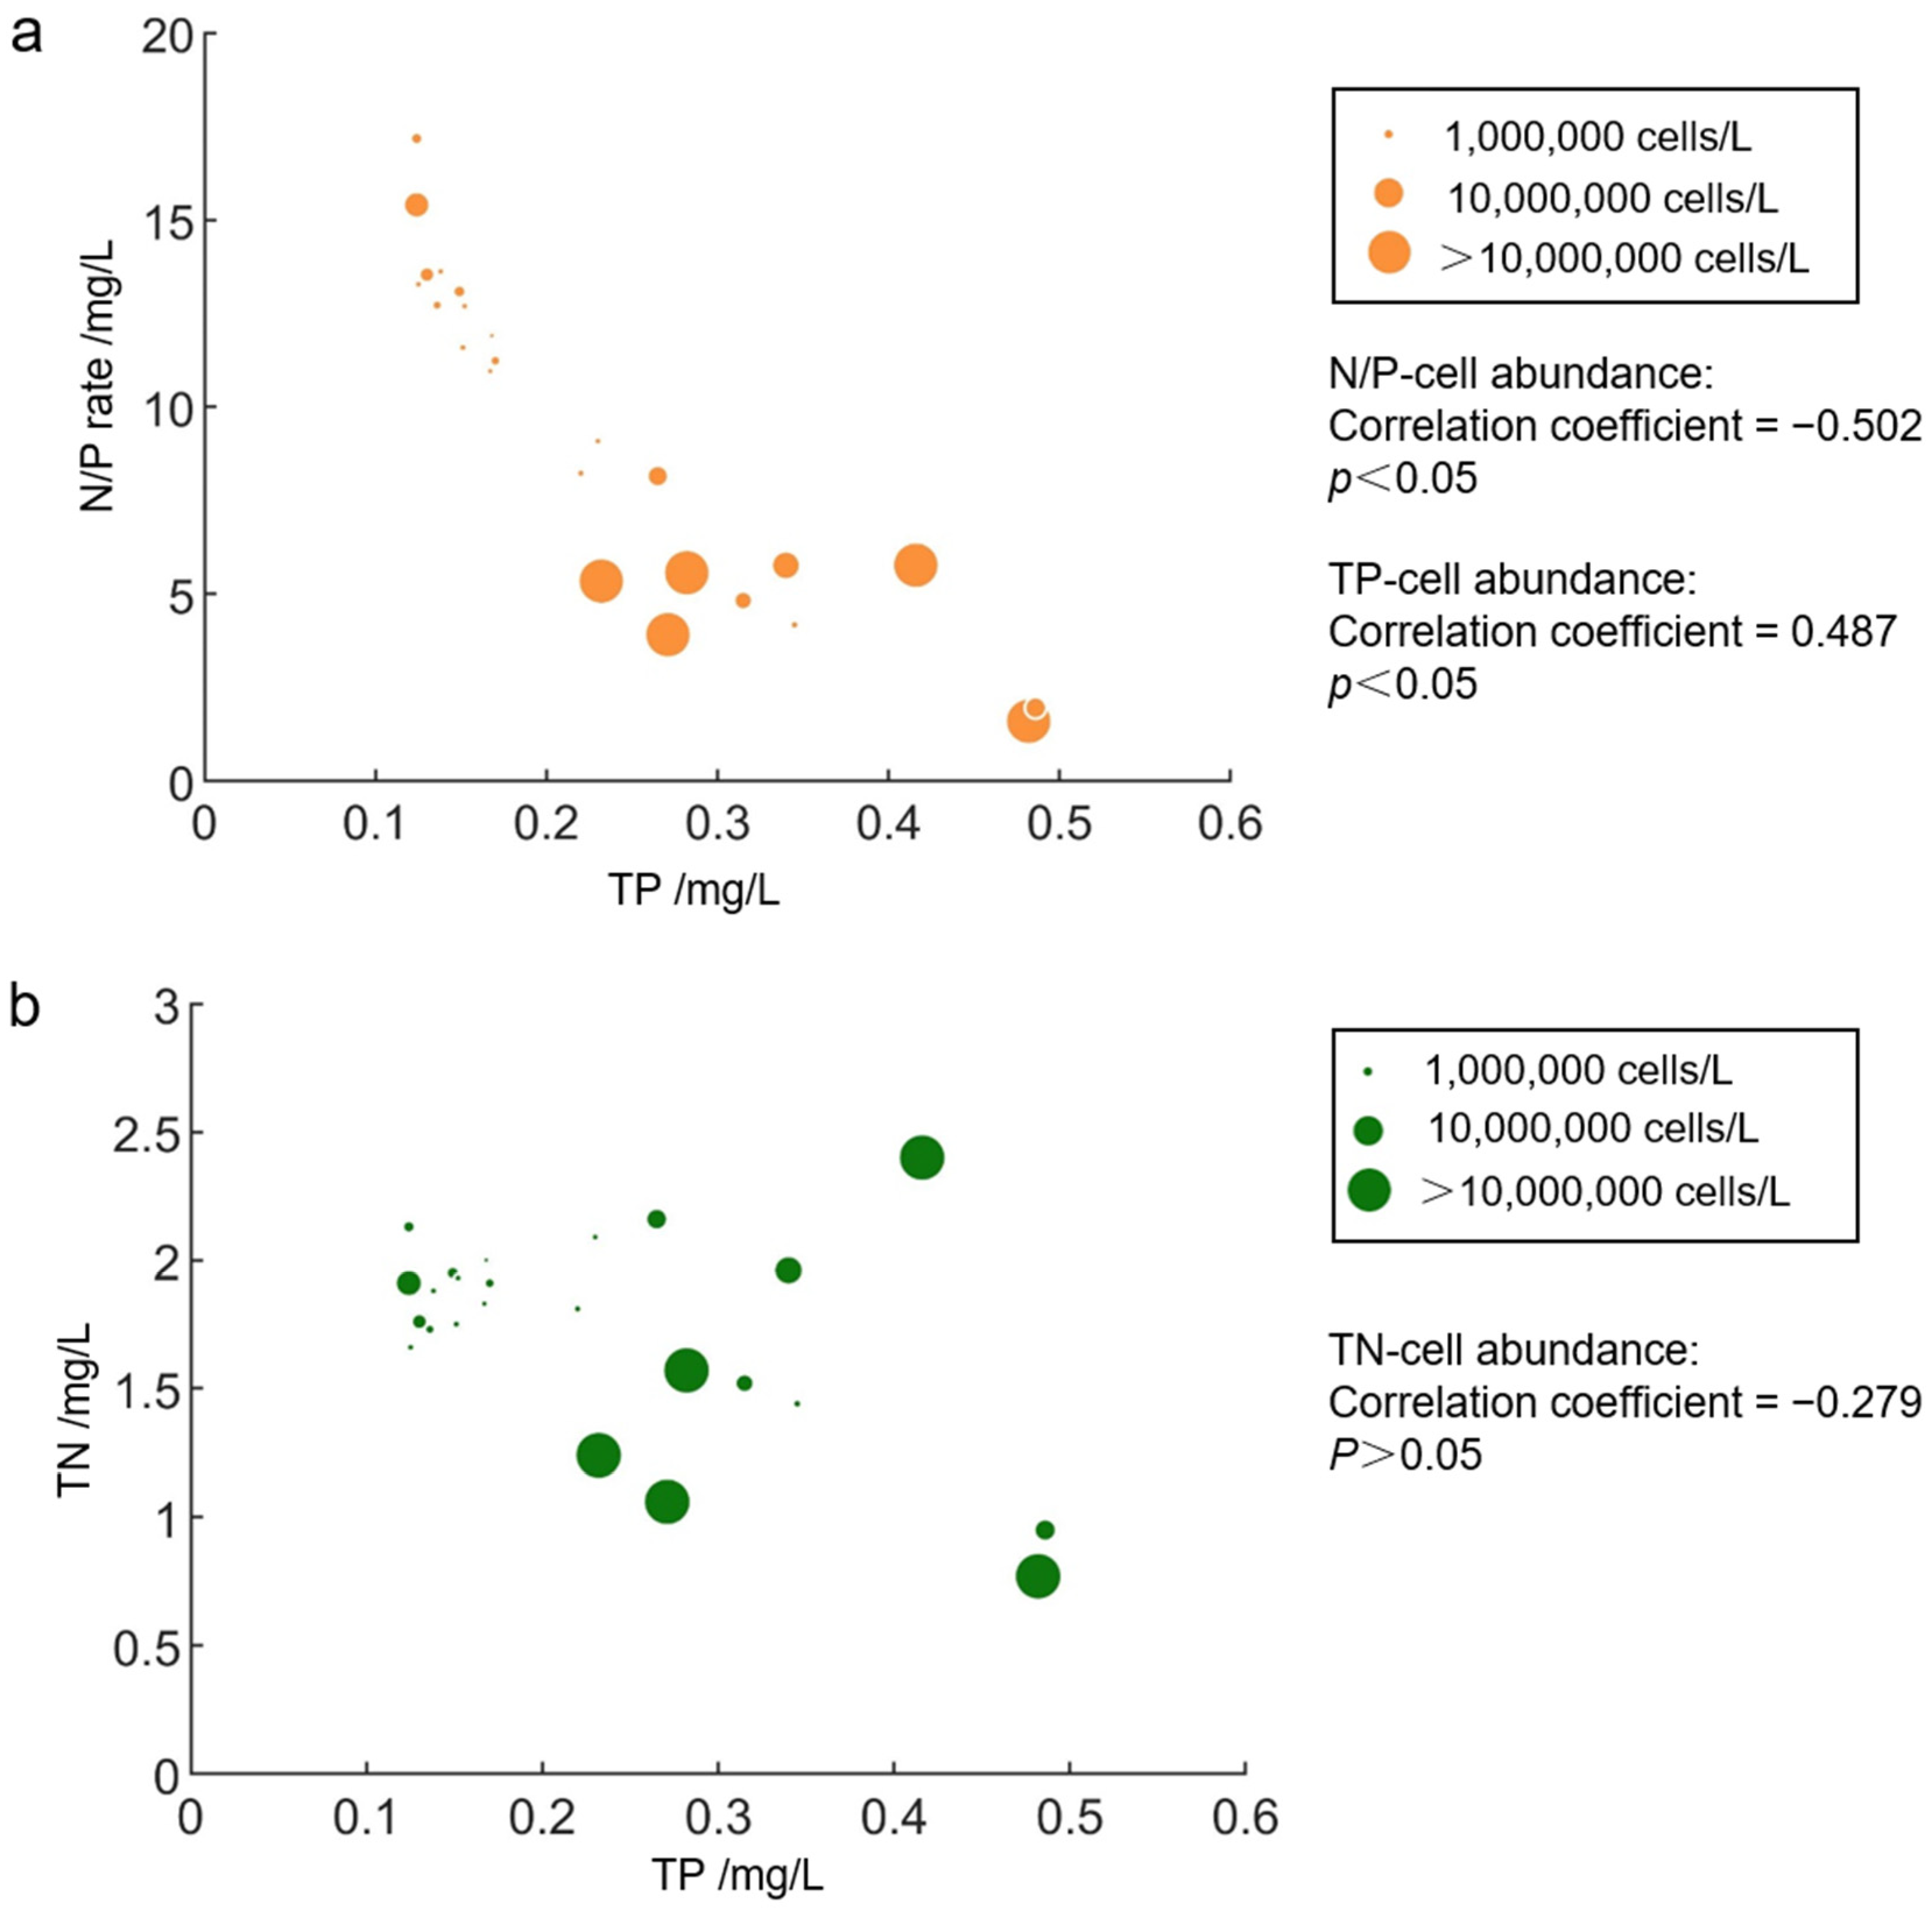
Total algae abundance was considerably affected by total phosphorus and positively correlated with total phosphorus concentration (Figure 4 and Figure 5) (the correlation coefficient was 0.487, p < 0.05). Total algae abundance was negatively correlated with total nitrogen, but no significance was observed (the correlation coefficient was −0.279, p > 0.05). Total algae abundance was also significantly negatively correlated with the N/P ratio (the correlation coefficient was −0.502, p < 0.05). The algal abundances of Cyanobacteria, Chlorophyta, Bacillariophyta, Dinophyta, Euglenophyta, and Cryptophyta were also positively correlated with total phosphorus and negatively correlated with total nitrogen.
According to the correlation analysis results in Figure 5, the nitrogen-to-phosphorus ratio decreased with an increase in the total phosphorus content and a decrease in the total nitrogen concentration. Simultaneously, the total algal cell abundance increased. When the total phosphorus concentration was higher than 0.3 mg/L, the number of species was maintained at a high level and exceeded eight. The total algal cell abundance was over 10 million cells/L in waters with total phosphorus higher than 0.2 mg/L and no more than 8 million cells/L in waters with total phosphorus less than 0.2 mg/L. The density of total algal cells in water with N/P ratios > 8 was generally lower than that in water with N/P ratios < 8. In waters with total algal cell abundance over 10 million cells/L, the N/P ratios were all <8, and in the waters with N/P ratios > 8, the total algal cell abundance was less than 1 million cells/L, except for one site with a cell abundance of 3.9 × 10⁶ cells/L.

4. Discussion

4.1. Several Algae Caused Single or Multiple Algal Blooms in Different Areas of Continuous Water

Phytoplankton, a photoautotrophic group that can use light energy to convert CO2 into carboniferous chemicals, are a vital part of the ecosystem and are widely distributed in marine and freshwater ecosystems, supporting biogeochemical cycles, food web structures, and the sustainability of aquatic ecosystems [28]. Whether in freshwater or marine ecosystems, the contribution from aquatic ecosystems is mainly produced by phytoplankton when the primary productivity of phytoplankton is more than 120 g C m−2 year−1 in some waters, such as the Stechlinsee [29,30]. However, an increase in phytoplankton is not always beneficial. The rapid proliferation and/or high biomass accumulation of certain algae at the water surface or column may cause a harmful algal bloom, which may lead to an ecological environment imbalance and negatively affect human health, socioeconomic interests, or components of aquatic ecosystems [31,32].
In connected water bodies, the causative species of algal blooms differ spatially. Aquatic ecosystems are interconnected, extending from inland mountain streams to rivers, lakes, reservoirs, estuaries, coasts, and oceans. Owing to the differences in environmental conditions in these different water areas, the common algae species and algal bloom-causative species exhibit spatial evolutionary characteristics. In particular, significant differences exist between marine and freshwater algal species, which are controlled by water salinity, as they show diversity in salinity tolerance among different algae [33,34]. Bacillariophyta and Dinophyta are common causative species in the ocean, and certain Dinophyta, such as Alexandrium, Gymnodinium, and Karenia, may cause serious ecological disasters by creating noxious scums, foams, or toxins [35,36,37,38]. However, algal blooms in freshwater ecosystems are usually caused by Cyanobacteria and are directly related to the safety of drinking water. Microcystis, Bacillariophyta, and Chlorophyta can also cause blooms [39,40,41]. The water area in this study was a river flowing into the East China Sea, and the causative species differed in each area, even though the waters were connected. Of the 10 algae bloom sites, 6 sites were caused by Cyanobacteria alone or accompanied by other phyla, which was consistent with most freshwater algal bloom characteristics [42]. Multiple Cyanobacterial bloom-causative species were identified in this water, including species in Pseudoanabaena, Microcystis, Merismopedia, Oscillatoria, and Anabaena. Microcystis causes serious ecological disasters worldwide because of its microcystin [43]. In Taihu Lake, the third largest freshwater lake in China, Microcystis blooms continuously in summer, accounting for more than 90% of the summer algal biomass [44,45]. Pseudoanabaena, Oscillatoria, and Anabaena have also been reported to bloom in freshwater aquaculture ponds, reservoirs, rivers, and lakes, releasing an unpleasant odor, leading to fish death, and threatening public health [46,47,48]. Merismopedia have been identified in several freshwater species worldwide and are mainly reported as community-dominant species; however, they cause few blooms [49]. However, Merismopedia blooms were found at two stations and even caused simple blooms in a certain water area, which is a very rare phenomenon. In addition, one species of Bacillariophyta and seven species of Chlorophyta, including species in Melosira, Scenedesmus, Actinastrum, Pediastrum, Chlamydomonas, Carteria, Pandorina morum, and Eudorina elegans, whose toxin-producing capacities have not been reported, also bloomed in our study [50,51,52,53]. Various widespread and non-widespread, toxic and non-toxic algal species and single or multiple blooms occurred in different areas of this continuous water, indicating that the bloom-causing species in this continuous water were various and abundant and had high spatial heterogeneity.

4.2. Effects of Nitrogen and Phosphorus on Phytoplankton Distribution

The composition and abundance of algal species are closely related to the physical and chemical properties of water, and the occurrence of algal blooms is often associated with eutrophication [54]. In some river systems that serve rural or urban catchments, such as the Klamath, Ohio, Maumee, St. Johns, Sacramento, and San Joaquin rivers in the United States; the Yangtze River in China; and the Nile River in Egypt, algal blooms often persist for longer periods in summer and autumn, which has been attributed to nutrient impacts as well as climatic variation and hydraulic engineering that change the flow of water bodies [55,56,57,58]. Among the components of eutrophication, nitrogen and phosphorus are the two nutrients that have received the most attention, supporting the growth of aquatic organisms such as phytoplankton [59].
In many temperate and polar coastal marine waters, nitrogen is the dominant nutrient limiting primary production by photosynthetic organisms [60,61]. In conjunction with waters between estuarine and freshwater habitats, nitrogen is usually regarded as the first limiting factor for primary productivity; however, in waters where abundant nitrogen in the upper reaches is transported to the estuary, it will support more algal growth and larger blooms will occur, such as in the lower Neuse River Estuary, North Carolina [62,63,64]. In water eutrophication caused by total nitrogen, especially when the total nitrogen concentration is higher than 0.8 mg/L, as in eutrophic Lake Taihu, China, phytoplankton growth is not limited by nitrogen [65]. In this study, the total nitrogen concentration was 0.77–2.40 mg/L, and phytoplankton appeared to be unconstrained by nitrogen. The negative correlation between phytoplankton abundance and total nitrogen concentration may indicate that nitrogen is a nutrient source for phytoplankton growth and blooms [66,67]. With an increase in phytoplankton abundance, the consumption of total nitrogen increased, and the total nitrogen concentration gradually decreased.
Except for in estuaries and coastal waters with high nitrogen input, phosphorus is the main nutrient in freshwater that limits the growth of photosynthetic organisms, as it is the least important macroelement required for photosynthesis [68]. Generally, eutrophication and algal blooms in lakes and reservoirs are associated with excess phosphorus loading. In certain waters, phosphorus reduction is the main measure with which to reduce eutrophication and control algal blooms, as it can be reduced to lower than the concentration required for an algal bloom to occur, and effective results have been achieved [69]. For example, in Lake Washington, by decreasing the amount of sewage in the lake to zero, the phosphorus concentration in the lake was reduced. Simultaneously, the species and quantity of phytoplankton in the water responded promptly, and the scale of Cyanobacteria bloom was reduced [70]. Controlling Cyanobacterial blooms by reducing phosphorus input is an effective method that has been successfully practiced in many areas worldwide, such as Lakes Constance, Lucerne, Maggiorre, Erie, and Biwa in Europe, America, and Asia [69,71]. These results indicate that phosphorus is an important nutrient source for algal growth and algal bloom occurrence in certain waters, and phosphorus is a key factor in regulating algal bloom occurrence. Similar to these waters, in this study, it appeared that total phosphorus was an important factor impacting phytoplankton growth and algal blooms. Phytoplankton abundance was positively correlated with total phosphorus. When the total phosphorus concentration was lower than 0.2 mg/L, the algal cell abundance was lower than 8 million cells/L, whereas the abundance of algal cells above 10 million cells/L occurred in water with a total phosphorus concentration of more than 0.2 mg/L.
A close relationship was observed between phytoplankton abundance and the N/P ratio. A previous study found that nitrogen deficiency growth was evident when the mass ratio of TN/TP was less than 9 (molar ratio of 20), phosphorus deficiency growth was evident when the mass ratio of TN/TP was over 23 (molar ratio of 50), and both nitrogen and phosphorus deficiencies were possible when the TN/TP was moderate [72]. Furthermore, some studies have shown that the ratio of nitrogen and phosphorus does not represent the real amount available to organisms, which does not directly affect the growth of phytoplankton; however, what significantly affects phytoplankton is the concentration of nitrogen and phosphorus [73]. For example, when total nitrogen or total phosphorus concentrations are much higher, or in any other unusual situation, the relationship between TN/TP and phytoplankton abundance may provide a confusing indication [74,75]. However, algal blooms occur in waters with an N/P ratio of less than 8, and the density of phytoplankton is negatively correlated with the N/P ratio. This does not mean that the lower the N/P ratio, the more favorable the algal bloom occurrence, which is not scientific evidence. This relationship implies that, in this study, phytoplankton growth was closely related to the concentration of nitrogen and phosphorus. With an increase in the phosphorus concentration, the abundance of phytoplankton increased and even caused blooms. Simultaneously, the consumption of nitrogen decreased the nitrogen concentration. This ecological process resulted in a negative correlation between phytoplankton and the N/P ratio, indicating a relationship between phytoplankton and absolute nitrogen and phosphorus concentration [76,77].
In this study, thirteen bloom-causative species were identified, which was unusual due to such a large number being in narrow and continuous water. And the study investigated algae blooms related to P concentrations in a scenario of multiple bloom-causative species. However, limited by the conditions of sample collection, the spatial evolution mechanism of bloom-causative species has not been thoroughly studied, which is the content and direction of our next study.

5. Conclusions

In the 21 km long connected freshwater in this study, the species and abundance distribution of phytoplankton showed evident spatial variation. Algal blooms occur in different water bodies and exhibit spatial heterogeneity. Algal abundance, the occurrence of blooms, and dominant species of blooms were all separated in the different water areas. Blooms were formed by different algae alone or in combination, and the dominant species of algal blooms in each water area differed, including 12 genera of Cyanobacteria, Cryptophyta, Bacillariophyta, and Chlorophyta. The dominant factors affecting the occurrence of algal blooms were analyzed, and blooms occurred in waters with a higher phosphorus concentration and lower nitrogen concentration than that in other waters. The occurrence of algal blooms was affected by phosphorus concentration and consumed nitrogen. The N/P ratio in the study water was 1.60–17.18, and algae bloomed in waters with an N/P ratio of less than 8. This study aimed to prevent and control algal blooms and reduce disasters. Although studies have shown that algal blooms in this area are largely influenced by nitrogen and phosphorus, they cannot be prevented by controlling the nutrient input. Phosphorus control involves human activities, such as industrial and agricultural production, which the proposed practical and effective methods cannot simply implement. Algal bloom occurrence is a complex process, and there are still many questions that have not been clearly clarified, such as which nitrogen and/or phosphorus plays a key role in the occurrence of algal blooms, what are the influencing processes and mechanisms, and which types of phytoplankton are distributed in the water. Further studies are required to answer these questions. This study enriched our understanding of the distribution characteristics and influencing factors of phytoplankton in a harbor-construction-formed reservoir and laid a foundation for the long-term impact of research on the ecological environment of harbor construction in the future.

Author Contributions

X.H.: conceptualization, methodology, formal analysis, visualization, writing—original draft, and writing—review and editing. K.L.: data curation. R.W.: investigation. S.L.: Data curation. Y.L. (Yunlong Liu): data curation. Y.W.: investigation. Y.L. (Yan Luo): writing—review and editing. T.Z.: data curation. L.L.: supervision and writing—review and editing. All authors have read and agreed to the published version of the manuscript.

Funding

This study was supported by the National Natural Science Foundation of China (Grant number 42107422).

Data Availability Statement

The raw data supporting the conclusions of this article will be made available by the authors on request.

Acknowledgments

The authors acknowledge the Ecology and Environment Bureau, the Meteorological Bureau, the Natural Resources and Planning Bureau of Xiangshan County, and the Xiangshan Water Group Co., Ltd. for providing the relevant data.

Conflicts of Interest

Author Tian-Peng Zhou was employed by the company Xiangshan Water Group Co., Ltd. The remaining authors declare that the research was conducted in the absence of any commercial or financial relationships that could be construed as a potential conflict of interest.

References

  1. Almond, R.E.A.; Grooten, M.; Juffe Bignoli, D.; Petersen, T. Living Planet Report 2022–Building a Naturepositive Society; WWF: Gland, Switzerland, 2022. [Google Scholar]
  2. GlobalHAB. Global Harmful Algal Blooms, Science and Implementation Plan; SCOR (Scientific Committee on Oceanic Research): Newark, DE, USA; IOC: Paris, France, 2017. [Google Scholar]
  3. Reid, A.J.; Carlson, A.K.; Creed, I.F.; Eliason, E.J.; Gell, P.A.; Johnson, P.T.J.; Kidd, K.A.; Maccormack, T.J.; Olden, J.D.; Ormerod, S.J. Emerging threats and persistent conservation challenges for freshwater biodiversity. Biol. Rev. 2019, 94, 849–873. [Google Scholar] [CrossRef] [PubMed]
  4. Paerl, H.W.; Otten, T.G. Harmful Cyanobacterial blooms: Causes, consequences, and controls. Microb. Ecol. 2013, 65, 995–1010. [Google Scholar] [CrossRef] [PubMed]
  5. Romo, S.; Fernández, F.; Ouahid, Y.; Barón-Sola, Á. Assessment of microcystins in lake water and fish (Mugilidae, Liza sp.) in the largest Spanish coastal lake. Environ. Monit. Assess. 2012, 184, 939–949. [Google Scholar] [CrossRef] [PubMed]
  6. Yu, R.C.; Lv, S.H.; Liang, Y.B. Harmful algal blooms in the coastal waters of China. In Global Ecology and Oceanography of Harmful Algal Blooms; Glibert, P.M., Berdalet, E., Burford, M.A., Pitcher, G.C., Zhou, M.J., Eds.; Springer: Berlin/Heidelberg, Germany, 2018; pp. 309–316. [Google Scholar]
  7. Hu, S.; Liu, G.X.; Zhou, G.J.; Mei, H.; Hu, Z.Y. Peridinium polonicum, a new record of freshwater toxic Dinoflagellate from China. Plant Sci. J. 2018, 26, 454–457, (In Chinese with English Abstract). [Google Scholar]
  8. Roset, J.; Gibello, A.; Aguayo, S.; Domínguez, L.; Álvarez, M.; Fernández-Garayzabal, J.F.; Zapata, A.; Muñoz, M. Mortality of rainbow trout (Oncorynchus mykiss (Walbaum)) associated with freshwater dinoflagellate bloom (Peridinium polonicom (Woloszynska)) in a fish farm. Aquac. Res. 2002, 33, 141–145. [Google Scholar] [CrossRef]
  9. Amorim, C.A.; Moura, A.D.N. Ecological impacts of freshwater algal blooms on water quality, plankton biodiversity, structure, and ecosystem functioning. Sci. Total Environ. 2021, 758, 143605. [Google Scholar] [CrossRef]
  10. Zhang, M.; Shi, X.L.; Yang, Z.; Yu, Y.; Shi, L.M.; Qin, B.Q. Long-term dynamics and drivers of phytoplankton biomass in eutrophic Lake Taihu. Sci. Total Environ. 2018, 645, 876–886. [Google Scholar] [CrossRef]
  11. Deng, J.M.; Qin, B.Q.; Paerl, H.; Zhang, Y.L.; Ma, J.R.; Chen, Y.W. Earlier and warmer springs increase Cyanobacterial (Microcystis spp.) blooms in subtropical Lake Taihu, China. Freshw. Biol. 2014, 59, 1076–1085. [Google Scholar] [CrossRef]
  12. Huisman, J.; Codd, G.A.; Paerl, H.W.; Ibelings, B.W.; Verspagen, J.M.; Visser, P.M. Cyanobacterial blooms. Nat. Rev. Microbiol. 2018, 16, 471–483. [Google Scholar] [CrossRef]
  13. Guo, L. Doing battle with the green monster of Taihu Lake. Science 2007, 317, 1166. [Google Scholar] [CrossRef]
  14. Krakhmalniy, A.F.; Wasser, S.P.; Nevo, E.; Kapitanchuk, L.M. New variety of Peridinium gatunense Nygaard f. kinnereta Krachmalny (Dinophyta) from Lake Kinneret (Israel). Int. J. Algae 2014, 24, 250–255. [Google Scholar] [CrossRef]
  15. James, R.T.; O’Dell, K.; Smith, V.H. Water quality trends in lake Tohopekaliga, Florida, USA: Responses to watershed management. J. Am. Water Resour. Assoc. 1994, 30, 531–546. [Google Scholar] [CrossRef]
  16. Romo, S.; Villena, M.; Sahuquillo, M.; Soria, J.; GimÉNez, M.; Vicente, E.; Miracle, M. Response of a shallow Mediterranean lake to nutrient diversion: Does it follow similar patterns as in northern shallow lakes? Freshw. Biol. 2005, 50, 1706–1717. [Google Scholar] [CrossRef]
  17. Cox, T.J.S.; Maris, T.; Soetaert, K.; Conley, D.J.; Van Damme, S.; Meire, P.; Middelburg, J.J.; Vos, M.; Struyf, E. A macro-tidal freshwater ecosystem recovering from hypereutrophication: The Schelde case study. Biogeosciences 2009, 6, 2935–2948. [Google Scholar] [CrossRef]
  18. Chen, F.; Shu, T.; Jeppesen, E.; Liu, Z.; Chen, Y. Restoration of a subtropical eutrophic shallow lake in China: Effects on nutrient concentrations and biological communities. Hydrobiologia 2013, 718, 59–71. [Google Scholar] [CrossRef]
  19. Utermöhl, H. Zur Vervollkommung der quantitativen Phytoplankton-Methodik. Int. Ver. Theor. Angew. Limnol. Mitteilungen. 1958, 9, 1–38. [Google Scholar]
  20. Sournia, A. Phytoplankton Manual; UNESCO: Paris, France, 1978. [Google Scholar]
  21. GB 11893-89; Water Quality—Determination of Total Phosphorus-Ammonium Molybdate Spectrophotometric Method. Former State Environmental Protection Administration of the People’s Republic of China: Beijing, China, 1989. (In Chinese)
  22. GB 3838-2002; Environmental Quality Standards for Surface Water. Former State Environmental Protection Administration of the People’s Republic of China: Beijing, China, 2002. (In Chinese)
  23. HJ/T 91-2002; Technical Specifications Requirements for Monitoring of Surface Water and Waste Water. Former State Environmental Protection Administration of the People’s Republic of China: Beijing, China, 2002. (In Chinese)
  24. Lv, S.C.; Li, X.H.; Wang, R.; Wang, Y.; Dong, Z.J.; Zhou, T.P.; Liu, Y.L.; Lin, K.X.; Liu, L.S. Autochthonous sources and drought conditions drive anomalous oxygen-consuming pollution increase in a sluice-controlled reservoir in eastern China. Sci. Total Environ. 2022, 841, 156739. [Google Scholar] [CrossRef]
  25. Dhar, S.S.; Chakraborty, B.; Chaudhuri, P. Comparison of multivariate distributions using quantile–quantile plots and related tests. Bernoulli 2014, 20, 1484–1506. [Google Scholar] [CrossRef]
  26. Joanes, D.N.; Gill, C.A. Comparing measures of sample skewness and kurtosis. Statistician 1998, 47, 183–189. [Google Scholar] [CrossRef]
  27. Christia, C.; Giordani, G.; Papastergiadou, E. Assessment of ecological quality of coastal lagoons with a combination of phytobenthic and water quality indices. Mar. Pollut. Bull. 2014, 86, 411–423. [Google Scholar] [CrossRef]
  28. Field, C.B.; Behrenfeld, M.J.; Randerson, J.T.; Falkowski, P. Primary production of the biosphere: Integrating terrestrial and oceanic components. Science 1998, 281, 237–240. [Google Scholar] [CrossRef] [PubMed]
  29. Barber, R.T.; Hilting, A.K. History of the study of plankton productivity. In Phytoplankton Productivity: Carbon Assimilation in Marine and Freshwater Ecosystems; Williams, P.J., Thomas, D.N., Reynolds, C.S., Eds.; Blackwell Science: Oxford, UK, 2002; pp. 16–43. [Google Scholar]
  30. Dokulil, M.T.; Qian, K. Photosynthesis, carbon acquisition and primary productivity of phytoplankton: A review dedicated to Colin Reynolds. Hydrobiol. 2020, 848, 77–94. [Google Scholar] [CrossRef]
  31. Anderson, D.M.; Cembella, A.D.; Hallegraeff, G.M. Progress in understanding harmful algal blooms: Paradigm shifts and new technologies for research, monitoring, and management. Annu. Rev. Mar. Sci. 2012, 4, 143–176. [Google Scholar] [CrossRef] [PubMed]
  32. Sakamoto, S.; Lim, W.A.; Lu, D.D.; Dai, X.F.; Orlova, T.; Iwataki, M. Harmful algal blooms and associated fisheries damage in East Asia: Current status and trends in China, Japan, Korea and Russia. Harmful Algae 2021, 102, 101787. [Google Scholar] [CrossRef]
  33. Calandrino, E.S.; Paerl, H.W. Determining the potential for the proliferation of the harmful cyanobacterium Cylindrospermopsis raciborskii in Currituck Sound, North Carolina. Harmful Algae 2011, 11, 1–9. [Google Scholar] [CrossRef]
  34. Labbe, M.; Raymond, F.; Levesque, A.; Thaler, M.; Mohit, V.; Audet, M.; Corbeil, J.; Culley, A. Communities of phytoplankton viruses across the transition zone of the St. Lawrence Estuary. Viruses 2018, 10, 672. [Google Scholar] [CrossRef]
  35. Aoki, K.; Kuroda, H.; Setou, T.; Okazaki, M.; Yamatogi, T.; Hirae, S.; Ishida, N.; Yoshida, K.; Mitoya, Y. Exceptional red-tide of fish-killing dinoflagellate Karenia mikimotoi promoted by typhoon-induced upwelling. Estuar. Coast. Shelf Sci. 2019, 219, 14–23. [Google Scholar] [CrossRef]
  36. Dai, L.; Geng, H.X.; Yu, R.C.; Liu, Y.; Zhao, J.Y.; Wang, J.X.; Zhang, Q.C.; Kong, F.Z.; Zhou, M.J. Distribution of Alexandrium pacificum cysts in the area adjacent to the Changjiang River estuary, China. Mar. Pollut. Bull. 2020, 156, 111206. [Google Scholar] [CrossRef]
  37. Hansen, G.; Daugbjerg, N.; Henriksen, P. Comparative study of Gymnodinium mikimotoi and Gymnodinium aureolum, comb. nov. (=Gyrodinium aureolum) based on morphology, pigment composition, and molecular data. J. Phycol. 2003, 36, 394–410. [Google Scholar] [CrossRef]
  38. Toebe, K.; Alpermann, T.J.; Tillmann, U.; Krock, B.; Cembella, A.; John, U. Molecular discrimination of toxic and non-toxic Alexandrium species (Dinophyta) in natural phytoplankton assemblages from the Scottish coast of the North Sea. Eur. J. Phycol. 2013, 48, 12–26. [Google Scholar] [CrossRef]
  39. Arai, H.; Fukushima, T. Impacts of long-term increase in silicon concentration on diatom blooms in Lake Kasumigaura, Japan. Ann. Limnol.-Int. J. Lim. 2014, 50, 335–346. [Google Scholar] [CrossRef]
  40. Fallahi, M.; Rahbary, S.H.; Shamsaii, M. Determination of optimum concentration of Diuron for the growth and bloom of the algae (Scenedesmus obliquus) in in Vitro condition. Iran. J. Fish. Sci. 2014, 13, 739–747. [Google Scholar]
  41. Jakubowska, N.; Szelag-Wasielewska, E. Toxic picoplanktonic cyanobacteria-review. Mar. Drugs 2015, 13, 1497–1518. [Google Scholar] [CrossRef] [PubMed]
  42. Kormas, K.A.; Gkelis, S.; Vardaka, E.; Moustaka-Gouni, M. Morphological and molecular analysis of bloom-forming Cyanobacteria in two eutrophic, shallow Mediterranean lakes. Limnologica 2011, 41, 167–173. [Google Scholar] [CrossRef]
  43. Ross, C.; Santiago-Vazquez, L.; Paul, V. Toxin release in response to oxidative stress and programmed cell death in the cyanobacterium Microcystis aeruginosa. Aquat. Toxicol. 2006, 78, 66–73. [Google Scholar] [CrossRef]
  44. Ma, J.; Qin, B.; Paerl, H.W.; Brookes, J.D.; Hall, N.S.; Shi, K.; Zhou, Y.; Guo, J.; Li, Z.; Xu, H.; et al. The persistence of cyanobacterial (Microcystis spp.) blooms throughout winter in Lake Taihu, China. Limnol. Oceanogr. 2016, 61, 711–722. [Google Scholar] [CrossRef]
  45. Qin, B.; Li, W.; Zhu, G.; Zhang, Y.; Wu, T.; Gao, G. Cyanobacterial bloom management through integrated monitoring and forecasting in large shallow eutrophic Lake Taihu (China). J. Hazard. Mater. 2015, 287, 356–363. [Google Scholar] [CrossRef]
  46. Bernat-Quesada, F.; Alvaro, M.; Garcia, H.; Navalon, S. Impact of chlorination and pre-ozonation on disinfection by-products formation from aqueous suspensions of Cyanobacteria: Microcystis aeruginosa, Anabaena aequalis and Oscillatoria tenuis. Water Res. 2020, 183, 116070. [Google Scholar] [CrossRef]
  47. Huang, X.; Huang, Z.; Chen, X.P.; Zhang, D.; Zhou, J.; Wang, X.; Gao, N. The predominant phytoplankton of Pseudoanabaena holding specific biosynthesis gene-derived occurrence of 2-MIB in a drinking water reservoir. Environ. Sci. Pollut. Res. Int. 2018, 25, 19134–19142. [Google Scholar] [CrossRef]
  48. Wang, H.; Sivonen, K.; Rouhiainen, L.; Fewer, D.P.; Liu, B. Genome-derived insights into the biology of the hepatotoxic bloom-forming cyanobacterium Anabaena sp. Strain 90. BMC Genom. 2012, 13, 613. [Google Scholar] [CrossRef]
  49. Xu, C.P.; Li, S.C.; Chai, W.B.; Chen, Y.W. A newly recorded cyanobacterial species in water blooms occurred in Lake Poyang-Merismopedia convoluta Breb. Kützing. J. Lake Sci. 2012, 24, 643–646, (In Chinese with English Abstract). [Google Scholar]
  50. Blokker, P.; Schouten, S.; van den Ende, H.; de Leeuw, J.W.; Hatcher, P.G.; Sinninghe Damsté, J.S. Chemical structure of algaenans from the fresh water algae Tetraedron minimum, Scenedesmus communis and Pediastrum boryanum. Org. Geochem. 1998, 29, 1453–1468. [Google Scholar] [CrossRef]
  51. Hu, Y.X.; Xing, W.Y.; Song, H.Y.; Liu, G.X.; Hu, Z.Y. Analysis of mitochondrial and chloroplast genomes in two volvocine algae: Eudorina elegans and Eudorina cylindrica (Volvocaceae, Chlorophyta). Eur. J. Phycol. 2019, 54, 193–205. [Google Scholar] [CrossRef]
  52. Okada, M.; Takeshita, S.; Sudo, R. Microcosm system study on the formation and control of water-bloom. Jpn. J. Water Pollut. Res. 1988, 11, 371–380. [Google Scholar] [CrossRef]
  53. Rhee, G.-Y. A continuous culture study of phosphate uptake, growth rate and polyphosphate in Scenedesmus sp. J. Phycol. 1973, 9, 495–506. [Google Scholar] [CrossRef]
  54. O’Neil, J.M.; Davis, T.W.; Burford, M.A.; Gobler, C.J. The rise of harmful Cyanobacteria blooms: The potential roles of eutrophication and climate change. Harmful Algae 2012, 14, 313–334. [Google Scholar] [CrossRef]
  55. Dodds, W.; Smith, V. Nitrogen, phosphorus, and eutrophication in streams. Inland Waters 2016, 6, 155–164. [Google Scholar] [CrossRef]
  56. Keck, F.; Lepori, F. Can we predict nutrient limitation in streams and rivers? Freshw. Biol. 2012, 57, 1410–1421. [Google Scholar] [CrossRef]
  57. Paerl, H.W.; Gardner, W.S.; Havens, K.E.; Joyner, A.R.; McCarthy, M.J.; Newell, S.E.; Qin, B.; Scott, J.T. Mitigating Cyanobacterial harmful algal blooms in aquatic ecosystems impacted by climate change and anthropogenic nutrients. Harmful Algae 2016, 54, 213–222. [Google Scholar] [CrossRef]
  58. Smith, V.H. The nitrogen and phosphorus dependence of algal biomass in lakes: An empirical and theoretical analysis. Limnol. Oceanogr. 1982, 27, 1101–1112. [Google Scholar] [CrossRef]
  59. Elser, J.J.; Bracken, M.E.S.; Cleland, E.E.; Gruner, D.S.; Harpole, W.S.; Hillebrand, H.; Ngai, J.T.; Seabloom, E.W.; Shurin, J.B.; Smith, J.E. Global analysis of nitrogen and phosphorus limitation of primary producers in freshwater, marine and terrestrial ecosystems. Ecol. Lett. 2007, 10, 1135–1142. [Google Scholar] [CrossRef] [PubMed]
  60. Dugdale, R.C.; Goering, J.J. Uptake of new and regenerated forms of nitrogen in primary productivity. Limnol. Oceanogr. 1967, 12, 196–206. [Google Scholar] [CrossRef]
  61. Howarth, R.W.; Marino, R. Nitrogen as the limiting nutrient for eutrophication in coastal marine ecosystems: Evolving views over three decades. Limnol. Oceanogr. 2006, 51, 364–376. [Google Scholar] [CrossRef]
  62. Fisher, T.R.; Peele, E.R.; Ammerman, J.W.; Harding, L.W. Nutrient limitation of phytoplankton in Chesapeake Bay. Mar. Ecol. Prog. Ser. 1992, 82, 51–63. [Google Scholar] [CrossRef]
  63. Mallin, M.A.; Paerl, H.W.; Rudek, J.; Bates, P.W. Regulation of estuarine primary production by watershed rainfall and river flow. Mar. Ecol. Prog. Ser. 1993, 93, 199–203. [Google Scholar] [CrossRef]
  64. Rudek, J.; Paerl, H.W.; Mallin, M.A.; Bates, P.W. Seasonal and hydrological control of phytoplankton nutrient limitation in the Lower Neuse River Estuary, North Carolina. Mar. Ecol. Prog. Ser. 1991, 75, 133–142. [Google Scholar] [CrossRef]
  65. Xu, H.; Paerl, H.W.; Qin, B.Q.; Zhu, G.W.; Gao, G. Nitrogen and phosphorus inputs control phytoplankton growth in eutrophic Lake Taihu, China. Limnol. Oceanogr. 2010, 55, 420–432. [Google Scholar] [CrossRef]
  66. Scott, J.T.; McCarthy, M.J.; Paerl, H.W. Nitrogen transformations differentially affect nutrient-limited primary production in lakes of varying trophic state. Limnol. Oceanogr. Lett. 2019, 4, 96–104. [Google Scholar] [CrossRef]
  67. Lin, Y.J.; He, Z.L.; Yang, Y.G.; Stoffella, P.J.; Philips, E.J.; Charles, A.P. Nitrogen versus phosphoruslimitation of phytoplankton growth in Ten Mile Creek, Florida, USA. Hydrobiologia 2008, 605, 247–258. [Google Scholar] [CrossRef]
  68. Schindler, D.W. Evolution of phosphorus limitation in lakes. Science 1977, 195, 260–262. [Google Scholar] [CrossRef]
  69. Paerl, H.W.; Scott, J.T.; McCarthy, M.J.; Newell, S.E.; Gardner, W.S.; Havens, K.E.; Hoffman, D.K.; Wilhelm, S.W.; Wurtsbaugh, W.A. It takes two to tango: When and where dual nutrient (N & P) reductions are needed to protect lakes and downstream ecosystems. Environ. Sci. Technol. 2016, 50, 10805–10813. [Google Scholar] [PubMed]
  70. Edmondson, W.T.; Lehman, J.T. The effect of changes in the nutrient income on the condition of Lake Washington. Limnol. Oceanogr. 1981, 26, 1–29. [Google Scholar] [CrossRef]
  71. Conley, D.J.; Paerl, H.W.; Howarth, R.W.; Boesch, D.F.; Seitzinger, S.P.; Havens, K.E.; Lancelot, C.; Likens, G.E. Controlling eutrophication: Nitrogen and phosphorus. Science 2009, 323, 1014–1015. [Google Scholar] [CrossRef] [PubMed]
  72. Guildford, S.J.; Hecky, R.E. Total nitrogen, total phosphorus, and nutrient limitation in lakes and oceans: Is there a common relationship? Limnol. Oceanogr. 2000, 45, 1213–1223. [Google Scholar] [CrossRef]
  73. Lewis, W.M.; Wurtsbaugh, W.A. Control of Lacustrine Phytoplankton by Nutrients: Erosion of the Phosphorus Paradigm. Int. Rev. Hydrobiol. 2008, 93, 446–465. [Google Scholar] [CrossRef]
  74. Bachmann, R.W. The limiting factor concept. What Stops Growth? Lakeline 2001, 21, 26–28. [Google Scholar]
  75. Wetzel, R.G. Variations in productivity of Goose and hypereutrophic Sylvan lakes, Indiana. Invest. Indiana Lakes Streams 1966, 7, 147–184. [Google Scholar]
  76. Dzialowski, A.R.; Wang, S.H.; Lim, N.C.; Spotts, W.W.; Huggins, D.G. Nutrient limitation of phytoplankton growth in central plains reservoirs, USA. J. Plankton Res. 2005, 27, 587–595. [Google Scholar] [CrossRef]
  77. Downing, J.A.; Watson, S.B.; McCauley, E. Predicting Cyanobacteria dominance in lakes. Can. J. Fish. Aquat. Sci. 2001, 58, 1905–1908. [Google Scholar] [CrossRef]
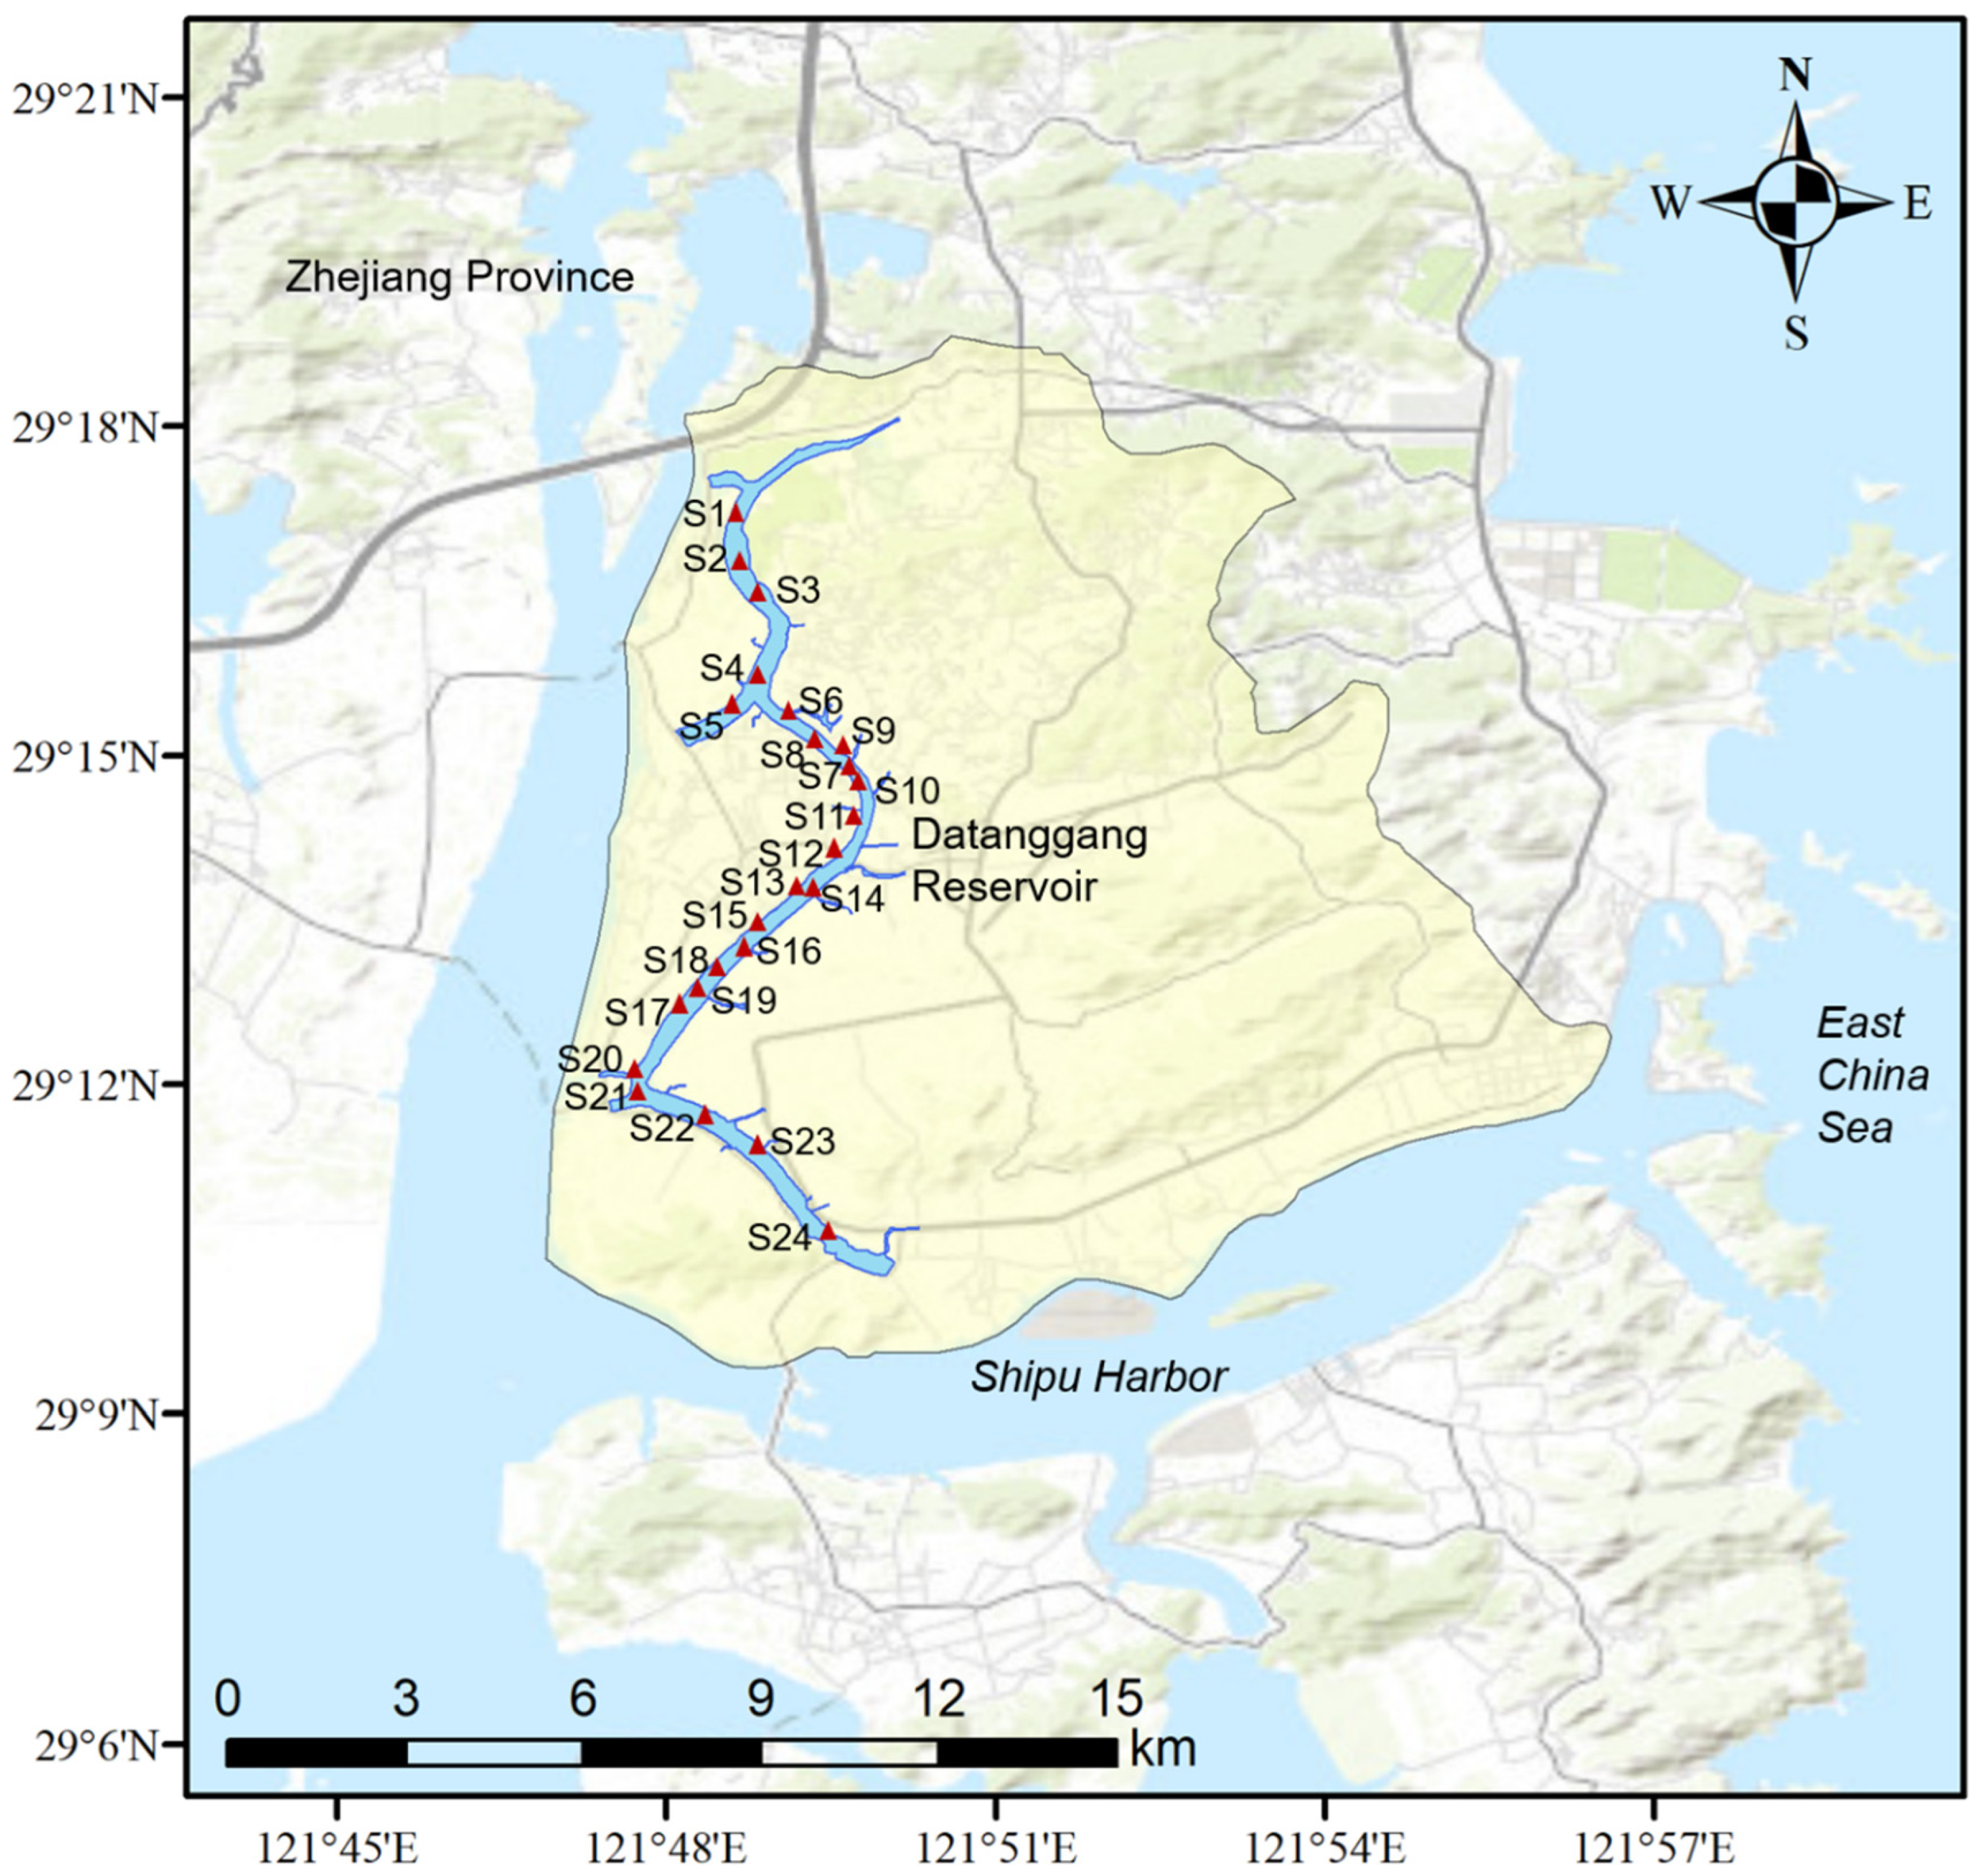
Figure 1. Study area and sampling sites.
Water 16 02813 g001
Figure 2. Chlorophyll a (A), species numbers (B), and cell abundance (C). Cell abundance had a significant correlation with species number (C) (p < 0.01). (A): Chlorophyll a and species numbers in sampling sites. S1 to S24 are the sampling stations. (B): The correlation between cell abundance and species number. Cell abundance had a significant correlation with species number (p < 0.01), and the correlation coefficient was 0.848. (C): Cell abundance in each site. S1 to S24 are the sampling stations.
Water 16 02813 g002
Figure 3. Composition of algae species at the sampling sites. (A): Species with cell abundance of more than 1,000,000 cells/L in one or one more site; (B): Cyanobacteria, Cryptophyta, Pyrrophyta, and Bacillariophyta spp. less than 1,000,000 cells/L; (C): Chlorophyta, Euglenophyta, and Chrysophyta spp. less than 1,000,000 cells/L.
Water 16 02813 g003
Figure 4. RDA of algae cell numbers and environmental factors.
Water 16 02813 g004
Figure 5. Relationship between cell abundance, TP concentration, TN concentration, and N/P rate. (a): Algae cell abundance in different TP concentrations and N/P rate; (b): algae cell abundance in different TN and TP concentrations.
Water 16 02813 g005
Disclaimer/Publisher’s Note: The statements, opinions and data contained in all publications are solely those of the individual author(s) and contributor(s) and not of MDPI and/or the editor(s). MDPI and/or the editor(s) disclaim responsibility for any injury to people or property resulting from any ideas, methods, instructions or products referred to in the content.