Abstract
Nitrate pollution is a global environmental problem, and mean nitrate levels have risen by an estimated 36% in global waterways since 1990. Tracing nitrate sources is important for water quality management, and nitrate isotopes (δ15N-NO3− and δ18O-NO3−) are commonly used for this purpose because of the different isotopic compositions of different sources. However, the impact of nitrate sorption on matrix and desorption from matrix on N and O isotopic composition of nitrate in liquid phase has not been well clarified. To explore the mechanism for the changes in nitrate concentration and isotopes in liquid phase during sorption and desorption, this study took a shale sample (enriched in clay minerals and commonly exposed in the Earth), conducted a series of laboratory experiments for nitrate sorption and desorption, and studied the impact of sorption and desorption on nitrate N and O isotopic composition in liquid phase. The results showed that the shale sample exhibited a rapid sorption and desorption rate for nitrate in the surface water samples, with the nitrate concentration in the solution decreasing from 14.3 mg/L to 4.1 mg/L within 5 min. The sorption data fit the Langmuir model better than that of the Freundlich model. The maximum possible sorption (Qmax) for the shale sample was estimated to be 46 μg/g. Preliminary laboratory experiments showed that changes in δ15N-NO3− values were not obvious, and changes in δ18O-NO3− values in liquid phase were minor during sorption and desorption of the shale sample, suggesting that nitrogen isotopic fractionation can be neglected, and the sorption of nitrate by the shale sample has a very limited impact on the distribution of nitrate isotopes in liquid phase. However, the impact of nitrate desorption on the nitrate isotopes in liquid phase depends on the isotopic composition of exchangeable nitrate in the solid phase, which may be related to antecedent water–rock interactions. This study provides important information for elucidating the evolution mechanism of nitrate and its isotopic compositions following sorption-desorption, and is conducive to revealing the nitrogen cycle law in the environment.
1. Introduction
Nitrate (NO3−) is a common pollutant in river water and groundwater, and can seriously affect environmental quality, ecosystems, and human health when its concentration is high [1,2,3]. High nitrate and nitrite concentrations in drinking water can give rise to bluebaby syndrome in bottle-fed infants, particularly where there is endemic diarrhoea in infants [4]. The maximum contaminant level for nitrate in drinking water has been set at 50 mg/L as NO3− by the World Health Organization and 10 mg/L as NO3−-N by the United States Environmental Protection Agency and the National Health Commission of the People’s Republic of China (in this study, the concentration of nitrate is expressed as NO3−) [4]. Nitrate pollution has become a global environmental problem [5], and mean nitrate levels have risen by an estimated 36% in global waterways since 1990, with the highest increase observed in the Eastern Mediterranean, Africa, and China, where nitrate contamination has more than doubled [6,7]. To manage water quality, it is important to trace the origin and evolution of NO3− in global waterways. Generally, NO3− in river water or groundwater can be derived from the chemical fertilizers in agricultural areas (NO3− fertilizers or nitrification of NH4+ fertilizers), nitrification of soil nitrogen, livestock manure, septic waste, industrial wastewater discharge, or rainfall [8,9,10,11].
The dual isotopes of nitrate, including δ15N-NO3− and δ18O-NO3−, have been used to differentiate different sources in river water and groundwater since the 1970s [12], because different sources always have different δ15N-NO3− and δ18O-NO3− values (Figure 1). For example, the direct input of NO3− from rainfall (including rainfall NO3− and/or NO3− derived from nitrification of rain NH4+) can be intensively cycled through the organic nitrogen pool in all watersheds or taken up by plants and contribute little to groundwater NO3− based on nitrate dual isotopes [13,14,15]. While chemical fertilizers generally have relatively low δ15N values and manure and septic waste have relatively high δ15N values (Figure 1), an increase in NO3− in river water or groundwater from chemical fertilizers (mainly NH4+-fertilizers) would show low δ15N-NO3− values, and from manure and septic waste it would show high δ15N-NO3− values (Figure 1 and Figure 2). Nitrate consumption through denitrification (Equations (1) and (2)) causes δ15N of residual nitrate to increase exponentially as nitrate concentrations decrease [8,16].
4NO3− + 5C + 2H2O → 2N2 + 4HCO3− + CO2
14NO3− + 5FeS2 + 4H+ → 7N2 + 10SO42− + 5Fe2+ + 2H2O
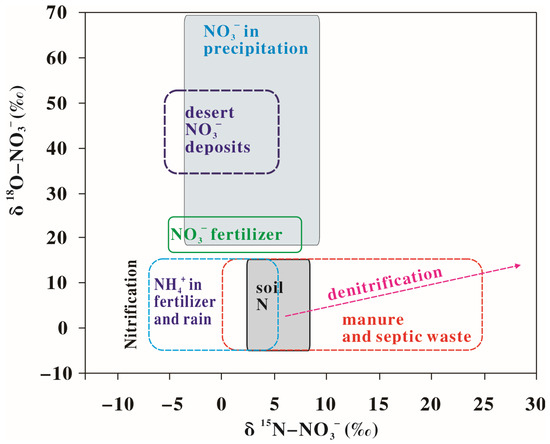
Figure 1.
Scheme of typical ranges of δ15N and δ18O values of nitrates from different sources, reprinted with permission from Ref. [12]. Copyright 1998, Elsevier, with License Number 5865090777555.
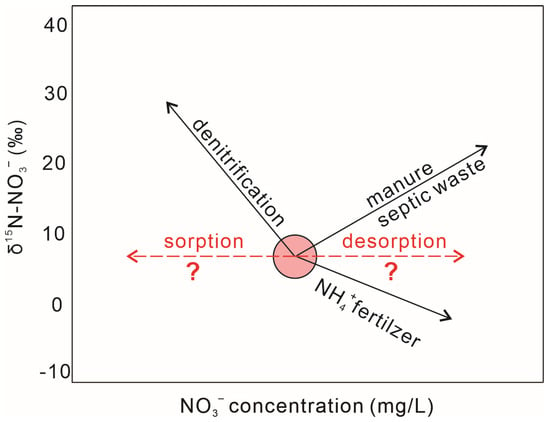
Figure 2.
The impact of different processes on nitrate concentration and nitrate nitrogen isotopes. The impact of sorption to clay minerals or/and desorption from clay minerals on the N isotopic composition has not been well clarified.
In this case, a decrease in the NO3− concentration derived from denitrification would show an increasing trend for δ15N-NO3− (Figure 2). Denitrification also causes an increase in the δ18O-NO3− of the residual nitrate. Several studies have shown that the ratio of enrichment of nitrogen to oxygen (Δδ15N:Δδ18O) ranged from 1.3:1 to 2.1:1, with a typical value of 2:1 [8,9,17,18].
However, the impact of the sorption of water NO3− onto clay minerals (resulting in a decrease in NO3− concentration of water) and/or desorption of nitrate in clay minerals to water (increasing in the NO3− concentration of water) on nitrate isotopes in water is not clear [19,20,21]. Previous studies have shown that sorption/desorption processes may cause small isotope fractionation in fluid as a result of isotope exchange (mainly NH4+) on the charged surfaces of clays and other materials [8,22]; however, there is little evidence for soil sorption of nitrate in solution [8]. Mayer and Matiatos pointed out that N species are very mobile and usually undergo multiple biogeochemical transformations before reaching the groundwater table as nitrate [23]. Denitrification is considered the most common sink for nitrate in groundwaters provided dissolved O2 is <2 mg/L. The adsorption capacity of nitrate in soil is low; however, nitrate is more readily absorbed by clay after undergoing dissimilatory anaerobic reduction to ammonia [23].
The sorption of nitrate ions in fluid phase onto clay minerals has not received much attention, possibly because clay surfaces are negatively charged [24]. Under certain conditions, some anions can be adsorbed in the order of the strength of adsorption of selected anions [25]:
F− > PO42− > HPO4− > HCO3− > H2BO3− > SO42− > Cl− >NO3−
Although NO3− has a low strength of sorption, recent studies have shown that nitrate in fluid can be sorbed onto some materials, such as sepiolite [24], Mg-Al layered double hydroxide [26], kaolin [27], modified calcium bentonite [28], organoclays [29], greenish clay [30], and bamboo-carbo [31]. However, these studies only focused on the sorption capacity of adsorbents for nitrate in fluid, and did not study the changes of isotopes and sorption mechanism during the sorption process. Shale samples, with high concentrations of clay minerals, can result in a decrease in NO3− concentration in water [32].
While there is little evidence for the impact of sorption-desorption on nitrate isotopic composition, this paper aims to explore the mechanism for the changes in nitrate concentration and isotopes in liquid phase during sorption and desorption of a shale sample.
2. Materials and Methods
Shale is always enriched in clay minerals [33], which commonly have high sorption sites and ion exchange capacities [34,35]. In addition, shale is a widely distributed sedimentary rock, accounting for 33.1% of the exposed rock on continents [36]. Therefore, a shale rock sample from a borehole (at a depth of 640 m from the surface) was used as an adsorbent in this study. The borehole is in the Xishui area of Southwest China (Figure S1), where a large area of exposed shale is distributed. The shale core samples were crushed using a disc mill and sieved using a sieve shaker with a sieve mesh number of 200. As a result, shale powder with a grain size of less than 74 μm was obtained.
Deionized water (30 mL) was mixed with the shale sample (15 g) at a water/rock ratio of 2:1 in a 50 mL tube; each equilibration time ranged from 2 min to 7 d (i.e., 2 min, 18 min, 30 min, 1 h, 2 h, 4 h, 6 h, 1 d, 2 d, 3 d, and 7 d) to confirm the presence of nitrate in the shale sample (Experiment Set 1) (Table 1). After each water–rock interaction between deionized water and shale sample, the tube was centrifuged at 4500 rpm for 15 min. The soluble or adsorbed components (including NO3−, Cl−, and SO42−) of the shale sample can be dissolved or extracted from the supernatant solution during equilibration of the shale sample with deionized water. The supernatant solution was filtered through 0.45 μm filters, and the main anions (NO3−, Cl−, and SO42−) were measured.

Table 1.
Change in concentration of main anion (including NO3−, Cl−, and SO42−) at different equilibration times of the interaction between deionized water and the shale sample (Experiment Set 1).
Next, sorption behavior experiments of nitrate in solution by the shale sample were conducted. Five sets of laboratory experiments (Experiment Set 2-6, Table 2) were conducted to study the impact of sorption equilibrium time (from 1 min to 1 d), solution pH (from 2.01 to 10.5), temperature (from 5 to 75 °C), solution electrical conductivity (EC, from 290 to 906 μs/cm), and initial concentration (from 6.3 to 79.6 mg/L). The water/rock ratio was also 2:1 (i.e., 15 g shale sample was added to 30 mL of solution in a 50 mL tube). For the first four sets, the NO3− concentration in the KNO3 solution was adjusted to be 31.31 mg/L, about 4–16 times higher than the natural baseline value in most temperate regions covered by forest or grassland (2–9 mg/L) [37,38,39]. After each sorption process, the tube was centrifuged at 4500 rpm for 15 min. The supernatant solution was filtered through 0.45 μm filters and main anions (NO3−, Cl−, and SO42−) were measured. The sorbed concentration Qe (μg/g) can be expressed as
where Ci is the initial concentration (mg/L), Ce is the equilibrium concentration (mg/L), V is the volume of the solution (mL), and m is the mass of the adsorbent (g), that is the shale sample used in this study.

Table 2.
Five sets (Experiment Sets 2–6) for studying the sorption behaviors of nitrate in solution by the shale sample under different equilibration time, pH, temperature, EC, and initial NO3− concentration conditions.
To study the nitrate isotherm sorption behavior of nitrate in solution by the shale sample (Experiment Set 6 in Table 2), the Langmuir and Freundlich adsorption isotherm models were used to characterize the sorption behavior. The Langmuir model is suited for describing monolayer adsorption, where adsorption occurs exclusively on a single layer on the solid surface. It assumes that all adsorption sites on the surface are uniform, there are no interactions between adsorbent molecules, and the adsorption process is reversible. In contrast, the Freundlich model is an empirical approach designed for multimolecular layer adsorption, particularly on heterogeneous surfaces. It assumes that the energy distribution of adsorption sites is non-uniform, allowing it to characterize the adsorption behavior on surfaces with varying characteristics, especially at low concentrations. The Langmuir equation [40] can be written as
where b is the experimental constant, and Qmax is the maximum possible sorption by the solid (μg/g), which is usually assumed to represent monolayer surface coverage. The Langmuir equation is usually linearized by inversion, and so used to test whether it is obeyed by experimental data [40], as shown in Equation (6)
Through experiments, a series of Ce and Qe values are obtained, with Ce/Qe as the vertical axis and Ce as the horizontal axis, to draw the Langmuir isotherm sorption line. The reciprocal of the slope of this line is Qmax.
The Freundlich equation can be expressed as follows [41]:
where K and n are experimental constants. To decide if the experimental sorption behavior of a substance obeys the Freundlich isotherm model, the approach generally used is to first linearize the isotherm by taking the logarithm of expression (8), which yields:
The intercept of the line equals log K, and the slope is n.
To study the impact of sorption and desorption by the shale sample on nitrate isotopes in liquid phase, a river water sample located 300 m west of the shale sample site (Figure S1) was taken as the initial water (Sam0). The NO3− concentration was 14.31 mg/L, about four times higher than the median groundwater baseline value of 3.8 mg/L in the study area [15], representing a slight contamination level. For sorption, the sample Sam0 was mixed with the shale sample and reacted for 5 min to 7 d at 25 °C (Experiment Set 7, Table 3). After each water–rock interaction, the tube was centrifuged at 4500 rpm for 15 min. The supernatant solution was filtered through 0.45 μm filters, and the main anions (NO3−, Cl−, and SO42−) and nitrate isotopes (δ15N-NO3− and δ18O-NO3−) were measured.

Table 3.
Sorption experiment of nitrate in surface water by shale (Experiment Set 7).
For desorption, the sample Sam0 was first mixed with the shale sample and reacted for 6 h at 25 °C (i.e., let NO3− in the sample Sam0 sorb into the shale sample), and then a series of desorption processes were consecutively conducted using deionized water or KCl solution (Experiment Sets 8 and 9, Table 4). The KCl solution concentration was set to 2 N (2 mol/L), which is commonly used to desorb ions in soil [35,42]. After each sorption and desorption process, the tube was centrifuged at 4500 rpm for 15 min. The supernatant solution was filtered through 0.45 μm filters and main anions (NO3−, Cl− and SO42−) and nitrate isotopes (δ15N-NO3− and δ18O-NO3−) were measured.

Table 4.
Desorption experiment of nitrate in the shale sample by deionized water and KCl solution (Experiment Sets 8 and 9).
The mineral compositions of the shale sample were identified using an X-ray Diffractometer (XRD, X’Pert PRO MPD, PANalytical B.V., Almelo, the Netherlands). The water temperature, electrical conductivity, pH, and oxidation-reduction potential in liquid phase were measured using a portable multi-parameter meter (HQ40D, Hach, Loveland, CO, USA). Anions concentrations (NO3−, Cl−, and SO42−) in liquid phase were measured with ion chromatography (IC, Dionex ICS-2000, Dionex Corporation, Sunnyvale, CA, USA) in the Institute of Geology and Geophysics, Chinese Academy of Science with a detection limit of 0.01 mg/L and with uncertainty of approximately 3%. Nitrate concentrations only for 2 N KCl solution (Experiment Set 9) were measured using a Gallery™ Discrete Photometry Analyzer (Thermo Scientific, Waltham, MA, USA) with a detection limit of 0.01 mg/L and with uncertainty better than 2%. The N and O isotope ratios of NO3− (δ15N-NO3− and δ18O-NO3−) in liquid phase were measured using the denitrifier method by converting NO3− to N2O at the Isotope Science Lab (ISL) [43], University of Calgary. The results were reported as δ15N and δ18O against standard AIR (the reference standard gas) and VSMOW (Vienna Standard Mean Ocean Water) as references (Equations (9) and (10)). The analytical precisions for δ15N-NO3− and δ18O-NO3− were 0.3‰ and 0.7‰, respectively, based on a long-term record of analyses of the ISL in-house reference (ISL-KNO3).
3. Results
3.1. Characteristics of the Sorbent
The XRD results showed that the shale sample (sorbent) was composed of clay minerals (40.2%), quartz (39.3%), calcite (9.6%), plagioclase (6.6%), pyrite (3.8%), and dolomite (0.5%) (Figure 3). Illite (72%) and illite–smectite mixed layer (28%) were the main clay minerals. The mineral analysis results for the shale sample are also consistent with those reported by Sui et al. [44] for the same region. Experiment Set 1 showed that after 7 days of water–rock interactions between the shale sample and deionized water, the content of NO3− concentration of the solution was only 0.03 mg/L (always less than 0.07 mg/L from 2 min to 7 d), while chloride and sulfate reach 18.8 mg/L and 419 mg/L, respectively (Table 1). This indicates that the shale sample did not contain soluble or exchangeable nitrate, but did contain soluble or exchangeable chloride and sulfate.
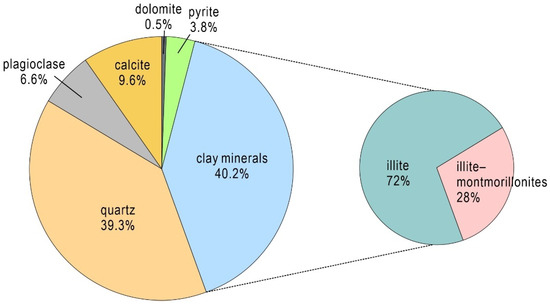
Figure 3.
The composition of the shale sample in this study revealed by XRD analysis.
3.2. Nitrate Sorption Behavior
Factors such as the equilibration time, pH, temperature, EC, and initial nitrate content were considered in this study (Table 2). The results showed that the nitrate concentration in liquid phase remained almost constant, ranging from 11.2 mg/L (7 d) to 15.2 mg/L (2 min) with reacting time from 1 min to 7 d (Figure 4a), suggesting that equilibration time was not the main impact factor for nitrate sorption from liquid phase to the shale sample. Under these conditions, the average sorbed concentration Qe was 35 μg/g. At low pH (i.e., pH = 2.01), the sorption rate was low. However, the sorption rate remained constant, with pH ranging from 3.93 to 10.5 (Figure 4b), with an average sorbed concentration Qe of 40 μg/g. Temperature can significantly affect sorption. At 5 °C, the sorbed concentration Qe was 44 μg/g (Figure 4c). However, it was only 7 μg/g at 75 °C. The impact of temperature on sorption may be complex and related to endothermic/exothermic process, ion strength, and ion effects [45,46,47]. The sorbed concentration Qe with EC less than 610 μs/cm was larger than 30 μg/g and decreased to 24 μg/g at an EC of 906 μs/cm (Figure 4d), which was mainly caused by the occupation of sorption sites by other ions. With an increase in the initial nitrate concentration in liquid phase, the sorbed concentration Qe increased, but remained at approximately 42 μg/g (Figure 4e). This could be controlled by the maximum possible sorption Qmax. However, the degree of sorption extraction of ions from liquid phase, Rs, (Equation (11)), decreased with increasing initial nitrate concentration (Figure 4f). When the initial concentration was 6.03 mg/L, approximately 70% of nitrate was sorbed into the sorbent. However, it decreased to 25% at an initial concentration of 79.6 mg/L.
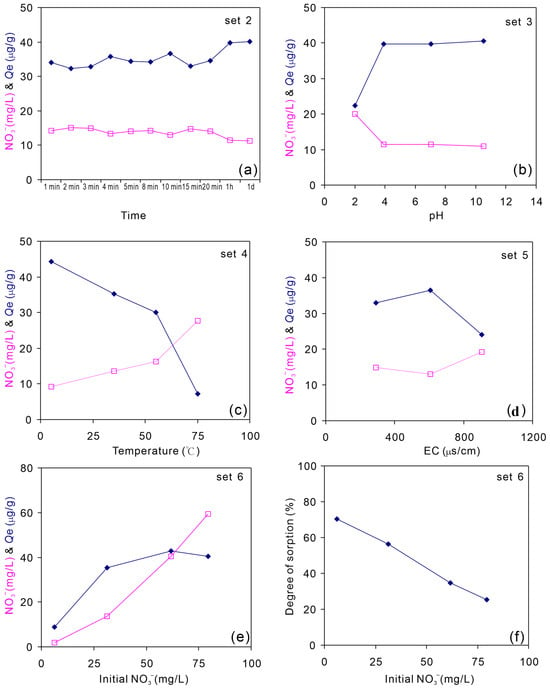
Figure 4.
Sorption behavior (reflected by sorption capacity) of nitrate in solution by the shale sample affected by equilibration time (a), pH (b), temperature (c), EC (d), and initial NO3− concentration (e) (experimental conditions are shown in Table 2). The degree of sorption extraction of ions from liquid phase is presented in (f).
Sorption processes are usually described through isotherms that represent the adsorbate distribution between the liquid and solid phases as a function of the equilibrium concentration [26,41]. In this study, the Langmuir and Freundlich isotherm sorption models were used to describe the sorption characteristics of nitrate in liquid phase by the shale sample (Figure 5). The mathematical forms of the models are given by Equations (6) and (8). The higher value of R2 indicated that the sorption data were better fitted to the Langmuir model (R2 = 0.99) than to the Freundlich model (R2 = 0.90). In the sorption isotherm of nitrate onto the sorbent (shale sample) according to the Langmuir models, Qe/Ce increases linearly as Ce increases, with a slope of 0.0219. In addition, bringing the Langmuir isothermal adsorption equation fitted in Figure 5a into Equation (6), the coefficient b can be obtained as 0.18, and the maximum possible sorption (Qmax) as 46 μg/g (which is reasonably higher than the Qe values in Experiment Set 2–5, Figure 4).
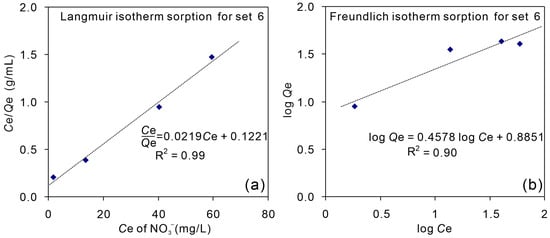
Figure 5.
Sorption isotherm of nitrate onto the sorbent (shale sample) according to the Langmuir (a) and Freundlich (b) models. The unit of Ce is mg/L and Qe is μg/g.
3.3. Changes in Nitrate Isotope during Sorption
When the shale sample (absence of soluble and exchangeable nitrate, see Experiment Set 1, Section 3.1) was reacted with the natural river water (Sam0) (Experiment Set 7), the concentration of nitrate in liquid phase decreased from 14.3 mg/L (Sam0) to 3.7–4.9 mg/L with sorption times ranging from 5 min to 7 d (Table 3). Once the sorption process started, the nitrate concentrations in liquid phase remained relatively constant (Figure 6), in agreement with the findings in Experiment Set 2. However, the δ15N-NO3− values in liquid phase remained constant (9.3‰ ± 0.2‰) in the first three days (Table 3 and Figure 6). Therefore, the decrease in nitrate concentration in liquid phase was due to sorption rather than denitrification, because denitrification would increase in δ15N-NO3− and δ18O-NO3− values in liquid phase with the ratio of enrichment of nitrogen to oxygen (Δδ15N:Δδ18O) ranging from 1.3:1 to 2.1:1 (Figure 7). This suggested that during sorption, there is almost no isotopic fractionation for N. For O, there was about a 2‰ increase in δ18O-NO3− values in liquid phase during sorption (1.2‰ for initial water Sam0 and an average of 3.3‰ for the residual waters) (Table 3). It is a minor change for δ18O-NO3−.
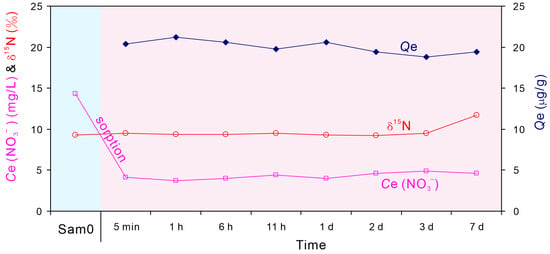
Figure 6.
Changes in nitrogen isotope (δ15N-NO3−), equilibrium concentration Ce (NO3−), and sorbed concentration (Qe) following sorption of nitrate in Sam0 by the shale sample with increasing time.
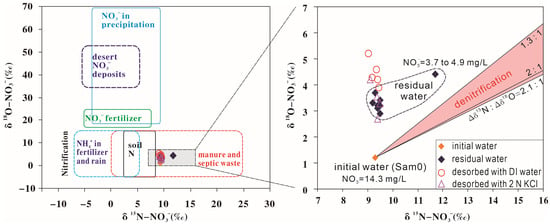
Figure 7.
Plot of δ15N-NO3− against δ18O-NO3− for initial water (Sam0), residual water (at different times after the shale sample reacts with the initial water), deionized (DI) water, and with 2 N KCl solution (after four times desorption of nitrate in the shale sample, respectively).
3.4. Changes in Nitrate Isotope during Desorption
After the nitrates in the initial water (Sam0) were sorbed onto the shale sample, deionized water and 2 N KCl solution were used to consecutively desorb the sorbed nitrate for four cycles (30 mL × 4), respectively (Experiment Sets 8 and 9, Table 5). The total sorbed amount was 309.6 μg and 305.7 μg, respectively (Table 5, Equations (12) and (13)). The results showed that deionized water can gradually desorb the sorbed nitrate in the shale sample (actually through other anions, like SO42−, HCO3−, and Cl−). After four cycles of desorption, the total desorbed amount was 164.9 μg, i.e., about 53.3% of sorbed nitrate was desorbed. When 2 N KCl solution was used, 253.2 μg (82.8%) sorbed nitrate was desorbed at the first time (9-2, in Table 5). After undergoing four cycles of desorption, the cumulative desorbed amount totaled 258.2 μg, corresponding to approximately 84.5% of the initially sorbed nitrate.
(14.31 − 3.99) mg/L × 30 mL = 309.6 μg
(14.31 − 4.12) mg/L × 30 mL = 305.7 μg

Table 5.
The result for the desorption experiments of nitrate in shale sample by deionized water and KCl solution (Experiment Sets 8 and 9) (* stands for water volume after centrifugation; # stands for total liquids volume available for measurement; $ stands for sorbed amount; & stands for each desorbed amount).
However, changes in δ15N-NO3− in liquid phase were not obvious during nitrate sorption by the shale sample (Table 5). The δ15N-NO3− values of the desorbed nitrate in liquid phase ranged from 9.0‰ to 9.5‰ (9.3 ± 0.3‰) and were close to the initial δ15N-NO3− of 9.3‰. Considering that the analysis error for δ15N-NO3− is 0.3‰, the changes in δ15N-NO3− during desorption can be neglected. For δ18O-NO3−, the changes during desorption were also minor (Table 5), approximately within 2‰ (analysis error for δ18O-NO3− is 0.7‰).
4. Discussion
This study showed that nitrate sorption and desorption from liquid phase to the shale sample were fast and occurred within 5 min (Table 3, Figure 6). Previous studies also showed that the sorption and desorption of metals onto the surface-exposed sorption sites of clay particles can approach equilibrium in seconds to minutes [26,41,48]. The sorption behaviors (better fitted for the Langmuir model) were in agreement with the findings of Islam and Patel and Hosni and Srasra for nitrate (Figure 5) [48,49]. Illite (72%) and illite–smectite mixed layer (28%) were the main clay minerals in the shale sample, and the goodness-of-fit to the Langmuir equation for nitrate indicated monolayer sorption of ions on the illite minerals in the shale sample [50], which is consistent with the results obtained by Long (2024) (the Langmuir isothermal adsorption model is more suitable to describe the adsorption process of calcium on illite than the Freundlich isothermal adsorption model) [51]. The Langmuir model assumes that only single molecular layer adsorption can occur on the surface of the adsorbent (each adsorption site can only adsorb one gas molecule at most). This assumption makes the Qe/Ce increases linearly as Ce increases with a slope of 0.0219 under low pressure or low concentration conditions until all adsorption sites are occupied, at which point the adsorption amount reaches the maximum (Qmax = 46 μg/g). The Langmuir model also assumes that the adsorption process reaches dynamic equilibrium, that is, the adsorption rate is equal to the desorption rate. This assumption enables the adsorption to remain in a stable state under given conditions (Qe in Figure 6). The mechanism of nitrate adsorption removal by illite in the shale sample involves multiple aspects, primarily encompassing electrostatic interactions, surface chemical properties and ion exchange processes (there are no electrostatic interactions, for the illite surface is negatively charged and not acidified). (1) Surface Chemical Properties: The surface of illite hosts various functional groups, such as hydroxyls (OH−), which can chemically react with nitrate to form stable chemical bonds or complexes, thereby enhancing the adsorption of anions on the illite surface. (2) Ion Exchange: Illite exhibits a layered structure with exchangeable cations (e.g., K+, Na+) present between layers. When the concentration of nitrate in solution is high, it can undergo exchange processes with interlayer cations, entering the interlayer structure of illite.
For nitrate-nitrogen isotope (δ15N-NO3−), this study suggested there is almost no isotopic fractionation during sorption onto clay minerals (mainly illite in this study). This implied that during sorption the NO3− concentration would decrease, but δ15N-NO3− remained constant (Figure 8). The isotopic fractionation for 18O is minor and can be neglected in the δ15N-δ18O plot (Figure 1). For Sr isotopes (87Sr/86Sr), there is also no significant isotopic fractionation during sorption [46]. For other isotopes, like 11B (δ11B) and 44Ca (δ44/40Ca), there are significant isotopic fractionation and light isotopes (10B and 40Ca) tend to be preferentially adsorbed, resulting in 11B and 44Ca enrichment in the residual fluids [52,53].
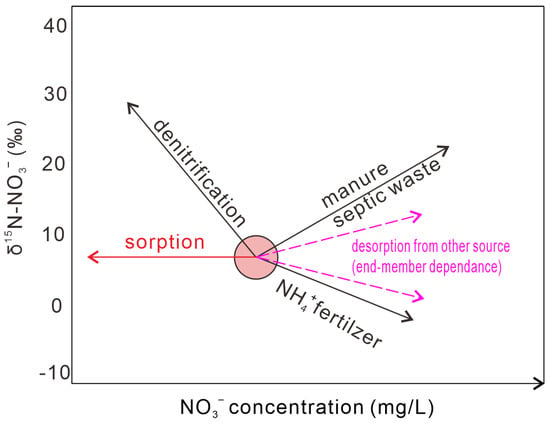
Figure 8.
Changes in nitrogen isotope in nitrate (δ15N-NO3−) and nitrate concentration C (NO3−) following different geochemical processes.
During the desorption of nitrate from the shale sample into fluids (water), the isotopic fractionation is also not obvious for 15N and is minor for 18O. However, the impact of nitrate desorption on water δ15N-NO3− and δ18O-NO3− may be complex, because the nitrate input (concentration and isotopic compositions) from desorption can vary and be related to antecedent water–rock interactions. For example, if a groundwater has an initial NO3− concentration of 20 mg/L and δ15N-NO3− value of 8‰ and gains 10 mg/L NO3− from clay mineral desorption along groundwater flow, the groundwater would have NO3− concentration of 30 mg/L and δ15N-NO3− value of 10‰ with exchangeable nitrate δ15N-NO3− of 14‰ and δ15N-NO3− value of 6‰ with exchangeable nitrate δ15N-NO3− of 2‰. This is very similar to B isotopes. Huang et al. showed that the δ11B of the exchangeable fraction in the shale sample was 21.1‰ and desorption of B increased B concentration and decreased δ11B in water [46]. In this case, the exchangeable fraction of nitrate should be analyzed for the use of nitrate isotopes in a water–rock system with clay minerals. However, such studies have rarely been reported.
5. Conclusions
This study has provided new insights into the nitrate sorption behaviors and isotopic composition changes following sorption and desorption. The decrease of nitrate concentration in solution is caused by the sorption of nitrate by the shale sample, and the sorption and desorption were fast and occurred within 5 min. The sorption data were fitted to the Langmuir model and the maximum possible sorption (Qmax) was estimated to be 46 μg/g. Through laboratory experiments, the preliminary results of this study showed that changes in δ15N-NO3− values in fluid were not obvious, and changes in δ18O-NO3− values in fluid were minor during sorption and desorption, suggesting that the N isotopic fractionation can be neglected and the impact of sorption on nitrate isotopes is limited. However, the impact of nitrate desorption on water δ15N-NO3− and δ18O-NO3− depends on the isotopic composition of exchangeable nitrate that may be related to antecedent water–rock interactions. In this condition, the exchangeable nitrate should be analyzed to study the nitrate and its isotopes’ evolution. The sorption efficiency of nitrate adsorbents is significantly influenced by pH, temperature, EC, and initial nitrate concentration. Optimal sorption occurs when the pH is between 3.93 and 10.5, the temperature is below 50 °C, and EC is less than 610 μs/cm. As the initial nitrate concentration increases, the sorption capacity rises, but the relative sorption rate decreases. This study would help trace nitrate sources using nitrate dual isotopic composition and help to improve the sorption effect of nitrate adsorbents.
Supplementary Materials
The following supporting information can be downloaded at: https://www.mdpi.com/article/10.3390/w16192807/s1, Figure S1: The map showing the sample location. The shale sample was taken from the borehole XK-3 with a well depth of 704 m and sampling depth of 640 m, and the surface water (Sam0) was taken from a stream near the XK-3; Table S1: The concentrations of major and trace elements in shale sample.
Author Contributions
Conceptualization, Z.L. and T.H.; methodology, T.H.; validation, C.Z.; formal analysis, Y.Z. (Yajing Zhao), C.Z. and T.H.; investigation, Y.Z. (Yan Zhang), Z.L. and Y.L.; data curation, Z.L. and Y.L.; writing—original draft preparation, Y.Z. (Yajing Zhao) and T.H.; writing—review and editing, T.H.; funding acquisition, T.H. All authors have read and agreed to the published version of the manuscript.
Funding
This research was funded by the National Natural Science Foundation of China (Grants number 42172277, 42141009, and 41877207), the Research Program of the Institute of Geology and Geophysics of the Chinese Academy of Sciences (Grant number IGGCAS-202204), and a CAS scholarship to visit the University of Calgary (Grant number 201825).
Data Availability Statement
Data included in study/Supplementary Materials/referenced in study.
Acknowledgments
We thank Steve Taylor, Michael Nightingale, and Jesusa Pontoy for help in isotopes and water chemistry measurement, and Bernhard Mayer, Yin Long, and Pauline Humez for helpful discussion. The authors wish to express their appreciation to two anonymous reviewers whose detailed comments were very helpful in improving the clarity and focus of the manuscript.
Conflicts of Interest
The authors declare that they have no known competing financial interests or personal relationships that could have appeared to influence the work reported in this paper.
References
- Böhlke, J.K. Groundwater recharge and agricultural contamination. Hydrogeol. J. 2002, 10, 153–179. [Google Scholar] [CrossRef]
- Velthof, G.L.; Lesschen, J.P.; Webb, J.; Pietrzak, S.; Miatkowski, Z.; Pinto, M.; Kros, J.; Oenema, O. The impact of the Nitrates Directive on nitrogen emissions from agriculture in the EU-27 during 2000–2008. Sci. Total Environ. 2014, 468–469, 1225–1233. [Google Scholar] [CrossRef] [PubMed]
- Izato, Y.; Shiota, K.; Miyake, A. Condensed-phase pyrolysis mechanism of ammonium nitrate based on detailed kinetic model. J. Anal. Appl. Pyrolysis 2019, 143, 104671. [Google Scholar] [CrossRef]
- World Health Organization. Guidelines for Drinking-Water Quality, 4th ed.; WHO Press: Geneva, Switzerland, 2011; Available online: https://iris.who.int/handle/10665/44584 (accessed on 8 July 2023).
- Abascal, E.; Gómez-Coma, L.; Ortiz, I.; Ortiz, A. Global diagnosis of nitrate pollution in groundwater and review of removal technologies. Sci. Total Environ. 2022, 810, 152233. [Google Scholar] [CrossRef] [PubMed]
- Pang, Z.; Yuan, L.; Huang, T.; Kong, Y.; Liu, J.; Li, Y. Impacts of human activities on the occurrence of groundwater nitrate in an alluvial plain: A multiple isotopic tracers approach. J. Earth Sci. 2013, 24, 111–124. [Google Scholar] [CrossRef]
- Shukla, S.; Saxena, A. Global status of nitrate contamination in groundwater: Its occurrence, health impacts, and mitigation measures. In Handbook of Environmental Materials Management; Hussain, C., Ed.; Springer: Cham, Switzerland, 2019. [Google Scholar] [CrossRef]
- Kendall, C.; Aravena, R. Nitrate isotopes in ground water systems. In Environmental Tracers in Subsurface Hydrology; Cook, P.G., Herczeg, A.L., Eds.; Kluwer Academic Publishers: Boston, MA, USA, 2000; pp. 261–297. [Google Scholar] [CrossRef]
- Xue, D.; Botte, J.; De Baets, B.; Accoe, F.; Nestler, A.; Taylor, P.; van Cleemput, O.; Berglund, M.; Boeckx, P. Present limitations and future prospects of stable isotope methods for nitrate source identification in surface- and groundwater. Water Res. 2009, 43, 1159–1170. [Google Scholar] [CrossRef]
- Gutiérrez, M.; Biagioni, R.N.; Alarcón-Herrera, M.T.; Rivas-Lucero, B.A. An overview of nitrate sources and operating processes in arid and semiarid aquifer systems. Sci. Total Environ. 2018, 624, 1513–1522. [Google Scholar] [CrossRef]
- Tokazhanov, G.; Ramazanova, E.; Hamid, S.; Bae, S.; Lee, W. Advances in the catalytic reduction of nitrate by metallic catalysts for high efficiency and N2 selectivity: A review. Chem. Eng. J. 2020, 384, 123252. [Google Scholar] [CrossRef]
- Kendall, C. Tracing sources and cycling of nitrate in catchments. In Isotope Tracers in Catchment Hydrology; Kendall, C., McDonnell, J.J., Eds.; Elsevier: Amsterdam, The Netherlands, 1998; pp. 519–576. [Google Scholar]
- Spalding, R.F.; Exner, M.E. Occurrence of nitrate in groundwater-a review. J. Environ. Qual. 1993, 22, 392–402. [Google Scholar] [CrossRef]
- Mayer, B.; Boyer, E.W.; Goodale, C.; Jaworski, N.A.; van Breemen, N.; Howarth, R.W.; Seitzinger, S.; Billen, G.; Lajtha, K.; Nadelhoffer, K.; et al. Sources of nitrate in rivers draining sixteen watersheds in the northeastern U.S.: Isotopic constraints. Biogeochemistry 2002, 57, 171–197. [Google Scholar] [CrossRef]
- Huang, T.; Li, Z.; Ma, B.; Long, Y. Tracing the origin of groundwater nitrate in an area affected by acid rain using dual isotopic composition of nitrate. Geofluids 2019, 2019, 8964182. [Google Scholar] [CrossRef]
- Fukada, T.; Hiscock, K.M.; Dennis, P.F.; Grischek, T. A dual isotope approach to identify denitrification in ground water at a river bank infiltration site. Water Res. 2003, 37, 3070–3078. [Google Scholar] [CrossRef] [PubMed]
- Aravena, R.; Robertson, W.D. Use of multiple isotope tracers to evaluate denitrification in groundwater: Case study of nitrate from a large-flux septic system plume. Ground Water 1998, 36, 975–982. [Google Scholar] [CrossRef]
- Ma, B.; Huang, T.; Li, J.; Li, Z.; Long, Y.; Zhang, F.; Pang, Z. Tracing nitrate source and transformation in a semiarid loess aquifer with the thick unsaturated zone. Catena 2021, 198, 105045. [Google Scholar] [CrossRef]
- Mayer, B. Assessing sources and transformations of sulphate and nitrate in the hydrosphere using isotope techniques. In Isotopes in the Water Cycle; Present and Future of a Developing Science, 2005 IAEA; Aggarwal, P.K., Gat, J.R., Froehlich, K.F.O., Eds.; Springer: Dordrecht, The Netherlands, 2005; pp. 67–89. [Google Scholar]
- Denk, T.R.A.; Mohn, J.; Decock, C.; Lewicka-Szczebak, D.; Harris, E.; Butterbach-Bahl, K.; Kiese, R.; Wolf, B. The nitrogen cycle: A review of isotope effects and isotope modeling approaches. Soil Biol. Biochem. 2017, 105, 121–137. [Google Scholar] [CrossRef]
- Wang, F.; Liu, L.; Xu, W.; Li, Y.; Ruan, Q.; Cao, W. Multiple stable isotopic approaches for tracing nitrate contamination sources: Implications for nitrogen management in complex watersheds. Ecotoxicol. Environ. Saf. 2024, 269, 115822. [Google Scholar] [CrossRef]
- Hübner, H. Isotope effects of nitrogen in the soil and biosphere. In Handbook of Environmental Isotope Geochemistry; The Terrestrial Environment; Fritz, P., Fontes, I.-C., Eds.; Elsevier: Amsterdam, The Netherlands, 1986; Volume 2, pp. 361–425. [Google Scholar]
- Mayer, B.; Matiatos, I. Nutrient dynamics in rivers and lakes. Treatise Geochem. 2024, 3, 155–178. [Google Scholar] [CrossRef]
- Özcan, A.; Şahin, M.; Özcan, A.S. Adsorption of Nitrate Ions onto Sepiolite and Surfactant-Modified Sepiolite. Adsorpt. Sci. Technol. 2005, 23, 323–334. [Google Scholar] [CrossRef]
- Shen, Z.; Zhu, W.; Zhong, Z. Fundamentals of Hydrogeochemistry; Geology Publishing House: Beijing, China, 1993. [Google Scholar]
- Halajnia, A.; Oustan, S.; Najafi, N.; Khataee, A.R.; Lakzian, A. Adsorption–desorption characteristics of nitrate, phosphate and sulfate on Mg–Al layered double hydroxide. Appl. Clay Sci. 2013, 80–81, 305–312. [Google Scholar] [CrossRef]
- Mohsenipour, M.; Shahid, S.; Ebrahimi, K. Nitrate Adsorption on Clay Kaolin: Batch Tests. J. Chem. 2015, 2015, 397069. [Google Scholar] [CrossRef]
- Mena-Duran, C.J.; Kou, M.R.S.; Lopez, T.; Azamar-Barrios, J.A.; Aguilar, D.H.; Dominguez, M.I.; Odriozola, J.A.; Quintana, P. Nitrate removal using natural clays modified by acid thermoactivation. Appl. Surf. Sci. 2007, 253, 5762–5766. [Google Scholar] [CrossRef]
- Xi, Y.; Mallavarapu, M.; Naidu, R. Preparation, characterization of surfactants modified clay minerals and nitrate adsorption. Appl. Clay Sci. 2010, 48, 92–96. [Google Scholar] [CrossRef]
- Battas, A.; Gaidoumi, A.E.; Ksakas, A.; Kherbeche, A. Adsorption study for the removal of nitrate from water using local clay. Sci. World J. 2019, 2019, 9529618. [Google Scholar] [CrossRef] [PubMed]
- He, Z.; Han, M.; Pang, L. Adsorption behavior and mechanism of the bamboo-carbon for nitrate in aqueous solution. Food Mach. 2010, 26, 68–71. [Google Scholar]
- Huang, T.; Li, Z.; Mayer, B.; Nightingale, M.; Li, X.; Li, G.; Long, Y.; Pang, Z. Identification of geochemical processes during hydraulic fracturing of a shale gas reservoir: A controlled field and laboratory water-rock interaction experiment. Geophys. Res. Lett. 2020, 47, e2020GL090420. [Google Scholar] [CrossRef]
- Heller, R.; Zoback, M. Adsorption of methane and carbon dioxide on gas shale and pure mineral samples. J. Unconv. Oil Gas Resour. 2014, 8, 14–24. [Google Scholar] [CrossRef]
- Appelo, C.A.J.; Postma, D. Geochemistry, Groundwater and Pollution, 2nd ed.; Balkema Publishers: Amsterdam, The Netherlands, 2005. [Google Scholar]
- Weil, R.R.; Brady, N.C. The Nature and Properties of Soils, 15th ed.; Pearson Education Limited: England, UK, 2017. [Google Scholar]
- Meybeck, M. Global chemical weathering of surficial rocks estimated from river dissolved loads. Am. J. Sci. 1987, 287, 401–428. [Google Scholar] [CrossRef]
- Mueller, D.K.; Helsel, D.R. Nutrients in the nation’s waters-too much of a good thing? US Geol. Surv. Circ. 1996, 1136, 24. [Google Scholar]
- Shand, P.; Edmunds, W.M. The baseline inorganic chemistry of European groundwaters. In Natural Groundwater Quality; Edmunds, W.M., Shand, P., Eds.; Blackwell: New York, NY, USA, 2008; pp. 22–58. [Google Scholar]
- Huang, T.; Pang, Z.; Yuan, L. Nitrate in groundwater and the unsaturated zone in (semi)arid northern China: Baseline and factors controlling its transport and fate. Environ. Earth Sci. 2013, 70, 145–156. [Google Scholar] [CrossRef]
- Langmuir, I. The adsorption of gases on plane surfaces of glass, mica and platinum. J. Am. Chem. Soc. 1918, 40, 1361–1403. [Google Scholar] [CrossRef]
- Freundlich, H. Über die Adsorption in Lösungen. Z. Phys. Chem. 1907, 57U, 385–470. [Google Scholar] [CrossRef]
- Jia, X.; Zhu, Y.; Huang, L.; Wei, X.; Fang, Y.; Wu, L.; Binley, A.; Shao, M. Mineral N stock and nitrate accumulation in the 50 to 200 m profile on the Loess Plateau. Sci. Total Environ. 2018, 633, 999–1006. [Google Scholar] [CrossRef] [PubMed]
- Sigman, D.M.; Casciotti, K.L.; Andreani, M.; Barford, C.; Galanter, M.; Böhlke, J.K. A bacterial method for the nitrogen isotopic analysis of nitrate in seawater and freshwater. Anal. Chem. 2001, 73, 4145–4153. [Google Scholar] [CrossRef] [PubMed]
- Sui, H.; Gao, W.; Hu, R. A New Evaluation Method for the Fracability of a Shale Reservoir Based on the Structural Properties. Geofluids 2019, 2019, 14. [Google Scholar] [CrossRef]
- Tremblay, C.; Kohl, S.D.; Rice, J.A.b.; Gagné, J.-P. Effects of temperature, salinity, and dissolved humic substances on the sorption of polycyclic aromatic hydrocarbons to estuarine particles. Mar. Chem. 2005, 96, 21–34. [Google Scholar] [CrossRef]
- Huang, T.; Li, Z.; Long, Y.; Zhang, F.; Pang, Z. Role of desorption-adsorption and ion exchange in isotopic and chemical (Li, B, and Sr) evolution of water following water–rock interaction. J. Hydrol. 2022, 610, 127800. [Google Scholar] [CrossRef]
- Kang, L.; Mucci, M.; Lürling, M. Influence of temperature and pH on phosphate removal efficiency of different sorbents used in lake restoration. Sci. Total Environ. 2022, 812, 151489. [Google Scholar] [CrossRef]
- Islam, M.; Patel, R. Physicochemical characterization and adsorption behavior of Ca/Al chloride hydrotalcite-like compound towards removal of nitrate. J. Hazard. Mater. 2011, 190, 659–668. [Google Scholar] [CrossRef]
- Hosni, K.; Srasra, E. Nitrate adsorption from aqueous solution by MII-Al-CO3 layered double hydroxide. Inorg. Mater. 2008, 44, 742–749. [Google Scholar] [CrossRef]
- Dai, X.; Wei, C.; Wang, M.; Song, Y.; Chen, R.; Wang, X.; Shi, X.; Vandeginste, V. Mineralization mechanism of carbon dioxide with illite interlayer cations using molecular dynamics simulation and experiments. J. CO2 Util. 2022, 64, 102161. [Google Scholar] [CrossRef]
- Long, Y. Study on the Calcium Isotopic Fractionation Following Cation Exchange. Ph.D. Thesis, University of Chinese Academy of Sciences, Beijing, China, June 2024. [Google Scholar]
- Vengosh, A.; Spivack, A.J. Boron isotopes in groundwater. In Environmental Tracers in Subsurface Hydrology; Cook, P.G., Herczeg, A.L., Eds.; Kluwer: Boston, MA, USA, 2000; pp. 479–485. [Google Scholar]
- Ockert, C.; Gussone, N.; Kaufhold, S.; Teichert, B.M.A. Isotope fractionation during Ca exchange on clay minerals in a marine environment. Geochim. Cosmochim. Acta 2013, 112, 374–388. [Google Scholar] [CrossRef]
Disclaimer/Publisher’s Note: The statements, opinions and data contained in all publications are solely those of the individual author(s) and contributor(s) and not of MDPI and/or the editor(s). MDPI and/or the editor(s) disclaim responsibility for any injury to people or property resulting from any ideas, methods, instructions or products referred to in the content. |
© 2024 by the authors. Licensee MDPI, Basel, Switzerland. This article is an open access article distributed under the terms and conditions of the Creative Commons Attribution (CC BY) license (https://creativecommons.org/licenses/by/4.0/).