Article

Optimizing the Activation of WWTP Wet-Weather Operation Using Radar-Based Flow and Volume Forecasting with the Relative Economic Value (REV) Approach

by
Vianney Courdent
1,2,
Thomas Munk-Nielsen
1 and
Peter Steen Mikkelsen
2,*
1
Krüger Veolia, Gladsaxevej 363, DK-2860 Søborg, Denmark
2
Department of Environmental and Resource Engineering (DTU Sustain), Technical University of Denmark, DK-2800 Kgs. Lyngby, Denmark
*
Author to whom correspondence should be addressed.
Water 2024, 16(19), 2806; https://doi.org/10.3390/w16192806
Submission received: 1 September 2024 / Revised: 21 September 2024 / Accepted: 22 September 2024 / Published: 2 October 2024
(This article belongs to the Section Wastewater Treatment and Reuse)

Abstract

:
Wastewater treatment plants (WWTPs) connected to combined sewer systems must cope with high flows during wet-weather conditions, often leading to bypass and thus pollution of water bodies. Radar rainfall forecasts coupled with a rainfall-runoff model provides flow and volume forecasts that can be used for deciding when to switch from normal to wet-weather operation, which temporarily allows for higher inflow. However, forecasts are by definition uncertain and may lead to potential mismanagement, e.g., false alarms and misses. Our study focused on two years of operational data from the Damhuså sewer catchment and WWTP. We used the Relative Economic Value (REV) framework to optimize the control parameters of a baseline control strategy (thresholds on flow measurements and radar flow prognosis) and to test new control strategies based on volume instead of flow thresholds. We investigated two situations with different objective functions, considering higher negative impact from misses than false alarms and vice versa, and obtained in both cases a reduction of the rate of false alarms, higher flow thresholds and lower bypass compared to the baseline control. We also assess a new control strategy that employs thresholds of predicted accumulated volume instead of predicted flow and achieved even better results.

1. Introduction

During wet-weather periods combined urban drainage systems (UDS) are affected by large flow increases, which lead to high hydraulic loadings on the wastewater treatment plant (WWTP), in addition to combined sewer overflows and flooding. These effects are all expected to increase as cities grow and heavy rainfall events become more frequent due to climate change, e.g., [1,2]. One of the main challenges of extended periods with high hydraulic loads for a biological WWTP is the risk of rising sludge blanket levels and consequently sludge escape from the secondary clarifiers directly to natural water bodies.
Flow to the biological step has to be restricted to mitigate this risk, and a maximum inlet flow threshold is commonly set at three times the dry-weather flow [3]. The exceeding wastewater has to be stored in upstream detention basins, when possible, or bypassed to the environment. Detention basins are however costly and the direct discharge of untreated or only mechanically treated wastewater however leads to environmental pollution, which should be avoided when possible.
There is thus an incentive to temporarily increase the acceptable hydraulic load to the WWTP during wet-weather conditions to reduce bypass. Some WWTPs are operated with a dedicated operation mode that allows higher inflow during wet-weather periods, e.g., [4,5,6]. For some plant configurations the wet-weather mode requires some preparation time in order to be fully operational in time to cope with the flow increase, e.g., when using the biological tanks as settling volume to increase the hydraulic capacity of the plant. Munk-Nielsen et al. [7] described how using flow forecasts to switch to wet-weather operation in due time can lead to an avoided discharge of untreated water, as displayed in Figure 1.
Applications of weather radar data in urban hydrological applications have evolved during the past decade [8], and rainfall forecasts based on extrapolated radar rainfall data have a great potential for short-term forecasting of WWTP influent flow in real-time [9,10,11]. Forecasts are however by nature uncertain and can therefore lead to mismanagement. The benefits gained by using the forecasts need to be evaluated and compared to the impacts of potential mismanagement in order to find an appropriate trade-off between benefits and drawbacks.
This paper introduces the relative economic value (REV) framework as a way to evaluate the switching between dry-weather and wet-weather operation mode, exemplified by the so-called aeration tank settling (ATS) control switch. The REV framework is furthermore used to optimize the parameters controlling the switching (pre-fixed flow thresholds) and to evaluate a new control strategy, which uses a volume forecast instead of a flow forecast. The paper is organized as follows: Section 2 introduces the relative economic value (REV) theory and explains how it is further developed and implemented for the decision problem of activation of WWTP wet-weather operation. Section 3 describes the Damhuså catchment and WWTP used for exemplification in the paper and presents the aeration tank settling (ATS) operation mode. It also explains the baseline implementation of the ATS control switch at the Damhuså WWTP, outlines a number of potential control strategies that are used in the analysis, and presents the full-scale catchment and plant data used in the investigation (two full years of data). The results are presented and discussed in Section 4 and finally, Section 5 provides the conclusions.

2. Theory and Methods

The relative economic value (REV) approach used in this study is inspired by the relatively simple cost–loss ratio decision model introduced by Richardson [12] and im-plemented in [13]. Richardson developed this approach to assess the economic value of taking costly actions to mitigate the consequences of forecasting ad-verse weather events to reduce the potential loss associated with them. Courdent et al. [13] further developed it to assess flow domain prediction generated from an ensemble of numerical weather predictions for the perspective of energy optimization of integrated urban drainage—wastewater treatment systems during predicted dry weather periods. Here we expand and demonstrate the theory to the case of activating wet-weather operation based on radar-based flow forecasts as well as measurements in the catchment and WWTP.

2.1. Contingency Table and Verification Measures

The empirical switch between dry-weather and wet-weather mode is represented as a binary time series with “0” when the WWTP is in dry-weather operation mode and “1” when the WWTP is in wet-weather operation mode. For each time step this time series is compared with another, ideal time series representing perfect wet-weather control switching by assuming a perfect knowledge of the future. The comparison between these 2 binary time series is summarized in a 2 × 2 contingency table in Table 1, where for each given time step only 4 outcomes are possible. The “hits” correspond to correct positives (a, the wet-weather mode is on as it should be) whereas the “false alarms” correspond to false positives (b, the wet-weather mode is on but should not be). The “misses” correspond to false negatives (c, the wet-weather mode is off but should be on) whereas the “correct negatives” (d) are when the wet-weather mode is off as it should be.
This article focuses on three verification measures that summarize the content of the contingency table, see Table 2. The probability of Detection (PoD) is defined as the fraction of correct activations of wet-weather mode (i.e., hits), and the probability of false detection (PoFD) is the fraction of non-occurrences of events that were incorrectly forecasted (i.e., false alarms). The critical success index (CSI) is a common overall verification skill score from a contingency table, which is not affected by a high rate of correct negatives. Furthermore, we define µ as the empirical occurrence frequency of events.

2.2. Objective Functions for Associating Economic Values to Outcomes

Direct verification skills from the contingency table, e.g., PoD and PoFD or CSI, can be used as objective functions to evaluate the switching between modes. However, such verification measures do not include flexibility to add weight on the different outcomes of the control strategy. The REV associates each course of action with a relative cost as well as economic benefit or loss depending on the observed outcome, see Table 1, which allows for a finer evaluation. If the WWTP is in wet-operation mode when it should be (hits) then a positive gain G is associated with it. However, if the WWTP is operated in wet-weather operation mode when it should not be (false alarm) then the WWTP under-performs and a loss L1 is associated with it. Similarly, if the WWTP is not switched to wet weather operation mode when it should be (miss), then the WWTP under-performs and a loss L2 it associates to it. No cost is associated to correct negatives, when the WWTP is operated in dry weather mode as it should be. The activation cost of the wet-weather mode (e.g., pumping) is here assumed to be included in G and L1.
We use ratios between these economic values in objective functions evaluating the skill of the control strategy, to avoid quantifying them in monetary terms. The loss-ratio, k, represents “how detrimental a false alarm is compared to a miss” and is defined by L1 = k*L and L2 = (1 − k)*L with L = L1 + L2, and the gain-loss ratio, α = G/L, represents “what the benefit of ATS operation is in comparison to potential drawback of miss management”, as also defined by [13].

2.3. Formulating the Relative Economic Value (REV)

The task is here to choose the appropriate control actions that will maximize the expected gain or minimize the expected loss. The usefulness (i.e., objective function) of a control strategy can thus be quantified by considering the occasions when the control is beneficial, neutral or detrimental. The REV compares the economic value of a given control strategy (EForecast) to the economic value of a reference scenario (ERef). This value is then normalised based on the expected economic value achieved with a perfect forecast (EPerfect) as expressed in Equation (1), to achieve a REV with a maximum value of 1.
R E V = E F o r e c a s t E R e f E P e r f e c t E R e f
A positive REV indicates that the control strategy is beneficial in comparison to the reference strategy and a negative REV that the control strategy is detrimental. The perfect control strategy and the reference control strategy need to be defined, to evaluate the control strategy based on forecast information.
The perfect ATS control represents the ideal control strategy given a perfect flow forecast. A time series can be generated representing the perfect ATS control, based on the plant characteristics and the measured inlet flow.
The reference control strategy is used for comparison and hence, according to the comparison wanted, different reference control strategies can be used. Three different reference control strategies were used in this study. REF-1 and REF-2 are similar to the reference used by Richardson [12]: when no forecast is available the two possible options are to never act or to always act (here meaning to never run ATS or to always run ATS). The strategy providing the better outcome should be used. REF-1 assumes, similarly to [13], that not acting corresponds to maintaining the dry-weather operation, which is represented by a zero value. REF-2 assumes that not acting during high flows is detrimental to the WWTP operation and should ideally be associated with a negative value. REF-3 corresponds to an ATS control switch solely based on flow measurement at the WWTP, the outcome of the contingency table for this control strategy are noted a’, b’, c’ and d’ and their associated skill scores PoD’ and PoFD’.

2.4. Closed Form Expression for REV

Based on the contingency table in Table 1 the expected economic value of a control strategy (EForecast) can be expressed empirically as follows:
E F o r e c a s t = a G b L 1 c L 2 n
The economic value of perfect ATS control (EPerfect, with b = c = 0), which assumes a perfect flow forecast, is expressed in Equation (3) with μ, the frequency of activated wet-weather operation for the perfect control defined as μ = (a + c)/n (in the case of perfect forecast μ = a/n).
E p e r f e c t = μ G
Finally, the economic value of the three reference control strategies described in Section 2.3 can be expressed as:
E R E F _ 1 = max ( G μ L 1 1 μ ,   0 )
E R E F _ 2 = max ( G μ L 1 1 μ ,   L 2 μ )
E R E F _ 3 = a G b L 1 c L 2 n
The REV expressed by Equation (1) can be reformulated using Equations (2)–(6) and expressed as a function of the PoD, the PoFD, the frequency of occurrence (μ), the loss ratio (k) and the gain–loss ratio (α = G/L) as shown by Equations (7)–(9) for REF-1, REF-2 and REF-3.
R E V R E F _ 1 =   P o D · α · μ P o F D · 1 μ · k + 1 P o D · μ · ( 1 k ) max ( α · μ 1 μ · k ,   0 α · μ max α · μ 1 μ · k ,   0
R E V R E F _ 2 =   P o D · α · μ P o F D · 1 μ · k + 1 P o D · μ · ( 1 k ) max α · μ 1 μ · k ,   k 1 · μ α · μ max ( α · μ 1 μ · k ,   k 1 · μ
R E V R E F _ 3 =   P o D P o D · α · μ P o F D P o F D · 1 μ k + P o D P o D · μ · 1 k   α · μ P o D · α · μ P o F D · 1 μ · k + 1 P o D · μ · ( 1 k )

3. Case Study, Data and Investigated Control Strategies

3.1. The Damhusåen Catchment and WWTP

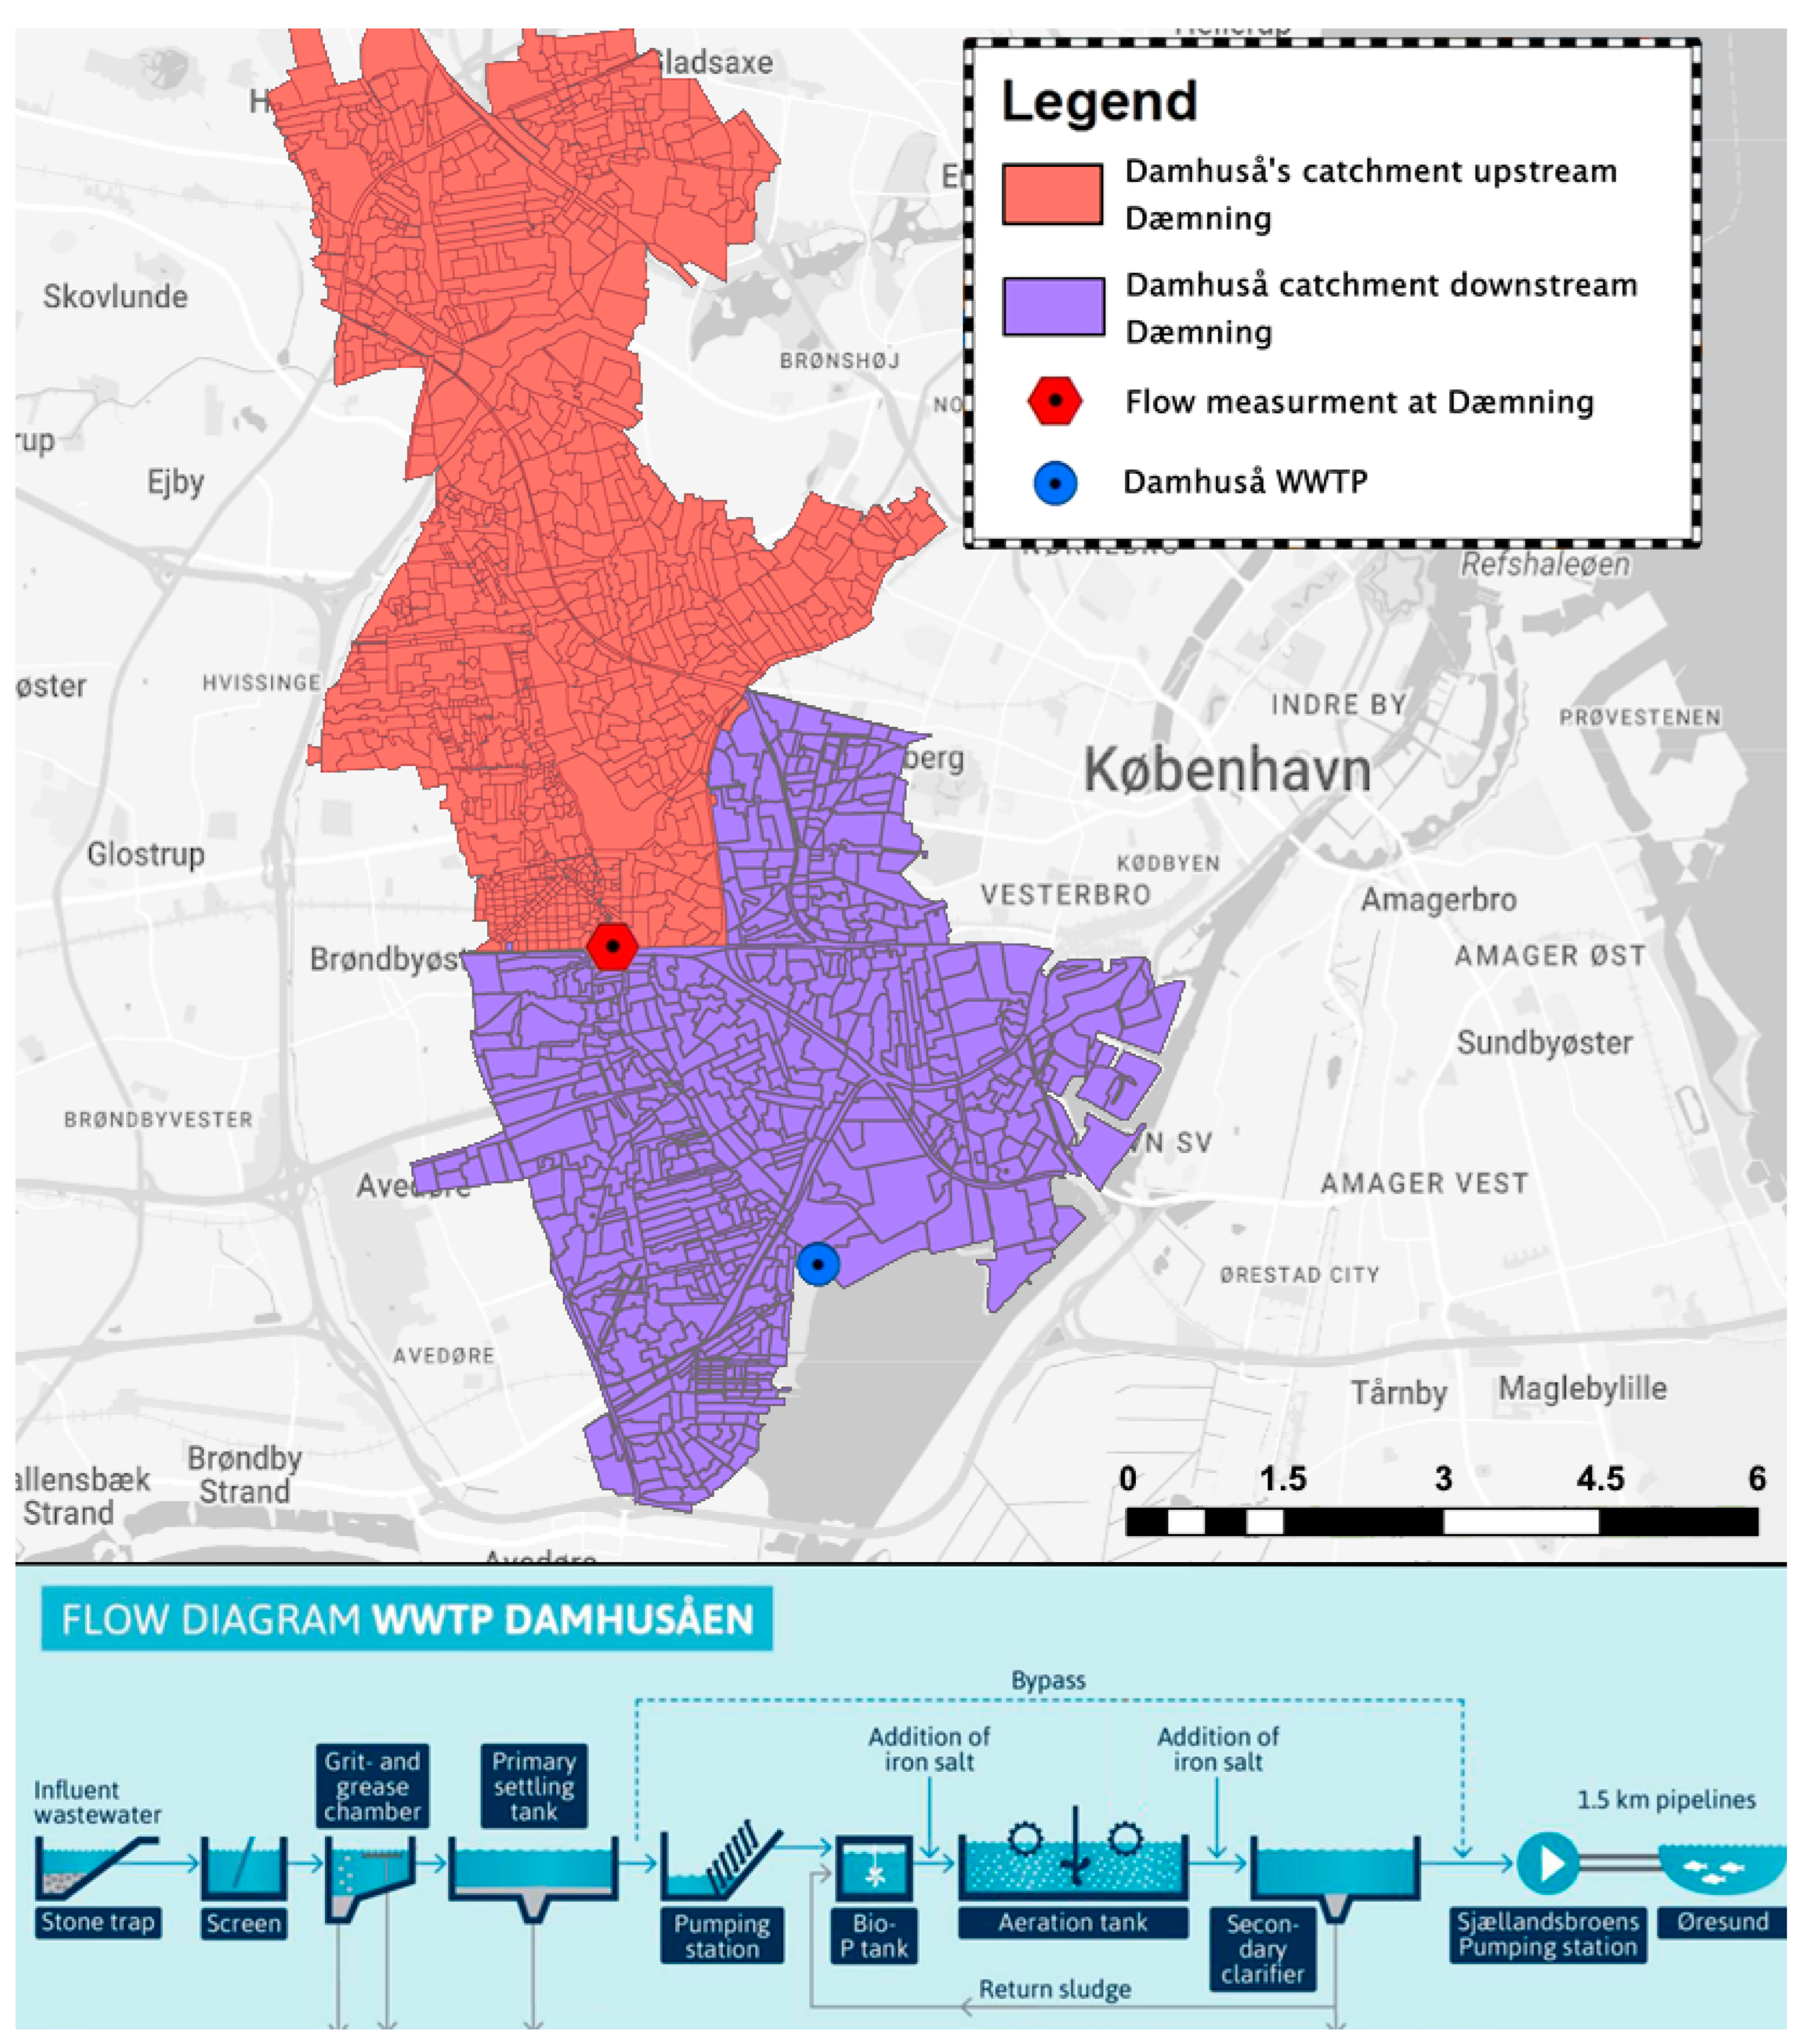
The catchment area of the Damhuså WWTP is located in the west part of Copenhagen, Denmark, which is a highly urbanized area with compact residential housing equipped with a combined sewer system that drains towards the south-east into Øresund (after treatment). Figure 2 (upper part) shows the Damhuså catchment and the separation between sub-catchments upstream and downstream from the Dæmning location. The overall sewer catchment stretches over 56 km2 and had (in the study period, from June 2015 to June 2017) a population of approx. 262,000 inhabitants. Flow measurements were available both at the inlet to the WWTP and at the Dæmning location, which is placed 3 km upstream from the WWTP corresponding to between 20 and 40 min of flow time depending on the actual flow conditions. The sub-catchment upstream Dæmning is approx. 30 km2 and the dry weather flow at the WWTP is approximately two times higher than the dry weather flow at Dæmning.
The Damhuså WWTP was built in 1930 for mechanical treatment only. It was expanded in 1997 with activated sludge treatment based on the Bio-Denipho® principle for removal of organic matter and nutrients. This principle is based on a cycle, alternating two oxidation ditches (denitrification and nitrification) by switching inlet and outlet between the two tanks and switching aeration on and off [14]. The flow diagram of the Damhuså WWTP is displayed in the lower part of Figure 2. The Damhuså WWTP had in 2015 a capacity of 350,000 PE (population equivalent), treated 33,390,000 m3 of wastewater and consumed 8735 MWh of electricity, which corresponds to a ratio of 0.261 kWh m−3 [15]. Treated and bypassed wastewater was discharged into the Øresund at a maximal flow rate of 18,000 m3 h−1. The bypass in the 2015–2017 period occurred after the mechanical treatment steps and primary settling but before the biological treatment. When the pumping capacity into the Øresund was exceeded, the treated wastewater was stored in a 45,000 m3 basin, which overflowed into the Øresund near the WWTP.
The Damhuså WWTP has two operational modes. A dry weather mode with a maximal hydraulic capacity to the biologic treatment of 6400 m3 h−1 and a wet-weather mode based on the aeration tank settling (ATS) concept, which increases the maximal hydraulic capacity of the biologic treatment to 10,000 m3 h−1, corresponding to a 56% increase of the hydraulic capacity. The hydraulic capacity is controlled by various flow measurements and forecasts as well as by TSS (total suspended solid) measurements in the WWTP outlet to avoid sludge escape from the secondary clarifiers due to high loading over long periods.

3.2. Aeration Tank Settling for Switching the WWTP into Wet-Weather Operation

The aeration tank settling (ATS) principle developed by Bundgaard et al. [16] and Nielsen et al. [17,18] changes the operation of the WWTP to increase its hydraulic capacity during wet-weather periods and thus reduces wastewater bypass to natural water bodies. The ATS operation reduces the suspended solids (SS) and hydraulic loads on the secondary settlers and consists of two steps. First, prior to the increase of the hydraulic loads, sludge from the secondary clarifiers is transferred to the aeration (biological) tanks. Then, the ATS operation consists of alternating settling (no mixing, no aeration) and aerobic phase conditions. This allows the plant to run at very low rates of return activated sludge flow from the final clarifiers (QRAS) and thereby to increase the maximum allowed flow to the biological step. However, this maximal allowed flow is reduced if the TSS concentration in the outlet exceeds a level defined by the operator. To reach the full capacity a correct sludge distribution between aeration tanks and clarifiers is required. Therefore, a preparation period is necessary to reach the correct sludge distribution before the arrival of the high flow.
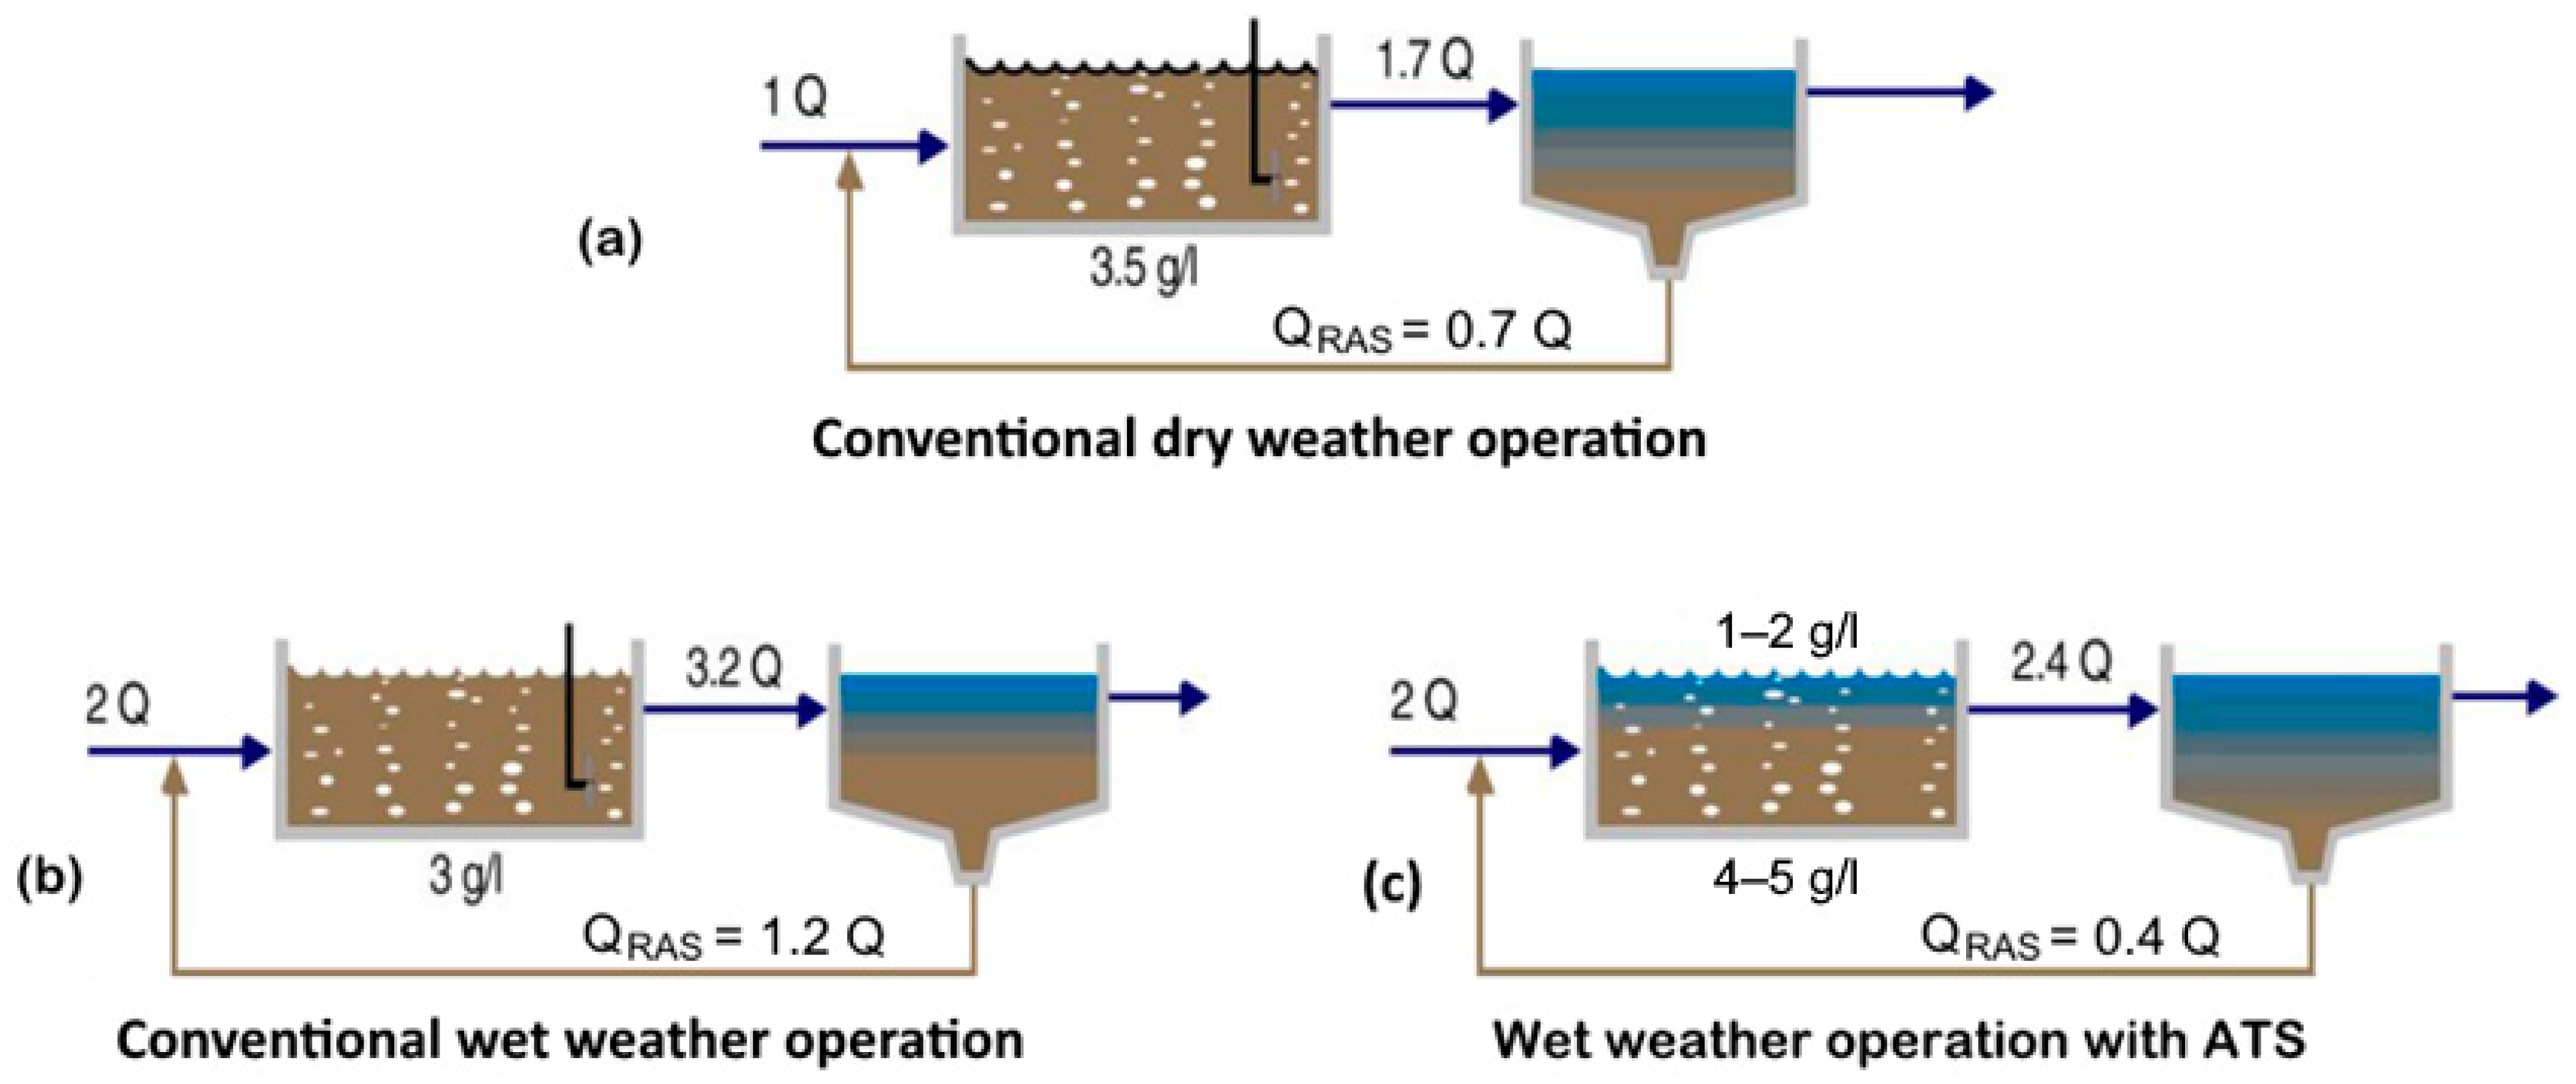
Figure 3 illustrates the difference between the three operation modes: (a) the normal dry weather operation, (b) the normal wet-weather operation and (c) the wet-weather operation with RTC and ATS. During wet-weather periods the conventional operation (b) increases the return activated sludge flow (QRAS) and therefore increases the SS and hydraulic loads to the secondary clarifiers, whereas with the ATS operation (c) QRAS is reduced and sludge is stored in the aeration tank.
In the example given in Figure 3, the aeration tank is operated at 3.5 g L−1 of mixed liquor suspended solids during dry-weather operation with a QRAS corresponding to 0.7·Qin (0.7 times the influent flow). The hydraulic and SS loads on the secondary clarifiers are 1.7·Qin and 5.95·Qin kg h−1. During a wet-weather period with a doubled influent flow (2·Qin), the conventional operation increases the QRAS up to 1.2·Qin, leading to hydraulic and SS loads on the secondary clarifiers of 3.2·Qin and 9.6·Qin kg h−1. Under the ATS operation, QRAS can be reduced to 0.4·Qin, because the sludge is stored in the aeration tank (4–5 g L−1), hence the hydraulic load on the secondary clarifiers is limited to 2.4·Qin. The settling phase in the ATS operation reduces the SS concentration in the flow to the secondary clarifiers to 1–2 g L−1 compared to 3 g L−1 in conventional wet-weather operation. This corresponds to a reduction of 25 and 50% of the hydraulic and SS loads, respectively, during the ATS operation compared to the conventional wet-weather operation [7]. If the ATS time is extended over a long time with the same flow, the system will move towards a steady state corresponding to conventional wet water operation. In other words, the extra capacity that ATS provided will be eroded over time, but a steady state is never achieved as a rule, since a rain event is dynamic in nature.
The aeration tank settling (ATS) method has proven to be an efficient approach to increase the hydraulic capacity of WWTPs during wet-weather periods. Sharma et al. [19] reported the performance of ATS operation after 7 years of full scale operation at another WWTP in Copenhagen (the Avedøre plant). The analysis showed that ATS operation in combination with RTC increased the wet-weather hydraulic capacity of the treatment plant with up to 150% of the design capacity during winter and up to 67% during summer. Compared to the conventional wet-weather operation mode, ATS operation also showed lower effluent concentrations for total phosphate (40–50%), suspended solids (30–60%) and chemical oxygen demand (30–50%), whereas no significant effect was observed on total nitrogen. Sharma et al. [19] however also explained that bypass of the biological treatment step was observed in some occasions for flows below the design capacity of the WWTP during ATS operation mode. This was due to a lack of preparation time to start the ATS operation in time for it to reach its optimal capacity prior to the arrival of the in-creased flow. Indeed, increasing the inlet capacity from dry weather to wet-weather operation requires between 20 and 120 min depending on the size of the WWTP [7].

3.3. Baseline ATS Control Switch at the Damhuså WWTP

The ATS operation was added to the advanced real time online control system of the Damhuså WWTP in 2012 [20]. The switching to ATS operation mode was first solely controlled based on the measured flow at the WWTP and at the upstream location Dæmning, see Figure 2. An increase of the flow measurements at Dæmning should provide some time to prepare the ATS switching of the WWTP, but this lead time is however only between 20 and 40 min, which is less than ideally needed. Flow prognosis based on radar forecasts were thus slowly introduced from September 2014, starting with 30 min lead time and increasing up to 120 min lead time in June 2015. The radar nowcast data and methods used are described in [21,22]. Flow forecasts used for the control switch described by Munk-Nielsen et al. [7] were generated using a conceptual rainfall-runoff model auto-calibrated to flow measurements using Maximum a Posteriori estimation, as described in [22].
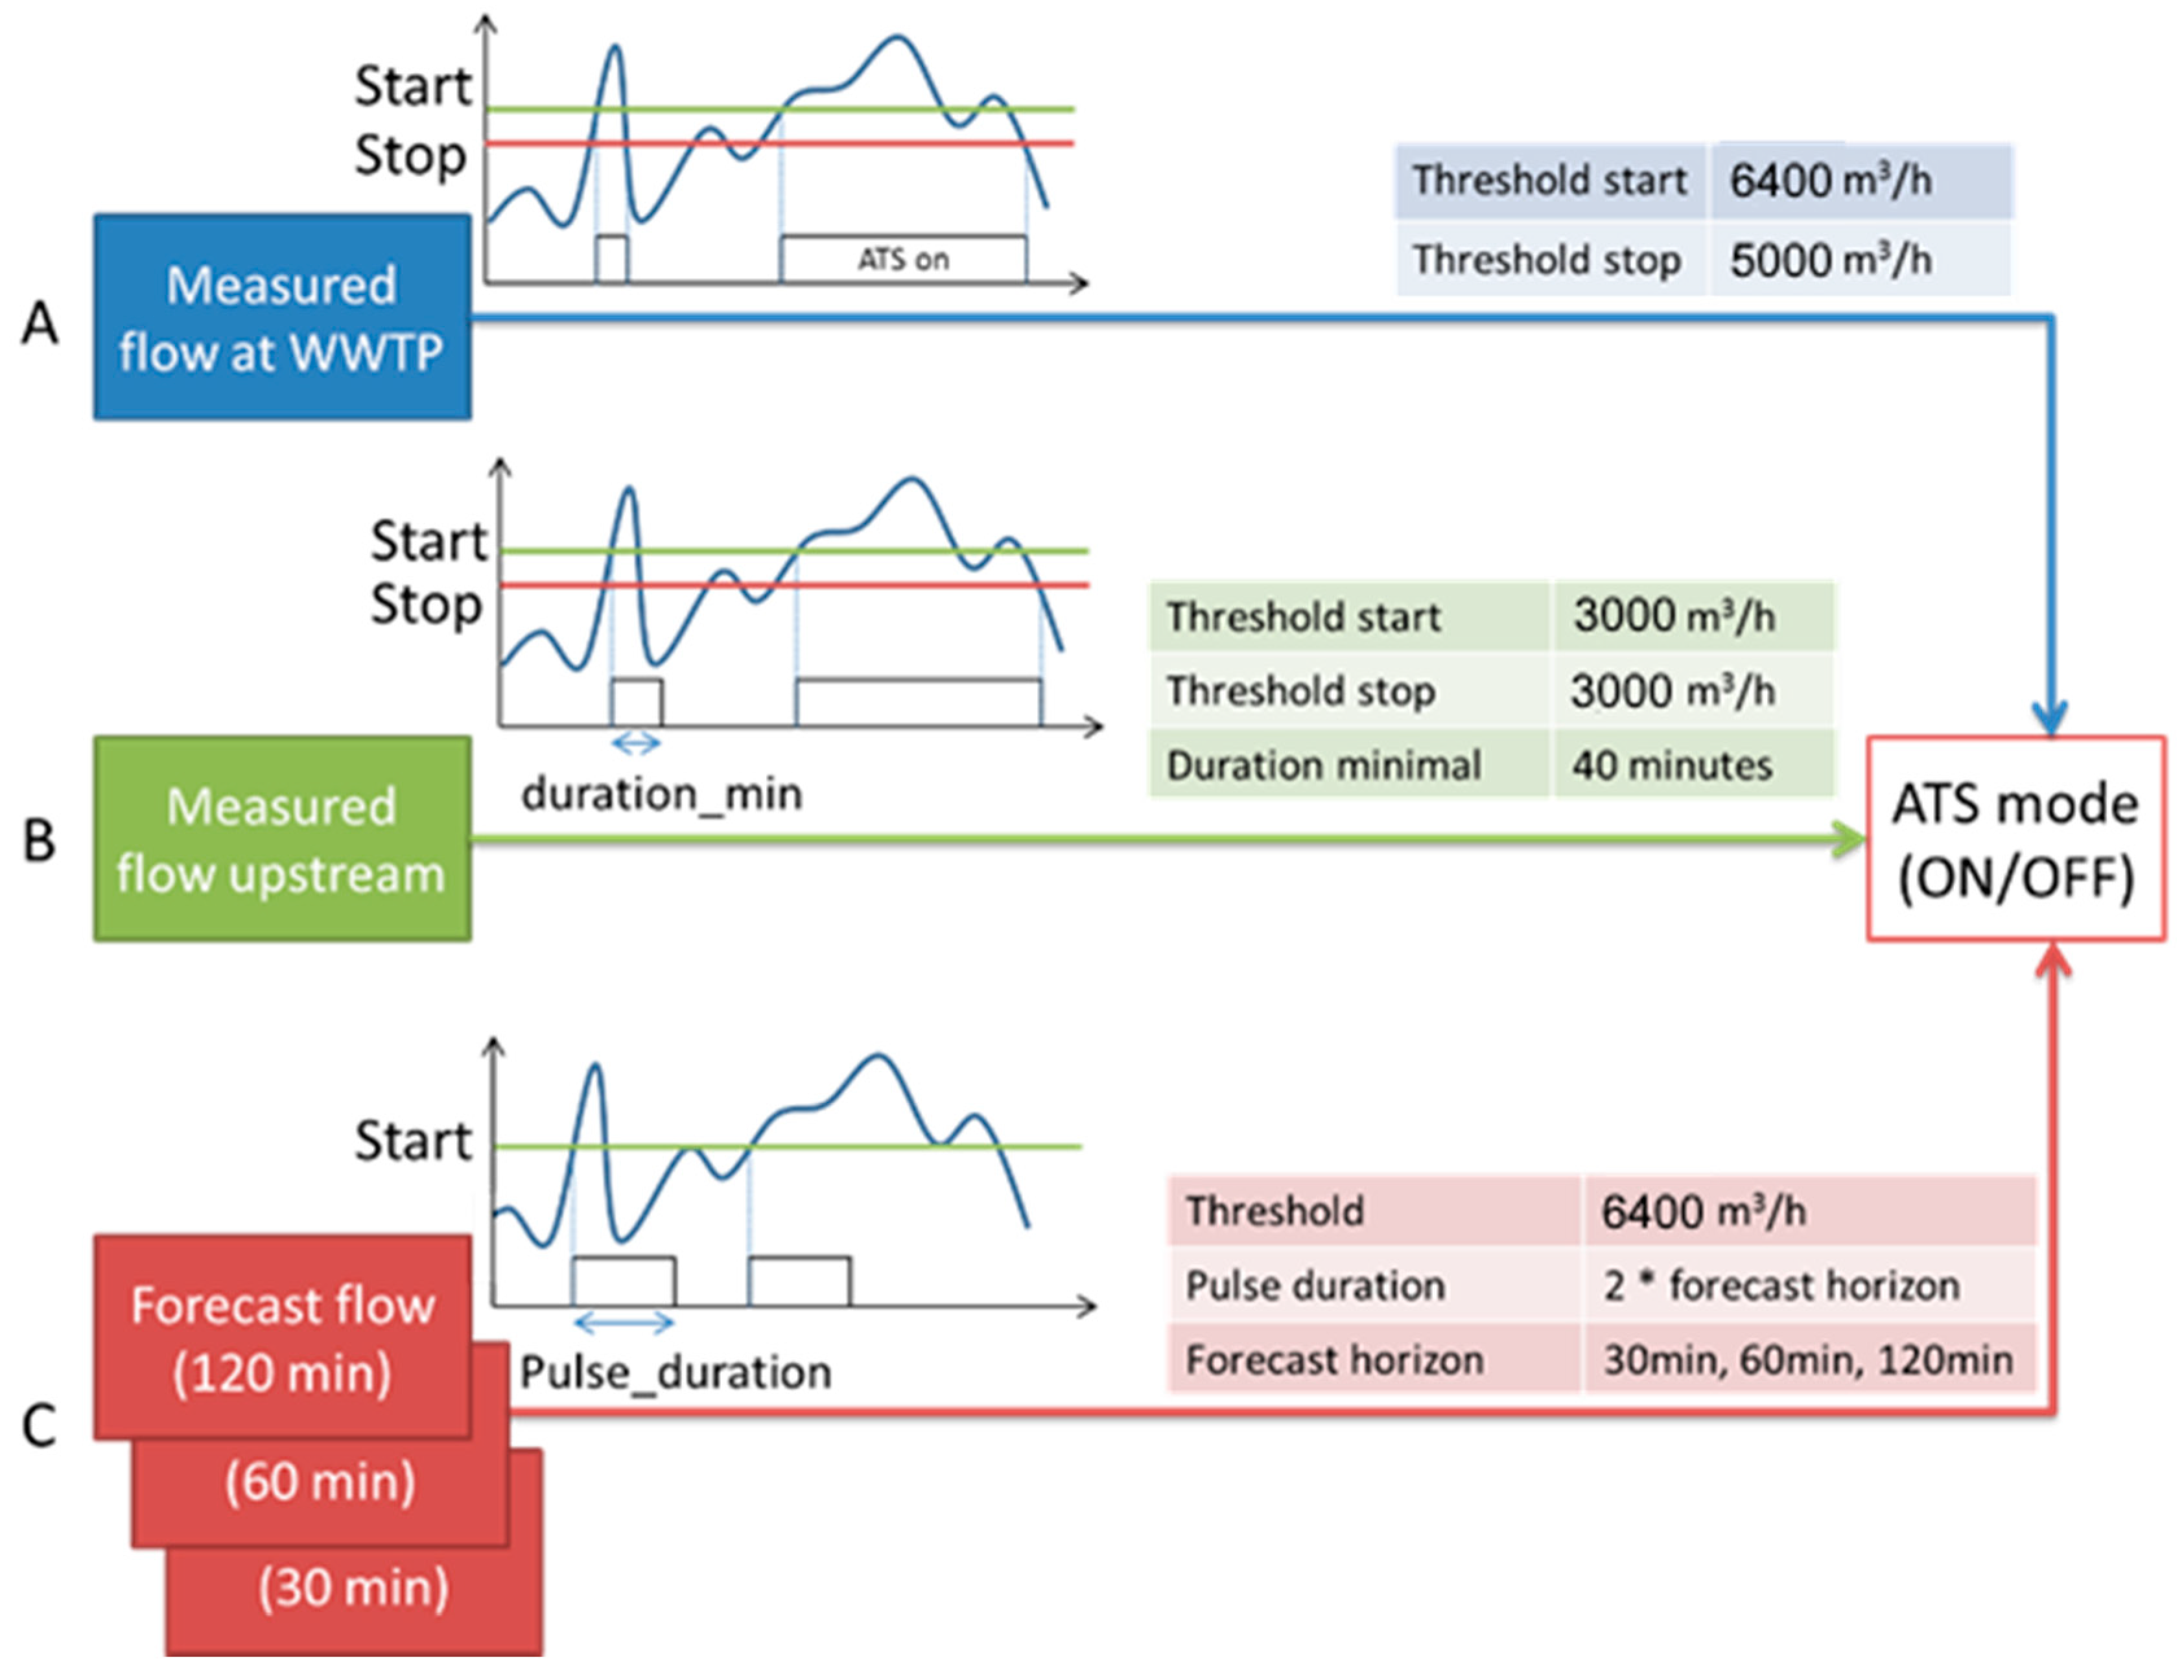
Hence, the baseline control of ATS operation (activation and deactivation) at the Damhuså WWTP was based on three inputs as displayed in Figure 4: (A) the measured inflow at the WWTP, (B) the measured flow at Dæmning upstream in the drainage system, and (C) the flow prognosis at the WWTP using radar extrapolation data. The ATS operation was (based on A) activated when the flow at the WWTP exceeds 6400 m3 h−1 and deactivated when the flow at the WWTP gets beneath 5000 m3 h−1. It could also be triggered by the upstream measurement at Dæmning (B), considering the transportation time between the measurement and the WWTP, which provided up to 40 min of additional lead time for the ATS activation. The flow threshold on the upstream measurement is lower than the flow threshold at the WWTP because additional flow arrives from the down-stream catchment to the main sewer in-between Dæmning and the WWTP. The ATS operation could finally be started by the radar flow prognosis, which provides up to 2 h lead time. The flow prognosis threshold was initially set to 5000 m3 h−1 and was raised to 6400 m3 h−1 in November 2016 to reduce the risk of false positives. The ATS switch from radar flow prognosis (C) aimed at preparing the ATS operation in due time. Therefore it only generated a pulse (signal of fixed duration) to start the ATS operation and keep it running for a defined period until the high flow arrived at the WWTP after which the ATS operation was maintained by the flow control based on the flow measurement at the WWTP (A).
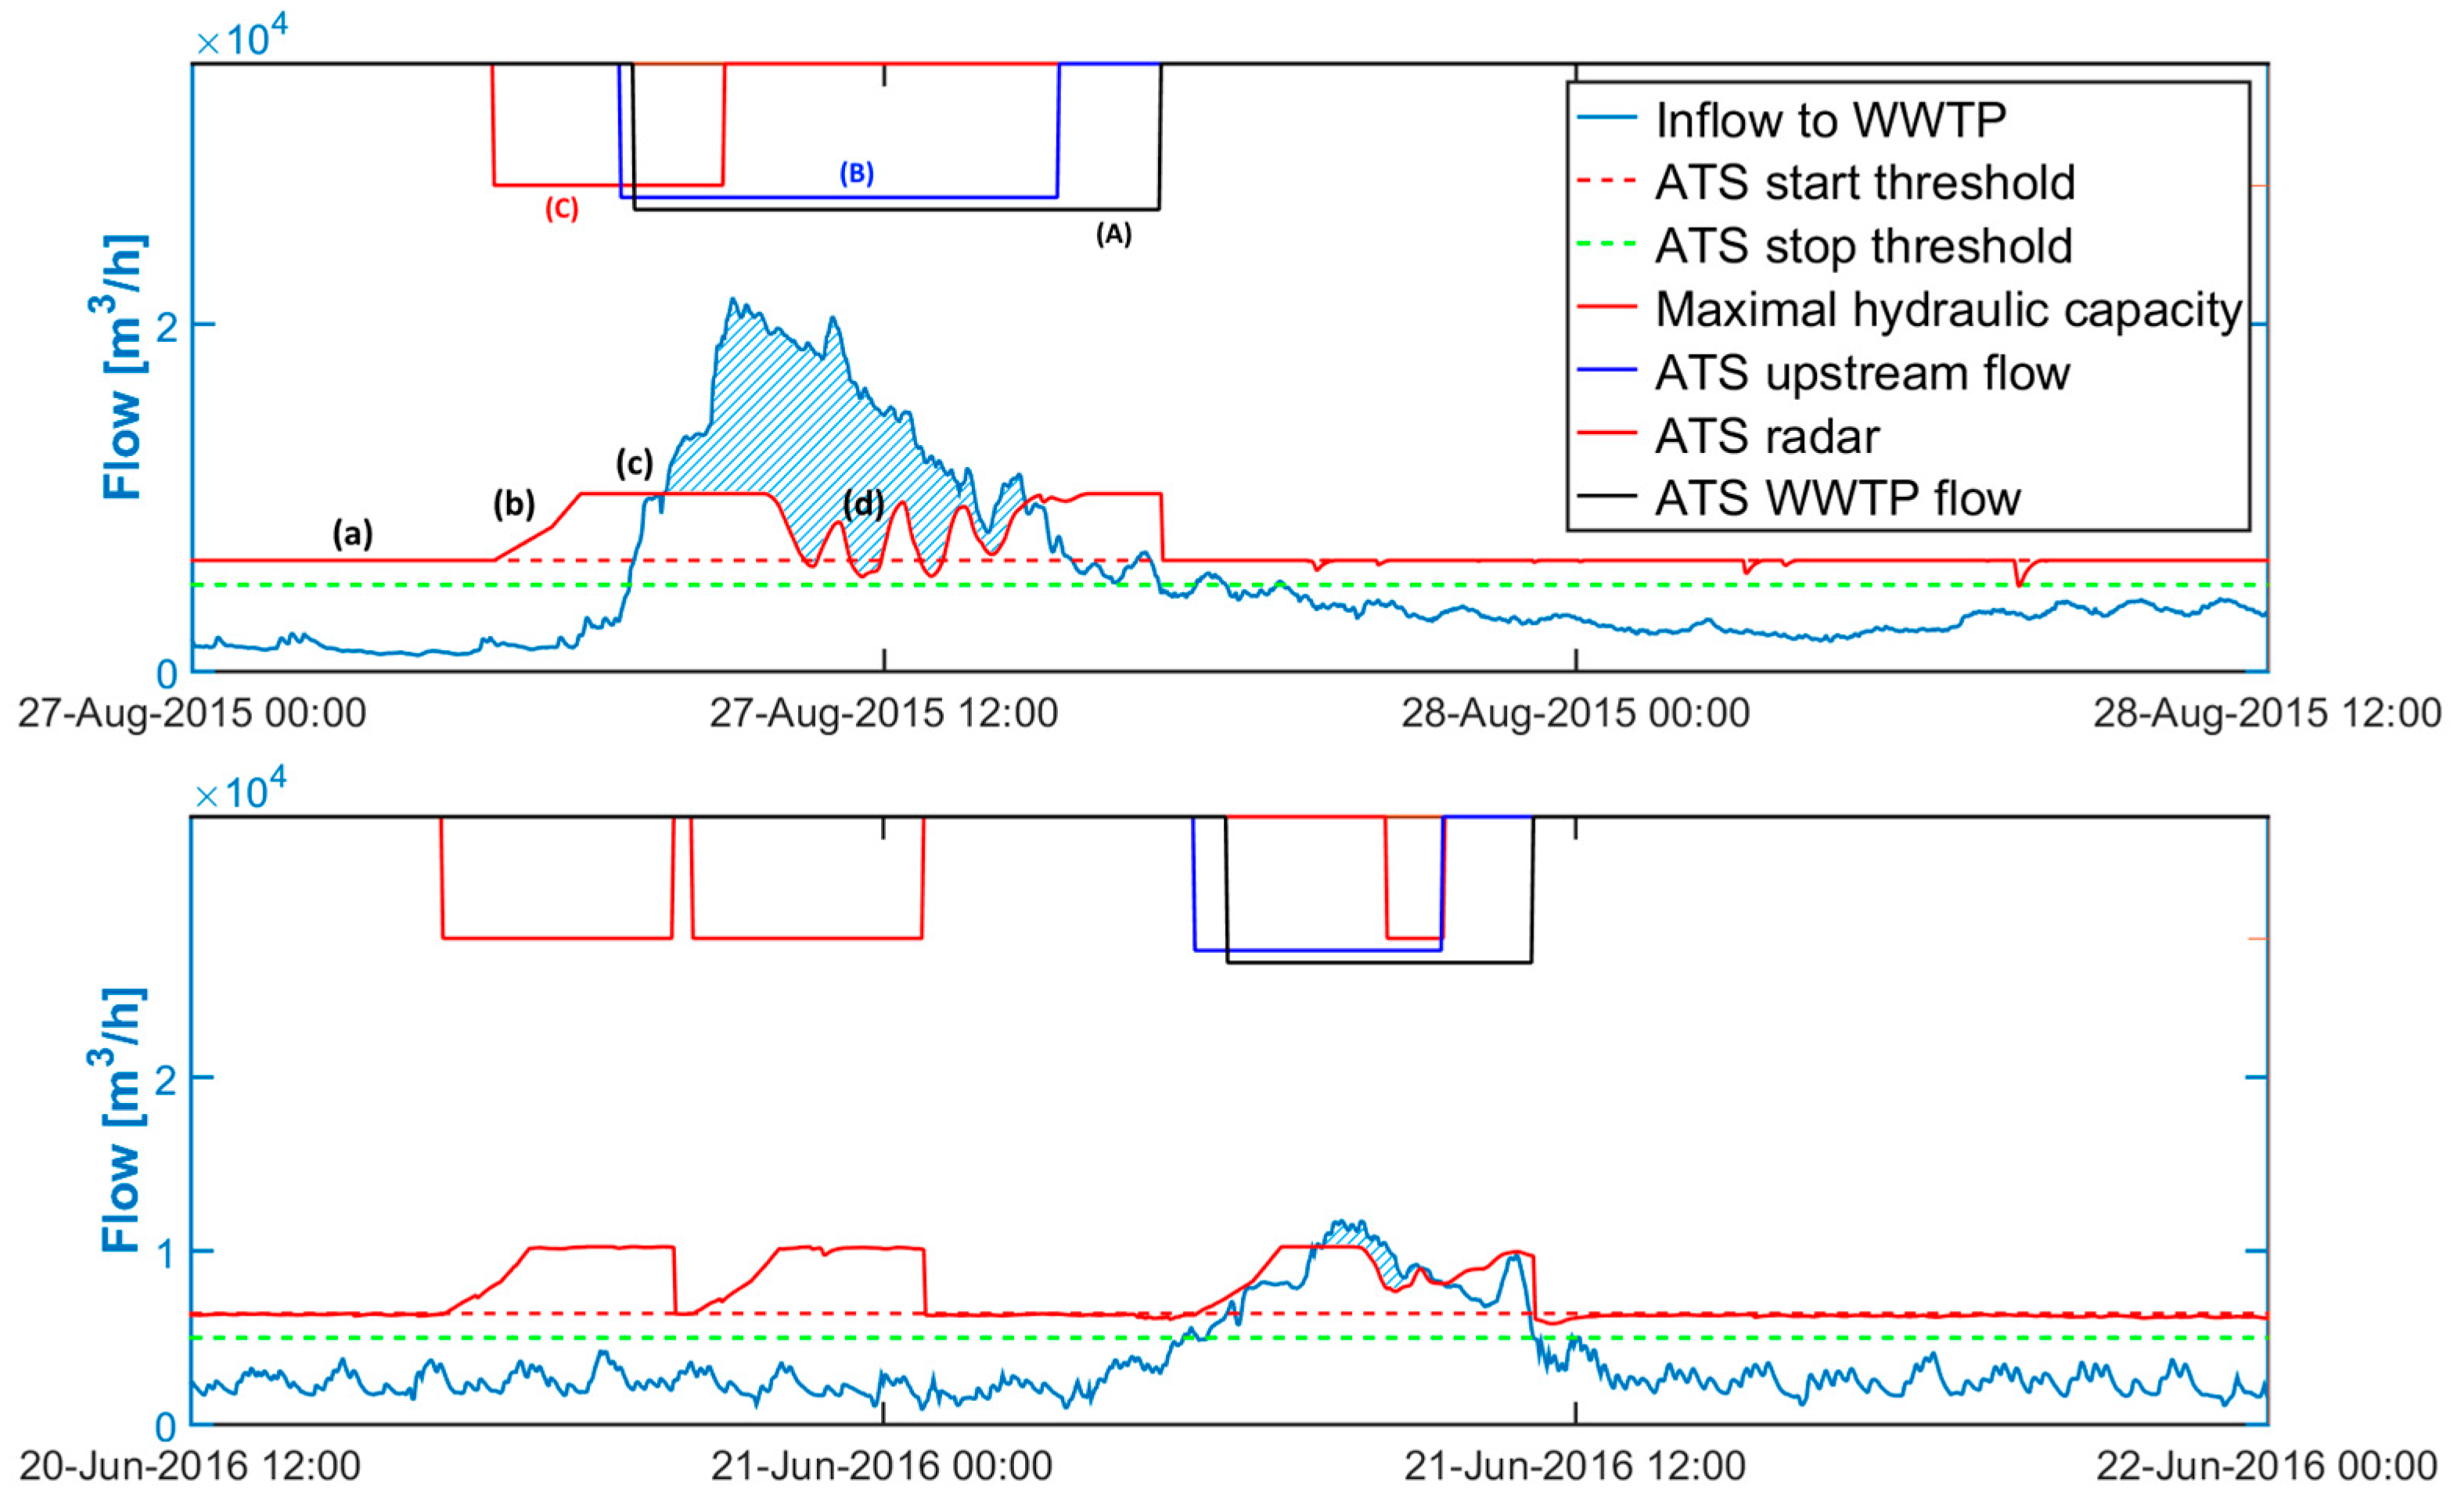
Figure 5 illustrates how the ATS control switch worked in real operation. The top panel displays an example of good operation. The ATS operation was in this case triggered by the pulse generated by the radar flow prognosis (C), which enabled it to start the preparation of the ATS operation in due time, prior to the flow increase (b). The ATS controls based on flow measurements (A & B) then took over and maintained the ATS operation until the end of the high flow event, interrupted only by some periods with lowered flow threshold due to increasing outlet TSS concentrations. The bottom panel shows examples of mismanagement; the ATS switch based on the radar flow prediction here generated 2 false alarms and then failed to anticipate the observed flow increase, and the start of ATS operation was thus in this case triggered by the upstream flow measurement.

3.4. Investigated Control Strategies

3.4.1. Perfect Control (EPerfect) and Reference Control (ERef)

For the given case study, we defined the perfect ATS control such that the ATS operation is started 2 h before the inflow to the WWTP exceeds 6400 m3 h−1, to have time to fully prepare the WWTP, and such that it is switched off when the inflow decreases below 5000 m3 h−1. Furthermore, small flow peaks that exceed these thresholds but are associated with small volumes, due to e.g., pumping operations, should not trigger a switch to ATS mode. Based on these criteria and using the measured flow at the WWTP, a time series was generated to represent the perfect ATS control. The reference control strategies were defined as explained in Section 2.3 (REF-1: never acting, REF-2: always acting; REF-3: ATS switching based solely on flow measurements at the WWTP).

3.4.2. Control Strategies Utilizing Flow and Volume Forecasts

Table 3 outlines a total of 7 control strategies that are evaluated in the results section using the REV approach and the acronyms by which they are denoted. These include the perfect ATS control switch (PERFECT) and the ATS control switch solely utilizing flow measurements at the WWTP (REF-3), described in Section 3.4.1, as well as 5 different control strategies that utilize (error prone) forecast information in different ways (FOR-1, FOR-2, FOR-3.1 and FOR-3.2, and FOR-4).
REF-3 and FOR-1 are both imaginary control strategies defined for the purpose of clarification; REF-3 is based solely on flow measurements at the WWTP (Figure 4A) and FOR-1 is based on both flow measurements at the WWTP and at the upstream Dæmning location (Figure 4A,B). FOR-2 corresponds to the baseline control strategy utilizing both measurements at the WWTP and the upstream location, as well as flow forecasts at the WWPT (Figure 4A–C). FOR-2 can be evaluated based on the historical, binary ATS data from the plant (which is affected by TSS concentration in the discharge as illustrated on Figure 5d) or directly based on the available flow time series (in which case the sludge blanket dependency is ignored).
FOR-3.1 and 3.2 are improved versions of the binary ATS control switch in which the parameters (flow thresholds) defining the rules (see Figure 4A–C) are optimized. The evaluation of the performance is done by calculating the REV, and the objective is to assess and provide the best control strategy for a given situation described by the pair (α, k), which are optimized using the fminsearch algorithm of MATLAB® with the objective function f = 1-REV. Two setups are analyzed, one (FOR-3.1) characterized by a high negative impact of false alarms (k = 0.8) and another (FOR-3.2) characterized by a high negative impact of misses (k = 0.2). For both set-ups, the value of losses and gain are equal (α = 1).
Finally, FOR-4 is a possible future control strategy that utilizes volume forecasts rather than flow forecasts. The baseline control strategy for the radar flow prognosis is based on a flow threshold. As soon as the flow prognosis exceeds the defined threshold the ATS operation is triggered, and this approach can potentially lead to a large amount of false alarms.
Figure 6 shows 3 situations, where the flow threshold starts the ATS operation at the time t1, 2 h before the predicted high flow. The “dotted” squares show the forecast horizon available at a given time (e.g., t1 or t2) and the used flow threshold. The upper panel (a) shows that this approach based on a flow threshold can lead to false alarm, especially when considering the uncertainty of the prediction. The middle panel (b) shows an example of ATS activation based on accumulated volume over a given duration. This approach provides a higher confidence on the prediction of a high flow event, hence the situation described in the first panel is not considered as a high flow event. However, using this method, the ATS operation is activated later (t2 > t1), and the preparation time to switch to ATS operation is therefore reduced. Hence, there is a trade-off between the duration required to assess the accumulated volume and the preparation time available to switch to ATS operation before the predicted flow increase reaches the WWTP.
In order to start the ATS operation as early as possible, different couples of accumulated volume-duration can be used. E.g., in the bottom panel of Figure 6c, the flow prediction is high, hence one can gain the confidence that this high flow event is relevant based on a shorter duration than for the example in the second panel. In the example of the third panel, ATS is started earlier (t2′ < t2).
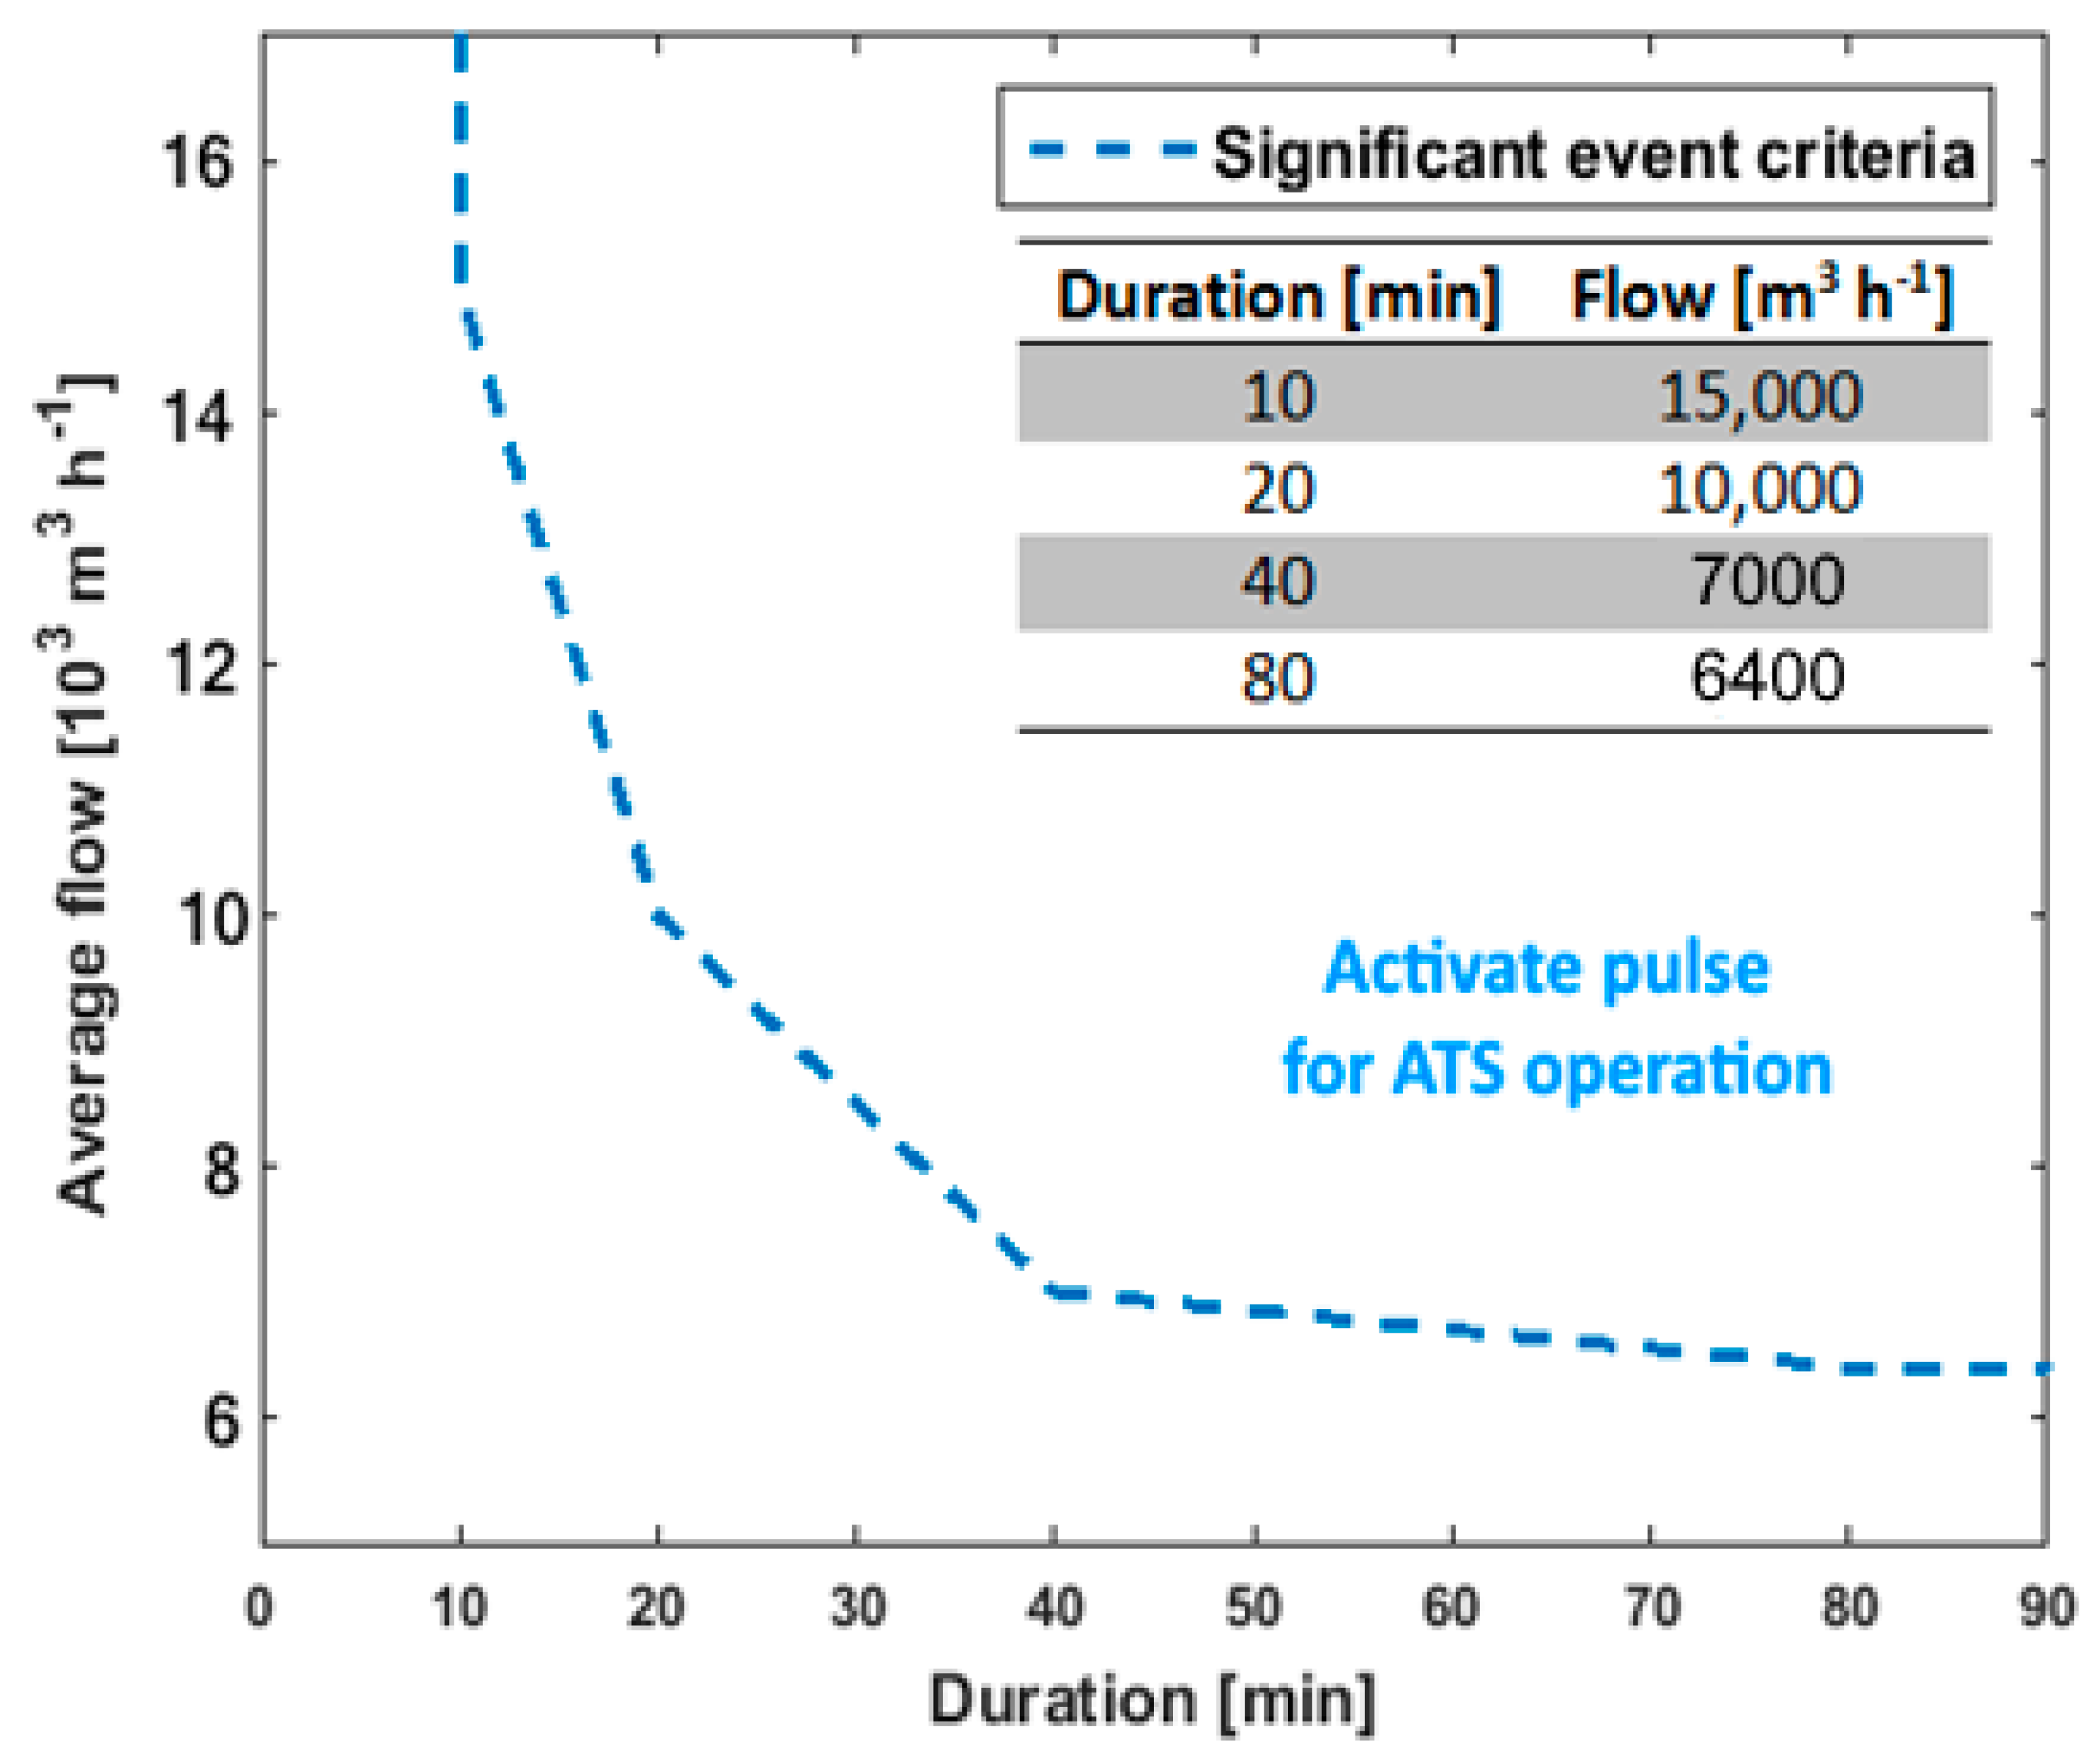
Figure 7 describes the average flow-duration curve criterion used to activate the ATS operation. The accumulated volume during a given period can be deduced from the average flow and the duration of the period considered. If the average flow for a given duration is above the criterion line, then the ATS operation is triggered. Hence if the radar flow prognosis clearly predicts a high flow event (e.g., bottom panel in Figure 6) then the ATS operation is triggered quickly and if radar flow prognosis predicts a moderate increase (e.g., upper and lower panel in Figure 6), then the ATS activation is delayed to assess if this increase is significant or not. In this way, it should potentially be possible to reduce the amount of false alarms.

3.5. Observation and Rainfall-Runoff Forecast Time Series Used in the Study

The empirical data covered the period from June 2015 to June 2017, i.e., 24 months in total. All data were time series with 2 min time step resolution covering flow measurements at the upstream Dæmning location and the WWTP inlet, flow prognoses at the WWTP inlet, and binary data documenting the perfect control strategy and the historical operation of ATS using the baseline control strategy described above in Section 3.3.

4. Results and Discussion

Table 4 illustrates the overall performance of the control strategies defined in Table 3. In the hypothesis of no ATS operation and no maximum flow reduction based on the TSS measurement in the effluent, i.e., assuming a constant maximal flow threshold of 6400 m3 h−1, the bypass volume would be 3.89 106 m3 y−1. All the other control strategies involve some form of ATS activation, i.e., temporarily raising the hydraulic capacity of the biological treatment step to 10,000 m3 h−1, and the computed bypass volumes are in these cases thus lower. The two imaginary control strategies (REF-3 and FOR-1) both perform worse than the control strategies based on forecast information, and the perfect control strategy (PERFECT) is the one performing the best, as expected.

4.1. Comparing the Baseline Control (FOR-2) to the Perfect Control (PERFECT)

The baseline bypass volume is 2.78 × 10⁶ m3 y−1 (calculated from the binary plant data), which corresponds to a reduction of 28.5%. Comparing the bypass volume reduction of the baseline ATS control to the perfect ATS control requires a theoretical calculation assuming no control of maximum flow based on the TSS measurement in the effluent, because these data are not known for theoretical flow control. With this assumption, the baseline ATS control bypasses 1.88 × 10⁶ m3 y−1, corresponding to 51.7% of bypass volume reduction, and the perfect ATS control bypasses 1.80 × 10⁶ m3 y−1, corresponding to 53.8% of bypass volume reduction, see Table 5. These results show a significant gap between the expected bypass volume reductions by considering or ignoring the maximum flow control based on the TSS concentration measurement in the effluent. This limitation is not further addressed in this paper; sensors were later installed in the secondary clarifiers to improve the monitoring of the sludge blanket and thus improve this control, which is not covered by the data investigated in this paper.
The contingency table of the baseline control (FOR-2) compared to the perfect current shows relatively few misses (0.82%) and many false alarms (7.12%), see Table 5. Considering the perfect ATS control, the WWTP should operate under ATS mode 12.5% of the time. In comparison, the baseline ATS operation is activated 18.8% of the time, which corresponds to 1.5 times more, and this is not desirable.
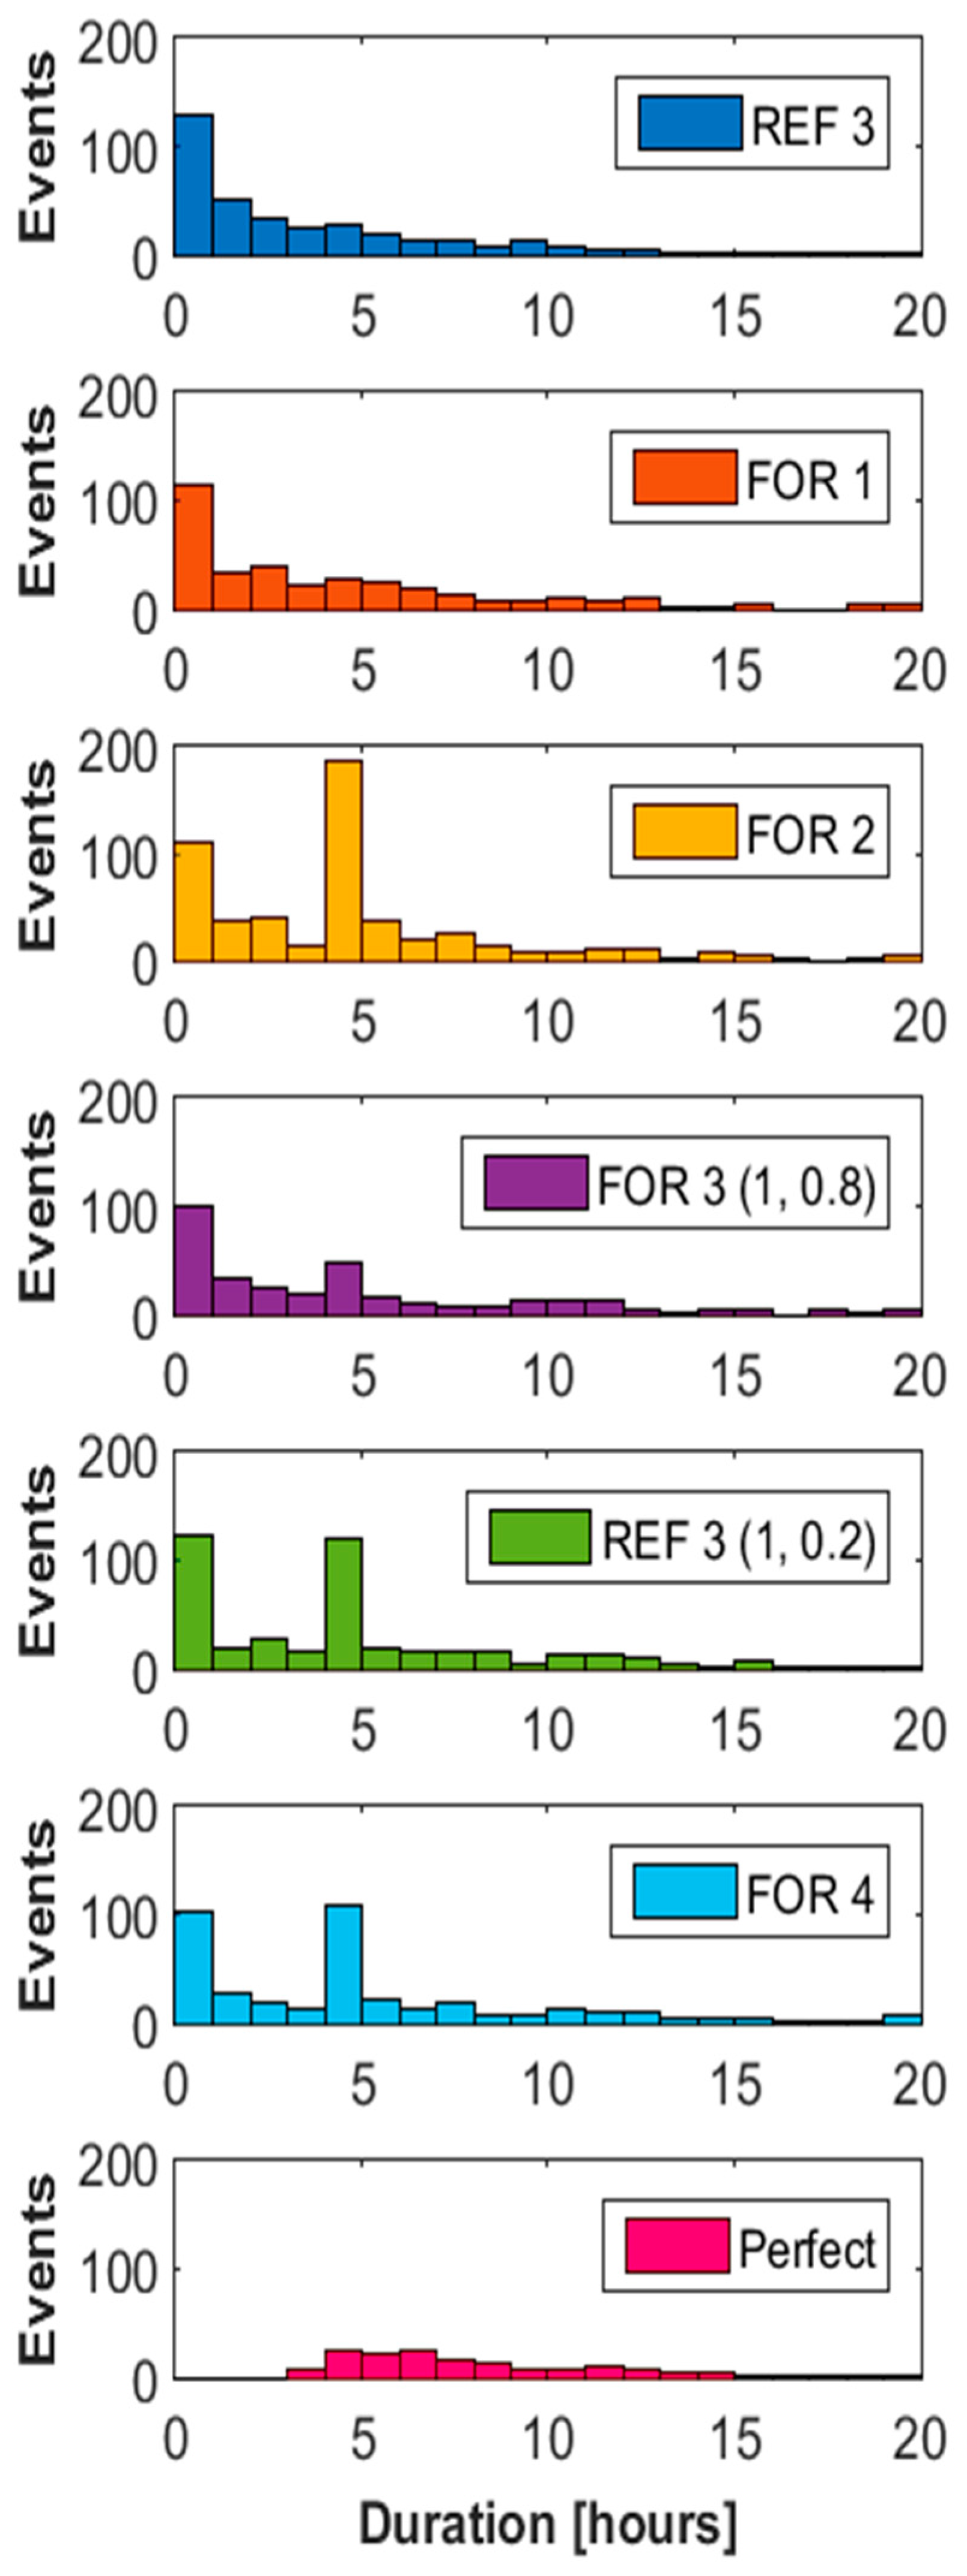
Figure 8 displays histograms of the ATS duration for all the control strategies listed in Table 4. The current control (FOR-2, third panel from the top) displays a significantly larger amount of ATS activations compared to the perfect control (bottom panel) (281 and 91 per year, cf. Table 4). The large number of ATS events shorter than one hour corresponds to small events exceeding the flow threshold at the WWTP for short amounts of time (e.g., due to pumping operation). A large peak is observed for 4-5 h ATS duration, which corresponds to the 4 h ATS activation pulse generated from the radar flow prognosis (see lower panel in Figure 5). This indicates that the baseline control based on radar flow prognoses generates a large amount of false alarms. Indeed, among the false alarms 76.5% solely result from the control switch based on the radar flow prognoses.
The analysis of the current ATS control indicates potential improvement in regard to false alarms. However, reducing the false alarms might result in an increase of the misses. Hence, the REV approach is used to determine the relevant trade-off according to the (α, k) pair chosen.
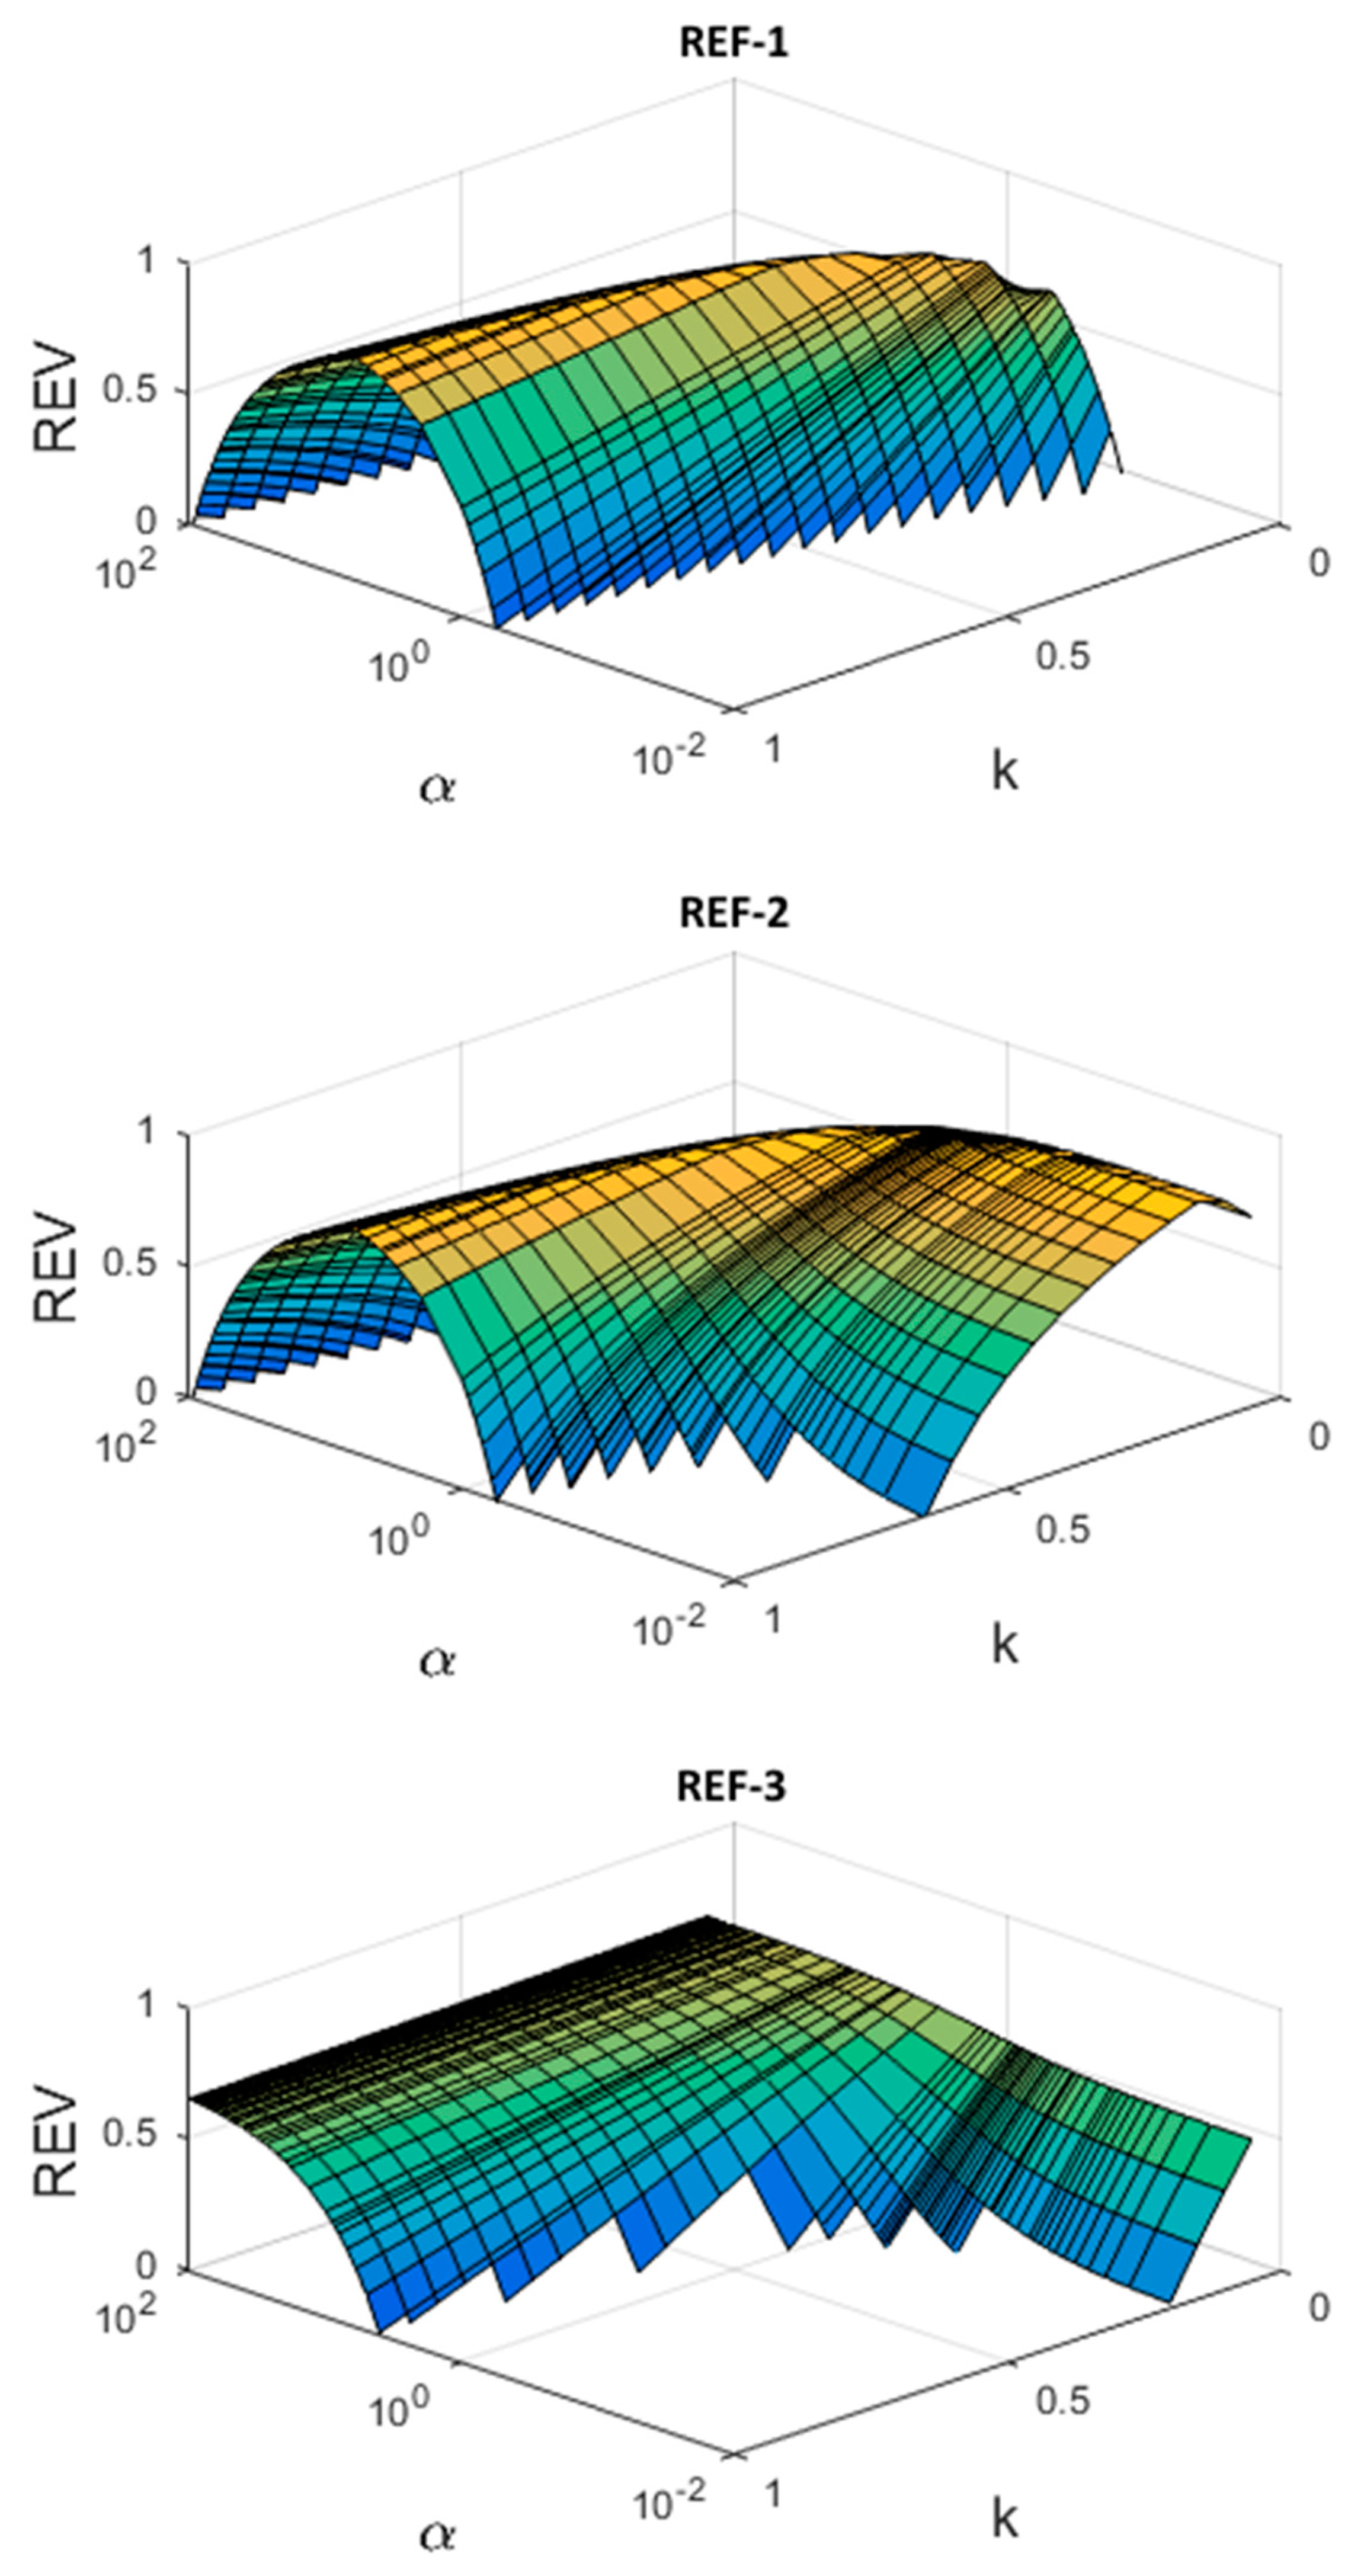
Figure 9 shows a 3D plot of the REV response surface for the baseline control switch (FOR-2) using each of the 3 reference strategies considered (see Section 2.3 and Section 2.4). The α and k values for which the REV is positive (the surfaces shown) represent the scope for which the current control strategy (FOR-2) is beneficial in comparison to the reference strategy.
The difference between REF-1 and REF-2 is the inclusion of negative impact from misses in REF-2. This results in positive REV of the baseline control (FOR-2) for low k values, i.e., if misses are assigned a high negative impact then it counterbalances the impact of false alarms, indicating that the current control strategy (FOR-2) performs better. Under these conditions the baseline control strategy (FOR-2) performs better than REF-2.
REF-3 compares the baseline control strategy to the control solely using the flow measurement at the WWTP. The REV shows that the baseline strategy using upstream measurements and radar flow prognoses is less beneficial than REF-3 in the situation of low gain compared to the potential loss (small α) and greater negative impact from false alarms than misses (high k).

4.2. Evaluation of the Optimized Parameters (FOR-3) and the New Control Switch (FOR-4)

The objective function evaluating the skill of the control strategy, based on the REV and the ratio between the different outcomes of the control strategy (α, k), was used to optimize the control parameters for two set-ups. The first one (FOR-3.1) is characterized by a high negative impact of false alarms (k = 0.8) whereas the second one (FOR-3.2) is characterized by a high negative impact of misses (k = 0.2). For both set-ups, the value of losses and gain were equal (α = 1). The threshold criteria to start the ATS operation were optimized for both the upstream flow and the radar flow prognosis. The results are displayed in Table 6, showing significant variations of the control parameters according to the objective criteria (α, k) and underlining the importance of selecting the relevant control parameters.
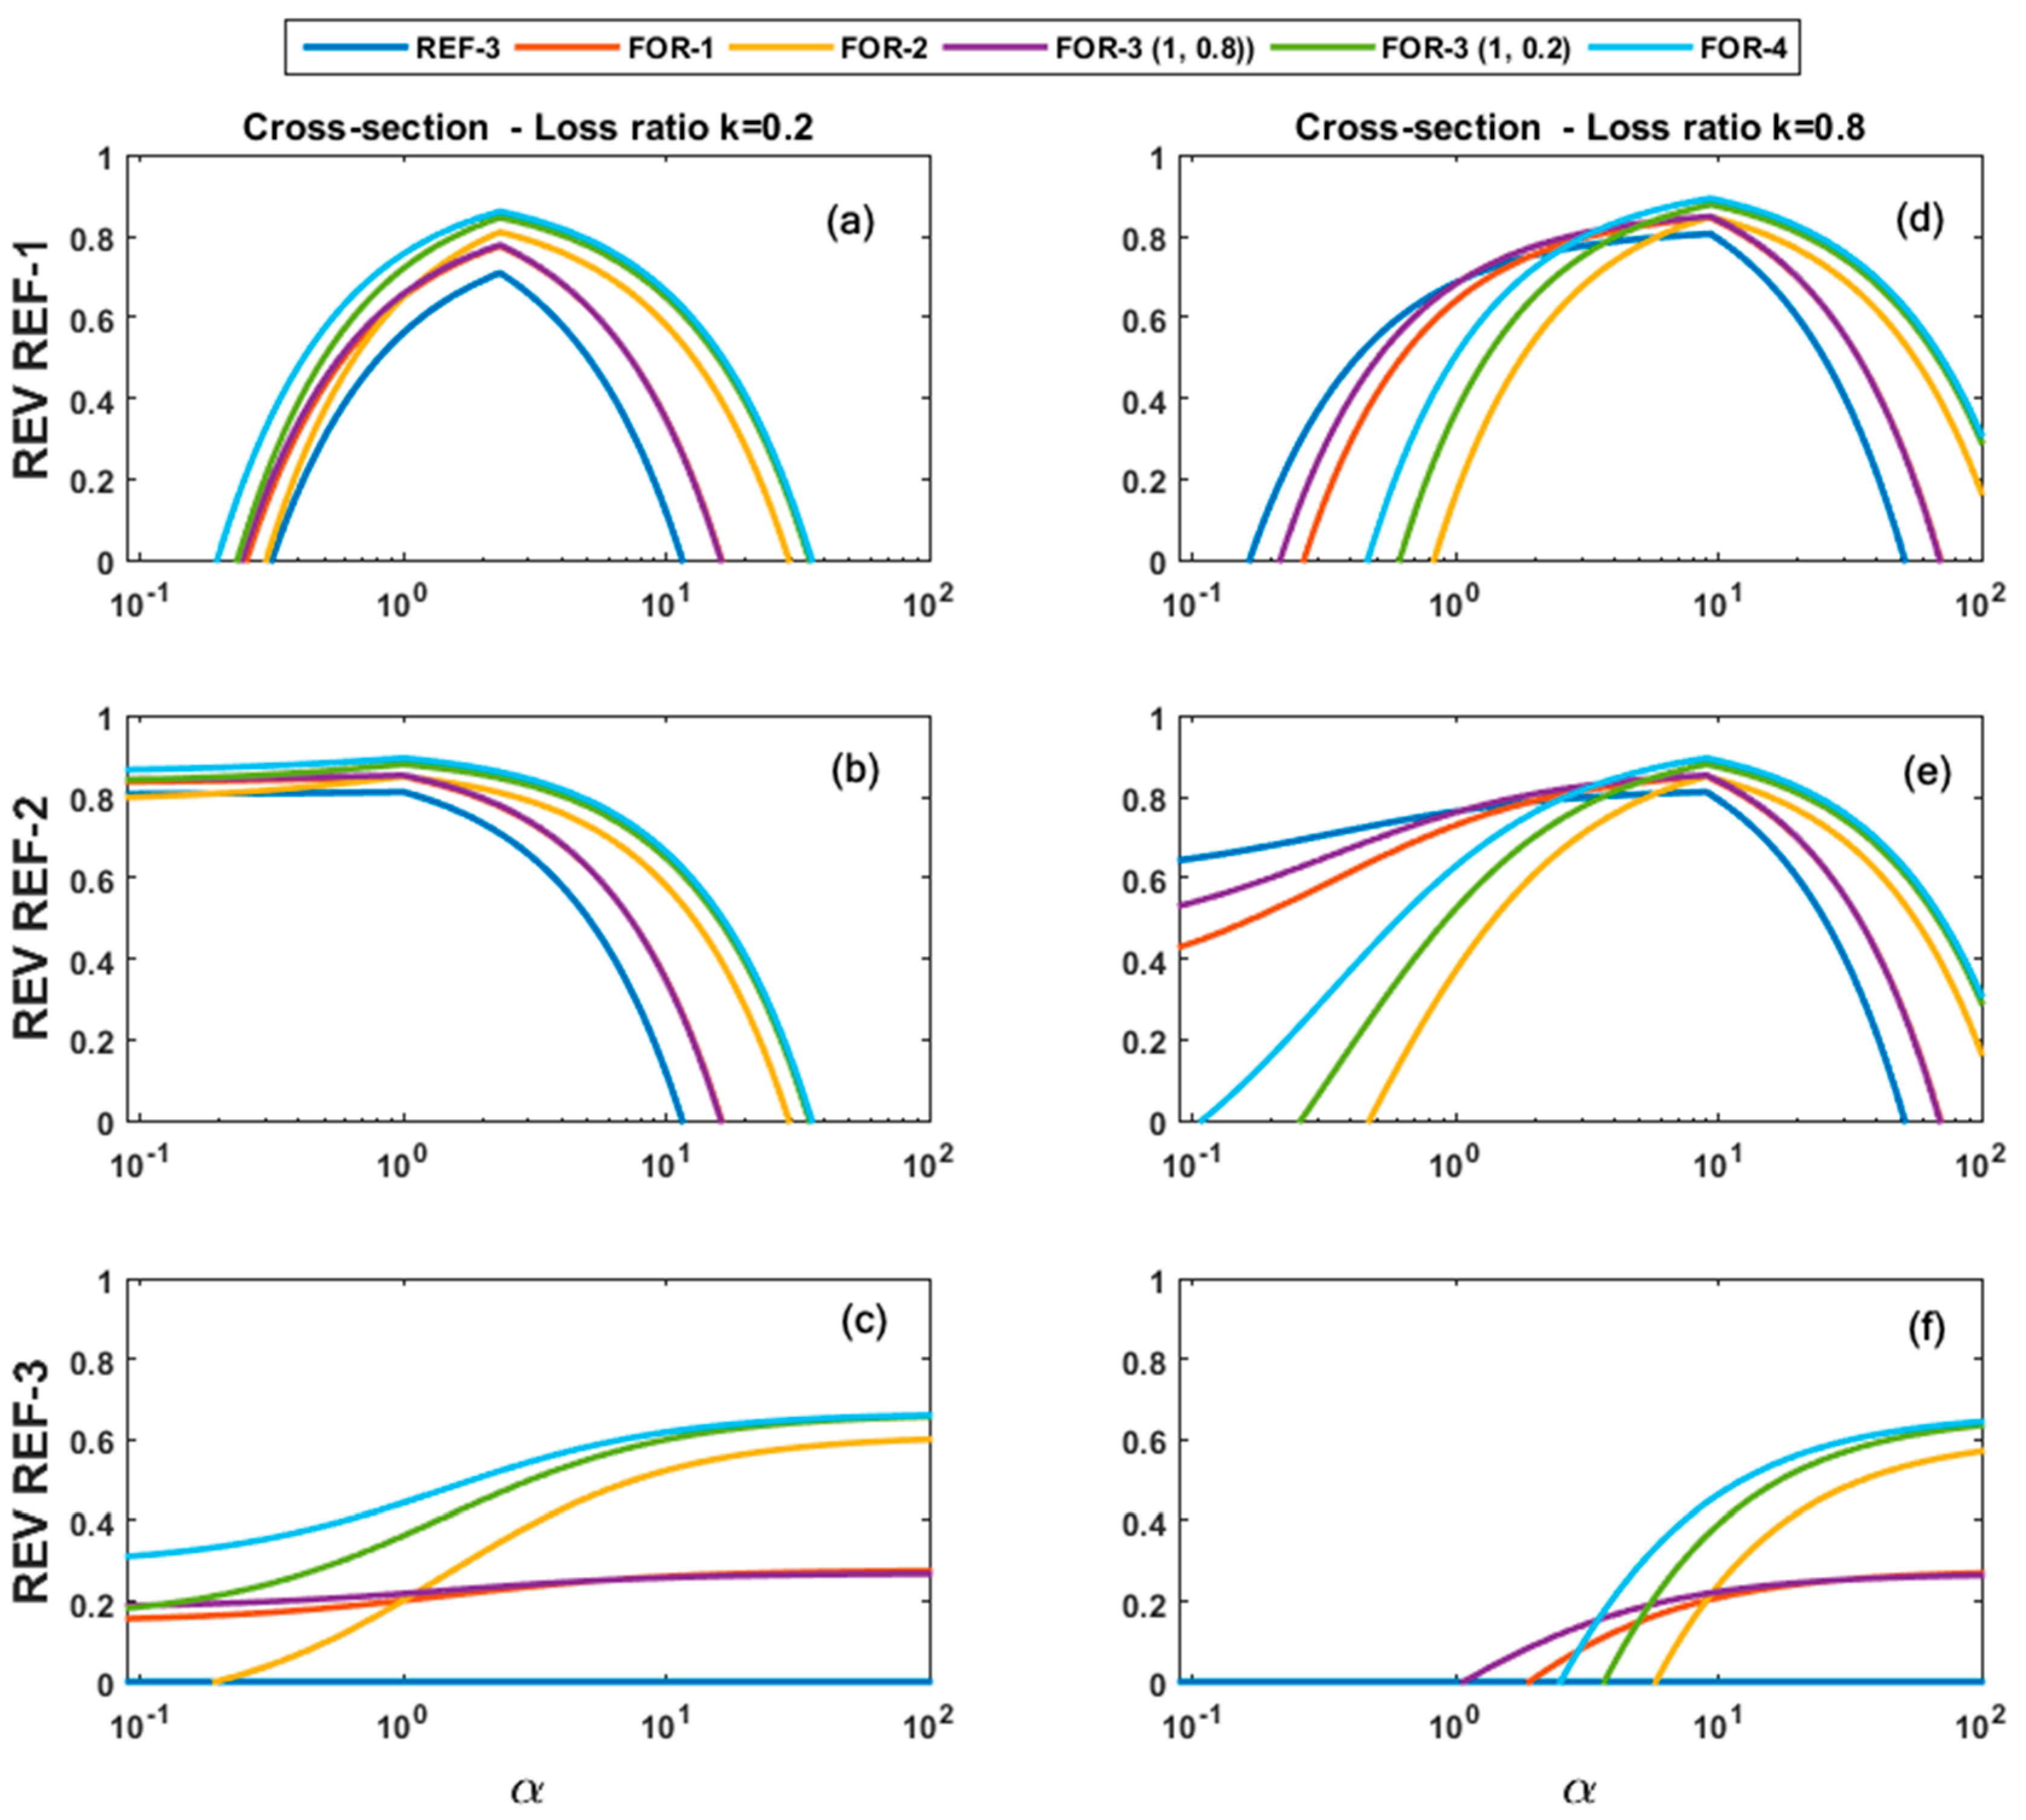
Figure 10 displays cross-sections of the REV surface response (shown in Figure 9 for FOR-2) for a k-value corresponding to the two optimized set-ups: for k = 0.2 (a, b and c—corresponding to higher negative impacts from misses than false alarms) and for k = 0.8 (c, d and e—corresponding to higher negative impacts from false alarms than misses).
For cross-sections k = 0.2, the optimized control strategy FOR-3.2 (1, 0.2) provides bet-ter results than the baseline control (FOR-2) regardless of the α-value. For the second cross-section k = 0.8, the best control strategy depends on the α-value. The optimized control strategy FOR-3.2 (1, 0.2) provides better results than the current control (FOR-2) for α-values lower than 9.5 and as shown by Figure 10f, for α-values lower than 1.07 the control strategy REF-3, which does not use any forecast, is the more beneficial. This demonstrates that for low α-values and high k-values, which corresponds to low gain compared to the potential loss and high negative impact from false alarms, upstream flow measurement and radar flow prognosis should not be used in the decision-making.
The false alarm rate was identified as a major limitation of the current control switch FOR-2 in the previous Section 4.1. Both optimized control strategies, FOR-3.2 (1, 0.2) and FOR-3.1 (1, 0.8), show a reduction of the false alarm rate of 31% and 75% respectively. The histograms in Figure 8 indicate that this reduction in false alarms corresponds to a reduction of the 4–5 h ATS events generated by the pulse of the generated from control on the flow radar prognosis.
The comparison between the common overall verification skill score CSI displayed in Table 4 and the REV curves displayed on Figure 10 shows a discrepancy between the control strategy with the highest CSI and the control strategy that provides the best benefit for a given situation. Indeed, FOR-3.1 (1, 0.8) has a highest CSI with 0.78 but as shown on Figure 10 according to selected (α, k) values, other control strategies with lower CSI provide higher benefits. This result underlines the importance of using a more detailed evaluation such as the REV instead of CSI.
Figure 10 also shows the benefit of the new approach, using an accumulated volume-duration curve instead of a flow threshold described in Section 3.4.2. The REV framework demonstrates that this new control strategy (FOR-4) is more beneficial than the baseline control strategy for k = 0.2, even when optimized. For k = 0.8 if α < 0.5 other control strategies provide higher REV, but similarly to FOR-3 the parameters on this new control strategy could be optimized specifically for these values in order to give higher benefit in this situation.

4.3. Defining and Quantifying the Objective Function

The REV approach requires defining an objective function, which has a major impact on the outcome of the evaluation and should be chosen carefully. The parametric REV approach requires allocating economic value to the outcomes of the contingency table (e.g., in the example G, L1 and L2). Such values can be difficult to assess and may depend on subjective criteria such as pollution load. However, the evaluation is here based on the ratio between these values represented by the pair (α, k), α = G/(L1 + L2) and k = L1/(L1 + L2), and specific values for the outcomes of the contingency table are hence not required. Furthermore, in some occasions a control strategy can be more beneficial than another regardless of the (α, k) values selected, as shown with FOR-2 and FOR-3 (1, 0.2) in the case study. This means that the control strategy could already be improved without quantifying the (α, k) values.
The chosen REV-based objective function assesses the control status for each time step, comparing it to the perfect control to generate the contingency table. Another approach could be to assess the control based on events instead of time steps, and the objective function could also be directly related to the bypass volume reduction.
The REV framework can be used to run a parameter estimation to determine the optimal set of control parameters for a given situation. The control strategy investigated in this case study is based on several sources of input for the same variable (flow measurement at the WWTP, flow measurement upstream, radar based flow prognosis). These different inputs are in some occasions redundant, which leads to correlated control parameters and hence, we only calibrated the two main parameters: the flow thresholds defined for the up-stream flow measurement and the downstream radar flow prognosis. We optimized the control parameters for two set-ups, with higher negative impact from misses than false alarms and vice versa. These two set-ups lead to two different control strategies, FOR-3 (1, 0.2) and FOR-3 (1, 0.8), with significantly different thresholds (respectively 9500 m3 h−1 and 16,875 m3 h−1 for the flow threshold on the radar flow prognosis, Table 6). These results underline the importance of defining the objective of the control strategy and to calibrate its parameters accordingly.
This REV framework can also be used to assess new control strategies as shown by FOR-4, which based the forecast decision on volume rather than flow threshold exceedance. It can furthermore be used to assess the benefit from using other new forecast inputs e.g., based on numerical weather predictions (NWP) that increasingly become available, e.g., [23,24].

5. Conclusions

Using uncertain forecast data leads to potential miss-management due to control errors resulting from e.g., false alarms or missed events. Therefore, a framework assessing the performance of a control strategy is important to support the decision-making, documenting the overall benefit of the control strategy despite potential temporary mismanagement due to forecast error.
This paper presents a framework based on the REV approach, which associates economic value to the potential outcomes of the control strategy summarized in the contingency table (hits, false alarms, misses and correct negatives). This framework was applied to the control switch for activating the wet-weather ATS operation at the Damhuså WWTP. The ATS operation has proven to increase the hydraulic capacity of the WWTP during high flow events, but it has to be triggered in advance to reach its full potential and therefore, forecast data are used to start the ATS mode in time to be fully operational when high flow occurs. Such uncertain data requires an assessment of the trade-off due to potential mismanagement from false alarms and missed events.
The REV framework proved to efficiently identify limitations of the baseline control strategy (e.g., high false alarm rate due to overconfidence on the radar flow prognosis). Furthermore, it allows a finer evaluation than common overall verification skill scores such as the CSI. Hence the control parameters (flow thresholds) can be optimized to improve the control strategy based on a chosen objective function defined by the ratio between the different outcomes of the contingency table, i.e., the ratio between gains and losses (α) and the ratio between the negative impact of false alarms and misses (k).
The two optimized control strategies, corresponding to higher negative impact from misses than false alarm and vice versa, showed improved benefit compared to the baseline control with e.g., a reduction of the probability of false detection respectively of 31% and 75%. We also used the REV framework to assess the potential for a new control strategy based on volume forecasting instead of flow forecasting for the control switch using the radar flow prognosis. The REV framework demonstrated that in some situations this new approach provided a higher benefit than optimizing the flow thresholds of the baseline control strategy.
The results yield two levels of recommendation. The first level, easy to implement, is to keep the baseline control strategy (based on flow measurements and radar flow prognoses) and use the REV-framework to optimize its control parameters (mainly the threshold on the radar flow prognosis) according to the chosen objective (α, k). The second level is to modify the baseline control strategy to include radar volume prognoses. This approach adds complexity and requires more programming, and its benefit compared with the baseline control strategy should therefore be assessed.

Author Contributions

Conceptualization and methodology, V.C., T.M.-N. and P.S.M.; software, V.C.; validation, T.M.-N. and P.S.M.; formal analysis, investigation, resources, data curation, visualization, and writing—original draft preparation, V.C.; writing—review and editing, V.C., T.M.-N. and P.S.M.; supervision, project administration, T.M.-N. and P.S.M.; funding acquisition, V.C. and P.S.M. All authors have read and agreed to the published version of the manuscript.

Funding

This research was financially supported by the industrial PhD programme of the Innovation Fund Denmark (grant no. 4019-00045B).

Data Availability Statement

The data presented in this study are available from the first author upon request.

Acknowledgments

The catchment and WWTP data were kindly provided by Greater Copenhagen Utility (HOFOR) and BIOFOS, the operator of the WWTP.

Conflicts of Interest

The authors declare no conflicts of interest.

Abbreviations

AbbreviationMeaning
ATSAeration tank settling
CSICritical Success Index
NWPNumerical weather prediction
PoDProbability of detection
PoFDProbability of false detection
QRASReturn activated sludge flow
REVRelative economic value
RTCReal time control
SSSuspended solids
TSSTotal suspended solids
UDSUrban drainage system
WWTPWastewater treatment plant

References

  1. Semadeni-Davies, A.; Hernebring, C.; Svensson, G.; Gustafsson, L.-G. The impacts of climate change and urbanisation on drainage in Helsingborg, Sweden: Combined sewer system. J. Hydrol. 2008, 350, 100–113. [Google Scholar] [CrossRef]
  2. Lund, N.L.S.; Borup, M.; Madsen, H.; Mark, O.; Arnbjerg-Nielsen, K.; Mikkelsen, P.S. Integrated stormwater inflow control of sewers, green infrastructure and urban landscapes. Nature Sustain. 2019, 2, 1003–1010. [Google Scholar] [CrossRef]
  3. Lessard, P.; Beck, M.B. Operational water quality management: Control of storm sewage at a wastewater treatment plant. Res. J. Water Pollut. Control Fed. 1990, 62, 810–819. [Google Scholar]
  4. Ahnert, M.; Tra, J.; Gu, N.; Hoeft, S.; Krebs, P. Model-based comparison of two ways to enhance WWTP capacity under stormwater conditions. Water Sci. Technol. 2009, 60, 1875–1883. [Google Scholar] [CrossRef] [PubMed]
  5. Liu, L.; Gao, H.; Zhao, X.; Chen, X.; Hong, S.N. Wastewater treatment: Enhanced biological treatment of storm flows. Filtr. Sep. 2010, 47, 23–27. [Google Scholar] [CrossRef]
  6. Rönner-Holm, S.G.E.; Alves, I.K.; Steinmetz, H.; Holm, N.C. Optimisation potential for a SBR plant based upon integrated modelling for dry and wet weather conditions. Water Sci. Technol. 2009, 60, 1953–1964. [Google Scholar] [CrossRef] [PubMed]
  7. Munk-Nielsen, T.; Poulsen, T.S.; Öennerth, T.B.; Thirsing, C. Real time control combined with weather radar forecast and aeration tank settling improves the hydraulic capacity and the treatment efficiency during wet weather operation. In Proceedings of the 2nd IWA New Developments in IT & Water Conference, Rotterdam, The Netherlands, 8–10 February 2015. [Google Scholar]
  8. Thorndahl, S.; Einfalt, T.; Willems, P.; Nielsen, J.E.; ten Veldhuis, M.-C.; Arnbjerg-Nielsen, K.; Rasmussen, M.R.; Molnar, P. Weather radar rainfall data in urban hydrology. Hydrol. Earth Syst. Sci. 2017, 21, 1359–1380. [Google Scholar] [CrossRef]
  9. Thorndahl, S.; Rasmussen, M.R. Short-term forecasting of urban storm water runoff in real-time using extrapolated radar rainfall data. J. Hydroinformatics 2013, 15, 897–912. [Google Scholar] [CrossRef]
  10. Heinonen, M.; Jokelainen, M.; Fred, T.; Koistinen, J.; Hohti, H. Improved wet weather wastewater influent modelling at Viikinmäki WWTP by on-line weather radar information. Water Sci. Technol. 2013, 68, 499–505. [Google Scholar] [CrossRef] [PubMed]
  11. Wei, X.; Kusiak, A. Short-term prediction of influent flow in wastewater treatment plant. Stoch. Environ. Res. Risk Assess. 2015, 29, 241–249. [Google Scholar] [CrossRef]
  12. Richardson, D.S. Skill and relative economic value of the ECMWF ensemble prediction system. Q. J. R. Meteorol. Soc. 2000, 126, 649–667. [Google Scholar] [CrossRef]
  13. Courdent, V.; Grum, M.; Munk-Nielsen, T.; Mikkelsen, P.S. A gain–loss framework based on ensemble flow forecasts to switch the urban drainage–wastewater system management towards energy optimization during dry periods. Hydrol. Earth Syst. Sci. 2017, 21, 2531–2544. [Google Scholar] [CrossRef]
  14. Einfeldt, J. The implementation of biological phosphorus and nitrogen removal with the Bio-Denipho proces on a 265,000 PE treatment plant. Water Sci. Technol. 1992, 25, 161–168. [Google Scholar] [CrossRef]
  15. BIOFOS: Miljøberetning, Copenhagen. Available online: http://www.biofos.dk/wp-content/uploads/2014/11/Miljoeberetning-2015.pdf (accessed on 17 June 2017).
  16. Bundgaard, E.; Nielsen, M.K.; Henze, M. Process development by full-scale on-line tests and documentation. Water Sci. Technol. 1996, 33, 281–287. [Google Scholar] [CrossRef]
  17. Nielsen, M.K.; Carstensen, J.; Harremoës, P. Combined control of sewer and treatment plant during rainstorm. Water Sci. Technol. 1996, 34, 181–187. [Google Scholar] [CrossRef]
  18. Nielsen, M.K.; Bechmann, H.; Henze, M. Modelling and test of aeration tank settling (ATS). Water Sci. Technol. 2000, 41, 179–184. [Google Scholar] [CrossRef]
  19. Sharma, A.K.; Guildal, T.; Thomsen, H.A.R.; Mikkelsen, P.S.; Jacobsen, B.N. Aeration tank settling and real time control as a tool to improve the hydraulic capacity and treatment efficiency during wet weather: Results from 7 years’ full-scale operational data. Water Sci. Technol. 2013, 67, 2169–2176. [Google Scholar] [CrossRef] [PubMed]
  20. Nielsen, M.K.; Lynggaard-Jensen, A. Superior tuning and reporting (STAR)—A new concept for on-line process control of wastewater treatment plants. In Proceedings of the IAWQ ICA Workshop, Hamilton, ON, Canada, 17–25 June 1993. [Google Scholar]
  21. Thorndahl, S.; Rasmussen, M.R. Vejrradarbaseret Styring af Spildevandsanlæg; DCE Technical Report No. 95; Aalborg University: Aalborg, Denmark, 2010. [Google Scholar]
  22. Pedersen, J.W.; Lund, N.S.V.; Borup, M.; Löwe, R.; Poulsen, T.S.; Mikkelsen, P.S.; Grum, M. Evaluation of Maximum a Posteriori Estimation as Data Assimilation Method for Forecasting Infiltration-Inflow Affected Urban Runoff with Radar Rainfall Input. Water 2016, 8, 381. [Google Scholar] [CrossRef]
  23. Korsholm, U.S.; Petersen, C.; Sass, B.H.; Nielsen, N.W.; Jensen, D.G.; Olsen, B.T.; Gill, R.; Vedel, H. A new approach for assimilation of 2D radar precipitation in a high-resolution NWP model. Meteorol. Appl. 2015, 22, 48–59. [Google Scholar] [CrossRef]
  24. Olsen, B.T.; Korsholm, U.S.; Petersen, C.; Nielsen, N.W.; Sass, B.H.; Vedel, H. On the performance of the new NWP nowcasting system at the Danish Meteorological Institute during a heavy rain period. Meteorol. Atmos. Phys. 2015, 127, 519–535. [Google Scholar] [CrossRef]
Figure 1. Benefit from use of a flow forecast for wet-weather control switching, which leads to an avoided discharge (bypass) of untreated wastewater. Based on [7].
Water 16 02806 g001
Figure 2. The Damhuså catchment (top) and a process diagram of the Damhuså WWTP (bottom).
Water 16 02806 g002
Figure 3. Main loads and concentrations during dry weather operation (a) and wet weather with the two operation modes: conventional wet-weather operation (b) and ATS operation (c) (inspired from [7].
Water 16 02806 g003
Figure 4. Baseline control scheme for the ATS switch at the Damhuså WWTP (June 2015–June 2017), based on three different inputs, (A) the measured inflow at the WWTP, (B) the measured flow at Dæmning upstream in the drainage system, and (C) the flow prognosis at the WWTP using radar extrapolation data.
Water 16 02806 g004
Figure 5. Examples of ATS control switch for two events in August 2015 and June 2016, based on (see Figure 4) flow measurements at the WWTP (A) and the upstream Dæmning location (B) and on radar flow prognosis (C). The maximal hydraulic capacity to the biological treatment varies under different conditions: (a) dry weather, (b) preparation of the ATS operation, (c) ATS operation, (d) critical sludge blanket level in secondary settlers and the wastewater bypassed (cross hatched).
Water 16 02806 g005
Figure 6. Example of volume based approach (dotted rectangles in purple and green) compared to the flow threshold approach (dotted rectangles in red), for three examples showing that use of a flow threshold can lead to both (a) false alarms and (b) hits, and that ((c), compared with (b)) volume forecasts can be made with different coupled volume-duration. “On” means that in a given situation ATS would be activated, and “off” that the ATS would not be activated. The time of activation of the ATS is represented by the time t1 and t2.
Water 16 02806 g006
Figure 7. Average flow-duration criterion to start the ATS operation based on the radar flow prog-nosis.
Water 16 02806 g007
Figure 8. Histograms of the ATS event duration for the different control strategies outlined in Table 4.
Water 16 02806 g008
Figure 9. REV response surface (*) for the current ATS control (FOR-2), with k and α as independent parameters, for the 3 different REF. Notice that the k and α axis are reversed for better visibility of the 3D plots.
Water 16 02806 g009
Figure 10. Cross-section of the REV surface response for high impact of misses with k = 0.2 (ac) and high impact of false alarms with k = 0.8 (df).
Water 16 02806 g010
Table 1. Contingency table for time series of n binary events. The number of outcomes in each category are represented by a, b, c and d, with their sum n being the total number of time steps evaluated. The REV assigned to the different outcomes are represented by G, L1, L2 and 0.
Perfect Control
OnOff
Real/Simulated
control
OnHits (a)
REV: G
False alarms (b)
REV: L1
a + b
OffMisses (c)
REV: L2
Correct negatives (d)
REV: 0
c + d
a + cb + da + b + c + d = n
Table 2. Verification measures based on the contingency table in Table 1, as well as their possible range and their perfect numerical value.
ScoreFormulaRangePerfect
PoD, Probability of detectiona/(a + c)[0, 1]1
PoFD, Probability of false detectionb/(b + d)[0, 1]0
CSI, Critical success indexa/(a + b + c)[0, 1]1
µ, Occurrence frequency of events(a + c)/n[0, 1]n/a
Table 3. Overview of the investigated control strategies and their different input, indicated by “X” in the relevant columns. n/a: not applicable.
AcronymExplanationWWTP Flow Meas. (A, Figure 4)Upstream Flow Meas. (B, Figure 4)Radar Prognosis (C)
Baseline (Flow)Optimized (Flow)New (Volume)
REF-3Reference control strategy (Section 2.3 and Section 3.4.1)X
FOR-1ATS control switch originally installed in 2012XX
FOR-2Baseline ATS control switch described in Section 3.3 and Figure 4XXX
FOR-3.1Like above, but with optimized flow-thresholdsXX X
FOR-3.2
FOR-4New control-switch, based on
volume-forecasting
XX X
PERFECTPerfect control (Section 3.4.1)n/an/an/an/an/a
Table 4. Overview of the results for the all the evaluated control strategies, bypass volume, percentage bypass volume reduction compared to the situation “without ATS”, number of ATS events per year and proportion of time with ATS operation, and three evaluation metrics (PoD, PoFD, CSI).
Bypass Volume
[106 m3 y−1]
Percentage of ReductionNumber of ATS Events per YearProp. of ATS OperationPoDPoFDCSI
With/Without
TSS Ctrl
With/Without TSS Ctrl
Without ATS-3.89 -------
REF-3-2.08 -46.4%18811%0.820.0080.78
FOR-1-1.97 -49.4%18312.7%0.870.0200.76
FOR-2 (Baseline)2.78 1.88 28.5%51.7%28118.8%0.930.0800.60
FOR-3.1 (1, 0.8)-1.94 -51.1%17412.1%0.890.0200.78
FOR-3.2 (1, 0.2)-1.85 -52.5% 22716.0%0.940.0550.68
FOR-4-1.85 -52.5%20915.6%0.940.0450.71
Perfect-1.80 -53.8%9112.5%101
Table 5. Contingency table for the baseline control strategy (FOR-2) vs. perfect ATC control showing the relative occurrence of each outcome.
Perfect ATS Control
OnOff
Current ATS controlOn0.11690.0712
Off0.00820.8036
Table 6. Results of the parameter optimization for FOR-3 (FOR-3.1 and FOR-3.2).
( α ,   k ) Upstream Flow
Threshold [m3 h−1]
Radar Flow Prognosis
Threshold [m3 h−1]
FOR-3.1 (1, 0.8)400016,875
FOR-3.2 (1, 0.2)28559500
Disclaimer/Publisher’s Note: The statements, opinions and data contained in all publications are solely those of the individual author(s) and contributor(s) and not of MDPI and/or the editor(s). MDPI and/or the editor(s) disclaim responsibility for any injury to people or property resulting from any ideas, methods, instructions or products referred to in the content.