Article

Flow Characteristics in Open Channels with Non-Submerged Rigid Vegetation Landscape

1
College of Water Conservancy & Architectural Engineering, Shihezi University, Shihezi 832003, China
2
College of Management and Economics, Tianjin University, Tianjin 300072, China
3
School of Water Conservancy and Hydroelectric Power, Hebei University of Engineering, Handan 056038, China
4
Nomal College, Shihezi University, Shihezi 832003, China
*
Author to whom correspondence should be addressed.
Water 2024, 16(19), 2759; https://doi.org/10.3390/w16192759
Submission received: 16 August 2024 / Revised: 21 September 2024 / Accepted: 26 September 2024 / Published: 27 September 2024
(This article belongs to the Section Hydraulics and Hydrodynamics)

Abstract

:
The commercial CFD package Fluent and the Reynolds stress model were used to simulate the hydraulic characteristics with three types of vegetation distribution: longitudinal, interlaced and patch. Each type was aggregated to the middle line l of the water flow in an equal proportion of 0.5, resulting in a total of nine landscape vegetation arrangements. The numerical model was verified and showed a high level of consistency with the experimental comparison; the results indicate the following: (1) As the distribution of landscape vegetation on both sides becomes increasingly concentrated from a loose state to the middle line l of the flow, the flow velocity declines and the maximum Reynolds stress rises, and the greater the Reynolds stress, the more powerful the shear layer, contributing to turbulence, generating mass and momentum exchange and enhancing the vertical transport of momentum. (2) Compared with the gap area, the flow velocity in the vegetation area is smaller, the turbulent kinetic energy is larger and the maximum Reynolds stress of the bottom flow is larger; the larger sediment particles tend to deposit in the gap area, while smaller sediments tend to deposit in the vegetation area. At the same time, the vegetation area is more prone to deposits than the gap area. (3) Under the same vegetation density, whether in the test area or the wake area, the water blocking capacity and the deposition capacity are in the following order: patch distribution pattern > interlaced distribution pattern > longitudinal distribution pattern.

Graphical Abstract

1. Introduction

With the acceleration of ecological landscape construction and the environmental restoration of rivers and lakes, the aquatic vegetation communities in rivers are becoming more abundant and three-dimensional [1,2,3]. However, there are numerous problems in the management of rivers and lakes, such as the insufficient consideration of landscape and ecology [4,5,6,7]. In recent years, there have been common phenomena of artificial intervention in vegetation arrangement, such as artificial ecological floating islands and floating beds. The existence of landscape vegetation will have a considerable impact on the flow structure [8], not only affecting the flood discharge and drainage capacity of the entire river [9,10,11], but also influencing the mass transport capacity of the vegetation [12,13,14]. Thus, by arranging different landscape vegetation patterns to form discontinuous water surfaces, it is of practical significance to achieve flood control and waterlogging prevention, as well as soil and water conservation, and to further build the landscape characteristics of human–water harmony [15,16,17].
While landscape vegetation distribution patterns improve the ecological function of rivers, they also change the internal structure. Previous studies on the distribution pattern of vegetation have yielded fruitful results. Zhang et al. [18,19] deeply analyzed the effects of different land allocation patterns on the protection function of water diffusion. Sun et al. [20] used three different surface vegetation layouts to explore the effects of these patterns on the intensity of water diffusion feedback. Fu et al. [21] arranged five artificial plant stem patterns to analyze the influence of plant stem distribution on sediment transport capacity. With the study of complex vegetation distribution patterns gradually being carried out, the hydraulic characteristics of vegetation combination and distribution have been clarified through six combination distributions and six discrete distributions based on an indoor scouring experiment [22].
There is also a research focus on the effect of coverage on the same vegetation pattern. For example, four different grassland coverages of 30%, 50%, 70% and 90% were set up, and three different grassland distribution patterns were designed under each coverage. Then, the influence of slope flow on the hydraulic characteristics was analyzed through a scouring experiment [23]. Zhang et al. [24] arranged three row spacings for flume simulation experiments and observed how the plant spacing changed the flow resistance on the slope and how these resistances further shaped the flow pattern. With the development of research on complex vegetation distribution patterns and the rise of numerical simulation research methods, Liu et al. [25] analyzed the internal velocity field and local flow resistance by arranging vegetation patches with different densities in an open channel. Anjum and Tanaka [26] used Fluent to analyze the influence of the cross-arrangement of vegetation combinations on flow structure. They were especially concerned about the two factors of vegetation coverage and vegetation area length and wanted to explore how they work together with regard to water flow characteristics.
In the past, the research objects of studies on open channels with vegetation were mostly simple vegetation distribution models. The research methods were mainly focused on different distribution patterns of vegetation under the same coverage and the same distribution pattern of vegetation under different coverages, while ignoring the fact that the same vegetation density is distributed in multiple landscape layouts.
At present, the modern watershed is influenced by highly complex human activities, and the self-organization behavior of aquatic vegetation under the constraint of nutrient resources [27] leads to the formation of complex vegetation patterns on the basin surface, destroying the spatial properties of continuous changes in the basin surface under natural conditions and accelerating the evolution of the natural watershed into the modern landscape watershed. The response relationship of channel runoff becomes abnormal [28].
In combination with the actual situation, in a designated area, a certain amount of vegetation can be artificially arranged into various landscapes. At the same time, for the selection of research parameters, it is not possible to simply obtain the hydraulic characteristics caused by the local vegetation distribution from the characteristics of the overall vegetation hydraulic parameters [29]. This study aims to recognize the flow characteristics of open channels under the different arrangements (nine landscape vegetation arrangements in longitudinal, interleaved, and patch distribution patterns) of non-submerged rigid vegetation through the following steps: (1) Verifying the feasibility of the numerical simulation of open-channel flow based on Fluent by introducing open-channel experiments and numerical simulation methods. (2) Investigating the effect of vegetation layout on the vertical stress of water flow and material deposition and analyzing the flow hydraulic parameters of different vegetation arrangements under the influence of water depth. (3) Exploring the effect of vegetation layout on water flow resistance and flow structure and analyzing the hydraulic parameters of water flow under different vegetation arrangements.

2. Materials and Methods

2.1. Problem Definition and Geometry

According to the actual ecological landscape river, a numerical model of rectangular open-channel flow is constructed in proportion. Referring to the vegetation layout studied by Xu et al. [30], considering the distribution direction and the aggregation degree of landscape vegetation, 3 distribution patterns of longitudinal distribution, interleaved distribution, and patch distribution are simulated. In each distribution pattern of the test area, the vegetation is arranged from loose to agglomerate at the middle line l on the upper surface of water flow. Figure 1 shows the layout diagram of vegetation floor. The research area is 2.4 m long (Y direction) and 0.3 m wide (X direction). Y = 0 m → Y = 0.8 m is selected as the test area (The green part in Figure 1) and Y = 0.8 m → Y = 2.4 m (The blue part in Figure 1) as the wake area. According to the Y direction, it is evenly divided into 6 parts. To ensure that the vegetation density in each equal part of the test area is the same, 63 rigid rods (D = 0.01 m, H = 0.1 m) are placed in each equal part (0.3 m × 0.4 m) of the test area. The 9 landscape vegetation arrangements are named (a), (b), (c), (d), (e), (f), (g), (h) and (i). In the following text, the 9 landscape vegetation arrangements are defined and completely replaced by (a), (b), (c), (d), (e), (f), (g), (h) and (i).
As shown in Figure 1a–c, they are longitudinal distribution patterns, and the spacing of vegetation in the X direction decreases proportionally according to 30, 15 and 7.5; Figure 1d–f are the interleaved distribution patterns, and the spacing of vegetation in the X direction decreases proportionally according to 136, 68 and 34; Figure 1g–i are the patch distribution patterns, and the spacing of vegetation in the X direction decreases proportionally according to 150, 75 and 37.5.
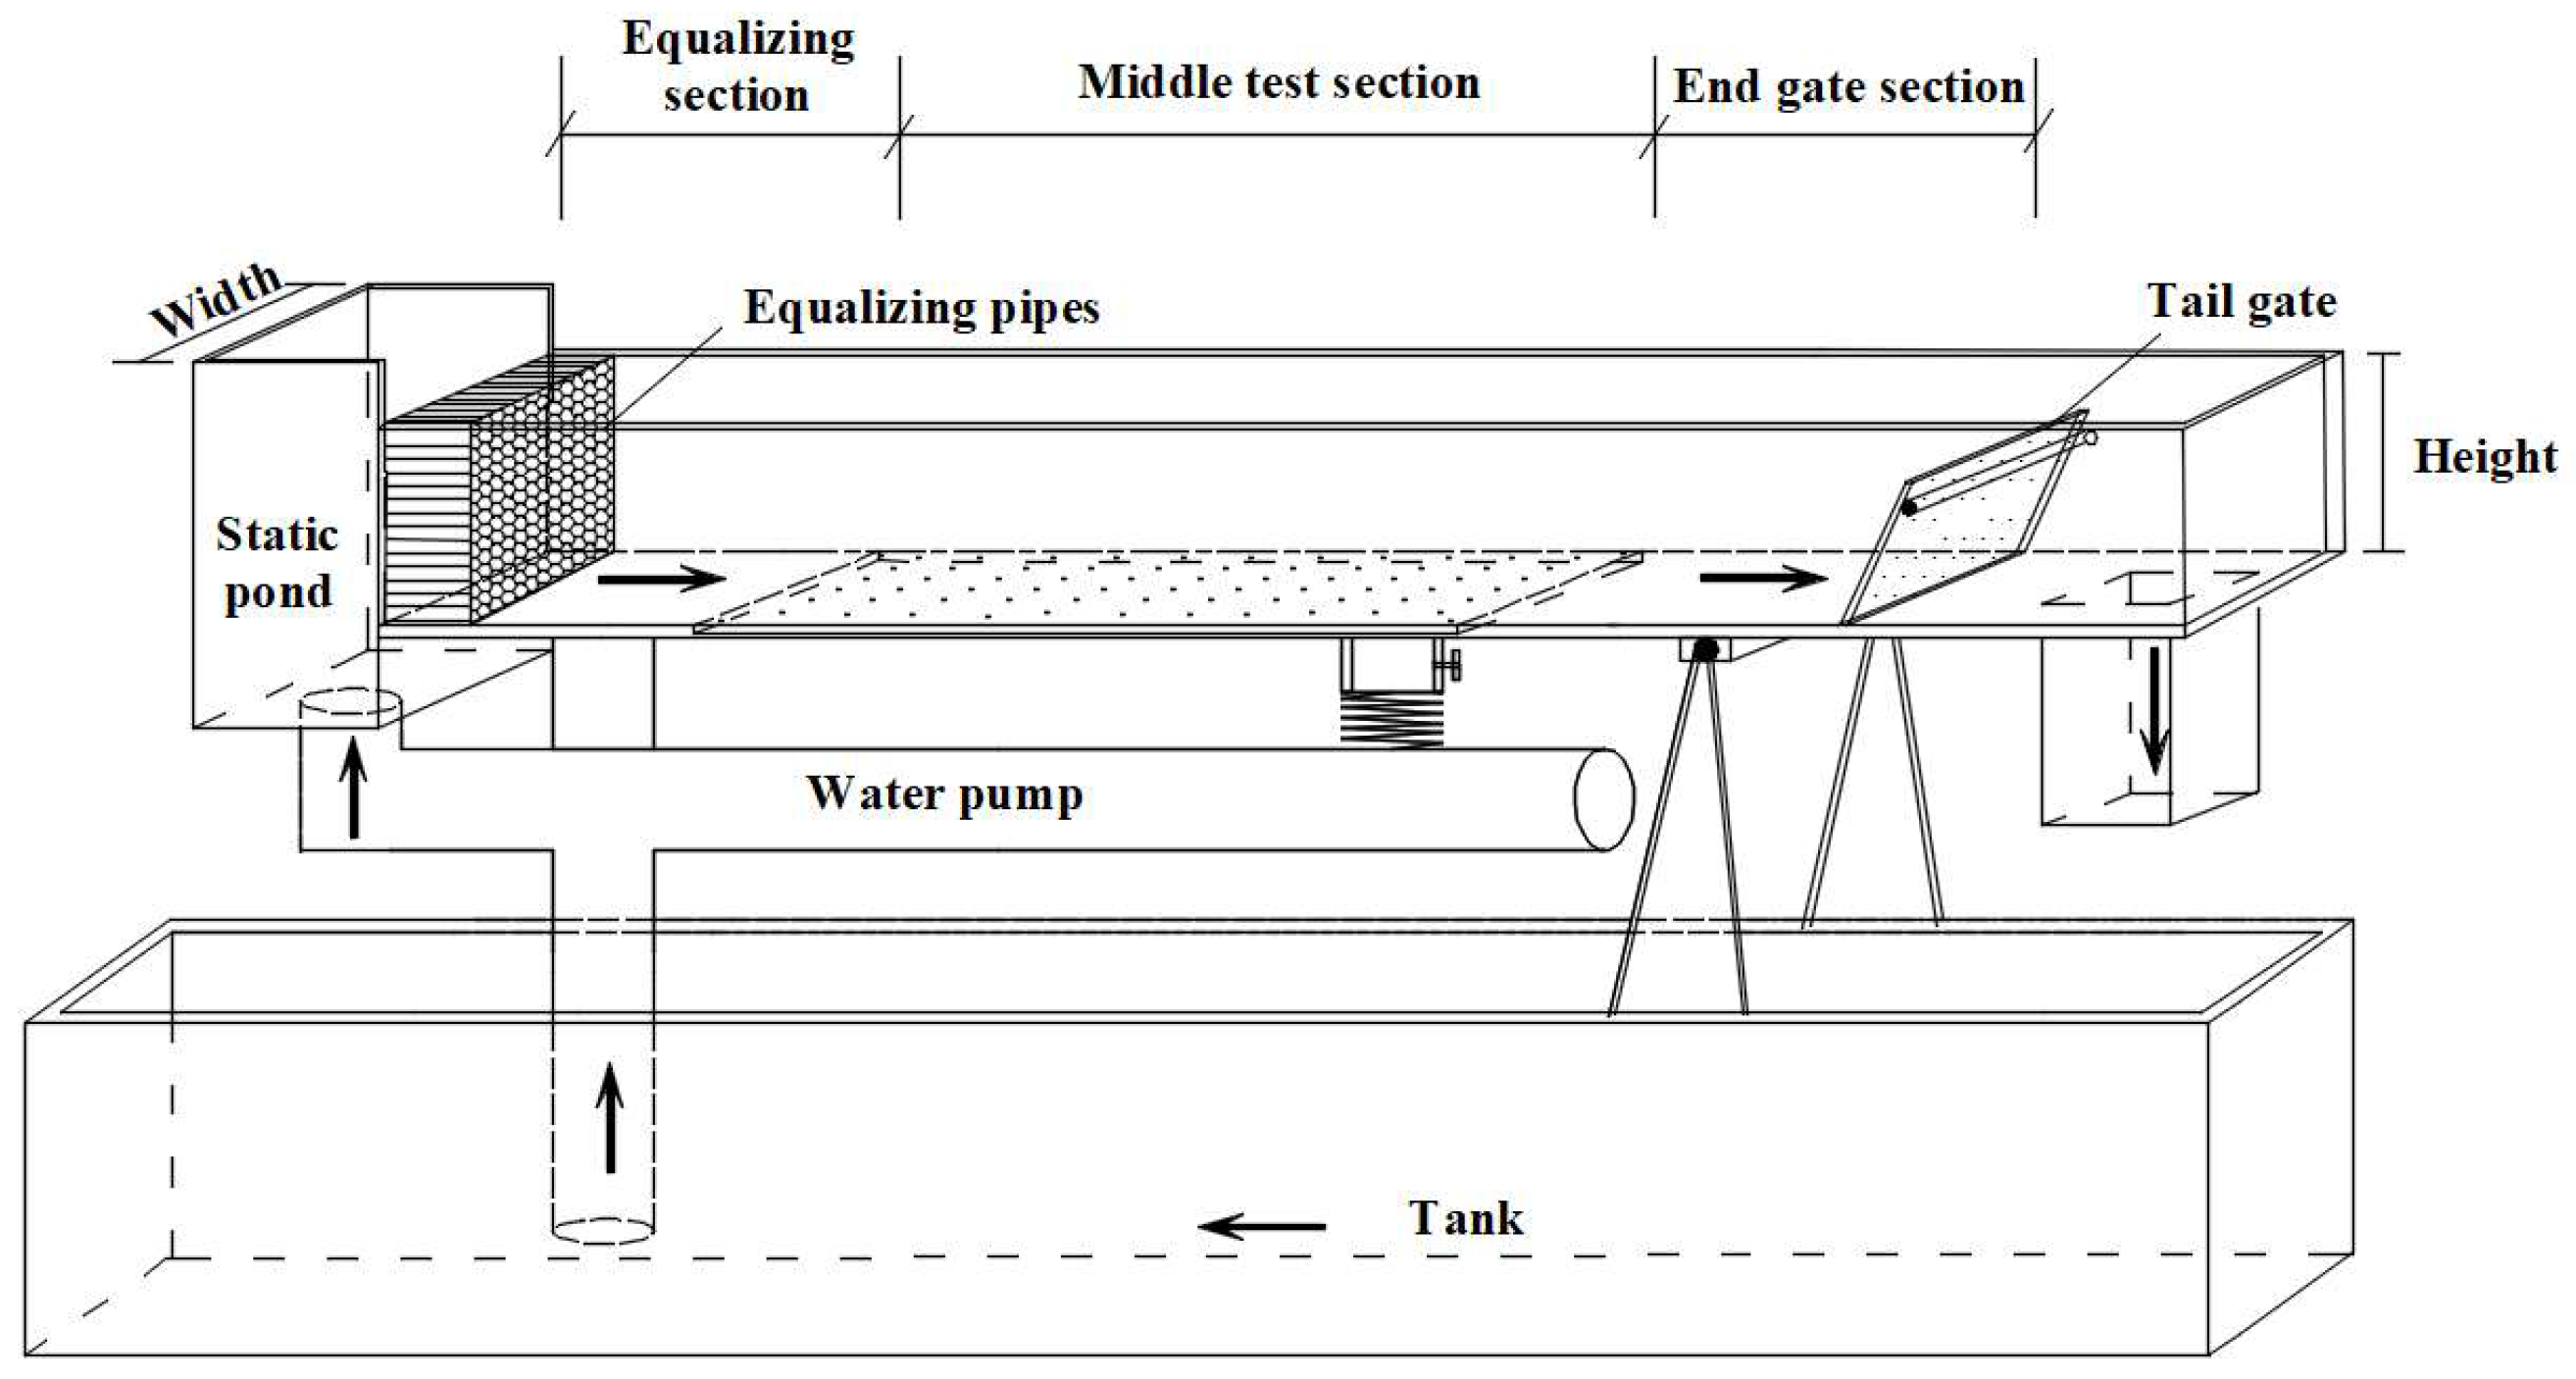
As shown in Figure 2, the slope is 0°, the rectangular cross-section is an open channel (Shihezi University), and the length, width and height are, respectively, 20 m, 0.6 m and 0.65 m. The flume is equipped with a water depth scale. It is divided into 3 parts: the equalizing section, the middle test area and end gate area. The middle test section is 2.4 m long (Y direction) and 0.3 m wide (X direction). The 9 landscape vegetation arrangements established in Figure 1 are selected for the middle test section. Considering that the flow rate in the landscape river is slow, under the condition of non-submerged vegetation, the flow rate is set to 30 m3/h, that is, 8.33 × 10⁻³m3/s. By adjusting the tailgate, when the water body is stable, it can be approximately regarded as a simplified model of a cuboid with a length of 2.4 m and a width of 0.3 m; at this time, the inlet velocity of the model is 0.23 m/s and the average water depth of the non-submerged surface is 0.09 m.
Therefore, based on the commercial CFD package Fluent, non-submerged rigid vegetation modeling is carried out in the computational domain with a slope of 0°, a length of 2.4 m (Y direction), a width of 0.3 m (X direction) and a height of 0.09 m (Z direction). Under the condition that the velocity inlet is 0.23 m/s, the corresponding position of the model is selected for hydraulic characteristic measurement. Figure 3 is a well-simulated numerical open-channel model. Set the line l (0.15, 0, 0.09) → (0.15, 2.4, 0.09) of the middle line of the upper surface, the vertical line Z1 (0.15, 0.4, 0) → (0.15, 0.4, 0.09) in the gap area of the test area and the vertical line Z2 (0.15, 0.6, 0) → (0.15, 0.6, 0.09) in the vegetation area of the test area as the required output data objects below.

2.2. Governing Equations and Boundary Conditions

The fluid mechanics simulation of the open channel is carried out using the commercial CFD package Fluent. First of all, to fully consider the development of water flow in a rectangular open channel, a multi-encrypted structured grid is employed. To meet the needs of both simulation accuracy and the maximum guarantee of calculation time, the grid division is made as uniform as possible, the mesh size is set to 0.01 and the number of generated mesh units reaches millions, with an average mesh quality of 0.8 and average grid skewness of 0.23. Secondly, the Reynolds stress model (RSM) is more likely to provide accurate predictions for complex flows as it takes into account the effects of streamlined curvature, vortex, rotation and rapid strain rate changes more strictly than single-equation and two-equation models. Therefore, the RSM is used [31]. Then, to simplify the experimental model of the open channel, a simplified model with only water is used. To simulate the slippery solid boundary of flow, the free water surface adopts a stable and easy-to-converge rigid cover assumption method, ignoring the water surface deformation. To ensure that the open-channel flow model is long enough to satisfy the vegetation model in the study area of stable flow, the calculation model based on RSM uses the symmetrical velocity inlet (0.23 m/s) and the symmetrical pressure outlet as boundary conditions. The surface and wall of the cylinder are set as non-slip solid wall boundaries [32]. Lastly, the simulation time should rely on the research area of the model and the number of grid results of the model to determine the final time step, Thus, the number of iteration steps is 3000, the minimum residual value is set to 1×10⁻⁵ and the calculated residual value is finally less than the minimum residual value and tends to be stable. The iteration ends and the model is correct [33].

2.3. Numerical Model Verification

Based on Section 2.1, a 3D Acoustic Doppler Velocimeter is used for measurement (ADV: The measurement probe consists of three 10 MHz receiving probes and one transmitting probe. The connection between the receiving probe and the water body is established and data are transmitted) [34]. Based on Section 2.2, Fluent is used for output. Both methods select the middle vertical line Z1 (0.15, 0.4, 0) → (0.15, 0.4, 0.09) of the model to measure the hydraulic characteristics for verification.
For the velocity measurement method of the open-channel experiment and Fluent numerical simulation data output, the 9 landscape vegetation arrangements under 3 distribution patterns are utilized to compare the relationship between water depth and flow velocity and analyze the flow pattern of the middle vertical line Z1 (0.15, 0.4, 0) → (0.15, 0.4, 0.09) of the test area (see Figure 1). From Figure 3, the results of flow velocity v and water depth h under 9 kinds of landscape vegetation arrangements, the flow velocity conforms to the ‘J’-shape distribution [35,36], and the experimental and numerical results are generally similar with an error of about 5.69% on average (see Table 1), which may be due to simplification of the modeling or the inevitable measurement error of the experiment. At the same water depth, as the vegetation arrangement tends to be close to the middle line l of the model, that is, following the law of vegetation spreading to the middle line from diffusion to agglomeration, the flow velocity decreases.

3. Results

3.1. Reynolds Stress in the Gap Area and the Vegetation Area under the Influence of Water Depth

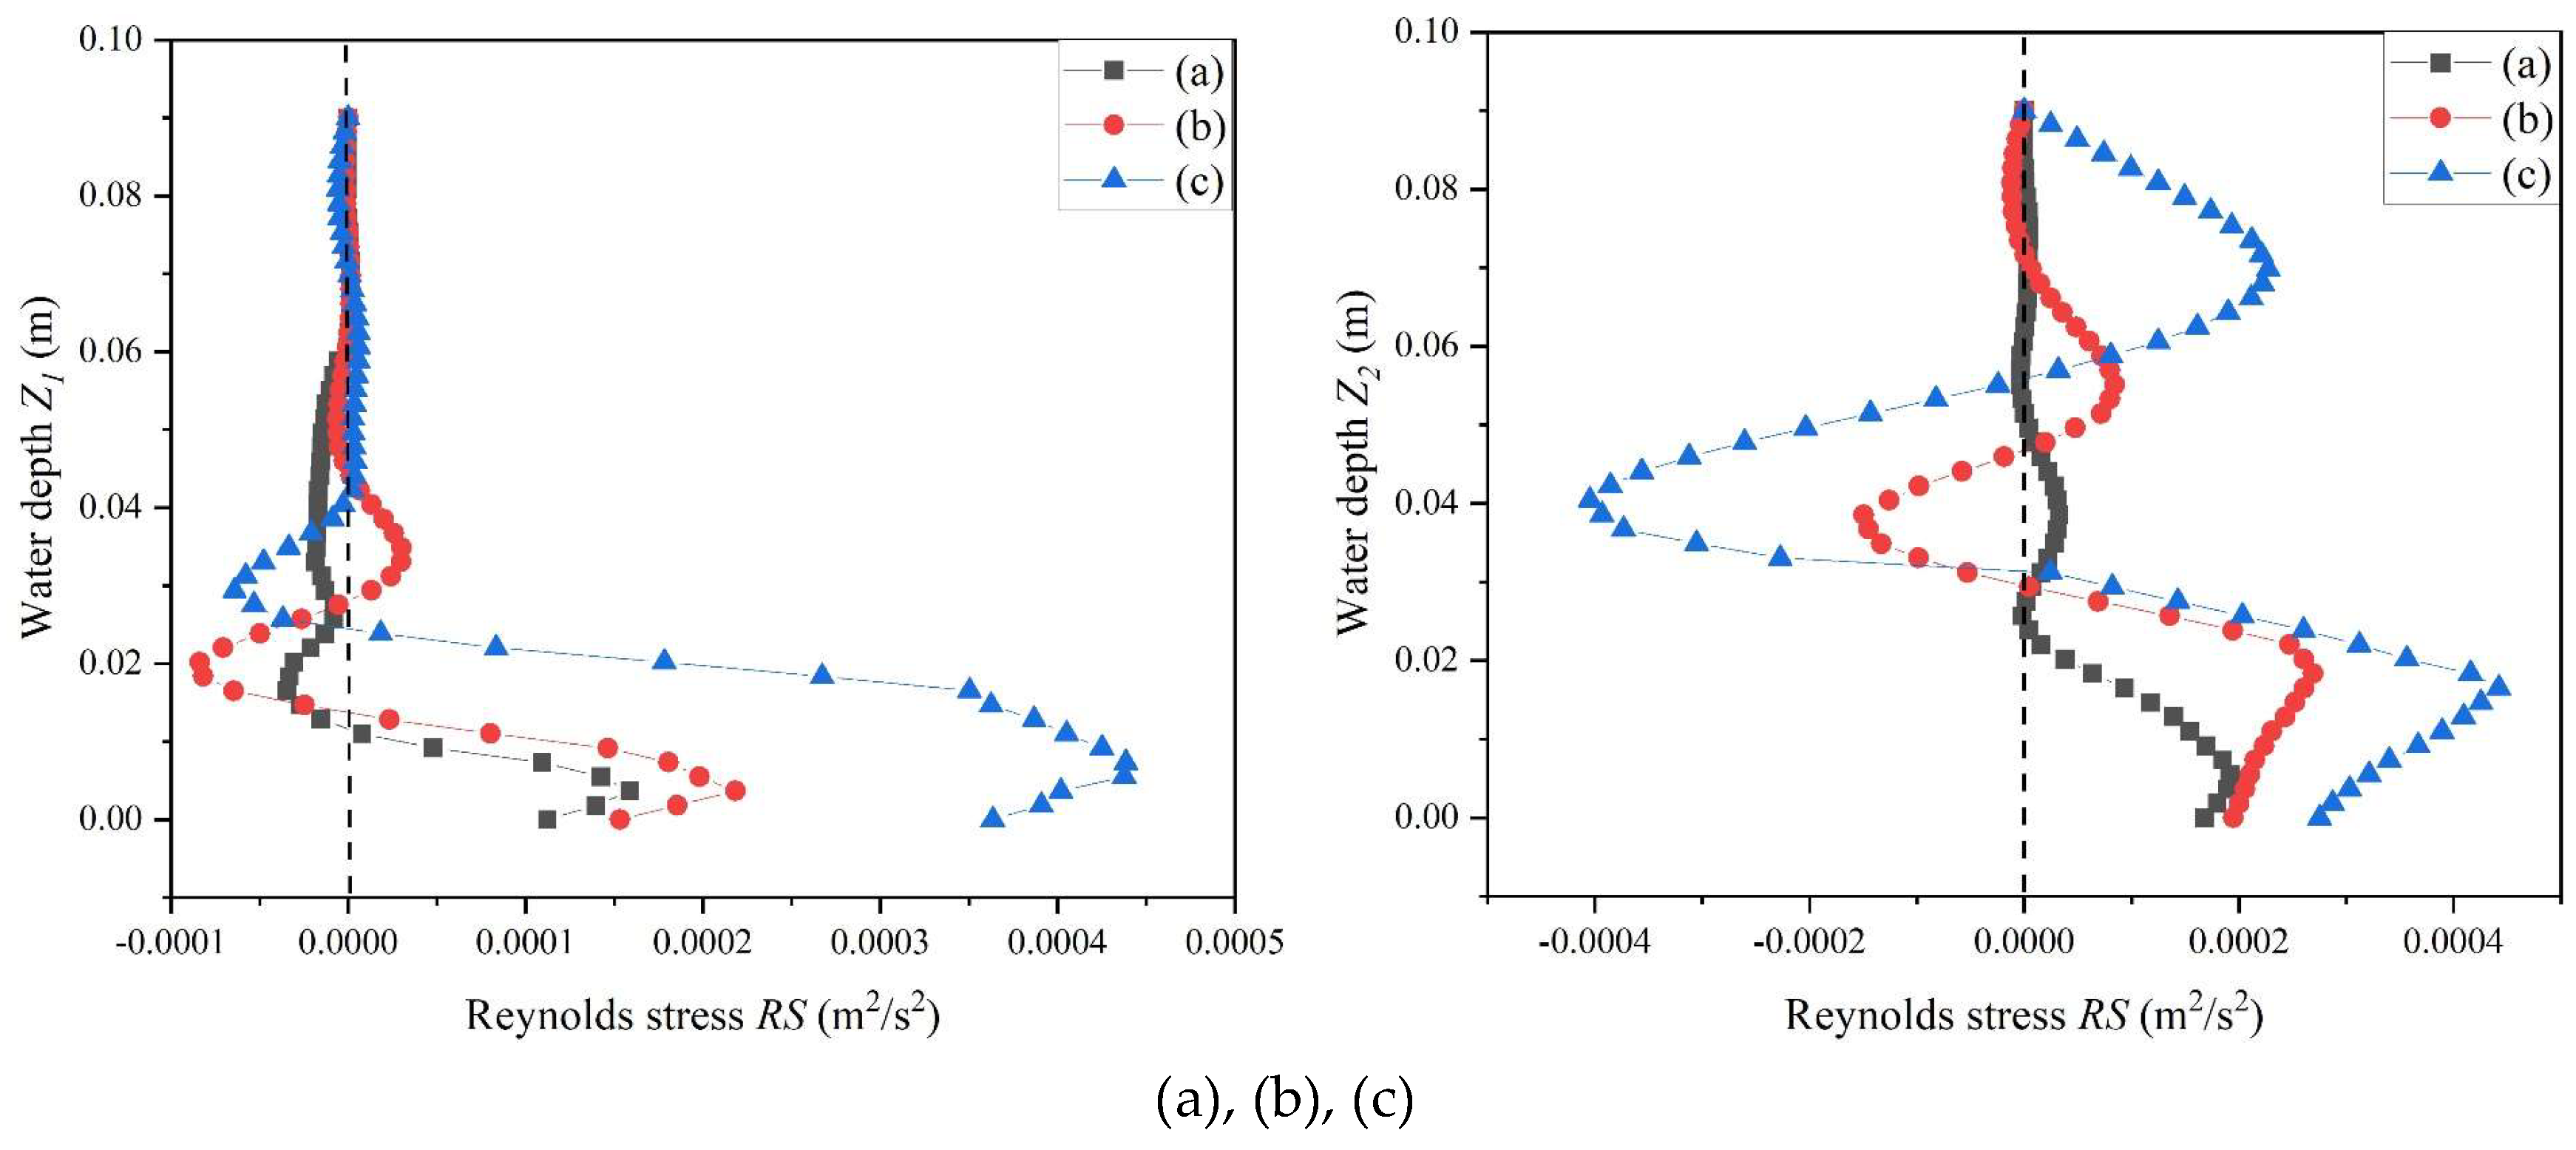
Reynolds stress is the shear stress generated by the exchange of turbulent water masses between flow layers, it can reflect the inhomogeneity of flow velocity. The larger its value, the more uneven the spatial distribution of flow velocity and the more intense the turbulence intensity in this area [37]. It is an important parameter for studying the hydraulic characteristics of vegetated channel. The position of the vertical line Z1 in the gap area and the position of the vertical line Z2 in the vegetation area are selected (see Figure 1).
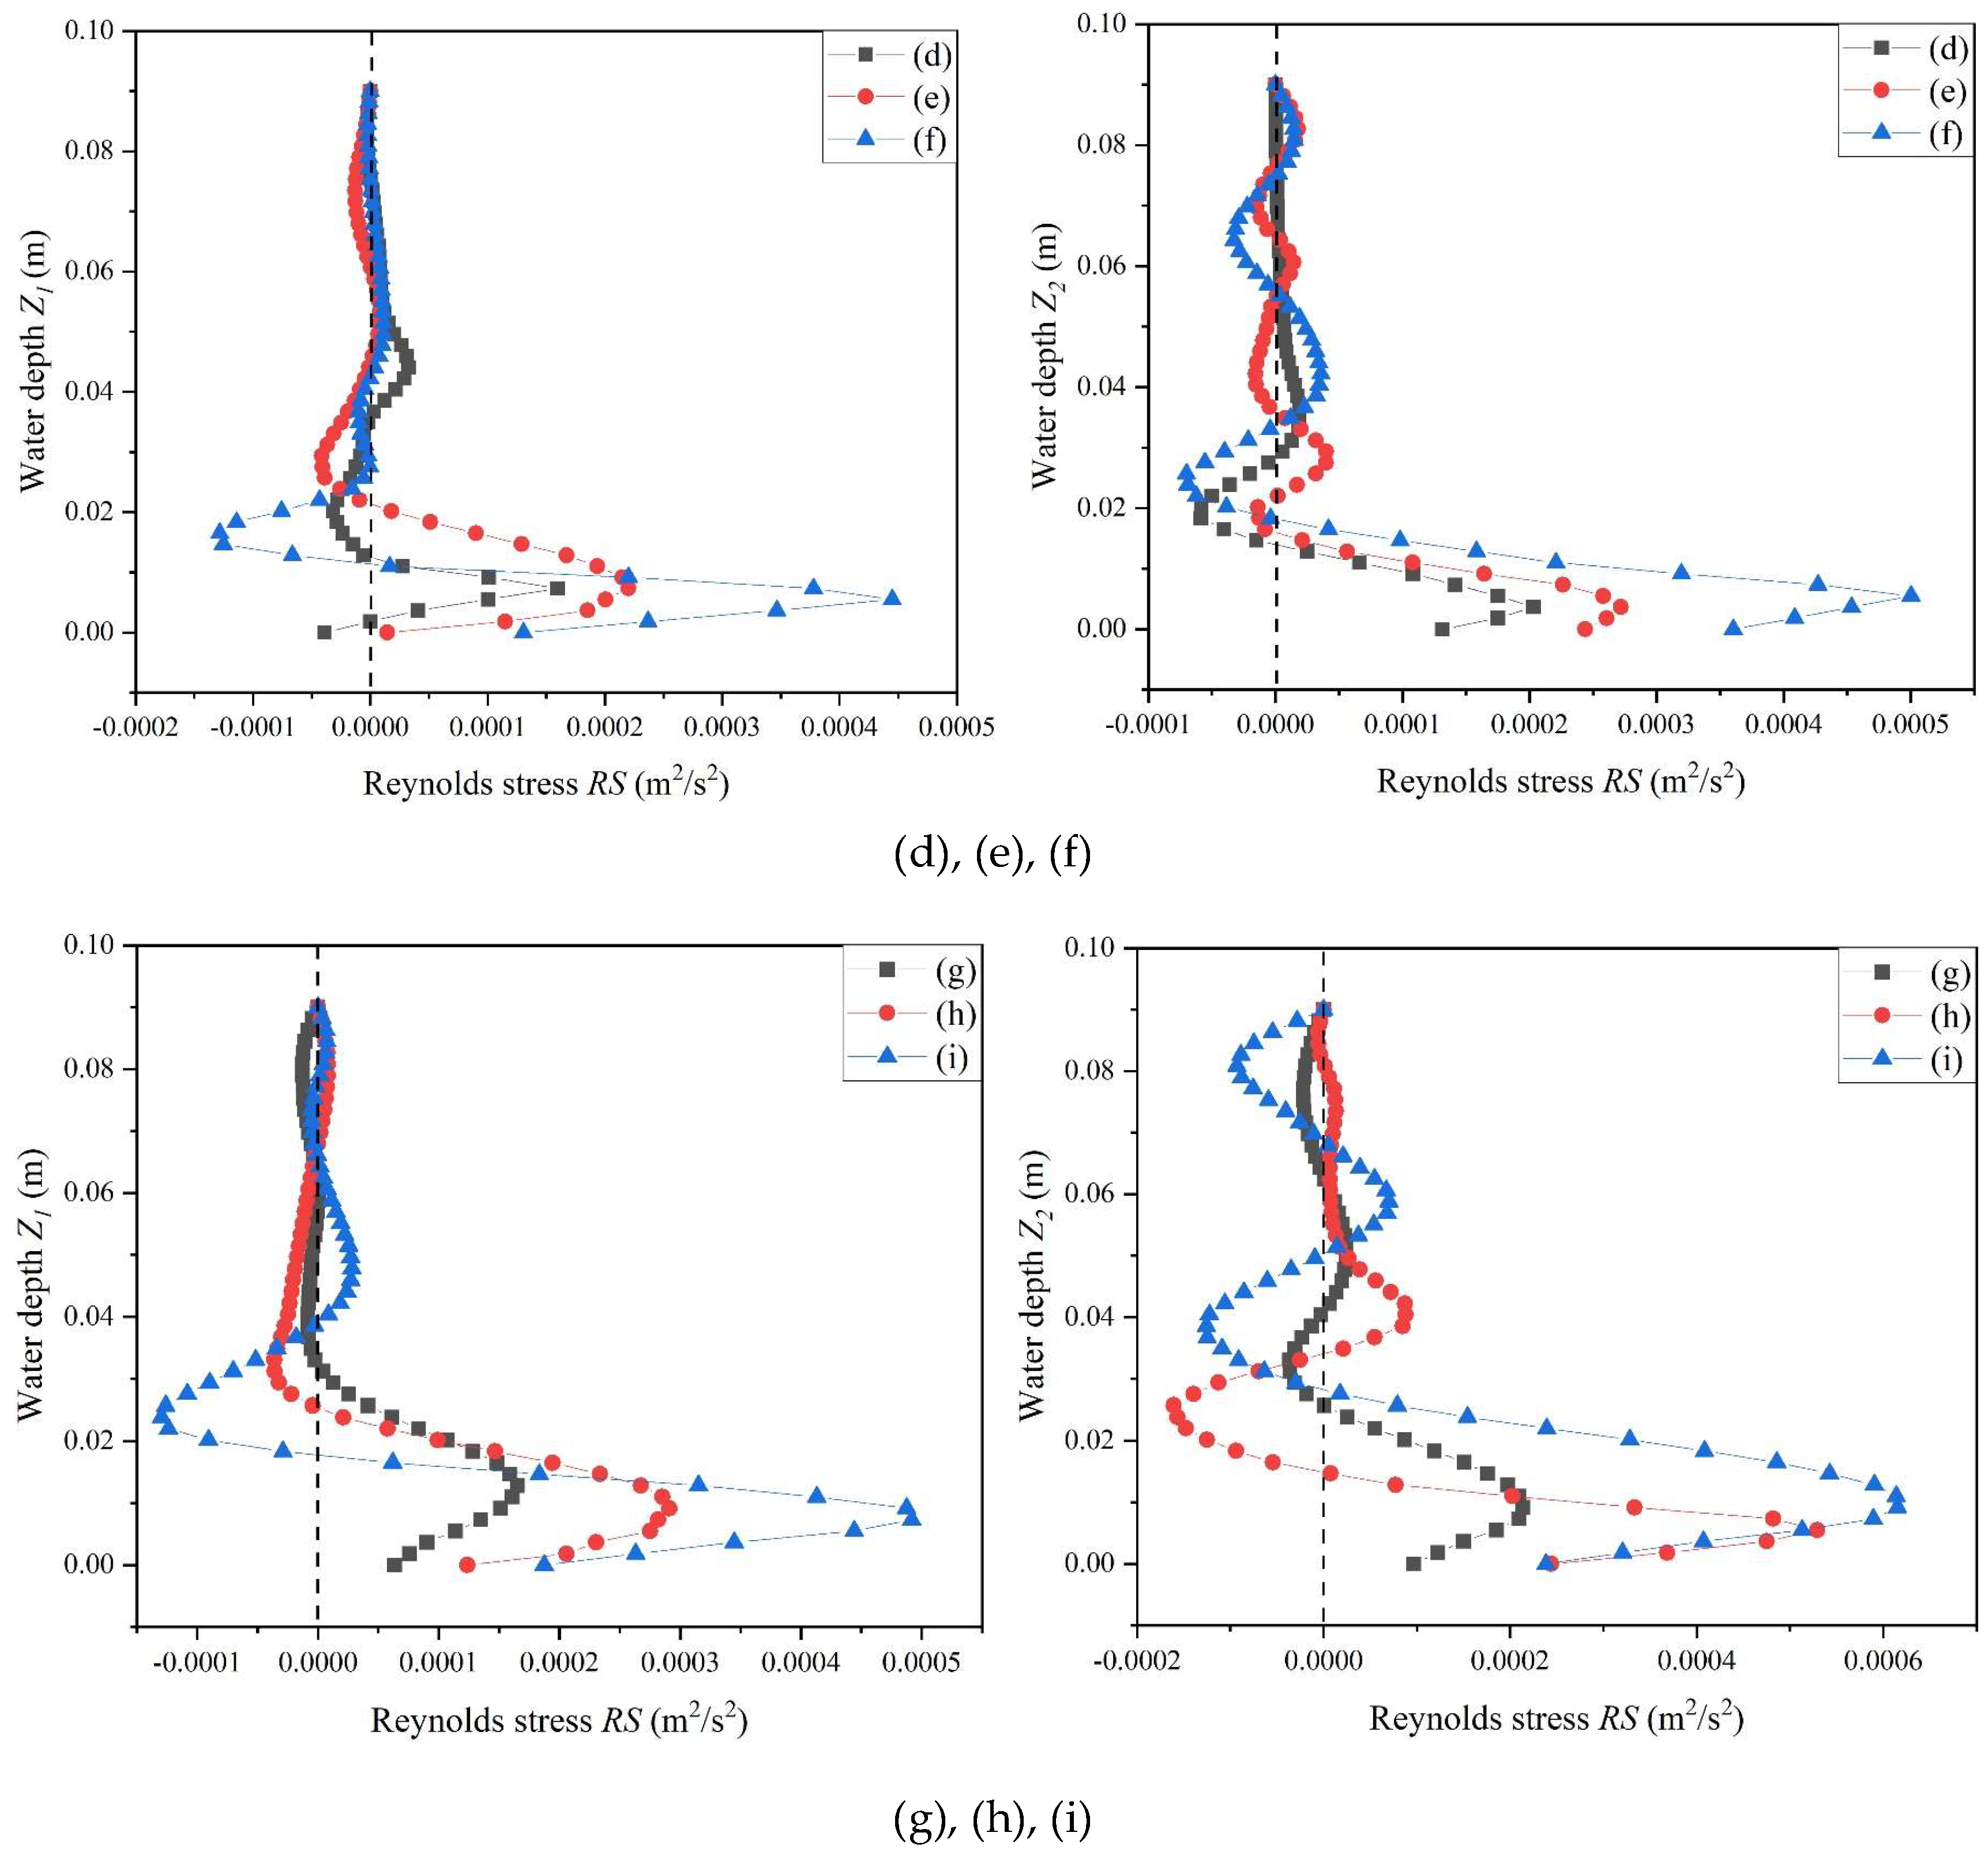
As shown in Figure 4, when the water depth is greater than 0.04 m (vegetation inundation degree Z/H > 2/5), vegetation patch coverage, water depth and specific location have little influence on Reynolds stress in Rs-Z1 of the gap area, and Reynolds stress is basically 0. However, in Rs-Z2 of the vegetation area, there are many data points of such negative Reynolds stress; this is due to the shielding effect of the vegetation area [38], but it still meets the condition of having the maximum Reynolds stress at the bottom of the water flow. When the vegetation inundation degree is less than 2/5, the Reynolds stress fluctuates with vegetation coverage, water depth and location due to the resistance shear force generated at the bottom of the riverbed. For the vegetation area, the Reynolds stress in the vegetation area and the gap area has a similar variation law with water depth, that is, when the vegetation inundation degree is less than 2/5, the Reynolds stress first increases and then decreases with the increase in water depth [39]. When the vegetation inundation degree is close to the bottom of the water flow, the Reynolds stress reaches the extreme point. The maximum Reynolds stress data statistics are shown in Table 2.
Under each distribution pattern, both the vegetation area and the gap area produce the maximum Reynolds stress at the bottom of the water flow, that is, there is intense turbulence at the bottom of the water flow [40]. The maximum Reynolds stress value of the vegetation area is greater than that of the gap area [41]. For the longitudinal vegetation arrangement (a), (b), (c), the maximum Reynolds stress is in the order of Rs(a) < Rs(b) < Rs(c); for the staggered vegetation arrangement (d), (e), (f), it is Rs(d) < Rs(e) < Rs(f); and for the patch vegetation arrangement (g), (h), (i), it is Rs(g) < Rs(h) < Rs(i) [42]. As the vegetation arrangement tends to follow the law close to the layout of the research center line, from Table 2, (a), (d) and (g) are the most dispersed states of the research middle line; (c), (f) and (i) are the most concentrated states; the maximum Reynolds stress of (a), (d), (g), (b), (e), (h) and (c), (f), (i) increases from small to large. This indicates that the influence of the distribution pattern on the turbulence at the bottom of the flow from large to small is patch distribution pattern > interlaced distribution pattern > longitudinal distribution pattern. The maximum Reynolds stress at the vertical line in the gap area and the vertical line in the vegetation area increases from small to large as the vegetation arrangement tends to be close to the research center line arrangement. This indicates that as the vegetation arrangement near the research center line l changes from loose to agglomerated, the turbulence at the bottom of the water flow is greater.

3.2. Analysis of the Surface Hydraulic Characteristics of Non-Submerged Rigid Vegetation

By observing the surface velocity field of water flow, the influence of vegetation distribution on the surface velocity of water flow are discussed, which is helpful for people to understand the mechanism of stagnant flow [43]. Fluent can calculate the instantaneous flow field; as shown in Figure 5, they are the upper surface velocity distribution of longitudinal vegetation arrangement (a), (b), (c), interlaced vegetation arrangement (d), (e), (f) and patch vegetation arrangement (g), (h), (i).
According to the above depiction of the flow velocity, the water surface is basically in a turbulent flow state; further study can be conducted on the momentum and energy exchange between the fluid media on the water surface [44]. Fluent can calculate the instantaneous turbulent kinetic energy; therefore, its numerical simulation is used to simulate the turbulent kinetic energy on the upper surface of the non-submerged vegetation flow in the open channel [45]. Figure 6 shows the turbulent kinetic energy distribution of the longitudinal vegetation arrangement (a), (b), (c), the staggered vegetation arrangement (d), (e), (f) and the patch vegetation arrangement (g), (h), (i).
A cloud atlas of water surface velocity and water surface turbulent kinetic energy under nine landscape vegetation arrangements was created. With the increase in the degree of vegetation aggregation taking the middle line l as the research object, for (a), (b), (c), the main influencing objects of incoming flow and flow through vegetation are mainly changed from single plant to vegetation communities; for (d), (e), (f), the main influencing objects of incoming flow and flow through vegetation are mainly affected by longitudinal shrinkage vegetation and transverse extrusion vegetation; for (g), (h), (i), the main influencing objects of incoming flow and flow through vegetation are mainly affected by the distribution form and fragmentation degree of the patch.
Through comparative analysis of the nine vegetation arrangements, in the test area, the flow velocity in the vegetation area is smaller than that in the gap area, and the turbulent kinetic energy of the vegetation area is larger than that in the gap area [46]; in the wake area, as the water flow advances, all vegetation arrangements gradually tend to be close to the stable value of the initial velocity, and the surface turbulent kinetic energy gradually tends to be close to a stable value. The more compact the vegetation arrangement is, the more the connectivity of runoff is destroyed, the more the zigzag degree of the runoff path is increased and the greater the difficulty of reaching the target area, thus promoting the energy exchange between the vegetation area and non-vegetation channel area [47].

4. Discussion

4.1. Analysis of Flow Hydraulic Parameters under the Influence of Water Depth for Different Vegetation Arrangements

The sharp spatial change in Reynolds stress affects the dynamics of sediments [48]. From Figure 3 and Figure 4 and Table 2, the Reynolds stress can reflect the non-uniformity of velocity in the flow field. The greater the Reynolds stress is, the more uneven the velocity distribution in the area is and the more intense the turbulence intensity is. This leads to a strong shear layer, mass and momentum exchange and the enhanced vertical transport of momentum. Stronger vertical transport accelerates sediment deposition; therefore, larger sediment particles tend to deposit in the gap area, while smaller sediments tend to deposit in the vegetation area. The deposition capacity is patch distribution pattern > interlaced distribution pattern > longitudinal distribution pattern.

4.2. Analysis of Hydraulic Parameters of Water Flow under the Influence of Different Arrangements of Vegetation along the Way

Based on Fluent numerical simulation, the flow velocity contours and the turbulent kinetic energy contours of the upper surface are output in the model region (Y = 0 m → Y = 2.4 m). For the same vegetation arrangement, there is obvious variation in the test area and the wake area. Meanwhile, as the vegetation arrangement tends to be close to the law of the midline layout in the study, the flow velocity and the turbulent kinetic energy changes significantly. Therefore, taking l as the research center line, the following comparative analysis is carried out.
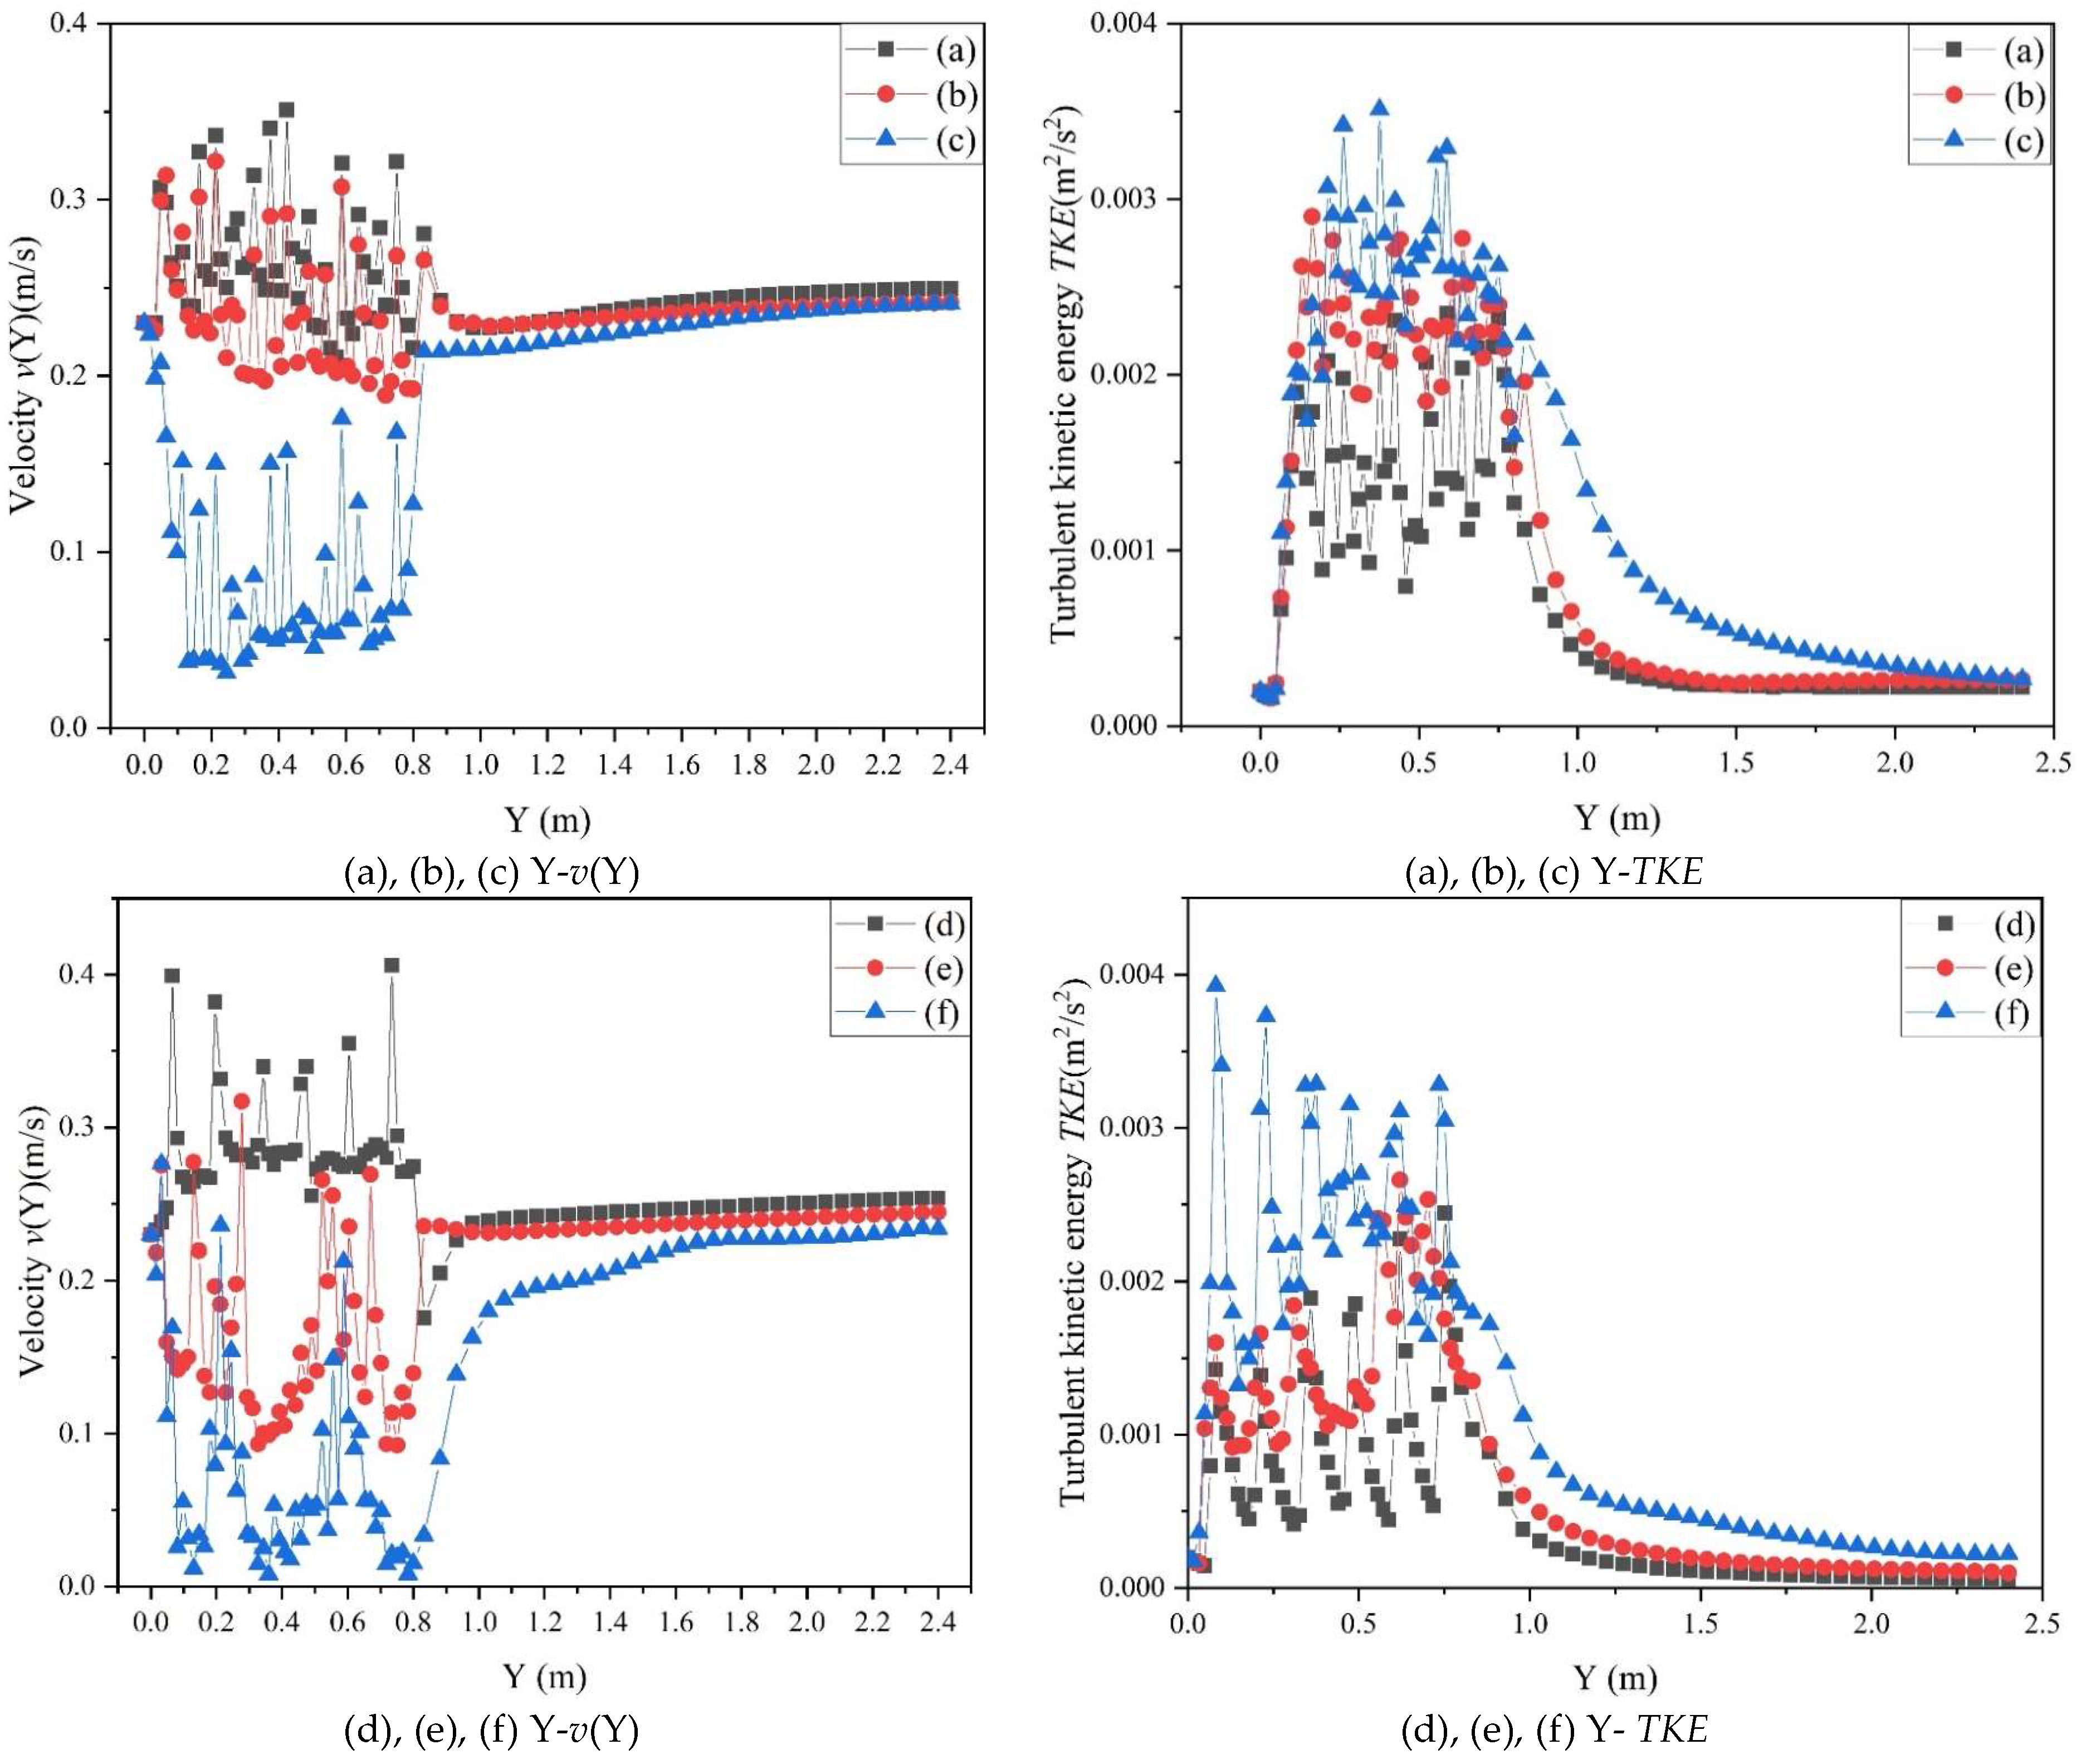
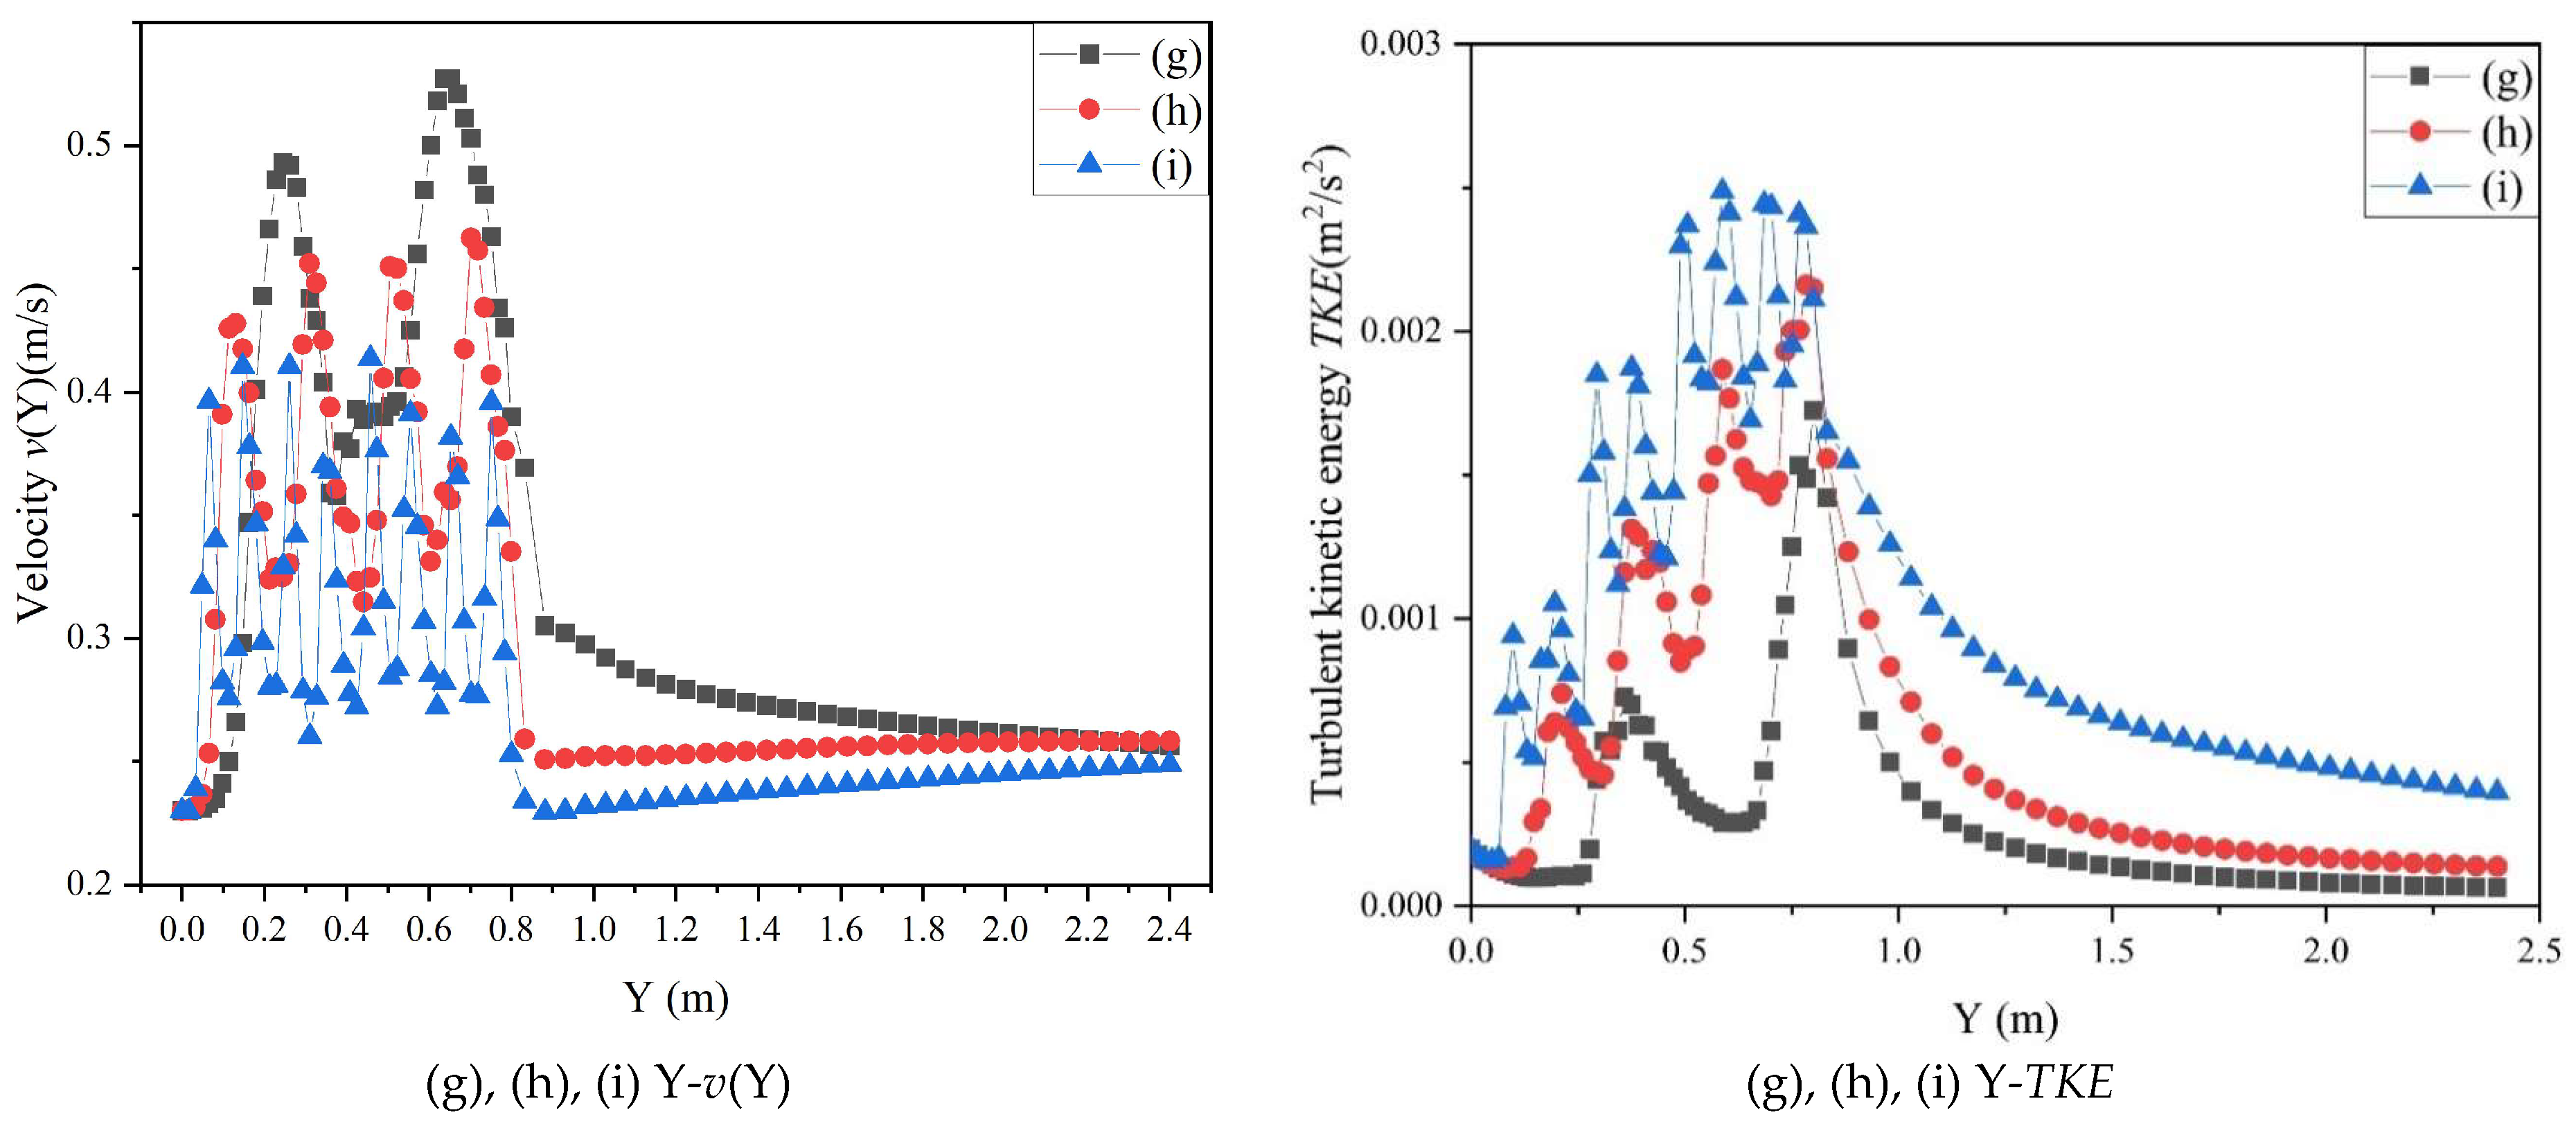
Based on the aforementioned research, the surface velocity and turbulent kinetic energy of water flow in the test area are calculated; this includes the velocity distribution and turbulent kinetic energy distribution of the longitudinal distribution (a), (b), (c), the interlaced distribution (d), (e), (f) and the patch distribution (g), (h), (i). Based on the above research, the middle line l of the upper surface in the experimental area is selected to generate Y-v (Y) data and Y-TKE data to create the relationship curve, as shown in Figure 7.
According to the above Y-v(Y) and Y-TKE relationship curve, the flow resistance is influenced by the distribution of vegetation [49]. For the test area (Y = 0 m → Y = 0.8 m), v(Y) has a zigzag distribution and its velocity is significantly lower than that in the gap area; meanwhile, TKE also has a zigzag distribution and its turbulent kinetic energy is significantly higher than that in the gap area. This causes the vegetation area to form a turbulent area with alternating high and low levels along the longitudinal section. Therefore, the velocity v1 and turbulent kinetic energy TKE1 at the midpoint (0.15, 0.4, 0.09) along the way are taken, with 1 and 2 in the gap area, as the research object, and the velocity v2 and turbulent kinetic energy TKE2 at the midpoint (0.15, 0.6, 0.09) in the vegetation area are taken. For the wake area (Y = 0.8 m → Y = 2.4 m), generally, v shows an increasing trend, while TKE shows a decreasing trend. Thus, the v3 and TKE3 of the steady values of the velocity and turbulent kinetic energy of the water flow in the wake area are compared and analyzed [50]. From the above relationship curve, the relevant hydraulic parameters of the test area and the wake area are output as shown in Table 3.
For the longitudinal vegetation arrangement (a), (b), (c), interlaced vegetation arrangement (d), (e), (f) and patch vegetation arrangement (g), (h), (i) of nine arrangements, as the vegetation arrangement approaches the middle line l of the study, in the test area, the flow velocity v decreases overall; in the wake area, the flow velocity increases along the flow direction and finally tends to a stable value: v3 (a) = 0.2570 > v3 (b) = 0.2500 > v3 (c) = 0.2420; v3 (d) = 0.2535 > v3 (e) = 0.2482 > v3 (f) = 0.2416; v3 (g) = 0.2420 > v3 (h) = 0.2416 > v3 (i) = 0.2408. The turbulent kinetic energy in the vegetation area is larger than that in the gap area. As the vegetation arrangement tends to follow the law of the middle line layout, in the test area, the turbulent kinetic energy increases overall. In the wake area, the turbulent kinetic energy decreases along the flow direction and finally tends to a stable value: TKE3 (a) = 5.55 × 10⁻⁵ < TKE3 (b) = 1.04 × 10⁻⁴ < TKE3 (c) = 2.0 × 10⁻⁴; TKE3 (d) = 5.70 × 10⁻⁵ < TKE3 (e) = 1.45 × 10⁻⁴ < TKE3 (f) = 2.24 × 10⁻⁴; TKE3 (g) = 2.22 × 10⁻⁴ < TKE3 (h) = 2.64 × 10⁻⁴ < TKE3 (i) = 2.90 × 10⁻⁴.
Arrangements (a), (d) and (g) represent the loosest state with respect to the research middle line l, while arrangements (c), (f) and (i) represent the most concentrated state. As shown in Table 3, as the vegetation distribution tends to approach the distribution pattern of the study middle line l, in the comparative analysis of v1, TKE1, v2, TKE2 in the region along (a), (d), (g), (b), (e), (h) and (c), (f), (i), as well as stable v3 and stable TKE3 in the wake area (a), (d), (g) → (c), (f), (i), the flow velocity becomes smaller and smaller, the turbulent kinetic energy becomes larger and larger, the turbulence intensity of the water body is intensified and the resistance is increased [51]. This shows that the influence of the distribution pattern on the flow resistance of the non-submerged upper surface is in ascending order: longitudinal distribution pattern < interlaced distribution pattern < patch distribution pattern.

5. Conclusions

In this study, the three-dimensional Reynolds stress model of Fluent was employed for a numerical simulation to model the landscape ecological river channel with three planting distribution patterns, which were fragmented into nine landscape vegetation arrangements. The applicability of the model was verified through indoor open-channel tests, and the changes in its flow structure characteristics were explored. The main conclusions are as follows:
(1) The relationship between velocity and water depth at the model line Z1 of nine kinds of landscape vegetation arrangements is in good accordance. Thus, the open-channel experiment and numerical simulation based on Fluent verify its feasibility.
(2) With the increase in water depth, the flow of landscape vegetation arrangement generates turbulence in the lower half of the water depth, and the maximum Reynolds stress is generated at the bottom of the water flow. At the same water depth, when the same vegetation pattern changes from loose to concentrated following the law of the study central line l, the flow velocity decreases, the Reynolds stress becomes greater and the flow resistance increases to achieve the purpose of blocking water. For the same loose type (a), (d), (g) to the same aggregation type (c), (f), (i), the maximum Reynolds stress value from large to small is patch distribution pattern > interlaced distribution pattern > longitudinal distribution pattern. The greater the Reynolds stress, the stronger the shear layer, contributing to turbulence, generating mass and momentum exchange and enhancing the vertical transport of momentum. Therefore, under the same vegetation density, the deposition capacity from large to small is patch distribution pattern > interlaced distribution pattern > longitudinal distribution pattern.
(3) The upper surface of non-submerged vegetation is characterized by slow turbulence. Whether it is the same distribution pattern or the same aggregation type, it also corresponds to the basic law of flow field along the way. This shows that the influence of the distribution pattern on the flow resistance of the non-submerged upper surface is in descending order: patch distribution pattern > interlaced distribution pattern > longitudinal distribution pattern. The restriction of the vegetation solid boundary on the water flow increases, and the inertia force of the water body decreases, which is beneficial for preventing excessive scouring of the water flow surface.
(4) By comparing and analyzing the hydraulic characteristic parameters of the vegetation area and the gap area, it is concluded that the flow velocity in the vegetation area is small, which can better block water. The Reynolds stress at the bottom of the water flow in the vegetation area is larger, forming a strong shear layer, thereby promoting energy exchange, making the turbulent kinetic energy larger and enhancing the turbulence. Larger sediment particles tend to deposit in the gap area, while smaller sediments tend to deposit in the vegetation area. At the same time, the gap area is more prone to deposition than the vegetation area.
(5) By comparing and analyzing the influence of the entire water flow on the wake, it is found that for the same vegetation pattern, as it changes from loose to agglomerated following the law of the central line l, it is more conducive to blocking water. Among the same aggregation types, the patch distribution pattern has the best water blocking effect, followed by the interlaced distribution pattern, and finally, the longitudinal distribution pattern.
In summary, during the process of ecological civilization construction, artificial vegetation is planted in the surface flow wetland of the designated area, and the reasonable layout of the landscape vegetation pattern under the same density and different degrees of aggregation of the same landscape vegetation pattern can make a significant contribution to the literature because as it can provide theoretical support for the application of optimal vegetation arrangement in the construction of ecological landscape river channels. It should be noted that this paper only selected representative vegetation distribution characteristics for research; however, the distribution forms and growth states of vegetation in actual landscape river channels are diverse and complex, and this study is insufficient to fully reflect the vegetation flow in real ecological landscape river channels.

Author Contributions

Writing—review and editing, W.W.; supervision, J.Z. and T.X.; funding acquisition, A.L. and X.L. All authors have read and agreed to the published version of the manuscript.

Funding

This research was funded by the National Natural Science Foundation of China, grant number “No. 52379020”.

Data Availability Statement

The data presented in this study are available on request from the first author, and the authors confirm that the data supporting the findings of this study are available within the article. If the supplementary materials are required, please contact the first author, Wenjun Wang: [email protected].

Acknowledgments

We would like to thank the National Natural Science Foundation of China for their financial support (no. 52379020).

Conflicts of Interest

The authors declare no conflicts of interest.

References

  1. Curran, J.C.; Hession, W.C. Vegetative impacts on hydraulics and sediment processes across the fluvial system. J. Hydrol. 2013, 505, 364–376. [Google Scholar] [CrossRef]
  2. Uijttewaal, W.S.J.; Truong, S.H. Transverse momentum exchange induced by large coherent structures in a vegetated compound channel. Water Resour. Res. 2019, 55, 589–612. [Google Scholar]
  3. Chen, X.; Taylor, A.R.; Reich, P.B.; Hisano, M.; Chen, H.Y.H.; Chang, S.X. Tree diversity increases decadal forest soil carbon and nitrogen accrual. Nature 2023, 618, 94–101. [Google Scholar] [CrossRef] [PubMed]
  4. Fathi-Moghadam, M.; Kashefipour, M.; Ebrahimi, N.; Emamgholizadeh, S. Physical and numerical modeling of submerged vegetation roughness in rivers and flood plains. J. Hydrol. Eng. 2011, 16, 858–864. [Google Scholar] [CrossRef]
  5. Temmerman, S.; Meire, P.; Bouma, T.J.; Herman, P.M.J.; Ysebaert, T.; Vriend, H.J.D. Ecosystem-based coastal defence in the face of global change. Nature 2013, 504, 79–83. [Google Scholar] [CrossRef] [PubMed]
  6. Grabowski, R.C.; Surian, N.; Gurnell, A.M. Characterizing geomorphological change to support sustainable river restoration and management. WIREs Water 2014, 1, 483–512. [Google Scholar] [CrossRef]
  7. Zdankus, N.; Punys, P.; Martinaitis, E.; Zdankus, T. Lowland river flow control by an artificial water plant system. River Res. Appl. 2016, 32, 1382–1391. [Google Scholar] [CrossRef]
  8. D’Ippolito, A.; Calomino, F.; Penna, N.; Dey, S.; Gaudio, R. Simulation of accelerated subcritical flow profiles in an open channel with emergent rigid vegetation. Appl. Sci. 2022, 12, 6960. [Google Scholar] [CrossRef]
  9. Yang, J.Q. Solute flow and particle transport in aquatic ecosystems: A review on the effect of emergent and rigid vegetation. Env. Sci. Ecotechnol. 2024, 21, 100429. [Google Scholar] [CrossRef]
  10. Yang, L.F.; Fang, H.Z.; Yang, Z.H.; Huai, W.X. Longitudinal dispersive coefficient in channels with aquatic vegetation: A review. J. Hydrodyn. 2023, 35, 379–395. [Google Scholar] [CrossRef]
  11. Huai, W.X.; Li, S.; Katul, G.G.; Liu, M.Y.; Yang, Z.H. Flow dynamics and sediment transport in vegetated rivers: A review. J. Hydrodyn. 2021, 33, 400–420. [Google Scholar] [CrossRef]
  12. Nepf, H.M. Hydrodynamics of vegetated channels. J. Hydraul. Res. 2012, 50, 262–279. [Google Scholar] [CrossRef]
  13. Aberle, J.; Järvelä, J. Flow resistance of emergent rigid and flexible floodplain vegetation. J. Hydraul. Res. 2013, 51, 33–45. [Google Scholar] [CrossRef]
  14. Boothroyd, R.J.; Hardy, R.J.; Warburton, J.; Marjoribanks, T.I. Modeling complex flow structures and drag around a submerged plant of varied posture. Water Resour. Res. 2017, 53, 2877–2901. [Google Scholar] [CrossRef]
  15. Rominger, J.T.; Nepf, H.M. Flow adjustment and interior flow associated with a rectangular porous obstruction. J. Fluid. Mech. 2011, 680, 636–659. [Google Scholar] [CrossRef]
  16. Velísková, Y.; Dulovičová, R.; Schügerl, R. Impact of vegetation on flow in a lowland stream during the growing season. Biologia 2017, 72, 840–846. [Google Scholar] [CrossRef]
  17. Jørgensen, S.E. Application of ecological engineering principles in lake management. Lakes Reserv. Res. Manag. 2006, 11, 103–109. [Google Scholar] [CrossRef]
  18. Zhang, G.; Liu, G.; Zhang, P.; Yi, L. Influence of vegetation parameters on runoff and sediment characteristics in patterned artemisia capillaris plots. J. Arid. Land 2013, 6, 352–360. [Google Scholar] [CrossRef]
  19. Hongyang, Z.; Kuandi, Z.; Juanjuan, L.; Meng, W.; Youdong, C. Quantifying the effects of grass distribution patterns on the relative hydrodynamic parameters of overland flow. Hydrol. Process. 2022, 36, e14707. [Google Scholar]
  20. Sun, G.-Q.; Wang, C.-H.; Chang, L.-L.; Wu, Y.-P.; Li, L.; Jin, Z. Effects of feedback regulation on vegetation patterns in semi-arid environments. Appl. Math. Model. 2018, 61, 200–215. [Google Scholar] [CrossRef]
  21. Fu, S.; Mu, H.; Liu, B.; Yu, X.; Zhang, G.; Liu, Y. Effects on the plant stem arrangement onsediment transport capacity of croplands. Land Degrad. Dev. 2019, 31, 1325–1334. [Google Scholar] [CrossRef]
  22. Zhang, J.; Zhang, S.; Wang, C.; Wang, W.; Ma, L. Influence of combined stem vegetation distribution and discretization on the hydraulic characteristics of overland flow. J. Clean. Prod. 2022, 376, 134188. [Google Scholar] [CrossRef]
  23. Ding, W.; Li, M. Effects of grass coverage and distribution patterns on erosion and overland flow hydraulic characteristics. Environ. Earth Sci. 2016, 75, 477. [Google Scholar] [CrossRef]
  24. Zhang, S.; Zhang, J.; Liu, Y.; Liu, Y.; Wang, Z. The effects of vegetation distribution pattern on overland flow. Water Environ. J. 2018, 32, 392–403. [Google Scholar] [CrossRef]
  25. Liu, C.; Shan, Y.; Sun, W.; Yan, C.; Yang, K. An open channel with an emergent vegetation patch: Predicting the longitudinal profiles of velocities based on exponential decay. J. Hydrol. 2020, 582, 124429. [Google Scholar] [CrossRef]
  26. Anjum, N.; Tanaka, N. Study on the flow structure around discontinued vertically layered vegetation in an open channel. J. Hydrodyn. 2019, 32, 454–467. [Google Scholar] [CrossRef]
  27. Ruiz-Reynes, D.; Gomila, D.; Sintes, T.; Hernandez-Garcia, E.; Marba, N.; Duarte, C.M. Fairy circle landscapes under the sea. Sci. Adv. 2017, 3, e1603262. [Google Scholar] [CrossRef]
  28. Folkard, A.M. Hydrodynamics of model posidonia oceanica patches in shallow water. Limnol. Oceanogr. 2005, 50, 1592–1600. [Google Scholar] [CrossRef]
  29. Afzalimehr, H.; Maddahi, M.R.; Sui, J.; Rahimpour, M. Impacts of vegetation over bedforms on flow characteristics in gravel-bed rivers. J. Hydrodyn. 2019, 31, 986–998. [Google Scholar] [CrossRef]
  30. Xu, S.; Zhao, Q.; Ding, S.; Qin, M.; Ning, L.; Ji, X. Improving soil and water conservation of riparian vegetation based on landscape leakiness and optimal vegetation pattern. Sustainability 2018, 10, 1571. [Google Scholar] [CrossRef]
  31. Gimbun, J. Cfd simulation of aerocyclone hydrodynamics and performance at extreme temperature. Eng. Appl. Comput. Fluid. Mech. 2014, 2, 22–29. [Google Scholar] [CrossRef]
  32. Kazemi, E.; Nichols, A.; Tait, S.; Shao, S. Sph modelling of depth-limited turbulent open channel flows over rough boundaries. Int. J. Numer. Methods Fluids 2017, 83, 3–27. [Google Scholar] [CrossRef] [PubMed]
  33. Zhang, J.; Zhang, S.; Wang, C.; Wang, W.; Ma, L. Flow characteristics of open channels based on patch distribution of partially discontinuous rigid combined vegetation. Front. Plant. Sci. 2022, 13, 976646. [Google Scholar] [CrossRef] [PubMed]
  34. Jia, F.C.; Wang, W.J.; Liu, L.H.; Li, J.J.; Huang, A.P.; Zhang, J.; Fu, Y.C.; Yu, Y. Derivation of new resistance principle on flow-induced morphological response of flexible vegetation. Env. Sci. Pollut. Res. Int. 2023, 30, 31561–31582. [Google Scholar] [CrossRef] [PubMed]
  35. Chanson, H. Environmental Hydraulics for Open Channel Flows; Elsevier Ltd.: Amsterdam, The Netherlands, 2004. [Google Scholar]
  36. Zhang, H.Y.; Wang, Z.Y.; Xu, W.G.; Dai, L.M. Effects of rigid unsubmerged vegetation on flow field structure and turbulent kinetic energy of gradually varied flow. River Res. Appl. 2015, 31, 1166–1175. [Google Scholar] [CrossRef]
  37. Zhao, W.; Zhang, S.; Zhang, J.; Bilal, A. Numerical study of the effects of vegetation stem thickness on the flow characteristics of curved channels. Water Supply 2024, 24, 2218–2231. [Google Scholar] [CrossRef]
  38. Anjum, N.; Tanaka, N. Investigating the turbulent flow behaviour through partially distributed discontinuous rigid vegetation in an open channel. River Res. Appl. 2020, 36, 1701–1716. [Google Scholar] [CrossRef]
  39. Nezu, I.; Rodi, W. Open-channel flow measurements with a laser doppler anemometer. J. Hydraul. Eng. 1986, 112, 335–355. [Google Scholar] [CrossRef]
  40. Wang, F.; Huai, W.; Guo, Y.; Liu, M. Turbulence structure and momentum exchange in compound channel flows with shore ice covered on the floodplains. Water Resour. Res. 2021, 57, e2020WR028621. [Google Scholar] [CrossRef]
  41. Fazeleh, K.; Reza, M.T.M.; Mohammad, S. Effect of vegetative bed on flow structure through a pool-riffle morphology. Flow. Meas. Instrum. 2022, 86, 102197. [Google Scholar]
  42. Suyu, J.; Fei, Y.; Jian, Z.; Bo, S. Multi-scale wake characteristics of the flow over a cylinder with different v-groove numbers. Water 2023, 15, 805. [Google Scholar] [CrossRef]
  43. Cai, Z.; Xie, J.; Chen, Y.; Yang, Y.; Wang, C.; Wang, J. Rigid vegetation affects slope flow velocity. Water 2024, 16, 2240. [Google Scholar] [CrossRef]
  44. Zhang, S.; Zhang, J.; Liu, Y.; Liu, Y.; Li, G. The resistance effect of vegetation stem diameter on overland runoff under different slope gradients. Water Sci. Technol. 2018, 78, 2383–2391. [Google Scholar] [CrossRef] [PubMed]
  45. Wang, G.; Chen, G.; Shan, Y.; Wang, Y.; Xie, Y.; Ba, Y.; Ba, D.; Liu, K. Research on pumping laws of different-shaped roots rotors for multi-stage vacuum pump design. Mech. Syst. Signal Process. 2023, 203, 110752. [Google Scholar] [CrossRef]
  46. Zeng, C.; Li, C.-W. Measurements and modeling of open-channel flows with finite semi-rigid vegetation patches. Environ. Fluid. Mech. 2014, 14, 113–134. [Google Scholar] [CrossRef]
  47. Wang, M.; Avital, E.; Korakianitis, T.; Williams, J.; Ai, K. A numerical study on the influence of curvature ratio and vegetation density on a partially vegetated u-bend channel flow. Adv. Water Resour. 2021, 148, 103843. [Google Scholar] [CrossRef]
  48. Zhao, F.; Huai, W. Hydrodynamics of discontinuous rigid submerged vegetation patches in open-channel flow. J. Hydro-Environ. Res. 2016, 12, 148–160. [Google Scholar] [CrossRef]
  49. Zhang, S.; Li, G. Effect of partially submerged vegetation distribution directions on flood flow resistance. Environ. Eng. Sci. 2019, 36, 1147–1155. [Google Scholar] [CrossRef]
  50. Li, S.H.; Kuang, Q.F.; Yue, W.P.; Guo, T.T. Numerical simulation of the 1.2mw wind turbine flow-field. Adv. Mater. Res. 2011, 383–390, 2045–2050. [Google Scholar] [CrossRef]
  51. Zhang, J.; Zhang, S.; Wang, C.; Wang, W.; Ma, L.; Xu, X.; Zhou, J. Influence of vegetation lodging on the flow regime and resistance characteristic of overland flow. Hydrol. Process. 2023, 37, e14848. [Google Scholar] [CrossRef]
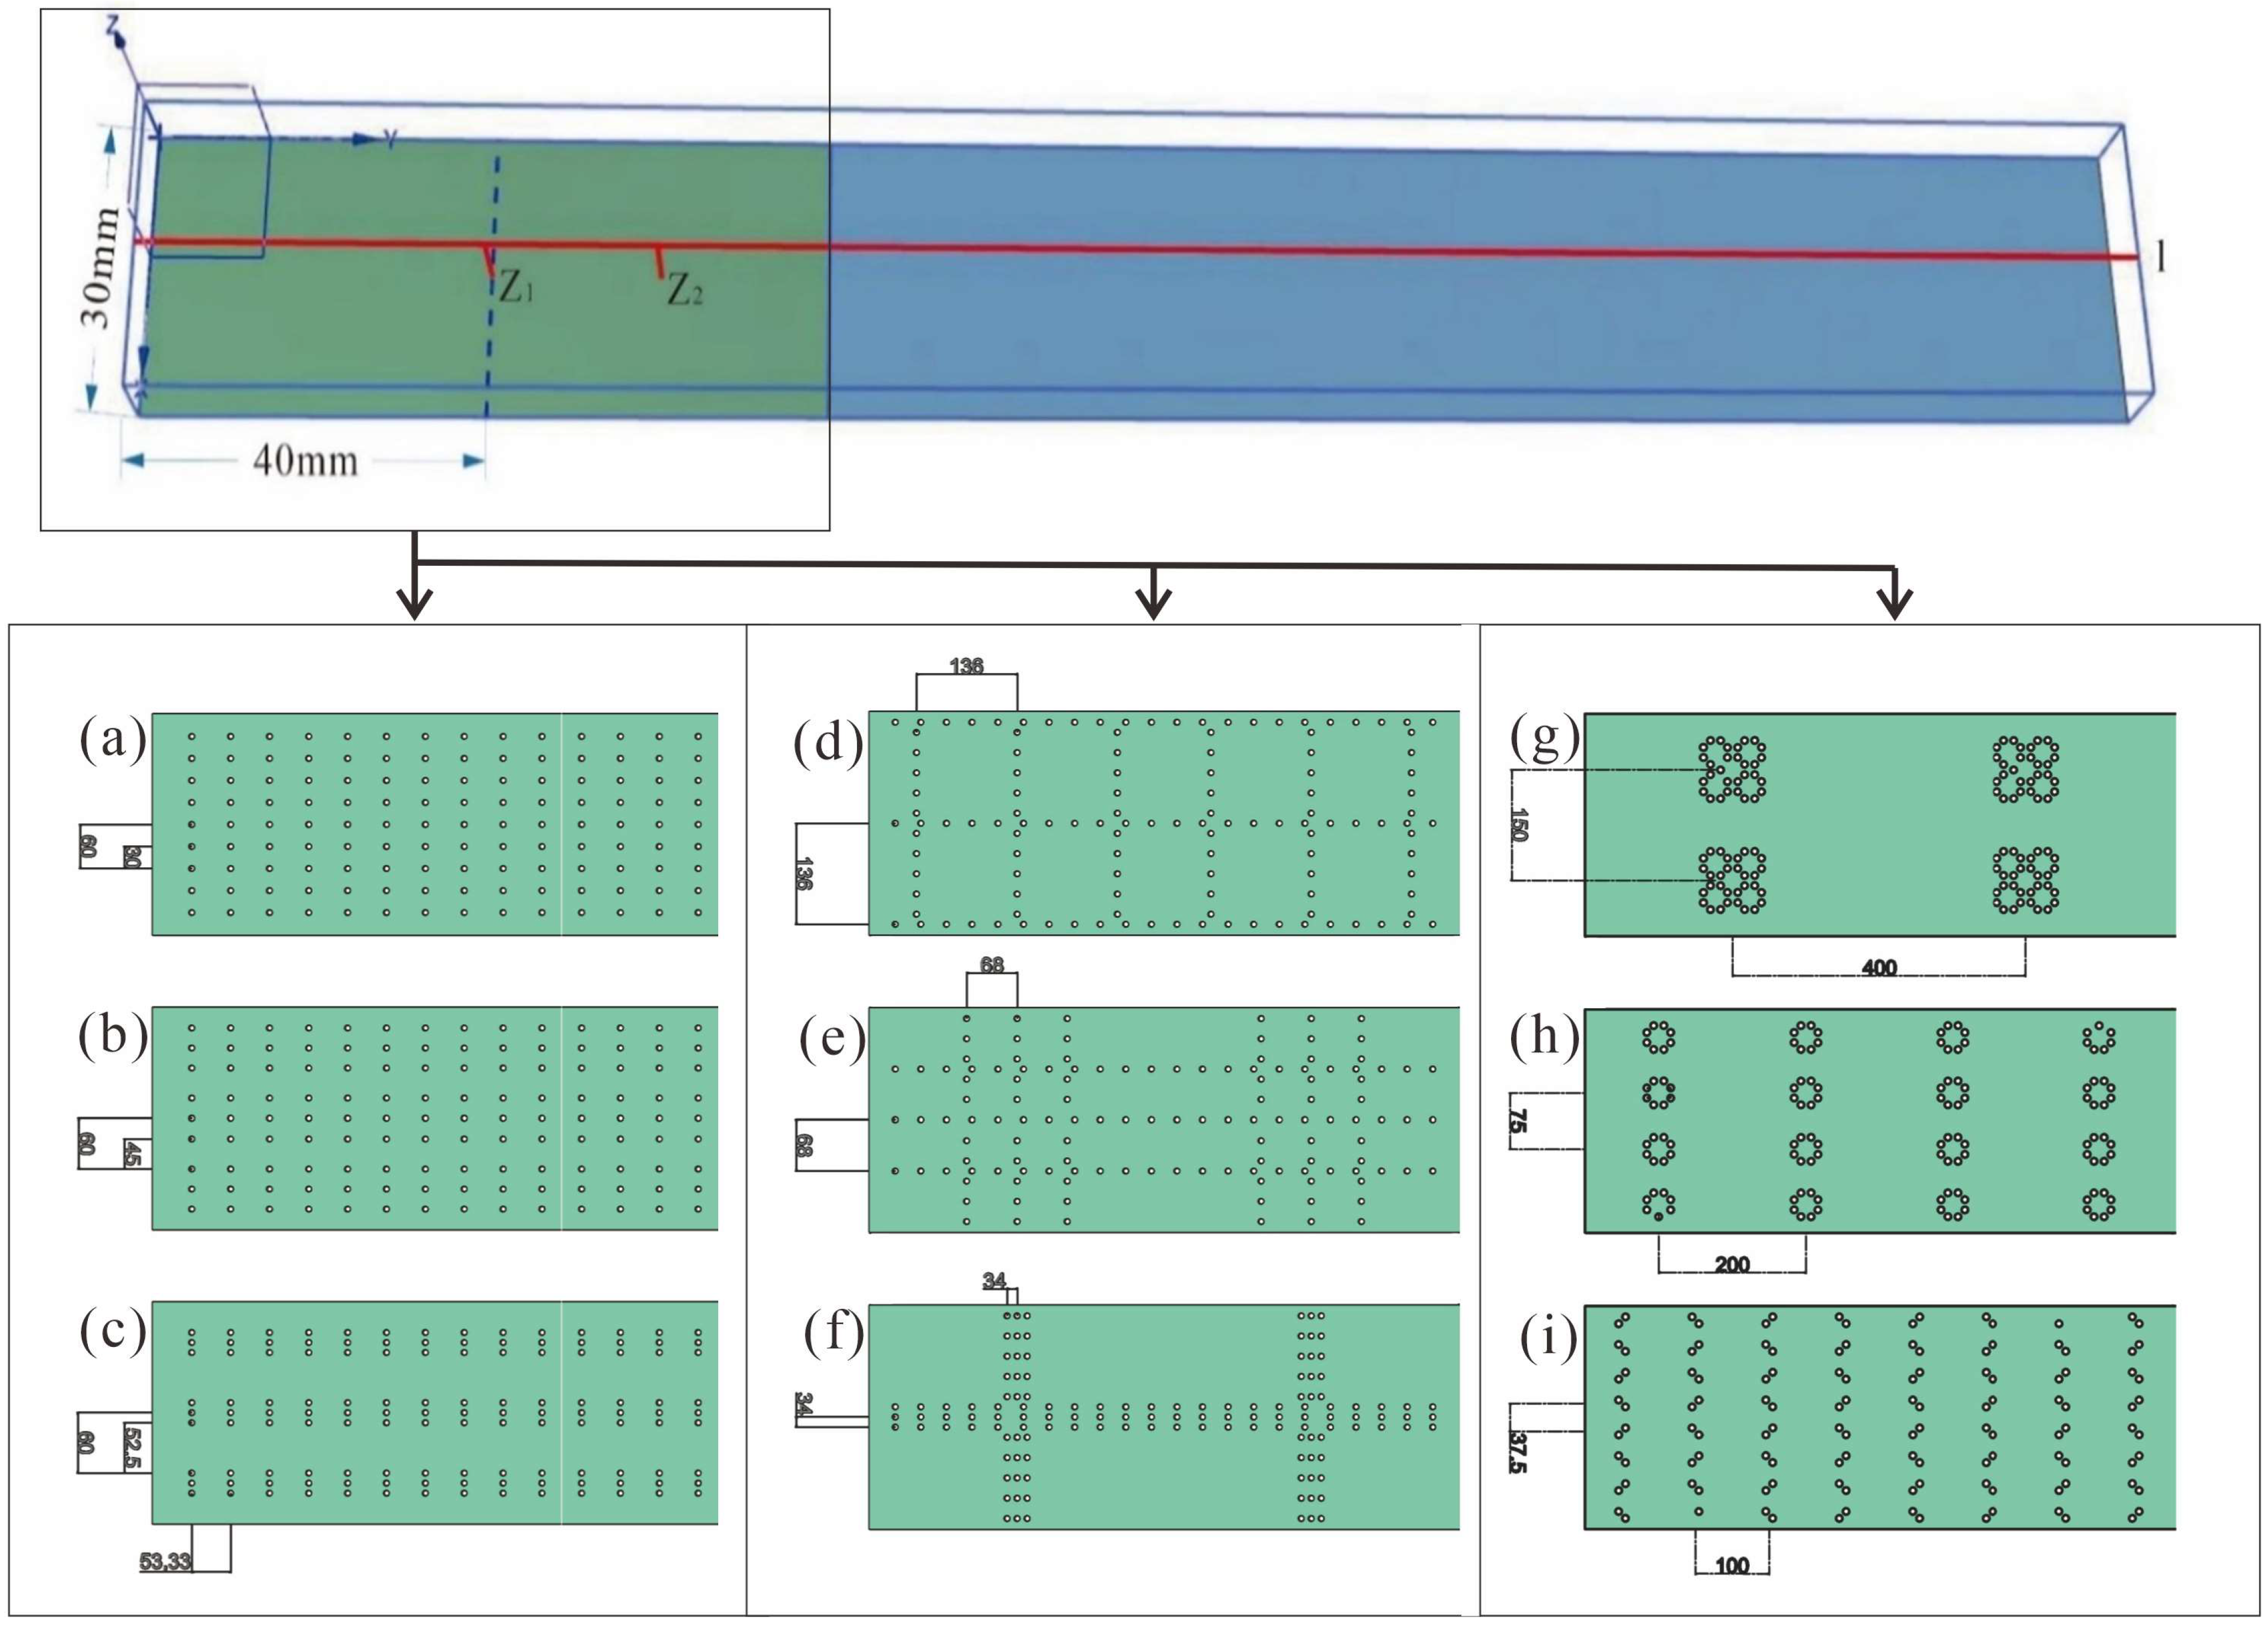
Figure 1. Vegetation landscape layouts under arrangements (a–i).
Water 16 02759 g001
Figure 2. Experimental installation.
Water 16 02759 g002
Figure 3. Comparison of the relationship between water depth and velocity under 9 landscape vegetation arrangements.
Water 16 02759 g003
Figure 4. Rs-Z of the gap area and the vegetation area under 9 landscape vegetation arrangements.
Water 16 02759 g004aWater 16 02759 g004b
Figure 5. Surface velocity cloud atlas under 9 landscape vegetation arrangements.
Water 16 02759 g005
Figure 6. Surface turbulent kinetic energy cloud atlas under 9 landscape vegetation arrangements.
Water 16 02759 g006
Figure 7. Y-v(Y) and Y-TKE under 9 landscape arrangements.
Water 16 02759 g007aWater 16 02759 g007b
Table 1. Verification error analysis under 9 landscape vegetation arrangements.
(a)(b)(c)(d)(e)(f)(g)(h)(i)Total Mean Error
Mean error4.32%5.10%7.12%5.34%10.97%4.32%3.86%4.19%5.95%5.69%
Table 2. The maximum Reynolds stress between the gap area and the vegetation area under 9 landscape vegetation arrangements.
Research Vertical Line Vertical Line Z1 in the Gap Area Vertical Line Z2 in the Vegetation Area
Arrangements
(a)(1.91 × 10⁻⁴ m2/s2, 5.10 × 10⁻³ m)(1.59 × 10⁻⁴ m2/s2, 3.67 × 10⁻³ m)
(b)(2.69 × 10⁻⁴ m2/s2, 1.84 × 10⁻² m)(2.04 × 10⁻⁴ m2/s2, 3.67 × 10⁻³ m)
(c)(4.42 × 10⁻⁴ m2/s2, 1.65 × 10⁻² m)(4.39 × 10⁻⁴ m2/s2, 7.50 × 10⁻³ m)
(d)(2.03 × 10⁻⁴ m2/s2, 3.67 × 10⁻³ m)(1.60 × 10⁻⁴ m2/s2, 7.35 × 10⁻³ m)
(e)(2.72 × 10⁻⁴ m2/s2, 3.67 × 10⁻³ m)(2.20 × 10⁻⁴ m2/s2, 7.35 × 10⁻³ m)
(f)(5.00 × 10⁻⁴ m2/s2, 5.51 × 10⁻³ m)(4.45 × 10⁻⁴ m2/s2, 2.45 × 10⁻⁴ m)
(g)(2.72 × 10⁻⁴ m2/s2, 9.18 × 10⁻³ m)(1.65 × 10⁻⁴ m2/s2, 1.29 × 10⁻³ m)
(h)(5.29 × 10⁻⁴ m2/s2, 5.51 × 10⁻³ m)(2.91 × 10⁻⁴ m2/s2, 9.18 × 10⁻³ m)
(i)(6.15 × 10⁻⁴ m2/s2, 9.18 × 10⁻³ m)(4.92 × 10⁻⁴ m2/s2, 7.35 × 10⁻³ m)
Table 3. Comparison of relevant hydraulic parameters in the test area and the wake area.
Test AreaThe Wake Area
v1 (m/s)TKE1 (m2/s2)v2 (m/s)TKE2 (m2/s2)v3 (m/s)TKE3 (m2/s2)
(a)0.39006.28 × 10−40.37851.13 × 10−30.25705.55 × 10−5
(b)0.34801.12 × 10−30.33521.25 × 10−30.25001.04 × 10−4
(c)0.30351.40 × 10−30.24481.54 × 10−30.24202.00 × 10−4
(d)0.32348.97 × 10−40.27461.31 × 10−30.25355.70 × 10−5
(e)0.31001.23 × 10−30.17971.37 × 10−30.24821.45 × 10−4
(f)0.24901.60 × 10−30.12701.65 × 10−30.24162.24 × 10−4
(g)0.30081.41 × 10−30.21581.54 × 10−30.24202.22 × 10−4
(h)0.20541.47 × 10−30.15262.08 × 10−30.24162.64 × 10−4
(i)0.15681.85 × 10−30.11322.46 × 10−30.24082.90 × 10−4
Disclaimer/Publisher’s Note: The statements, opinions and data contained in all publications are solely those of the individual author(s) and contributor(s) and not of MDPI and/or the editor(s). MDPI and/or the editor(s) disclaim responsibility for any injury to people or property resulting from any ideas, methods, instructions or products referred to in the content.