Abstract
A spillway is a hydraulic structure of major importance in dam safety, and its current analysis usually involves a hybrid approach combining CFD modeling with experimental research, either using well-known WES design charts or conducting new model experiments in the laboratory. Flow over spillway crests involves fluid accelerations, making irrotationality an adequate simplification of the Navier–Stokes (NS) equations. However, an efficient tool using this method is currently lacking for spillway flow, particularly for ogee spillway flow. This work focuses on this aspect of the problem, and a new method for computing irrotational flow solutions over ogee spillways is proposed by developing flow net computational solutions. The proposed method entails a new iterative procedure in the complex potential plane where free surface pressures are exactly set to zero, contrary to other methods, and an automatic determination of the critical point, the unknown energy head, and the free surface profile. The model generates solutions efficiently in only a few seconds on a personal workstation, permitting a fast estimate of spillway flow operation, and is thus an effective complement to experimental and NS-CFD modeling. The solutions produced are compared with observations of a high operational head equal to five times the design head of the ogee crest, resulting in reasonable agreement. The application of the new model to investigate the limitations of analytical equations used in spillway flow, like Jaeger’s theory, establishes limits for its use by relating its curvature parameter to the spillway chute slope.
1. Introduction
A dam spillway contains an inlet (see Figure 1), a transport structure, and an outlet section [1,2]. It is the cornerstone of dam safety regarding overtopping risk. Thus, it is one of the most important hydraulic structures in civil engineering, and current methods of analysis usually involve a hybrid approach combining experimental research with CFD modeling. This work focuses on a frontal overflow inlet-type structure, particularly the ogee crest profile. This shape is important both theoretically, involving strong curvature effects on a free surface flow in the gravity field, and practically, given the reliability and efficiency of this structure to release excess water [1,2,3].
Ogee crest profiles have been studied for more than a century, and their optimal design is well documented [2,4]. The currently recommended geometry of a crest shape corresponds to the USACE 3-circular arc profile (R = 0.5HD, R = 0.2HD and R = 0.04HD) of the upstream quadrant [4,5,6] (see Table 1 and Figure 1), and a power law profile for the downstream quadrant as shown in Figure 1. Other designs for the upstream quadrant are the two-circular arc profile and the elliptical profile [7,8,9]. Knapp [10] and Hager [11] proposed continuous bottom profiles using a logarithmic function for the entire crest to avoid curvature discontinuities.

Table 1.
Coordinates of points defining the USACE 3-arc upstream quadrant.
In practice, however, it appears that actual ogee crest profiles rarely correspond exactly to the theoretical profile, as illustrated by Erpicum et al. [12,13] for 27 large dams in France. Moreover, the evolution of both solicitations and regulations usually results in the operation of existing spillways at upstream heads higher than the design head [14,15], i.e., in a range of upstream heads for which the behavior of the ogee crest is still not fully understood. Better understanding of the flow conditions at an ogee crest above its design head, particularly regarding the pressure distribution and related flow detachment or cavitation risks, could also result in new designs [2]. For all these reasons, there is still a need for research on ogee crests and, thus, reliable tools to characterize the flow conditions on such hydraulic structures.
In many hydraulic structures, including spillway crests, flow involves fluid accelerations and, thus, flow irrotationality is an accurate simplification [16,17,18,19,20,21]. Resorting to solve the complete time-dependent 3D Reynolds-averaged Navier–Stokes (RANS) equations for the flow over an ogee crest, as it is typically conducted in 3D CFD industrial/commercial codes [22], is often unnecessary and inefficient for several reasons. First, the flow pattern can be determined using a flow net, and understanding it is fundamental in recognizing the operation of a hydraulic structure [16,17,23]. Second, solving the RANS equations is time consuming compared to irrotational flow solutions. Moreover, the numerical approaches required to solve the time-dependent RANS equations with acceptable numerical errors are complex, while the numerical solutions of the irrotational flow equations are generally based on simple numerical tools [22]. Consequently, the irrotational flow model is an ideal tool for explaining and teaching spillway flow or optimizing designs before a detailed analysis using physical laboratory models or a CFD Navier–Stokes model. If the viscous effects are to be accounted for, it is possible to couple an irrotational solver with a boundary layer computation [24], which will be simpler than solving the RANS equations. The 3D RANS equations solution for an ogee crest consists of a modification because of the turbulence effects of the irrotational flow pattern. Thus, the latter constitutes a suited initial condition. All of these aspects render an efficient irrotational flow solver an attractive tool, both from theoretical and practical viewpoints, complementary to analytical equations, design charts, experimentation, and CFD modeling.
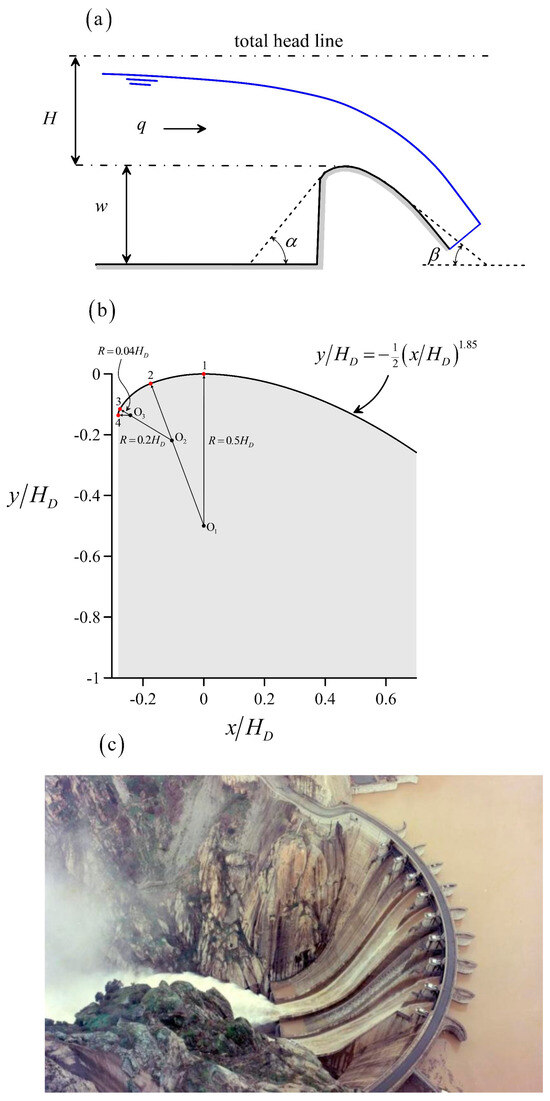
Figure 1.
Flow over an ogee crest: (a) definition sketch, (b) geometry of USACE [5] crest shape considered in this work, (c) Aldeadávila dam on Duero river; photo taken from https://es.wikipedia.org/wiki/Presa_de_Aldeadávila (accessed 10 September 2024). HD = 7.83 m.
Most of the irrotational spillway flow solutions presented in the literature are limited to H/HD <1.33 [25,26,27], with H the actual head and HD the ogee crest design head. In former works, the discharge coefficient Cd and the free surface profile are numerically determined; however, the bottom pressure head computations are rarely presented, with Ding and Liu [28], Ding [29] and Guo et al. [30] as notable exceptions. The favored numerical methods are the finite element method and the simpler finite-difference method. The free surface iteration and the Cd computation are important elements of any model for spillway flow. Methods using the zero-pressure free surface dynamic boundary condition to iterate the free surface position in a Newton–Raphson framework suffer from strong convergence issues [31,32,33,34,35]. This fact was discussed in detail by Castro-Orgaz and Hager [36]. However, if the irrotational flow solution is to be iterated in the complex potential plane, as suggested by Thom and Apelt [37], a new method is found in this work to set the pressure p equal to exactly zero at the free surface, a fact having been unnoticed in the literature. This finding was the starting point of the present research, highlighting the necessity of identifying a suitable method to produce a computational flow net solution in the complex potential plane.
Cassidy [38,39] proposed a computational method to determine the spillway flow in the complex potential plane by solving the corresponding boundary-value problem. However, while attempting to implement it during this research, his method was found to have drawbacks. The reasons are as follows. First, Cassidy’s approach [38,39] did not include a method to estimate the unknown energy head for a given discharge; therefore, it was determined by trial-and-error, resorting to eye inspection of the solutions of the free surface position. Second, the stagnation point, located upstream of the ogee crest, involved the mapping function W = −z2, where W is the complex potential and z the complex variable representing the physical plane. This mapping is independent of a given flow condition over a spillway, e.g., the value of the relative head H/HD, and thus it is not generally valid. Third, a suitable initial solution was found graphically, possibly determined by using Prasil’s method [17]. In addition, the iteration sequence contained arbitrary steps without double checking numerical procedures with all the available flow statements in the complex potential plane. Finally, Cassidy [38,39] did not present a single flow net to assess the accuracy of its numerical computations. In turn, the values of Cd given by Cassidy [39] are not accurate, as was formerly reported by Diersch et al. [40]. During this research, attempts to implement Cassidy’s [38,39] method in the computer produced failure in all cases, not yielding a solution. The present work seems to be the only attempt to produce a computational flow net model for a spillway flow. Many of the flow net solutions available in related books and papers are graphical solutions obtained by using Prasil’s method [17,21,23,41,42]. This method assumes that the free surface streamline and the energy head of the flow are known in advance. Then, the streamlines and equipotential lines are progressively calculated from the free surface down to the spillway bottom, once the free surface velocity and the potential distribution at the free surface nodes are determined. Ideally, the last streamline to be computed should agree with the bottom. This is, however, difficult due to the graphical errors. Therefore, an automatic computational method to accurately determine the flow net is still needed, one yielding the free surface and the discharge coefficient as part of the solution.
Approximate models for spillway flow are generally based on assumptions on the flow net geometry, like those based on the Jaeger and Fawer theories [42,43,44,45,46,47,48,49,50]. The analytical equations in both theories are useful to obtain fast estimations of the spillway flow, but they require accurate calibration. So far, however, Jaeger’s and Fawer’s assumptions have not been investigated for ogee weirs. Thus, a flow net construction is required to propose improved approximate models for spillway flow. Flow over a spillway can be determined using either the Jaeger [44] or Fawer [43] theories. In principle, there is not any advantage to using Fawer’s theory for spillway flow [21], so this is not further analyzed here. Indeed, the advantage of Fawer’s theory is that it can be applied to both curved and straight-bottom channels, whereas Jaeger’s theory breaks down in the latter case [21]. Thus, to model undular jumps at the lee side of obstacles, the Fawer theory is an adequate choice [51]. However, the tailwater conditions in low spillways involving transitions from super- to subcritical flows are excluded from this research, given that in this case turbulence becomes important, a feature out of the scope of this work that focuses on irrotational motion. Since Jaeger’s theory is simpler, and its mathematical statements are analytical, it is the only approach considered in this research.
The development of practical irrotational flow models for spillway flow received almost no attention as compared to turbulent CFD models. As a result, a simple irrotational model is not available, and approximate theories cannot be checked, expanded, or substituted, given the lack of irrotational solutions for reference. The purpose of this work is, therefore, twofold: (i) to elaborate a fast and general irrotational flow model to be applicable to any ogee crest spillway profile, including the standard shapes as well as actual designs observed at real dams, and (ii) to apply the new model to investigate the flow geometry and Jaeger’s theory.
2. Governing Equations
2.1. Complex Potential Plane
Flow over a spillway crest, as shown in Figure 1a,b, can be assumed to be irrotational; consequently, its mathematical analysis consists of solving the boundary-value problem depicted schematically in Figure 2a. Basically, the Laplace equations for the potential and stream ψ functions are solved in the physical plane z = x + iy, with i the imaginary unit. This results in the so-called flow net, which consists of families of streamlines and equipotential lines [16,23]. The inflow and outflow boundaries are equipotential curves located in zones where the streamlines are parallel and, thus, the velocity is constant along them. At the free surface, the value of the stream function equals the discharge per unit width q, and the total energy head H is constant within the flow, including the free surface, where the pressure is atmospheric. The bottom is a streamline where the normal component of the velocity vector V vanishes. For steady flow in hydraulic structures, however, it is advantageous to consider the solution to the problem in the complex potential plane W = + iψ, given that the flow domain maps into a rectangle (see Figure 2b), where the solution is simpler [37].
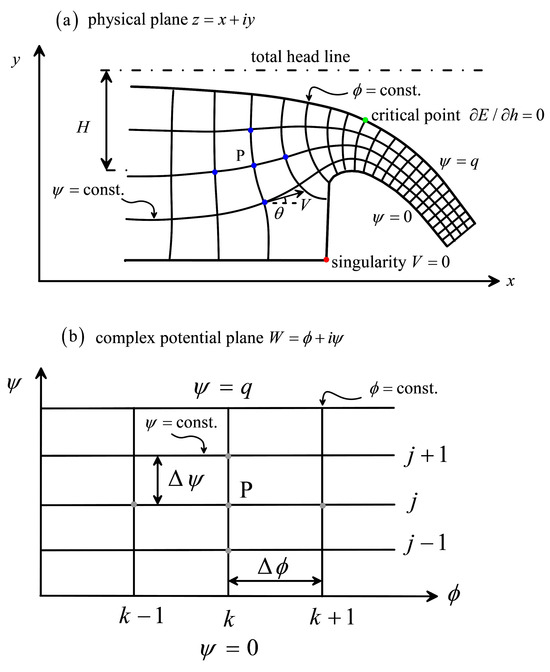
Figure 2.
Boundary-value problem for spillway flow in the (a) physical plane, (b) complex potential plane.
The free surface and bottom streamlines are horizontal boundaries in the complex potential plane, whereas the inflow and outflow boundaries are equipotential lines represented as vertical boundaries. Let the 2D velocity components in the (x, y) directions be
where θ is the inclination of the velocity vector with respect to the x-axis (see Figure 2a). The complex velocity is [20,52]
The logarithmic hodograph is then
In the complex potential plane W (see Figure 2b), lnV and θ are harmonic functions, and they must satisfy the Laplace equation [37,38], namely,
Equations (4)–(7) provide the mathematical relations of lnV and θ in the (ϕ, ψ) plane. These may be used for solving the corresponding boundary-value problems subjected to appropriate boundary conditions. The result of this operation is the velocity vector given by its modulus V and inclination θ at each point in the complex potential plane. However, the potential plane needs to be linked mathematically to the physical plane (x, y) to transform the computations in the former to the latter. Using Equation (2), it can be written as
Inserting Equation (1) into (8) yields, after separating real and imaginary parts,
These relations allow us to compute the (x, y) coordinates of a point in the W plane where lnV and θ are known. The variables (x, y) are themselves harmonic functions expressed in terms of (ϕ, ψ). They must satisfy the Laplacians [37]:
A major difficulty in the solution to the spillway flow problem stems from the fact that the discharge q for a given H is unknown in advance, and vice versa [16,23,38,39]. For a given crest geometry, the relation between H and q is unique, and a method of analysis must provide a means for determining this relation. It is elaborated below using the critical flow principle after having analyzed the non-linear free surface boundary condition imposed by the Bernoulli equation. After the solution to the problem, the pressure p at any point can be derived from the Bernoulli equation:
2.2. Free Surface
The free surface is a streamline where the pressure satisfies the atmospheric condition, e.g., p = 0. The Bernoulli equation provides the free surface boundary condition [21,53] considering the flow net geometry (see Figure 3; where s and b refers to the free surface and channel bottom, respectively):
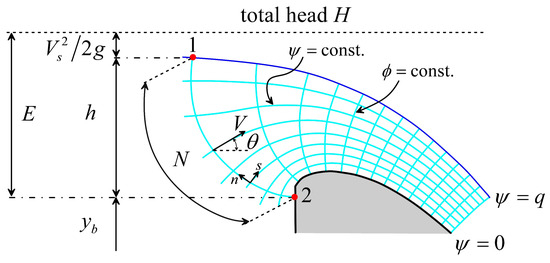
Figure 3.
Definition of specific energy E head in curved flow over an ogee profile.
Equation (13) is a non-linear free surface boundary condition to be satisfied by the solution. Note that h is not the vertical water depth at point 2, but the projection of the equipotential curve length N into a vertical [21]; while E is the specific energy head for curved flow, which can be rewritten for convenience as
where Ω is the ratio of free surface velocity at point 1 to depth-averaged velocity q/h along the equipotential 1–2. Equation (14) is fully general, simply written in a one-dimensional form. It defines a generalized specific energy equation for curved free surface flows. For Ω = 1, the hydrostatic energy equation used in gradually varied open channel flows is obtained [54,55,56].
The velocity V in natural coordinates (s, n), respectively, along and normal to the streamlines, as shown in Figure 3, is given by [16,23,57]
The discharge crossing an equipotential curve is given by
which is a mass-conservation statement to be satisfied by the computed velocity profile in the complex potential plane. Inserting Equation (15) into (16), ψ = q is obtained, which is a second free surface boundary condition to be satisfied by the solution.
2.3. Critical Flow
As previously explained, there is only one value of q related to a given value of H, hence producing a physically correct solution to the boundary-value problem of a spillway flow. In the past, trial-and-error methods were adopted to find a solution, e.g., H was fixed and values of q were tried until a physically acceptable free surface profile without perturbations was obtained [25,35,38,40,58,59]. However, this method is not systematic and does not guarantee to find a converged solution. Here, we will fix the value of q, or equivalently H, using the critical flow principle. It was demonstrated by Fawer [43], Jaeger [42], and Ding [29] that critical flow is a general fluid mechanics principle which can be applied suitably to curved free surface flows. However, it has been largely ignored and not systematically applied to the solution of flow over spillway crests. Considering our definition of specific energy in curved flow using flow net coordinates [Equation (14)], critical flow is settled by finding the minimum specific energy while keeping q constant (see Figure 2a):
The resulting minimum specific energy is found to be
Equations (17) and (18) are general, with subscript c referring to critical flow conditions or the critical point. Note that these equations do not yield information on the actual position of the critical point; they are just conditions to be satisfied by the solution at that point. An approximation is now conducted by neglecting the variation in Ω with h, resulting in
The curved flow features are included in the coefficient Ω, which considers the equipotential curve geometry at the critical point. Note that Equation (20) is identical to that of parallel flow, but the actual value of hc is less than (q2/g)1/3.
2.4. Flow Curvature
An important quantity involved in the solution to the spillway flow is the streamline curvature. Equation (7) is rewritten for convenience as follows:
An elementary manipulation of Equation (21) permits us to put it into the form
The fundamental definition of streamline curvature κ is [52]
Substituting Equation (23) in (22) produces
Integrating Equation (24) yields a general expression for the velocity profile along an equipotential curve:
This is the fundamental relation for approximate models of a spillway flow [14,21,42,43]. Its closed-form solution depends on the function assumed to describe κ. Therefore, we seek to link the curvature to the velocity vector solution in the complex potential plane by rewriting Equation (21) as
Comparing Equations (24) and (26) results in
which is the desired relation linking the flow curvature κ to the solution ln(dW/dz) in the W plane. We will use it to determine the curvature variation along the equipotential lines after having obtained the flow net solution. Its actual behavior in spillway flow is currently unknown.
2.5. Singularity
At the intersection of the upstream spillway face with the horizontal bottom, a stagnation point appears (see Figure 2a), where neither lnV nor θ are defined [23]. In Cassidy’s [38,39] method, the mapping function W = −z2 was used in this zone. However, it is independent of the actual flow conditions over the spillway, thus it was found not suitable and a different procedure was sought. We considered the general conformal mapping function for flow around a corner as
where A is a complex scale factor and γ the wall deflection angle. Therefore, for a given wall angle, the modulus D can be adjusted to patch the corner flow net to the actual spillway flow net at a reference point. For this task, the complex velocity is determined from [20]
From Equation (28), the complex variable z = x +iy representing the physical plane is
Substituting Equation (30) into (29) produces
This complex velocity shall conform with its general definition given by Equation (2):
from which the following relation emerges:
For a given flow velocity V at a point of the spillway flow net, the scale factor to patch the corner flow net is
The resulting procedure is written as follows. Given a point in the complex potential plane W where the velocity is V, a scale factor D is computed from Equation (34). Then, Equations (28) and (29) are used to determine the flow net in the vicinity of the stagnation point. Figure 4 depicts the corner solution in an example where D = 1 was arbitrarily chosen. The red point is the singularity, and the upstream point labeled A is the patching point of the spillway and corner flow nets.
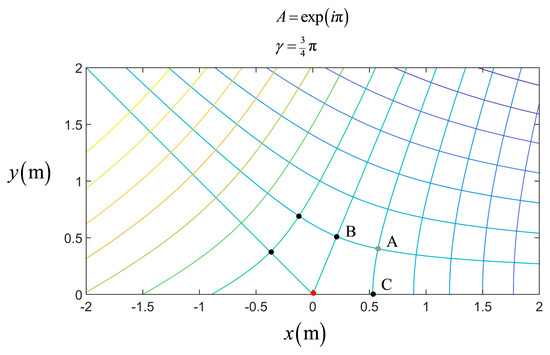
Figure 4.
Example of corner flow net used to remove the singularity in spillway flow net. Point A is used to patch the corner and spillway flow nets by defining the scaling D.
2.6. Flow Net Geometry and Jaeger’s Approximation
Approximate models for spillway flow are based on Equation (25), selecting a suitable approximation for κ = −1/R, where R is the radius of streamline curvature [43,44,45,46,47,50,60]. An approximation consists of using the Taylor expansion of R around the bed (denoted using subscript b) as follows:
Truncated to the first-order term, Equation (35) yields [44,61]
with
The coefficient K reflects the near-bed changes of the flow net geometry. Using Equation (36), integrating Equation (25) produces [44,61]
The discharge coefficient Cd is given by Poleni’s equation:
Using Equation (38), the following relationship is found from Jaeger’s theory [21,61]:
The ratio h/H follows from the critical flow condition ∂Cd/∂(h/H) = 0, resulting in [21,53,61]
Using Equations (40) and (41) yields Cd = Cd(H/Rb, K). The suggested value of K = 2.2 [21,44,61] relies on a purely empirical fitting of Cd to model and prototype data. The actual value of (∂R/∂n)b has so far not been investigated for ogee spillway crests, and it is unknown whether 2.2 is a physically correct value or not [60]. Another possible interpretation of Jaeger’s theory in a least-squares sense is
with as a fitting parameter to match the actual flow curvature distribution along a whole equipotential curve. Jaeger’s theory will be investigated after having produced the flow net solutions in the ensuing sections.
3. Solution Method
3.1. Iterative Solution
In the (ϕ, ψ) plane, the computational domain is a rectangular band requiring no irregular mesh (see Figure 2b). This approach was adopted by Thom and Apelt [37] and Cassidy [38,39], using a finite-difference discretization of Laplace’s equation. It allows us to use standard numerical methods [62,63,64], resulting in simple computations. We also follow this basic numerical method and use the second-order finite-differences for the discretization of the derivatives. The new iterative solution to the governing equations presented in Section 2 entails the following steps, which are detailed to allow for an easy implementation by the readers:
1. A head H is selected, and the discharge q is determined using Hager’s [65] semi-empirical equation to estimate Cd:
The number of streamlines M to model the flow is selected, resulting in the finite-difference increments in the W plane q/(M − 1). In Figure 2b, subindex k refers to an equipotential and j to a streamline; j = 1 is the bottom streamline and j = M is the free surface. We will generally model the flow net using squares, but this is not a constraint of the method, contrary to Cassidy’s [38,39] method, which implements numerical formulae proposed by Thom and Apelt [37] and is only valid for squares. In our implementation, an arbitrary mesh may be settled. The x coordinate origin is set to zero at the crest by choice, as well as to the zero potential. Velocity at the inlet-outlet sections is uniform and the streamlines parallel during the entire simulation.
2. An initial solution shall be set in the complex potential plane for both θ and V. This is obtained by assuming a hydrostatic free surface profile, resulting in a flow solution involving vertical equipotential lines, along which the velocity is a constant. The computation is standard and entails no difficulty, involving the inversion of the specific energy diagram analytically [55,56,66]. The sole peculiarity to generate this solution is that the mesh is uniform in the ϕ axis; thus, the computational points along the x-axis are in general not uniformly spaced. For a distribution of the potential function along the channel bottom, the x-coordinate of these nodes shall be determined using the computed velocity at each vertical equipotential. A simple successive substitution loop will converge fast and produce the desired solution. In this solution, the critical point is located at the spillway crest. The initial solution provides a free surface, energy head, and surface velocity to start the computations.
3. The value of θ at each free surface node is obtained from the local free surface slope using a finite-difference formula for a non-uniform mesh in the x-direction. Along the bottom, θ is obtained analytically from the known spillway geometry.
4. A second-order central finite-difference approximation is used to solve [Equation (5)] in the (ϕ, ψ) plane. The Laplace equation is solved using Successive-Overrelaxation (SOR) [22] with an overrelaxation factor of 1.8, determined by numerical tests, and a tolerance of 10−12. The singularity is excluded from the computation. In the first pass, an accurate value is not available at the first node above the bottom on the corner equipotential, just a rough hydrostatic value, but this value is improved in the next iterations, as explained below.
5. The numerical integration of the Cauchy–Riemann equations [Equations (6) and (7)] along the stream and equipotential lines yields values of lnV in the complete (ϕ, ψ) plane. These values are, thus, those corresponding to the actual free surface. The change in lnV along a streamline is given by Equation (6) as follows:
Similarly, the change in lnV along an equipotential line is from Equation (7) like
The gradients of θ in the W plane are computed in Equations (44) and (45) using second-order finite-differences, whereas the integrals are evaluated using the trapezoidal rule. An averaging of lnV at a node is made integrating along the equipotentials and streamlines. Integrations along the equipotential lines using Equation (45) are started at the free surface, where the velocity is known. For integration along the streamlines, an equipotential shall be selected upon initiation. After having tested several options, it was found that robust computations resulted by starting at the equipotential where the critical point is formed, e.g., the minimum specific energy equipotential curve. Therefore, the lnV distribution at the minimum specific equipotential is determined with Equation (45). Then, computations are performed from the free surface to the bottom using Equation (45), and using Equation (44) from the critical equipotential to the outlet doing a sweep towards the downstream side of the mesh, and from the critical equipotential to the inlet doing a sweep towards the upstream side of the mesh. At each node, an averaging of results from ∆lnV = −∫(∂θ/∂ψ)dϕ and ∆lnV = ∫(∂θ/∂ϕ)dψ is done while the integrations are conducted, such that final values at a node are available as soon as possible. A Savitzky–Golay smoothing filter is applied to the computed bottom velocity to remove oscillations. Once this computation is finished, the bottom velocity is updated using the new improved values.
6. The computations of the former step are not valid at the channel bottom for the stagnation point upstream of the spillway crest, where neither lnV nor θ are defined. Given the actual (discrete) bottom profile formed by data pairs x(k, 1) and y(k, 1), the stagnation point is located and its deflection angle γ determined. The flow in the vicinity of the deflection is characterized with the transformation W = Azm [Equation (28)]. The coordinates of the corner flow net are adapted to those of the spillway flow net, with the factor D determined from Equation (34). The reference velocity in the spillway flow net used to define the scaling is that at point A in Figure 4, just upstream of the bottom slope break in the first streamline above the bottom. Once the scaling is determined, lnV and θ at point B in Figure 4, e.g., on the corner equipotential and at the first streamline above the bottom, are determined from Equation (29). These values are set in the numerical mesh of the spillway flow net.
7. A second-order central finite-difference approximation is used to solve [Equation (4)] in the (ϕ, ψ) plane. The singularity is excluded from the computation, and lnV at point B is fixed at the value given by the former corner flow net computation. For the next θ iteration, the same procedure is adopted. The Laplace equation is solved using SOR with an overrelaxation factor of 1.8 and a tolerance of 10−12. This step results in a new and improved velocity field over the whole computational domain.
8. After a new V-field is available, the bottom coordinates x(ϕ, 0) and y(ϕ, 0) shall be recomputed. This task is accomplished as follows. The integration of the first Equation (9), valid for a streamline (dψ = 0), permits us to recompute the x-coordinate of the bottom points as
Here, j = 1 refers to the bottom streamline. Now, an estimation of the s curvilinear coordinate at the bottom points is made from V = dϕ/ds as follows:
Then, an additional estimation of the x-coordinate follows by considering that dx/ds = cosθ, namely,
The estimated x-coordinate at each node is obtained by averaging the results from Equations (46) and (48) progressively during integrations. Once x(ϕ, 0) is available, the values of y(ϕ, 0) are analytically determined from the known bottom geometry of the structure. The equations used above are not valid at the stagnation point. The bottom coordinates are updated from the crest in the up- and downstream directions. When the singularity is reached, it is skipped and the bottom coordinates at point C in Figure 4, e.g., upstream of the slope break on the bottom, are determined from the corner flow net relations.
9. Using the updated bottom profile, new θ values at the bottom are determined from the known bottom geometry.
10. Starting at the bottom coordinates previously computed, the (x, y) coordinates of the equipotential lines are determined from Equation (9) setting dϕ = 0 as follows:
At the corner equipotential, the computations start at point B, determining its coordinates by the corner flow net. New free surface coordinates x(ϕ, q) and y(ϕ, q) are, thereby, available after this stage.
11. Next, a new estimation of H follows. Ding’s [29] method was adapted to determine the critical point as follows. At each equipotential, the free surface velocity ratio is
A Savitzky–Golay smoothing filter was applied to the computed Ω to remove oscillations. The critical depth of curvilinear flow for each equipotential line is thus
The resulting minimum specific energy of each equipotential is then
This minimum specific energy can be transformed into the minimum total energy head at each node as follows:
This yields the minimum total head necessary at each equipotential for a passing discharge q; thus, a physical solution to the flow net implies H ≥ Hmin(k). The maximum value of this set satisfies this requirement, resulting in the new head estimation [29]:
This fixes the position of the critical point in the mesh, kcritical, and a new estimation of the total energy head of the flow.
12. A new estimation of the flow profile follows using an analytical solution [36]. With the local free surface specific energy at each equipotential given by E(k) = H − y(k, 1), the flow profile,
is computed for subcritical flow (k < kcritical), whereas the branch,
applies for supercritical flow (k > kcritical), with
With this computation, new values of the vertical coordinate at the free surface nodes are determined as y(k, M) = y(k, 1) + h(k) for the new H, keeping x(k, M) fixed. Therefore, the upper point of the equipotential is adjusted, moving it vertically up or down to satisfy Bernoulli’s equation. A Savitzky–Golay smoothing filter is applied to the computed flow profile to remove oscillations close to the critical point. A 2nd or 3rd order filter is typically used, with a window iteratively determined depending on the mesh size.
12. Using the new computed flow profile, the value of θ along the free surface is updated.
13. New values of lnV on the free surface are obtained by using y(ϕ, q), H, and the Bernoulli equation, e.g.,
In this step, the pressure on the free surface is forced to be exactly zero.
14. The velocity at the inlet-outlet sections is updated with the new free surface velocities, given that the velocity is uniform at those sections.
15. The free surface estimations y(ϕ, q) obtained by the integration along the equipotential lines (step 10) and by the analytical inversion of the generalized specific energy diagram (step 11) are compared. An average deviation in the computational domain is determined and, then, compared with a threshold value, typically 1%. If it is not below the threshold, a new iteration loop starts going back to step 4. Typically, 10–15 iterations produced accurate values, but a minimum of 50 iterations was forced in all the simulations of this work to ensure accuracy in the computed velocity profiles. If the value obtained for H largely deviates from that assumed in step 1, then the computation starts again by assuming a modified H value. This turns out to be necessary for test cases involving H/HD > 3, which are above the validity limit of Equation (43).
16. Once the free surface solution converges, steps 5–9 are repeated, and is solved again. The result is the final solution for the lnV and θ fields.
17. The flow net coordinates are to be determined. First, the boundary equipotentials are updated by applying Equation (49).
18. The flow net coordinates are determined solving and using SOR as previously done for lnV and θ.
19. Using the computed flow net, the middle streamline is selected, and starting at it, the first of Equation (49) is integrated until the new values of x(ϕ, q) result. The reason is that, at step 15, the values of y(ϕ, q) were updated, keeping x(ϕ, q) fixed, so this step adjusts the x-coordinates of the free surface nodes.
20. Using the new computed coordinates of the free surface nodes, and are solved again, which yields the final (x, y) coordinates of the flow net.
21. The pressure field is computed for the entire domain, including the bottom level, using Bernoulli’s equation.
Special features of the new method are as follows: The iteration loop determines H each time the free surface is moved by setting the critical flow and iteratively finding the critical point in spillway flow. Two estimations of the free surface position are made by integration along the equipotentials, yielding the (x, y) free surface coordinates, and by inverting the non-hydrostatic specific energy equation, which are compared to check the convergence of the solution. The actual free surface elevation is that which resulted from the inversion of the specific energy after each iteration, given its robustness. The iteration loops move the free surface until the difference between the two free surface estimations is negligible. The zero-pressure free surface boundary condition is directly forced during the iterations, contrary to other methods that use it for the iteration itself. The corner singularity is scaled each time the free surface is moved, and the velocities recomputed.
3.2. Solution Checks
After achieving the final solution, several checks to assess the quality of computations are to be performed:
1. Mass-conservation features of the method are evaluated by integration of the computed velocity profile along the equipotential lines [Equation (16)]; with the (x, y) coordinates of equipotential k available, the curvilinear coordinate n is determined and the discharge q(k) crossing the equipotential is determined as follows:
Deviations of q(k) from the actual discharge q are computed and the average deviation is determined. If it is not below ±1%, the number of streamlines is increased, and the simulation repeated.
2. Bottom curvilinear coordinate checks: The curvilinear bottom coordinate is firstly computed geometrically as follows:
A second check is done by computing s based on V at the, bottom resulting in
In a converged solution, both estimations perfectly match.
3. Bottom velocity checks: The computed bottom velocity is compared with two additional estimations determined from the solution. The first one results from
The second one is obtained by integrating a Cauchy–Riemann condition along the bottom streamline as follows:
Both bottom velocity estimations shall be in close agreement with the model bottom velocities.
4. Free surface checks: two additional free surface computations are conducted. The first one consists of integrating Equation (9) for a streamline (dψ = 0) starting at the outlet section:
The second one considers the solution to the Levi-Civita free surface condition in the complex potential plane W [52]:
where τ = lnV. It can be easily demonstrated that the equations,
when applied at the free surface, are equivalent to Equation (66) by differentiating the Bernoulli equation with respect to the curvilinear coordinate s along the free surface and using the definition V = dϕ/ds. Equation (67) was, therefore, iteratively solved for the free surface y-coordinates and V based on the computed θ-solution. However, attempts to use this formulation of the free surface condition for predictive purposes instead of for checking failed. A great sensitivity of this method to the estimation of the local θ value at the free surface nodes was found, making it not robust enough for predictive purposes.
3.3. Post-Processing of Results
After the quality check of the solution succeeds, the results are post-processed to investigate the flow geometry in the crest domain. Radii of streamline curvature variations R(n) along the equipotential lines are determined by evaluating Equation (27) using the second-order finite-differences. Once these results are available, two fittings to R(n) for the equipotential lines in the crest domain are investigated:
- The first one consists of a 6th-order polynomial fitting R(k, j) = R(k,1) + ∂R/∂n(k,1)n(k,1) + … to the function R(n) within the lower third of the streamlines used to model the flow, forcing the polynomial to satisfy the bed value Rb = R(k,1) at n = 0. This process represents for each equipotential line the near-bed variation in the radius of streamline curvature analytically; thus, it can be adopted as a discrete approximation of the truncated Taylor series Equation (35). The value of K follows from Equation (37).
- The second consists of performing the linear fitting of Equation (38) to each equipotential using all the streamlines characterizing the flow, forcing it to satisfy the bed value Rb = R(k,1) at n = 0. This gives an average K value along each equipotential in a least-squares sense.
4. Results
4.1. Free Surface and Bottom Pressure Head
Flow over an ogee crest for heads H/HD = 0.5, 1, and 1.33 is considered in Figure 5, including the free surface and bottom pressure head experimental data by USACE [4] and the irrotational flow results using 25 streamlines. In the numerical simulations, tanα = 2, tanβ = −1, and w/HD = 10 were settled. The upstream face angle of the spillway cannot equal 90° in the model, because of numerical instabilities occurring during the initiation of iterations. These are linked to the assumed initial solution involving a hydrostatic flow profile with vertical equipotential lines, which cannot be stabilized by the used numerical filter. By trial-and-error numerical experimentation, it was found that the upstream face slope can be set to the maximum slope angle of 85°. However, for such an extreme angle, it was difficult to find the suitable numerical filter. Given the weak effect of this slope on the flow features for values higher than 1:1 [6], we used a 2:1 slope (63.5°) for computational purposes.
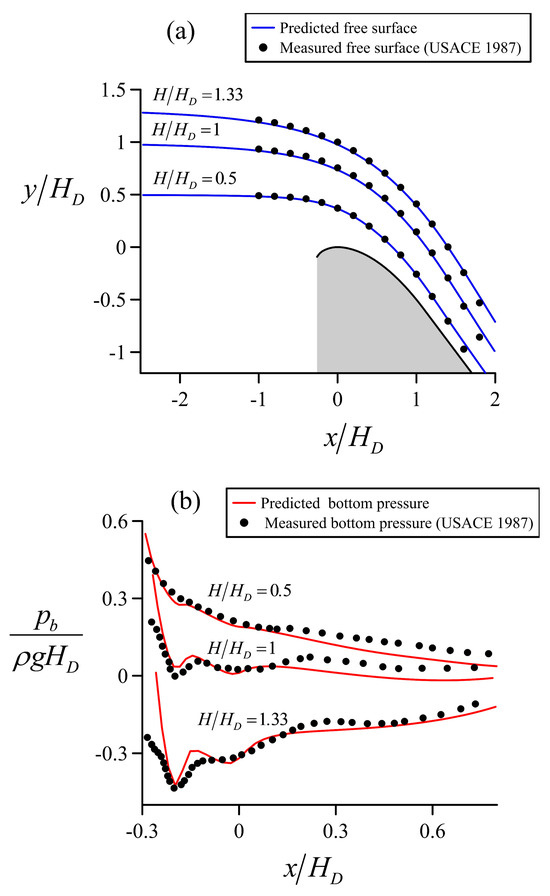
Figure 5.
Flow over ogee crest for relative heads of H/HD = 0.5, 1, and 1.33: Comparison of flow net model with USACE [4] experiments for (a) free surface profiles y/HD(x/HD), (b) bottom pressure head profiles pb/(ρgHD)(x/HD).
The results of Figure 5 indicate that the irrotational flow model accurately predicts the free surface profiles, whereas the simulated bottom pressure heads are in fair agreement with measurements. The model generally underpredicts USACE free surface measurements (see Figure 5a in the crest domain for H/HD = 1.33), which may imply a boundary layer displacement thickness effect of USACE data not accounted for in the irrotational model, because the viscosity is neglected. Pressures are under- and over-predicted along the weir crest (see Figure 5b), reflecting the discrepancies of the slip potential bottom velocity and the real near-bed velocity in USACE experiments. For x/HD > 0.15, the underprediction of pressure is evident. The pressure drop below the experimental data seems to indicate that the actual velocity near the bed is smaller than the slip velocity predicted by the irrotational model.
The irrotational flow results are further compared in Figure 6 with the experimental data by Hager [65] on a WES profile designed with HD = 0.1 m, tanβ = −1, and w/HD = 10. This comparison is conducted up to the head ratio H/HD = 3 both for the free surface profile and piezometric bottom head. To our knowledge, an irrotational flow net model has so far never been tested for this high-head overflow. The comparison depicts that the prediction of the free surface and piezometric head is good, albeit the predicted free surface is slightly below the experimental data. However, the pressures are over- and underpredicted, depending on the position. For H/HD = 3, the predicted bottom pressures are clearly below experiments, indicating that the slip irrotational velocity at the bed is larger than the near-bed velocity in the experiments.
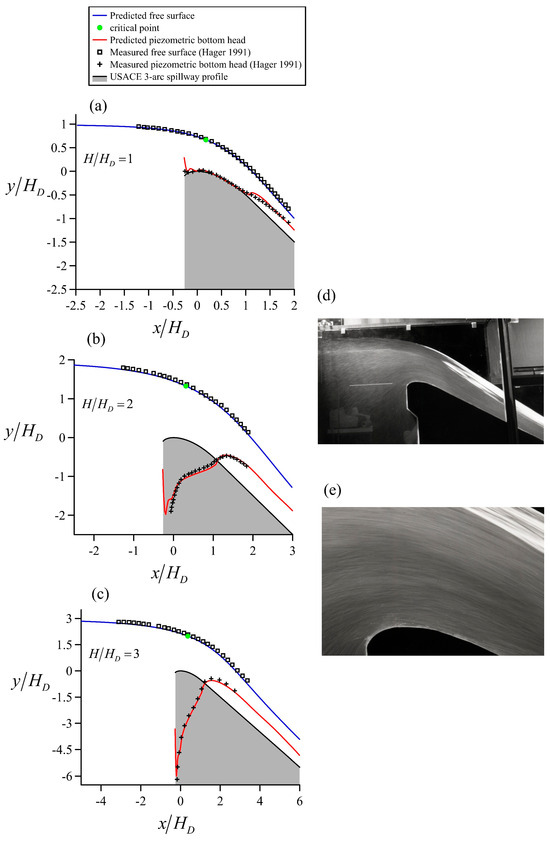
Figure 6.
Flow over ogee crest: Comparison of flow net model with Hager’s [65] experiments for free surface profiles and bottom piezometric head profiles for relative heads H/HD = (a) 1, (b) 2, (c) 3; Hager (1991) model: (d) general view of streamlines, (e) detail of crest streamlines.
This comparison reveals the utility of the proposed flow net model to simulate spillway overflows. The computed critical point reveals a significant displacement from the ogee crest. Cassidy [38,39] and Diersch et al. [40] explicitly stated that in spillway flow problems the head cannot be determined from first principles given a discharge, or vice versa. We indicate with our results that this is not the case; the proposed improved flow net computational method uses a fully automatic determination of the unknown energy head based on the generalized critical flow condition for free surface flows. That is, Cd is part of the mathematical solution, and not an input value taken from experiments, nor a trial-and-error adjusted value until getting a good solution by eye, as in Cassidy [38,39] or Diersch et al. [40].
Solutions involved a mesh with typically 1200 equipotentials and 25 streamlines, which results in 30,000 nodes in the complex potential plane. Each Laplace solution needed on average of around 200 SOR iterations. The Laplace equation is solved twice per surface iteration, which amounts to 400 iterations each time the free surface is moved, and 20,000 for the whole nested iteration technique to obtain a solution. The code was written in MATLAB R2021a, and simulations performed in this work were ultrafast, taking on average only 3 s on a personal workstation (CPU: Intel(R) Xeon(R) W-10885M 2.40 GHz). This is one of the strong reasons motivating this study to use an irrotational flow solver to simulate spillway flow, given that in roughly 5 min a hundred simulations could be conducted. This would permit optimizing designs fast before constructing a physical model or using time-consuming Reynolds-Averaged Navier–Stokes simulations [22,67], typical of CFD programs used in the industry.
4.2. Flow Net
The flow nets resulting from the computations in the former section are presented for H/HD = 0.5, 1, 2, and 3 in Figure 7, Figure 8, Figure 9 and Figure 10, respectively. In these figures, a general view of the flow net is firstly presented in the upper panels, where the behavior near the singularity is observed. Blue dots in the corner zone are the theoretical points resulting from the corner flow net. The scaling is done using the velocity at point B (see Figure 4), whereas (x, y) coordinates of corner and spillway flow nets are forced to coincide at point A. Note that, in general, all the blue points overlap at the intersections of the spillway flow net, thereby indicating the accuracy of the proposed solution method for handling the singularity. In addition, the proposed method was robust, and no computational issues were detected while solving the singularity. In the lower panels, a detail of the flow net in the crest domain is shown, which is the zone of greatest interest to investigate the variation in streamline curvature along the equipotentials. For clarity, flow nets for H/HD = 0.5 and 1 were drawn with 10 streamlines, whereas for H/HD = 2, 15 streamlines were used. For H/HD = 3, 25 streamlines are displayed.
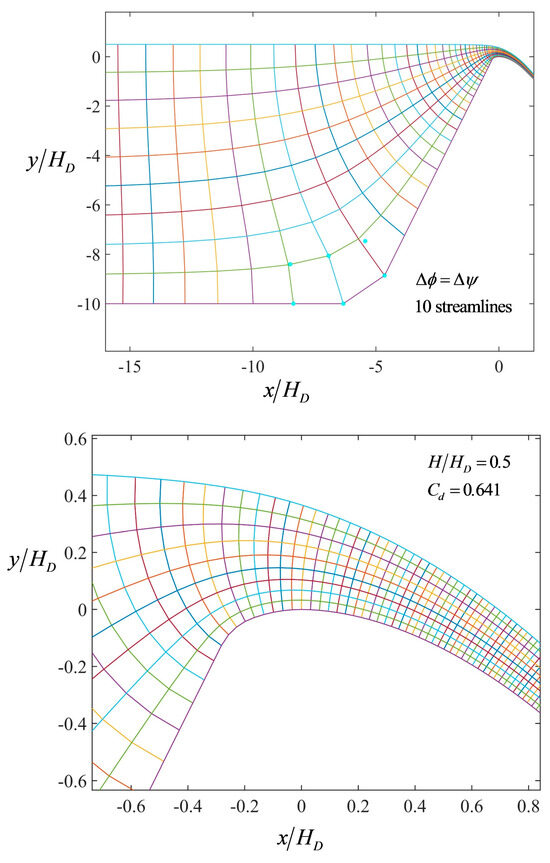
Figure 7.
Flow net for H/HD = 0.5.
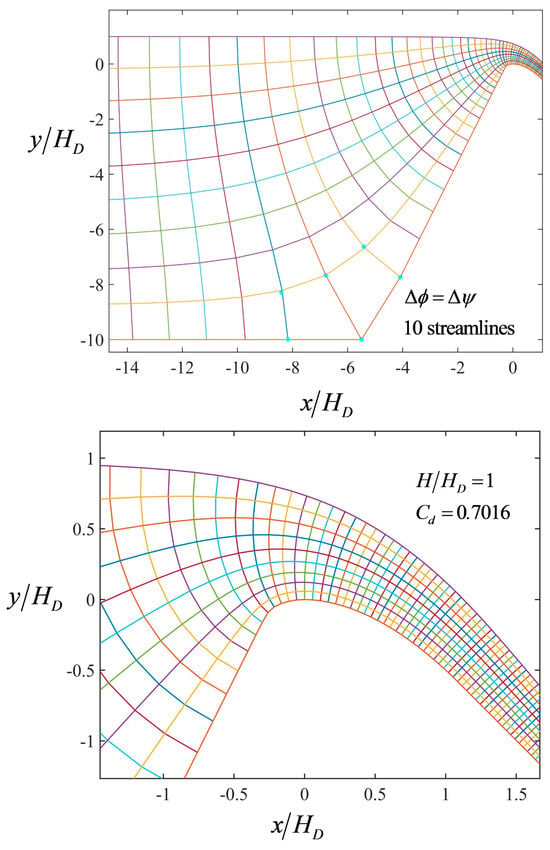
Figure 8.
Flow net for H/HD = 1.
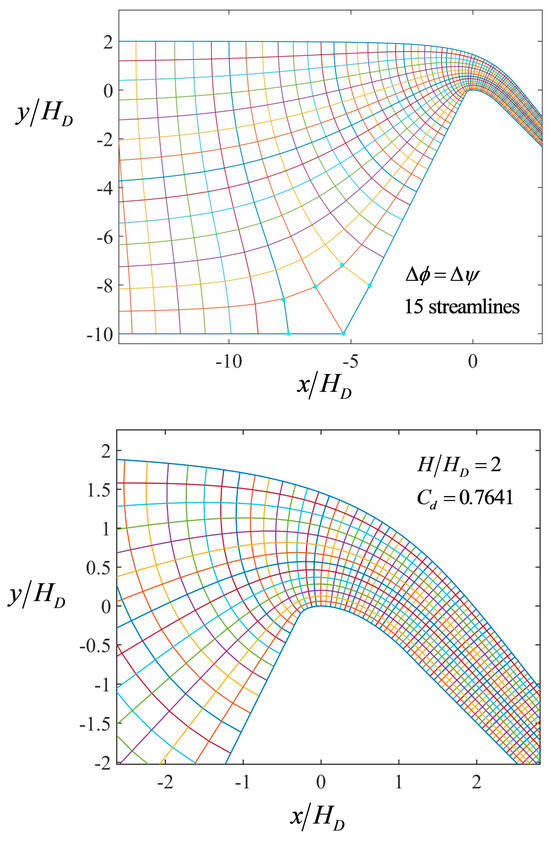
Figure 9.
Flow net for H/HD = 2.
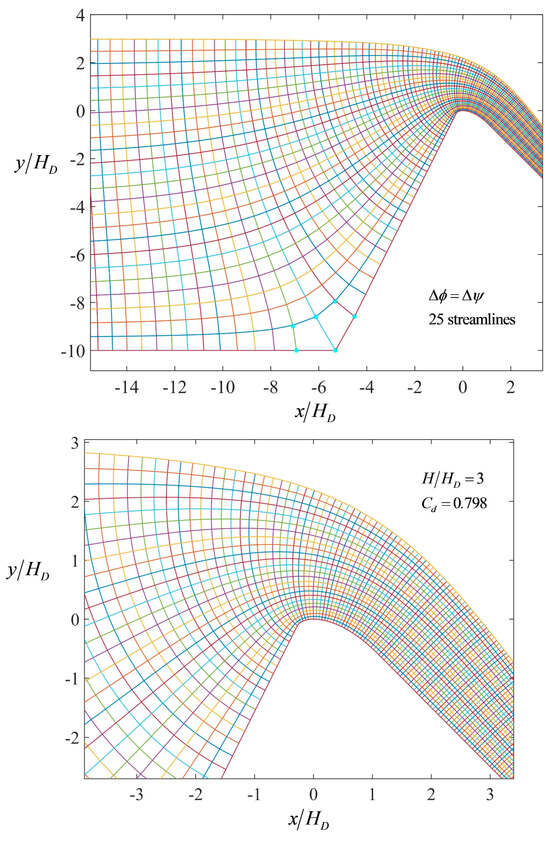
Figure 10.
Flow net for H/HD = 3.
4.3. Velocity Field
An output of the proposed model is the velocity vector, given by V and θ, in the complex potential plane. The image of these points in the z plane is determined, yielding the (x, y) coordinates of each velocity vector. The corresponding velocity fields for H/HD = 0.5, 1, 2, and 3 are plotted in Figure 11, Figure 12, Figure 13 and Figure 14, respectively.
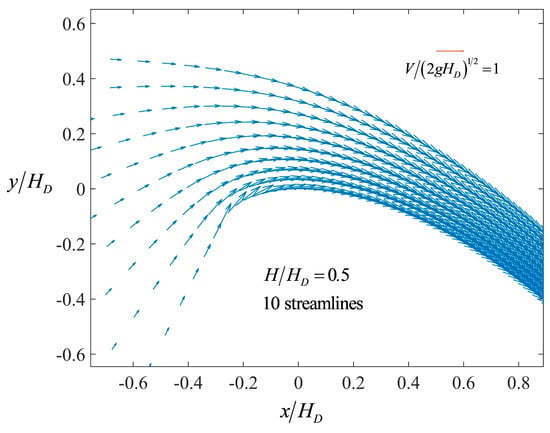
Figure 11.
Velocity field for H/HD = 0.5.
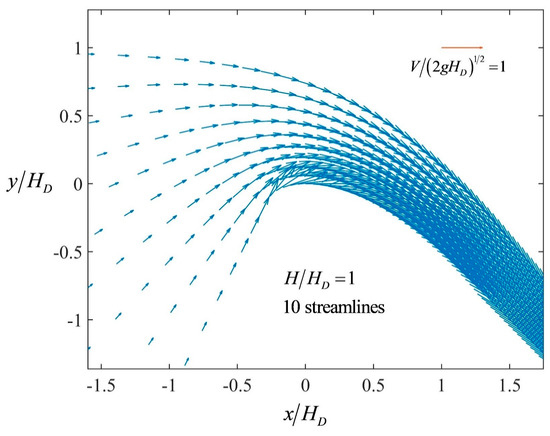
Figure 12.
Velocity field for H/HD = 1.
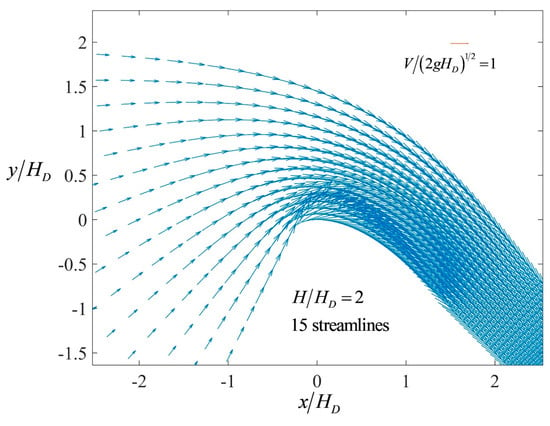
Figure 13.
Velocity field for H/HD = 2.
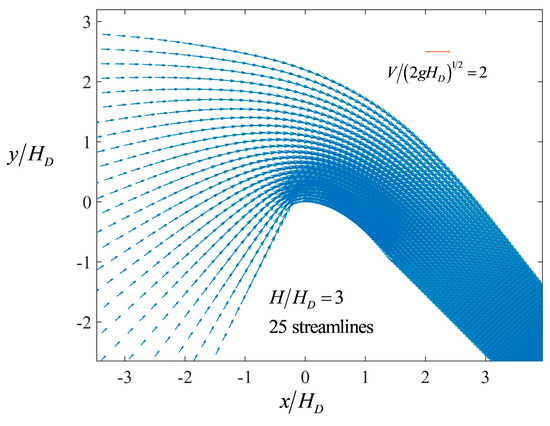
Figure 14.
Velocity field for H/HD = 3.
From these solutions, the variation in the velocity vector along the crest equipotential is plotted in Figure 15, where the vertical coordinate above the crest of the equipotential points is used in the vertical axis. Note that this is not the velocity profile along the vertical at the crest. Measurements by Hager [65] are plotted in the same figure for comparison purposes. The velocity field was measured by Hager [65] along the axis of the spillway model in two stages. First, deviations of streamlines from the horizontal were determined with an angle-probe. This flag-like device has an 8 mm × 16 mm thin rigid plate which may be positioned in the flow, thereby transducing the local angle of streamlines ±5° accurate to a reading instrument. Second, the modulus of velocity was determined by a miniature propeller meter of internal diameter 8 mm by externally setting the direction according to the local angle previously obtained. Thus, both the modulus and inclination with respect to the horizontal of the local velocity vector were determined at the measuring positions. In Figure 15, the measurements displayed are those for a vertical section at the spillway crest. Therefore, the comparison with the irrotational model is only qualitative. For small heads, the deviation of the crest equipotential from the vertical is weak, and the computed and measured velocity profiles are, therefore, in good agreement, e.g., for H/HD = 0.5 and 1. For higher heads, the deviations increase, with a notable shift near the free surface, as expected (e.g., see curve for H/HD = 3). This is not a failure of the model, it simply means that we are comparing a measured velocity profile vertically with a computed velocity profile along a curved equipotential; thus, the (x, y) coordinates of both sections diverge. Further, the experimental error measuring the velocity at high heads may contribute to the difference.
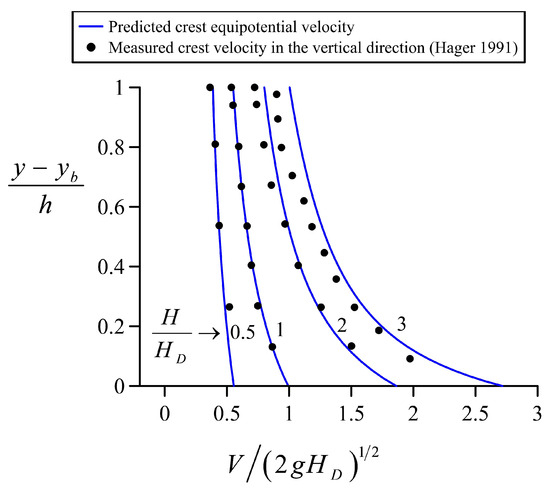
Figure 15.
Crest equipotential velocity profiles for H/HD = 0.5, 1, 2, and 3.
4.4. Flow Geometry
In this section, the flow nets for H/HD = 0.5, 1, 1.33, 2, and 3 were used to investigate the variation in streamline curvature along the equipotential curves in the crest zone. The region of interest included the whole upstream quadrant and a portion of the downstream quadrant of similar extension. To capture detailed variations in this zone, where curvature changes sharply, the analysis was conducted using 75 streamlines in the mathematical model. First, the flow geometry at the crest equipotential was analyzed in Figure 16, given that this curve is of paramount importance to understand the development of the approximate models for spillway flow [14,44,61]. Left panels in Figure 16 contain the fitting of Equation (42) to the curvature variation R(n) obtained from the flow net, forcing the fitting to satisfy R(0) = Rb. At the crest, there was a curvature discontinuity, which was 0.5HD for the upstream quadrant and infinity for the downstream quadrant. However, the effective value obtained from the simulations applying Equation (27) was always extremely close to 0.5HD in all cases, meaning that the discontinuity itself was not important. Data for the 75 streamlines were used while conducting the fitting. Here, was a least-squares parameter representing in an average sense the variation in streamline curvature. Note that decreased while H/HD increased, being always above 2.2., e.g., for H/HD = 3, the value obtained was 2.4376. Therefore, its order of magnitude agreed with the earlier fitting proposal by Jaeger [44]. The right panels present the fitting of a 6th-order polynomial to only the 25 streamlines close to the bed, e.g., they represent the near-bed variation in the streamline curvature. The fit was forced to satisfy R(0) = Rb. Note the excellent agreement of the fitting with the numerical data. Thus, it could be adopted as the Taylor series expansion of R(n) around the bed, with K = (∂R/∂n)b determined from Equation (37), e.g., the coefficient in the linear term of the series. This coefficient also decreased while H/HD increased, but its value was extremely far from 2.2; the lowest value obtained for H/HD = 3 was K = 4.3161. Note that the former average fitting poorly reproduced the near-bed variation. Therefore, was close to 2.2 at the crest, but (∂R/∂n)b was largely above this value. Jaeger’s theory should, therefore, be understood in a least-squares sense based on the flow net results of this study.
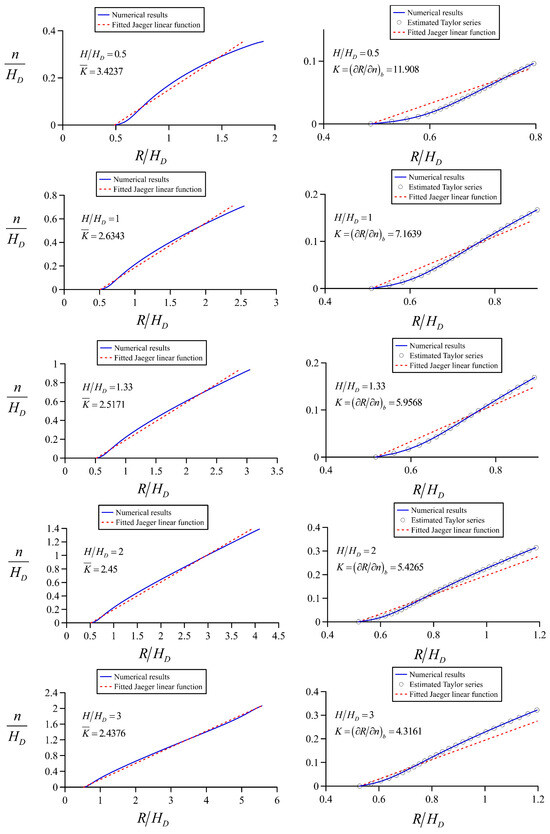
Figure 16.
Crest equipotential flow geometry analysis for H/HD = 0.5, 1, 1.33, 2, and 3: left panels contain the average fitting and right panels the near-bed variation.
Figure 17 contains an additional analysis of Jaeger’s theory, where the curvature variation at the crest equipotential is compared with his linear approximation K = 2.2, e.g., the recommended engineering value. This approach improves as the relative head increases, but at best, the curvature is only reasonably well reproduced for n/N < 0.4, e.g., in less than the lower half of the equipotential curve.
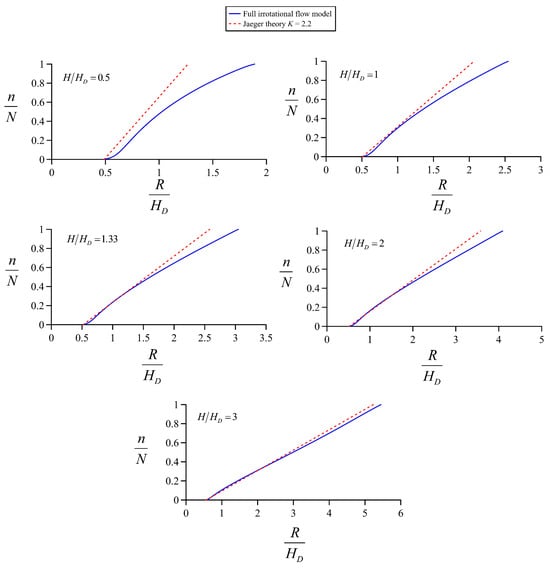
Figure 17.
Crest equipotential flow geometry analysis for H/HD = 0.5, 1, 1.33, 2, and 3: Comparison of flow net results with Jaeger’s theory for K = 2.2.
Now, the curvature variations are examined in the crest vicinity. Figure 18 contains the curvature variations near the bed for the two boundary equipotentials of the first arc in the upstream quadrant, where the bottom radius is Rb = 0.5HD. At the crest (point 1, Figure 18), the curvature variation presents an S-shape, with a fast increase in R near the bed. At the beginning of the first arc (point 2, Figure 18), there is a sharp reduction in the streamline radius of curvature with n near the bed, and it then begins to increase at a certain distance along the equipotential. The shape of both curves is totally different, given the significant differences in the behavior near the bed. For the crest equipotential, (∂R/∂n)b is larger than 0, but for equipotential 2, (∂R/∂n)b is smaller than 0. In this equipotential line, the streamlines near the bed have a positive θ value, which progressively reduces along the streamline direction s as the crest is approached until reaching a zero value. On the same equipotential line, near the free surface, θ is negative, and it progressively increases in magnitude along a streamline, keeping its sign until reaching the crest. This explains the curvature behavior at equipotential 2. A linear approximation to curve 2 in Figure 18 is rough and Jaeger’s theory cannot be considered an accurate approximation. Therefore, and the linear fitting given by Equation (42) are good in a physical sense in zones where K = (∂R/∂n)b > 0.
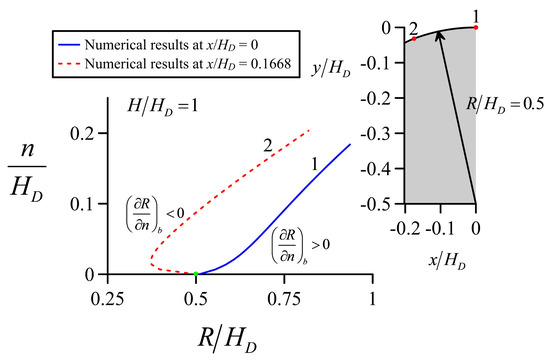
Figure 18.
Curvature variation near the bed within the first upstream arc.
Retaining these limitations, K = (∂R/∂n)b and were determined in the crest domain for H/HD = 0.5, 1, 1.33, 2, and 3, and the results are presented in Figure 19 and Figure 20, respectively.
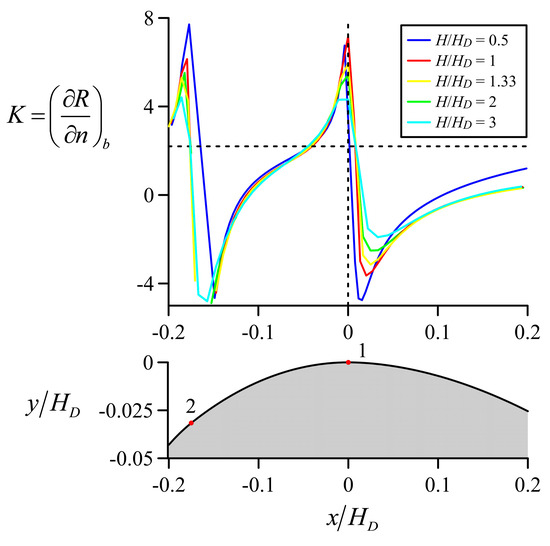
Figure 19.
Variation in K = (∂R/∂n)b in the crest domain.
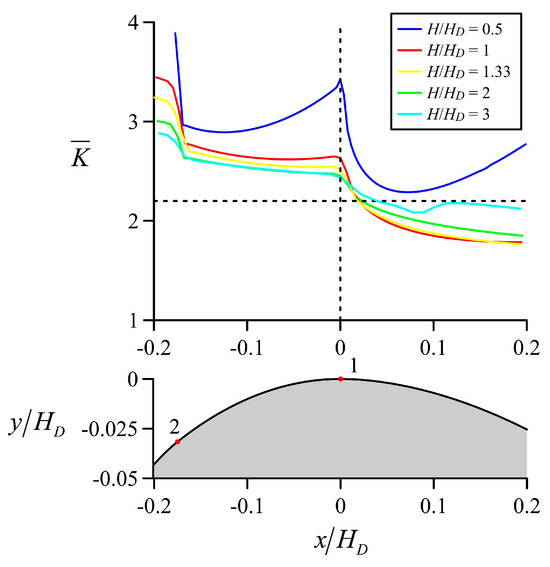
Figure 20.
Variation in in the crest domain.
Figure 19 depicts the extreme values reached by K away from the crest in both the up- and downstream directions. Note the sharp change at point 2, where the first and second arcs are joined, due to the discontinuity in the bed curvature. The portion of the up- and downstream quadrants with K = (∂R/∂n)b < 0 is significant. Very close to the crest, K = (∂R/∂n)b > 0. Values for presented in Figure 20 are always positive, but as discussed, these are questionable for the portions of the crest where K = (∂R/∂n)b < 0. At the crest, is a good approximation to model the curvature variation as K = (∂R/∂n)b > 0. For high heads fulfilling H/HD > 2, is close to 2.2. The conclusion is that Jaeger’s theory cannot be interpreted in terms of a Taylor series expansion of R around the bed. In turn, this renders the development only valid mathematically for those streamlines close to the bed, yet not applicable near the free surface. Looking at Jaeger’s approximation in an average sense, K regains a fitting meaning, in agreement with the flow net analysis. Jaeger’s linear approximation is a good approach in the crest vicinities, but its physical accuracy deteriorates quickly moving from the crest in both the up- and downstream directions. While this may be still acceptable for computing flow profiles using Jaeger’s theory [60], attempts to refine K values above or below 2.2 are not evident theoretically given the complex variation. Instead, K should be used as a fitting parameter based on available information in each situation.
4.5. Discharge Coefficient
The discharge coefficient obtained in the former simulations (α = 63.5°, w/HD = 10, β = 45°) by the irrotational flow model is compared in Figure 21a with Jaeger’s theory (K = 2.2, Rb = 0.5HD) and the experimental data by Rouse and Reid [68], Melsheimer and Murphy [6], and Hager [65]. The flow net results are in good agreement with measurements, especially with those by Hager [65]. Jaeger’s [44] theory is in remarkable agreement with the flow net model using K = 2.2, which in turn supports the use of this value. The irrotational simulations by Cassidy [38,39], who also conducted a solution in the complex potential plane W, are included, showing extremely large deviations between all the experimental data and our new theoretical computations. Therefore, this solution is not accurate, showing in turn the utility of the new accurate solution produced here in the W plane.
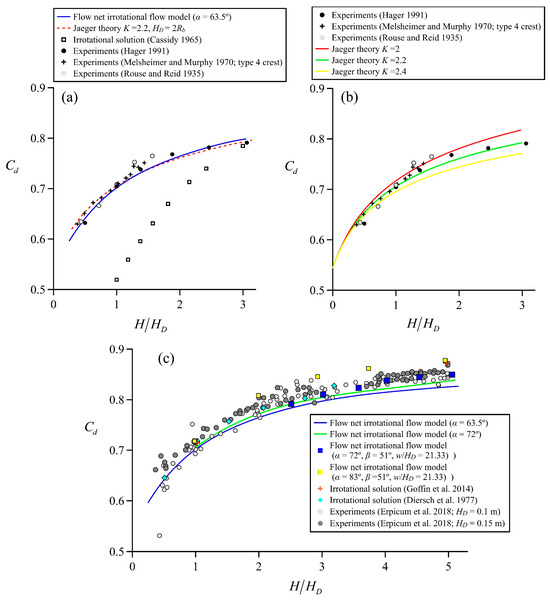
Figure 21.
Discharge characteristics of ogee spillway: (a) comparison of irrotational flow model with Jaeger’s theory for H/HD < 3.1, (b) impact of Jaeger parameter K, (c) comparison of the irrotational flow model outcomes with experiments and other solutions up to H/HD = 5.
The impact of K on the discharge characteristics of a spillway flow is highlighted in Figure 21b, where values of K = 2, 2.2, and 2.4 are considered. Note that a reduction in K down 2.2 implies stronger streamline curvature effects.
Figure 21c compares our theoretical model solutions with the experiments by Erpicum et al. (2018), conducted using two spillway models with β = 51° and HD = 0.1 m and 0.15 m, up to the extreme value H/HD = 5. For H/HD < 2, our irrotational solution agrees well with data of the spillway model for HD = 0.1 m, whereas data for HD = 0.15 m data are systematically shifted above. For H/HD > 2, all the experimental data are above our irrotational solution. This implies stronger curvature effects in the data than in our simulation. In general, the discharge coefficient is formulated as Cd = Cd(H/HD, tanα, tanβ, w/HD), implying that curvature effects will depend not only on the operational head [65], but also on the whole geometrical configuration. For example, the impact of the chute slope on Cd for high operational heads is unknown [65].
Additional simulations were conducted for α = 72.5°, w/HD = 10, β = 45°. The curve obtained and plotted in Figure 21c diverges from the former, particularly for H/HD > 1.5, but below this value, the effects can be neglected. The simulation is in excellent agreement with the results by Diersch et al. [40]. Still, the increase in the upstream face slope cannot explain the experimental data by Erpicum et al. [12]. A second set of simulations with α = 72.5°, w/HD = 21.33, β = 51° was conducted, e.g., with the weir height and chute slope in Erpicum et al.’s [12] setup. The increase in curvilinear effects by the steeper chute slope is notable for H/HD > 3.5. Finally, simulations with α = 83°, w/HD = 21.33, β = 51° were conducted, e.g., with an upstream vertical face from a practical viewpoint. Note how the simulation results produce an upper bound of the Erpicum et al.’s [12] experiments. This means, as expected, that the potential flow solutions are slightly above real fluid flow measurements [53]. Both the up- and downstream slopes force a curving of the flow net to such a degree that a notable increase in Cd is noted for H/HD > 1.5. Our simulation is in excellent agreement with that by Goffin et al. [69] for H/HD = 5. Moreover, for H/HD = 1 in our simulation, the simulation by Goffin et al. [69] and that by Diersch et al. [40] almost perfectly overlap. This confirms the accuracy of the three different irrotational flow solutions. Therefore, for H/HD < 1.5, one may set Cd = Cd(H/HD), but above this head it is suggested to include the impact of all the geometrical parameters on Cd. The irrotational flow solution by the new flow net model, and that by Goffin et al. [69], confirm that a potential flow approach is a feasible approximation to analyze fast and with enough accuracy flow over an ogee crest.
A consequence of the above findings is that K = K(H/HD, tanα, tanβ, w/HD) at the crest. Therefore, the value K = 2.2 suggested by Jaeger (1939) may be adopted for H/HD < 1.5 regardless of the chute slope. For Erpicum et al.’s [12] experiments, K = 2 is better for all the range of operational heads, given the increased curvature effects due to their steeper chute slope. For example, for the extreme test H/HD = 5, the analysis of the crest equipotential yields = 2.14. For practical purposes, to estimate the increased flow curvature due to the chute slope, one may adopt the following empirical equation:
The application of Jaeger’s theory to the datasets by Hager (45° chute angle) and Erpicum et al. [12] (51° chute angle) yields the results presented in Figure 22. Overall, this approach is accurate enough in practice and, theoretically, it explains why in the former work by Stilmant et al. [50] K = 2 produced a better fit to experiments than K = 2.2. Other approximations different to Jaeger’s theory are possible, yet this is a field so far weakly explored in spillway flow. The shallow water expansions using Picard iteration were recently found to be asymptotic for weir flow [70], thus only applicable for spillways operating at low heads. However, the Kantorovich–Krylov expansion for the velocity vector in a high-level Green–Naghdi variational theory was found to be convergent for weir flow, producing excellent results [71]. This technique could form the core of new approximations to model flows over ogee spillways and other hydraulic structures in the future, given that the order of expansion could be increased until reproducing high-head overflows with enough accuracy.
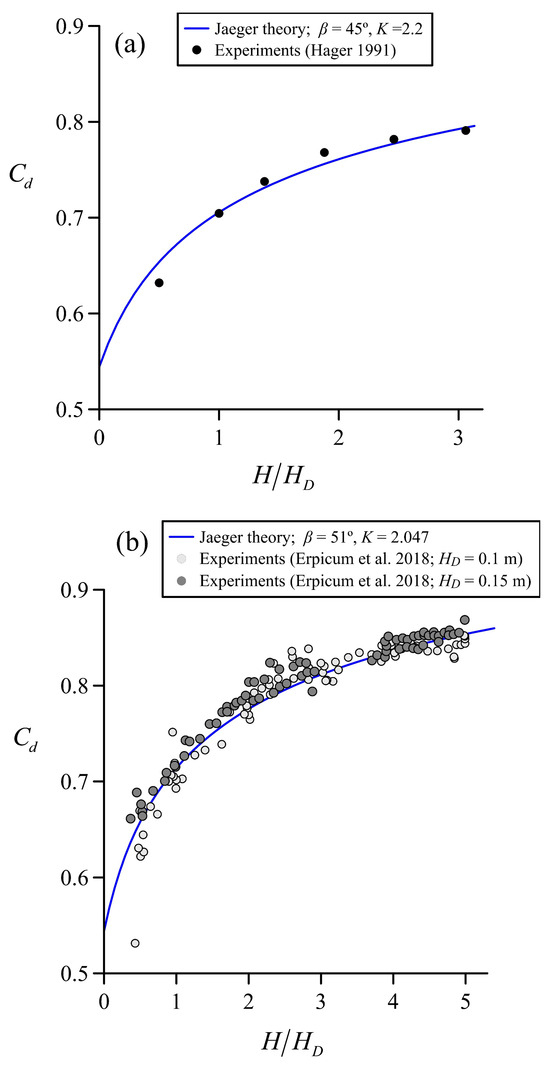
Figure 22.
Discharge characteristics of the ogee spillway using Jaeger’s theory: (a) 45° chute angle, (b) 51° chute angle; K estimated using Equation (68).
5. Limitations of the Proposed Method and Practical Utility
The proposed method involves the solution to the irrotational flow equations for an ogee shape, thereby resulting in the following limitations:
- -
- Complex flows involving turbulence and hydraulic jumps are excluded, like those which may appear at low weirs for high tailwater levels. It is the same with lateral contraction effects at abutments and piers, which are not considered in this study.
- -
- According to Vermeyen [72], under ideal entrance conditions, e.g., no lateral flow contraction when approaching the spillway, H/HD can reach a value of five on a spillway designed using the recommendation of USBR. However, under this flow condition, the nappe is unstable, and separation can occur from very small surface disturbances. Erpicum et al.’s [12] experiments conducted with WES profiles showed that at up to H/HD = 5 the flow is attached to the spillway surface, while separation occurs at H/HD = 5.5 [12]. The proposed method assumes that the flow is perfectly attached to the spillway surface, thus it cannot be applied for H/HD > 5, which was the upper limit adopted in our study.
The proposed irrotational model is, to our knowledge, so far, the only implementation with capabilities to automatically generate a computational flow net, including the free surface position, without trial estimations by eye, or graphical constructions. Further, it provides information about the flow geometry, thus it can be used to calibrate approximate theories producing analytical estimations of Cd, as in Stilmant et al. [50]. For example, in this work, we gave a calibration of Jaeger’s theory accounting for the chute slope effect in Cd. Such Cd formulas are useful for very fast hand computations during engineering studies.
While a CFD simulation can be used to generate the same results as our model, such a method involves large computational times [69], usually longer than a day, whereas our solver generates an approximate solution within seconds. This very low computation cost opens the door to unprecedented research and development on ogee crest spillways, for instance, considering new profile optimization to minimize cavitation risk while increasing discharge capacity. The proposed model is also perfectly suited for fast investigation at the early design stage of spillway-related projects, prior to CFD simulation, at a more advanced stage of the hydraulic study.
To highlight the efficiency of the proposed model, Table 2 presents the computation time as a function of the number of streamlines to model the flow over an ogee crest for H/HD = 1. As the number of streamlines increases, the number of equipotentials to cover the same physical space increases. The computation times are always generally small, on the order of a few seconds. For 25 streamlines, it was found in this work that results were accurate; thus, in general, more than 25 streamlines are not needed.

Table 2.
Computational efficiency as function of the number of streamlines for a test case with H/HD = 1. All the simulations involve 50 free surface iterations.
In addition, the practical utility of the proposed method relies on the following aspects:
- -
- For a standard ogee spillway, the design charts of USACE are available for limited operational flow conditions, e.g., up to H/HD = 1.5. However, in many circumstances, one may need data beyond that limit. For example, in dams experiencing the requirement to pass increased discharges because of a revised probable maximum flood, operational conditions may be much above H/HD = 1.5. This means that it may be necessary to investigate the safety conditions of the dam by estimating spillway operation for high overflow conditions, e.g., those up to H/HD = 5 [13,72]. Such operation above the design head is not well known and requires investigation. For instance, it has been shown in this work that the chute slope has a notable impact on Cd for heads 3 < H/HD < 5. To our best knowledge, this has never been previously reported.
- -
- Real spillway crests at existing dams may not correspond to standard crest shapes. For practical construction reasons (simplifications by approximate geometries or deviations during execution) or simply because the dam commissioning date was far before the proposal of the currently recommended ogee crest profile, the actual profiles of spillways rarely correspond exactly to the theoretical profile [12,13]. The dams operated by Electricité de France (EDF) are no exception to this observation, particularly for the upstream quadrant of the spillways, as illustrated by Erpicum et al. [13] for 27 real dams in France. This great heterogeneity of the upstream quadrant profiles can have a significant impact on spillway flow features. It is well known that the geometry of the upstream quadrant is of paramount importance in spillway operation [68], with a significant impact on the flow features. For these dams, design charts are not available, and the proposed theoretical method can be used to generate a fast analysis of the operational conditions using the real spillway profile.
- -
- Finally, the proposed model may be used to propose new designs for the overflow crest of a spillway considering cavitation conditions [2], given that the bottom pressure distribution is easily obtained.
6. Conclusions
In this work, a new method for the fast computing of irrotational flow solutions over ogee spillways is proposed. It entails a new iterative method in the complex potential plane, including an automatic determination of the critical point, unknown energy head, and free surface profile. A novel method for handling the singularity at the stagnation point is presented, and the pressure head on the free surface is set exactly to zero at all nodes during iterations, contrary to former methods. Solutions are compared with observations up to the high operational head of H/HD = 5, resulting in good agreement. Therefore, the new method could be used in practice for conducting fast simulations and optimizing designs before constructing a physical model or performing more accurate but time-consuming CFD simulations. From a theoretical viewpoint, it is the only fully automatic flow net computational method so far available for spillway flow, in contrast to former graphical solutions using Prasil’s method, or trial-and-error solutions guided by eye inspection.
An additional application of the flow net model proposed is its use to investigate approximate potential flow models for spillway flows, like those based on Jaeger’s theory. By a detailed flow net geometry analysis so far not available, it is revealed that the near-bed variation in the radius of streamline curvature R is not compatible with the values needed in Jaeger’s theory for its K-parameter. In turn, it was found that the parameter values required to correctly simulate the discharge characteristics are close to those obtained from the flow net in a least-squares sense if R varies linearly along an equipotential curve.
For H/HD < 1.5, the discharge characteristics can be assumed to be independent of both the up- and downstream bottom slopes, with K = 2.2 as an accurate enough value. However, for higher heads, the consideration of the actual slopes is important. In turn, the chute slope was found to have a notable impact on Cd for heads 3 < H/HD < 5, thereby reducing K to the order of 2 due to the increased streamline curvature effects imposed. An empirical equation is, therefore, proposed to account for this effect in Jaeger’s theory.
Further research is needed to improve the iteration of the initial solution if the upstream slope is vertical, as well as to find other filters to stabilize computations. Other approximations different from Jaeger’s theory should be explored, like high-level Green–Naghdi solutions, which could form the core of new methods to model high-head spillway flows.
Author Contributions
Conceptualization, O.C.-O. and W.H.H.; methodology, O.C.-O., W.H.H., Y.G., S.E. and F.N.C.-C.; software, O.C.-O.; validation, O.C.-O.; formal analysis, O.C.-O., W.H.H., Y.G., S.E. and F.N.C.-C.; investigation, O.C.-O., W.H.H., Y.G., S.E. and F.N.C.-C.; resources, O.C.-O., W.H.H., Y.G., S.E. and F.N.C.-C.; writing—original draft preparation, O.C.-O., W.H.H., Y.G., S.E. and F.N.C.-C.; writing—review and editing, O.C.-O., W.H.H., Y.G., S.E. and F.N.C.-C.; visualization, O.C.-O., W.H.H., Y.G., S.E. and F.N.C.-C.; supervision, O.C.-O., W.H.H., Y.G., S.E. and F.N.C.-C. All authors have read and agreed to the published version of the manuscript.
Funding
This research received no external funding.
Data Availability Statement
Data generated are available upon contact with the corresponding author.
Acknowledgments
The work of O. Castro-Orgaz was supported by the grant María de Maeztu for Centers and Units of Excellence in R&D (Ref. CEX2019-000968-M).
Conflicts of Interest
The authors declare no conflicts of interest.
References
- Hager, W.H.; Schleiss, A. Constructions hydrauliques: Ecoulements Stationnaires (Hydraulic Structures: Steady Flows); Traité de génie civil, 15; Presses Polytechniques Universitaires Romandes: Lausanne, Switzerland, 2009. (In French) [Google Scholar]
- Hager, W.H.; Schleiss, A.J.; Boes, R.M.; Pfister, M. Hydraulic Engineering of Dams; CRC Press: London, UK, 2021. [Google Scholar]
- Creager, W.P. Engineering for Masonry Dams; Wiley and Sons: New York, NY, USA, 1917. [Google Scholar]
- USACE. Hydraulic Design Criteria; U.S. Army Waterways Experiment Station: Vicksburg, MI, USA, 1987. [Google Scholar]
- USACE. Hydraulic Design of Spillways; U.S. Army Corps of Engineers: Washington, DC, USA, 1990. [Google Scholar]
- Melsheimer, E.S.; Murphy, T.E. Investigations of Various Shapes of the Upstream Quadrant of the Crest of a High Spillway: Hydraulic Laboratory Investigation; U.S. Army Engineer Waterways Experiment Station: Vicksburg, MS, USA, 1970. [Google Scholar]
- Murphy, T.E. Spillway Crest Design; U.S. Army Engineer Waterways Experiment Station: Vicksburg, MS, USA, 1973. [Google Scholar]
- Maynord, S.T. General Spillway Investigation: Hydraulic Model Investigation; U.S. Army Engineer Waterways Experiment Station: Vicksburg, MS, USA, 1985. [Google Scholar]
- Reese, A.J.; Maynord, S.T. Design of Spillway Crests. J. Hydraul. Eng. 1987, 113, 476–490. [Google Scholar] [CrossRef]
- Knapp, F.H. Ausfluss, Überfall und Durchfluss im Wasserbau (Outflow, Overflow and Throughflow in Hydraulic Engineering); Braun: Karlsruhe, Germany, 1960. (In German) [Google Scholar]
- Hager, W.H. Continuous crest profile for standard spillway. J. Hydraul. Eng. 1987, 113, 1453–1457. [Google Scholar] [CrossRef]
- Erpicum, S.; Blancher, B.; Vermeulen, J.; Peltier, Y.; Archambeau, P.; Dewals, B.; Pirotton, M. Experimental study of Ogee crested weir operation above the design head and influence of the upstream quadrant geometry. In Proceedings of the 7th International Symposium on Hydraulic Structures, Aachen, Germany, 15 May 2018. [Google Scholar]
- Erpicum, S.; Pirotton, M.; Blancher, B.; Vermeulen, J. Influence de la géométrie du quadrant amont et comportement hydraulique sous forte charge des seuils profilés standards. La Houille Blanche 2019, 105, 40–47. [Google Scholar] [CrossRef]
- Peltier, Y.; Dewals, B.; Archambeau, P.; Pirotton, M.; Erpicum, S. Pressure and Velocity on an Ogee Spillway Crest Operating at High Head Ratio: Experimental Measurements and Validation. J. Hydro-Environ. Res. 2018, 19, 128–136. [Google Scholar] [CrossRef]
- Erpicum, S.; Crookston, B.; Bombardelli, F.; Bung, D.; Felder, S.; Mulligan, S.; Oertel, M.; Palermo, M. Hydraulic structures engineering: An evolving science in a changing world. Wiley Interdiscip. Rev. Water 2021, 8, e1505. [Google Scholar] [CrossRef]
- Rouse, H. The Distribution of Hydraulic Energy in Weir Flow in Relation to Spillway Design. Master’s Thesis, MIT, Boston, MA, USA, 1932. [Google Scholar]
- Escande, L. Détermination pratique du profile optimum d’un barrage déversoir: Tracé des piles par les méthodes aérodynamiques. Application à un ouvrage déterminé (Practical determination of the optimum weir profile: Pier shape using aerodynamic methods, application to prototype structure). Sci. Ind. 1993, 17, 467–474. (In French) [Google Scholar]
- Ishihara, T.; Iwasa, Y.; Ihda, K. Basic studies on hydraulic performances of overflow spillways and diversion weirs. Bull. Disaster Prev. Res. Inst. 1960, 33, 1–30. [Google Scholar]
- Sivakumaran, N.S.; Hosking, R.J.; Tingsanchali, T. Steady shallow flow over a spillway. J. Fluid Mech. 1981, 111, 411–420. [Google Scholar] [CrossRef]
- Vallentine, H.R. Applied Hydrodynamics; Butterworths: London, UK, 1969. [Google Scholar]
- Castro-Orgaz, O.; Hager, W.H. Non-Hydrostatic Free Surface Flows; Advances in Geophysical and Environmental Mechanics and Mathematics; Springer: Berlin/Heidelberg, Germany, 2017; 696p. [Google Scholar] [CrossRef]
- Katopodes, N.D. Free Surface Flow: Computational Methods; Butterworth-Heinemann: Oxford, UK, 2019. [Google Scholar]
- Rouse, H. Fluid Mechanics for Hydraulic Engineers; McGraw-Hill: New York, NY, USA, 1938. [Google Scholar]
- Castro-Orgaz, O. Hydraulics of developing chute flow. J. Hydraul. Res. 2009, 47, 185–194. [Google Scholar] [CrossRef]
- Ikegawa, M.; Washizu, K. Finite element method applied to analysis of flow over a spillway crest. Int. J. Numer. Methods Eng. 1973, 6, 179–189. [Google Scholar] [CrossRef]
- Nakayama, T.; Ikegawa, M. Finite element analysis of flow over a weir. Comput. Struct. 1984, 19, 129–135. [Google Scholar] [CrossRef]
- Henderson, H.C.; Kok, M.; De Koning, W.L. Computer-aided spillway design using the boundary element method and non-linear programming. Int. J. Numer. Methods Fluids 1991, 13, 625–641. [Google Scholar] [CrossRef]
- Ding, D.Y.; Liu, M.L. Mathematical model of flow over a spillway dam. In Proceedings of the 13th International Congress on Large Dams, New Delhi, India, 29 October–2 November 1979; Volume Q50, pp. 959–976. [Google Scholar]
- Ding, D.Y. A numerical method of flow over spillway dam with unknown energy head. Acta Mech. Sin. 1985, 17, 300–308. (In Chinese) [Google Scholar]
- Guo, Y.; Wen, X.; Wu, C.; Fang, D. Numerical modelling of spillway flow with free drop and initially unknown discharge. J. Hydraul. Res. 1998, 36, 785–801. [Google Scholar]
- Tu, R. Free Boundary Potential Flow Using Finite Elements. Ph.D. Thesis, University of Arizona, Department of Civil Engineering and Engineering Mechanics, Tucson, AZ, USA, 1971. [Google Scholar]
- Cheng, A.H.-D.; Liggett, J.A.; Liu, P.L.-F. Boundary calculations of sluice and spillway flows. J. Hydraul. Div. 1981, 107, 1163–1178. [Google Scholar] [CrossRef]
- Liggett, J.A. The Boundary Element Method. Engineering Applications of Computational Hydraulics; Pitman Publisher: Boston, MA, USA, 1982; Chapter 8; Volume I. [Google Scholar]
- Lai, C.; Hromadka, T.D. Modeling complex two-dimensional flows by the complex-variable boundary-element method. In Proceedings of the International Symposium on Refined Flow Modelling and Turbulence Measurements, Iowa City, IA, USA, 16–18 September 1985; G-26-1/10;. University of Iowa: Iowa City, IA, USA, 1985; Volume II. [Google Scholar]
- Barbier, C. Computer algebra and transputers applied to the finite element method. Ph.D. Thesis, Durham University, Durham, UK, 1992. [Google Scholar]
- Castro-Orgaz, O.; Hager, W.H. Analytical determination of irrotational flow profiles in open-channel transitions. Water 2023, 15, 4217. [Google Scholar] [CrossRef]
- Thom, A.; Apelt, C. Field Computations in Engineering and Physics; Van Nostrand: London, UK, 1961. [Google Scholar]
- Cassidy, J.J. Spillway Discharge at Other than Design Head; State University of Iowa: Iowa City, IA, USA, 1964. [Google Scholar]
- Cassidy, J.J. Irrotational flow over spillways of finite height. J. Eng. Mech. Div. 1965, 91, 155–173. [Google Scholar] [CrossRef]
- Diersch, H.J.; Schirmer, A.; Busch, K.F. Analysis of flows with initially unknown discharge. J. Hydraul. Div. 1977, 103, 213–232. [Google Scholar] [CrossRef]
- Escande, L. Sur L’emploi des Barrages Déversoirs à Seuil Creager Déprimé (On the Use of Creager-Crested Dams). Chapitre VII in Nouveaux Compléments d’Hydraulique; Nº280; Publications Scientifiques et Techniques du ministère de L’Air: Paris, France, 1953. (In French) [Google Scholar]
- Jaeger, C. Engineering Fluid Mechanics; Blackie and Son: Edinburgh, UK, 1956. [Google Scholar]
- Fawer, C. Etude de quelques écoulements permanents à filets courbes (Study of some steady flows with curved streamlines). Ph.D. Thesis, Université de Lausanne, La Concorde, Lausanne, Switzerland, 1937. (In French). [Google Scholar]
- Jaeger, C. Remarques sur quelques écoulements le long des lits à pente variant graduellement (Remarks on some flows along bottoms of gradually varied slope). Schweiz. Bauztg. 1939, 114, 231–234. (In French) [Google Scholar]
- Sananes, F. Étude de l’écoulement sur un seuil circulaire muni d’une fente aspiratrice (Study of flow over a circular sill with an air-entraining slot). Comptes Rendus Académie Sci. 1955, 241, 1262–1264. [Google Scholar]
- Sananes, F. Étude du décollement de la veine dans l’écoulement au-dessus d’un seuil déversant (Study of flow separation above a weir). Comptes Rendus L’académie Sci. 1958, 246, 1971–1973. [Google Scholar]
- Castro-Orgaz, O. Curvilinear flow over round-crested weirs. J. Hydraul. Res. 2008, 46, 543–547. [Google Scholar] [CrossRef]
- Castro-Orgaz, O.; Giraldez, J.V.; Ayuso, J.L. Critical flow over circular crested weirs. J. Hydraul. Eng. 2008, 134, 1661–1664. [Google Scholar] [CrossRef]
- Castro-Orgaz, O.; Giraldez, J.V.; Ayuso, J.L. Higher order critical flow condition in curved streamline flow. J. Hydraul. Res. 2008, 46, 849–853. [Google Scholar] [CrossRef]
- Stilmant, F.; Erpicum, S.; Peltier, Y.; Archambeau, P.; Dewals, B.; Pirotton, M. Flow at an Ogee Crest Axis for a Wide Range of Head Ratios: Theoretical Model. Water 2022, 14, 2337. [Google Scholar] [CrossRef]
- Castro-Orgaz, O. Weakly undular hydraulic jump: Effects of friction. J. Hydraul. Res. 2010, 48, 453–465. [Google Scholar] [CrossRef]
- Milne-Thomson, L.M. Theoretical Hydrodynamics; MacMillan: London, UK, 1962. [Google Scholar]
- Montes, J.S. Hydraulics of Open Channel Flow; ASCE Press: Reston VA, USA, 1998. [Google Scholar]
- Chow, V.T. Open Channel Hydraulics; McGraw-Hill: New York, NY, USA, 1959. [Google Scholar]
- Henderson, F.M. Open Channel Flow; MacMillan: New York, NY, USA, 1966. [Google Scholar]
- Castro-Orgaz, O.; Hager, W.H. Shallow Water Hydraulics; Springer: Berlin/Heidelberg, Germany, 2019; 563p. [Google Scholar] [CrossRef]
- Bos, M.G. Discharge Measurement Structures; Publication 20; International Institute for Land Reclamation and Improvement (ILRI): Wageningen, The Netherlands, 1976. [Google Scholar]
- Varoḡlu, E.; Finn, W.D. Variable domain finite element analysis of free surface gravity flow. Comput. Fluids 1978, 6, 103–114. [Google Scholar] [CrossRef]
- Bettess, P.; Bettess, J. Analysis of free surface flows using isoparametric finite elements. Int. J. Numer. Methods Eng. 1983, 19, 1675–1689. [Google Scholar] [CrossRef]
- Castro-Orgaz, O.; Hager, W.H. Comment to Flow at an ogee crest axis for a wide range of head ratios: Theoretical model. Water 2024, 16, 231. [Google Scholar] [CrossRef]
- Montes, J.S. Flow over round crested weirs. L’Energ. Elettr. 1970, 47, 155–164. [Google Scholar]
- Southwell, R.V.; Vaisey, G. Relaxation methods applied to engineering problems XII: Fluid motions characterized by free streamlines. Philos. Trans. R. Soc. Lond. A 1946, 240, 117–161. [Google Scholar]
- Hay, N.; Markland, E. The determination of the discharge over weirs by the electrolytic tank. Proc. Inst. Civ. Eng. 1958, 10, 59–86. [Google Scholar] [CrossRef]
- Ganguli, M.K.; Roy, S.K. On the standardisation of the relaxation treatment of systematic pressure computations for overflow spillway discharge. Irrig. Power 1952, 9, 187–204. [Google Scholar]
- Hager, W.H. Experiments on standard spillway flow. Proc. Inst. Civ. Eng. 1991, 91, 399–416. [Google Scholar]
- Selby, S.M. Standard Mathematical Tables; CRC: Cleveland, OH, USA, 1973. [Google Scholar]
- Savage, B.M.; Johnson, M.C. Flow over ogee spillway: Physical and Numerical Model Case Study. J. Hydraul. Eng. 2001, 127, 640–649. [Google Scholar] [CrossRef]
- Rouse, H.; Reid, L. Model research on spillway crests. Civ. Eng. 1935, 5, 10–14. [Google Scholar]
- Goffin, L.; Erpicum, S.; Dewals, B.J.; Pirotton, M.; Archambeau, P. How to simulate quickly and efficiently a flow over a spillway? In Proceedings of the 5th International Junior Researcher and Engineer Workshop on Hydraulic Structures, Spa, Belgium, 28–30 August 2014. [Google Scholar]
- Castro-Orgaz, O.; Cantero-Chinchilla, F.N.; Hager, W.H. High-order shallow water expansions in free surface flows: Application to steady overflow processes. Ocean. Eng. 2022, 250, 110717. [Google Scholar] [CrossRef]
- Castro-Orgaz, O.; Gamero-Ojeda, P.P.; Cantero-Chinchilla, F.N.; Morales de Luna, T.; Chanson, H. Application of high-level Green Naghdi theory to sill-controlled flows. Environ. Fluid Mech. 2024, 24, 19–56. [Google Scholar] [CrossRef]
- Vermeyen, T.B. Uncontrolled Ogee Crest Research; US Department of the Interior, Bureau of Reclamation: Washington, DC, USA, 1992; Available online: www.usbr.gov/tsc/techreferences/hydraulics_lab/pubs/PAP/PAP-0609.pdf (accessed on 11 December 2017).
Disclaimer/Publisher’s Note: The statements, opinions and data contained in all publications are solely those of the individual author(s) and contributor(s) and not of MDPI and/or the editor(s). MDPI and/or the editor(s) disclaim responsibility for any injury to people or property resulting from any ideas, methods, instructions or products referred to in the content. |
© 2024 by the authors. Licensee MDPI, Basel, Switzerland. This article is an open access article distributed under the terms and conditions of the Creative Commons Attribution (CC BY) license (https://creativecommons.org/licenses/by/4.0/).