Article

Life-Cycle Analysis of Natural Treatment Systems for Wastewater (NTSW) Applied to Municipal Effluents

by
Nicolau Chirinza
1,
Federico A. Leon Zerpa
2,*,
Paulino Muguirrima
1,
Tania del Pino García
2,
Gilberto Martel Rodriguez
3,
Camila Gutierrez
3 and
Carlos A. Mendieta Pino
2
1
Faculty of Science and Technology, Zambezi University (Unizambeze), Beira 2100, Mozambique
2
Institute of Environmental Studies and Natural Resources (iUNAT), University of Las Palmas de Gran Canaria, 35001 Canary, Spain
3
Canary Islands Institute of Technology (ITC), Gobierno de Canarias, 35001 Canary, Spain
*
Author to whom correspondence should be addressed.
Water 2024, 16(18), 2653; https://doi.org/10.3390/w16182653
Submission received: 12 August 2024 / Revised: 6 September 2024 / Accepted: 16 September 2024 / Published: 18 September 2024
(This article belongs to the Section Urban Water Management)

Abstract

:
The objective of the described activity is to develop technologies or proposals that can be implemented within the cycle to enhance the relationship between climate change, water, energy, and food. The focus is on analyzing natural treatment systems for wastewater (NTSW) within the context of Macaronesia, considering factors such as life-cycle assessment (LCA), carbon footprint, impacts, and mitigation capacity. The analysis of real case data from the Canary Islands and Cape Verde will inform the development of appropriate technologies tailored to different areas and scales within Macaronesia. This work includes a comprehensive life-cycle analysis of the Santa Catarina (Cape Verde) NTSW. This analysis encompasses: (a) Inventory analysis of the construction phase: This involves the assessment of inputs and outputs associated with the construction of the NTSW, including materials, energy consumption, transportation, and waste generation. The maintenance and operation phases are then evaluated, with a focus on the ongoing maintenance and operation activities required for the NTSW, including energy consumption, water usage, chemical inputs (if any), labor, and equipment maintenance. (b) Finally, the impacts of the NTSW are evaluated. The environmental, social, and economic impacts generated by the NTSW are assessed. This includes an analysis of factors such as carbon emissions, water usage, land use, ecosystem impacts, human health effects, and economic costs. By conducting a comprehensive analysis of the Santa Catarina NTSW, the document aims to provide insights into the environmental performance and sustainability of the system. This information can then be used as a tool and experience of educational innovation for final-year undergraduate students to identify areas for improvement, develop mitigation strategies in the water sector, and inform decision-making processes regarding wastewater treatment technologies in Macaronesia. Furthermore, lessons learned from real case studies in the Canary Islands and Cape Verde can be applied to similar regions within the Macaronesia archipelago (IDIWATER project).

1. Introduction

The literature suggests various waste-management strategies, including conventional treatments, with outcomes varying depending on farm type [1,2,3,4]. Natural treatment systems for wastewater (NTSW) have emerged as viable options for both urban and rural settings due to their low energy requirements, effective contaminant removal capabilities, and potential for effluent reuse [5,6,7,8,9,10,11,12]. NTSW, as defined in the essay, are treatment systems where effluent storage involves high residence times, allowing organic matter degradation by bacterial activity. These systems are referred to in the scientific literature as unconventional technologies, low-cost systems, soft technologies, green systems, and others. The key differences between NTSW and conventional systems include zero energy consumption for removal and a larger treatment surface area. NTSW harnesses the synergy of physical, chemical, and biological processes found in nature. It has demonstrated suitability across various applications, including urban and rural contexts, with high pollutant-removal capacities and opportunities for effluent reuse. On Gran Canaria Island, NTSW solutions have been trialed in remote rural areas [13,14,15], yielding promising results with removal efficiencies exceeding 75% for chemical oxygen demand (COD) and 90% for total suspended solids (TSS).
The life-cycle assessment (LCA) is defined as a methodology for evaluating the environmental impacts of a product system throughout its life cycle. This life cycle encompasses all consecutive and interrelated stages, from the acquisition of raw materials to final disposal. LCA involves collecting and assessing data regarding inputs, outputs, and potential environmental impacts associated with each stage of the product system’s life cycle. Depending on the specific objectives of the assessment, LCA can be conducted at different levels of detail, resulting in three main types. The first type is a qualitative study that identifies the most significant impacts generically. The second type is a more comprehensive LCA that focuses on the most important steps and analyzes the most important data. The final type is the most intricate, as it involves a comprehensive analysis of the impacts, stages, and inventory at both qualitative and quantitative levels [16,17,18,19]. The LCA covers all stages of the system’s life cycle, from the extraction and processing of raw materials for construction to its operation and maintenance. By conducting a comprehensive LCA, it aims to provide an estimate of the environmental impacts associated with each stage of the system’s life cycle. Furthermore, the results of this LCA can serve as a valuable tool for decision-making in the planning of wastewater treatment and reuse models in similar areas. It can provide insights into the environmental implications of different treatment options, helping stakeholders make informed choices that prioritize sustainability and minimize environmental harm. Ultimately, this LCA contributes to the development of a decision-making guide for sustainable wastewater management in regions with characteristics like those studied [20,21,22,23,24].
The aim of this study is to evaluate the environmental impact of a natural wastewater treatment system, which is design to reuse, throughout its entire life cycle using life-cycle assessment (LCA). The system is designed to treat wastewater discharges from the municipality of Santa Catarina, with a focus on the Achada Galego locality on the island of Santiago, Cape Verde. Currently, the system operates at a flow rate of 140 m3 per day, although it was designed for a maximum capacity of 200 m3 per day [25,26,27,28]
The novelty of this study is that the data used were collected from the operational NDS located in Santa Catarina, a region considered into the IDIWATER project (DESAL+ LIVING LAB); co-financed by the European Interreg MAC Programme 2021-2027. In contrast, most other studies are conducted in pilot plants. However, this study considers the impact of real-world factors such as rainfall, droughts, population density, and wastewater generation. Furthermore, the subsequent application of treated water, either for irrigation or direct discharge, is a further innovation. This is due to the properties of the treated water. It was not possible to consider the use of water for irrigation in this study due to a lack of information and knowledge regarding its application in the program, necessitating further study.

2. Materials and Methods

NTSW is located on the island of Santiago (Cape Verde), in the locality of Achada Galego (N: 15.05′ 49.99, W: 234,101.75). This pilot project is financed by the Spanish Cooperation and aims to provide Cape Verde with a system for the storage, treatment, and distribution of treated wastewater for agricultural purposes. The planned infrastructure takes as a reference a small experimental part of the reuse of treated wastewater carried out in the framework of the ADAPTaRES project at the Santa Catarina NTSW, co-financed in this case by the European Interreg MAC Program 2014–2020 and Canary Islands Technological Institute (ITC). The facility is designed for a population equivalent of 1600 inhabitants.

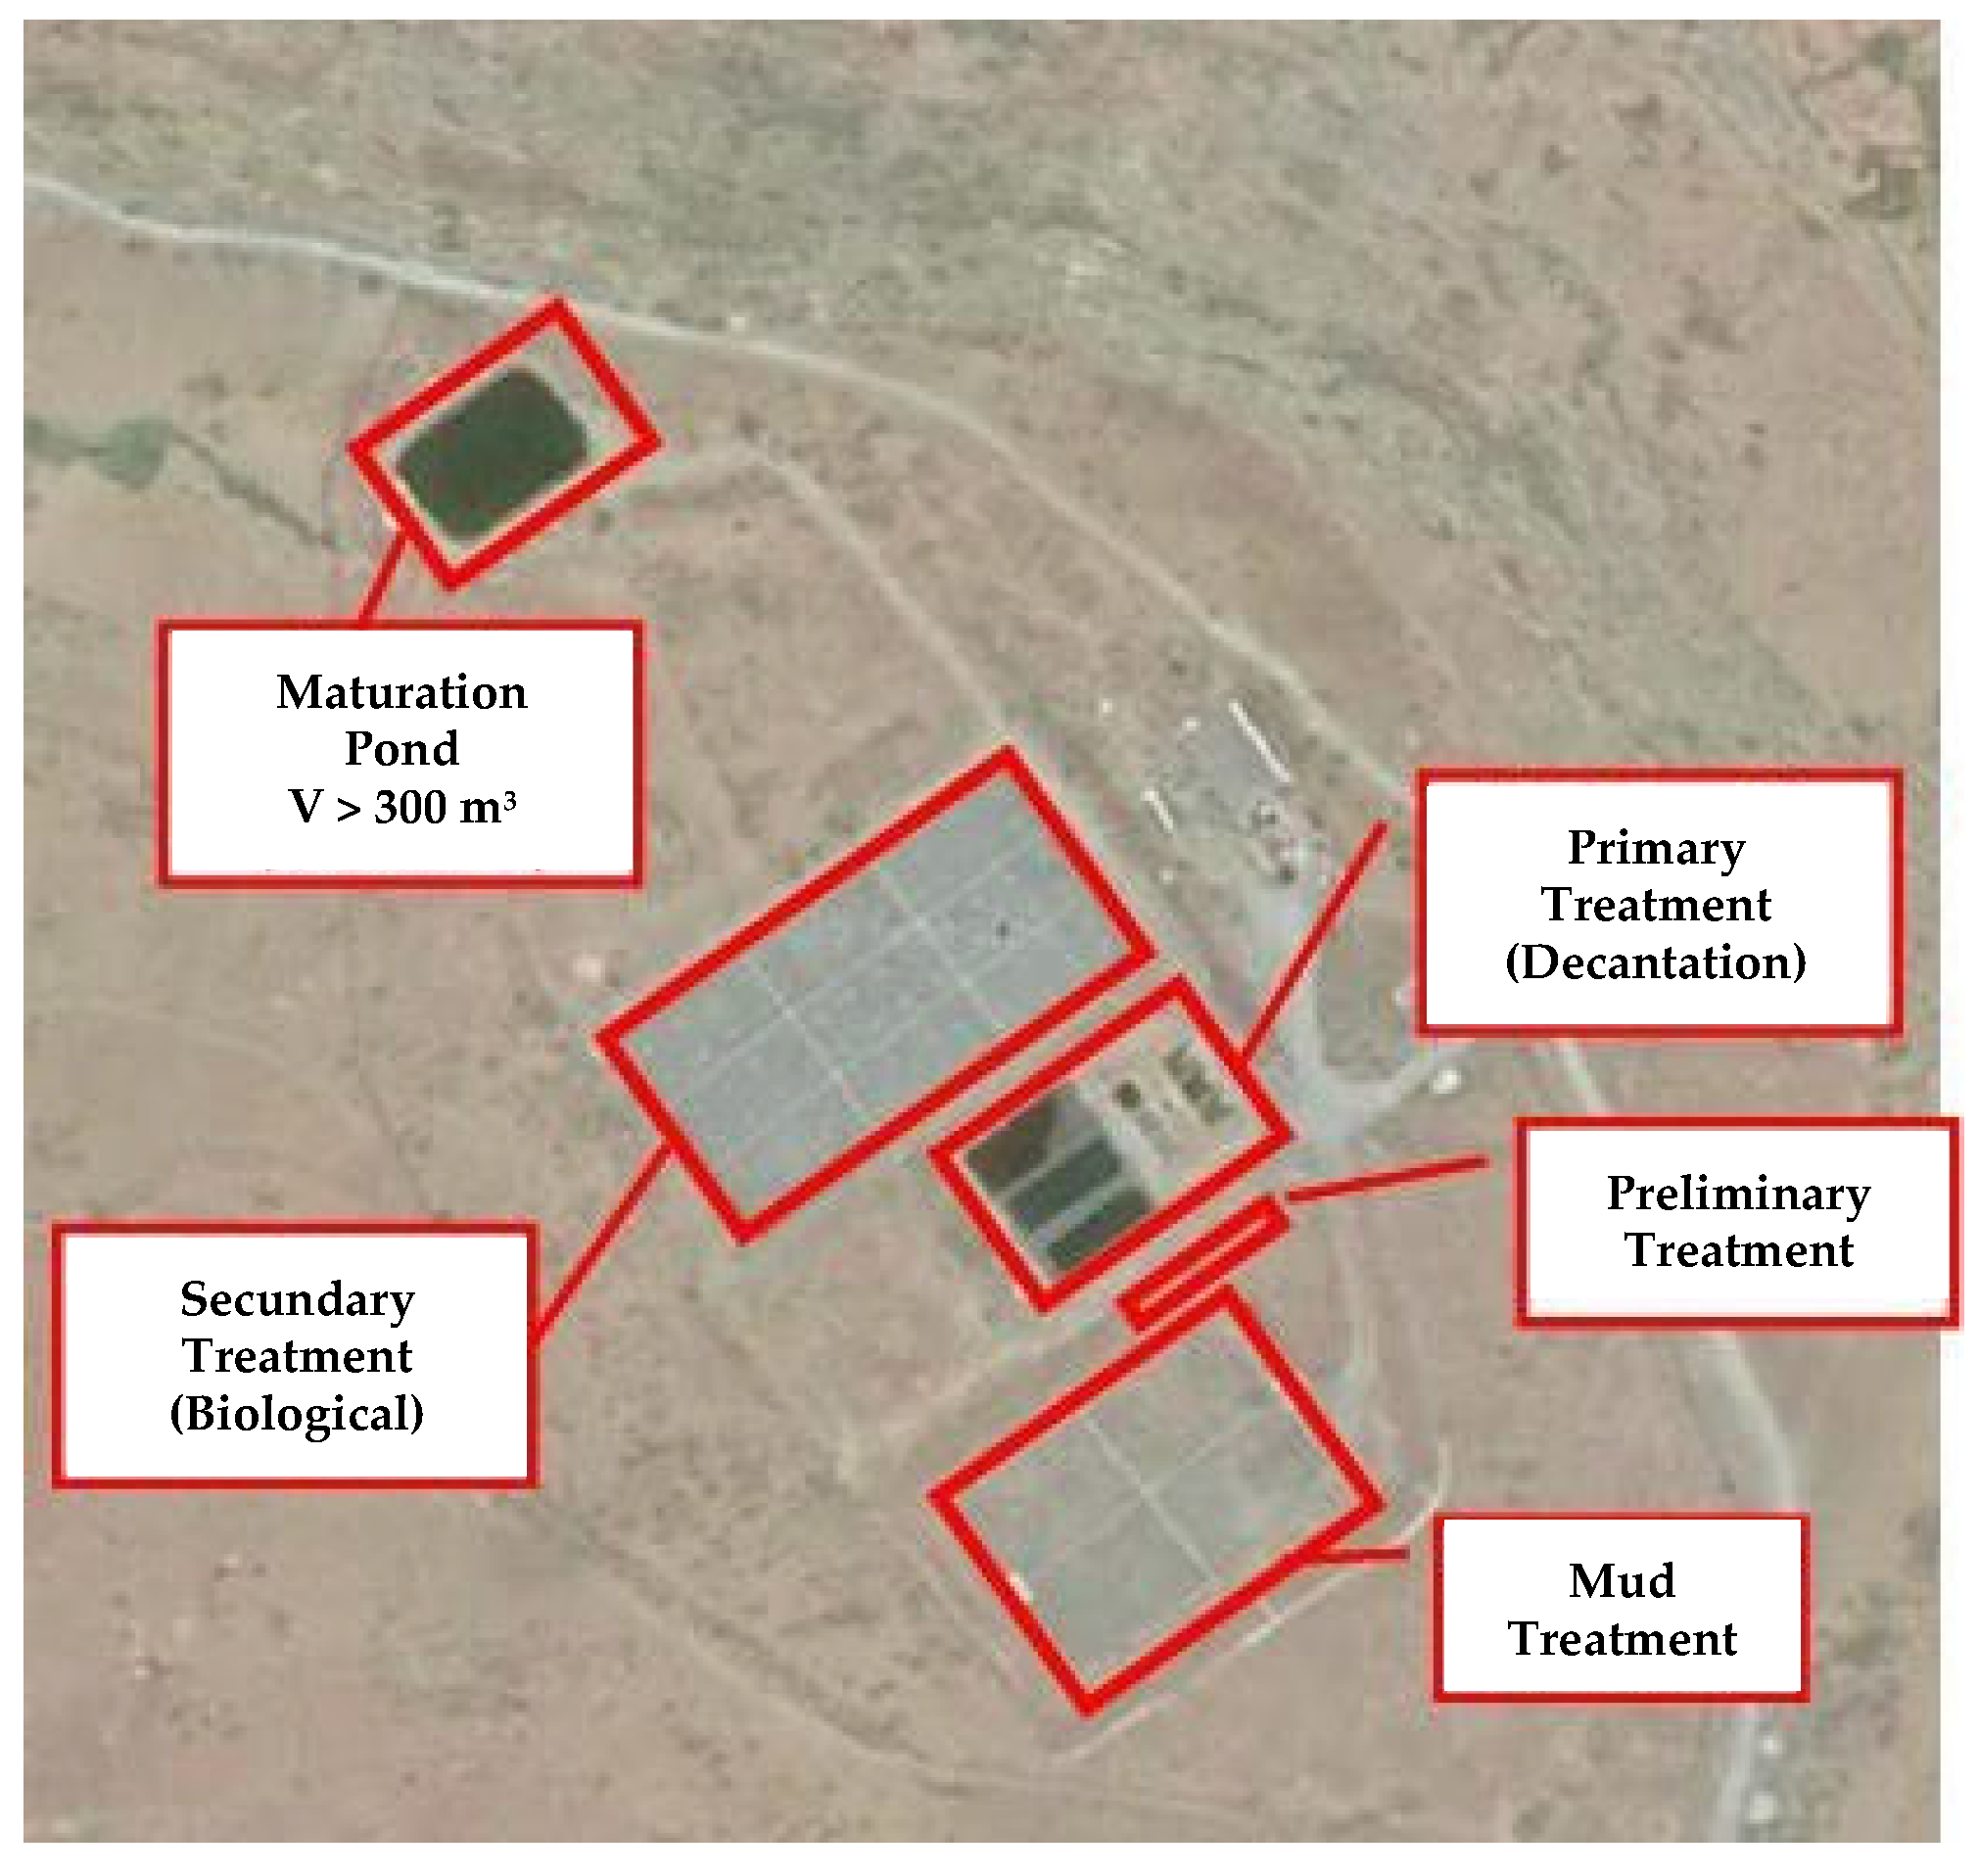
2.1. Description Plant

-
Preliminary treatment consisting of roughing screens: this stage will guarantee the proper functioning of the subsequent equipment, avoiding possible obstructions. There are two lines of 0.4 m wide and 3 m long.
-
Primary treatment (anaerobic lagoons): this process consists of reproducing the self-purification phenomena that occur naturally in rivers and lakes. In this type of lagoon, there are high organic loads that produce oxygen-free conditions, and anaerobic bacteria proliferate. This slows down the velocity and causes the heavier suspended particles to settle to the bottom, thus reducing the suspended solid content. These accumulate at the bottom and result in the formation of a sludge layer, which is usually removed every 5–10 years of operation due to anaerobic stabilization at room temperature, which reduces its volume. There are three lines 3.6 m deep, 21.8 m long, and 8.8 m wide. This is followed by a batch-discharge system.
-
Secondary treatment (Constructed Wetland with Vertical flow): The water coming from the anaerobic lagoon flows vertically through media collected in a drainage network at the bottom of the wetland, which is connected to aeration chimneys. The feed is discontinuous. In this case, there are 6 vertical-flow wetlands, 13 m wide and 26.8 m long. Each is made up of different layers of gravel and sand and has an impermeable membrane at the bottom of the basin.
-
The reserve lagoon is covered with a shading mesh made up of two grids of 5 mm Bayco-type black polyamide monofilament yarn, arranged in 0.5 × 0.5 grids, with dynamometer-controlled tensioning tied to the perimeter anchoring structure and a double layer of black polyethylene shading fabric with a minimum 85% shade, located between the two grids of yarns. The dimensions of this water are 31.6 m long, 20.60 m wide, and 0.5 m deep, giving a volume of about 325 m3. This lagoon will act as an initial reservoir, where the water treated in the treatment plant will be stored and can be pumped to feed the tertiary treatment.
The wastewater reclamation processes installed at the plant will be described below.
-
Underground treated water tank: The storage volume is 10 m3. It has two impulsion pumps at the outlet that will propel the water to the filtration system.
-
Filtration: In this stage, the aim is to eliminate dissolved solids practically in their entirety, in addition to reducing the microbiological activity of the water. This filtration system consists of a vertical filter with AFM (Activated Filter Media, DIMASA, Barcelona, Spain), from DIMASA (Barcelona, Spain) as the filter medium. These must have a backwashing system with clean water. Two lines are arranged in parallel, and at the inlet of this system, there is a flow meter to control the flow of water entering the system.
-
Refining: Once the water has been filtered, it will be passed through a manual cleaning ring filter with a 50 mm pitch, which will improve the quality of suspended solids and turbidity. In this process, there are also two lines consecutive to the previously mentioned filters.
-
Main disinfection: The selected disinfection system is a compact ultraviolet disinfection equipment. This system can interact with the DNA and RNA of bacteria viruses, preventing their reproduction.
-
Final tank: The treated water will be deposited in a 50 m3 closed reinforced concrete tank. This is equipped with a water disinfection system based on the addition of trichlorine tablets.
Figure 1 shows the stages of Santa Catarina NTSW.
The stages/aspects that are considered in the LCA are the following:
  • Materials for the construction of the facilities and their transport.
  • Construction of the installation considering the required energy/fuel consumption.
  • Maintenance and operation.
  • The impact of the treatment and disposal of waste to be landfilled or treated as byproducts.
The stage excluded from the analysis is the dismantling. Likewise, charges relating to the manufacture of the machinery and infrastructure necessary for the extraction and transport of any raw materials or materials used in the construction of the plant or the materials, waste, or byproducts resulting from the maintenance of the plant are also disregarded. Figure 2 shows the stages that are included in the study (red box) and those that have not been considered for this study.

2.2. Inventory

In this section, the inventory analysis of each of the selected wastewater treatment plants must be carried out. To do this, it is necessary to describe the facilities in such a way that all the processes that make them up are known. The inventory will consist of two parts: one associated with the construction phase, where all the materials and processes necessary for the construction of the treatment plant will be collected, and the other with the maintenance and operation phase. The latter will include the reagents necessary for the correct development of the plant, the maintenance stages, and the waste/byproducts obtained from this maintenance. In turn, the emissions associated with each of the processes in this operation phase will be obtained.

Construction Phase

Materials Used
This section defines the quantities of the main components of each of the stages that make up the Santa Lucia wastewater treatment plant, namely the intake works, the roughing works, the septic tank, the siphon and flow meter boxes, the vertical wetlands, the horizontal wetlands, the storage tank, the interconnection elements, and the passageways. For the calculation of the quantities required and the materials used for the construction of the treatment plant, reference was made to the construction reports for both the Santa Lucia treatment plant and the Calheta treatment plant (Maio Island in Cape Verde), which has similar characteristics to the Santa Lucia NTSW. The latter is required for the calculation of elements such as the septic tank and the interconnection chambers, which were not included in the Santa Lucia report.
Arrival and Roughing Works
It is considered that the pit is built with a medium-hard concrete base, like cleaning concrete. Elements such as plastering the inside of the pit, compacting the soil, or the removal of surplus material are not considered. For the roughing gratings, it is considered that they are manufactured with low-alloy steel as this steel is the most used for the manufacture of stainless steel in this case. The following are also not considered. The quantities of steel required for the manufacture of the grating are considered in the manufacturing process of the grating. The excavation of the ground is considered to be the sum of the amount of ground to be excavated from the roughing pit.
Roughing
First, the amount of concrete necessary for the construction of the pit containing the roughing gratings is obtained per inhabitant. The area of the concrete = 2.6 × 10⁻⁴ m3/h.e. Second, the amount of steel required for the construction of the roughing grate is obtained. The weight of the steel was 0.18 kg/h.e.
Excavation
To obtain the impact associated with the excavation process, it is considered that the entire impact will be determined by the fuel use of the backhoe loader carrying out the excavation. The total excavation area is determined as the land occupied by the backhoe loader 1995 m3. Knowing that the efficiency of the backhoe loader is 0.12 h/m3, we can calculate the number of hours needed to excavate the land. Furthermore, it is known that the power of the backhoe loader is 70 kW, so we multiply the time needed to obtain the kWh needed. The efficiency of the backhoe loader is 90%. As the fuel used by this machinery is diesel, the number of liters per inhabitant equivalent used is obtained by means of the LCV of this fuel. The fuel used was 0.011 L/h.e.
Land Occupation
One of the most important aspects of this type of treatment system is the amount of land it occupies, so it is considered very necessary to quantify the amount of land occupied by each of the processes that make up the NTSW. The land occupation was 0.0018 m2/h.e.
Discontinuous Discharge System
The discontinuous discharge system consists of “decolloideurs” and “chasses”, both composed of 3 compartments of equal magnitude. The first of these has dimensions of 4.5 m by 5 m each with a depth of 2 m, making a total of 4.5 m wide by 15 m long. The second of these is 7 m wide by 4.5 m long, and each has a depth of 1 m, making a total of 13.5 m long. Both structures will be made of medium-hard concrete with a thickness of 0.1 m. The area of the concrete was 0.02 m3/h.e.
Excavation
To obtain the impact associated with the excavation process, it is considered that the entire impact will be determined using fuel by the backhoe loader carrying out the excavation. For this purpose, the total excavation surface is determined as the land occupied by both systems: 94.5 m3 (chasses) and 135 m3 (decolloideurs), and was 0.13 L/h.e. The land occupation was 0.101 m2/h.e.
Anaerobic Lagoon
The anaerobic lagoons in the treatment plant are open-air. The purpose of these lagoons is to reduce the content of suspended solids, which are incorporated into the layer of sludge accumulated at the bottom. The water is introduced at the bottom of the lagoon, causing an absence of oxygen in the inlet water. The output water is obtained from the upper part. The considerations made in the manufacturing process of the anaerobic lagoons are as follows: There are three parallel lagoons operating at the same time whose dimensions are 8.24 m wide (each) and 23.26 m long. The depth of the three lagoons is 4 m each. The construction process is based on excavating the area where the lagoons are installed, covering the ground with a layer of geotextile and a layer of EPDM on top of the geotextile. This will allow the surface to be waterproof and the EPDM covering with geotextile will prevent cracks in the geotextile. On the other hand, pipes are required for the drainage of the incoming and outgoing water, and a manhole at the inlet to allow the correct distribution of the water.
Anaerobic Lagoon Pit
The water inlet to the lagoons is regulated by a chamber located at the beginning of the lagoons. The dimensions of the chamber are 1 m wide, 1 m long, and 1 m high. Considering a thickness of 0.05 m of concrete, the result is as follows: The area of concrete was 1.6 × 10⁻⁴ m3/h.e. The steel used in the manhole closure plate is calculated according to the dimensions of the manhole and the thickness of the door, which are 1 m long, 1 m wide, and 0.02 m thick. The weight of the steel was 0.098 kg/h.e.
Anaerobic Lagoon Manufacture
The lagoons are waterproofed with a 1.52 mm thick EPDM sheet and a 300 g/m2 geotextile sheet underneath the EPDM sheet. The geotextile sheet is made of polypropylene. In this case, more EPDM and geotextile are required because in addition to covering the ground, the sides (4 m high) must be covered, and there is material left over at the top of the wetland (0.5 m will be considered). Therefore, Geotextile 0.27 kg/h.e. and EPDM 0.185 kg/h.e. will be needed.
Pipelines
Approximately 15 m of piping is required in each of the lagoons, with three lagoons totaling 45 m. PE pipes with a diameter of 160 mm and a thickness of 3.0 mm are used at 0.033 kg/h.e.
Obtaining the Required Volume of PE
Calculation of the perimeter of the cylinder with a diameter of 160 mm and calculation of the perimeter of the cylinder with a diameter of 154 mm was carried out by subtracting and multiplying by the length to obtain the amount of PE required. To obtain the weight of the PE required, we multiply by the density of the cylinder.
Excavation
The excavated land corresponds to the sum of the dimensions of the three anaerobic lagoons and the inlet chamber, which is 2300 m3 in total. The volume of diesel is calculated in the same way as in the previous sections and was found to be 1.31 L/h.e.
Land Occupation
The anaerobic lagoons occupy a total of 574.99 m2 so they will have a much more relevant weight than the rest of the processes. The total surface area occupied was 0.36 m2/h.e.
Vertical-Flow-Constructed Wetlands
There are six vertical-flow-constructed wetlands. It should be noted that for the inventory of wetlands, a single wetland is considered, the dimensions of which are the sum of the two wetlands separately, thus creating a wetland of 3335 m2. The aggregates used are 15–25 mm and 5–12 mm gravel, but due to the lack of data on particle sizes, all gravel is 30–32 mm. In addition, a sheet of ethylene–propylene–diene rubber (EPDM) will be used to waterproof the system. In addition, there is a collection chamber at the inlet of the vertical-flow system. No account will be taken of the stones protecting the sheeting or other materials other than gravel, EPDM, polyethylene (PE) pipes, and concrete.
Vertical Wetland Pit
The dimensions of both manholes were considered to be 3.1 × 10⁻⁴ m3/h.e. The steel used in the manhole closure plate is calculated in the same way as the closure plate of the roughing manhole and was found to be 0.314 kg/h.e.
Manufacture of Vertical-flow Wetland
The dimensions of each wetland are as follows (note that there are 6 wetlands in total): 13 m wide, 26.8 m long, and 1.2 m deep. In this case, the flattening of the terrain is not considered. The wetland is waterproofed with a 1.52 mm thick EPDM sheet and 2 sheets of 300 g/m2 geotextile between the EPDM sheets. The geotextile sheet is made of polypropylene. In this case, a larger quantity of EPDM and geotextile is required because, in addition to covering the ground, the sides must be covered (1.2 m of height), and surplus material at the top of the wetland (0.5 m) shall be considered. Therefore, the following will be needed: 1.039 m2/h.e. and EPDM 0.36 kg/h.e. For the calculation of the amount of gravel required, the same gravel is considered for the entire surface. Therefore, 1698 kg/h.e. was required.
Pipelines
A total of 1245 m of pipes are needed for the conduits corresponding to vertical wetlands. PE pipes with a diameter of 160 mm and a thickness of 3.0 mm are used. A total of 0.922 kg/h.e. was required.
Obtaining the Required Volume of PE
Calculation of the perimeter of the cylinder with a diameter of 110 mm and calculation of the perimeter of the cylinder with a diameter of 106.8 mm was carried out by subtracting and multiplying by the length to obtain the amount of PE required. To obtain the weight of the PE required, we multiply by the density of the PE.
Excavation
The excavated land corresponds to the sum of the dimensions of the two vertical wetlands and the manholes of each of them, being 2509 m3 in total. The volume of diesel is calculated in the same way as in the previous sections. A total of 1.42 L/h.e. was required.
Land Occupation
The vertical-flow wetlands occupy a total of 2090 m2, so they will have a more relevant weight than the rest of the processes. The total surface area considered was 1.31 m2/h.e.
Storage
The manufacturing process of the storage lagoon is based on the excavation of the land occupied by the lagoon, the placement of a concrete slab, and its subsequent waterproofing with waterproofing paint. As in the previous cases, the removal of excess material and backfilling with excavated material is not considered. One of the main problems of the water treated in this NTSW is that it suffers a worsening of its quality conditions because it is in the open air, thus encouraging the growth of micro-algae. This factor causes a lack of oxygen. Also, the presence of birds on the surface of the lagoon can lead to an increase in microbiological indicators. It is, therefore, proposed that the lagoon be covered as a solution to these problems. A cover consisting of a 5 mm polyamide shading mesh and a double layer of high-density polyethylene shading fabric was considered.
Manufacture of the Storage Lagoon
The dimensions of the storage pond are 30.6 m long, 19 m wide, and 1 m deep. A thickness of 0.04 m of concrete was considered, which was calculated as 0.15 m3/h.e. It was proposed to carry out the waterproofing with waterproofing paint. In the same way as for the septic tank, since this product was not found in the SimaPro bases, it was decided to choose a waterless acrylic varnish, which can also be used as a waterproofing agent. The volume of acrylic varnish is obtained from the dimensions of the walls to be waterproofed and a thickness of approximately 60 microns. It was considered of 0.0052 kg/h.e.
Excavation
It is, therefore, necessary to excavate 590 m3, which is 0.335 L/h.e.
Land Occupation
The total surface area occupied by the storage lagoon is quite similar to that of the wetlands, i.e., 0.369 m2/h.e.
Lagoon Cover
In this case, it is necessary to know the quantity of polyamide yarn and shading mesh to be used.
Polyamide Yarn
Polyamide yarn is a synthetic fiber plastic (such as nylon or Kevlar) and/or natural (wool or silk). In this case, a type of nylon is used. The total surface area of the storage pond is estimated, and using these data, the thickness of the thread, and the density of this material, the necessary weight was 2.10 kg/h.e.
Shading Mesh
The lagoon will be covered with double high-density polyethylene (HDPE) mesh with shading capacity. The quantity required is calculated in the same way as for the polyamide yarn. This was found to be 3.50 kg/h.e.
Passageways and Pipelines
In this section, the materials necessary for the construction of the access and protection areas of the treatment plant and the connections to be made for the transport of water from one point to another will be obtained.
Conducts
The connections will be made with polyethylene pipes with a diameter of 160 mm and a thickness of 3.9 mm. The length required was 133 m of pipe or 0.804 kg/h.e.
Excavation of the Pipeline Area
Taking into account the dimensions, it is estimated that the total area to be excavated amounts to 35 m3, calculated to be 0.02 L/h.e.
Occupation of Land in Pipelines
This section will consider the total number of meters required for pipes that serve as connections between the different processes of the WWTP:
Occupied surface = (133 × 0.5)/1600 = 0.042 m2/h.e.
Passage Areas
The areas that have had to be prepared so that the terrain is in the best possible condition for transit, if necessary, are referred to as transit areas.
In addition, the protection of the terrain by means of fences covering it will also be considered in this section.
The total plot size is 14,867 m2. These data are approximate and obtained by means of the Graf Can Visor. If we deduct from this the areas where the purification equipment is located, the plot to be developed is 10,217 m2. (The land of the drying beds is considered to have been developed, but no inventory of the same is made).
To prepare the plot, the land will be cleared and cleaned using a wheel loader.
Knowing that the efficiency of the loader is 0.021 h/m3, we can calculate the number of hours necessary to excavate the terrain. We also know that the power of the same is 120 kW, so if we multiply the time required by the power, we obtain the kWh required. (Consider an efficiency of 90%).
As the fuel used by this machinery is diesel, if we obtain the PCI of this fuel, we can obtain the liters of fuel needed.
Fence Used
The fence used to surround the entire plot is a flat grey electro-welded mesh with holes (50 × 50 × 4 cm), whose dimensions are 2.6 m wide by 2 m high.
Taking into account that the perimeter of the plot is 806 m, about 310 prefabricated steel fences will be needed. As each mesh weighs 18.41 kg, this makes a total of 5707 kg.
Chromium-plated steel will be used, as this is the most commonly used steel in the stainless-steel industry.
Occupation of the Land in Transit Areas
This section considers all the land that has had to be conditioned to allow easy access to all the processes that make up WWTP. This quantity has been calculated beforehand, as it was necessary to know the diesel used to prepare the plot. Therefore, the following is obtained:
Elements of Tertiary Treatment
-
Feed pump for tertiary treatment: compact, reliable, horizontal, multistage end-suction centrifugal pump.
-
Water pumps usually consist of the following materials:
-
Hydraulic body: stainless steel
-
Pump casing: AISI 304
-
Impeller: Stainless steel
As can be seen, the material most commonly used for the manufacture of this type of pump is stainless steel, so for this study, the pump will be considered to be made entirely of stainless steel. The weight of the pump is 31.7 kg, according to its technical data sheet.
-
Washing pump: single-stage pump with top extraction system for easy disassembly.
The main component used for the manufacture of the seal is cast iron. Some small parts, such as the rotary seal ring or the stationary seat, are made of silicon carbide or EPDM in the case of the secondary seal.
-
Filtration (AFM filter): In this case, the filter is made of laminated polyester reinforced with glass fiber almost entirely except for the cover.
This will not be introduced in our analysis as not all systems have this treatment.
The side manhole is made of plastic-coated steel, and the crepinas (filtered water collectors at the bottom of the filter) are made of polypropylene. It should also be noted that the filtering material, green glass, is inserted inside the filter.
-
Ring filter: This is a physical filtration system produced by the retention of particles in the channels created by the superimposition of a set of rings. The materials used in this case are fiberglass-reinforced polyamide and synthetic rubber for the seals. It is considered to be made entirely of reinforced polyamide. The weight of these devices is approximately 6 kg.
-
Main disinfection (UV disinfection): This equipment generates ultraviolet radiation at a frequency of 254 nm, capable of destroying harmful bacteria and persistent viruses in the water without generating harmful byproducts. The radiation chamber is made of AISI 314 stainless steel. The weight and whether any other material is in higher proportion than steel is unknown.
The UV filter installed at the WWTP is the SAV-UV-6 with a maximum flow rate of 5 m3/h and 80 W power.
-
Final secondary disinfection tank (chlorine): After the filtration, refining, and main disinfection stages, the disinfected water is sent to the new reusable water tank, with a volume of 100 m3 made of concrete.
The dimensions of the tank are as follows: 7 m wide, 4.5 m long, and 3.2 m high. Considering a thickness of 0.05 m of concrete, we obtain:
-
Tertiary process building: It is proposed that the construction of the building containing the treatment equipment be as follows:
  • Concrete floor
  • Concrete block walls
The impact assessment establishes a relationship between the data collected in the inventory analysis and the environmental loads generated by them. To carry out the assessment, it is advisable to have a computer program that performs the calculations quickly and reliably. There is a great variability of programs such as SimaPro, Boustead, Umberto, Open LCA, etc. Each of them has different assessment methodologies. The assessment process is conducted in five distinct stages: classification, characterization, normalization, weighting, and damage assessment. The latter three stages are optional. The initial stage involves defining and selecting impact categories. An impact category is defined as a representative class of environmental variables to which the results of the inventory can be assigned. The classification is based on the grouping of the environmental loadings of the different inputs and outputs of resources and energy according to the environmental effects produced. It should be noted that certain outputs contribute to more than one category. The effect produced by the repetition of some factor will be accepted, provided that these outputs are independent. Finally, regarding the characterization, the process by which the potential contribution of each compound detected in the inventory analysis is obtained regarding a given environmental effect. Computer programs are available that provide characterization results directly, obviating the need for separate calculations. The processes are obtained directly as a result of the program, whereby the program itself performs the classification and characterization of the study, negating the need for manual input.
Databases available in SimaPro are as follows:
ETH-ESU Library 96 (2003): Contains energy inventory data. The inventory tables include emissions from primary energy extraction, refining, and distribution, extraction of mineral matter, production of raw materials, production of semi-factories and auxiliary and working materials, provision of transport and waste treatment services, construction of infrastructure, and energy conversion and transmission.
Infrastructure and energy conversion and transmission: The system description depicts the energy distribution situation of Switzerland and Western Europe concerning the production and imports of fuels and the production and imports of fuels and electricity production and business [5].
BUWAL Bookshop 250 (2001): The inventory tables include emissions from raw material production, energy production, production of semi-factories and auxiliary materials, and transport and material production processes. The description of the system is based on the Swiss consumption of packaging materials and imports and exports of materials. The energy systems are based on ETH data without considering capital goods; the plastics data are based on PWMI data [5].
IDEMAT Library 2001: Developed by the Faculty of Industrial Design Engineering of the Delft University of Technology (Delft, The Netherlands). The focus of the database is more than just the production of materials. Most of the data are original (not collected from other LCA databases) and come from a wide variety of sources. The Life-Cycle inventory includes mining, concentration, and processing in the case of minerals or harvesting and processing for agricultural products. In general, the average global situation is considered. Accordingly, transport is allocated to global mining and production of resources, with Rotterdam as the final destination. Recycling of secondary materials is considered according to the average Western European situation. The system boundaries cover all processes from nature [5].
Industry Data Library (2007): This database contains detailed inventories of common materials and processes sourced directly from industries. It includes the ecoprofiles of plastics and their associated intermediates, created by Boustead for AMPE (European Centre for Plastics in the Environment of the Association of Plastics Manufacturers in Europe). The results are the industry average, calculated as the principal value of the participating companies weighted by their production. The inventory table includes raw materials, emissions to air, water, and waste for all operations since the extraction of raw materials from the earth [5].
Ecoinvent v.3.7.1, founded in 2000 and developed by several Swiss institutes, namely the Swiss Centre for Life-Cycle Inventories, the Swiss Federal Office, and EMPA (Swiss Federal Laboratories for Materials Testing and Research). This can be seen as an update of the BUWAL 250 and ETH databases, containing data on products and services from the energy, transport, building materials, chemicals, pulp and paper and waste treatment, and agricultural sector, which are valid for Swiss and Western European conditions [5].
Dutch Input/Output database: This is available on the SimaPro Dutch Input/Output economic database. The starting point was an overview of how the distribution of the average consumer is spread over 350 categories. A connection was made between these categories and the economic sectors. The economic input–output table was used to plot the trade flows between these sectors. There are also foreign tables for OECD and non-OECD regions. This allows the tracing of the impact of goods produced outside the Netherlands [5].
Finally, the impact assessment methods to be used must be defined, so first, the impact categories to be considered must be determined. The following is a description of the most relevant impact categories according to the Society of Environmental Toxicology and Chemistry (SETAC):
-
Global warming (kg CO2 equivalents)
-
Consumption of energy resources (MJ)
-
Ozone layer depletion (kg CFC-11 equivalents)
-
Eutrophication (kg NO3 equivalents)
-
Acidification (kg. SO2 equivalents)
-
Consumption of raw materials (Tn)
-
Formation of photochemical oxidants (kg. C2H4 equivalents)
It should also be noted that these are not the only impact categories that exist, as it must be considered that different categories are required in each study area. Some of them are the following:
-
Human toxicity
-
Ecotoxicity
-
Land use (area occupied in m2/year)
-
Depletion of mineral and fossil resources
-
Biodiversity (number of species or density of vascular plants representative of species diversity)
-
Loss of life-supporting function (data on net primary production)
-
Depletion of biotic resources

3. Results

3.1. Operation and Maintenance Phase

3.1.1. Emissions to Soil and Water Environment

The emissions associated with each process are determined by the conditions under which each of the stages operates. Likewise, as the entire system is waterproofed, there are no emissions into the soil. Furthermore, since the treated water obtained at the end of the treatment process is reused for olive tree cultivation, emissions to the water environment will not be taken into account. If, on the other hand, the treated water were to be discharged into the public water domain (marine environment, watercourse, or subsoil), these emissions would be considered [5].
It should be noted that this study does not take into account the impact generated by the water used to irrigate the olive trees due to existing limitations. Likewise, an LCA could be considered for the olive trees in which the water needed for irrigation is obtained from the storage pond. In this case, it is considered that the treated water is kept in the storage pond without taking into account what happens to it afterward [1].
Therefore, the only emissions that will occur in the Santa Lucia treatment system will be emissions to the atmosphere in the form of CO2, CH4, H2S, H2O, or N2, depending on the operating conditions.

3.1.2. Atmospheric Emissions

To calculate these emissions, it is first necessary to determine the quantity of BOD5 eliminated, which can then be related to the amount of biogas produced. In this case, the characterization of the water entering the plant is available, but the BOD5 parameter has not been included in the study (Table 1). Therefore, these values will be estimated based on the theoretical yields [11]. The emissions to air will be contingent upon the biodegradable organic matter removed at each stage of the process. To achieve this, it is essential to ascertain which treatments are anaerobic or operate under aerobic conditions in an overloaded state. In this instance, the anaerobic lagoon and vertical-flow system represent the anaerobic processes that will result in the generation of the aforementioned emissions. No treatments operate at a higher discharge level than that for which they are sized, and thus, no emissions are associated with this type of system [7]. This information is shown in Table 1.
For every kg of BOD5 removed, 0.25 kg of methane is produced, i.e., approximately 0.42 kg of biogas, with 60% of the biogas being methane and 40% carbon dioxide. This ratio gives the emissions generated in each stage.
To know the kg/year of BOD5, it is necessary to know the flow with which it operates. From the data obtained in 2018, it is estimated that the average daily flow is 198 m3.
Anaerobic lagoons:
In the absence of a characterization of the water entering the plant via the theoretical elimination yields of the anaerobic lagoons, it is possible to obtain an estimate of the input parameters by taking into account the characteristics of the water leaving the lagoons. This allows the quantity of BOD5 removed during the process to be determined. The BOD5 removal efficiency in an anaerobic lagooning system is approximately 40–50% (Manual for the Implementation of Purification Systems in Small Towns). If an average efficiency is employed, namely 45% removal, the inlet water to the system is found to possess the following characteristics, as detailed in Table 2 and Table 3 [8,9].
  • The kg/year of BOD5 eliminated is calculated using the values shown in Table 2:
96 mg/L = 0.096 kg/m3 × 198 m3/day × 365 days /year = 6938 kg/year 𝐷𝐵𝑂5 eliminated
The water inlet to the lagoons is regulated by a chamber located at the beginning of the lagoons. The dimensions of the chamber are 1 m wide, 1 m long, and 1 m high.
2.
The kg of biogas emitted are obtained:
6938 kg 𝐷𝐵𝑂5/year 𝐷𝐵𝑂𝑒𝑙𝑖𝑚𝑖𝑛𝑎𝑑𝑎 ∗ 0.42 kg 𝑏𝑖𝑜𝑔a𝑠/kg 𝐷𝐵𝑂5 = 2914 kg 𝑏𝑖𝑜𝑔a𝑠/year
The steel used in the manhole closure plate is calculated according to the dimensions of the manhole and the thickness of the door, which are 1 m long, 1 m wide, and 0.02 m thick.
3.
Knowing that the biogas mixture is composed of 60% methane and 40% CO2, these emissions are calculated:
2914 kg 𝑏𝑖𝑜𝑔a𝑠/year ∗ 60 kg 𝐶𝐻4 /100 kg 𝑏𝑖𝑜𝑔a𝑠 = 1748 kg 𝐶𝐻 𝑘𝑔 𝐶𝐻4/year
= 1.1 kg 𝐶𝐻4 /year−h.e.
2914 kg 𝑏𝑖𝑜𝑔a𝑠/year ∗ 40 kg 𝐶𝑂2/100 kg 𝑏𝑖𝑜𝑔a𝑠 = 1165 kg 𝐶𝑂/year = 0.73 kg 𝐶𝑂2 /year−h.e.
Vertical-flow system:
The lagoons are waterproofed with a 1.52 mm thick EPDM sheet and a 300 g/m2 geotextile sheet underneath the EPDM sheet. The geotextile sheet is made of polypropylene. In this case, more EPDM and geotextile are required because in addition to covering the ground, the sides (4 m high) must be covered, and there is material left over at the top of the wetland (0.5 m will be considered).
167 mg/L = 0.167 kg/m3 ∗ 198 m3/day ∗ 365 days/year = 12069 kg/year 𝐷𝐵𝑂5 𝑒𝑙𝑖𝑚𝑖𝑛𝑎ted
Approximately 15 m of piping is required in each of the lagoons, with three lagoons totaling 45 m. PE pipes with a diameter of 160 mm and a thickness of 3.0 mm are used.
2.
The weight of biogas emitted is obtained:
12,069 kg 𝐷𝐵𝑂5/year 𝐷𝐵𝑂 eliminated ∗ 0.42 kg 𝑏𝑖𝑜𝑔a𝑠/kg 𝐷𝐵𝑂5 = 5069 kg 𝑏𝑖𝑜𝑔a𝑠/year
Calculation is made of the perimeter of the cylinder with a diameter of 160 mm and calculation of the perimeter of the cylinder with a diameter of 154 mm by subtracting and multiplying by the length to obtain the amount of PE required. Then, we multiply by the density of the cylinder and obtain the kg of PE required.
3.
Knowing that the biogas mixture is composed of 60% methane and 40% CO2, these emissions are calculated:
5069 kg 𝑏𝑖𝑜𝑔a𝑠/year ∗ 60 kg 𝐶𝐻4/100 kg𝑏𝑖𝑜𝑔a𝑠 = 6041 kg 𝐶𝐻 kg 𝐶𝐻4/year = 3.78 kg 𝐶𝐻4/year−h.e.
5069 kg 𝑏𝑖𝑜𝑔a𝑠/year ∗ 40 kg 𝐶𝑂2/100 kg𝑏𝑖𝑜𝑔a𝑠 = 2028 kg 𝐶𝑂 kg 𝐶𝑂2/year = 1.27 kg 𝐶𝑂2/year−h.e.
The excavated land corresponds to the sum of the dimensions of the three anaerobic lagoons and the inlet chamber, which is 2300 m3 in total. The anaerobic lagoons occupy a total of 574.99 m2 so they will have a much more relevant weight than the rest of the processes.
Figure 3 and Figure 4 show the primary and secondary effluent parameters of ETAR Santa Catarina. Moreover, Table 4 shows the generation of waste and/or byproducts.
The activities described in the maintenance manuals are not being carried out. Consequently, waste is being generated, and the quantities generated in the different cases will be estimated, as shown in Table 4 [10,11].
Roughing Grid
The roughing system installed is in the pumping station outside the treatment plant, i.e., the management of this waste does not belong to the plant, but it will be taken into account as it is waste generated as a result of wastewater treatment. The data will be obtained by estimating the production of Santa Lucia.
If the waste generated in Santa Lucia is 10 kg per week, taking into account that the water of 1600 equivalent inhabitants is treated in this system, 32 kg of waste will be generated per week, therefore:
32 kg/week × 52 weeks/1 year × 1/1600 h.e. = 1.04 kg/(year−h.e.)
Anaerobic Lagoon
In these systems, the flotsam that appears on the surface of the lagoons must be removed, using a pool leaf catcher and taking advantage of the moments when the prevailing winds accumulate the flotsam. This quantity of waste is not considerable and will therefore not be taken into account in the analysis. However, every 5–10 years, the sludge that has accumulated at the bottom of the lagoons in operation will be purged. It is estimated that the sludge production is 30–40 L/h.e. per year (manual for the implementation of wastewater treatment systems in small settlements). As a result, it can be estimated that the amount of waste in this case will be about 35 L/h.e. per year of sludge on a wet basis [19,20].
Vertical-Flow Wetlands
From similar cases such as the purification system in St Lucia, the following is considered.
In these wetlands, the sludge that has accumulated on the surface of the gravel during the operating period is left to dehydrate. Once it has dried, the surface is raked to remove them and prepare the system for the new period of operation. This operation is carried out once a month, taking into account the two operating wetlands. This mainly produces solids in the form of dewatered primary sludge and leaf debris. This is considered to be waste to be sent to landfill. The amount of waste obtained monthly from the vertical wetlands is 15 kg.
15 kg/month × 12 𝑚𝑒𝑠𝑒𝑠/1 𝑎ñ𝑜 × 1/1600 h.e.= 0.11 kg/(𝑎ñ𝑜−h.e.)
LCV Impact Assessment of the Studied Systems
For the correct development of the LCA methodology, it is necessary to use a software tool to save time and achieve reliable results. The basic function of these is to perform the material and energy balances on the specific process and to allocate emissions, energy uses, etc., normalized on a common basis. In this case, SimaPro version 9.1.1 is used.
For this LCA, we work with the most appropriate database, Ecoinvent v3.7.1, as it is an improvement of the BUWAL 250 and ETH databases, with more than 4000 processes belonging to different sectors.
The methodology used in the study is the ILCD 2011, as it will be the reference methodology for the EU Environmental Footprints, with the impact categories shown below:
  • Climate change
  • Depletion of the ozone layer
  • Ecotoxicity to freshwater ecosystems
  • Human toxicity (carcinogenic effects)
  • Inorganic particles with respiratory effects
  • Ionizing radiation and its effects on human health
  • Photochemical ozone formation
  • Acidification
  • Terrestrial eutrophication
  • Aquatic eutrophication
  • Freshwater ecotoxicity
  • Depletion of resources (water, minerals, fossils)
  • Land transformation
It should also be noted that the IPCC 2013 methodology is used to calculate carbon footprint [24].
  • Assessment and interpretation of the impacts of the construction phase.
  • According to the results obtained in the impact assessment of the construction phase (Figure 3), it can be seen that the passage and pipeline area generate greater effects on the environment. It is believed that this is because more impact-generating materials are used in this stage than in other stages. It should also be noted that the greatest occupation of the land is at this stage. When compared to the rest of the processes, the other stages generate very low impacts.
  • As illustrated in Table 5, the storage and passage areas and pipelines consistently represent the processes that generate the most significant impact. The considerable size of these two stages in comparison to the remainder may be a contributing factor to the elevated impact generation. Additionally, the negative values associated with “water resource depletion” in these passage areas are noteworthy. This may be linked to the processing of the steel within the factory itself. An assessment and interpretation of the impacts of the operational and maintenance phase [26] is essential. A comparison of the most significant impact categories (see Table 5) reveals that the “freshwater ecotoxicity” category exhibits the highest level of impact. The source of the elevated values for this impact remains uncertain. Table 5 provides a more comprehensive overview of the impacts generated at each stage of the process, as outlined in references [19,20].
There is a contribution to impact generation of the operation and maintenance phase. It can be seen that maintenance of the vertical-flow wetland is the process that generates the greatest impact. It should also be noted that the roughing grate does not generate any impact despite the generation of waste produced there and that, despite the amount of sludge extracted in the anaerobic lagoon, it generates a lower impact than the rest of the stages.
Of particular interest is the presence of only two impact categories in the assessment. When entering the data into the program, the only two impact categories that occur are “climate change” and “photochemical ozone formation”, while the rest have a value of zero, i.e., they do not occur.
This chapter presents a comparative analysis of the impacts generated during the construction phase and those generated during the operation and maintenance phase.
Only two impact categories are shared between the construction, operation, and maintenance phases. In the remaining categories, no impact is identified during the latter phase. Similarly, the operation and maintenance phase results in a more significant impact within the “climate change” category. This is attributable to the removal of organic matter across all stages considered. However, the operation and maintenance phases generate a considerably lower impact in the “photochemical ozone formation” category than the contraction phase. It is important to note that, as this is a biological purification system in which the energy input is zero, the operation phase is only affected by the emissions generated in the different stages and the waste and/or byproducts obtained in each of these stages. However, the construction phase entails the utilization of considerably larger quantities of materials and entails greater distances to be traversed by means of transport [28].

4. Discussion and Conclusions

During the construction phase, the highest values of environmental impact are obtained. Therefore, it is possible to improve the environmental performance of the construction process using less environmentally harmful materials. For instance, the utilization of natural cements, which consume less energy due to their lower firing temperatures, or the substitution of steel with other metals in the fabrication of grating components could be considered. The substitution of thermoplastic polyolefin for EDPM is a potential avenue for improvement. An additional potential enhancement would be the implementation of automated and regular maintenance systems, which could be powered by solar energy.
As in previous studies, in the construction stage, the materials that contribute most to the generation of impact are the steel and concrete used. In the impact of this type of steel and concrete, chosen from the database of the computer program, it can be seen how the impacts of the production of these materials in the factories at source are accounted for, which is why they have such a negative impact in this analysis. It should also be noted that the impact category “human toxicity, carcinogenic effects” is the highest. This is due to the use of steel and concrete. However, the impact category “land use” compared to the above mentioned is much lower.
Even though the consumption of materials is lower in the operation and maintenance phase, and it is a plant that operates at zero energy cost, two relevant impact categories are obtained in the study. The “climate change” category is the highest in this case, significantly outweighing the other categories. A total of 124 kg CO2 equivalent was generated during the operation and maintenance phase of the plant.
When comparing the impacts generated in both phases, it can be seen that the maintenance and operation phase generates a greater impact than the construction phase in the “climate change” impact category. Even though the installations operate at zero energy cost, the maintenance phase is higher than the construction phase. The highest impact category in both cases is “climate change”, which produces 227 kg CO2 equivalent. Of this, 103 kg of CO2 corresponds to the construction phase, i.e., 45% of the total emissions, so once again, it can be seen that this first phase contributes less to the generation of impact.
If a comparison is made of the impacts generated at the Santa Catarina WWTP located on the island of Cape Verde, made up of the previously described stages, with other treatment plants that operate similarly, the data obtained in this case are similar to those obtained in the other studies. In conclusion, the overall impact of the installation is not excessively high when compared with wastewater treatment plants that have stages with high energy costs, such as activated sludge, MBR, etc. Even so, it should be noted that the impact of this installation would be lower if the program did not use materials from the database that take into account the manufacturing part of the same.

Author Contributions

Conceptualization, N.C., P.M., G.M.R., C.G., C.A.M.P. and F.A.L.Z.; Data curation, N.C., P.M., G.M.R., C.A.M.P. and F.A.L.Z.; Formal analysis, C.A.M.P., G.M.R., T.d.P.G. and F.A.L.Z.; Funding acquisition, G.M.R., F.A.L.Z. and C.A.M.P.; Investigation, N.C., P.M., G.M.R., T.d.P.G. and C.A.M.P.; Methodology, C.G., P.M., G.M.R. and F.A.L.Z.; Project administration, G.M.R., C.G. and C.A.M.P.; Resources, N.C., P.M., C.G. and G.M.R.; Software, N.C., G.M.R. and C.A.M.P.; Supervision, C.A.M.P., G.M.R. and F.A.L.Z.; Validation, G.M.R., C.A.M.P., T.d.P.G. and F.A.L.Z.; Visualization, N.C., G.M.R., C.A.M.P. and F.A.L.Z.; Writing—original draft, N.C., T.d.P.G. and G.M.R.; Writing—review and editing, N.C., G.M.R., C.A.M.P. and F.A.L.Z. All authors have read and agreed to the published version of the manuscript.

Funding

This work has been financed by own funds of the University of Las Palmas de Gran Canaria 2023, with the title “Application of active and collaborative learning techniques in laboratories as work environments. Design, development and adaptation of equipment for its application in practical sessions” and PIE code 2023-60 of the University of Las Palmas de Gran Canaria. and the open-access with IDIWATER project (1/MAC/1/1.1/0022), co-financed by the European INTERREG MAC Programme 2021–2027.

Data Availability Statement

Data is contained within the article.

Acknowledgments

The authors are grateful for the invaluable collaboration of Aguas de Santiago (Cape Verde) and the contribution of the IDIWATER project (1/MAC/1/1.1/0022), co-financed by the European INTERREG MAC Programme 2021–2027.

Conflicts of Interest

The authors declare no conflict of interest.

References

  1. Corbella, C.; Puigagut, J.; Garfí, M. Life cycle assessment of constructed wetland systems for wastewater treatment coupled with microbial fuel cells. Sci. Total Environ. 2017, 584–585, 355–362. [Google Scholar] [CrossRef]
  2. Kadlec, R.; Wallace, S. Treatment Wetlands, 2nd ed.; CRC Press: Boca Raton, FL, USA, 2008. [Google Scholar]
  3. Saeed, T.; Sun, G. A review on nitrogen and organics removal mechanisms in subsurface flow constructed wetlands: Dependency on environmental parameters, operating conditions and supporting media. J. Environ. Manag. 2012, 112, 429–448. [Google Scholar] [CrossRef] [PubMed]
  4. Wu, H.; Zhang, J.; Ngo, H.H.; Guo, W.; Hu, Z.; Liang, S.; Fan, J.; Liu, H. A review on the sustainability of constructed wetlands for wastewater treatment: Design and operation. Bioresour. Technol. 2014, 175, 594–601. [Google Scholar] [CrossRef] [PubMed]
  5. Bohnes, F.A.; Hauschild, M.Z.; Schlundt, J.; Laurent, A. Life cycle assessments of aquaculture systems: A critical review of reported findings with recommendations for policy and system development. Rev. Aquac. 2018, 11, 1061–1079. [Google Scholar] [CrossRef]
  6. ISO 14040; Environmental Management—Life Cycle Assessment-Principles and Framework. International Standard: Geneva, Switzerland, 2006.
  7. Lutterbeck, C.A.; Kist, L.T.; Lopez, D.R.; Zerwes, F.V.; Machado, L. Life cycle assessment of integrated wastewater treatment systems with constructed wetlands in rural areas. J. Clean. Prod. 2017, 148, 527–536. [Google Scholar] [CrossRef]
  8. Garfí, M.; Flores, L.; Ferrer, I. Life Cycle Assessment of wastewater treatment systems for small communities: Activated sludge, constructed wetlands and high rate algal ponds. J. Clean. Prod. 2017, 161, 211–219. [Google Scholar] [CrossRef]
  9. Lopsik, K. Life cycle assessment of small-scale constructed wetland and extended aeration activated sludge wastewater treatment system. Int. J. Environ. Sci. Technol. 2013, 10, 1295–1308. [Google Scholar] [CrossRef]
  10. Nasution, M.A.; Wibawa, D.S.; Ahamed, T.; Noguchi, R. Comparative environmental impact evaluation of palm oil mill effluent treatment using a life cycle assessment approach: A case study based on composting and a combination for biogas technologies in North Sumatera of Indonesia. J. Clean. Prod. 2018, 184, 1028–1040. [Google Scholar] [CrossRef]
  11. Flores, L.; García, J.; Pena, R.; Garfí, M. Constructed wetlands for winery wastewater treatment: A comparative Life Cycle Assessment. Sci. Total Environ. 2018, 659, 1567–1576. [Google Scholar] [CrossRef]
  12. Hassan, A.S.A.; Ahmed, H.Y.; Fadhil, H.A.; Zeghid, M.; Chehri, A.; El-Mottaleb, S.A.A. Implementation of Shared Laser–LED Sources in a Free Space Optics (FSO) Network under Environmental Impact. Electronics 2023, 12, 801. [Google Scholar] [CrossRef]
  13. DiMuro, J.L.; Guertin, F.M.; Helling, R.K.; Perkins, J.L.; Romer, S. A Financial and Environmental Analysis of Constructed Wetlands for Industrial Wastewater Treatment. J. Ind. Ecol. 2014, 18, 631–640. [Google Scholar] [CrossRef]
  14. Saeed, T.; Afrin, R.; Al Muyeed, A.; Sun, G. Treatment of tannery wastewater in a pilot-scale hybrid constructed wetland system in Bangladesh. Chemosphere 2012, 88, 1065–1073. [Google Scholar] [CrossRef] [PubMed]
  15. Saeed, T.; Khan, T. Constructed wetlands for industrial wastewater treatment: Alternative media, input biodegradation ratio and unstable loading. J. Environ. Chem. Eng. 2019, 7, 103042. [Google Scholar] [CrossRef]
  16. Saeed, T.; Muntaha, S.; Rashid, M.; Sun, G.; Hasnat, A. Industrial wastewater treatment in constructed wetlands packed with construction materials and agricultural by-products. J. Clean. Prod. 2018, 189, 442–453. [Google Scholar] [CrossRef]
  17. Saeed, T.; Yasmin, N.; Sun, G.; Hasnat, A. The use of biochar and crushed mortar in treatment wetlands to enhance the removal of nutrients from sewage. Environ. Sci. Pollut. Res. 2018, 26, 586–599. [Google Scholar] [CrossRef]
  18. Vandepaer, L.; Treyer, K.; Mutel, C.; Bauer, C.; Amor, B. The integration of long-term marginal electricity supply mixes in the ecoinvent consequential database version 3.4 and examination of modeling choices. Int. J. Life Cycle Assess. 2019, 24, 1409–1428. [Google Scholar] [CrossRef]
  19. Welz, T.; Hischier, R.; Hilty, L. Environmental impacts of lighting technologies—Life cycle assessment and sensitivity analysis. Environ. Impact Assess. Rev. 2011, 31, 334–343. [Google Scholar] [CrossRef]
  20. Niero, M.; Pizzol, M.; Bruun, H.G.; Thomsen, M. Comparative life cycle assessment of wastewater treatment in Denmark including sensitivity and uncertainty analysis. J. Clean. Prod. 2014, 68, 25–35. [Google Scholar] [CrossRef]
  21. Zhou, W.; Guan, K.; Peng, B.; Margenot, A.; Lee, D.; Tang, J.; Jin, Z.; Grant, R.; DeLucia, E.; Qin, Z.; et al. How does uncertainty of soil organic carbon stock affect the calculation of carbon budgets and soil carbon credits for croplands in the U.S. Midwest? Geoderma 2023, 429, 116254. [Google Scholar] [CrossRef]
  22. Rodriguez-Garcia, G.; Molinos-Senante, M.; Hospido, A.; Hernández-Sancho, F.; Moreira, M.; Feijoo, G. Environmental and economic profile of six typologies of wastewater treatment plants. Water Res. 2011, 45, 5997–6010. [Google Scholar] [CrossRef]
  23. Idrees, M.; Akbar, A.; Saeed, F.; Gull, M.; Eldin, S.M. Sustainable production of Low-Shrinkage fired clay bricks by utilizing waste plastic dust. Alex. Eng. J. 2023, 68, 405–416. [Google Scholar] [CrossRef]
  24. Bošković, I.; Radivojević, A. Life cycle greenhouse gas emissions of hemp-lime concrete wall constructions in Serbia: The impact of carbon sequestration, transport, waste production and end of life biogenic carbon emission. J. Build. Eng. 2023, 66, 105908. [Google Scholar] [CrossRef]
  25. Wang, C.-Q.; Chen, S.; Huang, D.-M.; Huang, Q.-C.; Li, X.-Q.; Shui, Z.-H. Safe environmentally friendly reuse of red mud modified phosphogypsum composite cementitious material. Constr. Build. Mater. 2023, 368, 130348. [Google Scholar] [CrossRef]
  26. Menghini, M.; Pedrazzani, R.; Feretti, D.; Mazzoleni, G.; Steimberg, N.; Urani, C.; Zerbini, I.; Bertanza, G. Beyond the Black Box of Life Cycle Assessment in the Wastewater Treatment Plants: Which Help from the Bioassays? Water 2023, 15, 960. [Google Scholar] [CrossRef]
  27. Renou, S.; Thomas, J.; Aoustin, E.; Pons, M. Influence of impact assessment methods in wastewater treatment LCA. J. Clean. Prod. 2008, 16, 1098–1105. [Google Scholar] [CrossRef]
  28. Owsianiak, M.; Laurent, A.; Bjørn, A.; Hauschild, M.Z. IMPACT 2002+, ReCiPe 2008 and ILCD’s recommended practice for characterization modelling in life cycle impact assessment: A case study-based comparison. Int. J. Life Cycle Assess. 2014, 19, 1007–1021. [Google Scholar] [CrossRef]
Figure 1. Stages of the Santa Catarina NTSW.
Water 16 02653 g001
Figure 2. Stages included and excluded from the LCA.
Water 16 02653 g002
Figure 3. Primary effluent parameters of ETAR Santa Catarina [10,11].
Water 16 02653 g003
Figure 4. Secondary effluent parameters of ETAR Santa Catarina [10,11].
Water 16 02653 g004
Table 1. Input water characterization.
Influent—Santa Catarina
DateTSS
(mg/L)
CODT
(mgO2/L)
CODs
(mgO2/L)
TN
(mgN/L)
NO3
(mgN/L)
TP
(mg P/L)
22/Dec725202512481670.6620
29/Dec50015906392261.221
12/Jan107515044162410.0926
19/Jan47511465432001.122
26/Jan90020184892310.6915
2/Feb1753403221390.4716
9/Feb60017007042300.7136
16/Feb72518727181950.6811
23/Feb82514845632270.7619
2/Mar80016387382930.8829
9/Mar35011246662410.9620
Table 2. Anaerobic lagoon parameters.
BOD5 (mg/L)
Anaerobic lagoon inlet310
Anaerobic lagoon outlet214
Performance elimination45%
Table 3. Parameters of the vertical-flow system.
BOD5 (mg/L)
Entrance214
Exit47
Performance elimination78%
Table 4. Generation of waste and/or byproducts.
Local of IntervenorType of InterventionFrequencyMaterial Used
networkPressure cleaning2 times per weekPit road
Estaçaõ de Bombagemmaintenance cleaning2 times per weekPit lorry/operator
Pre-treatmentpermanent cleaning of thick wastedaily and permanentoperator
Drying bedDeferred separation of waste conveyor of waste
Separator from decanterwaste removal fluctuantthree times a weekclamshell
Bottom cleaningwhen necessaryPit lorry
DecanterRemoval of waste fluctuatingpermanent due to the accumulation of two residuesCable net
operation2 in simultaneous and 1 in standby
removal of slatsfrom 2 to 2 months (for 30 months)manager
Brita filtercleaning and effluent removal every 4 months with pond water dischargeFossa road
removal of gravel every 3 years and checking gravel quality
Chassecleaning2 times per monthLorry/manager
change/operation of box1 time per weekoperator
rest 2 weeks for each operatoroperator
Filtro de AreiaSand Filter change in operation box one box for each weekoperator
LagoaLagoon Emptying/cleaning Lagoon when necessary manager and operator
Table 5. Impact assessment of the construction phase by impact category (characterization).
Freshwater EcotoxicityCTUe37.711.226.677.5164746
Climate changekg CO2 eq0.8166.682.017.2568.917.1
Land usekg C deficit0.64522.7621.1165103
Ionizing radiation HHkBq U235 eq0.05550.2540.3580.5452.211.37
Terrestrial eutrophicationmolc N eq0.009950.07910.02250.0690.7490.202
Adificationmolc H+ eq0.004870.02250.01390.03920.2470.108
Photochemical ozone formkg NMVOC eq0.002730.02020.008910.02510.1970.0579
Particulate matterkg PM2.5 eq0.001330.001970.001830.005170.0220.0268
Marine eutrophicationkg N eq0.0009330.007110.002110.006460.0840.019
Freshwater eutrophicationkg P eq0.0002450.0007320.0003630.001020.007190.00469
Mineral, fossil & ren resourceskg Sb eq0.0001110.00002810.00008230.0002430.0002520.00219
Disclaimer/Publisher’s Note: The statements, opinions and data contained in all publications are solely those of the individual author(s) and contributor(s) and not of MDPI and/or the editor(s). MDPI and/or the editor(s) disclaim responsibility for any injury to people or property resulting from any ideas, methods, instructions or products referred to in the content.

