Abstract
The application of hydrogeophysical techniques to delineating aquifers was conducted in De Aar, the eastern part of the Karoo region, Northern Cape, South Africa. Previously, recharge estimations in this region assumed a uniform aquifer type, overlooking the presence of diverse aquifer systems. This study identified both unconfined and confined aquifers to improve recharge potential assessments. Vertical electrical resistivity sounding (VES) and ground telluric methods were applied. Six VES stations and eleven profiles were measured using a 1D Wenner array configuration. The VES data, processed with IPI2win software, generated a 2D subsurface model. In contrast, the telluric data were analyzed using an automated algorithm to create a 2D profile. The electric potential difference curve was interpreted in comparison with lithological cross-sections. The VES results revealed three to four distinct layers of low-resistivity (0.9–8.1 Ωm), moderate-resistivity (22.4–125 Ωm), and high-resistivity (68–177 Ωm) values, indicating three lithological formations. The telluric data suggested that shallow groundwater boreholes were located in areas with groundwater levels above 50 m. These findings, which matched the lithological data, pointed to a double-layer aquifer system, suggesting that recharge estimates should be carried out to different aquifer layers. The study demonstrated how hydrogeophysical methods can effectively delineate aquifer systems and enhance the identification of recharge areas.
1. Introduction
Aquifer delineation is crucial for measuring local and regional groundwater recharge, particularly in arid regions with limited surface water. Such environments tend to be groundwater-dependents where aquifers serve as the primary potable water supply. Woodford [1] reports that some aquifer systems supply over 50% of domestic water with no alternative source with limited surface water sources. In detailed knowledge on such aquifers and how they are recharge remain vital. In such areas, understanding groundwater recharge locality controls is essential for managing the hydrologic cycle, developing effective water allocation plans, and implementing accurate water monitoring practices [2]. A lack of understanding about aquifer systems and their recharge rates can lead to inadequate groundwater allocation plans and ineffective water monitoring practices. The current approaches for estimating recharge and planning water allocation do not account for the presence of multiple aquifer types within one area, relying instead on broad quaternary catchment delineation assumptions, which may lead to inaccurate uniform recharge values. This is despite the fact that various methods, including geological, hydrogeological, geophysical, and remote sensing techniques, can be applied to delineate aquifers and assess groundwater recharge potential zones [3]. Hydrogeological experiments and geophysical surveys are valuable for understanding groundwater recharge processes and spatial–temporal variations, but they often focus on single factors or rely on indirect, site-specific experiments [3].
Various geophysical techniques, including geoelectrical and electromagnetic methods, are used to delineate subsurface aquifers by assessing their extent and thickness [4,5]. The study employs both ground telluric and electrical resistivity sounding methods [6]. Geophysical studies in groundwater exploration typically involve deep and shallow aquifer delineation stages [7]. The electrical resistivity method is widely utilized due to its simplicity and efficient data acquisition and is particularly effective in delineating groundwater systems [8]. However, 1D interpretation has limitations such as not accounting for lateral changes in subsurface electrical resistivity, which can lead to errors in layer interpretation [9]. Although full 3D interpretation is free from such shortcomings, its application and interpretation of data acquisition is difficult to use. Despite these limitations, the method offers detailed insights into subsurface layer variations, identifying structures like aquicludes and aquitards sensitive to geological properties such as clay content [10,11]. Hydrogeophysical survey methods are also widely applied in groundwater exploration for community water supply projects [12,13,14]. Globally, electrical geophysical methods have been used extensively in groundwater studies. In the eastern Karoo region of South Africa, Vegter. [14] utilized electrical resistivity and refraction seismic methods alongside drilling to map alluvium deposit thickness and depths, distinguishing three aquifer types: coarse-grained basalt, weathered and fractured Beaufort and Ecca strata, and dolerite near intrusive contacts. In Northern Ethiopia, Bairu et al. [15] employed vertical electrical sounding and horizontal profiling to assess geological formations and structures. Sunmonu et al. [16] conducted a similar study in Nigeria using vertical electrical soundings to map aquifer patterns. In Egypt, Mohamaden. et al. [12] utilized geoelectric techniques for aquifer and subsurface stratigraphy detection while in Malaysia, Riwayat et al. [17] highlighted challenges with conventional techniques providing limited point-specific data. In Pakistan, India, Niaz et al. [18] applied Schlumberger array vertical electric soundings for aquifer delineation and vulnerability mapping, respectively, and AL-Juboury et al. [19] studied saline groundwater effects on electrical resistivity in Dammam formation, Iraq, Asia.
Ground telluric techniques rely on electrical potential difference (measured in millivolts) as the primary parameter for groundwater exploration [20,21]. This method has recently gained popularity in Africa for groundwater investigations. In South Africa, Gomo [21], who utilized electric potential difference in audio magneto telluric (AMT) geophysics for groundwater exploration, highlights the necessity of gaining a thorough understanding of ground telluric geophysical applications in this field. Hassan et al. [22], who applied this method in estimating groundwater recharge rates and identified groundwater recharge zones in the Kakia and Esamburbur sub-catchments of Narok, propose the adoption of managed aquifer recharge structures, which would significantly improve recharge, and thus increased availability of water to the locals even during the dry seasons. In Nigeria, Oyegoke et al. [20] used ground telluric to assess the effectiveness of the geophysical assessment of boreholes drilled in basement complex terrain at Afe Babalola University, using the method. Furthermore, Khan et al. [23] applied ground magnetotelluric methods in an integrated geophysical approach for groundwater investigation in the north-western part of Pakistan and managed to successfully locate aquifers with relative depths and electric resistivity (ER) survey for investigating the groundwater salinity.
This study is aimed at demonstrating the use of hydrogeophycal techniques in delineating aquifer systems into unconfined and confined areas and zones likely to control groundwater recharge. It argues that unless different aquifer types and drill log borehole lithologies into each aquifer type are delineated, accurate estimates of groundwater recharge rates cannot be achieved, which is crucial for improving groundwater allocation plans and water monitoring practices. The De Aar municipal wellfield, situated in the eastern part of the Karoo Supergroup, Northern Cape, South Africa is used as a specific case study. Estimating recharge potential in the Karoo Supergroup, with its diverse sediment groups and physical properties, requires a detailed understanding of aquifer types and geological patterns [14]. Most boreholes in this region have reported low safe yields (<1 L/s), yet significant volumes of groundwater are extracted daily for community water supply. The Karoo fractured rock aquifers with low storage capacity receive limited and highly variable rainfall recharge [24]. Their groundwater exploitation potential during prolonged droughts is largely controlled by the temporal variability of recharge [20].
2. Study Area Description
2.1. Local Setting
The study was conducted in De Aar, Emthanjeni Local Municipality, Northern Cape Province, South Africa and is part of the eastern Karoo Supergroup (Figure 1a). In terms of hydrological basins, the study is within the Lower Orange Water Management Area (WMA) and encompasses the quaternary catchment drainage regions D62C and D62D. The area was further subdivided into three parts: the lower (altitude from 1183 to 1233 m), middle (altitude from 1233 to 1261 m), and upper catchments (altitude from 1261 to above 1404 m), (Figure 1c). The study area covers approximately 2226 km2 with a semi-arid climate characterized by an average annual rainfall of 27 mm calculated from monthly totals. The majority of this rainfall typically falls during the summer months, starting in November/December and ending in March/April. Geomorphologically, the study area is characterized by scattered rings of dolerite hills, reaching diameters of up to 12 km and covering an area of 50–60 km2, and are formed by horizontally layered dolerite sheets [25]. The region is classified as lowland interspersed with mountainous hills nestled between river valleys. The Elandsfontein spruit, originating southeast of Hanover and the Brak River near Caroluspoort, along with several minor tributaries, drains the entire study area (Figure 1c). The confluence of these two ephemeral river systems lies approximately 10 km northwest of De Aar town. These rivers typically flow briefly, and mainly during and after heavy rainfall. Numerous slopes of dolerite hills frequently intersect the intermediate valley areas. The riverbeds lie below the groundwater table, leading to the formation of standing pools of water along the Elandsfontein Spruit and Brak River systems [14].
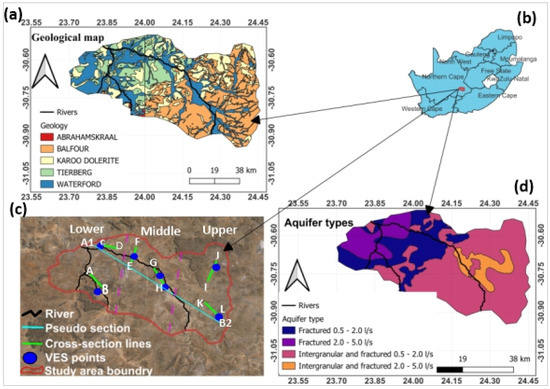
Figure 1.
(a). The geological map depicting the sedimentary and igneous outcrops of the basement rocks, (b). Show the location of the study area within the Northern Cape Province, South Africa. (c). Topographical landscape, including the locations of the VES points, regional pseudo section lines, cross-sections lines, drainage by the Brak River and Elandsfontein Spruit. (d) Various aquifer types as well as yield from each aquifer type.
2.2. Geology and Hydrogeological Setting
The study area is primarily defined by Karoo sedimentary rock formations, which are horizontally layered with a slight dipping, occasionally altered by notable dolerite intrusions. Vegter [14] has conducted investigations into the stratigraphy of the study area and ascertained that the area is composed of Ecca and Beaufort Group sediments, specifically the Tierberg and Middleton formations. The Ecca Group, the older of the two, consists of dark grey shale and siltstone formations found predominantly in the lower catchment (north-western site of the study area) and extending into parts of the middle catchment (north-eastern site) [26]. Layers and lenses of siltstone and fine-grained sandstone intermittently interrupt the shale succession at various horizons [4]. The Beaufort Group, dating to the late Permian period, comprises mudstone, siltstone, and sandstone formations [14]. In areas where these sediments have been fractured by intrusive dolerite formations, the rocks serve as significant groundwater-bearing targets. Dolerites typically intrude as dykes, sheets, and sills of various thicknesses. Ring-shaped dolerite structures are frequent, overlapping up to 30 m wide with curved outcrops. These formations range in width from 1 m to over 10 m and in length from 1 to 7 km [27]. Their shapes and orientations vary, transitioning into nearly horizontal sheet bodies. Kimberlites, deposited in the upper catchment southeast of the study area, occur as pipes or dykes [27]. Alluvial deposits are primarily found within river valleys and exhibit significant lateral and vertical heterogeneity. The maximum thickness of these deposits ranges from 10 to 15 m. Surface limestone deposits, formed from salt buildup in layers after evaporation in areas with shallow groundwater tables, are widespread but generally thin less than 5 m. Groundwater quality is classified as class II, with electrical conductivity (EC) ranging from 150 to 250 mS/m and total dissolved solids (TDS) exceeding 1000 mg/L [28]. Although dolerite intrusive formation itself is not highly groundwater productive, high-yielding groundwater strikes are often encountered in the sedimentary section of both the upper and lower contact zones with the dolerite zones [14]. The water strike in sedimentary layers above dolerite is significantly greater than in the underlying dolerite sections. In the study area, yields exceeding 5 L/s can be found in the weathered and fractured shale beneath the alluvium, particularly in areas where nearly complete calcification has occurred [1]. Boreholes that encounter multiple water-bearing fractures often produce higher yields than those with a single fracture. The groundwater level is very shallow, reflecting the superficial nature of the aquifer. However, this shallowness may be somewhat exaggerated due to the fact that exploration, monitoring, and production boreholes are primarily drilled along the river valley.
3. Material and Methods
3.1. Electrical Resistivity Sounding Data Acquisition
The vertical electrical sounding (VES) surveys were conducted using the Geotron electrical resistivity (ER) meter model G41 to measure the subsurface apparent electrical resistivity using Wenner array configuration [29,30] (Figure 2). The Wenner array configuration was chosen for its robust signal strength in noisy environments and enhanced sensitivity to vertical electrical resistivity variations and horizontal structures. The investigation proceeded under the assumption that geological sections are predominantly horizontally layered, comprising various geological strata or pseudo-layered structures influenced by groundwater levels and weathering [31].
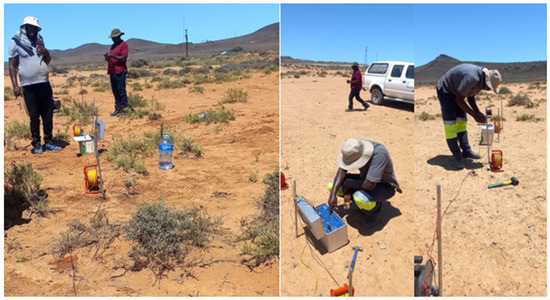
Figure 2.
Field setup of the electrical resistivity survey during the field investigations.
Seven VES stations were strategically placed throughout the study area to map various aquifer types, distinguishing between unconfined and confined aquifer layers along the survey lines [32]. At least two VES stations were established in each of the three catchments (i.e., lower, middle, and upper). Interpretation of the VES data involved partial curve matching using IP2WIN (lite) software [12,33], where plots were compared with standard master curves to determine optimal layer parameters such as resistivity, thicknesses, and depths. This process facilitated the development of an electrical resistivity–depth model for each area [34]. The electrical resistivity values were used to create 1D spatial curve graphs illustrating the layers of subsurface geometry [35]. The electrical resistivity and thickness values were interpolated to create two-dimensional (2D) regional pseudo-cross-sections A1–A2. These pseudo-cross-sections, derived from subsurface electrical resistivity data, were subsequently interpreted to describe each electrical resistivity layer and correlated with corresponding borehole log cross-sections.
3.2. Ground Magnetoteluric Method
In this study, the ground telluric method was employed as a complementary passive technique to delineate various aquifer layers (including confined and unconfined systems). This method was selected due to its resolution, simplicity, ease of use, high penetrating depth, and high resistance to interference [20]. The PQWT-TC300 series equipment was used for these procedures (Figure 4). Ten profile lines were established as shown in Figure 3. The ground telluric technique, which utilizes electrical potential differences (mV) to explore groundwater resources, has become popular in Africa for its effectiveness in investigating subsurface electric resistivity structures using the earth’s natural electromagnetic field [12,15,20,21,36]. Two non-polarizable electrodes, spaced 10 m apart, were employed for this study. Profiles 1 to 5 were conducted in the lower catchment area, with elevations ranging from 1183 to 1227 m (Table 1). The profile lengths ranged from 200 to 300 m each, with 20 to 30 point intervals. Profiles 6 to 8 were situated in the middle catchment area, at elevations between 1231 and 1261 m (Table 1). These profiles ranged from 200 to 250 m in length, with 20 to 25-point intervals (Table 1). Profiles 9 to 10 were established in the upper catchment area, with elevations between 1387 and 1404 m. Each of these profiles was 250 m long, with 25-point intervals (Table 1). The PQWT measures the electric potential difference between the M and N electrodes, corresponding to specific investigation depths (Figure 4). Raw data of electric potential differences at various frequencies were plotted against depth to create electrical potential difference curves. Gomo [21] emphasizes the importance of understanding this method for groundwater exploration, noting its capability to delineate deep structures with greater penetration than conventional methods. The method is increasingly employed alongside traditional techniques like electrical resistivity, providing 2D images through inverse modeling to interpret subsurface conditions [37]. Several studies highlight the effective application of the ground telluric method in groundwater exploration. The instrument operates by measuring the electric field component of the Earth’s electromagnetic field across various frequencies, which in turn delineates structures with high groundwater potential [23].
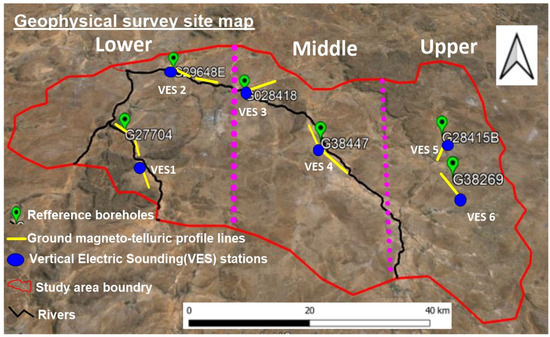
Figure 3.
Study area map showing the geophysical field sites displaying the locations of vertical electric sounding stations and ground telluric profile lines.

Table 1.
Summary information of the boreholes identified as references during the geophysical survey using ground telluric method.
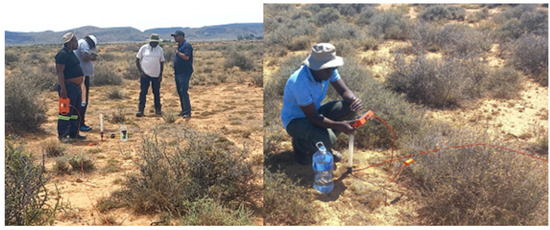
Figure 4.
Field procedures for conducting ground telluric surveys during the investigations.
3.3. Lithological Cross-Section of the Existing Boreholes
The geological cross-sections of the study area were constructed from data obtained from borehole drill cuttings sourced from the Department of Water and Sanitation (DWS) National Groundwater Archives NGA URL:“https://www.dws.gov.za/NGANet/Security/WebLoginForm.aspx” (accessed on 20 September 2022). The data were obtained from total of 12 boreholes that were drilled along the Elandsfontein Spruit and Brak River, representing the lower catchment area, while 13 boreholes were drilled along the Brak River, representing the middle catchment. Additionally, 8 boreholes were drilled in the headwaters, representing the upper catchment site. Initially, a line connecting two points (e.g., A-B) was drawn to mark the topographic elevation along the survey line. Subsequently, this elevation line was converted into a cross-section using Golden Suffer software, illustrating the surface topography. Borehole log information was then utilized to construct 2D hydrogeological cross-sections (Figure 5, Figure 6 and Figure 7). The interpretation of drill log cross-sections was integrated with resistivity data obtained from hydrogeophysical surveys to establish the applicability of these techniques in delineating aquifer layering to infer zones of groundwater recharge potential. Nearby boreholes with lithological logs were identified and used to correlate and calibrate the interpreted electrical resistivity data with actual geological information (Figure 8, Figure 9 and Figure 10).
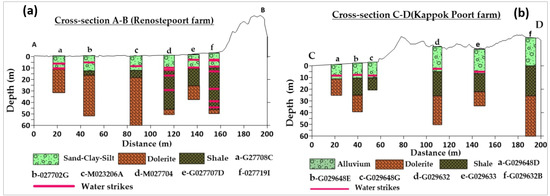
Figure 5.
(a), The lithological cross-sections of the boreholes used to calibrate and validate aquifer types in Renosterpoort farm and (b) in Kappok Poort farm, lower catchment area.
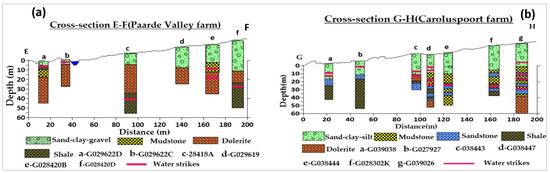
Figure 6.
(a) The lithological cross-sections of the boreholes used to calibrate and validate the aquifer types in Paarde Valley farm and (b) in Caroluspoort farm middle catchment area.
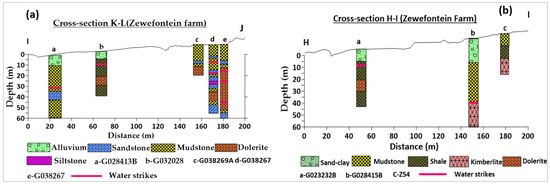
Figure 7.
(a,b). The lithological cross-sections of the boreholes were used to calibrate and validate the aquifer types in Zewefontein farm, upper catchment area.
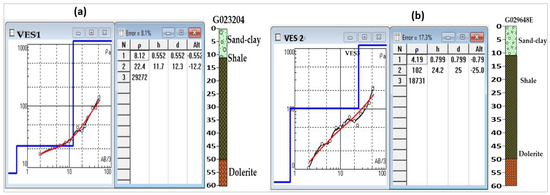
Figure 8.
(a) VES sounding curve generated in Renostepoort, and (b) VES sounding curve generated in Blaukranz farm, lower catchment area.
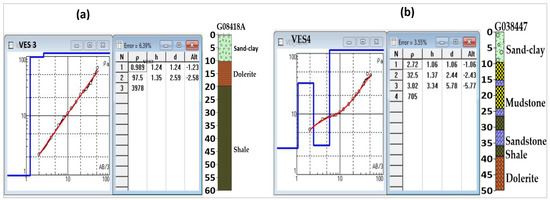
Figure 9.
(a) VES sounding curve generated in Paarde Valley, and (b) VES sounding curve in Caroluspoort farm, middle catchment area.
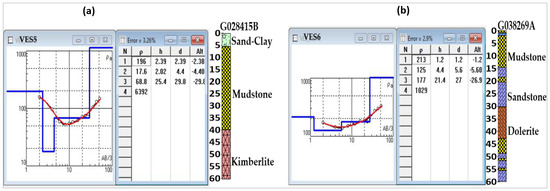
Figure 10.
(a,b). A VES sounding curve was generated at the Zewe Fountein farm, upper catchment area.
4. Results and Discussion
4.1. Electrical Resistivity Results and Lithostratigraphic Cross-Section
The interpretation of the vertical electrical sounding (VES) curves involved analyzing the apparent electrical resistivity and grouping them to create a regional pseudo-cross-section of the area (Figure 11). The data from VES stations were processed, interpreted, and analyzed using the IPI 2win software. Apparent electrical resistivity values were plotted against electrode spacing AB/3, with data error margins of 8.1% (VES1), 17.3% (VES2), 6.39% (VES3), 3.5% (VES4), 3.2% (VES5), and 2.9% (VES6) (Figure 8, Figure 9 and Figure 10). The AB/3 electrode spacing is recommended for the Wenner array, while the Schlumberger array uses an AB/2 electrode spacing. An acceptable apparent resistivity error is less than 10% to avoid overfitting or underfitting the data. The electrical resistivity values were correlated with the geological log obtained from a nearby borehole presented in Figure 5, Figure 6 and Figure 7. The findings presented in Figure 8, Figure 9 and Figure 10 suggest a subsurface medium consisting of multiple layers, typically three to four significant layers identified based on varying apparent electrical resistivity values. The first layer in the lower and middle catchments indicates the topsoil, sand, clay, and silt aquifer material, the second and third layers are dominated by interchanging weathered shale, sandstone, mudstone, and siltstone, and lastly, the fourth layer mainly weathered dolerite at a shallow depth and compacted hard dolerite at a deeper depth. Woodford [27,28] described the occurrence of alternating sandstone, mudstone, and shale in elevated terrain as potential groundwater recharge aquifers. As previously indicated, nearby borehole logs were utilized to correlate and calibrate the interpreted electrical resistivity data to demonstrate groundwater potential recharge areas. The interpretation of vertical electrical sounding (VES) results demonstrated a strong correlation between resistivity data and borehole logs, with consistent layering observed across all profiles. Figure 8, Figure 9 and Figure 10 present the comparison between electrical resistivity data and borehole logs obtained from the Department of Water and Sanitation (DWS). In the lower catchment, VES 1 and borehole G023206A, as well as VES 2 and borehole G029648E, revealed three distinct layers characterized by variable resistivity with consistent thickness and depth at the surface. This variability reflects a heterogeneous geological formation, including sand, clay, and silt at the top, transitioning to moisturized shale and dry dolerite below the surface. The low-electrical resistivity (0.9–8.1 Ωm) in the lower catchment can be attributed to differences in soil moisture and clay content. At depths greater than 12.3 m (VES 1) and 25 m (VES 2), the high resistivity is associated with the onset of dry hard rock formations such as dolerite sills or dykes. In this area, groundwater strikes are frequently encountered at depths below 10 m, consistent with the geological cross-sections. These findings align with the results of Araffaet al. [4], who found that clay formations in the survey area were indicated by low-resistivity values (<100 Ωm), while sand layers in the central part of the study zone were characterized by high-resistivity values (>600 Ωm). Their study proved that resistivity data can be valuable for detecting clay layers and mapping subsurface structures. Three to four layers were identified in the middle catchment, with variable resistivity and consistent thickness and depth near the surface (topsoil). Geologically, VES 3 and logs in borehole profile G38418A, as well as VES 4 and logs in borehole profile G38447, were characterized by low-resistivity (0.98–2.72 Ω), and moderate-resistivity (3.82–97.5 Ωm) shale, and alternating sandstone and mudstones influenced by groundwater accumulations at depths between 5 and 40 m as well as high resistivity (705–3978 Ωm) of unweathered dolerite below 40 m depth (Figure 9a,b). According to a study conducted by [22] in Kakia and Esamburbur Sub-Catchment Narok, Kenya, low-resistivity values indicate the presence of a high density of fractured and porous zones, which are considered major recharge sites. Good correlations between resistivity and geological logs were noted, demonstrating how hydrogeophysical tools can effectively delineate aquifer systems and enhance the identification of recharge areas. Extremely high resistivity between 2.59 m and 5.78 m at VES 3 suggests the beginning of bedrock formation, while dry sandstone or mudstone formation is observed at VES 4. In the upper catchment (headwaters), four layers were identified as moderate (196–213 Ωm) to high resistivity (1029–6392 Ωm). The high resistivity is attributed to dry mudstone and sandstone near the surface layer, with underlying dolerite and kimberlite pipes below the surface (Figure 8, Figure 9 and Figure 10). High resistivity below 30 m is linked to unweathered rocky gravel layers and intrusive rocks. These results are like a study conducted by Khan et al. [23], whereby high-resistivity values were attributed to the presence of highly cemented rocks or sandstone with low porosity and therefore less recharge potentiality. The result of this nature also justifies the beginning of bedrock formation. The geological log from boreholes indicates that groundwater is more frequently encountered in the alluvium (clay and sand) and the weathered fractured zones (comprising shale, sandstone, and mudstone) of both the upper and lower contact zones, compared to dolerite and kimberlite pipes (Figure 5, Figure 6 and Figure 7). According to Vegter [14], sedimentary layers directly overlying dolerite yield significantly higher water strikes than the dolerite itself, and sandstone exhibits more frequent water strikes than other sedimentary and igneous layers. The assessment of the borehole cross-section log shows that most boreholes have penetrated the Ecca group of shale, sandstone, mudstone, and siltstone, with fewer penetrations into the Beaufort group of dolerites (Figure 5, Figure 6 and Figure 7). The near-surface resistivity followed an order of equal thickness and depth throughout the study area. Resistivity measurements of the alluvium and weathered fractured zones extend to a maximum depth of 25 m, whereas dolerite extends deeper. The thickness of these layers varies depending on location, positioning, and orientation. Resistivity values for the alluvium formations range from 5 to 30 Ωm, while the underlying sedimentary rocks such as shale, sandstone, mudstone, and siltstone show resistivities between 20 and 102 Ωm. The bedrock beneath both the alluvium and sedimentary layers is more weathered and fractured, with resistivities reaching up to 30,000 Ωm. This increase in resistivity is evident at the third and fourth layers, marking the transition to a dry bedrock formation at their maximum penetration depth.
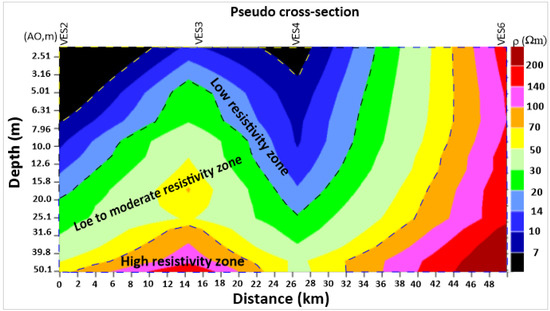
Figure 11.
Regional pseudo-cross-section integrating four VES stations, i.e., VES2 lower catchment, VES3 middle catchment, VES4 middle catchment, and VES6 upper catchment.
4.2. Regional Pseudo-Cross-Section
Figure 11 displays a regional pseudo-cross-section created by interpolating VES2, VE3, VES4, and VES6 data. The study identified three to four layers of low resistivity in the first and second layers, low to moderate resistivity in the third layer, and high resistivity near the surface as well as basement rock of the fourth layer (Figure 11). Similar findings were reported by Nazifi and Lambon [38] in Ghana and Mohamaden et al. in Egypt [12]. Mohamaden [12] identified three geological layers, with the first being sand and gravel with high resistivity (7.61–346 Ωm) and thin thicknesses (0.252–9.19 m), which differs slightly from our study due to the high resistivity of sand and gravel. The area with low electrical resistivity extends approximately 36 km. However, the regional distribution, thickness, and depth of the higher resistivity structures could not be fully determined due to their depth beyond the study’s scope, though they are likely composed of solid and dry formations such as dolerite, kimberlite, and dry sandstone. Kimberlite dykes, characterized by high resistivity, are located in the upper catchment, particularly to the east and southeast of the study area (VES6) (Figure 11). Of the four layers, the top layer is topsoil with resistivity ranging from 0 to 7 Ωm. The second layer, interpreted as unconfined, consists of sand, clay, and silt at variable depths between 5 and 20 m, with resistivity ranging from 7 to 20 Ωm. This layer contains groundwater, as evidenced by water strikes and depth to water, with an average water level depth of approximately 3 to 5 m, and shallower depths near the river valley due to the superficial nature of the aquifers [25]. The river–aquifer interaction influences groundwater levels near the valley. Municipal production and DWS monitoring boreholes are strategically located near the river valley to leverage the increased groundwater recharge potential. These findings are consistent with those in Sukolilo, Surabaya, East Java, as reported by Bahri et al. [16], who used lithological logs and resistivity measurements to delineate aquifers and assess groundwater quality. The third layer is identified as a semi-confined or leaky aquifer with a resistivity between 20 and 70 Ωm, and is found at depths ranging from 20 to 50 m. This layer predominantly consists of fractured shale and dolerite in the lower catchment, and sandstone, siltstone, mudstone, and dolerite in the middle and upper catchments. Clay and shale in this layer act as barriers or confining layers between the overlying sandstone, mudstone, or dolerite. The fourth layer is highly resistive (>210 Ωm), indicating hard rock or the bedrock basement aquifer, which is typically fractured and confined, with decreasing permeability and yields with depth [25]. According to Vegter [25] and Woodford [28], groundwater is more commonly found in sedimentary formations at both the upper and lower contact zones than in dolerite sections. Vegter [25] also noted that groundwater yields in sedimentary layers above dolerite are significantly higher than in the dolerite itself. This study’s results align with Vegter’s findings, indicating that alluvial aquifers in the area are semi-confined, or unconfined with delayed yield.
4.3. Ground Telluric Survey Results
Table 1 presents hydro census data, including borehole depth, static water level, elevation, casing depth, water strike depth, and lithology from reference boreholes. Ten profile lines were established across the study area. Out of these, profile lines 1, 5, 6, 7, 9, and 10 were interpreted (Table 1 and Figure 12, Figure 13 and Figure 14). The telluric data were processed and analyzed using an automated algorithm to create subsurface 2D profile image maps. The interpretation involved comparing the 2D processed profiles and electrical potential difference curves with lithology data from nearby boreholes to establish correlations (Figure 12, Figure 13 and Figure 14). The software generates electrical potential difference curves at various frequencies through analog-to-digital sampling and creates a 2D profile map along a traverse line. According to Adagunodo et al. [16], intersections or low convergence of the electrical potential difference curves generally indicate porous, faults, or fractured media filled with water or weathered rock formations, while significant divergence suggests highly resistive, compacted, or hard rock terrains.
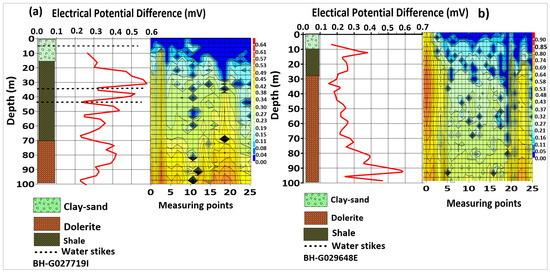
Figure 12.
An electrical potential difference curve plot with a 2D profile image coupled with lithological logs obtained from reference boreholes, shows the subsurface structural elements delineated during geophysical survey in the lower catchment (a) Renostepoort farm and (b) Kappork Poort farm.
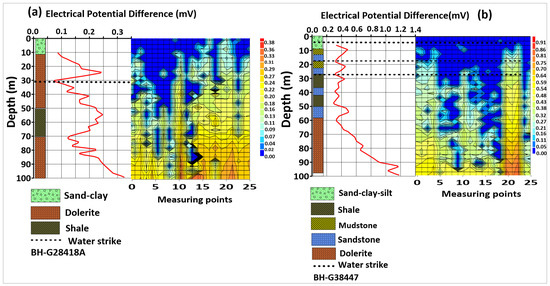
Figure 13.
An electrical potential difference curve plot with a 2D profile image coupled with lithological logs obtained from reference boreholes, shows the subsurface structures delineated during geophysical survey in the middle catchment (a) Paarde Valley farm and (b) Caroluspoort farm.
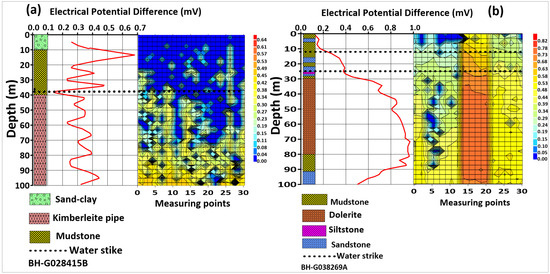
Figure 14.
(a,b). An electrical potential difference curve plot with a 2D profile image coupled with lithological logs obtained from reference boreholes, shows the subsurface structural elements delineated during geophysical survey in the upper catchment (Zewefontein farm).
Four lines of 200 m (20 data points), five lines of 250 m (25 data points), and two lines of 300 m (30 data points) were established across the study area (Table 1). Figure 12, Figure 13 and Figure 14 display the electrical potential difference curves, 2D profile images, and lithology data from nearby boreholes. According to Nazifi et al. [38] compact rock that is neither fractured nor weathered does not transmit or store groundwater, making groundwater recharge more likely in loose or less compacted areas or where cracks or fractures are present. This study adopted a similar approach to identify potential groundwater recharge areas. Colors such as blue, light blue, and light yellow indicate materials with low potential difference values, including water, mud, moist sand, clay, gravel, and silt, particularly at shallow depths. Yellow represents materials with moderate electrical potential difference values, such as weathered and fractured shale, sandstone, and mudstone. Red signifies materials with high potential difference values, like dense, hard rock formations such as dolerite, kimberlite pipes, and siltstone as explained by Garamoon et al. [39] in Kakia and Esamburbur sub-catchment Narok, Kenya (Figure 12, Figure 13 and Figure 14).
In the lower catchment area, the lithological logs of reference borehole G027719I reveal groundwater at depths of 4 m, 9 m, 12 m, 24 m, and 42 m within sand, shale, and dolerite formations (Table 1). For reference borehole G029648E, groundwater was found at 8 m within an alluvium formation (sand). The groundwater level of the two boreholes was measured at 3.13 m and 4.83 m. A ground telluric survey was carried out near these reference boreholes, and the resulting electrical potential difference (EPD) measurements were used to categorize aquifer units as either confined or unconfined by comparing them with the lithological logs. Figure 12a,b, where blue indicates water, show groundwater accumulations at depths between 5 and 15 m, characterized by low EPD values of 0 to 0.3 mV (representing alluvium formation, including sand, clay, and silt) and 0.3 to 0.5 mV (representing semi-confined formations of clay and shale). A significant increase in the potential difference indicates the transition to the bedrock basement of the dolerite sill. These findings support the integrated approach of Abdul Jabbar Khan et al. [23] in the north-western part of Pakistan, who compared ground magnetotelluric survey results with nearby borehole logs.
This section details the analysis and interpretation of results from the survey conducted in the middle catchment area along reference boreholes G028418A, and G038447 (Figure 13a,b). The groundwater level of these two boreholes was measured to be 3.86 m and 4.77 m (Table 1). The two profile images reveal weathered vertical fractures at depths ranging from 20 m to 75 m between measurement points 12 and 22 (Figure 13a), and at depths from 10 m to 30 m between points 3 and 15 (Figure 13b). The positioning and dip of these fractures may indicate potential groundwater recharge zones and areas of preferential flow for groundwater–surface water interactions. The relatively low potential difference (<0.3 mV) suggests weathered and fractured zones composed of clay, shale, sandstone, or mudstone, which could be potential recharge or groundwater occurrence zones. Conversely, a high divergence in the EPD curve up to 0.5 mV at a depth between 20 m and 50 m indicates shallow compacted hard rock formations, like dry fractured sandstone, and 0.65 mV at a depth between 70 m and 100 m point to deep fractured dolerite formation (Figure 13a,b). These findings align with Gomo’s study, which indicated that higher electric potential differences are associated with electrically resistive formations like fresh dolerite and dry sandstone. Similarly, Oyegoke et al. [20] reported that deep vertical dark blue and light blue colors signify significant vertical fracturing. The results of this study are consistent with lithological data calibrations and water level elevations, suggesting that the primary aquifer consists of alluvial sediments at shallow depths and fractured, weathered gneiss at greater depths. According to Faleye et al. [40,41] aquifers connected to river channels are recharged by these faults or fractured systems.
Figure 14a,b present the results from the profile survey conducted in the upper catchment area along reference boreholes G028415B and G038269A, located near the municipal production boreholes that were actively pumping during the survey. Groundwater levels in these boreholes were recorded at 7.03 m and 9.86 m, respectively. The potential difference curve and profile image in Figure 14b reveal shallow aquifers at depths between 15 m and 45 m, with visible vertical fractures observed between points 18 and 21 and between points 23 and 24. Below 60 m, a fresh bedrock basement aquifer shows minimal groundwater recharge potential. Figure 14b displays a high divergence curve of up to 2.5 mV between depths of 10 m and 80 m, indicating a poor groundwater recharge zone. The profile image identifies weathered and fractured zones at isolated depths between points 1 and 10. Additionally, a deep vertical dolerite dyke with a high electric potential difference was noted at depths from 1 m to 100 m between points 11 and 17. These findings are consistent with those reported by Olagoke Victoria Oluwadamilola et al. [41], who used ground magnetotelluric methods to identify the most prolific aquifer unit in Obantoko, Odeda Local Government Area, Ogun State, Nigeria. The subsurface profile mapping using ground telluric methods revealed no groundwater accumulations below 50 m, reinforcing the presence of potential shallow groundwater suitable for borehole placement. Conversely, the lithological logs from the reference boreholes in this study provide a foundation for calibrating the hydrogeophysical results and confirm the heterogeneous nature of the subsurface layering in the study area. These findings align with those of Amos-Uhegbu et al. [42], which highlight the effectiveness of hydrogeophysical methods in delineating aquifer layers and improving the understanding of subsurface structures.
5. Conclusions
This study underscores the significance of employing hydrogeophysical techniques to delineate aquifers into confined and unconfined units, particularly in groundwater-dependent regions, to enhance groundwater allocation strategies and management practices. Integration of VES results with lithological data from boreholes validated the findings, revealing a three-to-four-layer medium across different sections of the catchment. In some areas, such as the upper catchment along VES 6 and profile line 10, upper unconfined aquifer layers were absent, indicating confined aquifers closer to the surface. Low-electrical resistivity structures were spatially distributed over approximately 36 km in the lower and middle catchment areas, suggesting significant groundwater potential conducive for groundwater recharge initiatives. The extent of high-electrical resistivity structures, marking the final investigation unit, was not fully estimated. The study identified the onset of geological dry bedrock comprising sandstone, siltstone, dolerite, and kimberlite formations, fractured into confined aquifers. The study did not investigate depths beyond this point, indicating a need for further research. Boreholes examined in the study intersected either unconfined aquifers of sand intercalated with semi-confined clay or confined aquifers composed of shale, sandstone, mudstone, siltstone, dolerite, and kimberlite. The results from passive ground telluric methods complemented those from vertical electric sounding, effectively delineating subsurface aquifer structures. Consistency between lithological logs from reference boreholes and geophysical profile results confirmed the distinct lithological formations. This study demonstrates that hydrogeophysical techniques, combined with lithological data analysis, yield valuable insights into interpreting electrical resistivity, profile maps, and electric potential difference values. The findings from this study therefore establish a foundation for estimating recharge in diverse aquifer systems, thereby enhancing water allocation strategies and groundwater management practices.
Author Contributions
Conceptualization, T.K. and H.P.; methodology, L.B.; software, I.M. and L.B.; validation, I.M., T.K. and H.P.; formal analysis, L.B.; investigation, L.B., T.K., H.P. and I.M.; resources, H.P., T.K. and I.M.; data curation, L.B., T.K., H.P. and I.M.; writing—original draft preparation, L.B.; writing—review and editing, L.B., T.K., H.P. and I.M.; visualization, L.B.; supervision, T.K. and H.P.; project administration, L.B.; funding acquisition, L.B. and T.K. All authors have read and agreed to the published version of the manuscript.
Funding
This research was funded by the National Department of Water and Sanitation, South Africa. The fieldwork was co-funded by the University of the Western Cape (UWC) and the Council for Scientific and Industrial Research (CSIR).
Data Availability Statement
The original contributions presented in the study are included in the article.
Acknowledgments
This paper forms part of the corresponding author’s Ph.D. studies currently underway. The author wishes to thank the following institutions: the National Department of Water and Sanitation, the University of the Western Cape, the Council for Scientific and Industrial Research, and the University of Namibia for their unwavering contributions. The authors acknowledge the contributions of the following individuals for their technical support and resources during field investigations: Madlala T., Makhetha J., Fenini P. and Xaza A. To the reviewers, the author is grateful for their valuable time and comments on this manuscript.
Conflicts of Interest
The authors declare no conflicts of interest.
References
- Woodford, A.C.; Sci, P.N.D.; Visser, P.; Sci, N. Geohydrological Assessment of De Aar’s Groundwater Resources Emthanjeni Municipality SRK Project Number 374624 SRK Consulting. The Administrative Building Albion Spring 183 Main Road Rondebosch 7700 South Africa Postnet Suite #206 Private Bag X18 Rondebosch 7701 South Africa. 2007. Available online: https://www.dws.gov.za/ghreport/reports/2.2(1655).pdf (accessed on 20 September 2022).
- Bennett, G.; Van Camp, M.; Shemsanga, C.; Kervyn, M.; Walraevens, K. Delineation of the aquifer structure and estimation of hydraulic properties on the flanks of Mount Meru, Northern Tanzania. J. Afr. Earth Sci. 2022, 196, 104673. [Google Scholar] [CrossRef]
- Yeh, H.F.; Cheng, Y.S.; Lin, H.I.; Lee, C.H. Mapping groundwater recharge potential zone using a GIS approach in Hualian River, Taiwan. Sustain. Environ. Res. 2016, 26, 33–43. [Google Scholar] [CrossRef]
- Araffa, S.A.S. Delineation of groundwater aquifer and subsurface structures on North Cairo, Egypt, using integrated interpretation of magnetic, gravity, geoelectrical and geochemical data. Geophys. J. Int. 2013, 192, 94–112. [Google Scholar] [CrossRef]
- Awad, S.; Araffa, S.; Pek, J. Delineating Groundwater Aquifer and Subsurface Structures Using Integrated Geophysical Interpretation at the Western Part of Gulf of Aqaba, Sinai, Egypt. Int. J. Water Resour. Arid Environ. 2014, 3, 51–62. [Google Scholar]
- Abdullahi, M.G. The Application of Vertical Electrical Sounding (VES) for Groundwater Exploration in Tudun Wada Kano State, Nigeria. J. Geol. Geosci. 2015, 4, 1. [Google Scholar] [CrossRef]
- Placide, U.; Kumar, G.R.S. Electrical Resistivity Data Interpretation for Groundwater Detection in Tittagudi Taluk of Cuddalore District, Tamil Nadu, India. 13 October 2015. Available online: http://www.ijret.org (accessed on 20 September 2022).
- Oyeyemi, K.D.; Aizebeokhai, A.P.; Metwaly, M.; Omobulejo, O.; Sanuade, O.A.; Okon, E.E. Assessing the suitable electrical resistivity arrays for characterization of basement aquifers using numerical modelling. Heliyon 2022, 8, e09427. [Google Scholar] [CrossRef]
- Loke, M.H.; Rucker, D.F.; Chambers, J.E.; Wilkinson, P.B.; Kuras, O. Electrical resistivity surveys and data interpretation. In Encyclopedia of Solid Earth Geophysics, 2nd ed.; Springer: Cham, Switzerland, 2020; Available online: https://ijret.org/volumes/2015v04/i10/IJRET20150410040.pdf (accessed on 20 September 2022).
- Tamunosiki, D. Aquifer Delineation and Characterization Using Geoelectric Method at Parts of Umuahia, Nigeria. Available online: https://www.researchgate.net/publication/327644912_Aquifer_Delineation_and_Characterization_using_Geoelectric_Method_at_Parts_of_Umuahia_Nigeria (accessed on 20 September 2022).
- Rangel, R.C.; Porsani, J.L.; Bortolozo, C.A.; Hamada, L.R. Electrical Resistivity Tomography and TDEM Applied to Hydrogeological Study in Taubaté Basin, Brazil. Int. J. Geosci. 2018, 9, 119–130. [Google Scholar] [CrossRef][Green Version]
- Mohamaden, M.I.I. Delineating groundwater aquifer and subsurface structures by using geoelectrical data: Case study (Dakhla Oasis, Egypt). NRIAG J. Astron. Geophys. 2016, 5, 247–253. [Google Scholar] [CrossRef][Green Version]
- Banerjee, K.S.; Sharma, S.P.; Sarangi, A.K.; Sengupta, D. Delineation of subsurface structures using resistivity, VLF and radiometric measurement around a U-tailings pond and its hydrogeological implication. Phys. Chem. Earth 2011, 36, 1345–1352. [Google Scholar] [CrossRef]
- Vegter, J.R. A geohydrological investigation at Caroluspoort, De Aar for South African Railways. Dept Water—Pretoria. 1961; [GH1145]. Available online: https://www.dws.gov.za/ghreport/Home/Result.aspx?Search=%20FORMSOF%20(INFLECTIONAL,%20gh1145) (accessed on 20 September 2022).
- Bairu, A. Application of Vertical Electrical Sounding and Horizontal Profiling Methods to Decipher the Existing Subsurface Stratification in River Segen Dam Site, Tigray, Northern Ethiopia. 2013. Volume 3. 16 May 2013. Available online: www.iiste.org (accessed on 20 September 2022).
- Adagunodo, T.A.; Sunmonu, L.A.; Adeniji, A.A.; Oladejo, O.P.; Alagbe, O.A. Geoelectric Delineation of Aquifer Pattern in Crystalline Bedrock. Open Trans. Geosci. 2015, 2015, 1–16. [Google Scholar] [CrossRef]
- Riwayat, A.I.; Ahmad Nazri, M.A.; Zainal Abidin, M.H. Application of Electrical Resistivity Method (ERM) in Groundwater Exploration. J. Phys. Conf. Ser. 2018, 995, 012094. [Google Scholar] [CrossRef]
- Niaz, A.; Khan, M.R.; Hameed, F.; Asghar, A.; Bangash, A.A.; Nisar, U.B.; Niaz, J.; Farooq, M.; Khan, M.Y.; Awan, M. Application of electrical resistivity method in delineating aquifer properties along with vulnerability mapping in Gujrat District and surrounding areas of Punjab province. J. Himal. Earth Sci. 2019, 52, 106–128. [Google Scholar]
- AL-Juboury, A.A.; Thabit, J.M.; AL-Menshed, F.H. Delineation the effect of saline groundwater on the resistivity of middle part of dammam formation southwest of samawah city, southern Iraq. Iraqi J. Sci. 2019, 60, 1095–1103. [Google Scholar] [CrossRef]
- Oyegoke, S.O.; Ayeni, O.O.; Olowe, K.O.; Adebanjo, A.S.; Fayomi, O.O. Effectiveness of geophysical assessment of boreholes drilled in basement complex terrain at Afe Babalola University, using Electromagnetic (E.M.) method. Niger. J. Technol. 2020, 39, 36–41. [Google Scholar] [CrossRef]
- Gomo, M. Use of electric potential difference in audio magnetotelluric (AMT) geophysics for groundwater exploration. Groundw. Sustain. Dev. 2023, 20, 100864. [Google Scholar] [CrossRef]
- Hassan, N.A.; Gathenya, J.M.; Raude, J.M. Estimating Groundwater Recharge Rates and Identifying Groundwater Recharge Zones in Kakia and Esamburbur Sub-Catchment Narok, Kenya. J. Sustain. Res. Eng. 2020, 7, 31–45. [Google Scholar]
- Khan, A.J.; Mustafa, F.U.; Gabriel, H.F.; Khan, H.U.; Haider, W.; Abbas, H.; Shahid, M. An Integrated Geo-Physical Approach for Groundwater Investigation in Northwestern Part of Pakistan. Eur. J. Mol. Clin. Med. 2020, 7, 2020. [Google Scholar]
- Sami, K.; Hughes, D.A. A comparison of recharge estimates to a fractured sedimentary aquifer in South Africa from a chloride mass balance and an integrated surface-subsurface model. J. Hydrol. 1996, 179, 111–136. [Google Scholar] [CrossRef]
- Matome, F.; Sekiba, A. Application of geophysical techniques in the delineation of aquifer systems in the Beaufort West area, Western Karoo, South Africa. 2019. Available online: https://scholar.ufs.ac.za/bitstreams/ef01e38c-8bb7-450e-a254-8a9b7ba72c7e/download (accessed on 20 September 2022).
- Vegter, J.R. Groundwater Supply: A Digest of the Past and an Outlook for the Future. Department Water Affairs, Pretoria. GH3775. De Aar 1992. 1992. Available online: https://www.dws.gov.za/ghreport/Home/Result.aspx?Search=%20FORMSOF%20(INFLECTIONAL,%20gh3775) (accessed on 20 September 2022).
- Woodford, A.C. Development and Management of Available Groundwater Resources. Deptment of Water Affairs, Pretoria. GH3837. De Aar 1993. 1993. Available online: https://www.dws.gov.za/ghreport/Home/Result.aspx?Search=%20FORMSOF%20(INFLECTIONAL,%20gh3837) (accessed on 20 September 2022).
- Parsons, R.P. An Assessment of Hydrochemical Changes of Groundwater around De Aar. Deptment of Water Affairs, Pretoria GH3628. De Aar 1989. 1989. Available online: https://www.dws.gov.za/ghreport/Home/Result.aspx?Search=%20FORMSOF%20(INFLECTIONAL,%20gh3628) (accessed on 20 September 2022).
- Parwatiningtyas, D.; Sjamsuri, A. Application Of Resistivity Method Wenner Configuration For Determining Aquifer Position At Pasir Impun Area, Bandung, West Java. 2015. Available online: https://isomase.org/OMAse/Vol.2-2015/Section-2/2-8.pdf (accessed on 20 September 2022).
- Adeyemo, I.A.; Ojo, B.T.; Raheem, W.O. Comparison of Thickness and Depth Resolution Power of Wenner and Schlumberger Arrays: A Case Study of Temidire Quarters, Akure, Nigeria. J. Geosci. Environ. Prot. 2017, 5, 233–239. [Google Scholar] [CrossRef]
- Shevnin, V.; Delgado Rodríguez, O.; Mousatov, A.; Flores Hernández, D.; Zegarra Martínez, H.; Ryjov, A. Estimation of soil petrophysical parameters from resistivity data: Application to oil-contaminated site characterization. Geofísica Int. 2006, 45, 179–193. [Google Scholar] [CrossRef]
- Ikhane, P.R.; Omosanya, K.O.; Akinmosin, A.A.; Odugbesan, A.B. Electrical Resistivity Imaging (ERI) of Slope Deposits and Structures in Some Parts of Eastern Dahomey Basin. J. Appl. Sci. 2012, 12, 716–726. [Google Scholar] [CrossRef]
- Chikabvumbwa, S.R.; Sibale, D.; Marne, R.; Chisale, S.W.; Chisanu, L. Geophysical investigation of dambo groundwater reserves as sustainable irrigation water sources: Case of Linthipe sub-basin. Heliyon 2021, 7, e08346. [Google Scholar] [CrossRef] [PubMed]
- Omosanya, K. A Review of Stratigraphic Surfaces Generated from Multiple Electrical Sounding and Profiling. 2014. Available online: https://www.researchgate.net/publication/267269883 (accessed on 20 September 2022).
- Mosuro, G.O.; Omosanya, K.O.; Bayewu, O.O.; Oloruntola, M.O.; Laniyan, T.A.; Atobi, O.; Okubena, M.; Popoola, E. Assessment of groundwater vulnerability to leachate infiltration using electrical resistivity method. Appl. Water Sci. 2017, 7, 2195–2207. [Google Scholar] [CrossRef]
- Raji, W.O.; Ayolabi, E.A.; Aluko, K.; Raji, W.; Ayolabi, E. Application of 2-D Resistivity Survey to Groundwater Aquifer Delineation in a Sedimentary Terrain: Integration of Borehole Logs and 2D Electrical Resistivity Imaging in the Investigation of Saltwater Intrusion in Lagos Island, Southwestern Nigeria. View project Application of 2-D Resistivity Survey to Groundwater Aquifer Delineation in a Sedimentary Terrain: A Case Study of South-Western Nigeria. 2017. Available online: https://www.researchgate.net/publication/325091526 (accessed on 20 September 2022).
- Saibi, H.; Khosravi, S.; Cherkose, B.A.; Smirnov, M.; Kebede, Y.; Fowler, A.R. Magnetotelluric data analysis using 2D inversion: A case study from Al-Mubazzarah Geothermal Area (AMGA), Al-Ain, United Arab Emirates. Heliyon 2021, 7, e07440. [Google Scholar] [CrossRef] [PubMed]
- Isah, A.G.; Akinbiyi, O.A.; Ugwoke, J.L.; Ayajuru, N.C.; Oyelola, R.O. Detection of groundwater level and heavy metal contamination: A case study of Olubunku dumpsite and environs, Ede North, Southwestern Nigeria. J. Afr. Earth Sci. 2023, 197, 104740. [Google Scholar] [CrossRef]
- Nazifi, H.M.; Lambon, S.B. Geophysical Mapping of Groundwater Aquifers Beneath the Central Region of Ghana. J. Int. Environ. Appl. Sci. 2021, 16, 113–122. [Google Scholar]
- Adagunodo, T.A.; Ojoawo, A.I.; Anie, N.O.; Edukugho, P.O. Application of frequency selection and geoelectrical sounding methods for mapping of leachate’s pathways in an active dumpsite. SN Appl. Sci. 2023, 5, 352. [Google Scholar] [CrossRef]
- Oluwadamilola, O.V.; Abimbola, A.A.; Hassan Tolulope, B.; Rebecca, V.O. A Heuristic Evaluation of the State of Groundwater Using Electromagnetic Method. In Proceedings of the 2022 5th Information Technology for Education and Development (ITED), Abuja, Nigeria, 1–3 November 2022; IEEE: Piscataway, NJ, USA, 2022; pp. 1–7. [Google Scholar] [CrossRef]
- Amos-Uhegbu, C.; Igboekwe, M.U.; Chukwu, G.U.; Okengwu, K.O.; Eke, T.K. Hydrogeophysical Delineation and Hydrogeochemical Characterization of the Aquifer Systems in Umuahia-South Area, Southern Nigeria. 2012. [Online]. 24 January 2023. Available online: https://doi.org/10.9734/BJAST/2012/1645 (accessed on 20 September 2022).
Disclaimer/Publisher’s Note: The statements, opinions and data contained in all publications are solely those of the individual author(s) and contributor(s) and not of MDPI and/or the editor(s). MDPI and/or the editor(s) disclaim responsibility for any injury to people or property resulting from any ideas, methods, instructions or products referred to in the content. |
© 2024 by the authors. Licensee MDPI, Basel, Switzerland. This article is an open access article distributed under the terms and conditions of the Creative Commons Attribution (CC BY) license (https://creativecommons.org/licenses/by/4.0/).