Article

Impact of Land Use/Cover Change on Soil Erosion and Future Simulations in Hainan Island, China

1
Hainan Province Water Conservancy & Hydropower Survey, Design & Research Institute Co., Ltd., Haikou 571100, China
2
School of Soil and Water Conservation, Beijing Forestry University, Beijing 100083, China
*
Authors to whom correspondence should be addressed.
Water 2024, 16(18), 2654; https://doi.org/10.3390/w16182654
Submission received: 22 August 2024 / Revised: 16 September 2024 / Accepted: 17 September 2024 / Published: 18 September 2024
(This article belongs to the Section Water Erosion and Sediment Transport)

Abstract

:
Soil erosion (SE) is a critical threat to the sustainable development of ecosystem stability, agricultural productivity, and human society in the context of global environmental and climate change. Particularly in tropical island regions, due to the expansion of human activities and land use/cover changes (LUCCs), the risk of SE has been exacerbated. Combining the RUSLE with machine learning methods, SE spatial patterns, their driving forces and the mechanisms of how LUCCs affect SE, were illustrated. Additionally, the potential impacts of future LUCCs on SE were simulated by using the PLUS model. The main results are as follows: (1) Due to LUCCs, the average soil erosion modulus (SEM) decreased significantly from 108.09 t/(km2·a) in 2000 to 106.75 t/(km2·a) in 2020, a reduction of 1.34 t/(km2·a), mainly due to the transformation of cropland to forest and urban land. (2) The dominant factor affecting the spatial pattern of SE is the LS factor (with relative contributions of 43.9% and 45.17%), followed by land use/cover (LUC) (the relative contribution is 28.46% and 34.89%) in 2000 and 2020, respectively. (3) Three kinds of future scenarios simulation results indicate that the average SEM will decrease by 2.40 t/(km2·a) under the natural development scenario and by 1.86 t/(km2·a) under the ecological protection scenario by 2060. However, under the cropland protection scenario, there is a slight increase in SEM, with an increase of 0.08 t/(km2·a). Sloping cropland erosion control remains a primary issue for Hainan Island in the future.

1. Introduction

Soil erosion (SE) is one of the most significant and widespread ecological issues in global environmental change. It not only directly leads to land degradation and loss of fertility but also significantly affects ecosystem stability and productivity [1,2]. Each year, SE results in agricultural losses worth billions of dollars worldwide, degrading large areas of cropland and posing a serious threat to global food security [3,4,5]. As an essential component of carbon storage, SE exacerbates global climate change; the loss of topsoil and its organic carbon reduces soil carbon stock, thereby impacting the global carbon cycle [6,7,8]. The cumulative effects of soil degradation threaten both ecological balance and socioeconomic development, particularly the sustainable development of agriculture-dependent economies [9,10].
Globally, tropical regions, especially tropical islands, are particularly vulnerable to SE due to their unique ecological environments and geographical characteristics. Tropical islands often possess complex and diverse ecosystems, but they also face intense rainfall, steep topography, and frequent natural disasters, which together exacerbate SE risk [11,12]. Moreover, global climate change has further amplified the ecological pressures in these regions, with the increased frequency of extreme weather events significantly expanding the intensity and scope of SE [13]. At the same time, the intensification of human activities, such as agricultural expansion, urbanization, and infrastructure development, has significantly altered land use/cover (LUC) patterns in these regions, further exacerbating SE severity [14,15]. Therefore, understanding and addressing SE issues in tropical islands is crucial for maintaining the stability of their fragile ecosystems.
Land use/cover change (LUCC) is one of the key driving factors of SE, and human activities are the primary forces behind these changes [16]. Globally, agricultural expansion, urbanization, and infrastructure development are the most common drivers of LUCCs. These activities significantly alter the original LUC patterns, directly impacting the SE process. For example, agricultural expansion occurs as the population grows and food demand increases, and agricultural land continues to expand. This often involves large-scale deforestation and the conversion of grasslands into cropland, exposing previously protected soil to rainfall and wind erosion [17,18]. Additionally, modern agricultural practices, such as deep plowing and the use of heavy machinery, further disturb soil structures, reducing their stability and increasing erosion risk. Moreover, the rapid process of urbanization is accompanied by extensive construction activities, including the development of roads, residential areas, and industrial zones [19,20,21]. These activities typically remove vegetation cover, increase impervious surface area, and alter natural surface hydrological processes, which can lead to changes in SE patterns. Overall, LUCCs directly influence the risk and intensity of SE by altering surface cover, topographical conditions, and hydrological processes [22,23]. With the rapid development of remote sensing technology and Geographic Information Systems (GISs), researchers are able to monitor LUCCs and their impact on SE with high accuracy and efficiency. Remote sensing technology, through satellite imagery, provides large-scale, continuous spatiotemporal LUC information, enabling researchers to track and analyze the dynamic processes of land use change in real time. GIS technology offers powerful spatial analysis capabilities, integrating multiple spatial datasets to conduct quantitative analyses and simulations of SE. The combination of these technologies not only enhances the understanding of SE processes but also provides reliable support for land managers to formulate scientifically sound soil conservation strategies [24]. These advanced technological tools have greatly advanced the monitoring and research of SE.
Significant progress has been made in SE research over the past few decades, with various models and methods widely applied in SE assessments across different regions [25,26]. The RUSLE model is among the most commonly applied models. The RUSLE model provides an effective method for estimating SE based on factors such as rainfall, vegetation cover, and management practices, and it has been widely used in SE studies across different scales and geographic regions [27]. Despite this progress, notable research gaps and challenges remain in SE assessment. Most studies have concentrated on the direct effects of rainfall and vegetation cover on SE. Some studies suggest that rainfall is the primary driving force behind SE, with its intensity, frequency, and duration determining erosion severity [28]. Research indicates that intense rainfall events can significantly exacerbate topsoil loss, while prolonged rainfall may lead to more widespread erosion issues. At the same time, vegetation cover plays an indispensable role in mitigating SE [29]. Vegetation effectively reduces SE risk by decreasing surface runoff, increasing soil permeability, and stabilizing soil with root systems [30]. Therefore, the interaction between rainfall and vegetation cover has become a central theme in SE research. Despite the widely recognized importance of vegetation cover and rainfall in controlling SE, research on the long-term impacts of LUCCs on SE remains relatively limited. LUCCs, particularly those driven by human activities, such as cropland expansion, urbanization, and deforestation, may have more complex and profound impacts on SE than rainfall and vegetation cover alone [24]. LUCCs not only alter vegetation cover types and surface conditions but may also trigger a series of complex chain reactions, such as changes in topography and hydrological processes, which can either exacerbate or mitigate SE. Current research seldom provides a comprehensive examination of how LUCCs influence the dynamic processes of SE. Moreover, most studies focus on specific regions or time periods and lack comprehensive assessments of future LUCC scenarios. With the intensification of human activities, future LUC patterns are likely to undergo significant changes, which will have profound implications for SE risk. Additionally, most studies focus on specific regions or the analysis of historical data and lack systematic research on potential future LUCCs and their impact on SE. Future LUC patterns are likely to undergo significant changes, with profound implications for SE risk.
In light of the above context, this study focuses on Hainan Island, aiming to systematically evaluate the impact of LUCCs on SE by coupling the RUSLE and PLUS models, and predict the effects of future LUCCs on SE under different scenarios. The study seeks to comprehensively reflect the extent and processes of the impact of LUCCs on SE, providing a basis for informed ecological protection and restoration measures.

2. Study Area

Hainan Island spans an area of 34,000 km2 (Figure 1). The island has a complex topography, with its highest point at Wuzhi Mountain in the center (elevation 1795 m), gradually transitioning outward into mountains, hills, terraces, plains, and beaches. The varied terrain is a major contributing factor to SE. Hainan Island’s average annual temperature ranges between 23 and 26 °C, with abundant rainfall averaging around 2000 mm per year. Most of the precipitation occurs during the rainy season, from May to October, contributing over 80% of the annual total. The island’s primary soil types include red soil, lateritic red soil, sandy soil, and alluvial soil. Red and lateritic red soils are primarily found in hilly and mountainous areas, while sandy soils are mostly found in coastal regions. According to 2020 statistics, Hainan Island has a forest coverage rate of over 60%, with tropical rainforests predominantly distributed in the central mountainous areas. These forests are crucial not only for reducing soil erosion but also for maintaining ecosystem stability. However, since the construction of the Hainan Free Trade Port in 2010, the island’s urbanization has accelerated significantly, leading to substantial changes in LUC patterns. Large-scale infrastructure development and agricultural expansion have gradually transformed the original forests and grasslands into croplands, construction sites, and other developed land, further increasing the risk of soil erosion. Overall, Hainan Island’s unique geography, climate, soil, and geological conditions, coupled with rapidly changing LUC patterns, have made the problem of SE particularly acute.

3. Data Sources and Methods

3.1. Data Sources

The LUC data were obtained from the Resource and Environment Data Center, with a spatial resolution of 30 m. To analyze the driving forces behind the spatial pattern of SE, the study selected factors in Table 1. All data were standardized to a 30 m spatial resolution using the ArcGIS software (Version 10.2 (2013), Environmental Systems Research Institute, Redlands, CA, USA, https://www.esri.com, accessed on 10 May 2023).

3.2. Methods

3.2.1. RUSLE Model

The soil erosion modulus (SEM) was determined using the RUSLE model, expressed as follows [32,33]:
A = R × K × LS × C × P
where A represents the SEM, t/(hm2·a); R is the rainfall erosivity factor, MJ·mm/(hm2·h·a), and in this study, R is the average value from 2000 to 2020; K is the soil erodibility factor, t·hm2·h/hm2·MJ·mm; LS is the slope length and steepness factor; C is the cover management factor; and P is the support practice factor. The calculation formulas for R, K, and LS are based on the study conducted by Lai et al. [34]. The C and P factors are assigned based on previous studies on Hainan Province, combined with the actual LUC (Table 2) [35,36].

3.2.2. Extreme Gradient Boosting (XGBoost)

XGBoost is an optimized algorithm based on gradient-boosting decision trees, known for its efficient parallel computing capabilities and strong performance in handling structured data [37]. In this study, the features listed in Table 1 were selected for model training, as these variables are considered to have a significant impact on SEM. The model construction process is as follows: (1) Model initialization: XGBoost’s default parameters were used as the initial settings, with gradual adjustments made to improve model performance. (2) Hyperparameter tuning: A combination of random search and cross-validation was employed to optimize the model’s hyperparameters, with particular attention to tree depth, learning rate, and the number of trees. (3) Model training: The XGBoost model was trained on the training set, and cross-validation was used to assess the model’s generalization performance, preventing overfitting. (4) The model’s predictive accuracy was evaluated on the test set, with performance assessed using the coefficient of determination (R2), root mean square error (RMSE), and mean absolute error (MAE). This process was conducted using R 4.3 [38,39,40].

3.2.3. SHapley Additive exPlanations (SHAP)

To better understand the predictive results of the XGBoost model, we used SHAP values to explain the contribution of each feature to the model’s output [41]. This process involved three main parts: (1) SHAP value calculation: SHAP values were calculated for each sample using the trained XGBoost model. These values represent the marginal contribution of each feature to the final prediction. (2) Feature importance interpretation: Feature importance plots were generated using SHAP values to display the overall importance of each feature. Additionally, SHAP values were used for local interpretation to analyze the prediction results of individual samples. (3) Model visualization: SHAP visualization tools, such as the summary plot and dependence plot, were employed to further explore the model’s predictive logic and feature interaction effects. This process was also carried out in R 4.3 [42,43].

3.2.4. PLUS Model

The PLUS model is an advanced LUC simulation framework that builds upon the FLUS model. It integrates two key modules: the Land Expansion Analysis Strategy (LEAS) and the Cellular Automata based on Multiple Random Seeds (CARS). The main calculation process of the PLUS model can be summarized as follows [44,45]:
  • LEAS: LEAS is designed to streamline the analysis of multiclass LUCCs by avoiding complex calculations while still effectively examining the mechanisms driving these changes over specific periods. Utilizing LUC from 2010 and 2020, along with insights from previous studies, nine driving factors, encompassing both natural and human activities, were selected to investigate the relationships between land class expansion and various drivers. Through this analysis, LEAS calculates the development probabilities for each land class, providing a nuanced understanding of how different factors contribute to LUCCs. This approach allows for a more efficient and insightful exploration of the dynamics governing LUC transitions [34].
  • CARS: In the CARS module, using 2000 as the baseline LUC data, the expansion area ratios of each land class from 2000 to 2020 serve as the neighborhood weights for simulating 2020 LUC data. Accuracy was verified against actual 2020 LUC data, with an overall accuracy of 93.16%, indicating good LUC outcomes with the PLUS model.
  • Scenario settings: Based on the conditions of Hainan Island, this study established three scenarios [34]: natural development (NDS), cropland protection (CPS), and ecological protection (EPS). LUCCs from 2000 to 2020 were used as the baseline. LUC demand was predicted using a Markov chain, and transition probabilities were obtained. NDS: This scenario continues the LUCCs observed from 2000 to 2020, without considering human intervention. EPS: In this scenario, the probability of converting woodland and grassland to construction land is reduced by 50%, the probability of converting cropland to construction land is reduced by 30%, and the probability of converting cropland and grassland to woodland is increased by 30%. CPS: This scenario reduces the probability of converting cropland to construction land by 70% [46].

4. Results and Analysis

4.1. Spatiotemporal Characteristics of LUCCs

4.1.1. Spatial Pattern of LUC

From 2000 to 2020, woodland, as the predominant LUC, was concentrated in the central part (Figure 2). Although the proportion of woodland decreased over the years, it remained above 62%. The proportion of cropland was above 25%, mainly concentrated in the coastal plain areas and the low-altitude mountainous regions in the northeast. Grassland accounted for approximately 3.20%, primarily scattered across the central part of the study area, with poor overall connectivity. The proportion of waters increased from 3.74% in 2000 to 4.31% in 2020, with these areas mainly located in Dongfang, Danzhou, and Wanning. Construction land significantly expanded during this period, with its proportion increasing from 2.28% in 2000 to 4.38% in 2020, nearly doubling. This expansion was mainly concentrated in the economic zones of Haikou and Sanya, reflecting the impact of economic development on LUCCs. The proportion of unused land was low, with scattered distribution in coastal areas.

4.1.2. LUCC Trajectorie

From 2000 to 2020, significant LUCCs occurred on Hainan Island, primarily characterized by substantial reductions in ecological and productive lands, and the expansion of construction land (Figure 3). During these 20 years, the area of cropland decreased by 725.45 km2, mainly converted into woodland and construction land, amounting to 255.23 km2 and 334.24 km2, respectively. Woodland decreased by 790.34 km2, primarily converted into cropland and construction land, accounting for 271.47 km2 and 340.14 km2, respectively. The most significant increase was seen in construction land, expanding from 779.83 km2 in 2000 to 1417.85 km2 in 2020, nearly doubling. This growth was primarily due to urban expansion, especially in coastal areas such as Haikou, Sanya, and Danzhou, where the economy has developed rapidly. Additionally, there was frequent conversion between woodland and cropland, mainly scattered across the central part of the island. This was due to the effects of forestry ecological projects and population growth driving agricultural expansion.

4.2. Correlation between LUCCs and SE

4.2.1. Spatiotemporal Changes in SEM

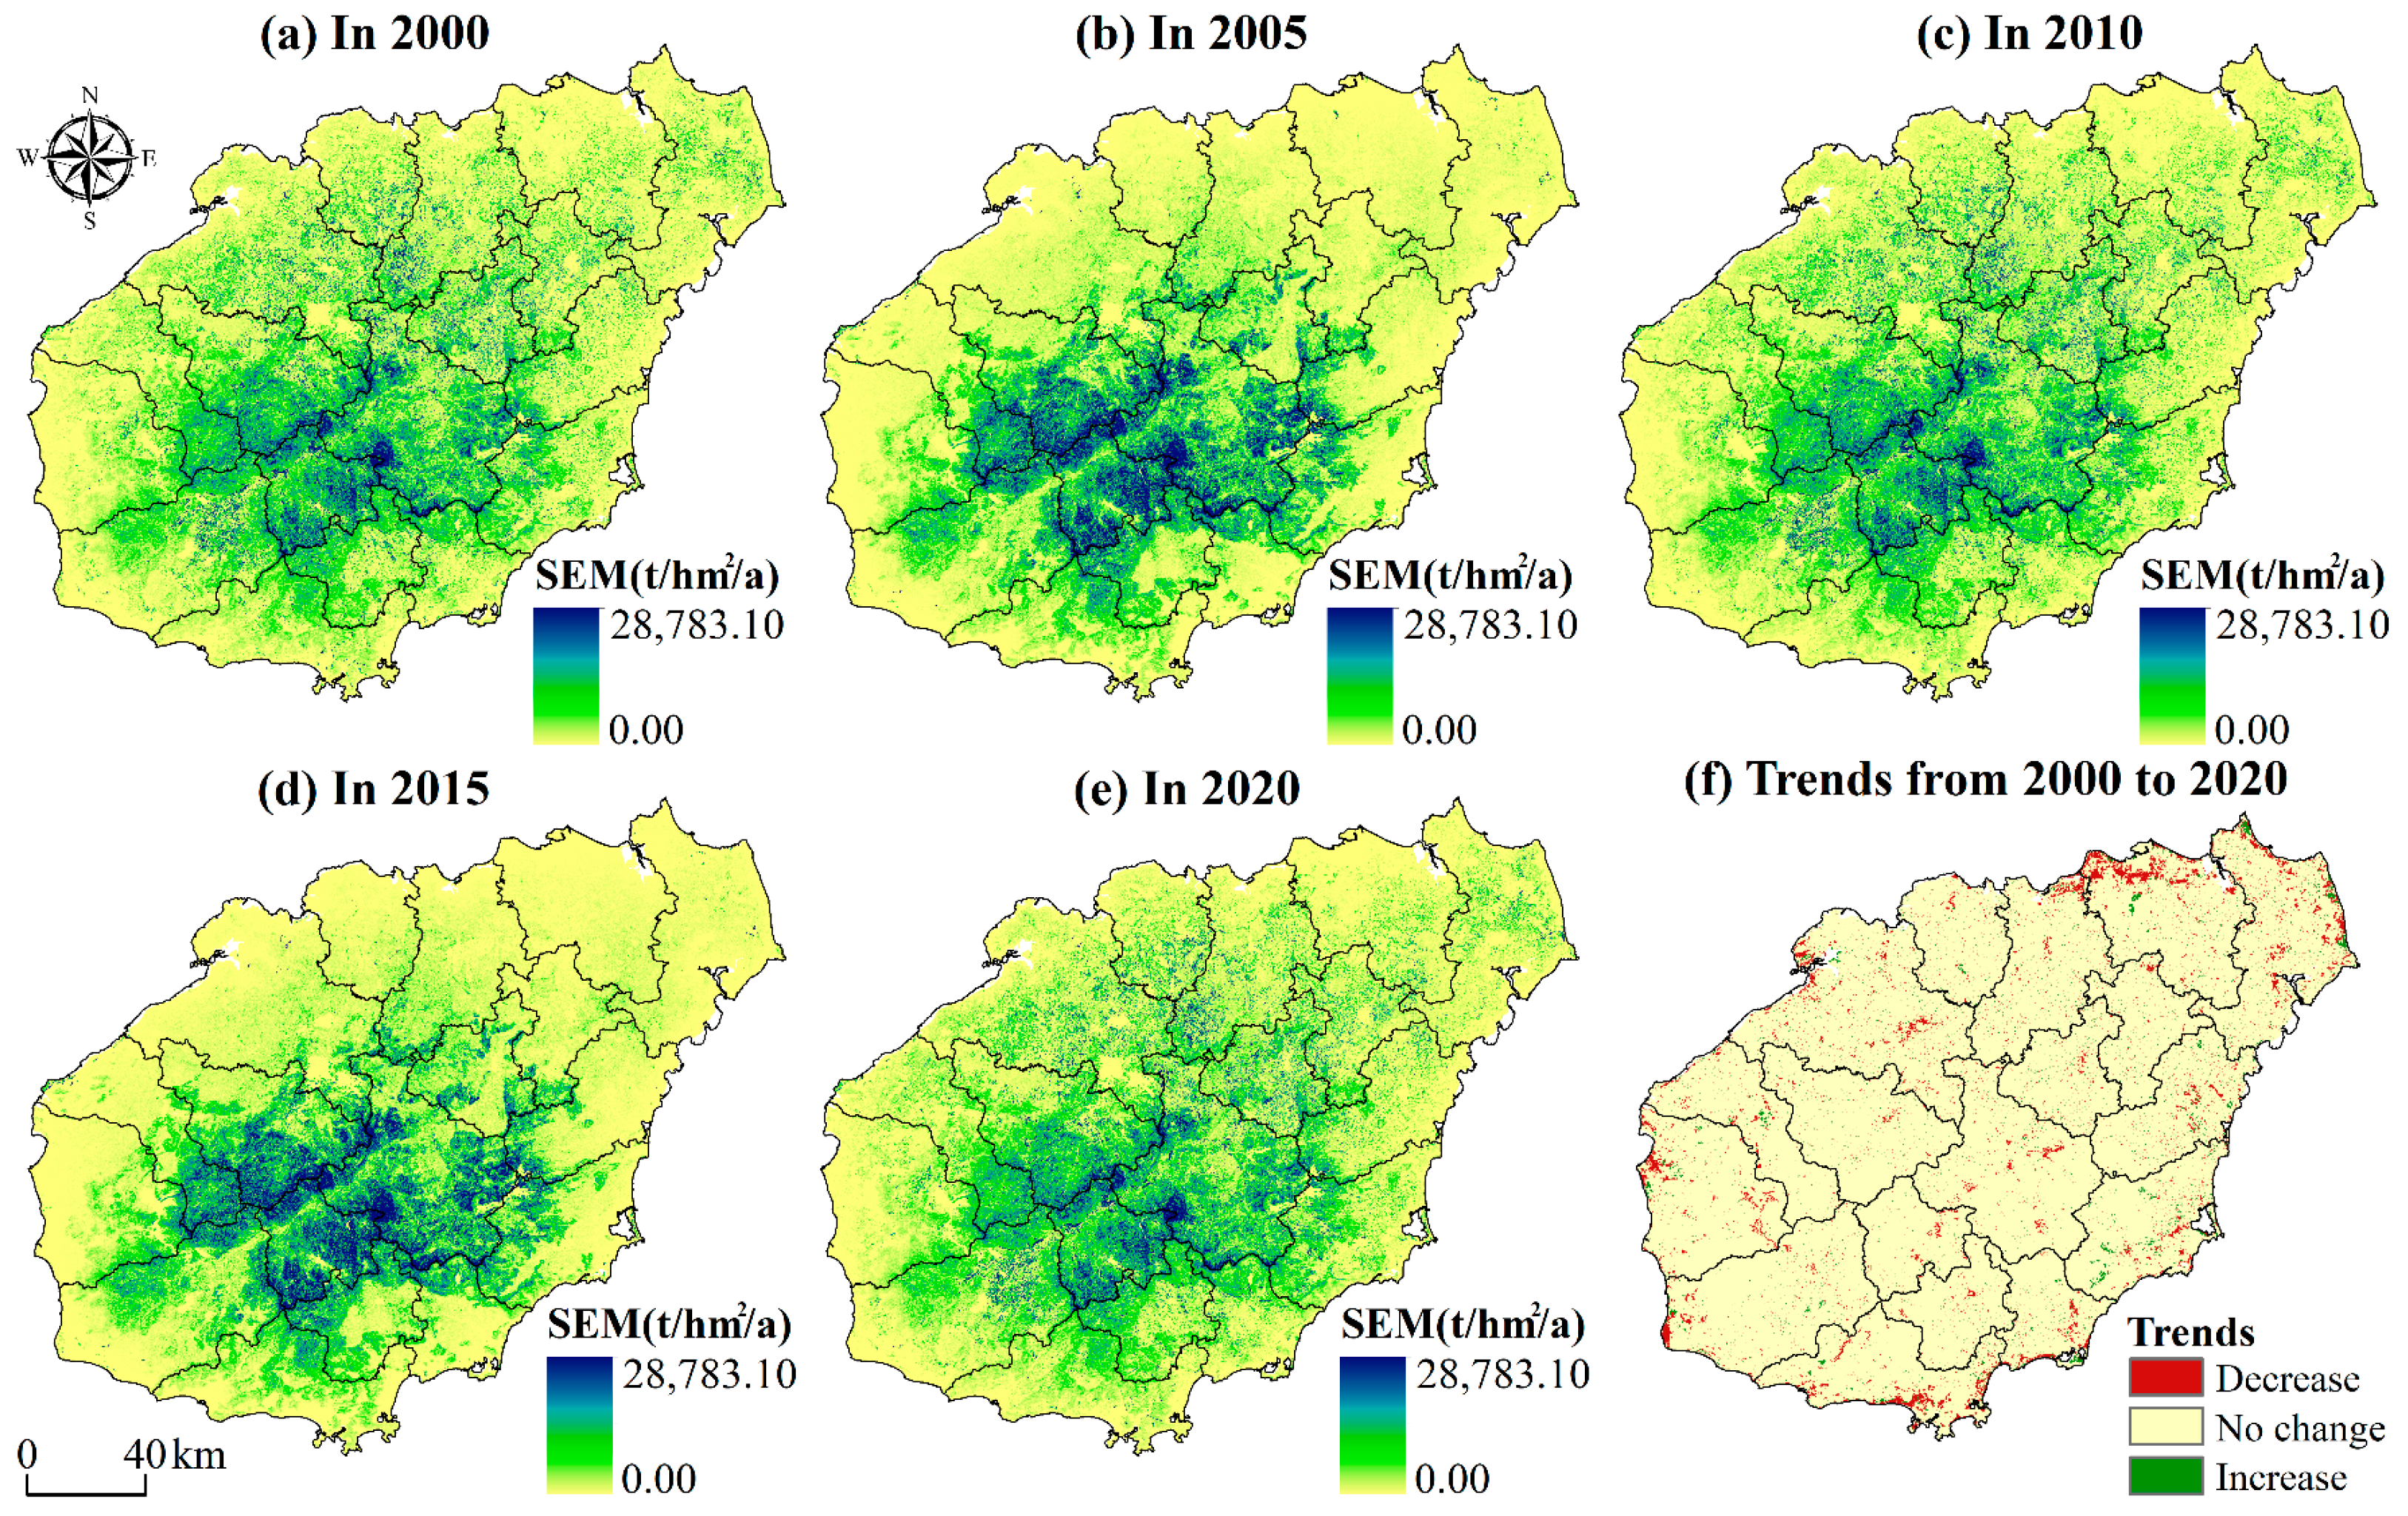
During the period from 2000 to 2020, the spatial distribution of SEM in Hainan Island remained relatively consistent, with a clear distinction between low-value and high-value areas (Figure 4). Low-value areas were mainly located in coastal plains, while high-value areas clustered in the central mountains. In terms of temporal changes, the SEM showed a decreasing trend, with the average SEM declining from 108.09 t/(km2·a) in 2000 to 106.75 t/(km2·a) in 2020, a reduction of 1.34 t/(km2·a). This downward trend reflects the success of soil conservation and land use management efforts in Hainan Island. Spatially, the decrease in SEM was primarily observed in areas where woodland and cropland were converted to construction land. This change is mainly attributed to the surface hardening effect during urbanization, which reduced soil exposure to rainfall and runoff, thereby decreasing the likelihood of SE.

4.2.2. Impact of LUCCs on Soil Lost (SL)

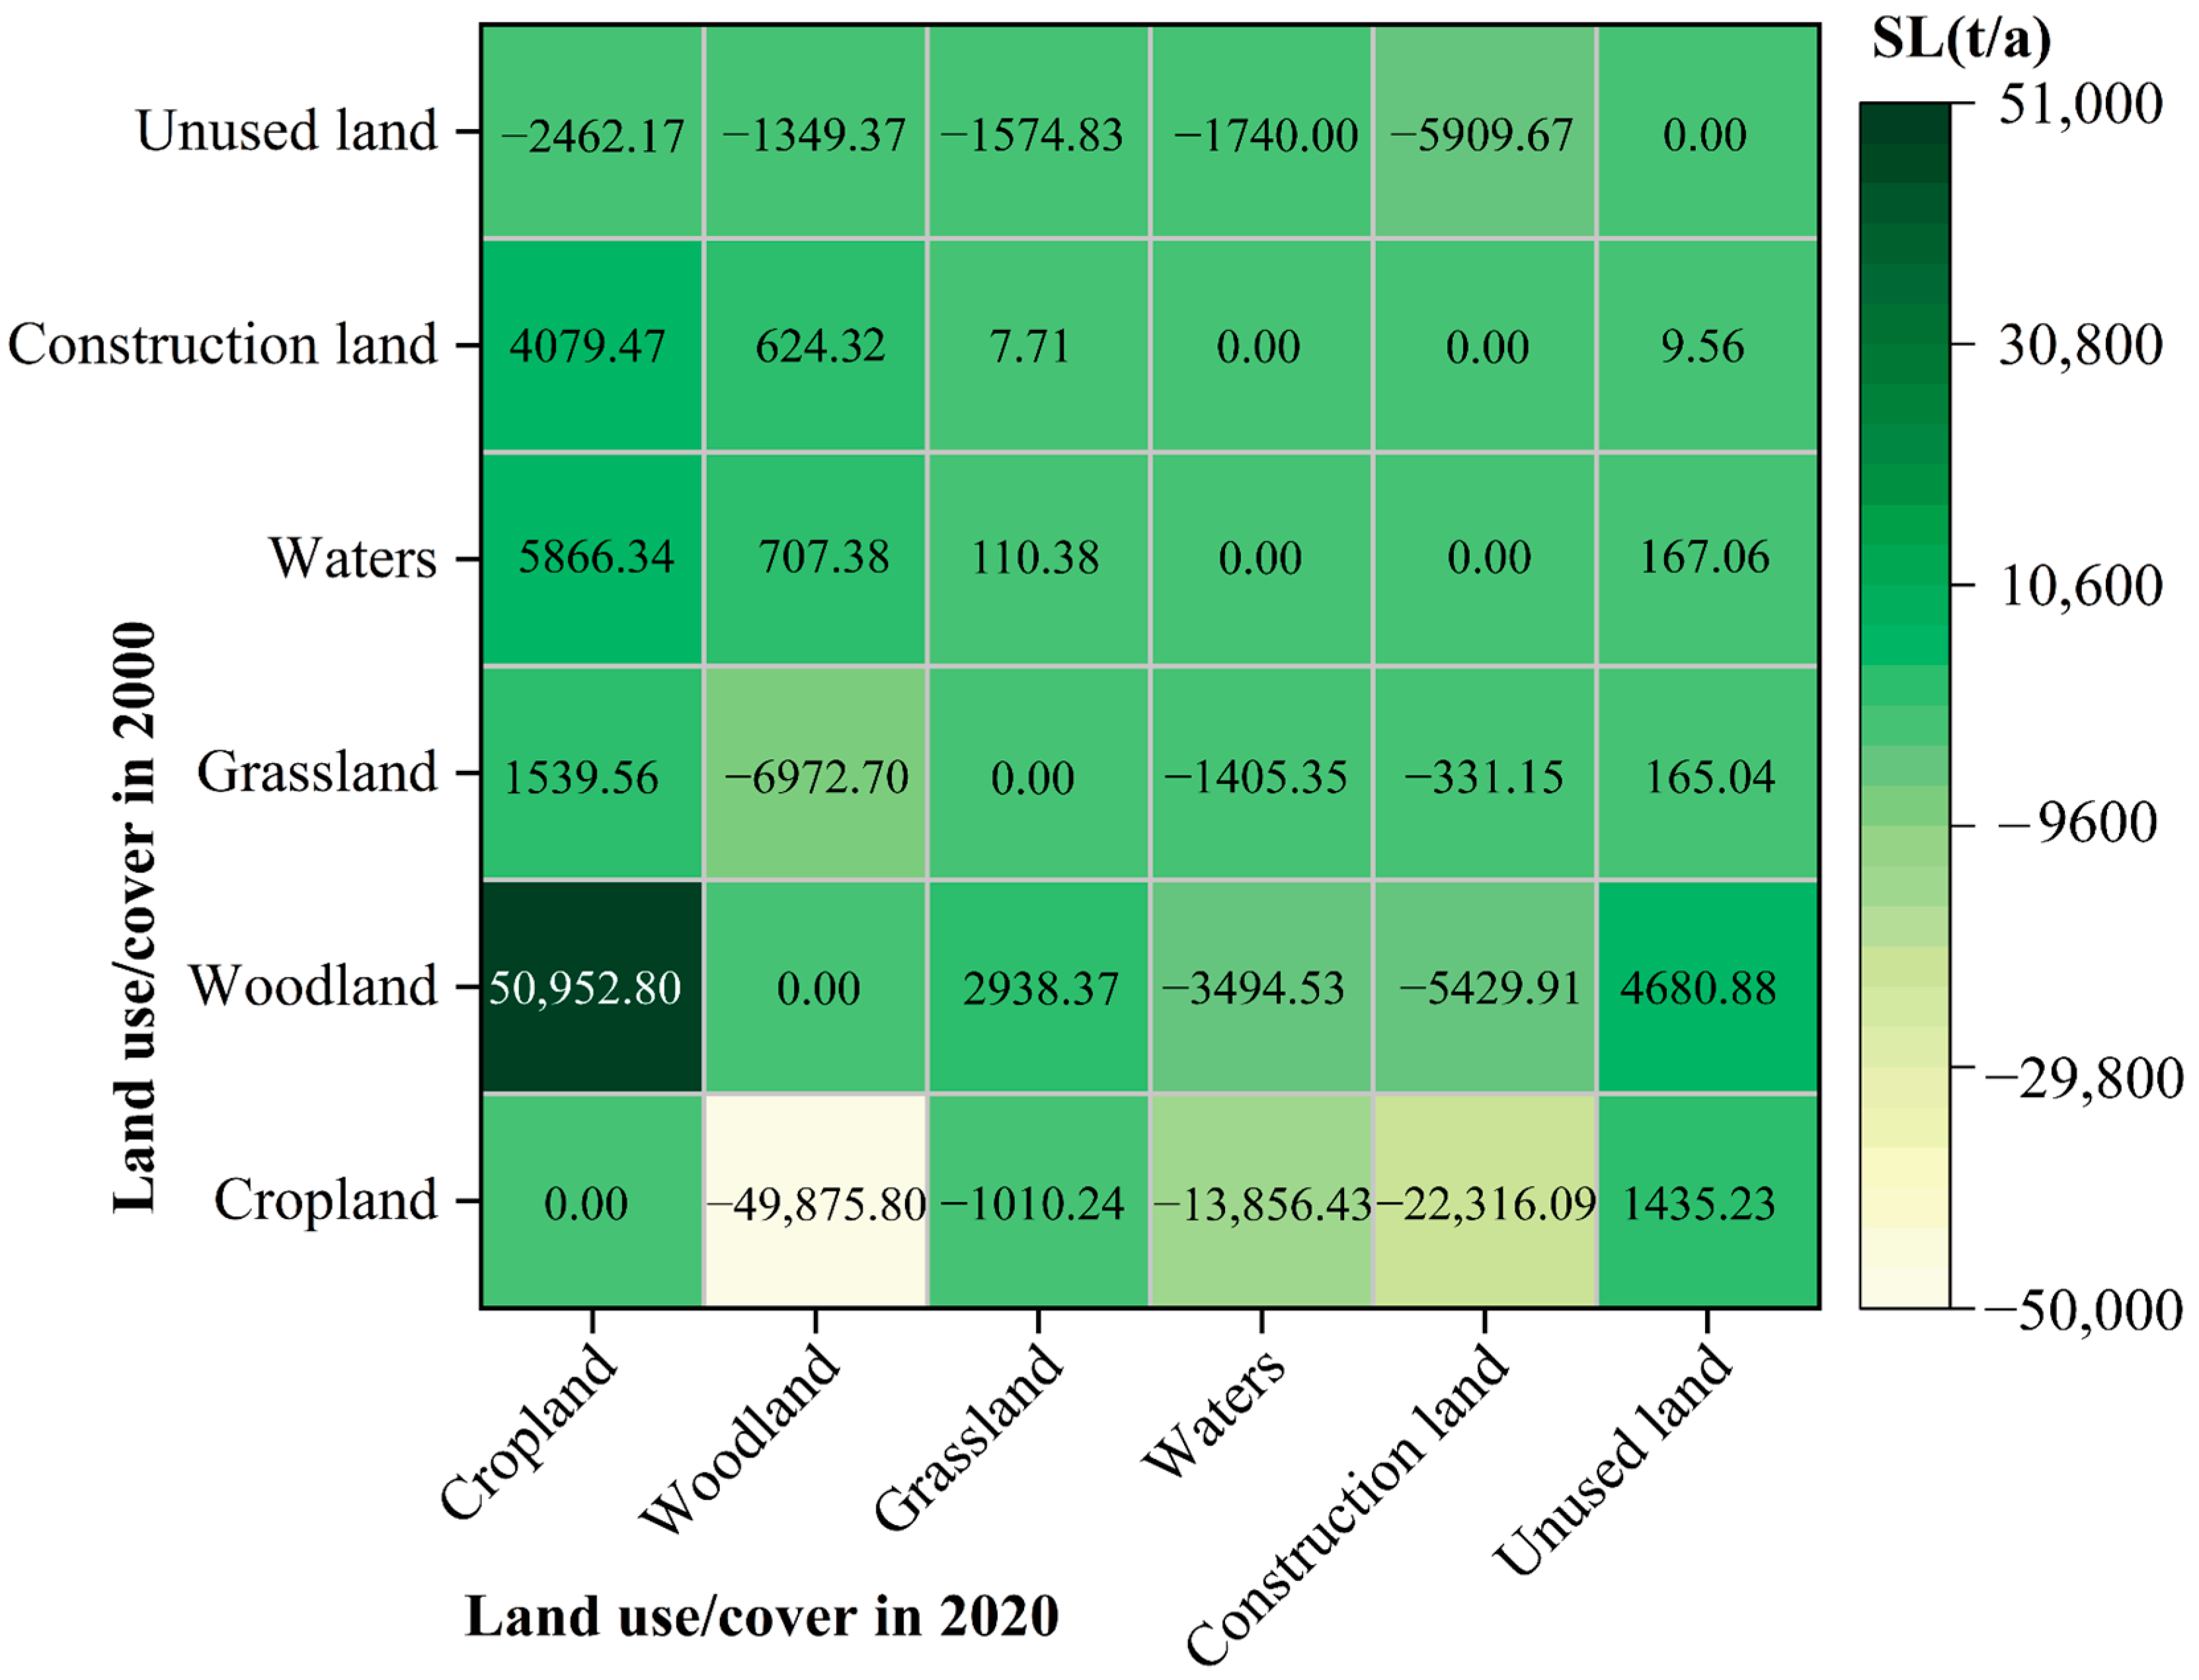
SL caused by LUCCs is shown in Figure 5. Overall, SL on Hainan Island decreased by 44,444.12 t/a due to LUC transitions. The most significant change in SL was caused by transitions in cropland, which decreased by 85,623.33 t/a when cropland was converted to other LUC. Of this, transformations from cropland to woodland and construction land reduced SL by 49,875.80 t/a and 22,316.09 t/a, respectively. This indicates the important role of woodland and construction land in reducing SL, particularly in controlling erosion from cropland. Conversely, transformations from other LUC to cropland resulted in an increase in SL of 59,976.01 t/a, with the conversion from woodland to cropland contributing the most to this increase, at 50,952.80 t/a. This reflects the high sensitivity of cropland to SE, with transformations to cropland significantly increasing SL. Additionally, the increase in water bodies has significantly contributed to the reduction in SL, with transformations from other LUC to waters reducing SL by 20,496.31 t/a. This indicates that the expansion of water bodies plays a positive role in mitigating SL, particularly by reducing the area of exposed surface and runoff erosion.

4.3. Driving Forces of Spatial Heterogeneity in SEM

4.3.1. SHAP Interpretability Analysis

The SEM and feature datasets in 2000 and 2020 were divided into 80% for training and 20% for testing. The XGBoost model was trained on these data, and the fitting results showed that the R2 values were all above 0.80, RMSE below 2.65, and MAE below 2.15, indicating that the model’s predictive performance was good.
To more accurately explore the factors influencing the spatial heterogeneity of the SEM, SHAP values were used to analyze the relative contributions of the features to the XGBoost model’s predictions and their directional effects (Figure 6). LS had a relative contribution of over 40%, making it the dominant factor in the spatial pattern of the SEM. Followed by LUC, with relative contributions of 28.46% in 2000 and 34.89% in 2020, significantly higher than other features. This indicates that the spatial pattern of the SEM in Hainan Island is primarily controlled by LS and Lut. Although the relative contributions of the other features were below 10%, they still had some impact on the model. In addition, the SHAP value distributions of LS, R, K, and Ele were similar, with SHAP values increasing as LS, R, K, and Ele increased, indicating that their rise would increase the risk of SE.

4.3.2. Correlation between SEM and Features

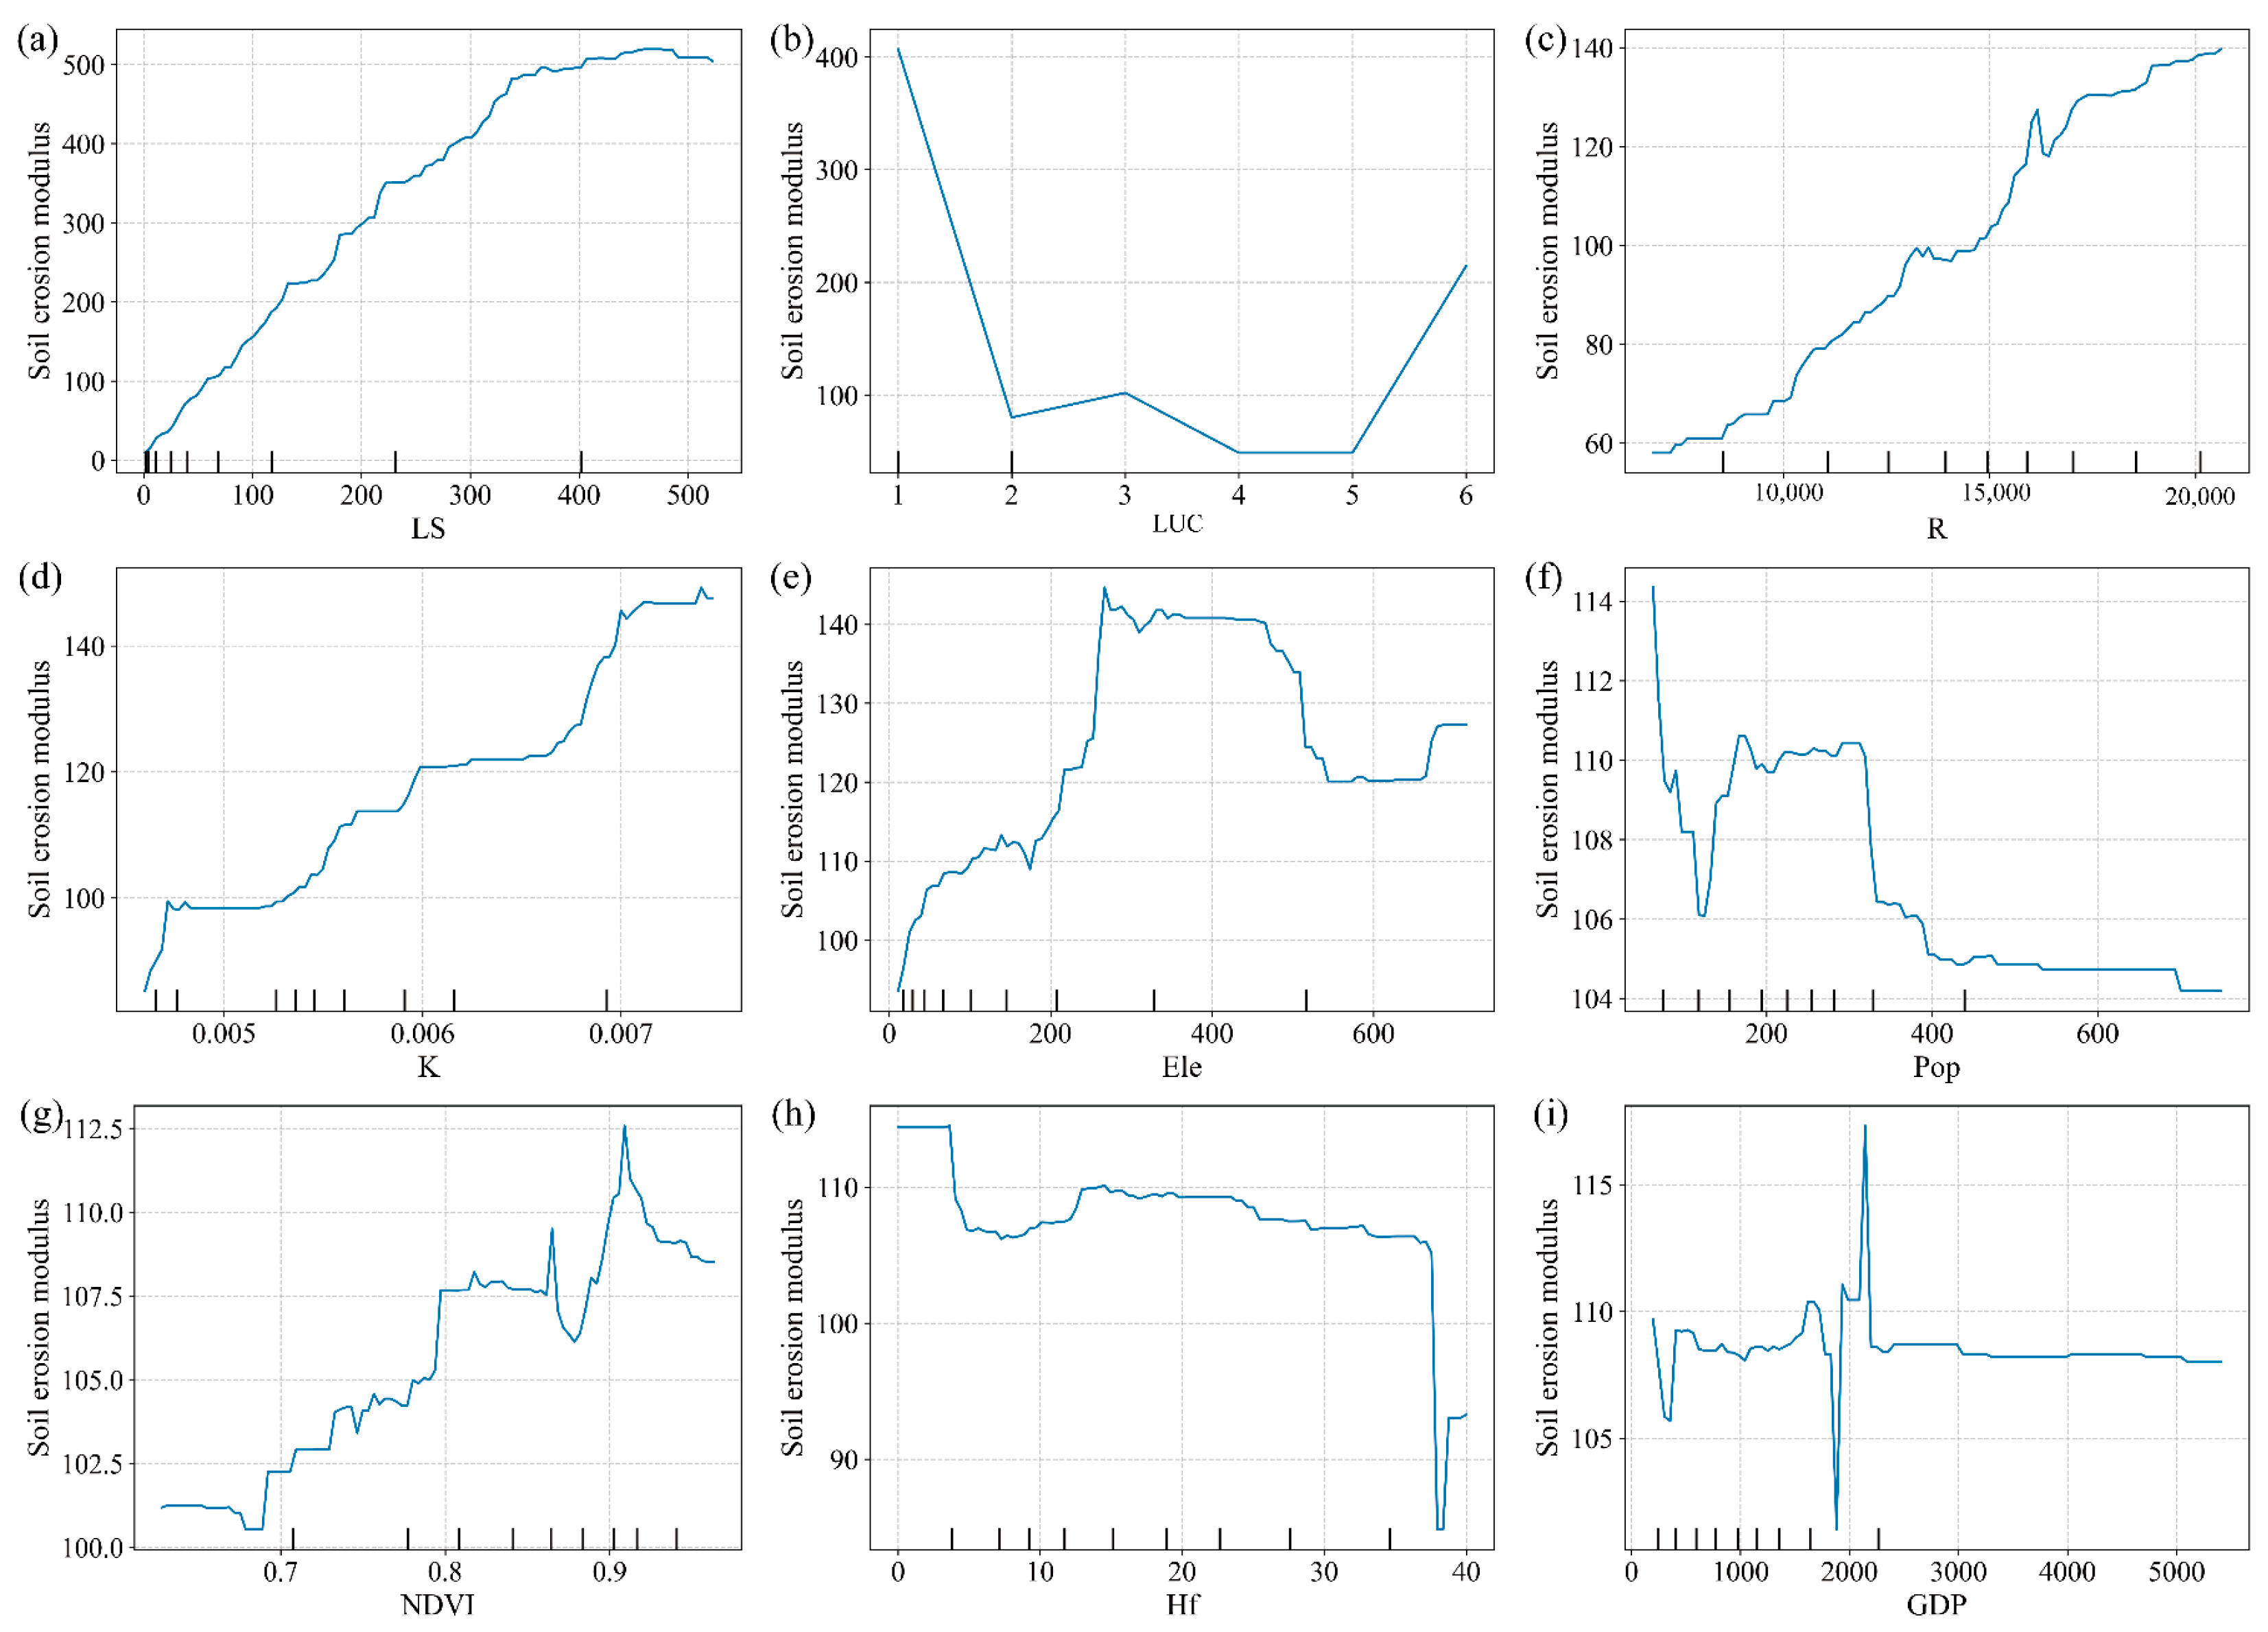
The SHAP dependence plot reflects the marginal effects of features on the SEM (Figure 7). LS, R, and K: These features exhibit similar trends, with the SEM showing a significant linear increase as LS, R, and K increase. This indicates that areas with higher LS, R, and K values have a significantly increased risk of SE. LUC: The SEM for cropland is relatively high, reflecting an increased risk of SE due to farming activities. Ele: When Ele is below 250 m, the SEM increases with rising elevation. However, when elevation exceeds 250 m, the SEM tends to decrease with further increases in Ele. Pop and Hf: Pop and Hf exhibit a negative correlation with the SEM. In areas with intense human activity, the SEM is relatively low, possibly because urbanized areas reduce SE through surface hardening. NDVI: NDVI is commonly used to assess vegetation quality, but contrary to usual perceptions, when NDVI is below 0.90, the SEM increases as NDVI rises. However, when NDVI exceeds 0.90, the SEM decreases. GDP: The impact of GDP is more complex, showing considerable fluctuations within the range of 1500 to 2000 yuan.

4.4. Future Multi-Scenario SE Simulation

4.4.1. Future LUCCs Simulation

Future LUCCs were simulated using the PLUS model (Figure 8). Under the NDS, without explicit policy constraints, the proportion of construction land is projected to increase by 4.48% by 2060, doubling the 2020 level. This increase is primarily driven by the conversion of cropland and woodland, leading to decreases of 1.67% and 3.02% in their respective proportions. Under the EPS, construction land expansion is strictly regulated. Compared to 2020, the proportion of construction land increased by 2.41%. Due to effective ecological protection policies, the conversion of cropland and woodland to construction land was effectively suppressed, though their areas still showed decreasing trends, with reductions of 1.07% and 1.56% respectively. This indicates that ecological protection policies have significant effects in controlling the expansion of construction land and protecting cropland and woodland, helping to maintain ecological balance. Under the CPS, by 2060, the proportion of construction land is projected to increase by 2.83%. Unlike other scenarios, this model restricts the conversion of cropland to other LUCs, resulting in construction land expansion primarily at the expense of woodland, which is expected to decrease by 3.36%. Additionally, there was a slight increase in cropland area in this scenario, up by 0.38% compared to 2020. This indicates that while cropland protection policies restrict the expansion of construction land to some extent, they also result in a significant reduction in woodland. Overall, the simulation results across different scenarios demonstrate that the formulation of land use policies has a significant impact on future LUCCs. In the NDS, the unregulated expansion of construction land could negatively impact the ecological environment, while the EPS effectively controls this expansion and protects cropland and woodland. Although the CPS restricts the loss of cropland, it results in a reduction in woodland. Therefore, future land use planning should balance economic development needs with ecological protection and sustainable development goals, ensuring a balanced LUC structure and safeguarding the stability and functionality of ecosystems.

4.4.2. Future SEM Changes

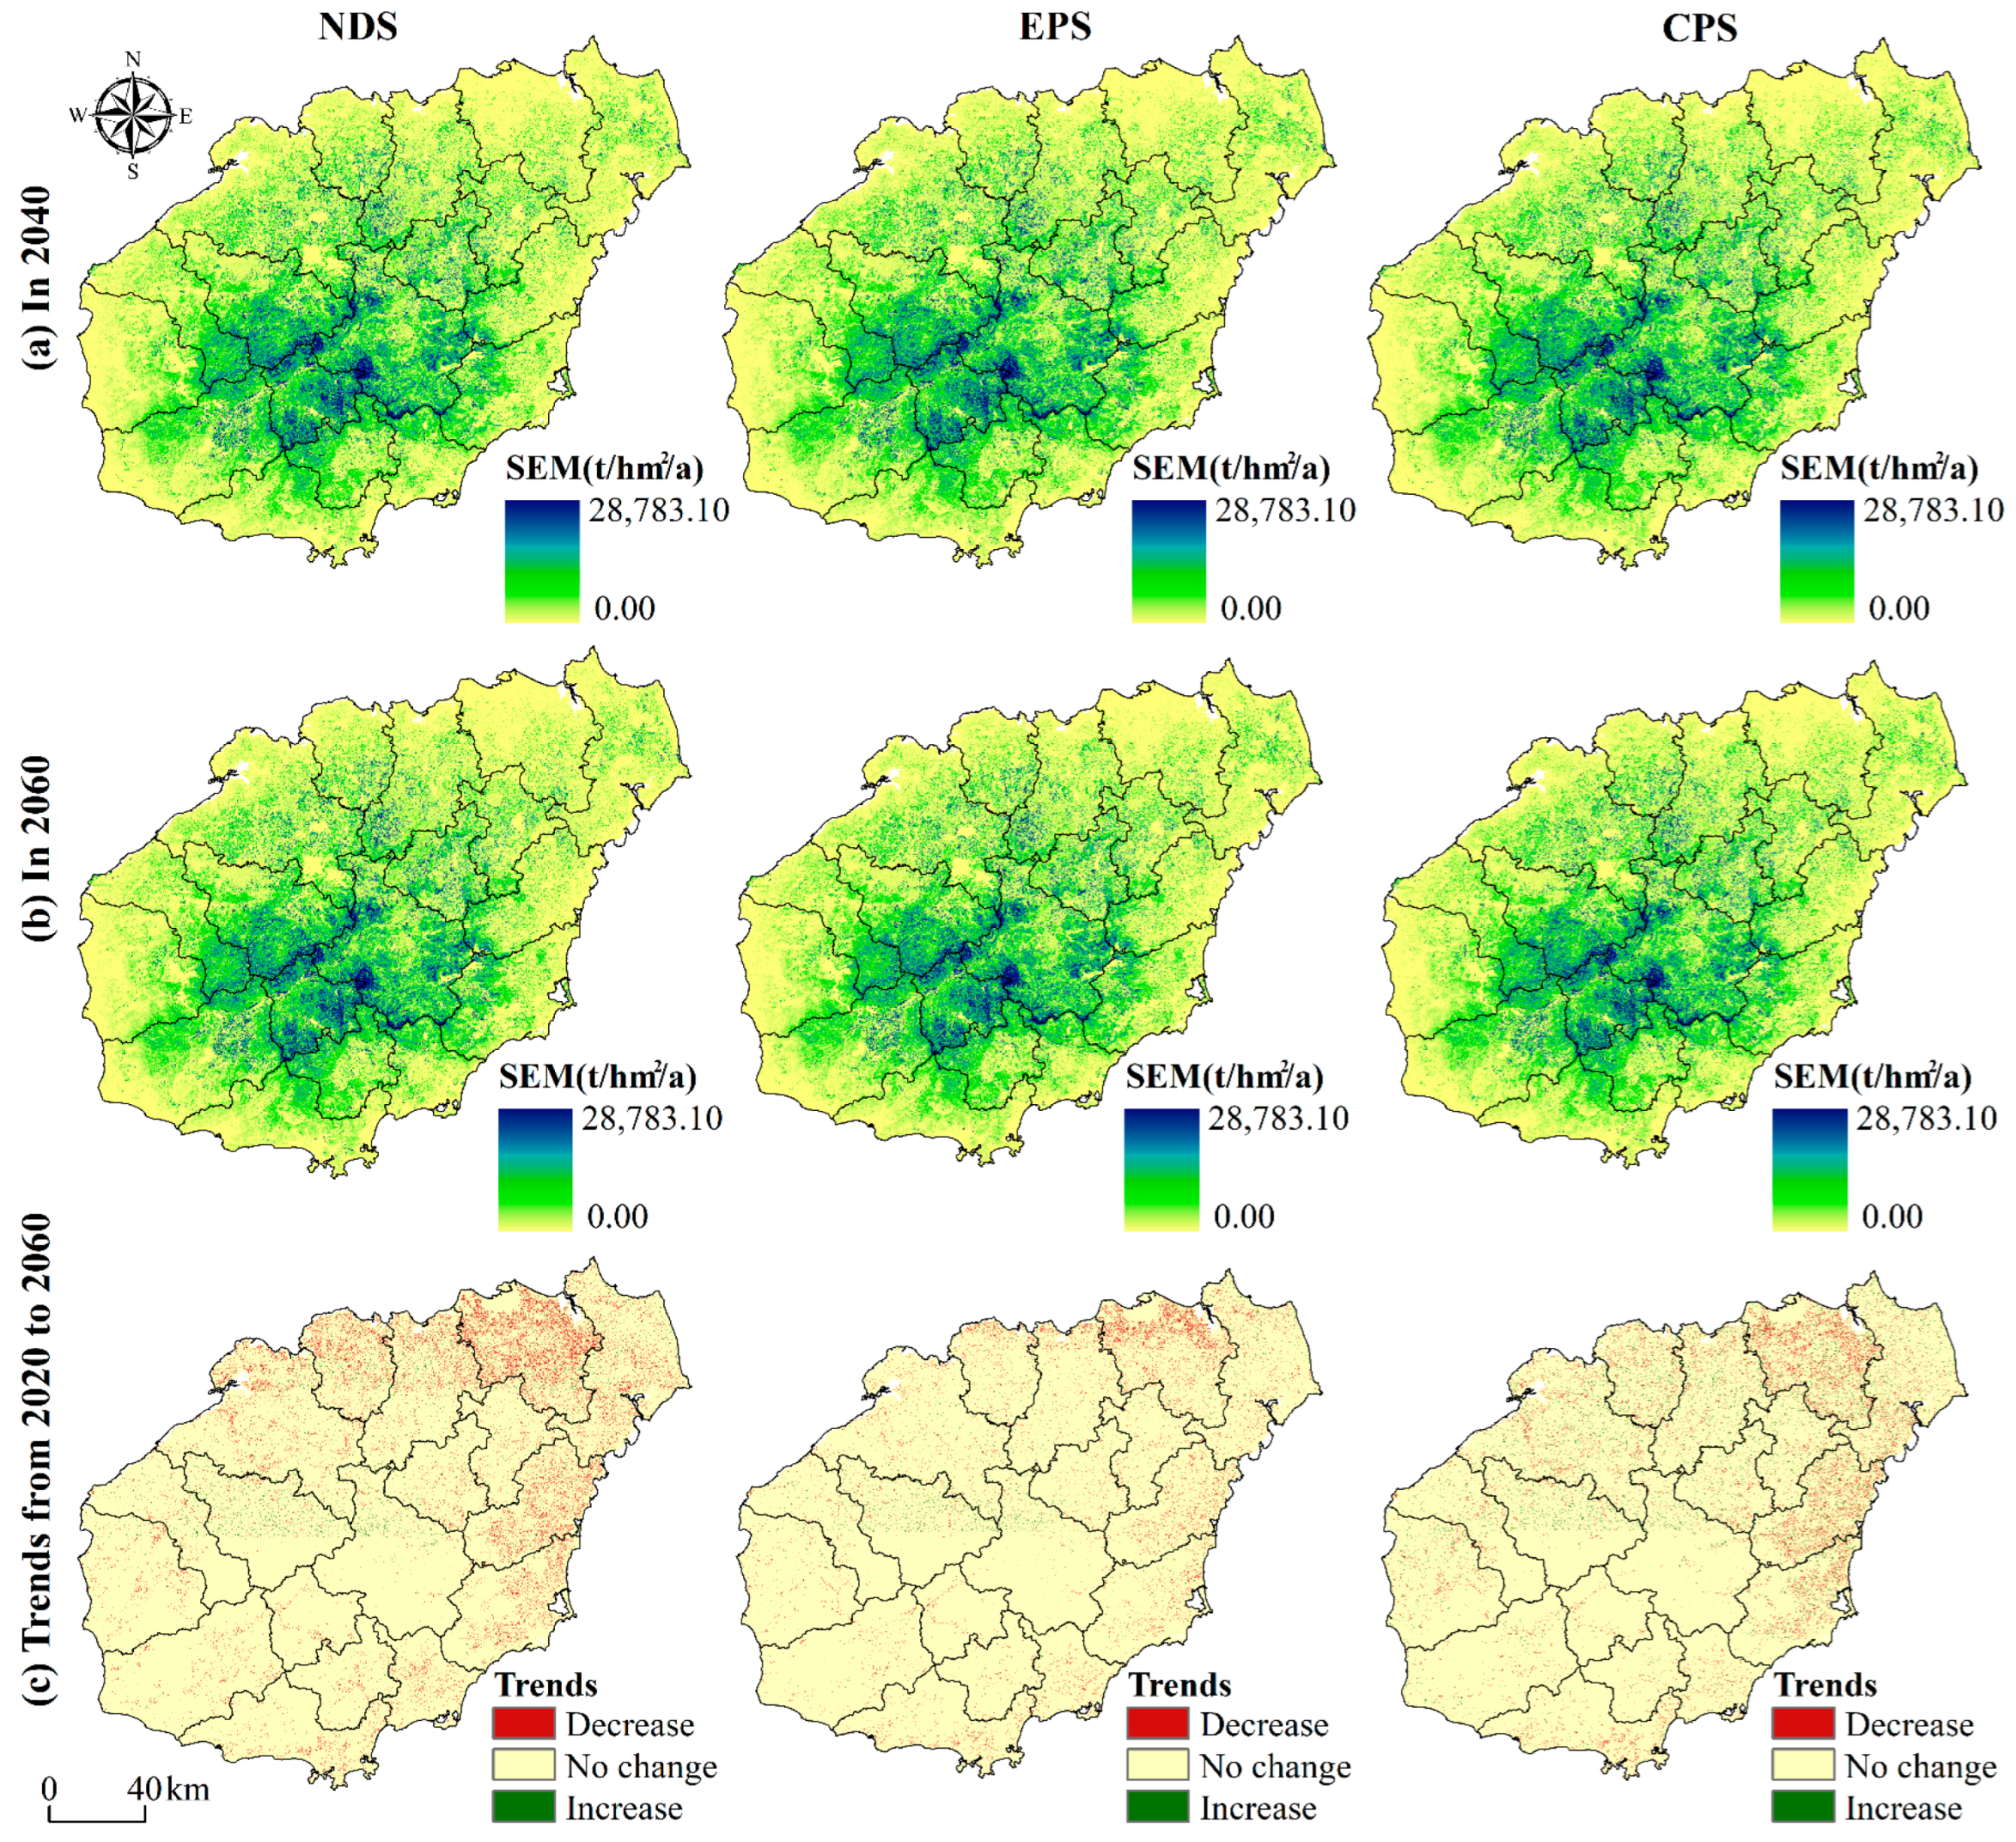
This study further calculated the SEM based on LUCCs from 2040 to 2060 (Figure 9). Under the NDS, the average SEM decreases by 2.40 t/(km2·a) by 2060 compared to 2020. This trend is primarily due to the reduction in exposed land surface caused by the expansion of construction land, while the conversion of cropland to woodland enhances vegetation cover, thereby reducing SEM. Under the EPS, the SEM decreases by 1.86 t/(km2·a) by 2060 compared to 2020. This change demonstrates the positive impact of ecological protection policies on SE control, significantly reducing SE risk by decreasing cropland area and increasing woodland cover. Under the CPS, the SEM showed a slight increase, rising by 0.08 t/(km2·a) by 2060 compared to 2020. This phenomenon indicates that although cropland protection policies help maintain agricultural production, they may also lead to a reduction in woodland, thereby increasing the risk of SE. Spatially, due to the impact of construction land expansion, areas with reduced SEM are mainly concentrated in the northeastern part of Hainan Island. These areas are undergoing rapid urbanization, which leads to surface hardening and reduced vegetation, thereby decreasing the SEM. Areas with increased SEM are mainly scattered in the central part of Hainan Island, displaying a more fragmented pattern. These areas are primarily affected by the conversion from woodland to cropland, which leads to reduced vegetation cover and an increased risk of SE.

4.4.3. SL under LUCCs from 2020 to 2060

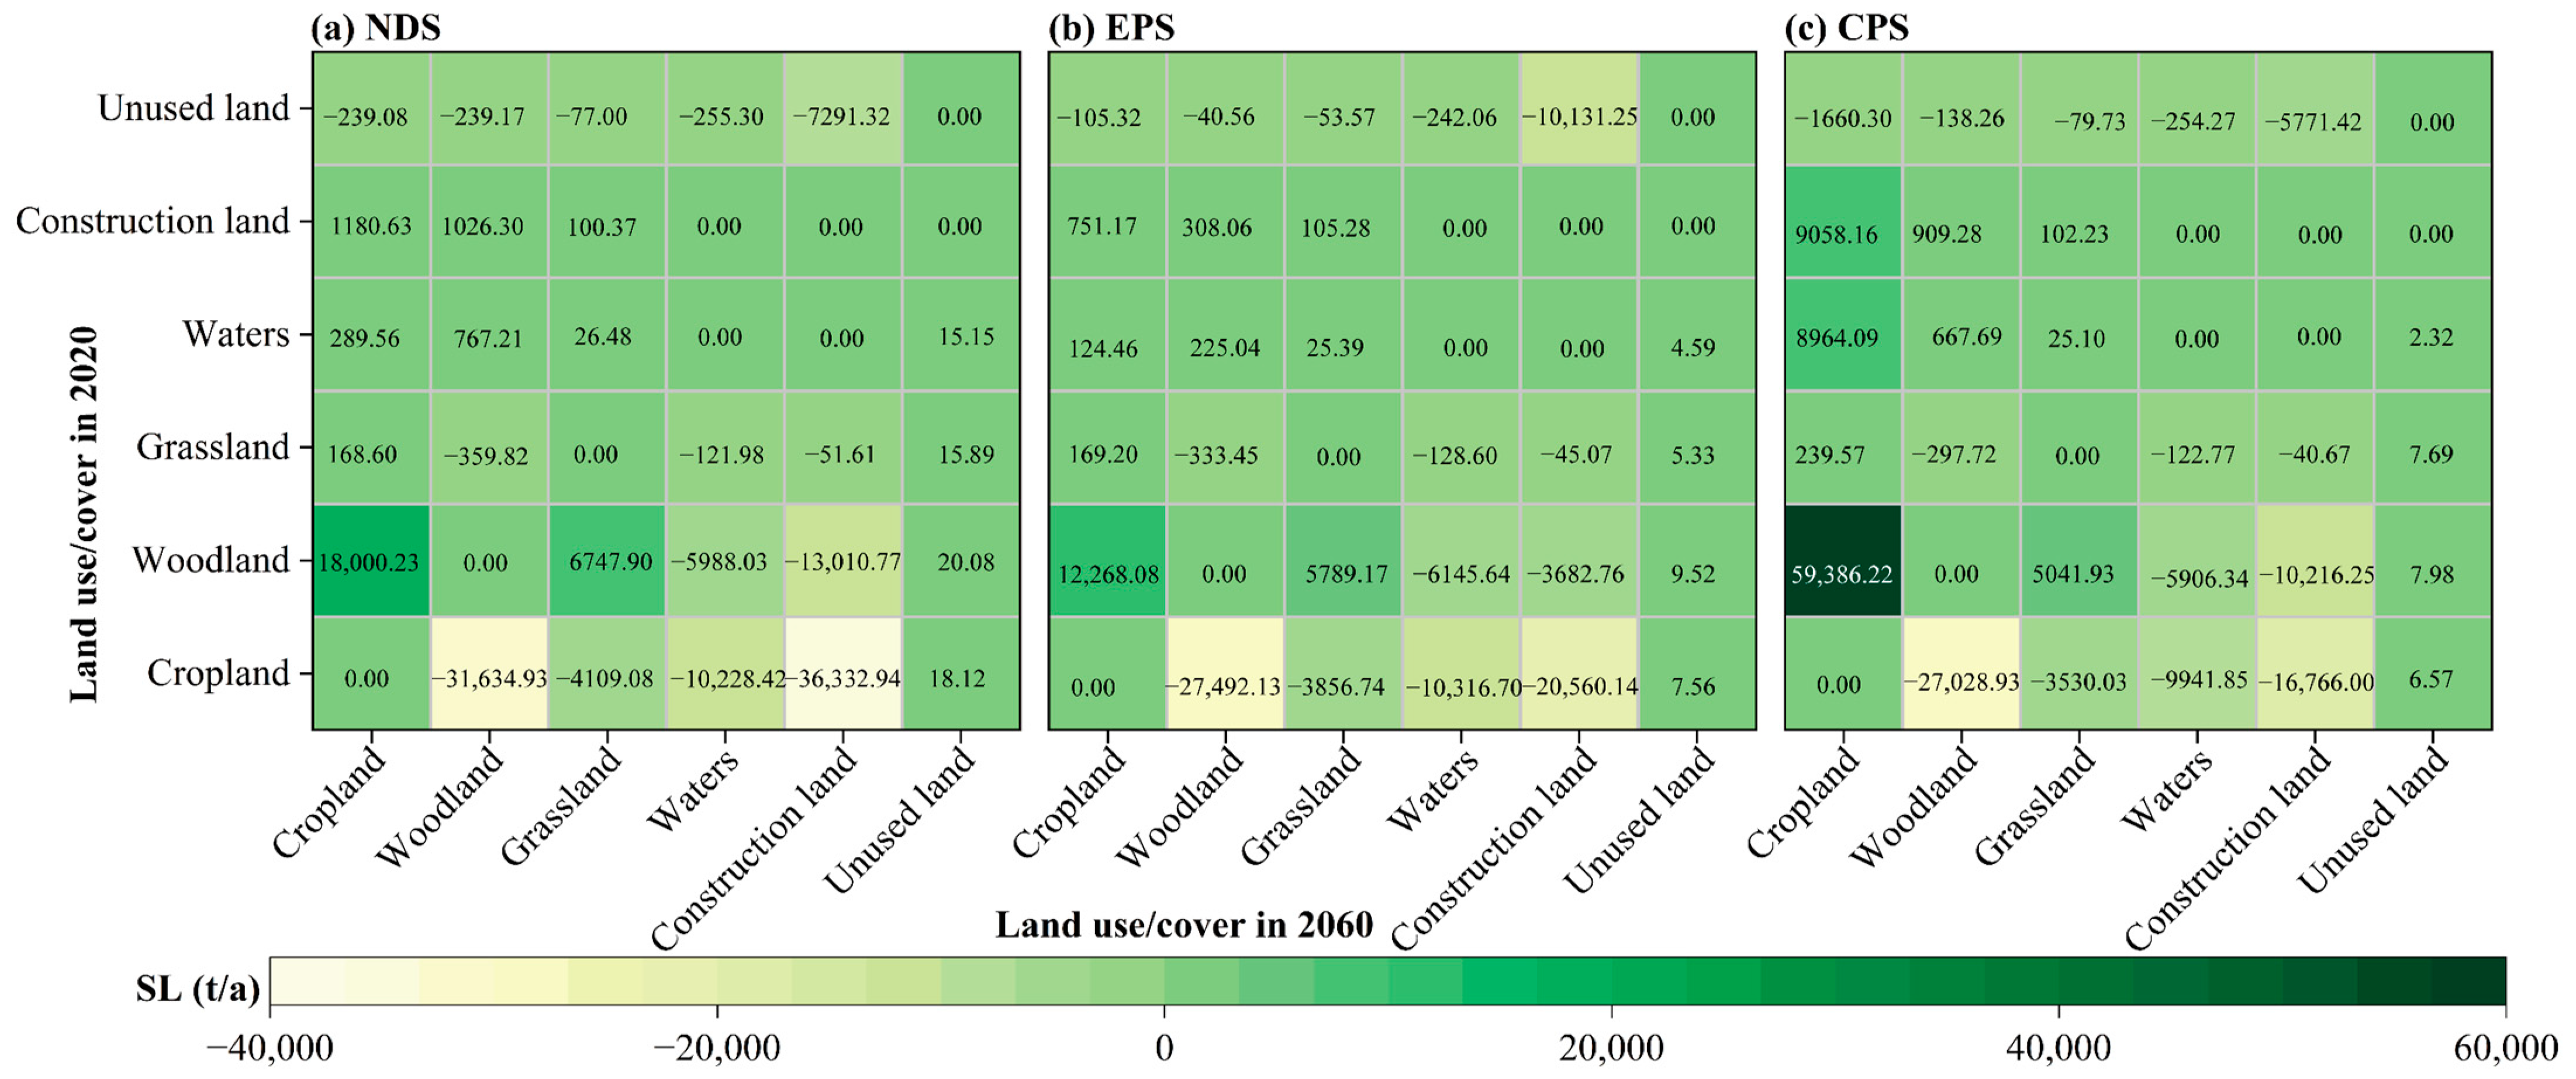
From 2020 to 2060, the LUCCs on Hainan Island under various scenarios have significantly impacted SL (Figure 10). Overall, SL shows a decreasing trend in the NDS and EPS, while it increases in the CPS. In the NDS, SL decreased by 81,632.18 t/a. This is mainly attributed to the transformation of cropland to woodland and construction land, where the transformation from cropland to woodland reduced SL by 31,634.93 t/a, and conversion to construction land reduced it by 36,332.94 t/a. Under the EPS, SL decreased by 63,368.15 t/a. Compared to the NDS, the reduction in SL from the transformation of cropland to woodland was greater, reaching 27,492.13 t/a, while the reduction from conversion to construction land was 20,560.14 t/a. This indicates that ecological protection policies effectively reduce SE by increasing woodland cover. In the CPS, despite the transformation of cropland to woodland and construction land reducing SL by 27,028.93 t/a and 16,766.00 t/a, respectively, an increase in cropland area and the transformation of woodland to cropland caused an increase in SL by 59,386.22 t/a. Ultimately, the overall SL in the study area increased by 2639.73 t/a.

5. Discussion

5.1. Temporal and Spatial Variability of SE

In this study, the analysis of LUCCs and SEM in Hainan Island clearly reveals the profound impact of LUCCs on SE. The results show notable differences in the impact of various LUC transitions on SE, especially in the conversions between cropland, woodland, and construction land. First, the conversion of cropland to woodland and construction land significantly reduced the SEM, a phenomenon attributable to the superior ability of woodland and construction land to prevent SE [47,48,49]. The vegetation cover in woodlands effectively slows surface runoff and enhances soil stability, while construction land reduces SE risk directly through surface hardening [50]. However, the expansion of cropland, especially through the conversion of woodland to cropland, significantly increased SL. This result indicates that the high sensitivity of cropland to SE is closely related to its lower vegetation cover, with frequent disturbances from farming activities further exacerbating SE [51]. Secondly, the expansion of water bodies also played a positive role in reducing SE. The transition of other LUC to water bodies reduced the exposed surface area, thereby decreasing the risk of runoff erosion. This finding further demonstrates the importance of water bodies in controlling SE, particularly in mitigating SE issues in coastal areas [52].
The simulation results under different future scenarios further emphasize the potential impact of land use policies on SE. Under the NDS, as cropland decreases and construction land expands, the SEM shows a declining trend. However, under the CPS, although the increase in cropland area helps maintain agricultural production, the reduction in woodland may lead to an increased risk of SE. This indicates that future land use planning must adopt effective ecological protection measures while meeting economic development needs to reduce the negative impacts of SE. Overall, LUCC is a significant factor influencing SE in Hainan Island. Rational land use strategies not only help control SE risks but also achieve a balance between ecological protection and economic development [53]. These findings offer a scientific foundation for future land management policy development and underscore the importance of incorporating diverse land use strategies for effective SE prevention and control [54].

5.2. Policy Recommendations for Optimizing LUC Patterns

This study reveals the significant impact of LUCCs on SE in Hainan Island, especially during the conversion between cropland, woodland, and construction land. The regulatory role of LUCCs on SE is crucial in this process. In light of this, we propose the following recommendations:
(1)
Strengthen the protection of sloping cropland and ecological restoration: SE is severe in the sloping cropland areas of Hainan Island, particularly during the conversion of cropland to other land types. The study shows that the conversion of cropland to woodland effectively reduces soil loss. Therefore, vegetation restoration and ecological rehabilitation should be prioritized in sloping cropland areas to increase vegetation cover, stabilize soil structure, and reduce soil loss. Land planning should restrict farming activities in high-risk areas to reduce the risk of SE on sloping cropland [55].
(2)
Control the expansion of construction land and optimize spatial layout: The expansion of construction land during urbanization has significantly affected the LUC pattern of Hainan Island. Although the expansion of construction land has reduced SE to some extent, its negative impact on the ecosystem cannot be ignored [56]. To reduce the occupation of woodland and cropland, land planning should reasonably control the expansion of construction land and avoid unregulated development. At the same time, the spatial layout of urban construction should be optimized to prevent large-scale infrastructure projects in areas with high SE risk, ensuring coordination between construction activities and ecological protection [57,58].
(3)
Implement comprehensive ecological protection policies to promote sustainable development: Future simulation results show that under the ecological protection scenario, the soil erosion modulus of Hainan Island significantly decreases. This indicates that the implementation of strict ecological protection policies plays a vital role in reducing SE [59]. Therefore, policymakers should further strengthen forest protection and ecological restoration efforts, strictly control the conversion of cropland and woodland, especially in ecologically sensitive areas, by adopting development-restrictive measures. Additionally, land reclamation and vegetation restoration projects should be encouraged, and ecological management should be improved to enhance regional ecosystem stability, thereby promoting soil conservation and sustainable development [60].
(4)
Promote policies combining cropland protection and ecological protection: Under the CPS, although the loss of cropland is reduced, the reduction in woodland has led to increased SE [61,62]. This indicates that a singular cropland protection policy may not effectively control SE. Therefore, future land use planning should integrate both cropland preservation and ecological conservation, balancing agricultural production with ecological preservation. Agroforestry models should be reasonably planned to integrate cropland protection with vegetation restoration, thereby reducing SE while ensuring the sustainability of agricultural production [63,64].
In conclusion, the optimization of LUC patterns and the implementation of appropriate policies are crucial for controlling SE in Hainan Island. Future land use planning should focus on integrated ecological management, balancing the needs of economic development and ecological protection to ensure the sustainable development of land use in Hainan Island.

5.3. Research Limitations and Future Prospects

Although this study provided a comprehensive analysis of the current state and future trends of SE on Hainan Island by integrating the RUSLE and PLUS models, achieving certain results, there are still limitations that warrant further exploration and improvement in future research. First, there are certain limitations in data acquisition and processing. Although we used high-resolution remote sensing imagery and multiple driving factors, the temporal and spatial resolution limitations of the data may have affected the accuracy of model simulations. Especially for some microscale LUCCs and SE processes, existing data may be insufficient to fully capture these phenomena.
Secondly, although this study used the RUSLE model to simulate SE, the RUSLE model itself also has certain limitations. This model is mainly suitable for long-term SE assessments, but its application may be less effective on small watershed or slope scales. Additionally, the RUSLE model’s parameter settings involve a certain degree of empiricism, which may introduce uncertainty. Future research should consider incorporating more complex and detailed SE models, such as the SWAT model (Soil and Water Assessment Tool), to enhance the simulation capabilities of SE processes across different scales. Moreover, although climate change is a key factor affecting SE, this study did not fully incorporate its dynamic impacts into the model. Future research should incorporate climate change scenarios to simulate SE trends under varying climatic conditions and assess their impacts on land use planning and ecological protection strategies. Additionally, this study mainly focused on the overall SE situation in Hainan Island, while lacking in-depth analysis of the specific impact mechanisms of different land use types. For example, different farming practices in agricultural activities and the selection of different tree species in vegetation restoration can have varying impacts on SE. Future research should further refine LUC and explore its specific impact mechanisms on SE to provide scientific evidence for developing more targeted soil conservation measures.

6. Conclusions

This study uncovered the intricate mechanisms through which LUCCs influence SE, identified the driving factors behind SE spatial patterns, and assessed potential SE trends under various future LUC scenarios. The key conclusions are as follows: (1) Due to LUCCs, the average SEM significantly decreased from 108.09 t/(km2·a) in 2000 to 106.75 t/(km2·a) in 2020, with a reduction of 1.34 t/(km2·a). This reduction was mainly attributed to the conversion of cropland into forest and built-up areas. (2) The dominant factor affecting the spatial pattern of SE is the LS factor (with relative contributions of 43.9% and 45.17%), followed by LUC (the relative contribution is 28.46% and 34.89%) in 2000 and 2020, respectively. (3) Future scenario simulations indicate that under the NDS, the average SEM will decrease by 2.40 t/(km2·a) by 2060. This reduction is mainly due to the expansion of construction land and the conversion of cropland to woodland, which reduces the exposed surface area and improves vegetation cover. Under the EPS, the decrease in SEM is more pronounced, with a reduction of 1.86 t/(km2·a) by 2060 due to the increased conversion of cropland to woodland. Under the CPS, although the reduction in cropland is limited, the conversion of woodland to cropland leads to a slight increase in SEM, rising by 0.08 t/(km2·a). Effective land use planning is essential for controlling SE on Hainan Island, particularly in sloping cropland areas. Strengthening management, implementing vegetation restoration, and adopting soil and water conservation measures are necessary to mitigate SE. Furthermore, the uncontrolled expansion of construction land must be restricted to prevent further harm to the ecosystem.

Author Contributions

Conceptualization, J.G., S.Q. and J.C.; methodology, S.Q.; software, J.G.; validation, J.G., S.Q. and J.C.; formal analysis, S.Q.; investigation, S.Q.; resources, J.C.; data curation, S.Q.; writing—original draft preparation, S.Q. and J.C.; writing—review and editing, S.Q. and J.G.; visualization, S.Q.; supervision, J.C.; project administration, J.C.; funding acquisition, J.C. All authors have read and agreed to the published version of the manuscript.

Funding

This research was funded by the Hainan Province Science and Technology Special Fund, grant number ZDKJ2021033.

Data Availability Statement

The original contributions presented in the study are included in the article, further inquiries can be directed to the corresponding authors.

Conflicts of Interest

Authors Jiadong Chen and Jianchao Guo were employed by the company Hainan Province Water Conservancy & Hydropower Survey, Design & Research Institute Co., Ltd. The remaining authors declare that the research was conducted in the absence of any commercial or financial relationships that could be construed as a potential conflict of interest.

References

  1. Chen, F.-C.; Katayama, A.; Oyamada, M.; Tsuyama, T.; Kijidani, Y.; Tokumoto, Y. Effects of Soil Environmental Changes Accompanying Soil Erosion on the Soil Prokaryotes and Fungi of Cool Temperate Forests in Southern Japan. J. For. Res. 2024, 29, 89–102. [Google Scholar] [CrossRef]
  2. Poraj-Górska, A.I.; Żarczyński, M.J.; Ahrens, A.; Enters, D.; Weisbrodt, D.; Tylmann, W. Impact of Historical Land Use Changes on Lacustrine Sedimentation Recorded in Varved Sediments of Lake Jaczno, Northeastern Poland. CATENA 2017, 153, 182–193. [Google Scholar] [CrossRef]
  3. Borrelli, P.; Panagos, P.; Alewell, C.; Ballabio, C.; De Oliveira Fagundes, H.; Haregeweyn, N.; Lugato, E.; Maerker, M.; Poesen, J.; Vanmaercke, M.; et al. Policy Implications of Multiple Concurrent Soil Erosion Processes in European Farmland. Nat. Sustain. 2022, 6, 103–112. [Google Scholar] [CrossRef]
  4. Guo, Q.; Cheng, C.; Jiang, H.; Liu, B.; Wang, Y. Comparative Rates of Wind and Water Erosion on Typical Farmland at the Northern End of the Loess Plateau, China. Geoderma 2019, 352, 104–115. [Google Scholar] [CrossRef]
  5. Wang, Y.; Dong, Y.; Su, Z.; Mudd, S.M.; Zheng, Q.; Hu, G.; Yan, D. Spatial Distribution of Water and Wind Erosion and Their Influence on the Soil Quality at the Agropastoral Ecotone of North China. Int. Soil. Water Conserv. Res. 2020, 8, 253–265. [Google Scholar] [CrossRef]
  6. Gao, G.; Liang, Y.; Liu, J.; Dunkerley, D.; Fu, B. A Modified RUSLE Model to Simulate Soil Erosion under Different Ecological Restoration Types in the Loess Hilly Area. Int. Soil. Water Conserv. Res. 2024, 12, 258–266. [Google Scholar] [CrossRef]
  7. Gholamahmadi, B.; Jeffery, S.; Gonzalez-Pelayo, O.; Prats, S.A.; Bastos, A.C.; Keizer, J.J.; Verheijen, F.G.A. Biochar Impacts on Runoff and Soil Erosion by Water: A Systematic Global Scale Meta-Analysis. Sci. Total Environ. 2023, 871, 161860. [Google Scholar] [CrossRef]
  8. Jiang, C.; Zhang, H.; Zhao, L.; Yang, Z.; Wang, X.; Yang, L.; Wen, M.; Geng, S.; Zeng, Q.; Wang, J. Unfolding the Effectiveness of Ecological Restoration Programs in Combating Land Degradation: Achievements, Causes, and Implications. Sci. Total Environ. 2020, 748, 141552. [Google Scholar] [CrossRef] [PubMed]
  9. Chen, S.; Zhang, G.; Wang, C. How Does Straw-Incorporation Rate Reduce Runoff and Erosion on Sloping Cropland of Black Soil Region? Agric. Ecosyst. Environ. 2023, 357, 108676. [Google Scholar] [CrossRef]
  10. Wang, Y.; Zhang, Y.; Xian, Y.; Zhang, J.; Tan, B.; Zhang, Y. Horizontal and Vertical Variations in Soil Fertility in Response to Soil Translocation Due to Tillage-Induced Erosion on Sloping Cropland. CATENA 2024, 242, 108089. [Google Scholar] [CrossRef]
  11. Auerswald, K.; Fiener, P. Soil Organic Carbon Storage Following Conversion from Cropland to Grassland on Sites Differing in Soil Drainage and Erosion History. Sci. Total Environ. 2019, 661, 481–491. [Google Scholar] [CrossRef] [PubMed]
  12. Mariappan, S.; Hartley, I.P.; Cressey, E.L.; Dungait, J.A.J.; Quine, T.A. Soil Burial Reduces Decomposition and Offsets Erosion-induced Soil Carbon Losses in the Indian Himalaya. Glob. Change Biol. 2022, 28, 1643–1658. [Google Scholar] [CrossRef]
  13. Ma, T.; Liu, B.; He, L.; Dong, L.; Yin, B.; Zhao, Y. Response of Soil Erosion to Vegetation and Terrace Changes in a Small Watershed on the Loess Plateau over the Past 85 Years. Geoderma 2024, 443, 116837. [Google Scholar] [CrossRef]
  14. Huang, X.; Ren, X.; Chen, X.; Zhang, J.; Zhang, X.; Shen, Z.; Hu, Y.; Chen, F. Anthropogenic Mountain Forest Degradation and Soil Erosion Recorded in the Sediments of Mayinghai Lake in Northern China. CATENA 2021, 207, 105597. [Google Scholar] [CrossRef]
  15. Riquetti, N.B.; Beskow, S.; Guo, L.; Mello, C.R. Soil Erosion Assessment in the Amazon Basin in the Last 60 Years of Deforestation. Environ. Res. 2023, 236, 116846. [Google Scholar] [CrossRef]
  16. Carmo, M.; Domingos, T. Agricultural Expansion, Soil Degradation, and Fertilization in Portugal, 1873–1960: From History to Soil and Back Again. Soc. Sci. Hist. 2021, 45, 705–732. [Google Scholar] [CrossRef]
  17. Carollo, F.G.; Serio, M.A.; Pampalone, V.; Ferro, V. The Unit Plot of the Universal Soil Loss Equation (USLE): Myth or Reality? J. Hydrol. 2024, 632, 130880. [Google Scholar] [CrossRef]
  18. Tilahun, A.; Desta, H. Soil Erosion Modeling and Sediment Transport Index Analysis Using USLE and GIS Techniques in Ada’a Watershed, Awash River Basin, Ethiopia. Geosci. Lett. 2023, 10, 57. [Google Scholar] [CrossRef]
  19. Jing, J.; Li, R.; Zhang, Y.; Wu, Q. Identification of Priority Areas for Soil Erosion Control Based on Minimum Administrative Units and Karst Landforms in Karst Areas of Guizhou. Prog. Phys. Geogr. Earth Environ. 2023, 47, 892–911. [Google Scholar] [CrossRef]
  20. Mier-Valderrama, L.; Leal, J.; Perotto-Baldivieso, H.L.; Hedquist, B.; Menendez, H.M.; Anoruo, A.; Turner, B.L. Evaluating Soil Erosion and Runoff Dynamics in a Humid Subtropic, Low Stream Order, Southern Plains Watershed from Cultivation and Solar Farm Development. Int. Soil. Water Conserv. Res. 2024, 12, 432–445. [Google Scholar] [CrossRef]
  21. Oudchaira, S.; Rhoujjati, A.; Hanich, L.; El Hachimi, M.L. Evaluating Soil Loss and Sediment Yield for Sustainable Management of the Hassan II Dam within Morocco’s Upper Moulouya Watershed Using RUSLE Model and GIS. Env. Earth Sci. 2024, 83, 210. [Google Scholar] [CrossRef]
  22. Bettoni, M.; Maerker, M.; Bosino, A.; Conedera, M.; Simoncelli, L.; Vogel, S. Land Use Effects on Surface Runoff and Soil Erosion in a Southern Alpine Valley. Geoderma 2023, 435, 116505. [Google Scholar] [CrossRef]
  23. Wei, B.; Li, Z.; Duan, L.; Gu, Z.; Liu, X. Vegetation Types and Rainfall Regimes Impact on Surface Runoff and Soil Erosion over 10 Years in Karst Hillslopes. CATENA 2023, 232, 107443. [Google Scholar] [CrossRef]
  24. Marondedze, A.K.; Schütt, B. Predicting the Impact of Future Land Use and Climate Change on Potential Soil Erosion Risk in an Urban District of the Harare Metropolitan Province, Zimbabwe. Remote Sens. 2021, 13, 4360. [Google Scholar] [CrossRef]
  25. Li, B.; Wang, Y. Impact of the Grain-for-Green Programme and Climate Change on the Soil Erosion Decline in the Yangtze River, China. J. Geogr. Sci. 2024, 34, 527–542. [Google Scholar] [CrossRef]
  26. Xiong, M.; Leng, G. Global Soil Water Erosion Responses to Climate and Land Use Changes. CATENA 2024, 241, 108043. [Google Scholar] [CrossRef]
  27. Srejić, T.; Manojlović, S.; Sibinović, M.; Bajat, B.; Novković, I.; Milošević, M.V.; Carević, I.; Todosijević, M.; Sedlak, M.G. Agricultural Land Use Changes as a Driving Force of Soil Erosion in the Velika Morava River Basin, Serbia. Agriculture 2023, 13, 778. [Google Scholar] [CrossRef]
  28. Wu, Q.; Jiang, X.; Shi, X.; Zhang, Y.; Liu, Y.; Cai, W. Spatiotemporal Evolution Characteristics of Soil Erosion and Its Driving Mechanisms—A Case Study: Loess Plateau, China. CATENA 2024, 242, 108075. [Google Scholar] [CrossRef]
  29. Tian, L.; Liu, Y.; Ma, Y.; Duan, J.; Chen, F.; Deng, Y.; Zhu, H.; Li, Z. Combined Role of Ground Cover Management in Altering Orchard Surface–subsurface Erosion and Associated Carbon–Nitrogen-Phosphorus Loss. Env. Sci. Pollut. Res. 2023, 31, 5655–5667. [Google Scholar] [CrossRef]
  30. Tuo, D.; Xu, M.; Gao, G. Relative Contributions of Wind and Water Erosion to Total Soil Loss and Its Effect on Soil Properties in Sloping Croplands of the Chinese Loess Plateau. Sci. Total Environ. 2018, 633, 1032–1040. [Google Scholar] [CrossRef]
  31. Haowei, M.; Xuecao, L.; Yanan, W.; Jianxi, H.; Peijun, D.; Wei, S.; Shuangxi, M.; Mengqing, G. A Global Record of Annual Terrestrial Human Footprint Dataset from 2000 to 2018. Sci. Data 2022, 9, 176. [Google Scholar] [CrossRef]
  32. Felix, F.C.; Cândido, B.M.; Moraes, J.F.L.D. Improving RUSLE Predictions through UAV-Based Soil Cover Management Factor (C) Assessments: A Novel Approach for Enhanced Erosion Analysis in Sugarcane Fields. J. Hydrol. 2023, 626, 130229. [Google Scholar] [CrossRef]
  33. Porto, P.; Callegari, G.; Ouadja, A.; Infusino, E. Using Cs-137 Measurements and RUSLE Model to Explore the Effect of Land Use Changes on Soil Erosion and Deposition Rates in a Mid-Sized Catchment in Southern Italy. Int. J. Sediment. Res. 2023, 39, 167–177. [Google Scholar] [CrossRef]
  34. Lai, J.; Li, J.; Liu, L. Predicting Soil Erosion Using RUSLE and GeoSOS-FLUS Models: A Case Study in Kunming, China. Forests 2024, 15, 1039. [Google Scholar] [CrossRef]
  35. Ma, S.; Wang, L.-J.; Wang, H.-Y.; Zhao, Y.-G.; Jiang, J. Impacts of Land Use/Land Cover and Soil Property Changes on Soil Erosion in the Black Soil Region, China. J. Environ. Manag. 2023, 328, 117024. [Google Scholar] [CrossRef]
  36. Peng, L.; Tang, C.; Zhang, X.; Duan, J.; Yang, L.; Liu, S. Quantifying the Effects of Root and Soil Properties on Soil Detachment Capacity in Agricultural Land Use of Southern China. Forests 2022, 13, 1788. [Google Scholar] [CrossRef]
  37. Chen, J.; You, J.; Wei, J.; Dai, Z.; Zhang, G. Interpreting XGBoost Predictions for Shear-Wave Velocity Using SHAP: Insights into Gas Hydrate Morphology and Saturation. Fuel 2024, 364, 131145. [Google Scholar] [CrossRef]
  38. He, H.; Wang, J.; Ding, J.; Wang, L. Spatial Downscaling of Precipitation Data in Arid Regions Based on the XGBoost-MGWR Model: A Case Study of the Turpan–Hami Region. Land 2024, 13, 448. [Google Scholar] [CrossRef]
  39. He, K.; Chen, X.; Yu, X.; Dong, C.; Zhao, D. Evaluation and Prediction of Compound Geohazards in Highly Urbanized Regions across China’s Greater Bay Area. J. Clean. Prod. 2024, 449, 141641. [Google Scholar] [CrossRef]
  40. Myśliwiec, P.; Kubit, A.; Szawara, P. Optimization of 2024-T3 Aluminum Alloy Friction Stir Welding Using Random Forest, XGBoost, and MLP Machine Learning Techniques. Materials 2024, 17, 1452. [Google Scholar] [CrossRef]
  41. Hong, Y.-W.; Yoo, D.-Y. Multiple Intrusion Detection Using Shapley Additive Explanations and a Heterogeneous Ensemble Model in an Unmanned Aerial Vehicle’s Controller Area Network. Appl. Sci. 2024, 14, 5487. [Google Scholar] [CrossRef]
  42. Karathanasopoulos, N.; Singh, A.; Hadjidoukas, P. Machine Learning-Based Modelling, Feature Importance and Shapley Additive Explanations Analysis of Variable-Stiffness Composite Beam Structures. Structures 2024, 62, 106206. [Google Scholar] [CrossRef]
  43. Zhou, N.; Qin, W.; Zhang, J.-J.; Wang, Y.; Wen, J.-S.; Lim, Y.M. Epidemiological Exploration of the Impact of Bluetooth Headset Usage on Thyroid Nodules Using Shapley Additive Explanations Method. Sci. Rep. 2024, 14, 14354. [Google Scholar] [CrossRef] [PubMed]
  44. Li, S.; Cao, Y.; Liu, J.; Wang, S. Simulating Land Use Change for Sustainable Land Management in China’s Coal Resource-Based Cities under Different Scenarios. Sci. Total Environ. 2024, 916, 170126. [Google Scholar] [CrossRef]
  45. Zhang, Z.; Luo, J.; Chen, B. Spatially Explicit Quantification of Total Soil Erosion by RTK GPS in Wind and Water Eroded Croplands. Sci. Total Environ. 2020, 702, 134716. [Google Scholar] [CrossRef]
  46. Wang, J.; Zhang, J.; Xiong, N.; Liang, B.; Wang, Z.; Cressey, E. Spatial and Temporal Variation, Simulation and Prediction of Land Use in Ecological Conservation Area of Western Beijing. Remote Sens. 2022, 14, 1452. [Google Scholar] [CrossRef]
  47. Han, Y.; Zhao, W.; Ding, J.; Ferreira, C.S.S. Soil Erodibility for Water and Wind Erosion and Its Relationship to Vegetation and Soil Properties in China’s Drylands. Sci. Total Environ. 2023, 903, 166639. [Google Scholar] [CrossRef]
  48. He, X.; Miao, Z.; Wang, Y.; Yang, L.; Zhang, Z. Response of Soil Erosion to Climate Change and Vegetation Restoration in the Ganjiang River Basin, China. Ecol. Indic. 2024, 158, 111429. [Google Scholar] [CrossRef]
  49. Tian, P.; Tian, X.; Geng, R.; Zhao, G.; Yang, L.; Mu, X.; Gao, P.; Sun, W.; Liu, Y. Response of Soil Erosion to Vegetation Restoration and Terracing on the Loess Plateau. CATENA 2023, 227, 107103. [Google Scholar] [CrossRef]
  50. Nouwakpo, S.K.; Weltz, M.A.; Green, C.H.M.; Arslan, A. Combining 3D Data and Traditional Soil Erosion Assessment Techniques to Study the Effect of a Vegetation Cover Gradient on Hillslope Runoff and Soil Erosion in a Semi-Arid Catchment. CATENA 2018, 170, 129–140. [Google Scholar] [CrossRef]
  51. Chen, G.; Zhao, J.; Duan, X.; Tang, B.; Zuo, L.; Wang, X.; Guo, Q. Spatial Quantification of Cropland Soil Erosion Dynamics in the Yunnan Plateau Based on Sampling Survey and Multi-Source LUCC Data. Remote Sens. 2024, 16, 977. [Google Scholar] [CrossRef]
  52. Zhou, Y.; Yi, Y.; Liu, H.; Tang, C.; Zhang, S. Spatiotemporal Dynamic of Soil Erosion and the Key Factors Impact Processes over Semi-Arid Catchments in Southwest China. Ecol. Eng. 2024, 201, 107217. [Google Scholar] [CrossRef]
  53. Dong, H.; Li, P.; Feng, Z.; Yang, Y.; You, Z.; Li, Q. Natural Capital Utilization on an International Tourism Island Based on a Three-Dimensional Ecological Footprint Model: A Case Study of Hainan Province, China. Ecol. Indic. 2019, 104, 479–488. [Google Scholar] [CrossRef]
  54. Fu, J.; Zhang, Q.; Wang, P.; Zhang, L.; Tian, Y.; Li, X. Spatio-Temporal Changes in Ecosystem Service Value and Its Coordinated Development with Economy: A Case Study in Hainan Province, China. Remote Sens. 2022, 14, 970. [Google Scholar] [CrossRef]
  55. Kang, D.-H.; Kim, J. Development of Eco-Friendly Soil Improvement Agent for Enhanced Slope Stability and Erosion Control in Urban Areas. Buildings 2024, 14, 1021. [Google Scholar] [CrossRef]
  56. Jian, Z.; Sun, Y.; Wang, F.; Zhou, C.; Pan, F.; Meng, W.; Sui, M. Soil Conservation Ecosystem Service Supply-Demand and Multi Scenario Simulation in the Loess Plateau, China. Glob. Ecol. Conserv. 2024, 49, e02796. [Google Scholar] [CrossRef]
  57. Romero-Blanco, A.; Castro-Díez, P.; Lázaro-Lobo, A.; Molina-Venegas, R.; Cruces, P.; Pyšek, P. Searching for Predictors of the Variability of Impacts Caused by Non-Native Trees on Regulating Ecosystem Services Worldwide. Sci. Total Environ. 2023, 877, 162961. [Google Scholar] [CrossRef] [PubMed]
  58. Zarrinabadi, E.; Lobb, D.A.; Enanga, E.; Badiou, P.; Creed, I.F. Agricultural Activities Lead to Sediment Infilling of Wetlandscapes in the Canadian Prairies: Assessment of Soil Erosion and Sedimentation Fluxes. Geoderma 2023, 436, 116525. [Google Scholar] [CrossRef]
  59. Zhao, J.; Shao, Z.; Xia, C.; Fang, K.; Chen, R.; Zhou, J. Ecosystem Services Assessment Based on Land Use Simulation: A Case Study in the Heihe River Basin, China. Ecol. Indic. 2022, 143, 109402. [Google Scholar] [CrossRef]
  60. Cheng, Q.; Sha, S. Revealing the Injustice and Factors That Affect the Resilience Responses of Residents in the Full Period of Heat Waves. Sustain. Cities Soc. 2024, 107, 105467. [Google Scholar] [CrossRef]
  61. Huang, P.; Zhao, X.; Pu, J.; Gu, Z.; Ran, Y.; Xu, Y.; Wu, B.; Dong, W.; Qu, G.; Xiong, B.; et al. Defining the Land Use Area Threshold and Optimizing Its Structure to Improve Supply-Demand Balance State of Ecosystem Services. J. Geogr. Sci. 2024, 34, 891–920. [Google Scholar] [CrossRef]
  62. Luo, R.; He, D. The Dynamic Impact of Land Use Change on Ecosystem Services as the Fast GDP Growth in Guiyang City. Ecol. Indic. 2023, 157, 111275. [Google Scholar] [CrossRef]
  63. Liu, L.; Di, B.; Zhang, M. The Tradeoff between Ecological Protection and Economic Growth in China’s County Development: Evidence from the Soil and Water Conservation Projects during 2011–2015. Resour. Conserv. Recycl. 2020, 156, 104745. [Google Scholar] [CrossRef]
  64. Yu, S.; Wang, L.; Zhao, J.; Shi, Z. Using Structural Equation Modelling to Identify Regional Socio-Economic Driving Forces of Soil Erosion: A Case Study of Jiangxi Province, Southern China. J. Environ. Manag. 2021, 279, 111616. [Google Scholar] [CrossRef] [PubMed]
Figure 1. Location map.
Water 16 02654 g001
Figure 2. Spatial distribution of LUC.
Water 16 02654 g002
Figure 3. LUCCs from 2000 to 2020.
Water 16 02654 g003
Figure 4. Spatiotemporal changes in SEM.
Water 16 02654 g004
Figure 5. Changes in SL due to LUCCs.
Water 16 02654 g005
Figure 6. SHAP summary plot in (a) 2000 and (b) 2020. Notes: LS, LUC, R, Ele, K, Hf, Pop, GDP, and NDVI correspond to the LS factor, land use/cover, R factor, elevation, K factor, human footprint, population density, and gross domestic product, respectively.
Water 16 02654 g006
Figure 7. SHAP dependence plot. Notes: LS, LUC, R, Ele, K, Hf, Pop, GDP, and NDVI correspond to the LS factor, land use/cover, R factor, elevation, K factor, human footprint, population density, and gross domestic product, respectively.
Water 16 02654 g007
Figure 8. LUCCs from 2040 to 2060.
Water 16 02654 g008
Figure 9. Spatiotemporal changes in SEM under different future scenarios.
Water 16 02654 g009
Figure 10. SL change under LUCCs from 2020 to 2060.
Water 16 02654 g010
Table 1. Data details.
CategoriesVariablesAbbreviationResolutionSources
Land use/cover LUC30 mhttps://www.resdc.cn, accessed on 25 May 2024.
Natural factorsElevationEle30 mhttps://www.gscloud.cn, accessed on 25 May 2024.
SlopeSlop30 m
TemperatureTem30 mhttps://data.cma.cn, accessed on 25 May 2024.
RainfallRain30 m
Normalized difference vegetation indexNDVI250 mhttps://www.geodata.cn, accessed on 25 May 2024.
Soil erodibility factorK30 m
Anthropogenic factorsGross domestic productGDP1 kmhttps://www.resdc.cn, accessed on 20 May 2024.
Population densityPop1 km
Human footprintHf1 km[31], accessed on 20 May 2024.
Table 2. Assignment of C and p values.
Land Use/CoverCroplandUnused LandWoodlandConstruction LandGrasslandWaters
C0.101.000.0030.200.0050.00
p0.351.001.000.001.000.00
Disclaimer/Publisher’s Note: The statements, opinions and data contained in all publications are solely those of the individual author(s) and contributor(s) and not of MDPI and/or the editor(s). MDPI and/or the editor(s) disclaim responsibility for any injury to people or property resulting from any ideas, methods, instructions or products referred to in the content.