Article

A Data-Driven Methodology for Assessing Reuse Potential in Existing Wastewater Treatment Plants

by
Inês Areosa
1,*,
Tiago A. E. Martins
2,
Rita Lourinho
3,
Marcos Batista
4,
António G. Brito
1,5 and
Leonor Amaral
2,6
1
Department of Biosystems Science and Engineering, School of Agriculture, University of Lisbon, 1349-017 Lisbon, Portugal
2
Department of Environmental Sciences and Engineering, NOVA School of Science and Technology, NOVA University of Lisbon, 2829-516 Caparica, Portugal
3
Department of Research, Development, and Innovation, Águas do Tejo Atlântico S.A., 1300-254 Lisbon, Portugal
4
Department of Communication and Development, Águas do Tejo Atlântico S.A., 1300-254 Lisbon, Portugal
5
LEAF (Linking Landscape, Environment, Agriculture and Food) & TERRA (Laboratory for Sustainable Land Use and Ecosystem Services), School of Agriculture, University of Lisbon, 1349-017 Lisbon, Portugal
6
CENSE (Center for Environmental and Sustainability Research) & CHANGE (Global Change and Sustainability Institute), NOVA School of Science and Technology, NOVA University of Lisbon, 2829-516 Caparica, Portugal
*
Author to whom correspondence should be addressed.
Water 2024, 16(17), 2474; https://doi.org/10.3390/w16172474
Submission received: 7 August 2024 / Revised: 27 August 2024 / Accepted: 28 August 2024 / Published: 30 August 2024
(This article belongs to the Section Wastewater Treatment and Reuse)

Abstract

:
Wastewater reuse is a proven strategy to mitigate water stress in drought-prone regions. However, this practice is still limited due to high implementation costs, regulatory hurdles, and limited public acceptance. In regions with low reclaim rates, a thorough evaluation of the potential for reuse is needed to support decision-making, focusing on opportunities that address both low-hanging fruit and high-leverage projects. This paper introduces a streamlined, data-centric methodology for assessing wastewater reuse potential, adaptable to various regional contexts. The methodology involves comprehensive data collection and processing to evaluate wastewater treatment plant (WWTP) capabilities and identify potential users, allowing the prioritisation of case studies based on demand alignment. Different treatment and distribution systems are analysed to match WWTP capabilities with user needs, considering volume, quality, and infrastructure requirements. Cost analysis incorporates capital expenditure (CAPEX), operational expenditure (OPEX) and unit costs using novel cost functions for treatment and distribution. Risk analysis adheres to WHO methodology to ensure safety and sustainability. A case study in the Lisbon and Oeste areas in Portugal validates this approach, revealing key insights into the potential and economic viability of water reuse. By comparing tariffs and costs associated with different reuse scenarios, this paper offers benchmarks for the economic feasibility of reuse projects.

1. Introduction

Water scarcity is a pressing global challenge, exacerbated by climate change, population growth, and increased industrial activities. As freshwater resources decrease, the reuse of treated wastewater emerges as a sustainable solution to alleviate water stress and enhance water security, particularly in drought-prone regions where alternative sources are limited, therefore making water reuse an alternative source.
In recent years, there have been significant advancements in wastewater treatment technologies, enabling the treatment of reclaimed water for various applications. These technologies include membrane bioreactors, ultraviolet (UV) disinfection, and advanced oxidation processes, which produce high-quality reclaimed water meeting stringent regulatory standards. Despite a high level of technological readiness, reuse rates remain low in many countries facing high drought risk, such as Portugal (1.2%) Greece (2%) and Italy (4%) [1,2,3].
Effective policymaking and water resource management require comprehensive information on the availability and economic viability of water reclamation projects. Thus, integrated plans that identify and leverage reuse potential are essential to bridge the gap between regulatory standards and practical implementation. Previous studies have highlighted the importance of robust methodologies and site-specific assessments in determining the viability of wastewater reuse projects [4,5]. For that, various indices and methodologies have been developed to evaluate wastewater reuse potential, considering criteria such as crop irrigation needs, waste water treatment plant (WWTP) treated volumes [5,6,7], climate conditions, types of crops, distance to WWTP, water regulations [8], availability and cost of conventional water sources, water productivity [9], quality of effluent and rainfall [10]. However, risk analysis seems to have been often neglected.
Economic considerations are essential for the success of water reuse projects. While some cost functions are available in the literature [11,12,13], they are outdated and primarily focus on newly constructed WWTPs rather than retrofitting existing ones. More relevant data can be found in some cost databases [14,15]. Additionally, Pistocchi et al. [16]. conducted a broad European study on the costs of reclaiming and transporting treated wastewater, but this type of macro-level analysis often overlooks specific local factors. Moreover, reclaimed water projects can be highly dependent on end-users’ willingness to pay, making it crucial to integrate economic considerations with technical, environmental, and risk factors in a comprehensive cost–benefit analysis. Comparing treatment and distribution costs with the economic benefits of water savings, environmental protection, and enhanced water security is crucial for accounting for the real advantages of increased reuse [17,18].
This paper builds on such research by introducing a streamlined methodology to assess wastewater reuse potential that can be adapted to different regional contexts. The methodology integrates a data-centric approach to characterize WWTPs and their surrounding areas, using prioritization strategies for case study selection. It includes guidelines for aligning WWTP capabilities with user demands, as well as tools for analysing cost and risk factors. Beyond other methodologies, this approach focuses on locally relevant features such as existing irrigation and reservoir infrastructure, effluent quality, and fit-for-purpose treatments adapted to user needs and existing treatment systems. The integration of a risk analysis further ensures that the proposed solutions are not only cost-effective but also safe and sustainable. Additionally, it provides Excel-based calculation tools to facilitate cost estimation and base decision-making for stakeholders, promoting practical and efficient water reuse solutions.
A practical case study in the Lisbon and Oeste regions, in Portugal, managed by Águas do Tejo Atlântico (AdTA), Portugal’s major wastewater utility, is also presented. The example intends to showcase how this approach provides a detailed understanding of the current state and future potential of water reuse in the region, guiding strategic planning and implementation efforts for sustainable water management in water-scarce regions.

2. Materials and Methods

2.1. Data Collection and Processing

The first step of this methodology consists of a data-centric approach for characterizing wastewater treatment in the region. In the second phase, the resulting information is then used to support the identification of key case studies for a detailed analysis. For that, it is suggested that all WWTPs are assessed based on multiple factors, such as maximum yearly potential production rate, seasonal flow variation, reuse rate, type of treatment system, effluent pollution load (TSS, BOD5, N, NH4 and P), the stability of water quality discharged, and current conformity to the requirements established for reclaimed water quality. This last parameter is relevant to understand if there is any WWTP that is prepared for direct reuse without the need to modify its treatment system.
To prospect potential users, namely agricultural, recreational and industrial, an area within a 5 km radius of each WWTP was analysed using remote sensing imagery and territorial management tools. Among all possible reclaimed water uses, these three sectors were chosen because they represent major water consumers, and their demand patterns can be reliably predicted using publicly available data sources. Furthermore, the drought susceptibility of the regions surrounding each WWTP was evaluated using combined drought indicator data [19] to determine the average percentage of days each location was under drought warning conditions throughout the year.
Data were processed and analysed using various tools and software platforms, including R (Version 4.3.2), Microsoft Excel (Version 16.0.14332.20761), Microsoft Power BI (Version 2.132.1053.0), Google Earth Pro (Version 7.3.6.9796) and QGIS (Version 3.34.3).

2.2. Case Study Prioritisation

Given the large number of WWTPs in a region, conducting an in-depth analysis of all facilities is impractical due to time constraints and resource limitations. Therefore, a strategic approach is necessary to select a subset of significant case studies that will allow for a detailed WWTP-user adequation study.
Multiple prioritisation strategies found in the literature can be adopted, but these often require detailed and extensive data that may not be available at this initial stage. Considering the preliminary state of wastewater reuse in Portugal and the urgent need to increase reuse volumes within a short timeframe, this methodology hence focused on aligning potential supply with demand by concentrating efforts on a relatively small number of facilities. Hence, WWTPs were chosen based on two primary criteria:
(1)
Proximity to significant potential users: The presence of substantial water consumers: irrigated agricultural areas, tourism facilities with golf courses and industrial zones within a 5 km radius.
(2)
Reuse capability: Facilities that could consistently supply a sufficient volume of water were prioritised to ensure they contribute meaningfully to water reuse goals.

2.3. WWTP-User Adequation

A streamlined methodology to ensure that WWTP capabilities are matched effectively with user demands is crucial, promoting practical and efficient water reuse solutions. That being said, for each selected WWTP and corresponding users, various possibilities for treatment and distribution systems were calibrated, considering users’ water volume and quality requirements, the WWTP’s reuse potential and need for treatment system adaptation, and the implementation of a distribution system to link both. Figure 1 includes a diagram summarising all foreseen methodological stages and respective required data inputs, which should be provided considering context-relevant information. Essential steps also included reviewing historical data on water quality and quantity, conducting site visits, studying infrastructure design reports, and collaborating directly with municipal bodies and industry and farmers’ associations to better understand the user ecosystem.

2.3.1. User Volume Requirements

Water consumption needs were estimated according to the specific use, whether agricultural, recreational green spaces (i.e., golf courses and parks) or industrial. Ideally, these values should be provided by the users themselves, backed by historical data and future projections considering scenarios like production variations, technical changes, prolonged droughts, and improved supply efficiency.
If user-provided data are not available, agricultural water needs can be estimated using relevant reference values. For this work, we utilized reference crop requirements for dry years, specific to the distinct river basins in the region [20,21,22] and reported cultivated areas [23]. The efficiency of distribution and irrigation systems was considered, assuming 85% efficiency for modern collective irrigation systems, with additional efficiencies of 75% for sprinkler systems and 90% for drip irrigation [20,21]. The expected annual irrigation consumption was calculated using Equation (1), where η represents the water application efficiency:
Consumption   = Water   requirements   ( m 3 ) Efficiency = Net   irrigation   requirements x · Area x ( %   Irrigation   method   y η irrigation   y ) · η   distribution
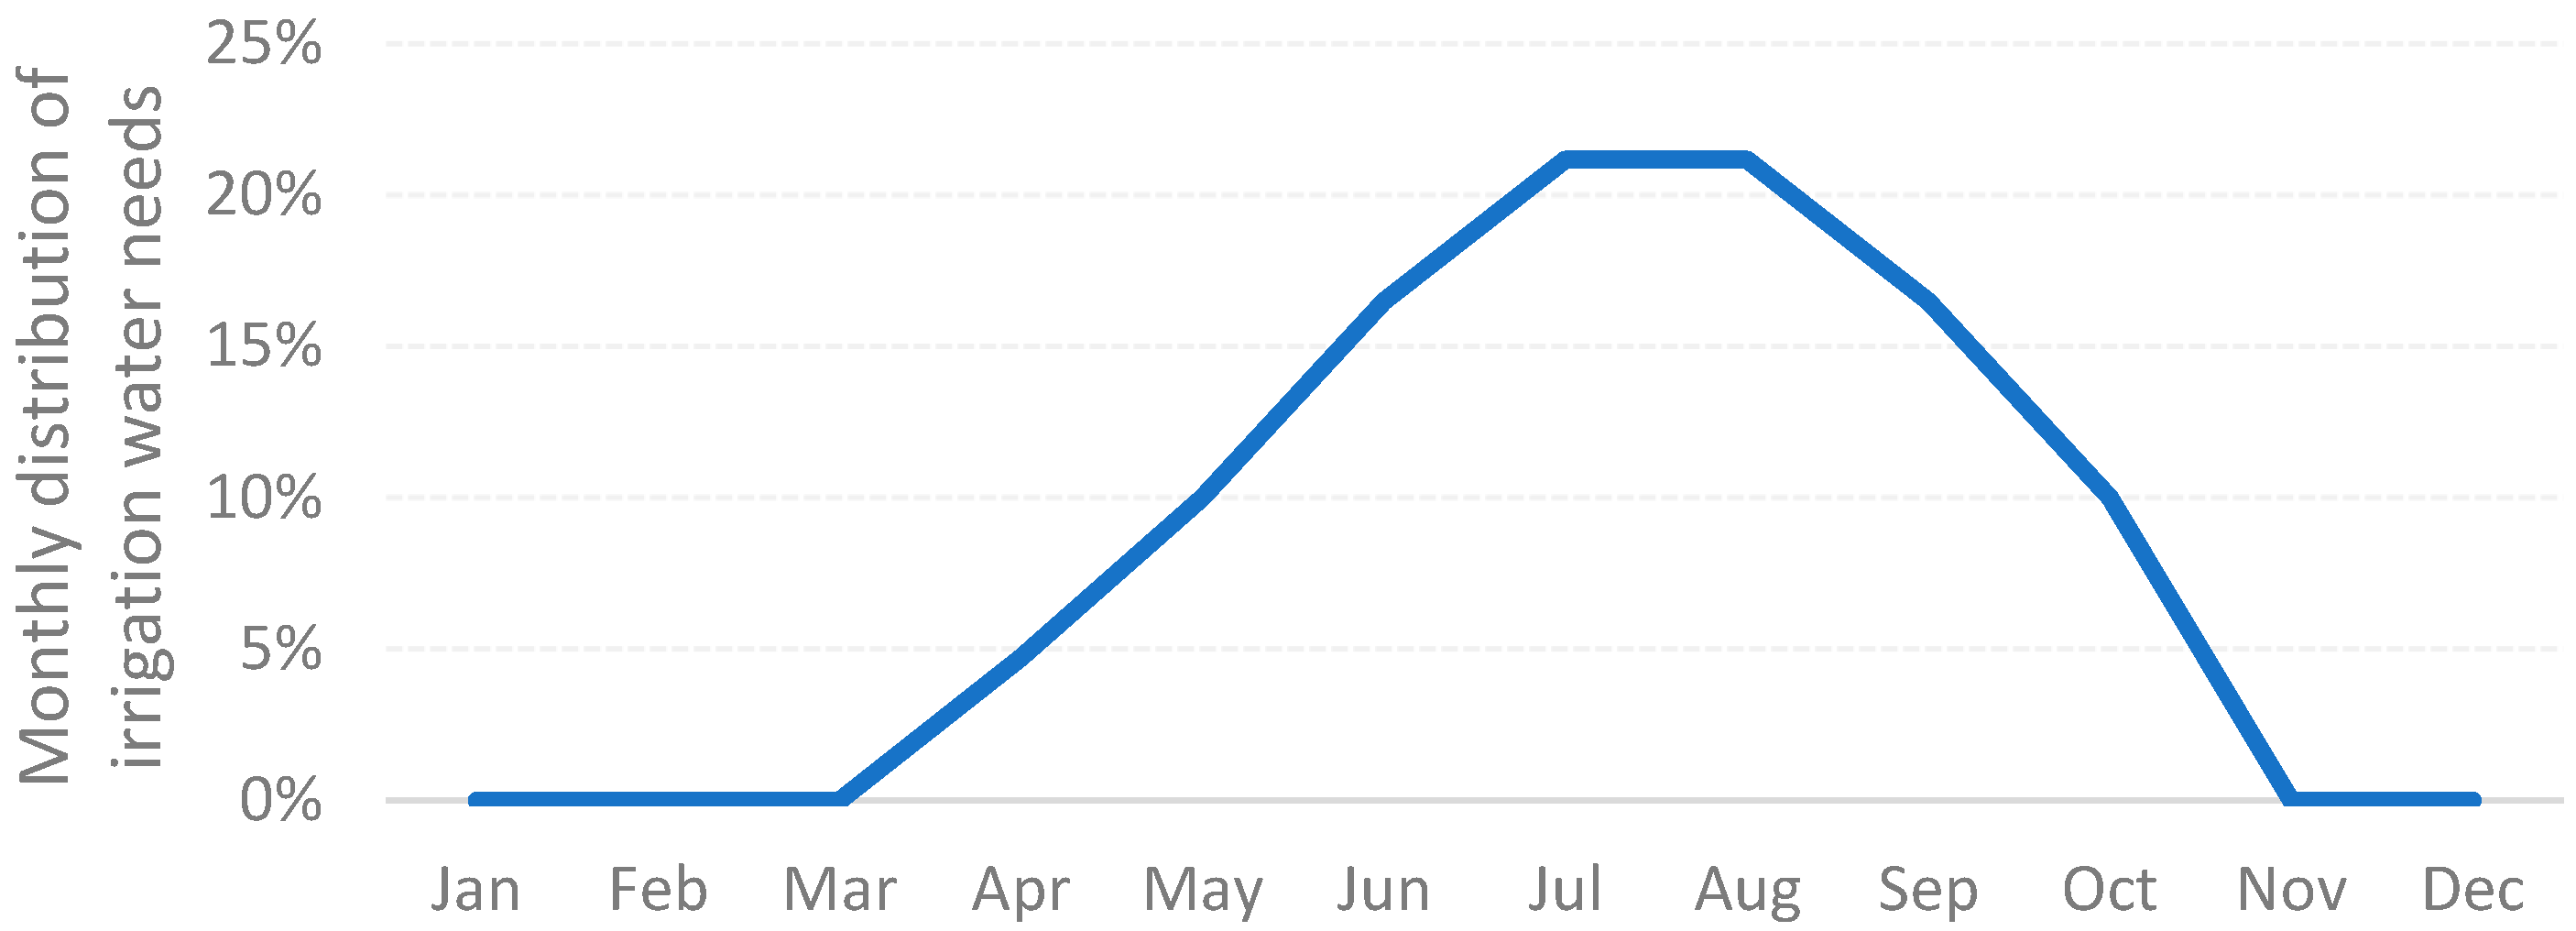
In the studied areas, a variety of crops are cultivated with staggered planting periods, resulting in an extended irrigation period from April to October, with peak demand in July and August (Figure 2).
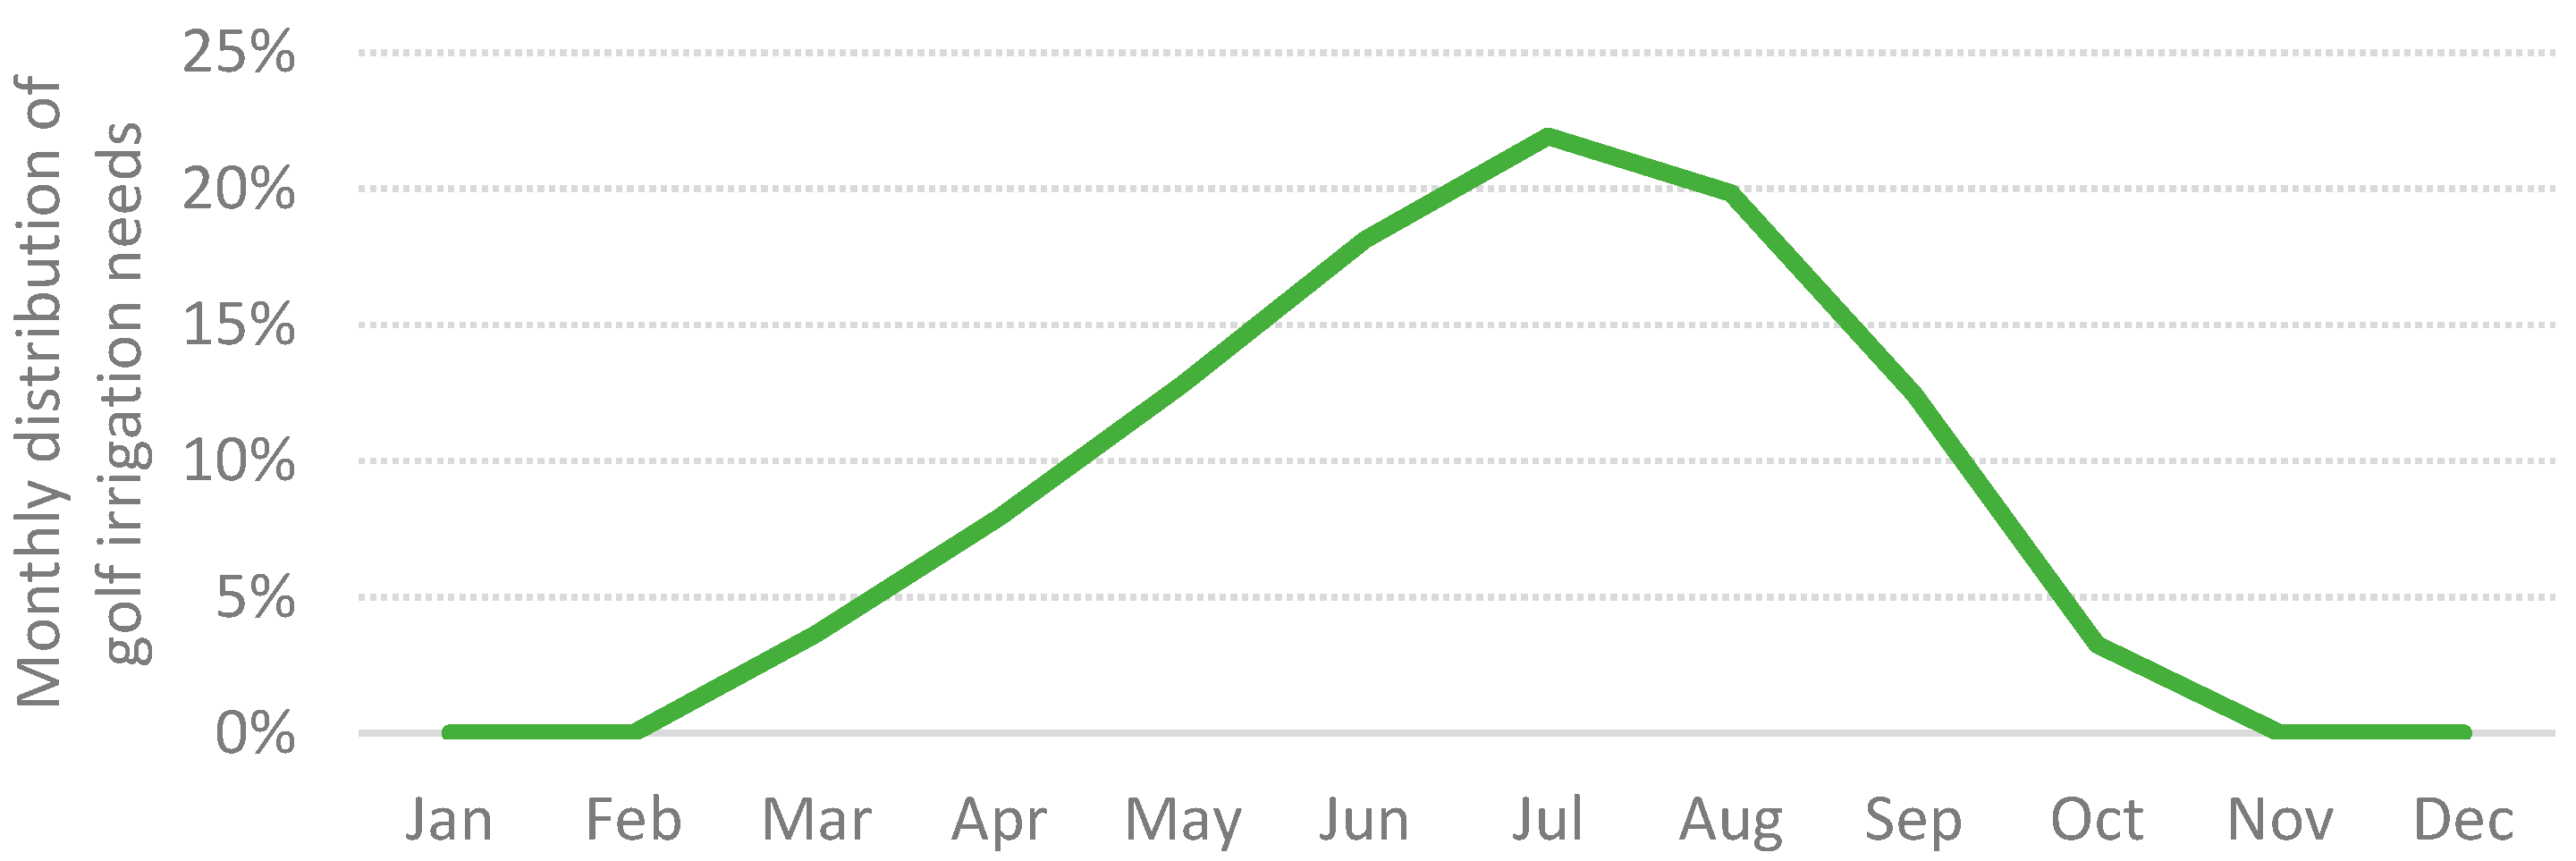
For irrigating green spaces, such as golf courses, reported local average consumption figures were utilized [24], varying from 7084 m3/ha to 10,011 m3/ha, and respective areas were calculated using GIS tools. FAO 56 guidelines for computing crop water requirements (ETo × Kc) − Pe) × Area [25] were used to estimate monthly distributions, considering a crop coefficient (Kc) of 0.8 and effective precipitation (Pe) as the actual precipitation with a runoff coefficient of 50% [26]. Monthly precipitation and evapotranspiration (ETo) values were taken from the river basin management plans [27], resulting in the distribution exemplified in Figure 3.
For industrial uses, consumption data can be more elusive but may be derived from sustainability and environmental impact reports, water abstraction licenses, or direct surveys. In all cases, the availability of water storage infrastructure, such as dams or ponds, should be considered, particularly where such reservoirs are already present. For the case of golf ponds, literature sizing considerations [28,29] can be used to estimate the capacity from remote sensing imagery, using Volume = 1.2 Area.

2.3.2. Reuse Potential

To determine the reuse potential in each scenario, we compared the estimated water needs of potential users with the theoretical reclaimed water (RW) production capacity of each supplying WWTP. This involved calculating the available volume of treated wastewater (TW) (Equation (2)) by subtracting the volume already allocated for external users ( R W e x t e r n a l   u s e s ) and internal WWTP processes ( R W W W T P   u s e s ) from the average received raw wastewater volume, while accounting for a 5% water loss [30]:
A v a i l a b l e   T W 95 %   R a w   W a s t e w a t e r R W W W T P   u s e s R W e x t e r n a l   u s e s Q e c o l o g i c a l   .
Moreover, we considered the maintenance of an ecological flow ( Q e c o l o g i c a l ) for water bodies that rely on treated wastewater discharge to maintain aquatic ecosystems. While ecological needs should ideally be assessed on a case-by-case basis, data were unavailable for the studied basins. Therefore, Tennant’s method was considered, which suggests that a 10% minimum of the river’s average flow should be allocated for ecological purposes [31,32]. For the sake of simplicity, this was approximated as 10% of the WWTP’s average effluent flow due to the significant contribution of the discharge.
The monthly volume of reclaimed water that could be consumed ( U s e r   R W t ) was then calculated by comparing the theoretically available volume from the WWTP ( Available   TW ) with the user’s required volume ( User   Needs ) (Equation (3)):
U s e r   R W t =   Available   TW t ,   i f   A v a i l a b l e T W t   < User   Needs   t User Needs t ,   i f   Available   TW t User   Needs t .
For scenarios involving existing or planned reservoirs, the monthly volume stored in the reservoir ( V   reserv t ) was also calculated (Equation (4)). When the WWTP’s potential production ( Available   TW ) was less than the user’s demand ( User   Needs ), the reservoir supplied the deficit until it was empty. Conversely, when the user’s demand was lower than the available supply, the surplus water was stored in the reservoir until full. The final volume of reclaimed water consumed by the user was determined based on these calculations (Equation (5)).
V   reserv t = M a x ( 0 , V t 1   User   Needs   t   + Available   TW t ) , i f   User   Needs   t   > Available   TW t M i n ( V m á x , V t 1 + User   Needs   t   Available   TW t ) , i f   User   Needs   t   > Available   TW t
U s e r   R W t = Min ( Available   TW t Δ V t ; User   Needs t )

2.3.3. Design Flow

To size the treatment and distribution systems, two scenarios were considered: (I) the reuse capacity always exceeds the irrigation needs; (II) there are months when the reuse capacity does not fully meet the irrigation requirements, necessitating the use of the entire flow for producing reuse wastewater.
In the first scenario, the treatment system was designed considering the maximum daily user needs. The distribution system, on the other hand, was designed for the 90th percentile of daily flow required by consumers, avoiding oversizing and reducing costs. In the second scenario, all the effluent flow from the WWTP is dedicated to reclaimed water production, and the treatment system is designed for the 90th percentile of the daily wastewater inflow, considering only supply months. For the transportation system, the design flow was based on the 90th percentile of reuse potential, excluding other uses (Figure 4).

2.3.4. Quality Requirements

Reused wastewater quality requirements were defined following European and Portuguese legislation, specifically EU Regulation 2020/741 [33] and Decree-Law no. 119/2019 [34] (Table 1). The minimum standards were selected for each consumer based on the type of use and, for irrigation, based on the crops and irrigation method employed. Due to the variability in water quality requirements across different industrial applications, and the limitations in available data regarding specific industrial categories, this study assumed the most stringent quality standard for industrial use. For simplification, and considering the legislated values presented in Table 1, recreational and industrial uses requirements were equated to Class A for agricultural irrigation.
For the treatment system adequation, the quality of treated wastewater was assumed to be equivalent to the maximum values established in the WWTP discharge permit. However, if there were frequent non-conformities for a given parameter, the historic average value was used instead. This approach ensures that the reclaimed water quality meets or exceeds the required standards, guaranteeing its suitability for the intended uses. In case the discharge license did not specify a limit value for a particular parameter, the 90th percentile value of that parameter was used as the baseline, based on data from the past three years.

2.3.5. Treatment System

WWTPs with secondary and tertiary treatment (i.e., nutrient removal) generally meet the minimum physicochemical quality requirements for Class B. Nonetheless, to ensure microbiological safety and successfully supply the treated wastewater, a disinfection step is required. Additionally, a filtration step may be necessary to reduce the solid and organic content, enhancing the effectiveness of the disinfection process and reducing the formation of disinfection byproducts.
To ensure users’ required quality and robustness, six treatment systems were suggested, most to be implemented following the existing treatment stages. Technologies were selected based on a fit-for-purpose approach to maximize water security, even when simpler solutions were defined for situations with lower quality requirements (Class B and C). Hence, the application is dependent on the WWTP historical data (i.e., quality, quantity) and the existing main treatment system, as well as on the user requirements.

Treatment System Proposals

Treatment systems were selected based on a thorough evaluation of factors such as costs (i.e., investment, operational), robustness, complexity, technical readiness and byproduct formation. Disinfection methods such as sodium hypochlorite (NaOCl), chlorine dioxide (ClO2) and UV closed reactors were chosen for their cost-effectiveness and simple dosing. However, in the presence of high ammonia and natural organic matter concentrations, sodium hypochlorite can form chloramines with reduced disinfection power [35], necessitating dose adjustments or the adoption of alternative technologies.
To minimize NaOCl doses and byproduct formation, scenarios coupling UV disinfection and NaOCl were suggested, considering UV’s high efficiency and effectiveness. In case the treated wastewater transmittance was below 50%, chlorine dioxide disinfection was prioritised due to UV inefficiencies in such conditions [36], since low transmittance is correlated with the presence of solid matter that can either scatter the UV light or shield bacteria from UV [37].
Although membrane bioreactors (MBRs) and ultrafiltration (UF) membranes were assessed as filtration technology (for high-quality reclaimed water), conventional disc filtration was selected for particulate matter removal due to its lower operational costs.
The chemical disinfectant doses were defined for a contact time of 30 min, based on literature values [38,39,40], though prior disinfection tests are recommended to adjust dosing for treated wastewater quality (e.g., nitrogen, solid content). If the user is distant enough, the contact will occur in the distribution pipeline, and mixing is guaranteed with the use of static mixers [41]. On the contrary, if the distribution time is less than 30 min, the construction of a contact chamber was considered. For NaOCl dosing and consumption estimation, a 13% w/w concentration was considered, with a density of 1.22 kg/L and 160 g of active chlorine per litre. Chlorine dioxide is formed in situ by mixing equal parts (23.3 L each) of sodium chlorite (7.5% w/v) and hydrochloric acid (9% w/v) [42].
Table 2 showcases the selected treatment system scenarios composed of disinfection, filtration and disinfection, or filtration and double disinfection. The latter solution type addresses the requirement of having a chlorine residue in the supply system to prevent pathogen proliferation.
Scenario A aims only to guarantee the reduction of the microbiologic parameters, assuming that all others are fulfilled. Nevertheless, the relatively high solid content requires high disinfectant concentrations to guarantee the proper disinfection and the disinfection residual, which may lead to an increased risk of byproduct formations, such as organochlorine compounds.
Conversely, scenario B is designed for a WWTP whose treated wastewater requires both solid content and microbiological reductions or, in cases where it is aimed, a lower disinfectant dose due to high byproduct formation risk. The existence of a filtration stage reduces the organic matter to oxidize, therefore reducing the chlorine requirements, when compared to Scenario A, while aiming for the same microbiological reduction.
Scenario C follows the previous rationale, having a double disinfection process (UV and NaOCl), allowing for a chemical disinfectant dose reduction and less expected toxic byproducts. Moreover, in the event of a UV malfunction or maintenance, this proposal provides more flexibility and safety since it is possible to increase the NaOCl dose momentarily, guaranteeing the same microbiological removal. However, this proposal leads to an increase in initial investment and operating costs, associated with the UV equipment.
For scenario D, the disinfection stage is carried out using ClO2, and the filtration stage is retained. This solution is mostly recommended for cases where treated wastewater has reduced (<50%) transmittance or when there is a high risk of byproduct formation since ClO2 can be more effective, as it does not combine with the present ammonia
Unlike previous proposals based on conventional filtration, scenario E utilises UF membranes, which ensure high-quality reclaimed water and follow existing guidance in other regions [43,44,45], for class A production. However, it should be noted that UF is commonly associated with high economic operational burdens due to membrane clogging and high energy consumption [46]. Since UF also removes microorganisms through physical separation, with high effectiveness and efficiency, this proposal’s estimated maximum dose of NaOCl is lower than all the previously mentioned doses.
Scenario F also uses UF technologies, but to reconvert the main treatment system from activated sludge into an MBR. Afterwards, given the high-reliability treatment, there is also a low dosing of NaOCl to guarantee microbiological safety. Although this scenario involves a high initial investment for the reconversion, it offers one of the highest reliabilities with lower operational costs compared to a CAS + UF + NaOCl treatment system [47]. This scenario is of particular importance for WWTPs that have a treated wastewater flow similar to the required water reclaim flow and serve over 100,000 p.e. As per the European Directive 2022/0345/COD proposal [48], they will need to increase treatment standards (including micropollutant removal) by 2030.
In addition to the treatment technologies discussed, adsorption and advanced oxidation were also evaluated for their potential to enhance reclaimed water quality, particularly in scenarios requiring micropollutant removal. For an overview of these options and their application in this study, please refer to the Supplementary Material (Appendix A).

2.3.6. Distribution System

For each case study, multiple distribution layouts were evaluated, including options for installing new pipelines along roadways and repurposing existing pipelines. These options aimed to minimize costs by optimizing the size of pumps and pipes. Elevation profiles, crucial for accurate planning, were obtained using Google Earth Pro.
The flow velocity was limited to a minimum of 0.3 m/s to avoid sedimentation and biofilm growth [49] a maximum of 2 m/s for agricultural uses [50] and 1.5 m/s for other uses [51]. The nominal diameter was parametrized considering velocity limits and the principle of continuity, using values from a list of commercially available diameters (ISO 4427) [52].
Regarding the pumping system, the total head required must compensate for the geometric head, losses along the route (both continuous and localized), and, if necessary, the required pressure at the delivery point. Continuous head losses were calculated using the Gauckler–Manning–Strickler formula. High-density polyethylene (HDPE) pipes were considered, with Young’s modulus of 0.9 GPa and a roughness coefficient of 125 m1/3. Localized head losses in the pipes were considered by applying a 10% increase to the calculated value.
Moreover, it was ensured that the pressure in the pipeline remained positive and below the nominal pressure at all points along the route, using a 1.5 safety factor. Hydraulic shock scenarios were here considered, simulating the pressure increase caused by the waterhammer using the Joukowsky equation. Finally, different combinations of DN and Hm values were iterated, considering pressure and velocity limitations, until optimal unit costs were achieved.

2.4. Risk Analysis

Given the variable composition of treated wastewater and its potentially high concentration of natural organic matter and nitrogen, the presence of disinfection byproducts must be monitored. Furthermore, it is vital (and mandatory) to regularly evaluate the composition of reclaimed water, especially in circumstances of direct contact with living beings or potential food adsorption. To analyse the different scenarios proposed in terms of their potential risk to consumer health or the environment, a semi-quantitative risk analysis was proposed, following the World Health Organization (WHO) methodology [53], focused on analysing and preventing risks in water reuse systems.
For each scenario proposed for a WWTP, dangerous events should be identified and evaluated based on severity and likelihood, considering the type of contact (e.g., direct/indirect, continued/discontinued). Once the dangerous events and descriptors are identified, the risk value is quantified (Risk = Probability × Severity) and categorized as High, Average or Low. This methodology provides an initial analysis, acknowledging the scarcity of comprehensive hazards and risk management databases for reclaimed water consumption. The authors are aware of the need to develop a more detailed risk assessment that covers the entire life cycle of both reclaimed water production and consumption, identifying the hazards not only for users but also for operators involved in the production systems. For that purpose, it is crucial to identify which microorganisms and chemical compounds might be responsible for health impacts and perform afterwards a detailed epidemiological assessment that supports the determination of the severity criteria.
This risk analysis helps define which treatment processes minimize usage risks based on the designated uses for the reclaimed water, as well as determining which containment barriers can be suitably applied for risk mitigation, thereby increasing confidence among the users and ensuring healthy operation at the production facilities. Although the problems associated with disinfection inefficiency may lead to possible health effects (due to the presence of bacteria in treated wastewater), these risks may be mitigated by applying containment barriers (e.g., changing the type of irrigation, using reclaimed water only during periods when the installation is closed) or other measures. Therefore, more steps in the treatment system lead to a safer product with fewer malfunction risks due to the multibarrier containment.

2.5. Cost Analysis

The total costs associated with a water reclamation project are determined by a complex polynomial equation, reflecting various site-specific factors. These costs are influenced by the size of the project, distance from the water source, water quality requirements, regulatory mandates, selected treatment systems, and the need for pumping and storage. Additionally, external costs such as land acquisition, environmental mitigation, and the availability of subsidies play a significant part.

2.5.1. Investment Costs

Capital expenditure (CAPEX), in this study, encompasses the investments required for both the treatment systems and the distribution network, accounting for equipment, civil construction and project design.

Treatment System Costs

Cost functions for the investment costs of treatment equipment were estimated based on a comprehensive sampling and analysis of current market prices and trends, utilising cost data obtained from multiple international suppliers through formal and informal consultations (Table 3). These cost curves accounted for the scaling of equipment and economies of scale, providing a more accurate estimation for projects of varying sizes.
The previous information helped fill an existing knowledge gap. Although the market prices are volatile and dependent on many variables, these cost curves allow the scientific community to predict an order of magnitude of prices of equipment used in water treatment systems.
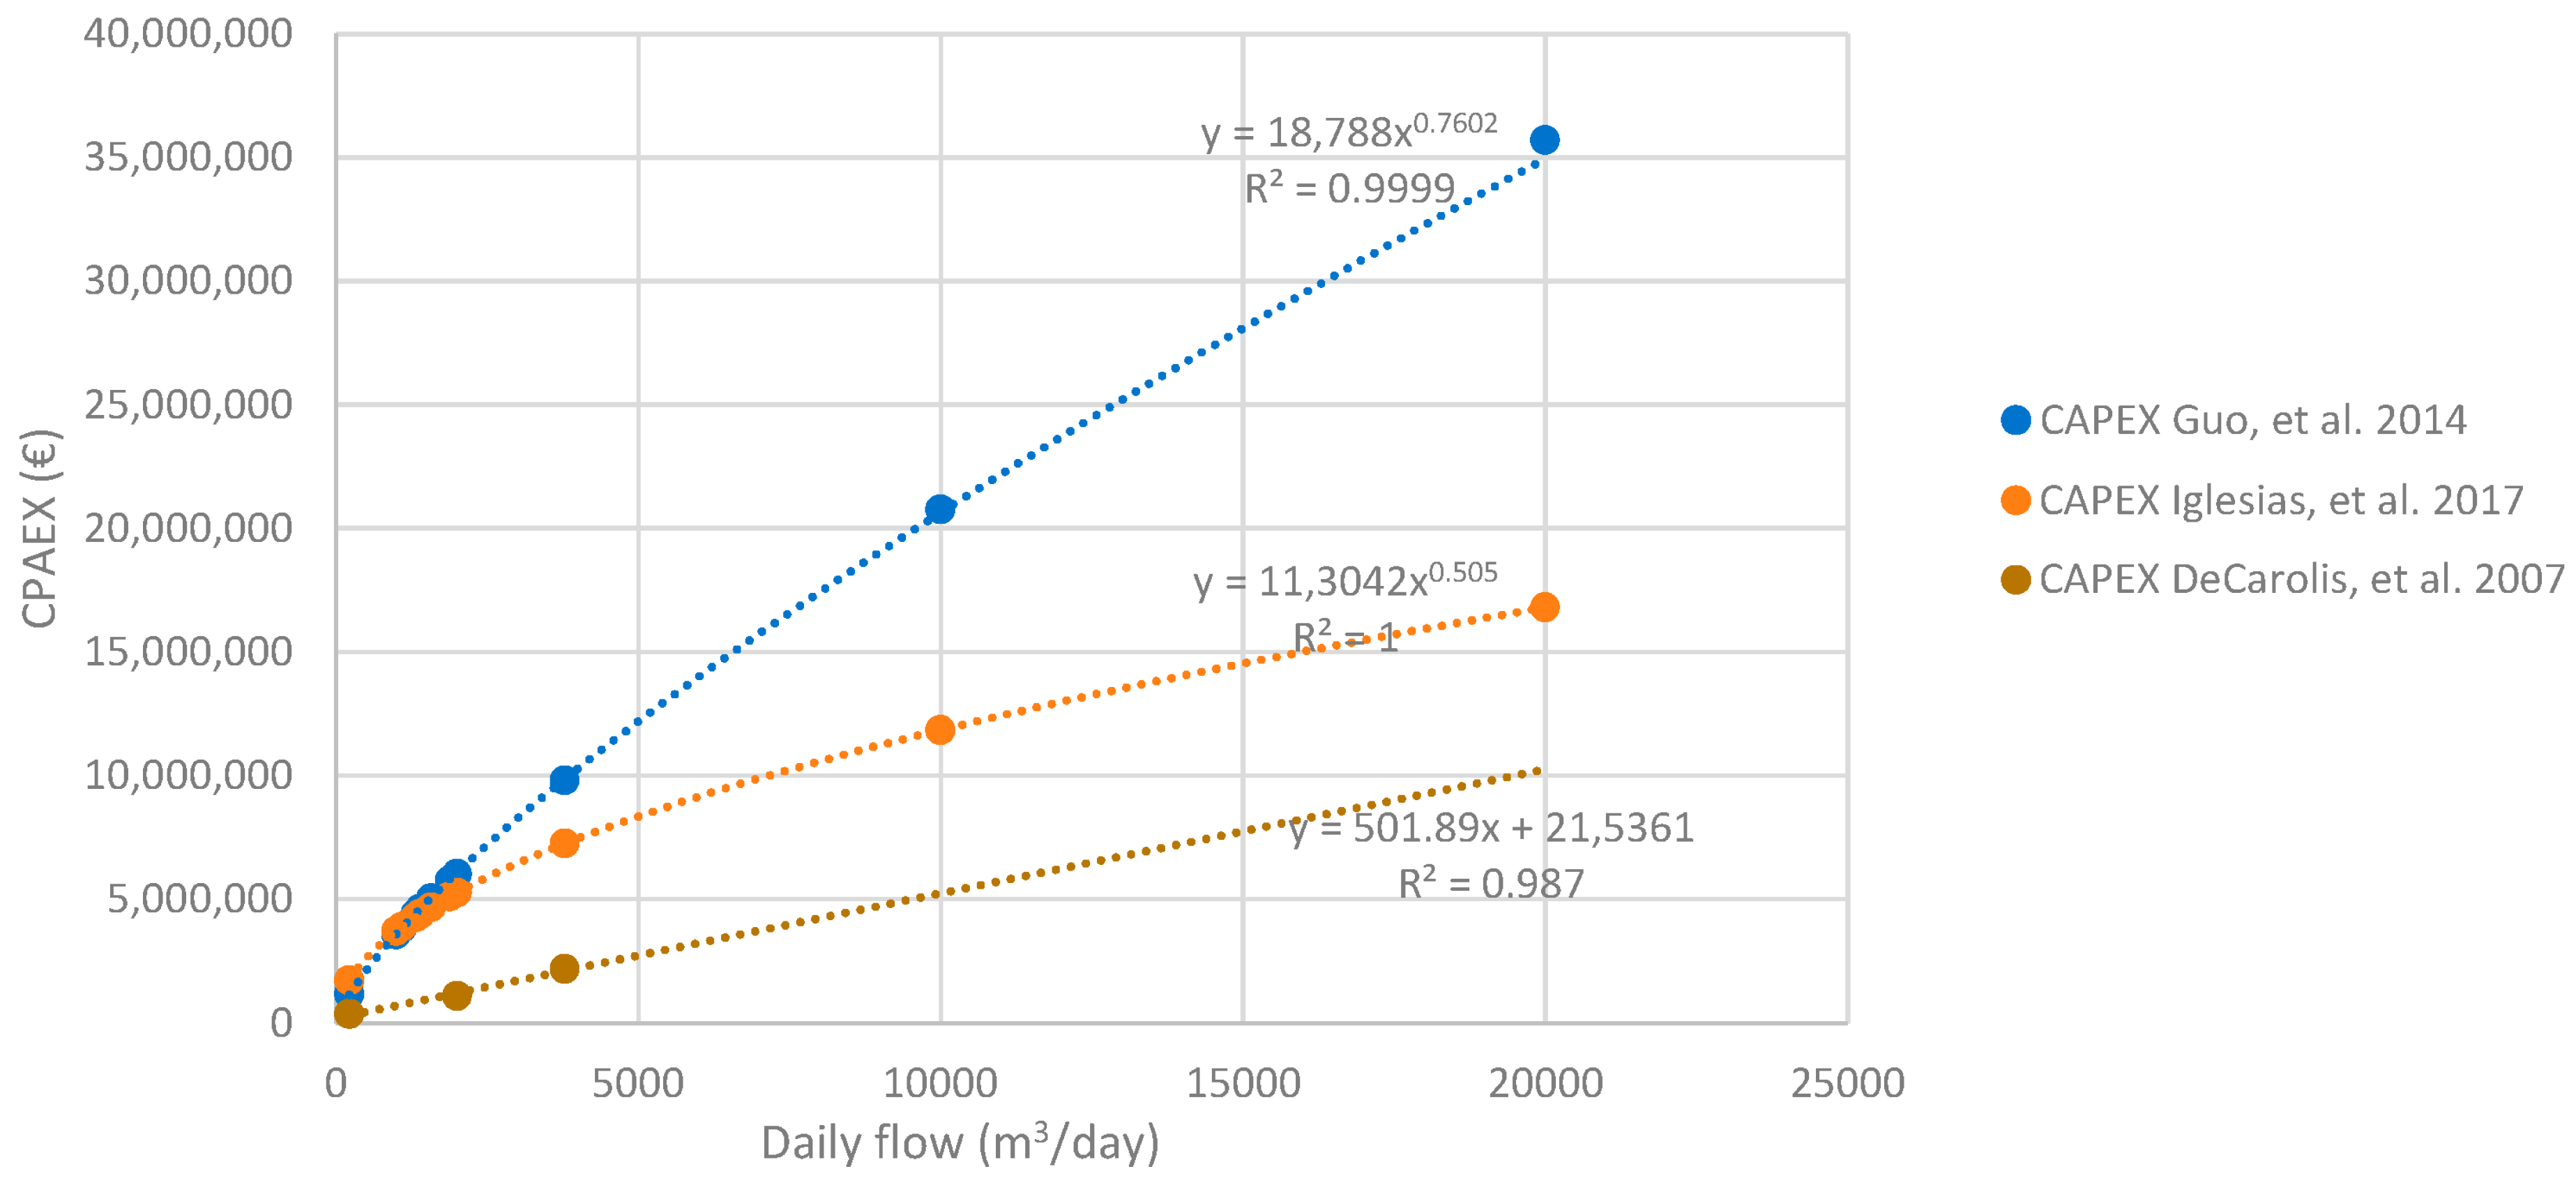
In contrast to other studied technologies, MBRs require a significant overhaul of the existing treatment system, usually involving dismantling or repurposing of current infrastructure. With this in mind, MBR cost dynamics were taken with a distinct approach, focused on the review of cost functions in the literature [54,55], reported costs [56], and market estimated budgets, adjusted for inflation (Figure A1 in Appendix B). For the regional study, function CAPEX = 501.89Q + 215,361 was selected, where Q represents the design daily flow. This was deemed more adequate for the context, despite not reflecting the typical scale effect reduction seen in large projects, in which case the function should be used with caution.
In addition to the investment costs for treatment equipment, other essential expenses related to the construction and installation of infrastructure were considered (Table 4).

Distribution System Costs

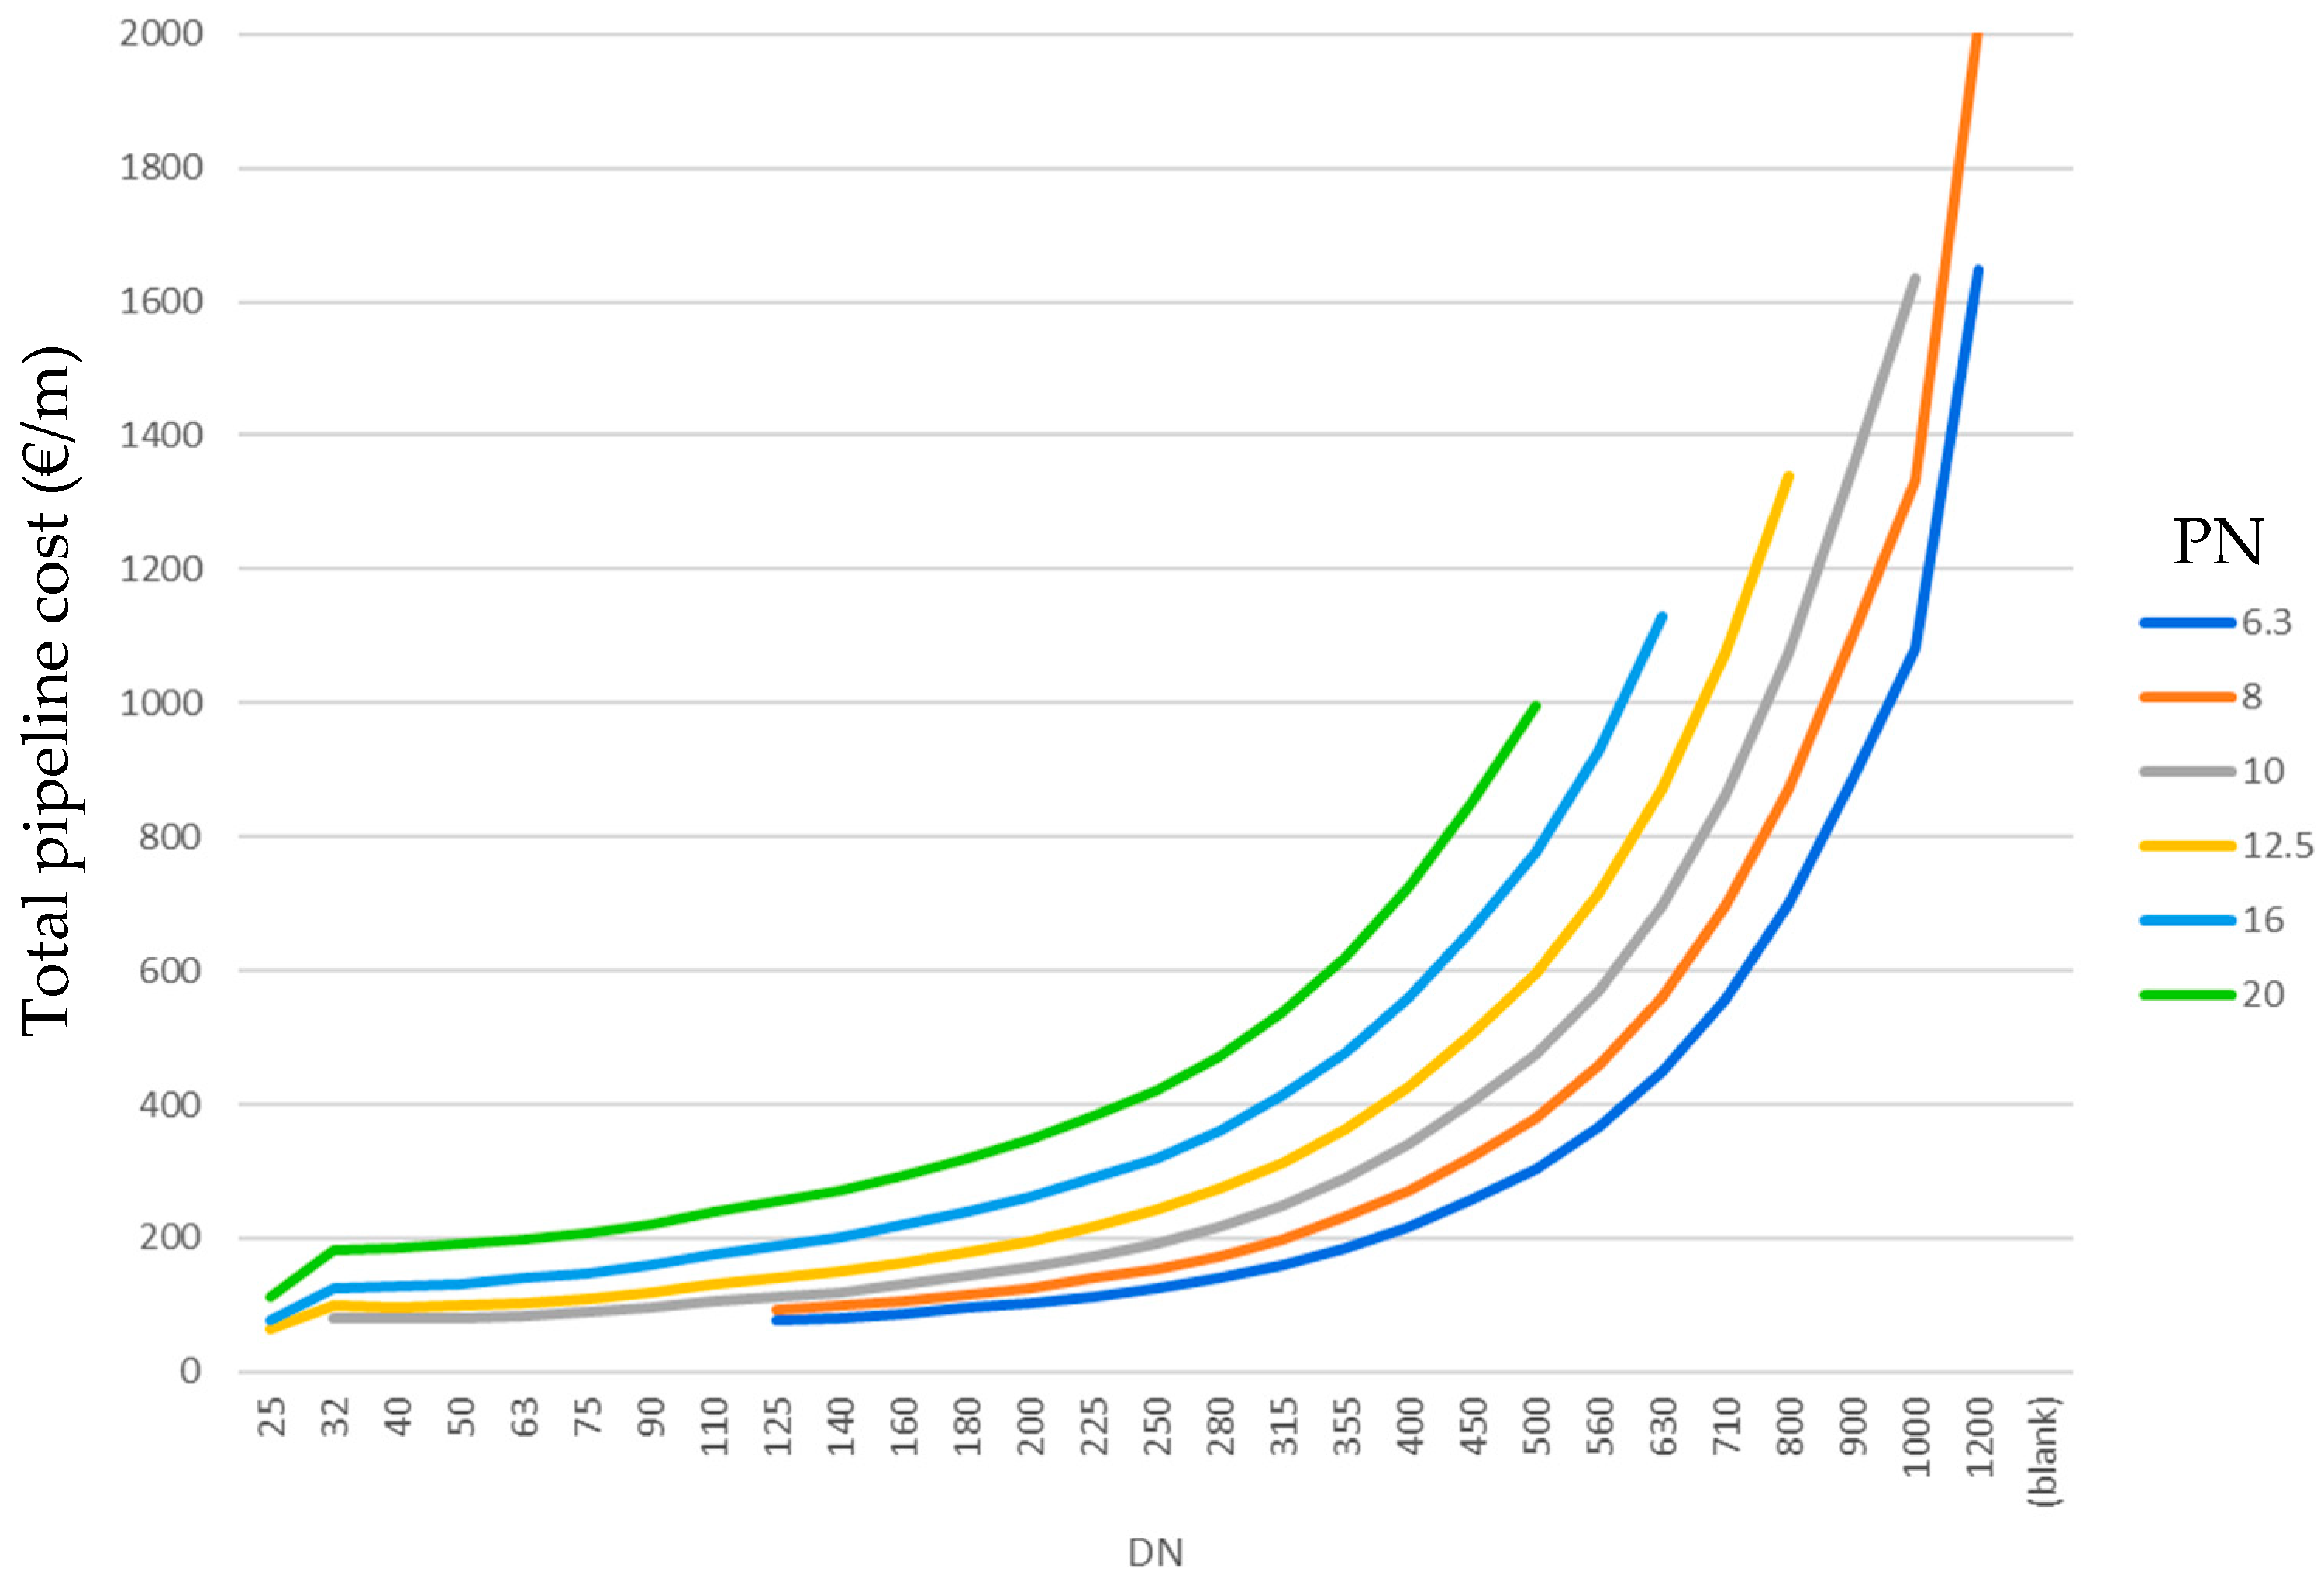
Distribution system investment costs are primarily associated with the installation costs of the pipeline and the construction of the pumping stations. For the pipelines, the total cost per unit length was estimated based on the nominal pressure (PN) and nominal diameter (DN). This estimation was performed by extrapolating an existing cost function for PN = 10 (covering both piping and installation/construction) [57] to other PN, using market prices for HDPE pipes based on both DN and PN and resulting in the cost function outlined in Equation (6) and shown in Figure A2 in Appendix B.
C o s t   p i p e l i n e   m = 5.134 + 9.281 × 10 2 × D N 2.036 × 10 4 × DN 2 + 2.512 ×   10 7 × D N 3 + 1.059 × P N 6.55 × 10 2 × P N 2 + 1.25 × 10 3 × P N 3 1.511 × 10 2   × P N × D N + 1.18 × 10 4 × D N 2 × P N + 5.515 × 10 4 4 × P N 2 × D N 0.8357 + 0.8385 1 + e 1.7347   ln D N 5.7478
The construction cost of the pumping stations was derived from a regression curve of data collected between 2005 and 2020 in Portugal [57,58], shown in Equation (7), which includes, in addition to the pump, other equipment (e.g., valves, piping), electrical installations and construction costs. P indicates the pump hydraulic power, in kW.
C o s t p u m p i n g   s t a t i o n   = 66   394.53   P 0.3081

Further CAPEX Considerations

In addition to the mentioned expenses (equipment and civil construction), CAPEX calculations also considered the cost of electrical installations (10% of the treatment system equipment cost) and project costs, such as start-up costs (2% of costs for equipment, electrical installations and civil construction) and the development of safety, health and environmental management plans for the construction site (4.5% of civil construction costs).

2.5.2. Operational Costs

Operational expenditure (OPEX) considered costs of energy (treatment and distribution), quality monitoring, reagents, maintenance and human resources. Reagent costs considered consultations with suppliers, internal procurement records and analysis of values on public contracts in Portugal, resulting in the estimate in Table 5.
The cost associated with personnel used AdTA salary tables and considered that each main area of intervention (two in total for the region) required one graduate technician, two operators and one maintenance-specialized technician, in a total of EUR 105,985 annually.
The amount dedicated to monitoring was based on internal procurement cost records per chemical and microbiological parameter, as well as the minimum frequencies outlined in national and European legislation for BOD5, TSS, E. coli and Legionella spp. (for aspersion irrigation) [33,34]. In addition to these parameters, irrigation with reclaimed water should also consider the monitoring of ammonia, total nitrogen, and total phosphorus. In this case, as minimum frequencies are not pre-determined, two monitoring typologies were assumed: (a) frequent nutrient monitoring in case reclaimed water irrigation is intended to replace fertilizers; (b) occasional nutrient monitoring whenever these are no critical parameters, resulting in the costs in Table 6.
For energy costs, it was considered an expense of EUR 163.2/MWh, which entailed the average cost expected under the time-of-use electricity tariff practised in 2023. Moreover, and following energy neutrality commitments, photovoltaic energy self-production was contemplated for facilities where installation of solar panels is feasible, considering a cost of EUR 10/MWh for maintenance and operation. Table 7 presents the estimated electrical power of the proposed equipment, following consultation with suppliers. For distribution, required pumping power considered typical design efficiency values of 75% for the pump and 80% for the motor.
Lastly, annual maintenance costs were estimated at 2% of the initial equipment cost and 1% of civil construction costs.
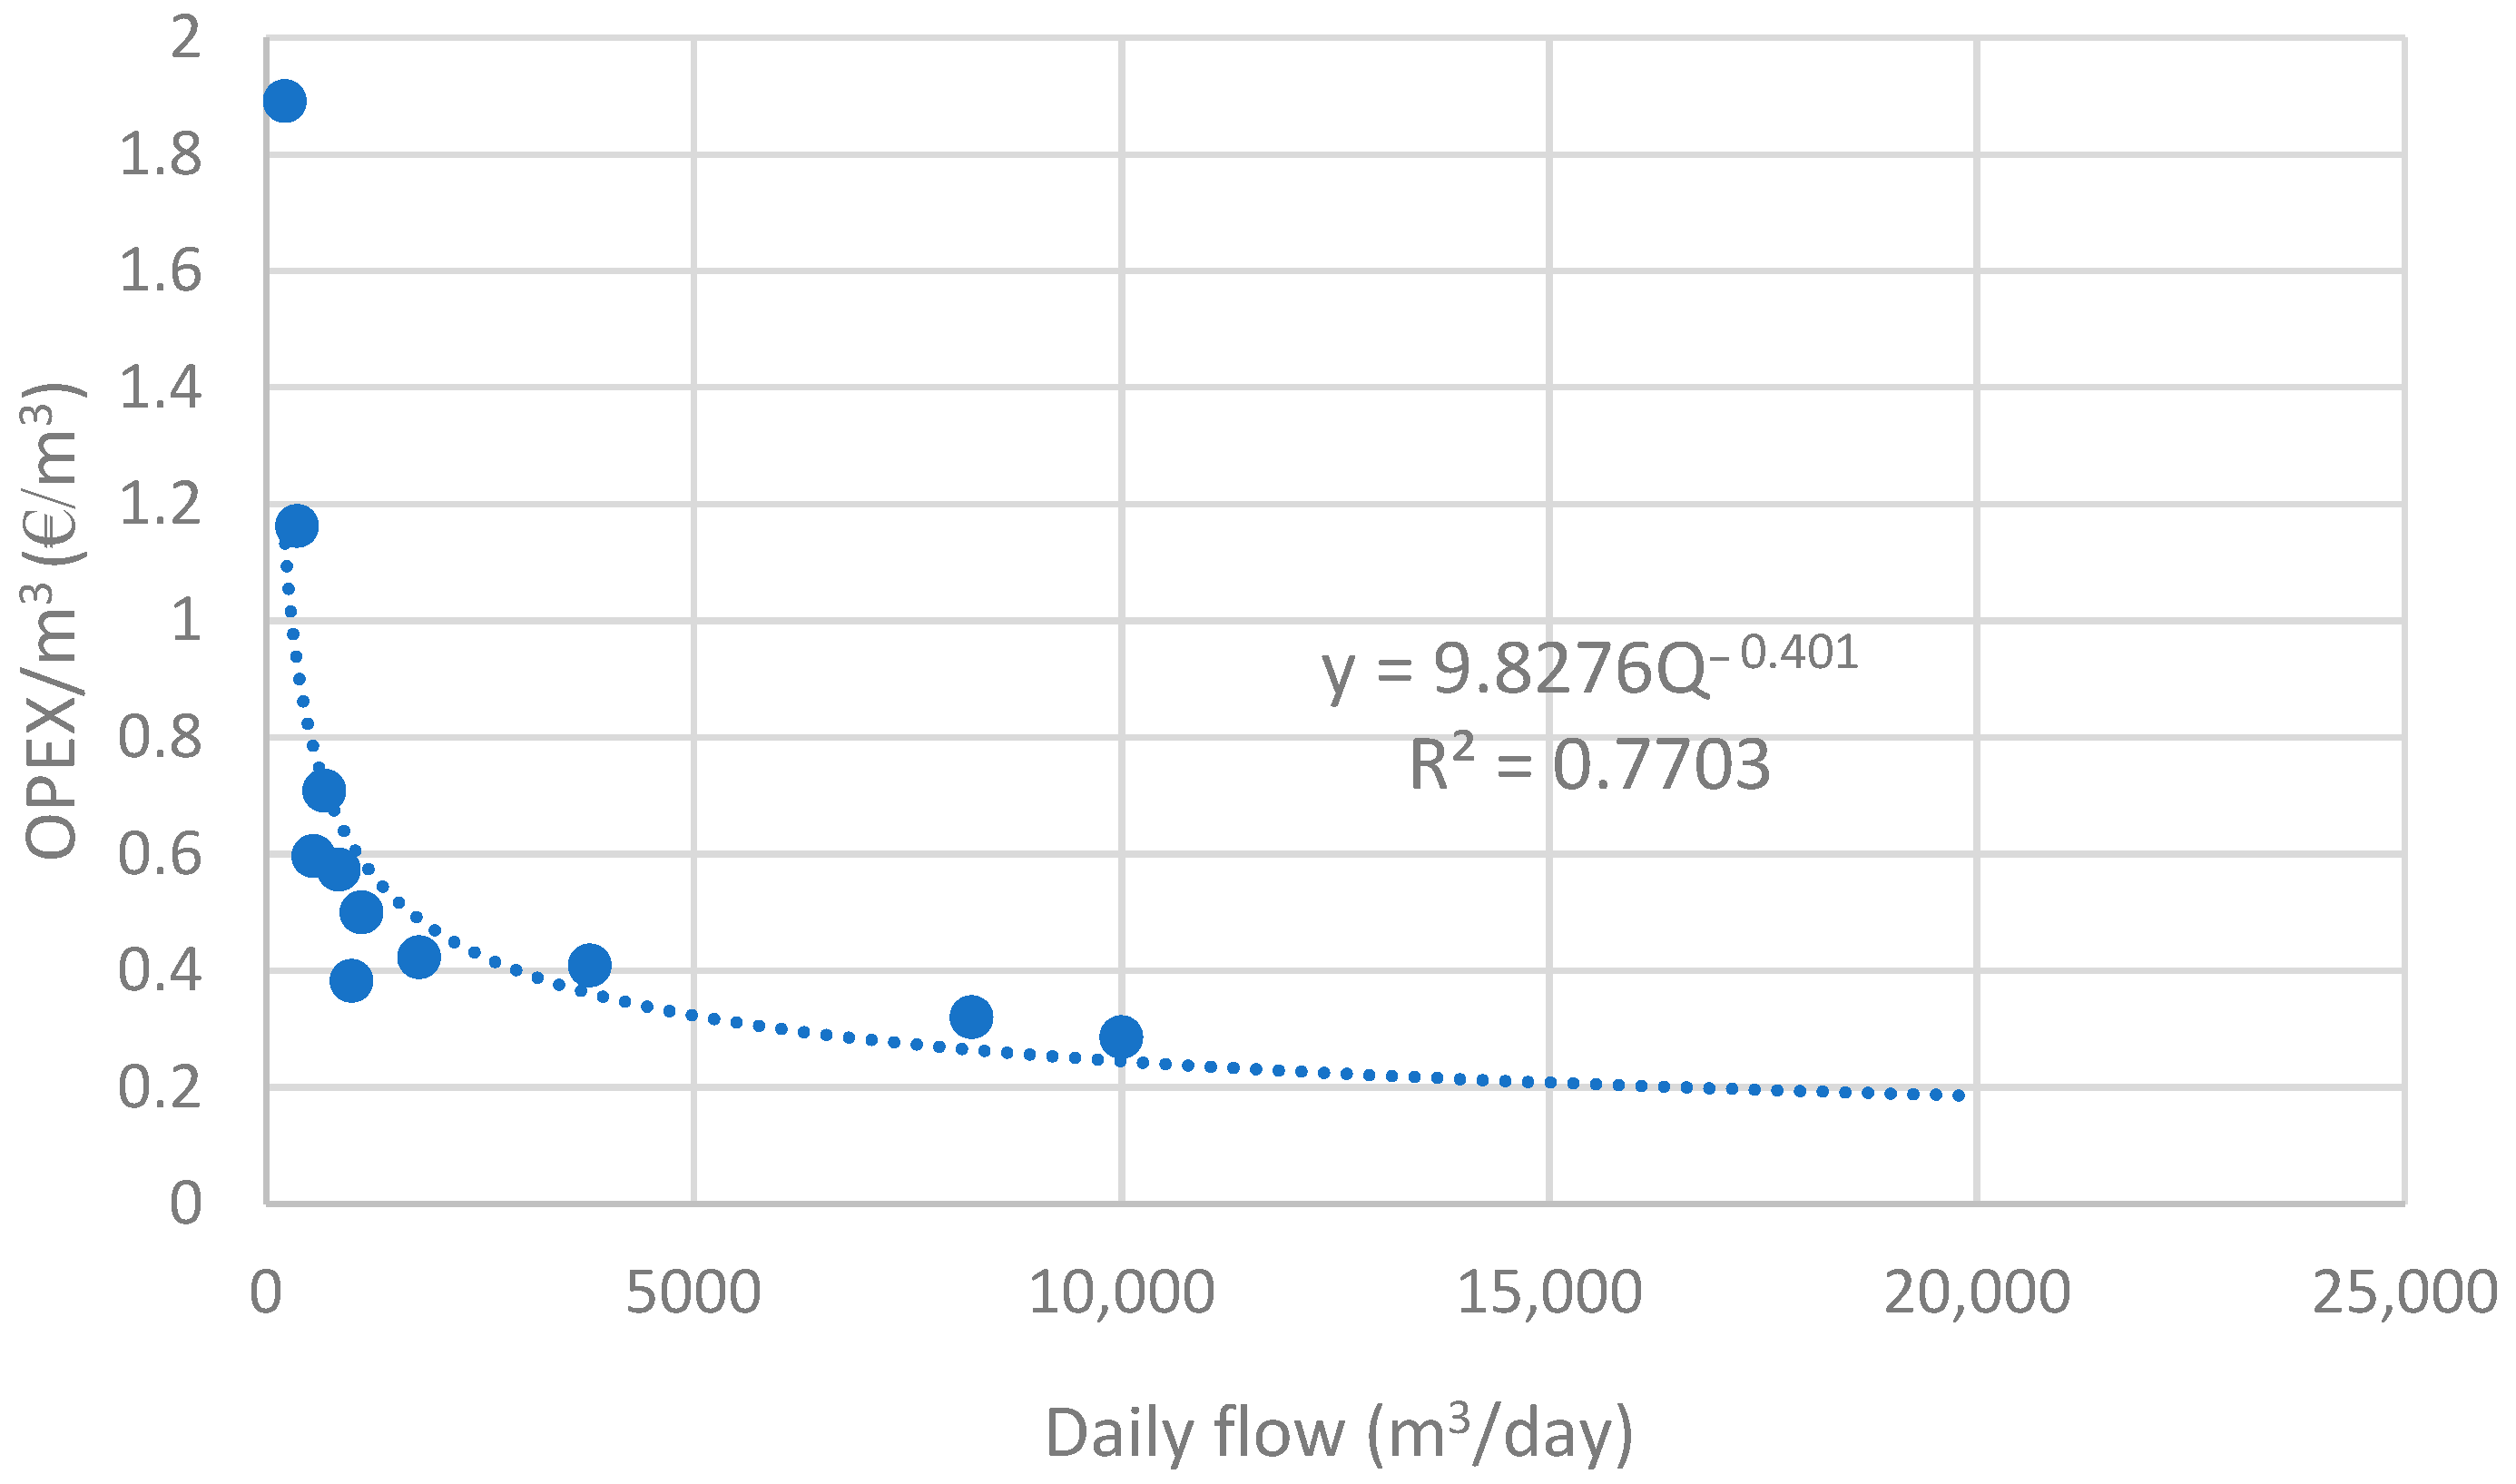
For the specific case of MBRs, operational costs were estimated separately using literature data [50,51,52] (Figure 5). Despite high operational costs, mainly due to energy expenses, comparisons with other treatment systems should consider that MBR OPEX values already include secondary treatment, which should be covered by wastewater user fees. Furthermore, following previous research findings, the resulting cost function was increased by 10% to cover membrane replacement every 10 years.

2.5.3. Unit Costs

Unit cost calculation (EUR/m3) was based on a 30-year planning period, with a 6% discount rate. It included the replacement of equipment—both for the treatment system and for the distribution pumps, every 15 years. Inflation rates were factored in, using sector-specific average values from 2010 and 2021: 1.8% for human resources, 3.8% for energy and 1.6% for infrastructure, reagents and monitoring [59,60]. Additionally, unit costs also accounted for a 10% tariff update every 5 years.

2.6. Calculator Tool

To facilitate the estimation of costs for WWTP reuse projects, we have developed an Excel-based calculator tool, available as Supplementary Material. This calculator is designed to help users apply the methodology and values discussed in the previous sections, ensuring accurate and consistent cost assessments.

3. Results and Discussion

3.1. Regional Characterization of Wastewater Treatment and Reuse

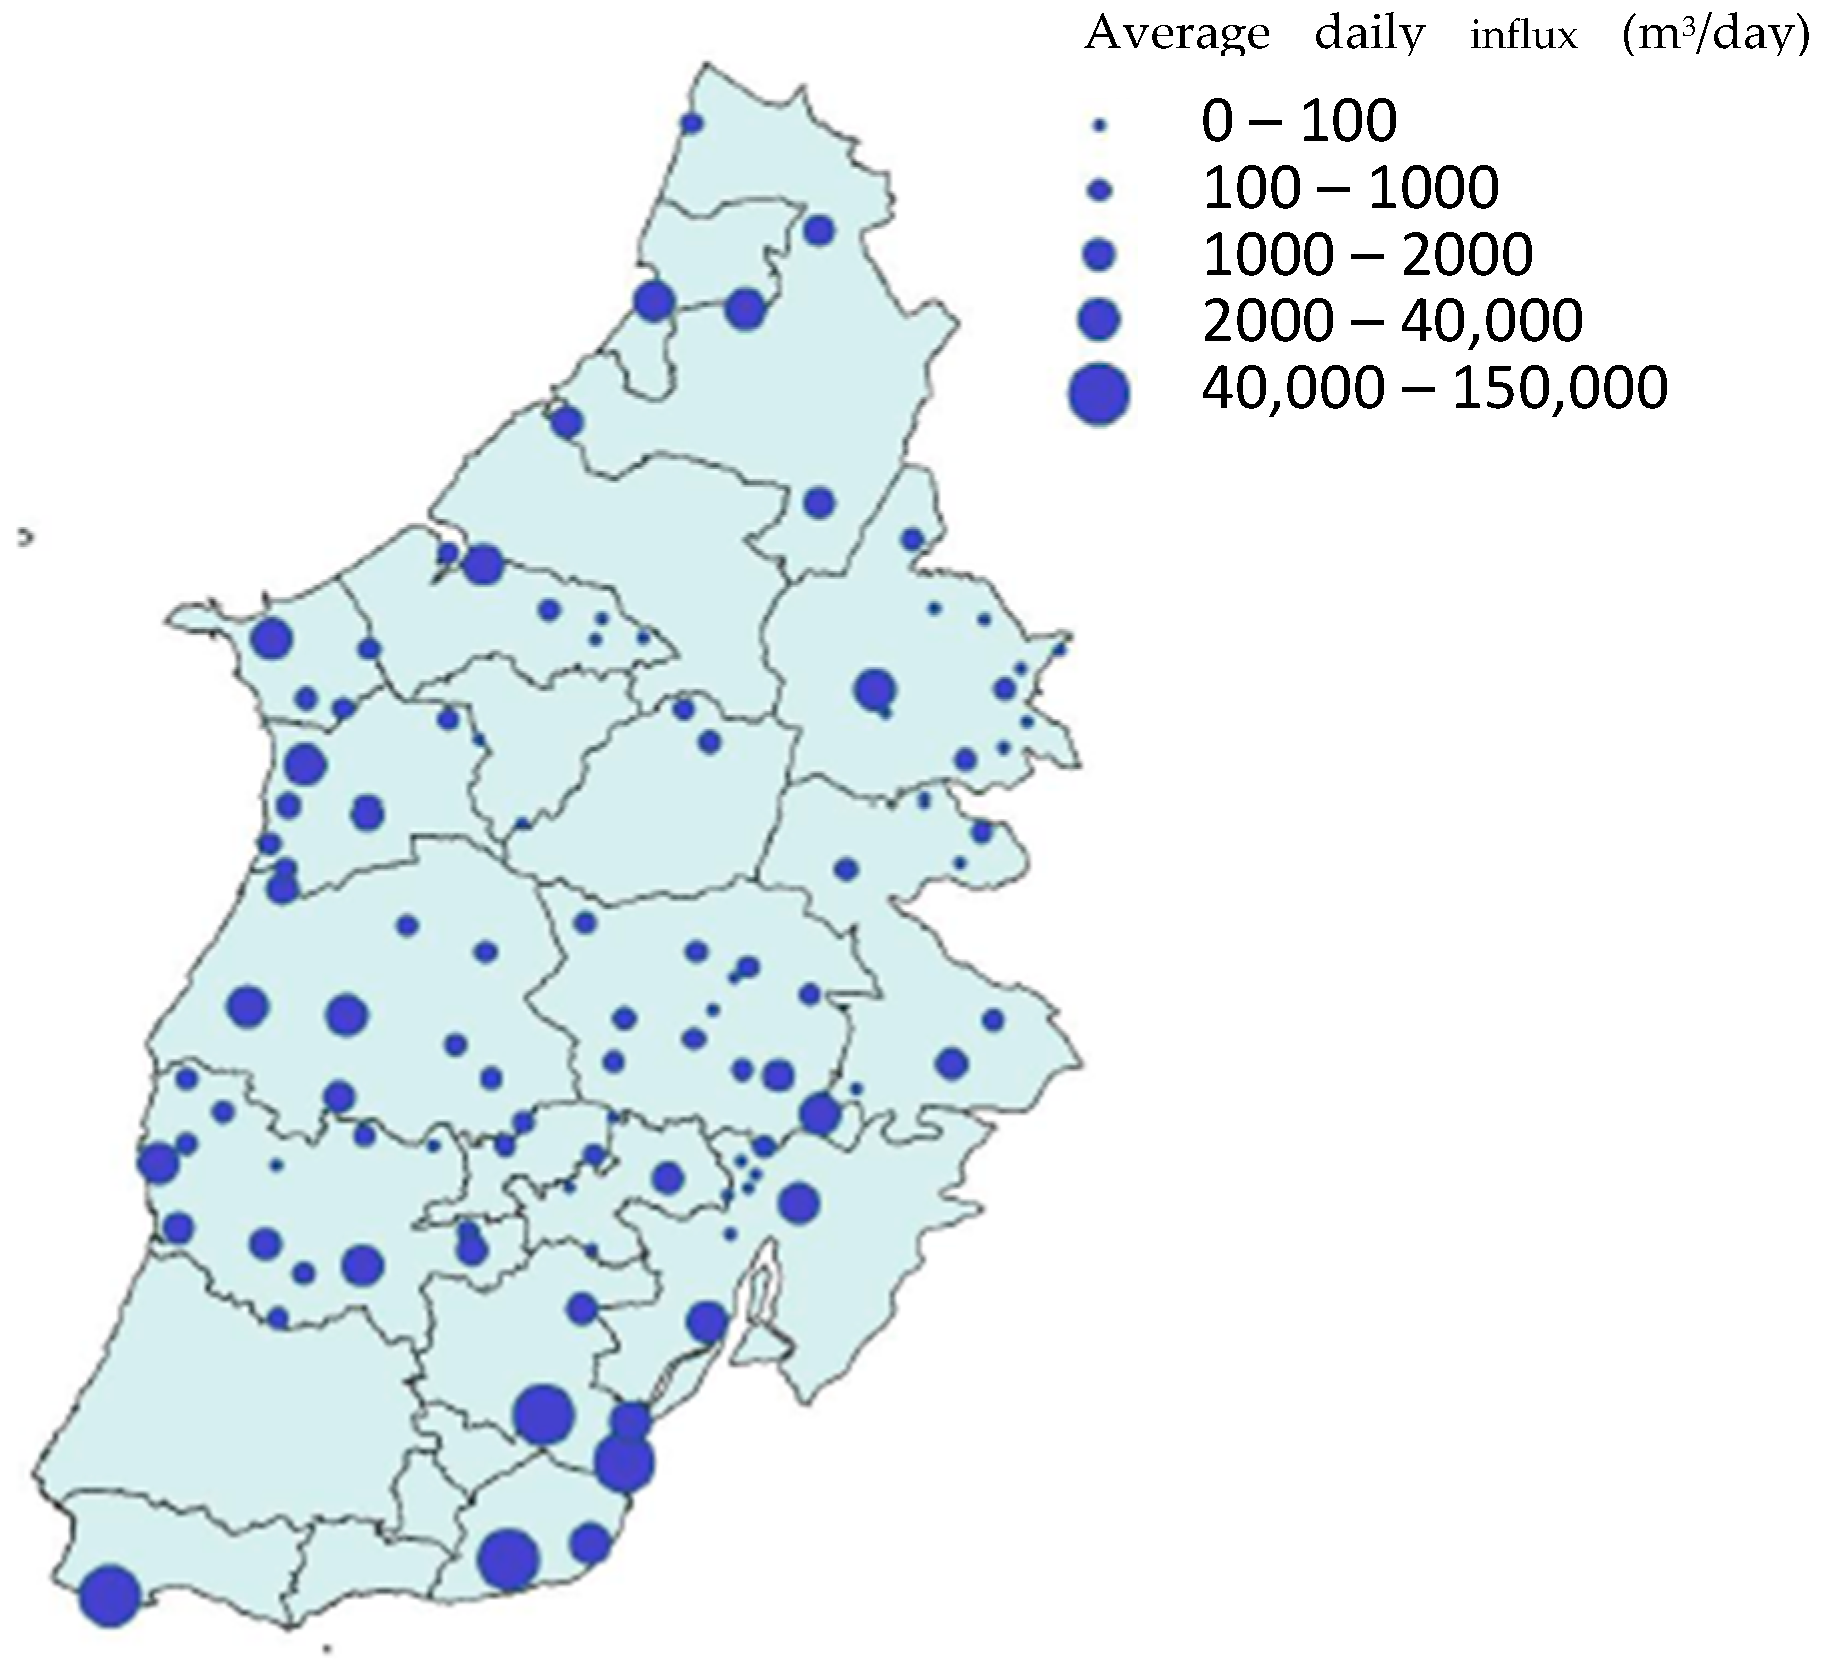
To provide a comprehensive understanding of the wastewater treatment landscape, all 100 WWTPs managed by AdTA (Figure 6), the main wastewater utilities in the area, were characterized, considering data until 2023. This assessment revealed key insights relevant to the prospective water reuse in the region.
Scale: The analysis showed a predominance of small-scale facilities, with 60% of the WWTPs treating less than an average of 500 m3/day and 27% handling less than 100 m³/day. This indicates a limited potential for large-scale reuse from many plants and shows that the focus should go to local reuse opportunities.
Drought Susceptibility: CDI data indicated that around 90% of the WWTPs were in drought-prone areas, experiencing warning conditions for more than 17% of the analysed period. Less drought-affected regions are predominantly located along the coastal strip. This scenario is anticipated to worsen due to climate change, which is expected to increase the frequency and severity of droughts, further challenging water resource management and justifying reuse efforts.
Water Discharge and Indirect Reuse: Most WWTPs (90%) discharge treated wastewater into surface water bodies such as rivers and streams, and a minority discharge into lentic environments (1%) or through soil infiltration (1%), all contributing to indirect reuse, aquifer recharge, or maintaining ecological flows, particularly in temporary rivers. About 8% discharge into estuaries or directly into the ocean. Although this represents a small fraction of the total number of plants, it corresponds to a significant 72% of the total wastewater treated where indirect reuse is not feasible.
Flow Seasonality: Combined sewer systems were shown to lead to great flow variability, tendentially with higher flows during rainy seasons, creating a pattern of availability inverse to typical irrigation demands. While this increased the hydraulic load, the studied WWTPs had enough idle capacity to handle such hydrological events, as just a slight increase in total solids was observed. Nevertheless, WWTP water reuse planning must be integrated with water-sensitive urban designs [61] and nature-based solutions for stormwater management [62]. In addition, reclaimed water production should be halted during intense precipitation phenomena if effluent quality is compromised, underscoring the importance of water quality monitoring.
Treatment Processes and Water Quality: Most WWTPs use secondary biological treatment processes, with 77% employing activated sludge systems. Smaller WWTPs utilize traditional lagooning (9%) and trickling filters (7%), while biological disc treatment and constructed wetlands are less common. Disinfection methods such as UV radiation or chemical chlorination are used in approximately 40% of the plants, covering 16% of the effluent. Currently, half of the facilities do not produce reclaimed water, particularly those using lagoons, biological discs, or constructed wetlands. Overall, only 1.3% of the treated effluent is reused, primarily for internal processes, with 11–13% provided for external use, totalling around 300,000 m3 annually.
Compliance Issues and Reuse Potential: Theoretically, according to the discharge license, 50% of the WWTPs (representing 70% of the flow) should have an effluent quality that could meet Class B standards with only additional disinfection. In practice, some quality non-conformities were observed, reducing this availability to around 40% of the volume, and highlighting the need for rigorous monitoring and potential adjustments in treatment processes. It should be noted that only physicochemical parameters, specifically BOD5 and TSS, were considered in this assessment. Most of the observed non-conformities pertained to surpassed limits of TSS (10% of WWTPs) or both TSS and BOD5 (12%), which indicates areas where targeted process adjustments could enhance compliance and reuse potential.
Prospective Reuse Applications: The majority (94%) of WWTPs are near agricultural or rural areas, indicating a strong potential for irrigation use, although land parcels are often small and fragmented. However, these only represent a third of the treated wastewater volume. Half of the WWTPs are near urban areas and process significantly higher volumes—on average 25 times more—than those in non-urban areas, indicating a higher capacity for reclaimed water production. Only 38% are near industrial zones, with sparse industrial units.
Challenges and Opportunities: Seasonal variation in inflow, particularly high during rainy periods, affects the potential for irrigation reuse during periods of peak demand. This necessitates infrastructure adjustments such as increased storage capacity to balance supply and demand throughout the year. The potential to produce Class B reclaimed water with minimal additional treatment is significant, particularly with the addition of disinfection stages. However, a substantial portion of treated effluent is discharged into the ocean, representing a missed opportunity for reuse. Addressing non-compliance issues and improving pre-treatment processes where necessary will enhance the overall reuse potential.
The data-driven regional analysis allowed for the identification of several key characteristics of wastewater reuse in the region that limit the application of reclaimed water projects and should form the basis of strategic planning. This highlights the importance of a thorough characterization of the current state before progressing to a study of potential reuse, ensuring that all relevant factors are considered.

3.2. Case Study Results

Eight facilities were selected to validate the methodology based on their potential to supply significant volumes of reclaimed water (Charneca, Turcifal, Atouguia da Baleia, Rio Maior, Vila Franca de Xira, Alverca, Fervença and Nazaré). The selection criteria were based on proximity to high-demand users, average daily inflow, and the capacity to adapt existing treatment processes for reuse purposes. The methodology enabled the calculation of the maximum reuse potential for each WWTP considering user needs as well as volume and storage limitations, as presented in Table 8. Overall, the implementation of reuse projects at these WWTPs could contribute an additional 9 hm³ annually, representing an increase in AdTA’s reuse rate from 1.2% to 5% and a doubling of national rates (from 1.2% to 2.5%). Unlocking the 9 hm3 yearly reuse potential would come at a minimum initial investment of nearly EUR 25 million, with operational expenses amounting roughly to EUR 1 million per year.
A total of 19 user scenarios were developed, encompassing different combinations of agricultural, recreational, urban, and industrial uses. Sixty-two solutions were studied, mostly (68%) focusing on Class B water quality, given its suitability for most irrigation purposes and manageable treatment requirements. Twenty-three percent of the solutions entailed the provision of Class A, mostly focusing on urban uses, industry and crops consumed raw. A small minority investigated Class C for irrigation of golf courses with limited access and processed food crops.
The cost analysis included calculations of CAPEX, OPEX and unit costs for multiple treatment and distribution solutions (Table 8 and Table A1 in Appendix C). The variability in the costs presented corresponded to different users (with distinct volume and distance requirements) as well as different suggested treatment system solutions.
The comparative cost analysis across the case studies shows significant diversity, with costs ranging from EUR 0.28/m3 to EUR 2.5/m3 for Class A water, EUR 0.02/m3 to EUR 0.83/m3 for Class B, and EUR 0.10/m3 to EUR 0.58/m3 for Class C. Fervença WWTP emerges as the most cost-effective solution, aimed at agricultural reuse, at just EUR 0.02/m3, which is explained by the proximity between the WWTP and the agricultural land, as well as the high suitability of the treated effluent for immediate use as reclaimed water. On the other end of the spectrum, Vila Franca de Xira WWTP can supply high-quality irrigation water for green parks but at a cost of EUR 2.51/m3, due to the implementation of a costly treatment solution (MBR), for a relatively low consumption (0.09 hm3/yr). These examples demonstrate that reuse costs are not easily generalized and project site-specific (scale, user necessities and WWTP characteristics).
When comparing expected costs between quality classes, although Class C is associated with a slight cost reduction (<5%) when compared to the lowest cost solution for class B, it was concluded not to justify the increased risks. The supply of Class A water, on the other hand, represents costs that are 45% higher, on average, than Class B supply—highlighting that the balance between reduced risk and greater safety vs. economic costs should be analysed on a case-by-case basis.
In general, for the same quality class requirements, treatment was the variable with the least influence on the final unit cost. The only exceptions are for systems using chlorine dioxide for Class B and MBR for Class A, which imply tariffs on average 20% and 44% higher, respectively, than average project unit costs (considering all suitable technologies). However, although MBR unit costs are significantly higher than those for other treatment systems, it should be noted that operational costs also incorporate secondary treatment costs, so it would be important to separate the charges between the sanitation system users and the reclaimed water users.
A significant part of the costs is explained by user characteristics, such as volume and distance to the WWTP, underscoring the importance of specific studies that consider the local context for strategic planning to optimize wastewater reuse in a region or country.

4. Conclusions

Innovative water management strategies are invaluable in addressing increasing water scarcity. By introducing a streamlined methodology to assess wastewater reuse potential, this research provides a practical and replicable framework for enhancing water security in drought-prone regions. The developed Excel-based calculator tool facilitates cost estimation and decision-making, promoting efficient water reuse solutions. In addition, the regional assessment of Lisbon and Oeste validates and showcases the methodology’s effectiveness, revealing substantial opportunities for water reuse in food, golf and green park irrigation in an area of 2135 ha, and for industries, with a significant reuse potential of 9 hm³ annually being identified. The variability in unit costs calculated (EUR 0.02/m3 up to EUR 2.51/m3) showcased the critical role of user proximity and volume needs in assessing the economic feasibility of different reuse scenarios.
The proposed methodology is replicable in other contexts, with adjustments to reflect local parameters such as crop irrigation needs, climate conditions and legislation requirements. By tailoring the approach to specific regional characteristics, it can provide practical solutions for optimising wastewater reuse globally as valuable insights to support decision-making. This adaptability underscores the methodology’s potential as an important tool for sustainable water resource management, promoting resilience against water scarcity and enhancing environmental protection.

Supplementary Materials

The following supporting information can be downloaded at: https://www.mdpi.com/article/10.3390/w16172474/s1, Tool S1: Wastewater reuse project cost assessment calculator.

Author Contributions

Conceptualization, I.A., T.A.E.M., A.G.B. and L.A.; methodology, I.A., T.A.E.M., A.G.B. and L.A., software, I.A.; validation, I.A. and T.A.E.M.; formal analysis, I.A. and T.A.E.M.; investigation, I.A. and T.A.E.M.; writing—original draft preparation, I.A. and T.A.E.M.; writing—review and editing, A.G.B. and L.A.; visualization, I.A.; supervision, A.G.B. and L.A.; project administration, R.L., M.B., A.G.B. and L.A.; funding acquisition, R.L. and M.B. All authors have read and agreed to the published version of the manuscript.

Funding

This work was performed under the Diagnostic Study and Implementation of Actions to Increase Consumption of Água+, requested by the company Águas do Tejo Atlântico S.A (part of the group Águas de Portugal, SGPS, S.A.) to NOVA School of Science and Technology, NOVA University of Lisbon and School of Agriculture, University of Lisbon. Additionally, the authors acknowledge and appreciate the support provided by FCT (Fundação Portuguesa para a Ciência e Tecnologia) to CENSE–Center for Environmental and Sustainability Research, NOVA School of Science and Technology (UIDB/04085/2020) and to its Associate Laboratory CHANGE–Global Change and Sustainability Institute (LA/P/0121/2020), as well as to LEAF–Linking Landscape, Environment, Agriculture and Food, School of Agriculture of Lisbon University and its Associate Laboratory TERRA–Laboratory for Sustainable Land Use and Ecosystem Services.

Data Availability Statement

Results data will be made available on request, while raw data will remain confidential and will not be shared.

Conflicts of Interest

The authors declare that they have no known competing financial interests or personal relationships that could have appeared to influence the work reported in this paper.

Appendix A. Advanced Wastewater Treatment Processes

Adsorption and advanced oxidation technologies are also possible to be applied in reclaimed water treatments, mostly for those with stricter requirements regarding micropollutant concentration. These technologies were not proposed in the selected treatment trains due to the need for real-sized studies in treated wastewater streams, namely, to assess the adsorbent–micropollutant interactions (i.e., sorption/desorption) due to preferential chemical affinities of the compounds [63]. For adsorption, both granular activated carbon and zeolites may be applied to adsorb micropollutant compounds (e.g., pharmaceuticals and heavy metals) [64]. This adsorption stage must be after filtration steps (to minimize the adsorbent fouling) but before the last chemical disinfectant barrier (to reduce disinfectant consumption with absorbent interactions).
In addition to adsorption technologies, advanced oxidation processes (AOP) may be applied, allowing not only the removal of micropollutants but also helping with pathogen inactivation and removal of dissolved solids, colour [65] and odour [66]. Technologies like hydrogen peroxide (H2O2), ozone (O3), and performic acid (PFA) may be applied [67]. The combination of adsorbents and AOP has also been a target of studies due to its double capacity (i.e., oxidation, adsorption) [68]. Although these technologies have been shown to be effective, real full-scale results are still needed to guarantee the benefits. In case the final use is aimed at irrigation, it is important to also verify the oxidative capacity of the reclaimed water after treatment, to guarantee no adverse effect on the crops.

Appendix B. Cost Functions

Figure A1. MBR initial investment cost function [54,55,56].
Water 16 02474 g0a1
Figure A2. Cost functions for construction of the pipeline system, according to DN and PN.
Water 16 02474 g0a2

Appendix C

Table A1. Summary of economic results for wastewater reuse in eight WWTPs, considering the supply of distinct users *.
Case StudyWWTPAvg. Flow
(hm3/yr)
Distance to User (km)Reclaimed
Water Volume (hm3/yr)
Unit Cost (€/m3) per Water Quality ClassCAPEX (M€/yr) per
Water Quality Class
OPEX (k€/yr) per
Water Quality Class
ABCABCABC
1Charneca1.897–9 0.40–1.790.30–0.660.19–0.580.182.13–2.691.98–2.522.3597–27665–189136
2Turcifal0.4250.16-0.59–0.650.58-0.83–0.910.83-33–3432
3Atouguia da Baleia0.921–30.05–0.530.280.16–0.83-0.580.33–0.59-9412–94-
4Rio Maior0.9280.47-0.40–0.44--1.75–1.78--59–74-
5Fervença1.260.2–60.43–0.53-0.02–0.23--0.07–0.67--6–58-
Nazaré0.911–2-0.29–0.57--0.54–1.57--66–117-
6Vila Franca de Xira2.962–80.09–3.01.32–2.50.21–0.250.11.11–1.463.22–3.291.06–1.1233–12492–14947–58
Alverca5.925–170.39–1.680.27–0.32-3.36–6.459.12–9.15-97–634198–308-
Notes: * hm3 represents cubic hectometres (=1,000,000 m3), M€ is million euros (=1,000,000 €) and k€ is thousand euros (=1000 €).

References

  1. WaterEurope. Country Profiles on Urban Wastewater Treatment: Greece. WISE–Freshwater Information System for Europe. Available online: https://water.europa.eu/freshwater/countries/uwwt/greece (accessed on 2 July 2024).
  2. ERSAR. Relatório Anual dos Serviços de Águas e Resíduos em Portugal (RASARP) 2022. Volume 1. Available online: https://www.ersar.pt/pt/site-publicacoes/Paginas/edicoes-anuais-do-RASARP.aspx#BookID=6331 (accessed on 4 July 2023).
  3. Re, I.; Daniotti, S.; Ferrini, M.; Gatto, F. Circular Economy in Italy-Market Analysis and Business Opportunities for Dutch Innovative Companies: Clean & Safe Water and Water Resource Recovery; Embassy of the Kingdom of the Netherlands, Consulate-General of the Netherlands in Italy, the Netherlands Enterprise Agency: Rome, Italy, 2020.
  4. Stathatou, P.M.; Gad, F.; Kampragou, E.; Grigoropoulou, H.; Assimacopoulos, D. Treated Wastewater Reuse Potential: Mitigating Water Scarcity Problems in the Aegean Islands. Desalination Water Treat. 2014, 53, 3272–3282. [Google Scholar] [CrossRef]
  5. Lima, M.; Araújo, B.; Ayrimoraes, S.; Santos, A.; Vieira, J. Water Reuse Potential for Irrigation in Brazilian Hydrographic Regions. Water Supply 2020, 21, 2799–2810. [Google Scholar] [CrossRef]
  6. Chu, J.; Chen, J.; Wang, C.; Fu, P. Wastewater Reuse Potential Analysis: Implications for China’s Water Resources Management. Water Res. 2004, 38, 2746–2756. [Google Scholar] [CrossRef] [PubMed]
  7. Vivaldi, G.A.; Zaccaria, D.; Camposeo, S.; Pasanisi, F.; Salcedo, F.P.; Portoghese, I. Appraising Water and Nutrient Recovery for Perennial Crops Irrigated with Reclaimed Water in Mediterranean Areas Through an Index-Based Approach. Sci. Total Environ. 2022, 820, 152890. [Google Scholar] [CrossRef]
  8. Paul, M.; Negahban-Azar, M.; Shirmohammadi, A.; Montas, H. Assessment of Agricultural Land Suitability for Irrigation with Reclaimed Water Using Geospatial Multi-Criteria Decision Analysis. Agric. Water Manag. 2020, 231, 105987. [Google Scholar] [CrossRef]
  9. Expósito, A.; Díaz-Cano, E.; Berbel, J. The Potential Use of Reclaimed Water for Irrigation Purposes: Is It Overestimated? Water Resour. Manag. 2024, 38, 4541–4554. [Google Scholar] [CrossRef]
  10. Penserini, L.; Moretti, A.; Mainardis, M.; Cantoni, B.; Antonelli, M. Tackling Climate Change Through Wastewater Reuse in Agriculture: A Prioritization Methodology. Sci. Total Environ. 2024, 914, 169862. [Google Scholar] [CrossRef]
  11. Zhang, Y.; Wang, H.; Wang, J. Cost Analysis of Reclaimed Water Treatment: A Case Study in Beijing. In Proceedings of the 4th International Conference on Bioinformatics and Biomedical Engineering, Chengdu, China, 18–20 June 2010. [Google Scholar]
  12. Gonzalez-Serrano, E.; Rodríguez-Mirasol, J.; Cordero, T.; Koussis, A.; Rodriguez, J.J. Cost of Reclaimed Municipal Wastewater for Applications in Seasonally Stressed Semi-Arid Regions. J. Water Supply Res. Technol. AQUA 2005, 54, 355–369. [Google Scholar] [CrossRef]
  13. Nogueira, R.; Ferreira, I.; Janknecht, P.; Rodríguez, J.J.; Oliveira, P.; Brito, A.G. Energy-Saving Wastewater Treatment Systems: Formulation of Cost Functions. Water Sci. Technol. 2007, 56, 85–92. [Google Scholar] [CrossRef]
  14. De Paoli, G.; Mattheiss, V. Deliverable 4.7 Cost, Pricing, and Financing of Water Reuse Against Natural Water Resources; Demoware research project FP7-ENV-2013-WATER-INNO-DEMO; DemoWare: Santa Monica, CA, USA, 2016. [Google Scholar] [CrossRef]
  15. SUGGEREIX. LL1.1 Bases de Dades de Casos de Reutilització. Available online: https://aiguaregenerada.cat/en/project-publications-2/ (accessed on 3 October 2022).
  16. Pistocchi, A.; Aloe, A.; Dorati, C.; Alcalde Sanz, L.; Bouraoui, F.; Gawlik, B.; Grizzetti, B.; Pastori, M.; Vigiak, O. The Potential of Water Reuse for Agricultural Irrigation in the EU: A Hydro-Economic Analysis; JRC: Luxembourg, 2017. [Google Scholar]
  17. Molinos-Senante, M.; Hernández-Sancho, F.; Sala-Garrido, R. Economic Feasibility Study for Wastewater Treatment: A Cost-Benefit Analysis. Sci. Total Environ. 2010, 408, 4396–4402. [Google Scholar] [CrossRef]
  18. Garcia, X.; Pargament, D. Reusing Wastewater to Cope with Water Scarcity: Economic, Social, and Environmental Considerations for Decision-Making. Resour. Conserv. Recycl. 2015, 101, 154–166. [Google Scholar] [CrossRef]
  19. Sepulcre-Canto, G.; Horion, S.; Singleton, A.; Carrao, H.; Vogt, J. Development of a Combined Drought Indicator to Detect Agricultural Drought in Europe. Nat. Hazards Earth Syst. Sci. 2012, 12, 3519–3531. [Google Scholar] [CrossRef]
  20. APA. Plano das Bacias Hidrográficas das Ribeiras do Oeste, Parte 2—Caraterização e Diagnóstico da Região Hidrográfica: 2010–2015; APA: Lisbon, Portugal, 2016. [Google Scholar]
  21. APA. Plano de Gestão da Região Hidrográfico do Tejo, Parte 2—Caraterização e Diagnóstico da Região Hidrográfica: 2010–2015; APA: Lisbon, Portugal, 2016. [Google Scholar]
  22. DGADR. Dotações de Rega de Referência: Quadro 1—Região Sul-Ribatejo, Alentejo e Algarve. Available online: https://www.abroxo.pt/images/Quadro__1.pdf (accessed on 1 July 2023).
  23. DGADR. Aproveitamentos Hidroagrícolas do Grupo II no Continente–Culturas e Áreas Regadas em 2020. Available online: https://sir.dgadr.gov.pt/pub-leg/publicacoes/summary/8-regadio/416-aproveitamentos-hidroagricolas-do-grupo-ii-no-continente-culturas-e-areas-regadas-em-2020 (accessed on 12 July 2023).
  24. Almeida, A.; Velosa, V. Análise da Eficiência Hídrica nos Campos de Golfe em Portugal; Turismo de Portugal: Lisbon, Portugal, 2021. [Google Scholar]
  25. Doorenbos, J.; Pruitt, W.O. Crop Water Requirements: FAO Irrigation and Drainage Paper No. 24; FAO: Rome, Italy, 1977. [Google Scholar]
  26. Gross, P.; Hartwiger, C. How to Develop a Water Budget for Your Golf Course. Green Sect. Rec. 2016, 54, 1–5. [Google Scholar]
  27. APA. Plano de Gestão de Região Hidrográfica–Tejo e Ribeiras do Oeste (RH5A), Parte 2—Caraterização e Diagnóstico, Volume B, 2022–2027; APA: Lisbon, Portugal, 2022. [Google Scholar]
  28. Devitt, D.; Morris, R.; Baghzouz, M.; Lockett, M.; Fenstermaker, L. Water Quality Changes in Golf Course Irrigation Ponds Transitioning to Reuse Water. HortScience 2005, 40, 2151–2156. [Google Scholar] [CrossRef]
  29. Swistock, B. Pond Measurements: Area, Volume, and Residence Time. Available online: https://extension.psu.edu/pond-measurements-area-volume-and-residence-time (accessed on 19 August 2022).
  30. Selvarajan, S. Cradle-to-Gate LCA of Water Treatment Alternatives: A Case Study Performed for Norrvatten’s Future Waterwork Expansion. Dissertation on KTH, School of Architecture and Built Environment. 2021, p. 156. Available online: https://www.diva-portal.org/smash/get/diva2:1519618/FULLTEXT01.pdf (accessed on 27 August 2024).
  31. APA. Guia Metodológico para a Definição de Caudais Ecológicos em Aproveitamentos Hidráulicos em Portugal Continental; APA: Lisbon, Portugal, USA, 2022. [Google Scholar]
  32. Tennant, D. Instream Flow Regimens for Fish, Wildlife, Recreation, and Related Environmental Resources. Fisheries 1975, 1, 4. [Google Scholar] [CrossRef]
  33. Regulation (EU) 2020/741 of the European Parliament and of the Council of 25 May 2020 on Minimum Requirements for Water Reuse. Off. J. Eur. Union 2020, L177/32. Available online: http://data.europa.eu/eli/reg/2020/741/oj (accessed on 27 August 2024).
  34. Presidência do Conselho de Ministros, Decreto-Lei n.º 119/2019 de 21 de agosto, Diário da República n.º 159/2019: Série I de 2019-08-21. pp. 21–44. Available online: https://diariodarepublica.pt/dr/detalhe/decreto-lei/119-2019-124097549 (accessed on 27 August 2024).
  35. Parveen, N.; Chowdhury, S.; Goel, S. Environmental Impacts of the Widespread Use of Chlorine-Based Disinfectants During the COVID-19 Pandemic. Environ. Sci. Pollut. Res. 2022, 29, 85742–85760. [Google Scholar] [CrossRef]
  36. Wang, C.; Chang, C.; Lin, W. Efficiency Improvement of a Flow-Through Water Disinfection Reactor Using UV-C Light Emitting Diodes. J. Water Process Eng. 2021, 40, 101819. [Google Scholar] [CrossRef]
  37. Carré, E.; Pérot, J.; Jauzein, V.; Lopez-Ferber, M. Impact of Suspended Particles on UV Disinfection of Activated-Sludge Effluent with the Aim of Reclamation. J. Water Process Eng. 2018, 22, 87–93. [Google Scholar] [CrossRef]
  38. Metcalf & Eddy; Asano, T.; Burton, F.; Leverenz, H. Water Reuse: Issues, Technologies, and Applications, 1st ed.; McGraw-Hill: New York, NY, USA, 2007. [Google Scholar]
  39. Metcalf & Eddy; Tchobanoglous, G.; Stensel, H.; Tsuchihashi, R.; Burton, F. Wastewater Engineering: Treatment and Resource Recovery, 5th ed.; McGraw-Hill Professional: New York, NY, USA, 2014. [Google Scholar]
  40. Kesar, S.; Bhatti, M.S. Chlorination of Secondary Treated Wastewater with Sodium Hypochlorite (NaOCl): An Effective Single Alternative to Other Disinfectants. Heliyon 2022, 8, e11162. [Google Scholar] [CrossRef]
  41. Valdés, J.; Kahouadji, L.; Matar, O. Current Advances in Liquid–Liquid Mixing in Static Mixers: A Review. Chem. Eng. Res. Des. 2022, 177, 694–731. [Google Scholar] [CrossRef]
  42. ProMinent. Operating Instructions: Chlorine Dioxide Systems Bello Zon Product Range CDVd. Available online: https://www.prominent.com/resources/OperatingInstructions/English/24082/981555-BA-BEZ-060-07-21-EN-Chlorine-Dioxide-System-BelloZon-CDVd-BA-EN.pdf (accessed on 4 July 2023).
  43. Anderson, J. Water for Life: Diversification and Water Reuse as Ingredients in Sydney’s Integrated Water Plan. In Milestones in Water Reuse: The Best Success Stories; IWA Publishing: London, UK, 2013; pp. 27–35. [Google Scholar]
  44. Chalmers, R.; Patel, M. Key to Success of Groundwater Recharge with Recycled Water in California. In Milestones in Water Reuse: The Best Success Stories; IWA Publishing: London, UK, 2013; pp. 297–314. [Google Scholar]
  45. Lim, M.; Seah, H. NEWater: A Key Element of Singapore’s Water Sustainability. In Milestones in Water Reuse: The Best Success Stories; IWA Publishing: London, UK, 2013; pp. 53–62. [Google Scholar]
  46. Torkashvand, J.; Farzadkia, M.; Younesi, S.; Gholami, M. A Systematic Review on Membrane Technology for Carwash Wastewater Treatment: Efficiency and Limitations. Desalination Water Treat. 2021, 210, 81–90. [Google Scholar] [CrossRef]
  47. Bertanza, G.; Canato, M.; Laera, G.; Vaccari, M.; Svanstrom, M.; Heimersson, S. A Comparison Between Two Full-Scale MBR and CAS Municipal Wastewater Treatment Plants: Techno-Economic-Environmental Assessment. Environ. Sci. Pollut. Res. 2017, 24, 17383–17393. [Google Scholar] [CrossRef] [PubMed]
  48. European Commission. Proposal for a Directive of the European Parliament and of the Council Concerning Urban Wastewater Treatment COM/2022/541/FINAL. 2022. Available online: https://eur-lex.europa.eu/legal-content/EN/TXT/?uri=COM%3A2022%3A0541%3AFIN (accessed on 27 August 2024).
  49. Cowle, M.W.; Webster, G.; Babatunde, A.O.; Bockelmann-Evans, B.N.; Weightman, A.J. Impact of Flow Hydrodynamics and Pipe Material Properties on Biofilm Development Within Drinking Water Systems. Environ. Technol. 2019, 41, 3732–3744. [Google Scholar] [CrossRef]
  50. Miranda, J.C. Infra-Estruturas de Aducão e Regularização em Perímetros de Rega Coletivos. In Jornadas Técnicas APRH—A Engenharia dos Aproveitamentos Agrícolas; 2011; Available online: https://www.aprh.pt/wp-content/uploads/2011/10/13-15Outubro2011_livro-de-resumos1.pdf (accessed on 27 August 2024).
  51. Mariano, J. Adutoras Puras e Mistas: Análise Técnico-Económica; Instituto Superior de Engenharia de Coimbra, Departamento de Engenharia Civil: Coimbra, Portugal, 2014. [Google Scholar]
  52. ISO 4427-1:2019; Plastic Piping Systems for Water Supply and for Drainage and Seweage under Pressure—Polyethylene. ISO: Geneva, Switzerland, 2019; Edition 2.
  53. Fewtrell, L.; Bartram, J. Water Quality: Guidelines, Standards and Health: Assessment of Risk and Risk Management for Water-Related Infectious Diseases; WHO: Geneva, Switzerland, 2001. [Google Scholar]
  54. Guo, T.; Englehardt, J.; Wu, T. Review of Cost Versus Scale: Water and Wastewater Treatment and Reuse Processes. Water Sci. Technol. 2014, 69, 223–234. [Google Scholar] [CrossRef] [PubMed]
  55. Iglesias, R.; Simón, P.; Moragas, L.; Arce, A.; Rodriguez-Roda, I. Cost Comparison of Full-Scale Water Reclamation Technologies with an Emphasis on Membrane Bioreactors. Water Sci. Technol. 2017, 75, 2562–2570. [Google Scholar] [CrossRef]
  56. DeCarolis, J.; Adham, S.; Pearce, W.; Hirani, Z.; Lacy, S.; Stephenson, R. Cost Trends of MBR Systems for Municipal Wastewater Treatment. Proc. Water Environ. Fed. 2007, 15, 3407–3418. [Google Scholar] [CrossRef]
  57. Covas, D. Custos de Construção de Infraestruturas Associadas ao Ciclo Urbano da Água; Guia Técnico 23; ERSAR: Lisboa, Portugal, 2020. [Google Scholar]
  58. ADP. Water Infrastructures Construction Costs Estimator (WICCE). Available online: https://wicce.adp.pt/ (accessed on 2 January 2023).
  59. FFMS. Remuneração Base Média Mensal dos Trabalhadores por Conta de Outrem: Total e por Setor de Atividade Económica. Available online: https://www.pordata.pt/municipios/remuneracao+base+media+mensal+dos+trabalhadores+por+conta+de+outrem+total+e+por+setor+de+atividade+economica-238 (accessed on 4 December 2022).
  60. FFMS. Taxa de Inflação (Taxa de Variação do Índice de Preços no Consumidor): Total e por Consumo Individual por Objetivo. Available online: https://www.pordata.pt/portugal/taxa+de+inflacao+(taxa+de+variacao+do+indice+de+precos+no+consumidor)+total+e+por+consumo+individual+por+objetivo-2315 (accessed on 4 March 2023).
  61. Rogers, B.; Dunn, G.; Hammer, K.; Novalia, W.; Haan, F.J.d.; Brown, L.; Brown, R.; Lloyd, S.; Urich, C.; Wong, T.; et al. Water Sensitive Cities Index: A Diagnostic Tool to Assess Water Sensitivity and Guide Management Actions. Water Res. 2020, 186, 116411. [Google Scholar] [CrossRef] [PubMed]
  62. Orta-Ortiz, M.G.D. What Variables Matter When Designing Nature-Based Solutions for Stormwater Management? A Review of Impacts on Ecosystem Services. Environ. Impact Assess. Rev. 2022, 95, 106802. [Google Scholar] [CrossRef]
  63. Hofman-Caris, C.; Bäuerlein, P.; Siegers, W.; Ziaie, J.; Tolkamp, H.; Voogt, P. Affinity Adsorption for the Removal of Organic Micropollutants in Drinking Water Sources: Proof of Principle. Water Sci. Technol. Water Supply 2015, 15, 1207–1219. [Google Scholar] [CrossRef]
  64. Gisi, S.; Lofrano, G.; Grassi, M.; Notarnicola, M. Characteristics and Adsorption Capacities of Low-Cost Sorbents for Wastewater Treatment: A Review. Sustain. Mater. Technol. 2016, 9, 10–40. [Google Scholar] [CrossRef]
  65. Ismail, G.A.; Sakai, H. Review on Effect of Different Types of Dyes on Advanced Oxidation Processes (AOPs) for Textile Color Removal. Chemosphere 2022, 291, 132906. [Google Scholar] [CrossRef] [PubMed]
  66. Antonopoulou, M.; Konstantinou, I. AOPs Methods for the Removal of Taste and Odor Compounds. In Applications of Advanced Oxidation Processes (AOPs) in Drinking Water Treatment; Springer International Publishing: Berlin/Heidelberg, Germany, 2019; pp. 179–210. [Google Scholar]
  67. Hajalifard, Z.; Kazemi, S.; Eftekhari, S.; Rezaei, S.; Mousazadeh, M.; Usman, M. Per- and Polyfluoroalkyl Substances Degradation Using Hydroxyl- and Sulfate- Radical-Based Advanced Oxidation from Water Matrices: Which One Is the Best Approach? Int. J. Environ. Anal. Chem. 2023, 1–25. [Google Scholar] [CrossRef]
  68. Spilsbury, F.; Kisielius, V.; Bester, K.; Backhaus, T. Ecotoxicological Mixture Risk Assessment of 35 Pharmaceuticals in Wastewater Effluents Following Post-Treatment with Ozone and/or Granulated Activated Carbon. Sci. Total Environ. 2024, 906, 167440. [Google Scholar] [CrossRef] [PubMed]
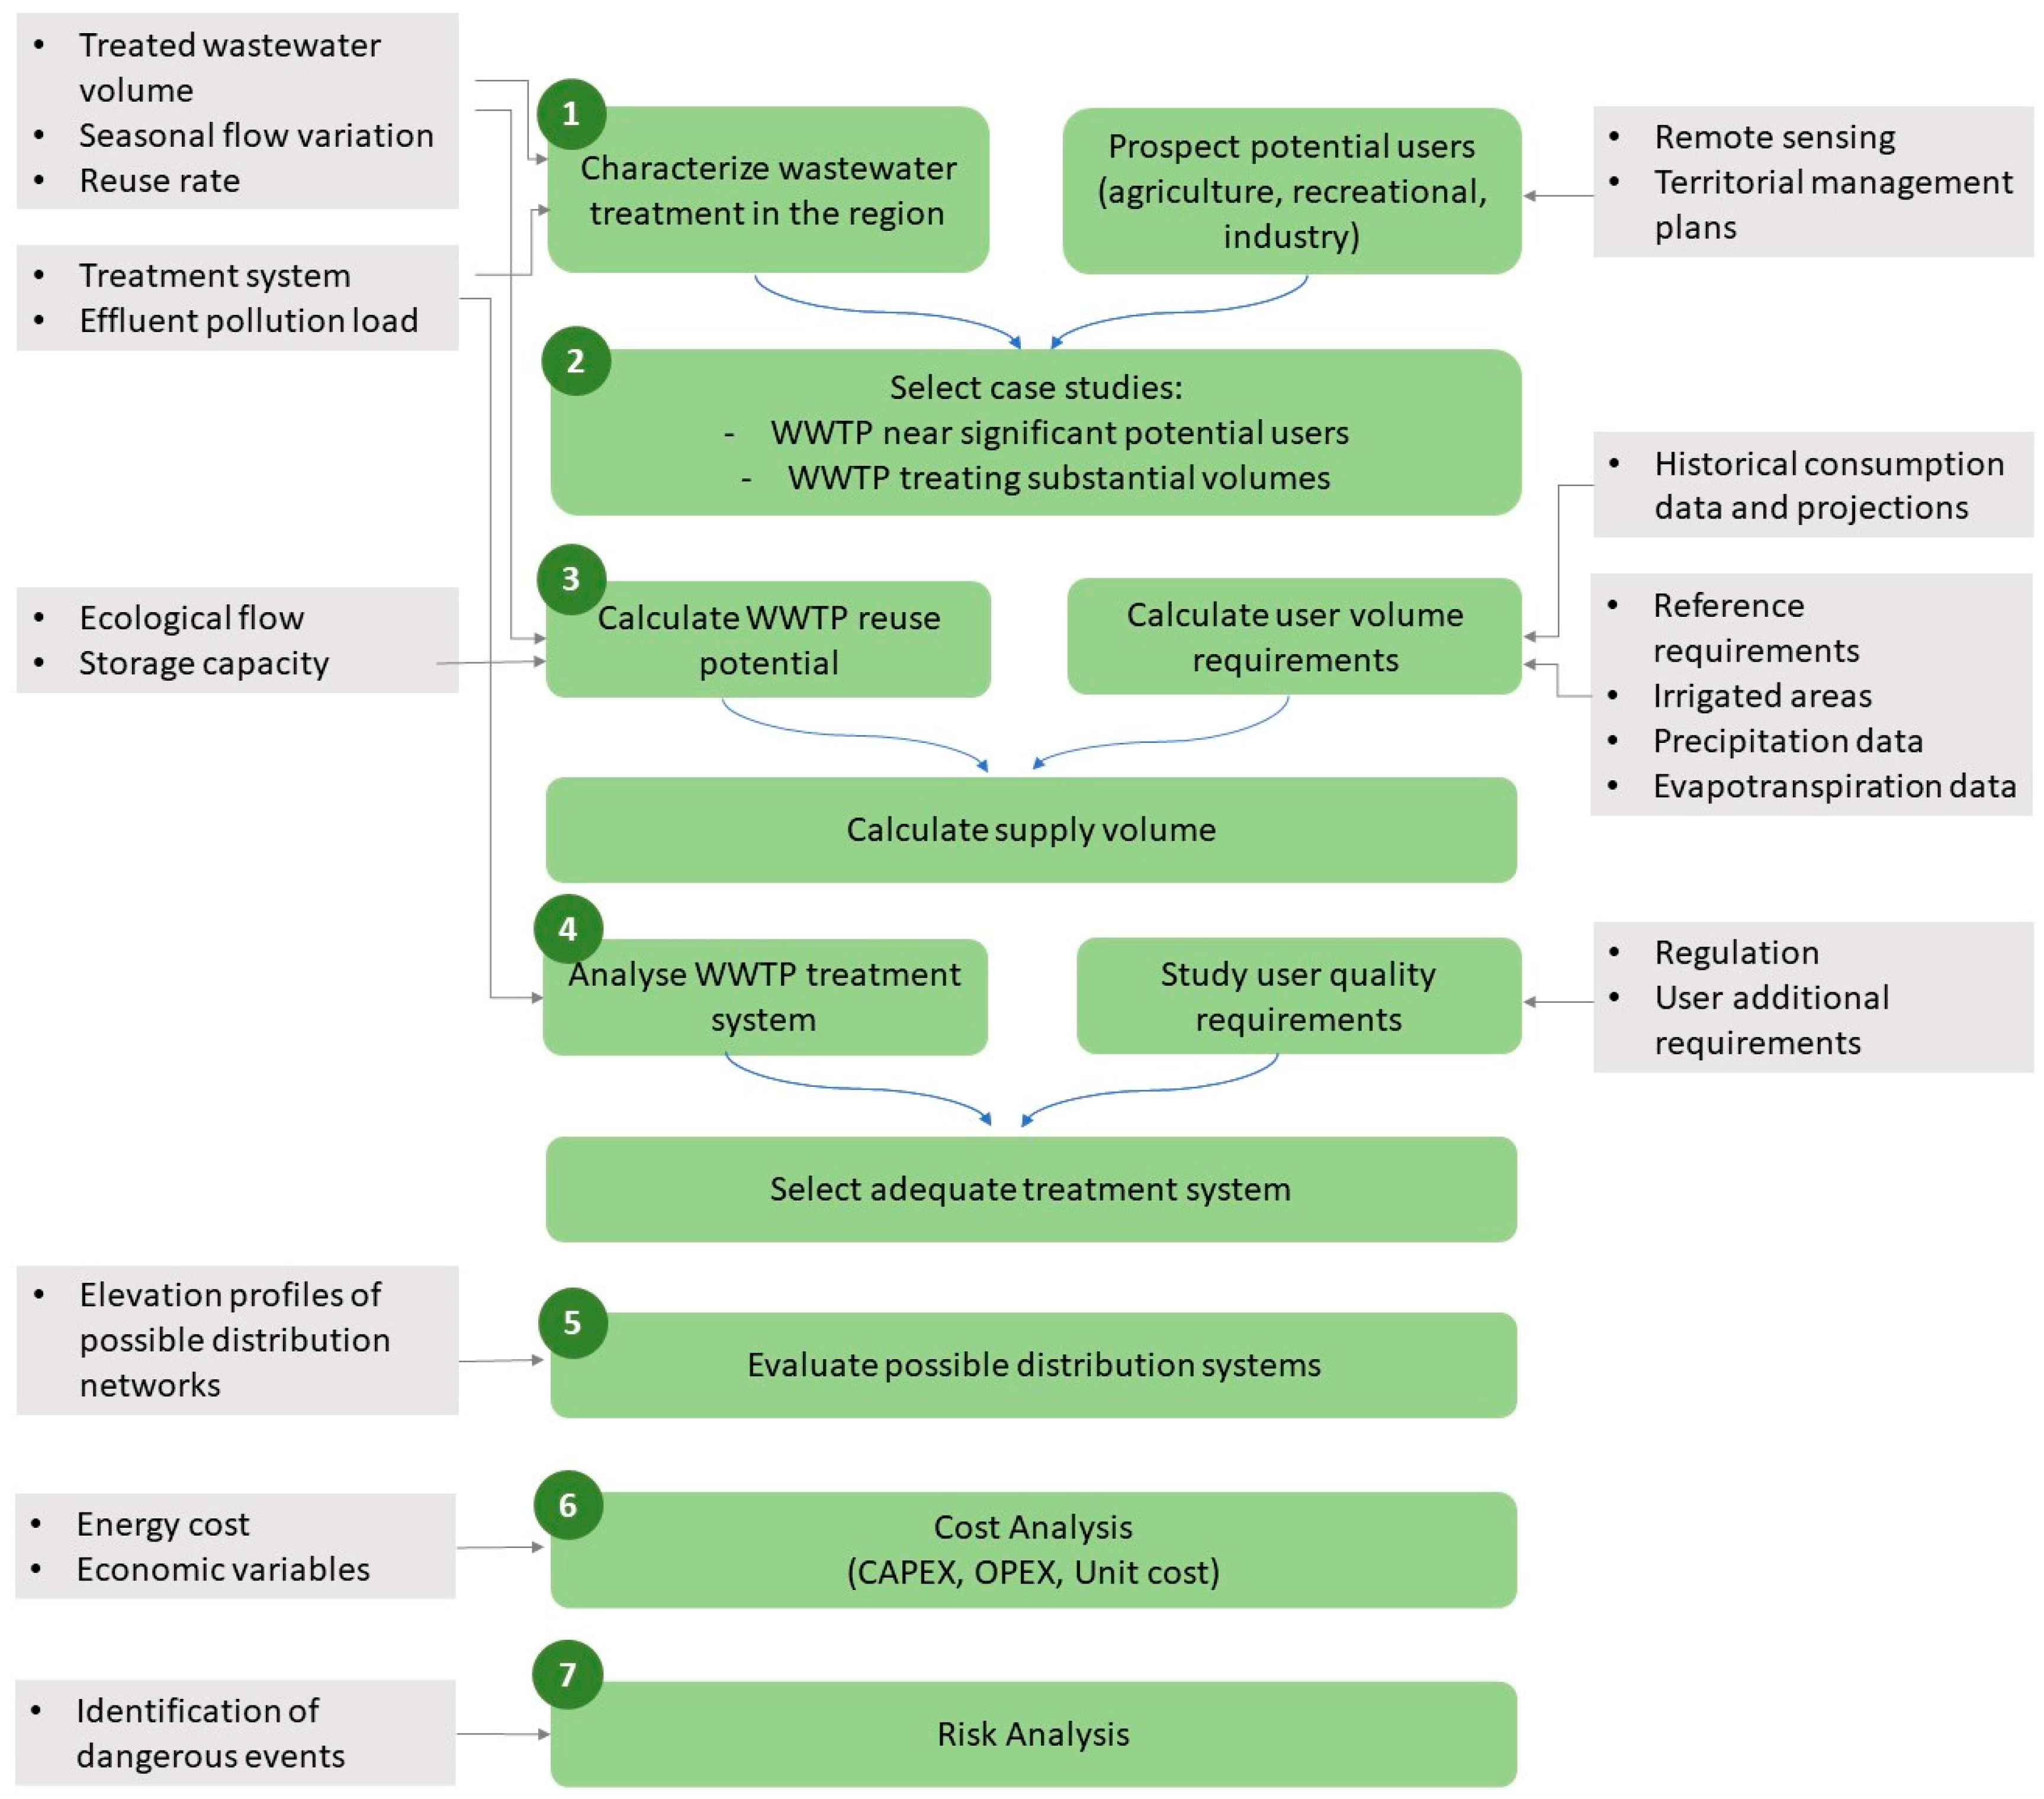
Figure 1. Summary diagram of methodological steps (green) and external data sources required (grey).
Water 16 02474 g001
Figure 2. Monthly distribution used to estimate the water consumption for agricultural irrigation areas.
Water 16 02474 g002
Figure 3. Example of monthly distribution of water consumption estimates for recreational green space areas.
Water 16 02474 g003
Figure 4. Workflow for selection of design flux.
Water 16 02474 g004
Figure 5. OPEX cost function for MBR systems, derived from OPEX data points in the literature.
Water 16 02474 g005
Figure 6. WWTP identification by location and size.
Water 16 02474 g006
Table 1. Reclaimed water quality requirements for several reclaimed water users, considering legislation [33,34].
Agricultural IrrigationRecreational UsesIndustry (a)
ABCD
E. coli (number/100 mL)≤10≤100≤1000≤10,000≤10≤10
BOD5 (mg/L)≤10≤25≤25≤25≤25
TSS (mg/L)≤10≤35≤35≤35
Turbidity (NTU)5---≤5≤5
Legionella spp. (cfu/L)≤1000 (b)≤1000 (b)≤1000 (b)≤1000 (b)
Intestinal nematodes (eggs/L) ≤1≤1
Total Nitrogen (mg NH4/L) ≤10 (b)
Total Phosphorus (mg P/L) ≤15 (b) ≤2 (b)
Ammonia (mg NH4/L) ≤5 (b) ≤5
Notes: (a) Stricter standard for circuits with direct ingestion risk (including accidental ingestion, e.g., droplets) and dermal contact. (b) Optional parameter, to be applied using a fit-for-purpose approach.
Table 2. Summary of proposed treatment systems for reclaimed water production.
ScenarioTreatment SystemClassRemarksDisinfection Dosing per Class
ABCUnit
A—Keep it simpleDisinfection (NaOCl)CByproduct formation may occur with nitrogen and natural organic matter, increasing NaOCl requirements. Not recommended for WWTPs with high levels of TSS and/or ammonia. --5mg Cl/L
B—Simple and robustFiltration + Disinfection (NaOCl)B or CNot recommended for WWTPs with high levels of ammonia.-31.5mg Cl/L
C—Less simple, safer and more robustFiltration + Disinfection (UV) + Disinfection (NaOCl)B or CNot recommended for WWTPs with reported low transmittance.-10.5mJ/cm2
D—SaferFiltration + Disinfection (ClO2)A or BPossible chlorate and chlorite production.31-mg ClO2/L
E—Super safeMembrane Filtration (UF) + Disinfection (NaOCl)AThe disinfection technology can be changed for others with greater efficiency, being aware of the cost increase.0.5--mg Cl/L
F—All-in-oneBiological Membrane Filtration (MBR) + Disinfection (NaOCl)AThe residual disinfection technology can be changed for others with greater efficiency, being aware of the cost increase.1--mg Cl/L
Table 3. Estimated initial investment cost curves for the treatment train equipment (for 2023).
EquipmentInitial Investment (€)Parameters
Chlorine dioxide generatorsy = 11.521x + 16,588x = Dose (g/h)
Disc filtrationy = 148.42x + 82,708x = Design flow (m3/h)
Dosing pumpy = 19.816x + 1384.4x = Reagent dose (L/h)
Static mixersy = 0.0467x2 + 3.7808x + 640.67x = Design flow (m3/h)
Ultrafiltrationy = 775.51x + 42,653x = Design flow (m3/h)
Closed-vessel UVy = 99.607x − 6325.6x = Design flow (m3/h)
Table 4. Investment cost processes associated with wastewater treatment infrastructure.
OperationCost
Clearing, excavation and levelling 3 €/m2
Concrete application 6 €/m2
Equipment protection building200 €/m2
Pumping well350 €/m3 active volume
Contact tank400 €/m3 active volume
Table 5. Reagent cost estimates.
ReagentPrice
Sodium hypochlorite (13%)0.400 €/kg
Sodium chlorite (7.5%)0.985 €/kg
Hydrochloric acid (9%)0.465 €/kg
Table 6. Sampling frequency and total expected annual monitoring costs according to water reuse quality class and production volume, following European and Portuguese legislation.
ABC–D
ParameterAnalysis Cost <300 m3/day300–1500 m3/day1500–7500 m3/day>7500 m3/day<300 m3/day300–1500 m3/day1500–7500 m3/day>7500 m3/day
Occasional nutrient monitoring
BOD515 €5241212264121226
TSS10 €5241212264121226
E. coli12 €525252525226262626
Helminth eggs15 € 26262626
Legionella spp.55 €242424242424242424
Nitrogen13 €121212121212121212
Phosphorus18 €121212121212121212
Ammonia9 €121212121212121212
Total cost
(aspersion irrigation)
3724 €2524 €2724 €2724 €3074 €2589 €2789 €2789 €3139 €
Total cost
(other irrigation types)
2404 €1864 €2064 €2064 €2414 €1929 €2129 €2129 €2479 €
Frequent nutrient monitoring
BOD515 €5241212264121226
TSS10 €5241212264121226
E. coli12 €525252525226262626
Helminth eggs15 € 26262626
Legionella spp.55 €242424242424242424
Nitrogen13 €242424242424242424
Phosphorus18 €242424242424242424
Ammonia9 €242424242424242424
Total cost
(aspersion irrigation)
4204 €3004 €3204 €3204 €3554 €3069 €3269 €3269 €3619 €
Total cost
(other irrigation types)
2884 €2344 €2544 €2544 €2894 €2409 €2609 €2609 €2959 €
Table 7. Estimated electrical power for treatment equipment.
EquipmentEstimated Power
Dosing Pump15 W/L reagent
Disc Filters3.4 W/m3 reclaimed water
UV Reactor55 W/m3 reclaimed water
UF Membrane500 W/ m3 reclaimed water
Pump75 W/ m3 reclaimed water
Chlorine Dioxide generator (<600 g/h)740 W
Chlorine dioxide generator (>600 g/h)300 W
Table 8. Summary of results for eight WWTPs, in a total of six case studies, considering reclaimed water potential and resulting increased reuse percentage *.
Case StudyWWTPAvg. Flow
(hm3/yr)
Distance to User (km)Reclaimed Water Potential% Max Reuse WWTPUnit Cost (€/m3) per Water Quality Class
Max
(hm3/yr)
Agriculture
(hm3/yr)
Agric.
(ha)
Recreative and Urban (hm3/yr)Recr.
(ha)
Industrial
(hm3/yr)
ABC
1Charneca1.897–9 1.791.798430.4055-950.30–0.660.19–0.580.18
2Turcifal0.4250.16--0.1623-42-0.59–0.650.58
3Atouguia da Baleia0.921–30.530.532590.057-580.280.16–0.83-
4Rio Maior0.9280.47 0.4766-52-0.40–0.44-
5 (a)Fervença1.260.2–60.990.96313-
-
-
-
-
-
45-0.02–0.23-
Nazaré0.911–2-0.29–0.57-
6 (a)Vila Franca de Xira2.962–85.024.534560.461131.00581.32–2.510.21–0.250.10
Alverca5.925–170.39–1.680.27–0.32-
Total 8.967.8118711.082641.46
Notes: * hm3 represents cubic hectometres (=1,000,000 m3); (a) Case studies 5 and 6 each considered two WWTPs, which were grouped because they had the same potential identified users in their surrounding area, and thus supply was studied collectively.
Disclaimer/Publisher’s Note: The statements, opinions and data contained in all publications are solely those of the individual author(s) and contributor(s) and not of MDPI and/or the editor(s). MDPI and/or the editor(s) disclaim responsibility for any injury to people or property resulting from any ideas, methods, instructions or products referred to in the content.