1. Introduction
According to the 2023 World Water Development Report [
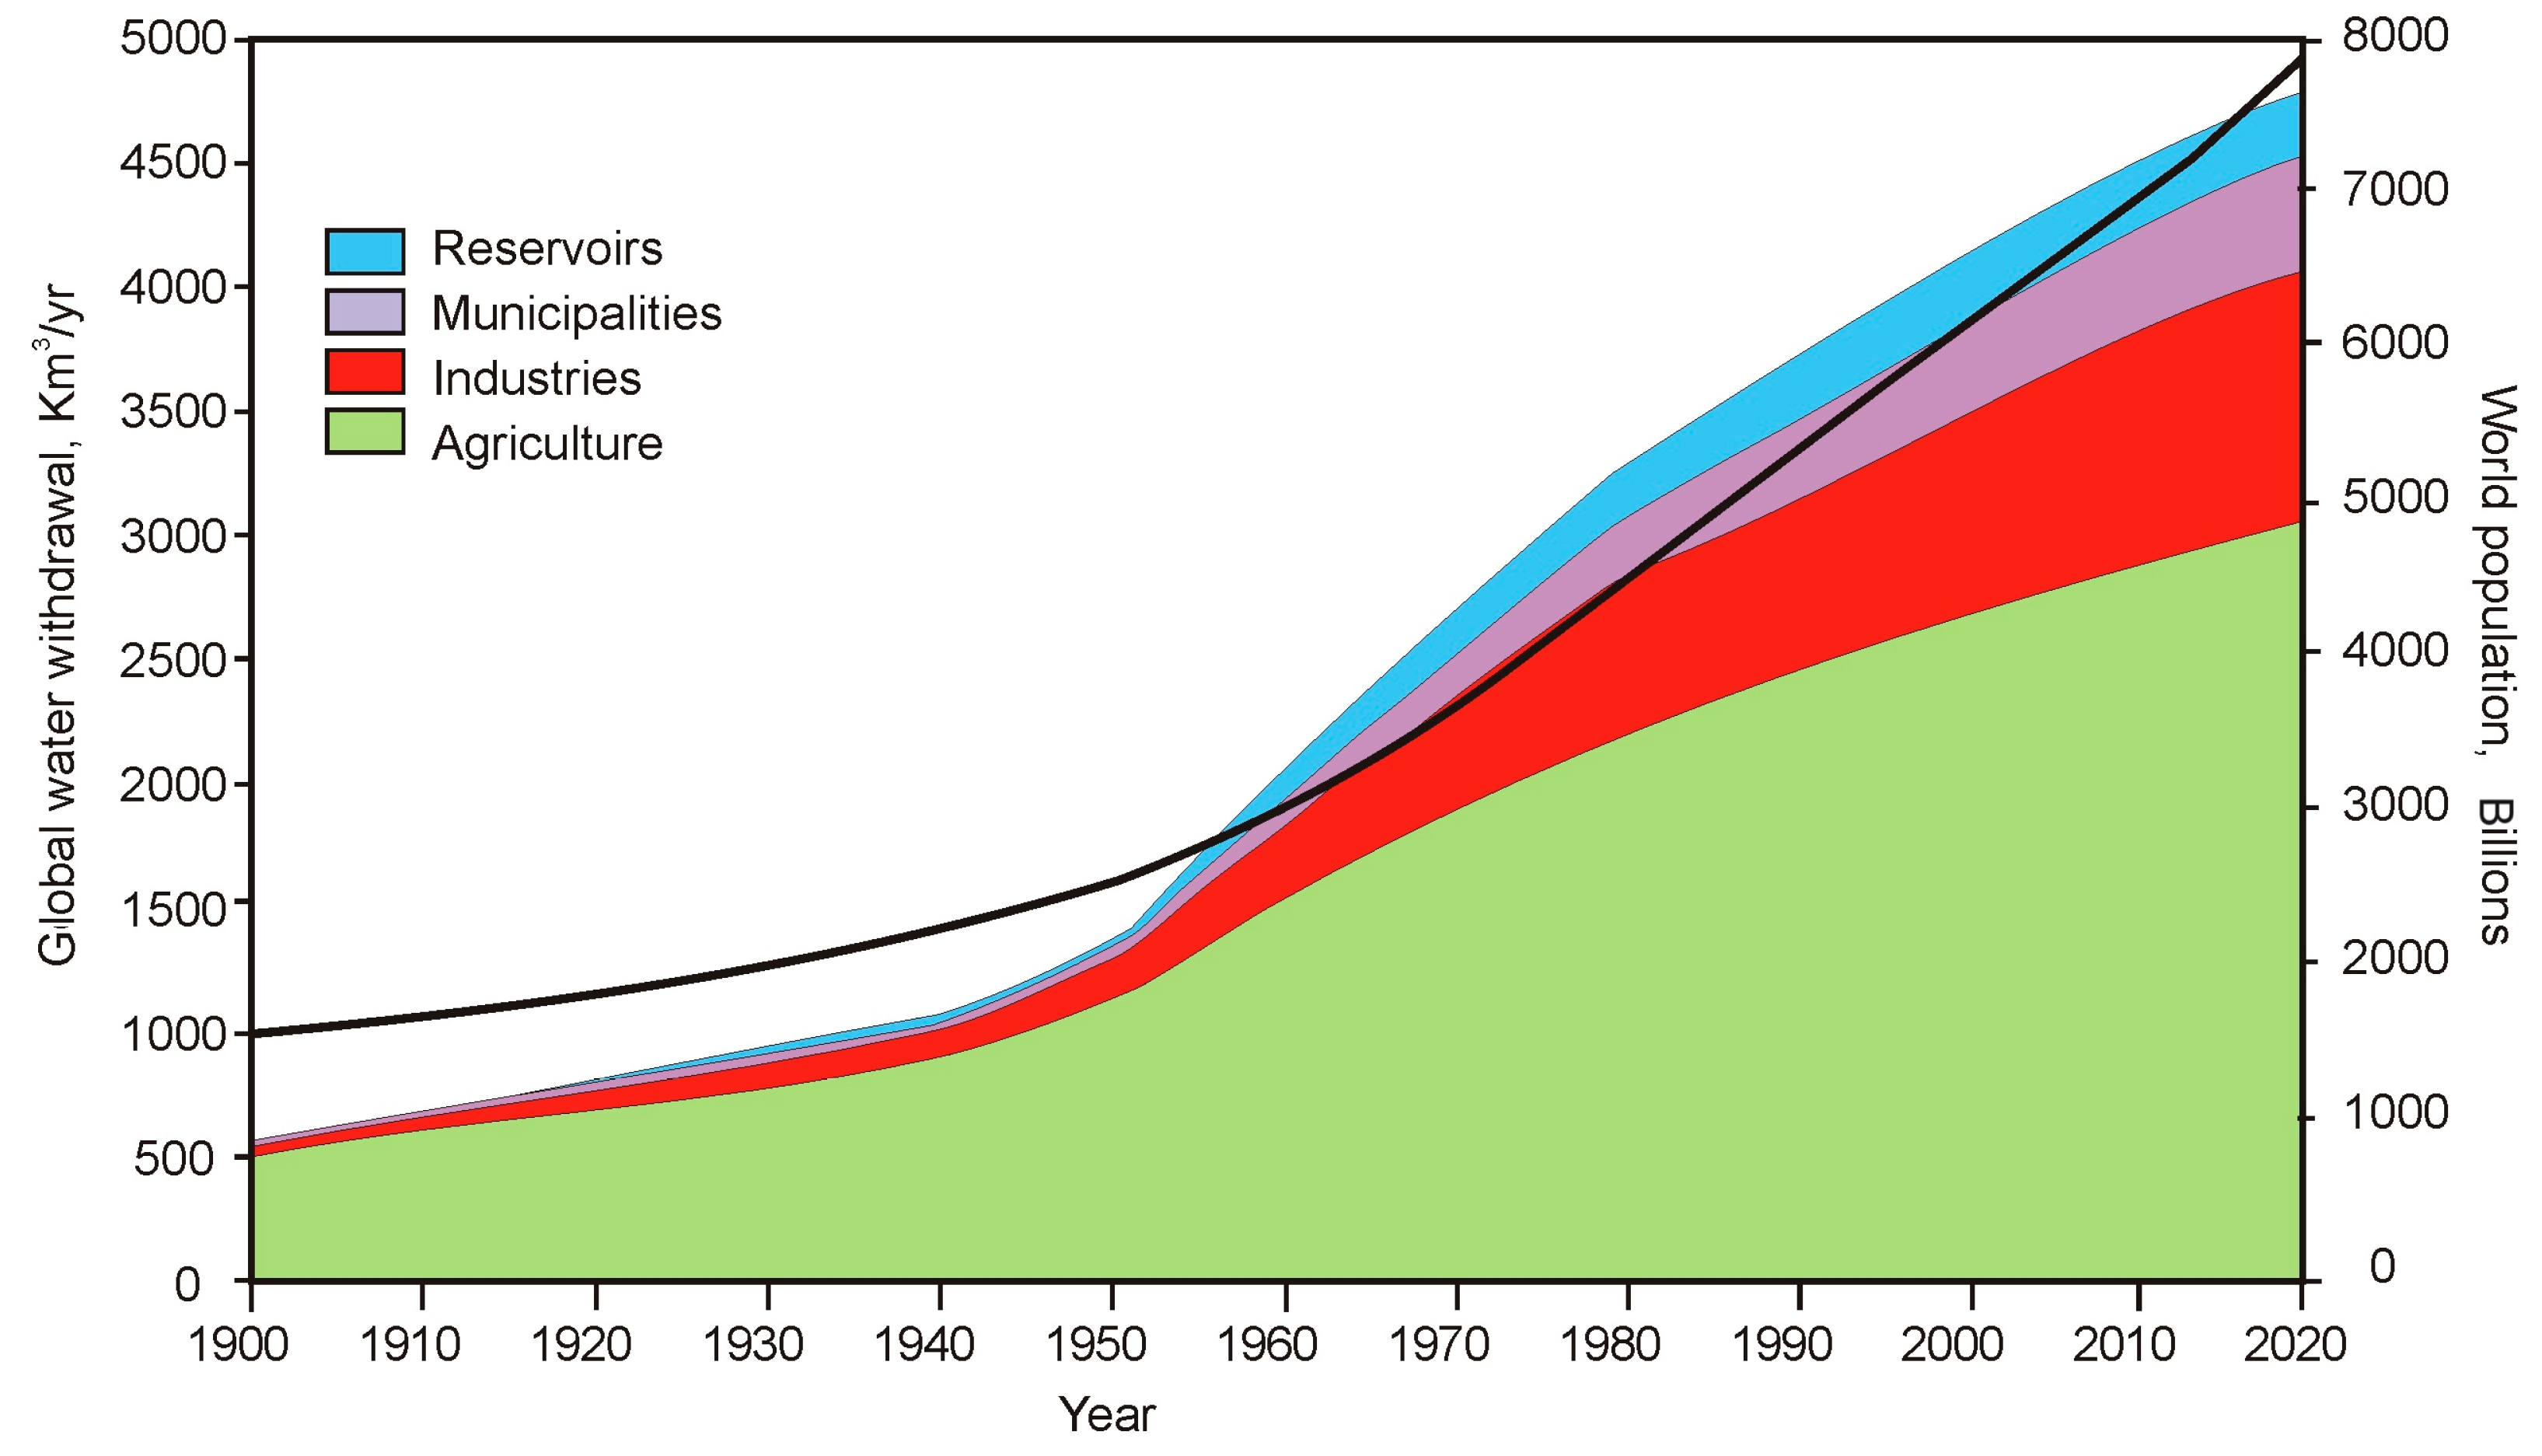
1], the global use of freshwater has increased six-fold in the past 100 years and has been growing by about 1% per year since the 1980s. As a consequence, there has been an increase in global water loss over time in the water used in all productive sectors, and surface evaporation in reservoirs is also considered to be part of these losses, since this evaporation would not occur without human intervention [
2]. This situation is still progressing today, as predicted by Shiklomanov [
3,
4,
5]. This increase can be related to the global increase in the world’s population (
Figure 1), although global water withdrawal increased 1.7 times faster than world population, according to AQUASTAT [
2]. In that sense, the 2030 the Water Resources Group [
6] concluded that the world would face a 40% global water deficit by 2030 under a business-as-usual scenario, considering the full availability of water resources. In this scenario, the appropriate conservation of water infrastructures is essential for the management of water resources for both the present and future generations. In addition to these considerations, water resources are expected to decrease as a result of climate change [
7].
Urban water systems constitute a vital segment of the global public infrastructure for water utilities, and municipalities are tasked with the responsibility of overseeing and improving them for present and future generations. Among these, water distribution networks (WDNs) stand out as crucial and costly municipal infrastructure assets [
8]. The primary challenge arises as these infrastructures naturally age and deteriorate, while urban development continues to intensify demands from customers. Both factors contribute to the same issue, underscoring the importance of risk management and sustainability in addressing water losses due to pipe leakage.
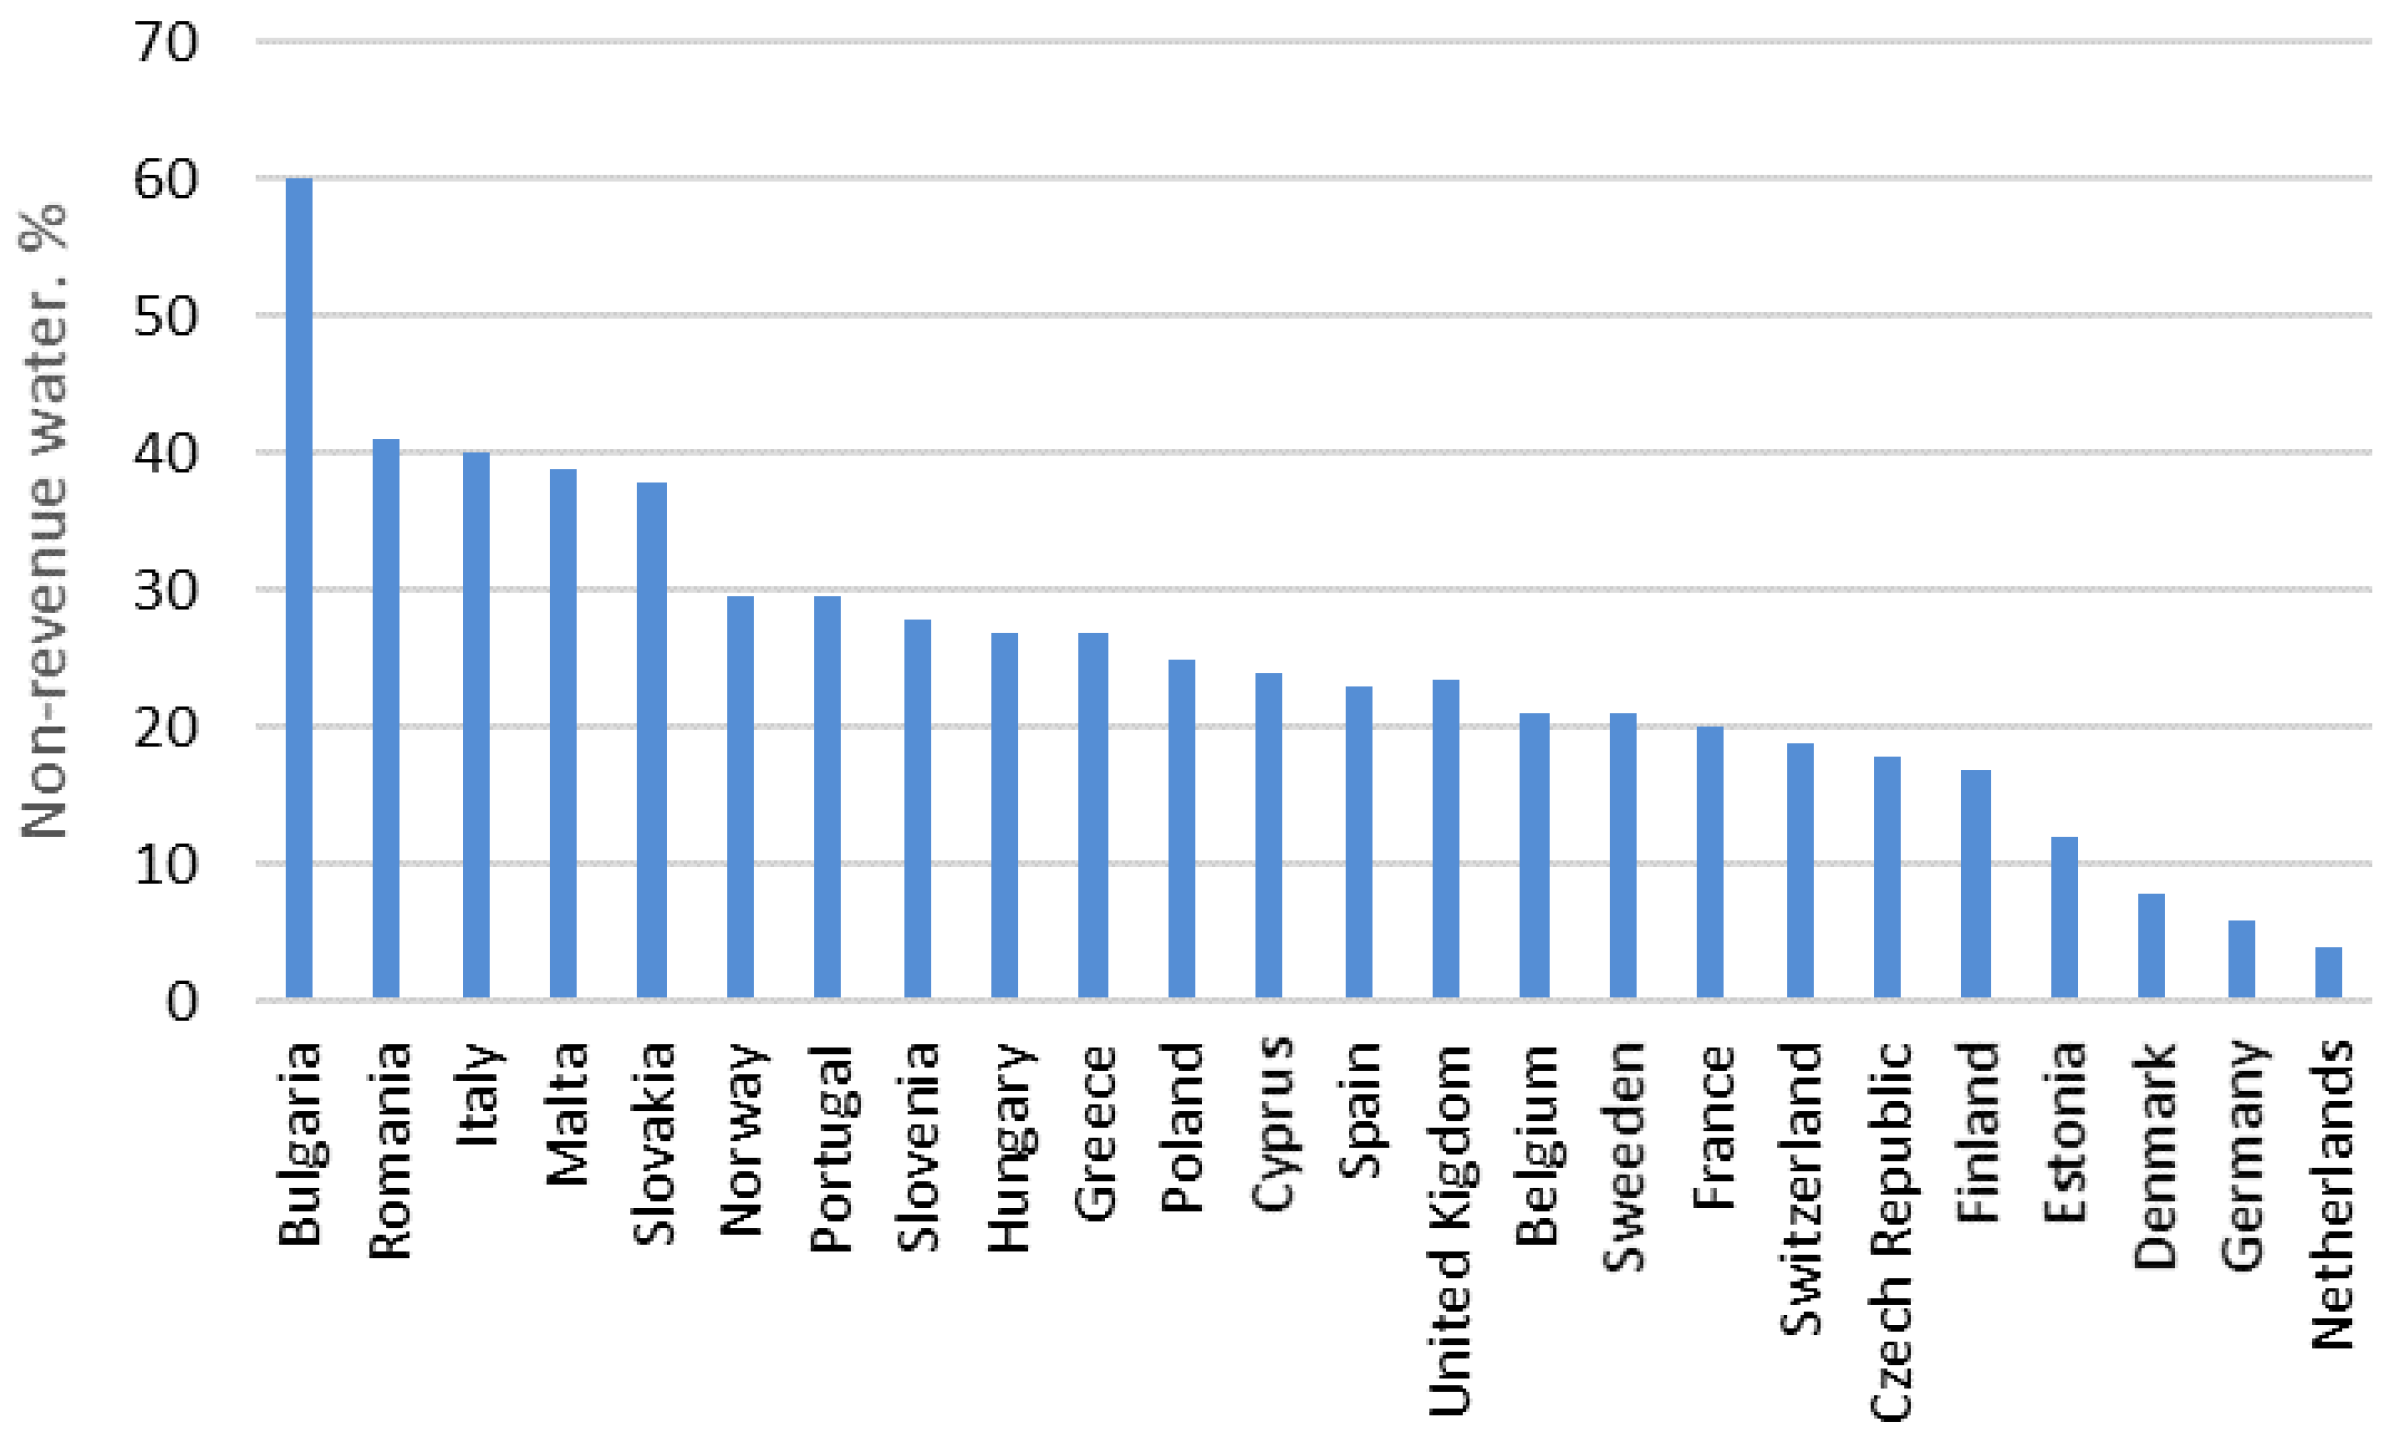
As mentioned before, water utilities are facing significant challenges, such as supplying more and more water due to population growth, with fewer water resources being the current scenario due to climate change. In this regard, all actions that involve increasing the lifespans of their assets are mandatory, thereby reducing leaks which currently represent more than 25% of total flow, on average, measured as % of non-revenue water in the European Union, according to the EurEau [
9], see
Figure 2. This is another way to increase water resources. Older systems have reduced carrying capacity due to issues such as corrosion and tuberculation, making them more susceptible to leaks and breaks. These issues result in water losses and involve both time and financial resources in their repairs. Consequently, the rehabilitation, replacement, and/or expansion of an existing system to meet the current and future demands of flow rate and pressure head has consistently been a subject of interest for engineers.
According to the American Water Works Association, an estimated
$1 trillion will be necessary to maintain and expand service to meet demands over the next 25 years [
10]. This is the real challenge when it comes to updating and upgrading water network infrastructure for water utilities. Since it is unrealistic and unnecessary to rehabilitate and/or replace all pipes in an existing water distribution system (because any water distribution network consists of thousands of kilometers of pipe, and leaks are dispersed within this extensive infrastructure), many authors have explored methodologies which can be used to increase the lifespan of pipes or determine which pipes in the system should undergo rehabilitation and/or replacement over the next 50 years [
11,
12]. This approach aims to ensure that demand and pressure requirements are met while minimizing the total cost. In this matter, a successful risk assessment program provides water network management tools to estimate pipe failures and assess the consequences of such failures, and also recommends prioritization strategies [
13]. These risk models, typically traditional statistical models or machine learning models, should be developed considering different types of pipe materials (see [
14,
15,
16,
17]). The results show the risks of failure for specific pipe reaches.
In addition to these methodologies used to increase lifespan of pipes or identify which pipes should be replaced or rehabilitated, some authors propose to estimate the internal and external causes which deteriorate pipes and which are the key parameters in quantifying their degradation. It is important to determine the causes and effects of probability of failure, where failure can manifest as structural integrity, hydraulic capacity, water quality [
18,
19,
20,
21,
22], and finally, adverse consequences [
20,
23]. In this sense, structural pipe integrity is the main key used to estimate the pipe’s deterioration, as risk of failure increases in cases of loss of structural integrity; furthermore, it also has real consequences for hydraulic capacity and water quality.
In order to assess the probability of failure, some authors categorize pipes into groups based on particular properties known to influence pipe deterioration, particularly, material, date of installation, diameter, and pipe thickness [
24,
25,
26,
27]. According to several authors ([
28] or [
29]), the structural deterioration of water mains and their subsequent failures are affected by many factors, both static (e.g., pipe material, pipe size, pipe thickness, and soil type), see [
30], and dynamic (e.g., installation age, climate, cathodic protection, and pressure zone changes), see [
31]. The deterioration of pipes may be classified into two categories. The first one is structural deterioration, which diminishes a pipe’s structural resiliency and its ability to withstand the various types of stresses imposed upon it [
24]. The second issue is the deterioration of the inner surfaces of the pipes, resulting in diminished hydraulic capacity, degradation of water quality, and reduced structural resiliency in cases of severe internal corrosion [
32]. In the literature there are many deterioration models that assess pipeline conditions. All of them use different approaches, such as physical models, statistical models, or artificial intelligence models. Each approach presents advantages and disadvantages [
33].
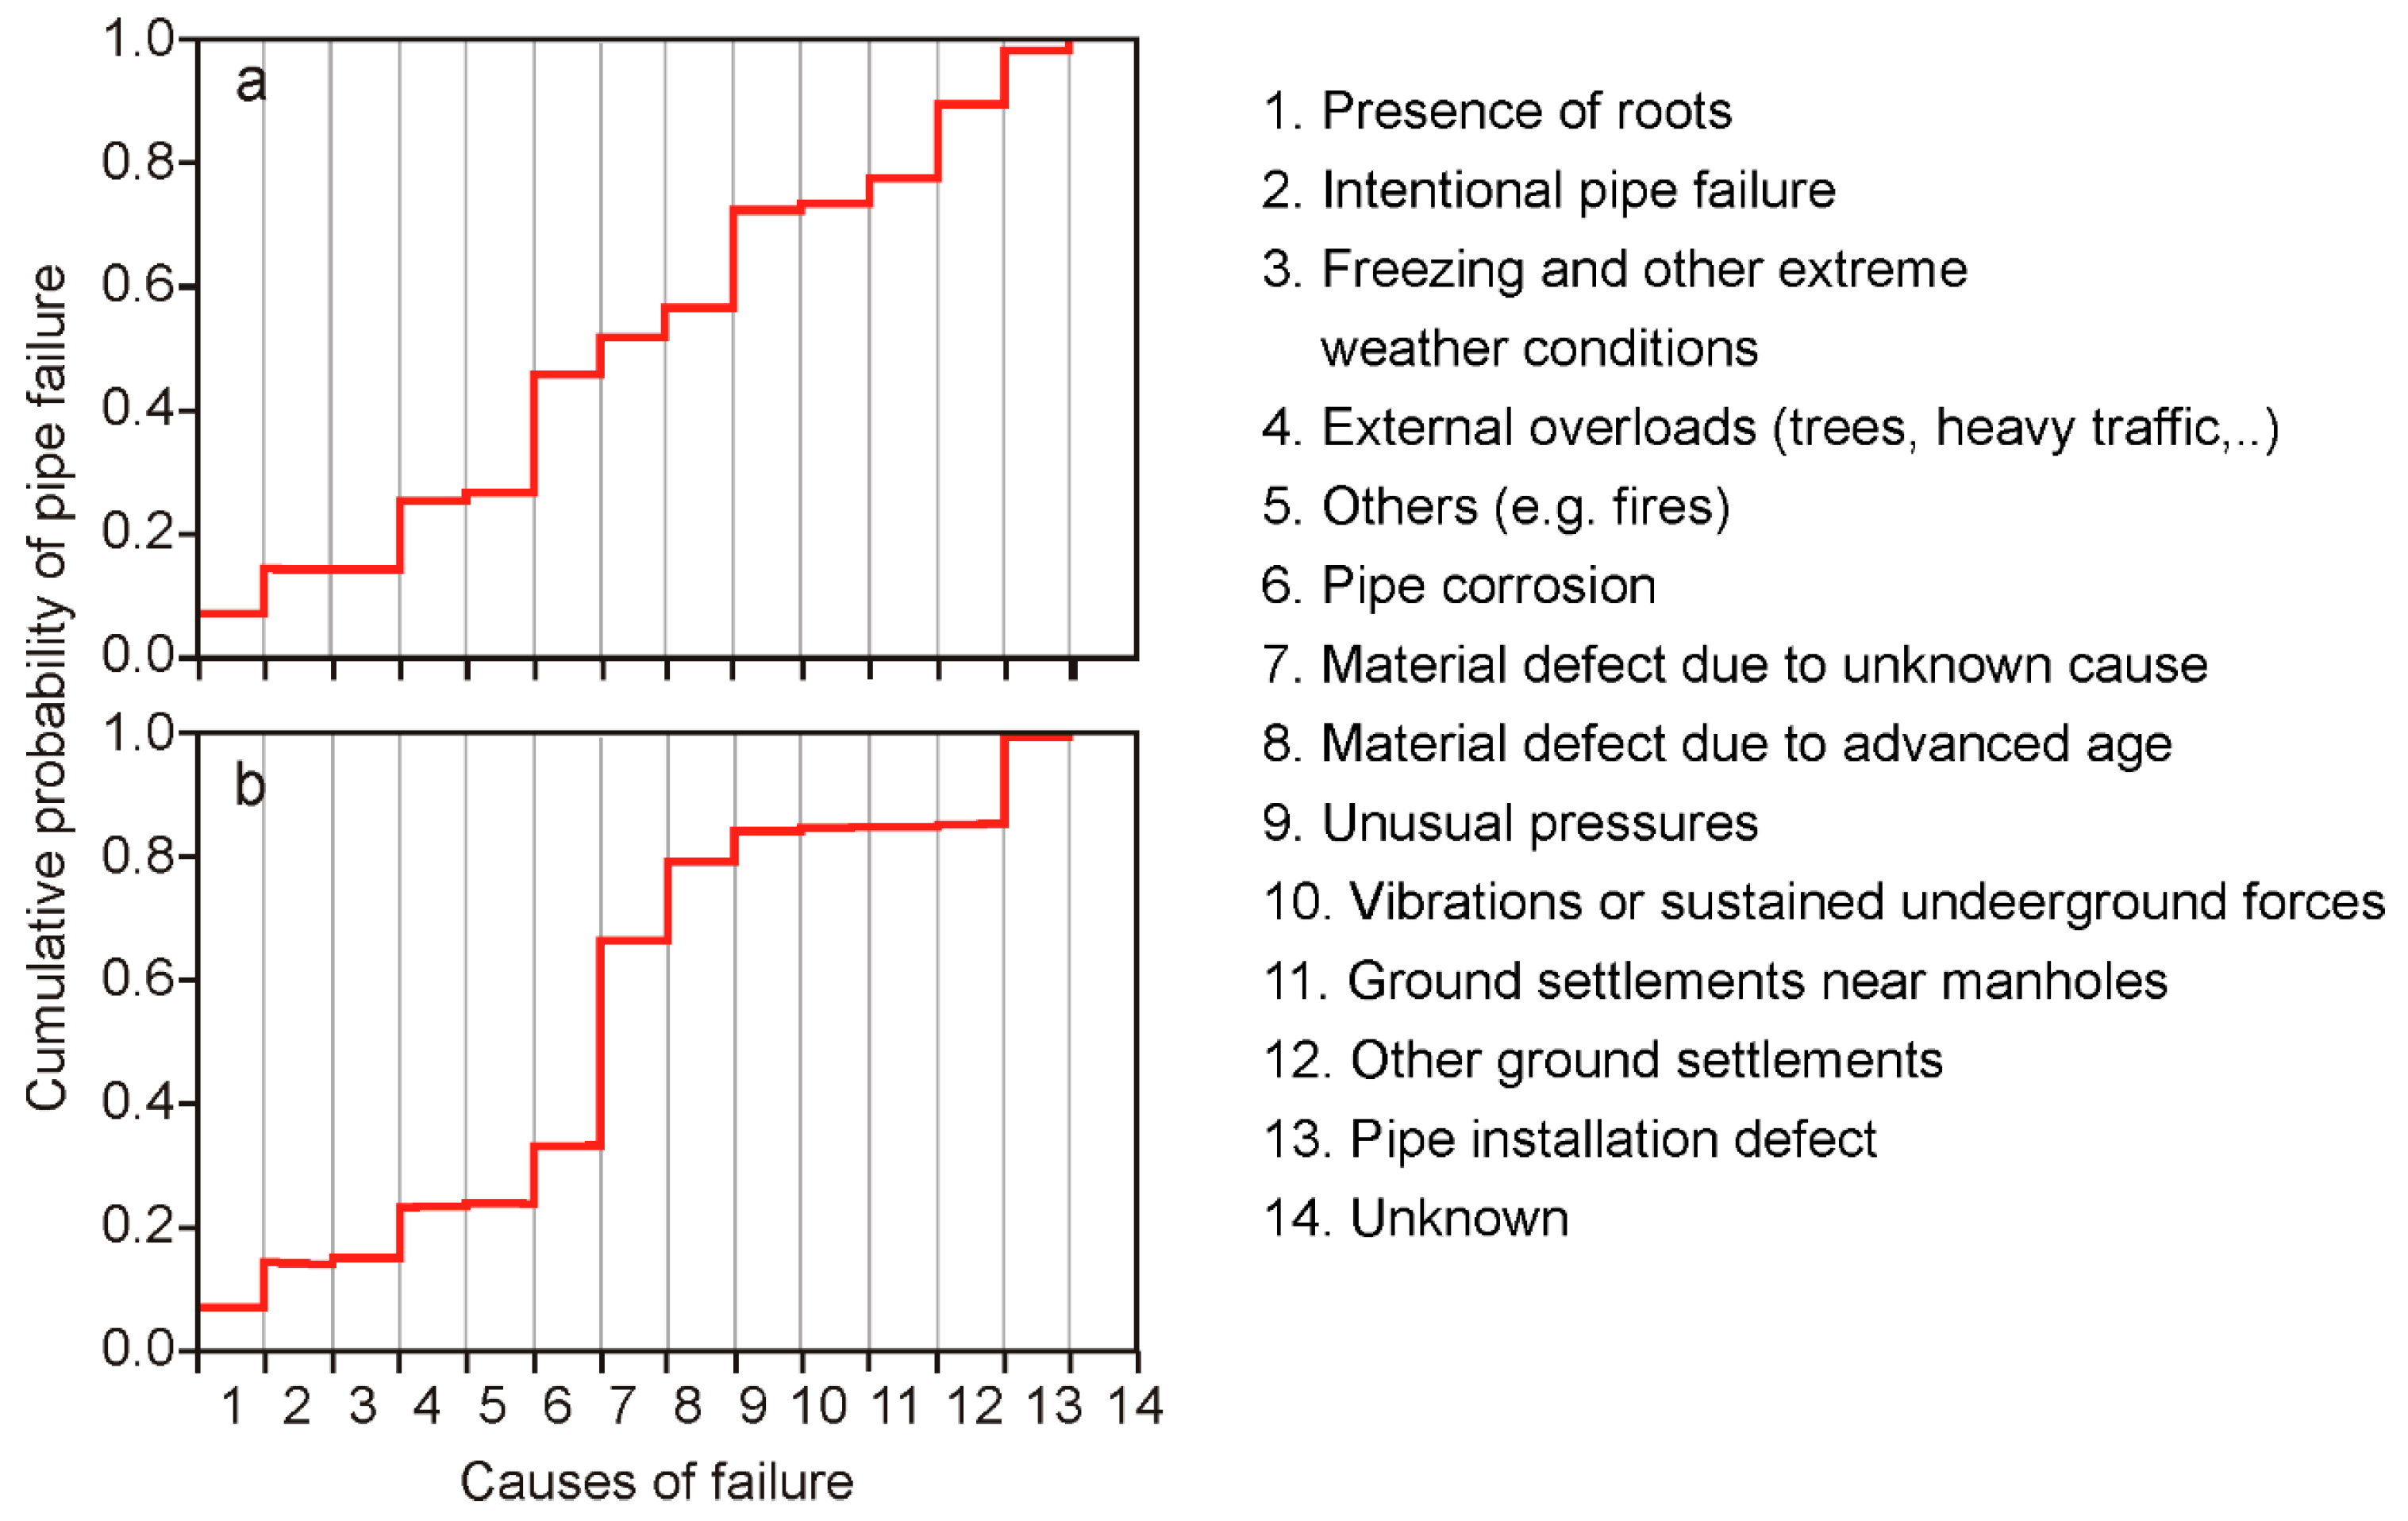
One of the most interesting models applied in a water utility context was utilized by Canal Isabel II (the water utility in the Madrid Community, Spain), using real pipe failure data, pipe condition assessments, and water distribution operational data. In that sense, they proposed a cumulative probability of failure in relation to different causes, as can be observed in
Figure 3. According to Martínez-Codina et al. [
34], the highest probability of failure corresponds mainly to corrosion (19.5%), followed by unusual pressures (16.3%), ground settlements (12.5%), external overloads (11.2%), and pipeline installation defects (8.7%). In this sense, specifically in reinforced concrete pipes, both the internal and external mortar layers act as barriers against oxidation and corrosion of the structural reinforcement that provides structural strength to the pipe. Therefore, a good condition of the mortar, and mainly its reinforcement, are crucial to the prevention of pipe failures, since almost 20% of pipe failures are attributed to reinforcement corrosion (
Figure 3). On the other hand, as mentioned above, if the mortar or reinforcement is in poor condition, it can lead to structural deterioration. In such cases, the pipe becomes more vulnerable to unusual pressures, ground settlements, and external overloads, which are secondary causes of failure.
Concerning reinforced concrete pipes (RCP), the mortar/concrete serves as a protective barrier against pipe corrosion and structural deterioration, since the reinforcement is typically not designed to resist corrosion. In addition, the reinforced concrete pipes in water utilities are usually large diameter, high strength, precast concrete pipes used in water and wastewater transmission mains, so the occurrence of a leak has huge consequences in water services, because the flows these pipes carry are often substantial; consequently, this type of pipe presents a special interest for operators in pipe asset management [
35]. Additionally, their weight makes them difficult and costly to transport for testing. Furthermore, their specific location (e.g., major streets) necessitates fast repair or renewal, precluding subsequent analysis, as they are typically transport pipes. This is why water utilities often do not analyze or test these types of pipes. However, a comprehensive understanding of these pipes is essential for any water utility, which is why this study was conducted.
By considering the main issues related to water management, such as limited resources (e.g., water scarcity), high demand leading to water stress, and outdated transport infrastructure which significantly reduces water resources due to leaks, along with the extensive prior research on this problem, our work aims to provide a speedy prediction of the structural resistance of concrete in reinforced concrete pipes and to assess their overall condition, thereby reducing pipe failures and leakages. In this context, the findings could be used to plan a renewal pipe campaign, since, as mentioned before, it is not feasible to renew the entire water distribution network every 50 years.
Considering the main causes of pipe deterioration, and recognizing the significance of mortar in assessing reinforced concrete pipes, this manuscript focuses specifically on identifying the key parameters associated with the deterioration of reinforced concrete pipes. Additionally, the manuscript aims to develop a predictive model useful for assessing the average concrete strength and pipe condition of reinforced concrete pipes.
2. Materials and Methods
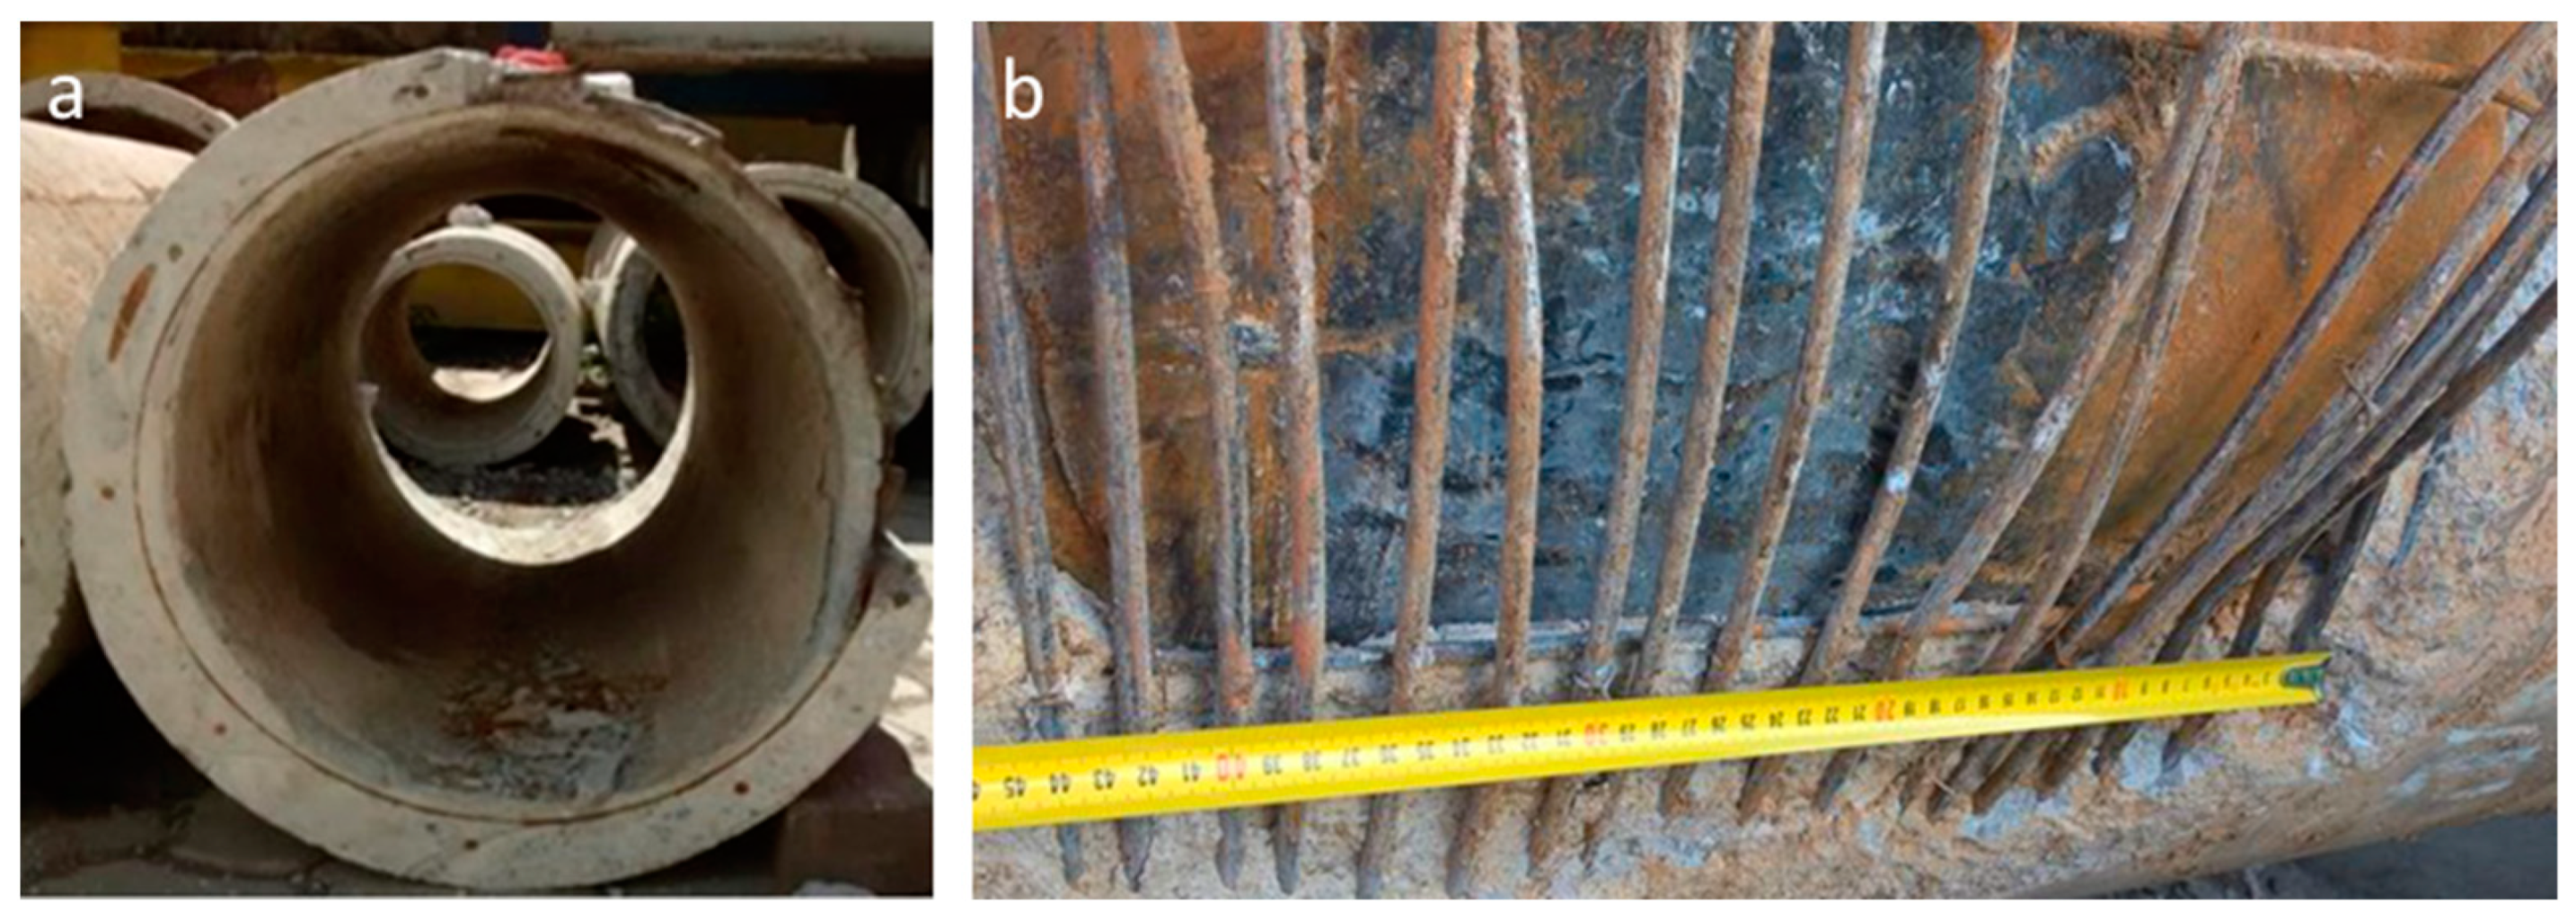
In the first stage of the study, segments of RCPs were collected from several water distribution networks in different locations of Catalonia (Spain). A total of 13 pipe reaches (with one or more samples per pipe reach) were inspected and analyzed (
Figure 4). Some of them presented instances of serious material damage, while the rest were apparently in perfect condition. However, in all cases, they were replaced, because the condition of the buried pipe cannot be verified until the trenching process has been initiated, and this is the most expensive practice in civil engineering. Given this circumstance, pipes are usually replaced once trench has been excavated.
For this research, all pipe reaches were stored at the Polytechnic University of Catalonia (UPC) facilities in order to perform a preliminary pipe characterization (pipe geometry, reinforcement diameter, mortar thickness, and manufacturing date, the last of which was provided by the water utility). On the other hand, an assessment of pipe condition, consisting of visual inspections, was also carried out for each pipe section. Drawing upon extensive experience in this field [
24,
34,
36], a set of potential key parameters was initially proposed to assess the deterioration of reinforced concrete pipes, along with the appropriate testing methods to be used to estimate these parameters. This section also shows the results obtained from the physical pipe characterization, visual inspection to assess pipe condition, and laboratory testing to estimate physical and mechanical properties of the pipes, as well as the chemical and microstructural characterization.
Once all pipe reaches were correctly characterized regarding the set of potential key parameters defined previously, a pipe dataset was generated in order to correlate key parameters associated with pipe condition assessment and develop a predictive model.
2.1. Potential Key Parameters for Estimating RCP Condition Assessment
According to Kleiner et al. [
24] and Martínez-Codina et al. [
34], structural deterioration is one of the main causes of pipe failure and pipe deterioration, and it can be classified into two categories. The first is structural deterioration, which reduces the pipe’s structural resilience and its ability to withstand various types of stresses. The second category involves the deterioration of the pipe’s inner surfaces, leading to reduced hydraulic capacity, extremely low water quality, and decreased structural resilience in cases of severe internal corrosion. In this context, some authors suggest establishing pipe groups based on particular properties that are known to influence pipe deterioration, such as diameter, manufacturing data, and material. They advocate for the grouping of pipes with similar characteristics, an attribute which also implies similar behavior in response to causes of internal and external degradation. Therefore, all of these pipe characteristics and properties should be regarded as key parameters for the estimation of structural deterioration.
On the other hand, other authors [
37] also consider the combination of internal and external degradation, pointing out that it causes a reduction in the structural integrity of the pipe cross-section, which could eventually lead to failure. In contrast, other authors [
36,
38] propose life expectancy models for reinforcement concrete structure regarding pipe characteristics such as water–cement ratio, cement proportion, strength, and thickness, which are directly related with concrete resistance.
According to the extensive literature [
24,
30,
34], the potential key parameters used to estimate reinforced concrete pipe deterioration should include diameter, manufacturing age, internal and external mortar thickness, cement ratio, and water–cement ratio, although these last two parameters are usually unknown, since they can only be estimated during the manufacturing process. In this sense, the internal and external mortar density and the porosity could be considered as indirect parameters for their estimation.
As mentioned, it is not possible to directly quantify the water–cement ratio and cement proportion from density and porosity, but there exists an indirect relation between these pairs of attributes [
39,
40]. Furthermore, it is also possible to evaluate the effects on long-term concrete durability due to porosity [
41,
42]. In that sense, the behavior with respect to durability determined in aging tests is related to the formulation, and hence, to the porosity.
Based on an extensive search of the literature and the observation of cases in several distribution water networks, the following list of potential key parameters for estimating the deterioration of reinforced concrete pipes has been developed (
Table 1), considering standard environmental conditions.
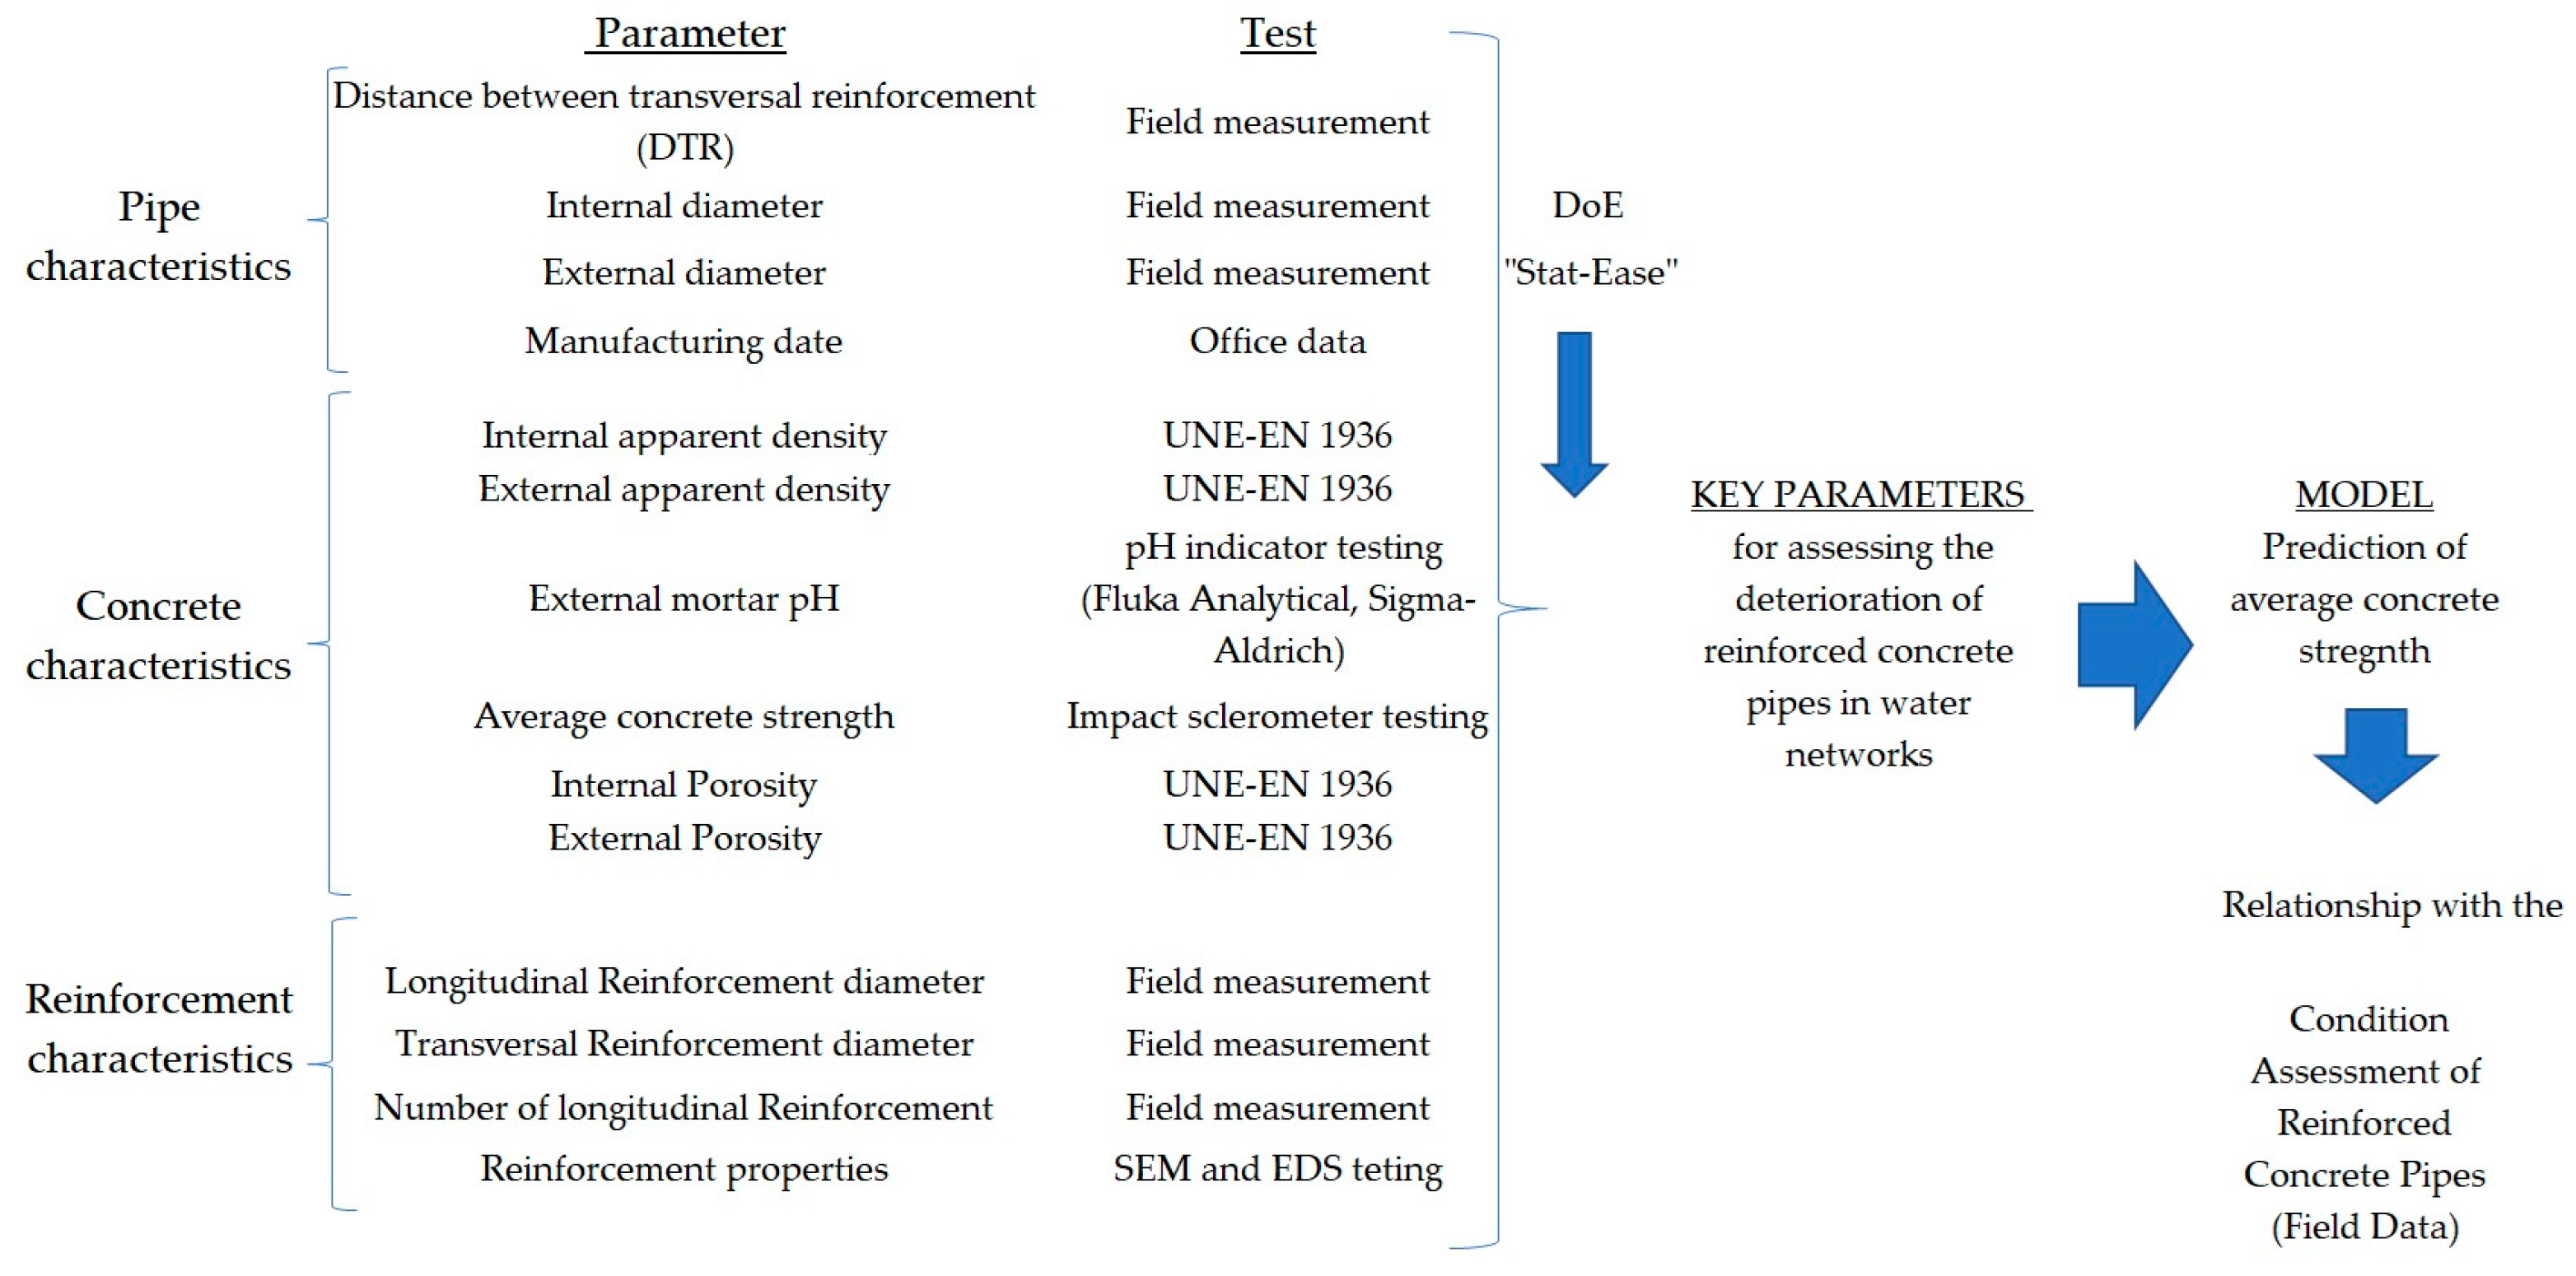
On the other hand,
Figure 5 shows a diagram of all the parameters considered in the study, as well as the tests conducted and the steps used to develop the model for predicting the structural resistance of concrete in reinforced concrete pipes.
Table 1.
Potential key parameters proposed in this study for estimating pipe condition assessment of RCP.
Table 1.
Potential key parameters proposed in this study for estimating pipe condition assessment of RCP.
| Parameter Name | Units | Observations |
|---|
| Internal apparent density | g/cm3 | Detailed information in Section 2.3.3 |
| External apparent density | g/cm3 | Detailed information in Section 2.3.3 |
| External mortar pH | | Detailed information in Section 2.3.2 |
| Distance between transversal reinforcement (DTR) | mm | See Figure 6 |
| Average concrete strength | N/mm2 | Detailed information in Section 2.3.1 |
| Internal diameter | mm | See Figure 6 |
| External diameter | mm | See Figure 6 |
| Manufacturing date | Year | Detailed information in Section 2.2 |
| Steel casing thickness | mm | See Figure 6 |
| Longitudinal reinforcement diameter | mm | see Figure 6 |
| Transversal reinforcement diameter | mm | See Figure 6 |
| Number of longitudinal reinforcement | units | See Figure 6 |
| Internal porosity | % | Detailed information in Section 2.3.3 |
| External porosity | % | Detailed information in Section 2.3.3 |
| Pipe condition assessment | Categorical | Detailed information in Section 2.2 |
2.2. Geometry and Materials of RCP
Pipe characteristics, such as internal and external pipe diameter and pipe thickness, were measured in situ for each pipe reach; in addition, the pipe condition was assessed, and pipe manufacturing data were provided by water utility operators for each pipe reach. The assessment of pipe conditions was evaluated by water operators according to the following attributes: the pipes were considered to be in bad condition if they were not suitable for water distribution, with a significant flow leakage; in fair condition if they showed appreciable signs of deterioration but no leakage flow; and in good condition if they showed no signs of deterioration and no leakage flow. This data is shown in
Figure 6 and
Table 2.
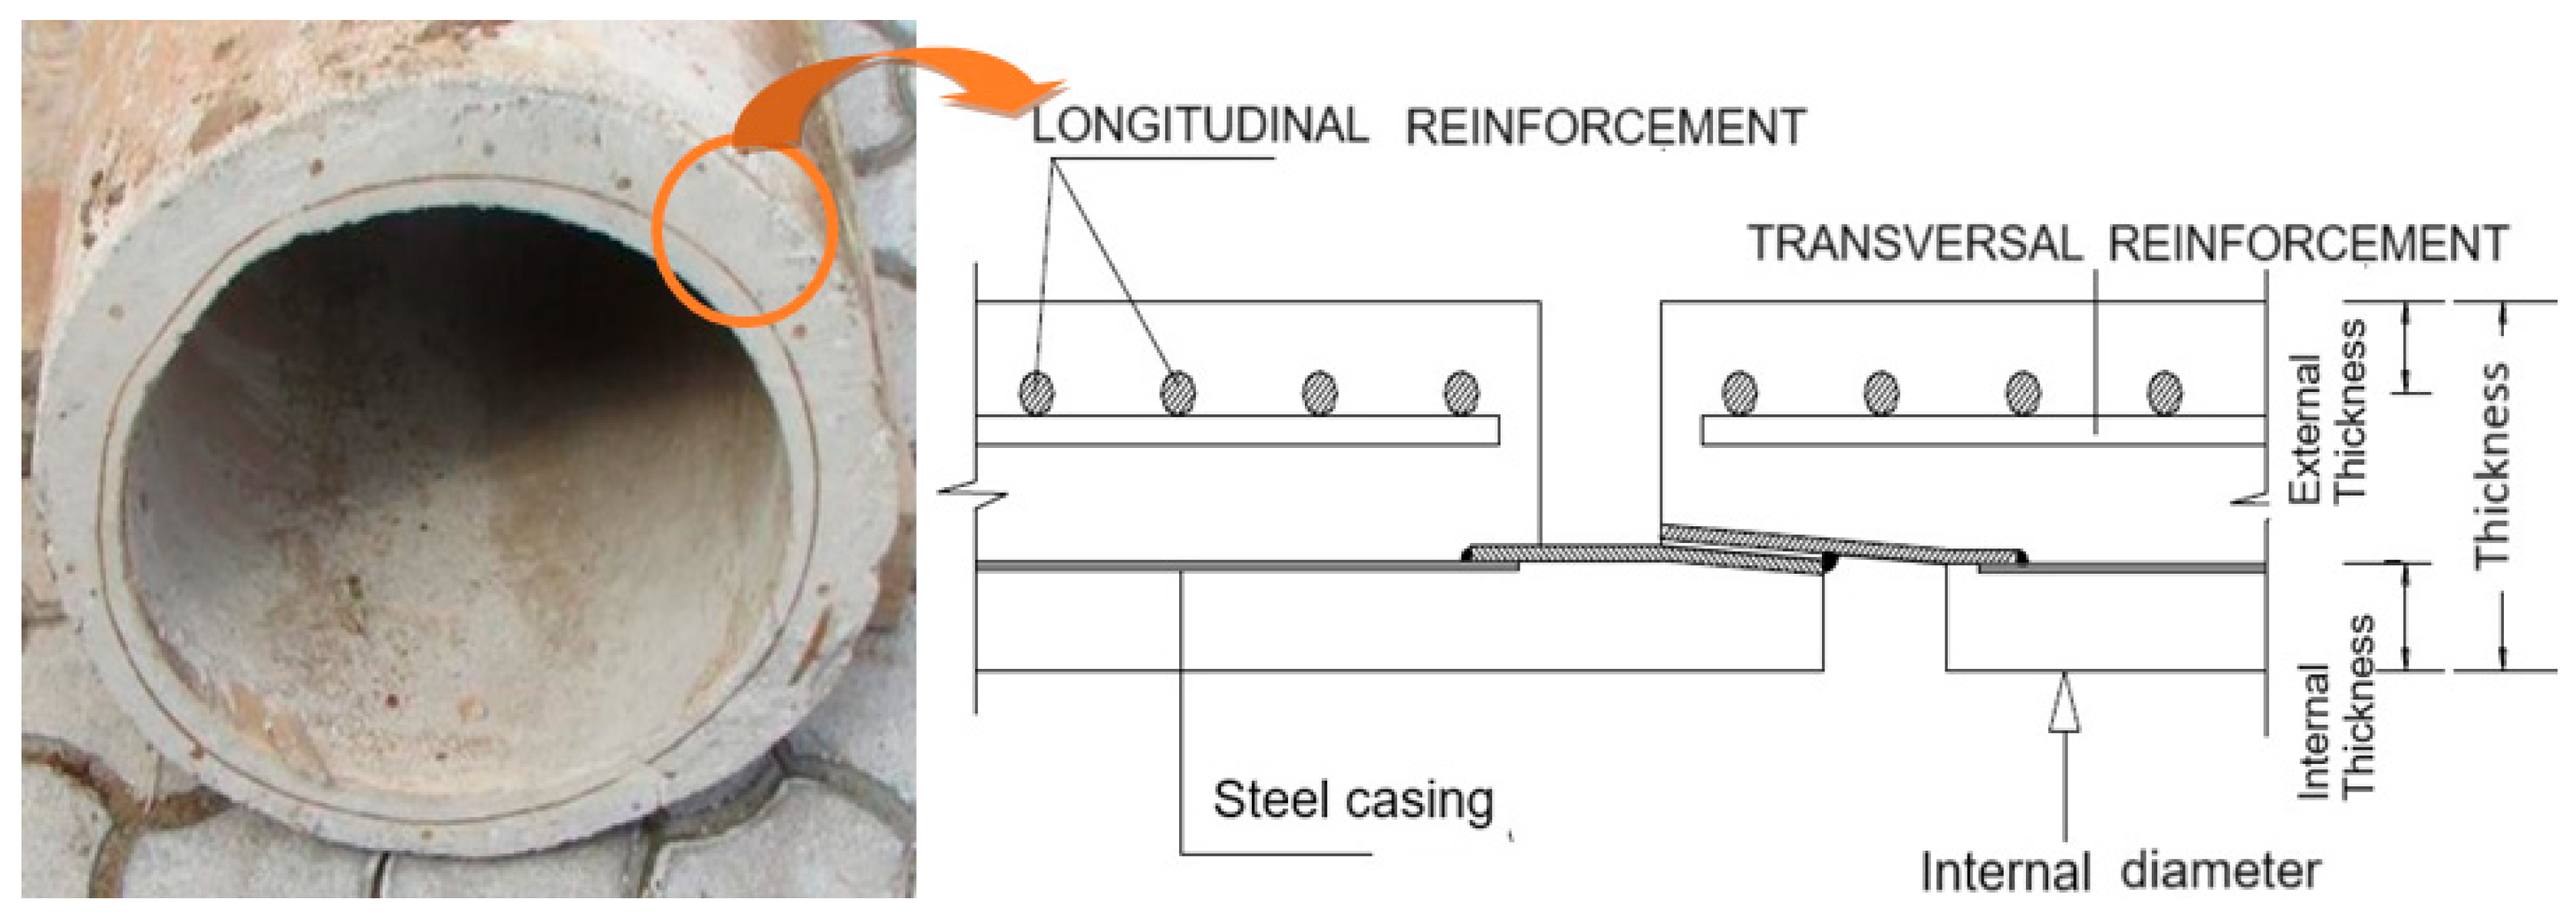
The reinforcement in the RCP typically consists of two elements: (1) a mesh made up of longitudinal and transverse reinforcement, with diameters ranging from ∅6 to ∅8 (in this study), and external mortar thickness around 30 mm; and (2) a steel casing thickness of around 1 mm and an internal mortar thickness of around 20 mm (
Figure 6 and
Figure 7). The reinforcement diameter (both longitudinal and transversal), the steel casing thickness, and the number of longitudinal reinforcements and the distance between transversal reinforcements are detailed in
Table 3.
According to several authors [
24,
43], pipes classified as being in poor condition usually present a high degree of corrosion. They suggest that there is a real link between structural deterioration and corrosion. In this sense, the reinforcement and steel casing condition were also evaluated in all pipe reaches, and metal properties were characterized in certain pipe reaches to assess their resistance to corrosion in following sections.
All pipe reaches were built with similar materials and reinforcement characteristics, such as longitudinal and transversal reinforcement diameter, number of longitudinal reinforcement, and steel casing thickness (
Table 2 and
Table 3); this is reasonable, due to the fact that all of these pipes are main pipes of water distribution systems, with external diameters in the range of 300–550 mm.
2.3. Testing Procedures
Regarding the potential key parameters list presented in the last section, several destructive and non-destructive forms of testing were proposed in order to characterize the pipe reaches.
2.3.1. Impact Sclerometer Testing
Due to the difficulty of sampling for compression testing, the use of an impact sclerometer was proposed in order to estimate the resistance of the concrete (mortar) according to the Spanish standard UNE-EN 12504-2:2022 [
44]. Although this method could present a high dispersion, it allows a real evaluation of the concrete. To perform this test, a grid of points is drawn for each pipe sample, evenly distributed over its entire outer surface, and separated from each other by a distance of no less than 25 cm. The reading with the sclerometer is carried out perpendicular to the surface. Three readings were taken at each measurement point, discarding the first one due to the possible interference that the existing dirt could cause.
Table 4 shows the summary of the average concrete strength for each of the 13 pipe reaches; several sections were tested in some pipe reaches, resulting in 18 pipe sections being analyzed by the sclerometer. The average concrete strength for each pipe reach represents the average concrete strength of all grid points for all of its sections. In this sense, the average concrete strength ranges from 9.2 N/mm
2 to 49.8 N/mm
2. This is a wide range of concrete resistance, but it is not unusual; the goal of the study was to obtain a heterogeneous set of samples for pipe condition assessment, representative of the entire water distribution network.
2.3.2. pH Testing
The carbonation of concrete is an inevitable process in structures exposed to the atmosphere. If it occurs, the pH of the concrete gradually decreases from initial values of 12–13 to below 10. For pH levels below 10–11, the reinforcement is no longer protected (depassivation), initiating corrosion of the steel. The corrosion rate increases as the pH decreases. This section shows the tests conducted to assess the pH for the concrete pipes; tests were conducted in every pipe section (
Table 4). An indicator of pH (Fluka Analytical, Sigma-Aldrich manufactured by Merck KGaA company (Darmstadt, Germany) with a coloration range between 3 and 10 was used for this purpose. The results show an external pH slightly higher than the internal pH, but in all cases, the values are above 8.9, indicating a basic environment in all samples. However, according to some authors, depassivation starts below a pH of 9 (see Sumra et al. [
45]).
2.3.3. Apparent Mortar Density and Porosity Testing
To determine the density and porosity of the concrete, the procedure proposed in the UNE-EN 1936 Spanish standard has been followed, see [
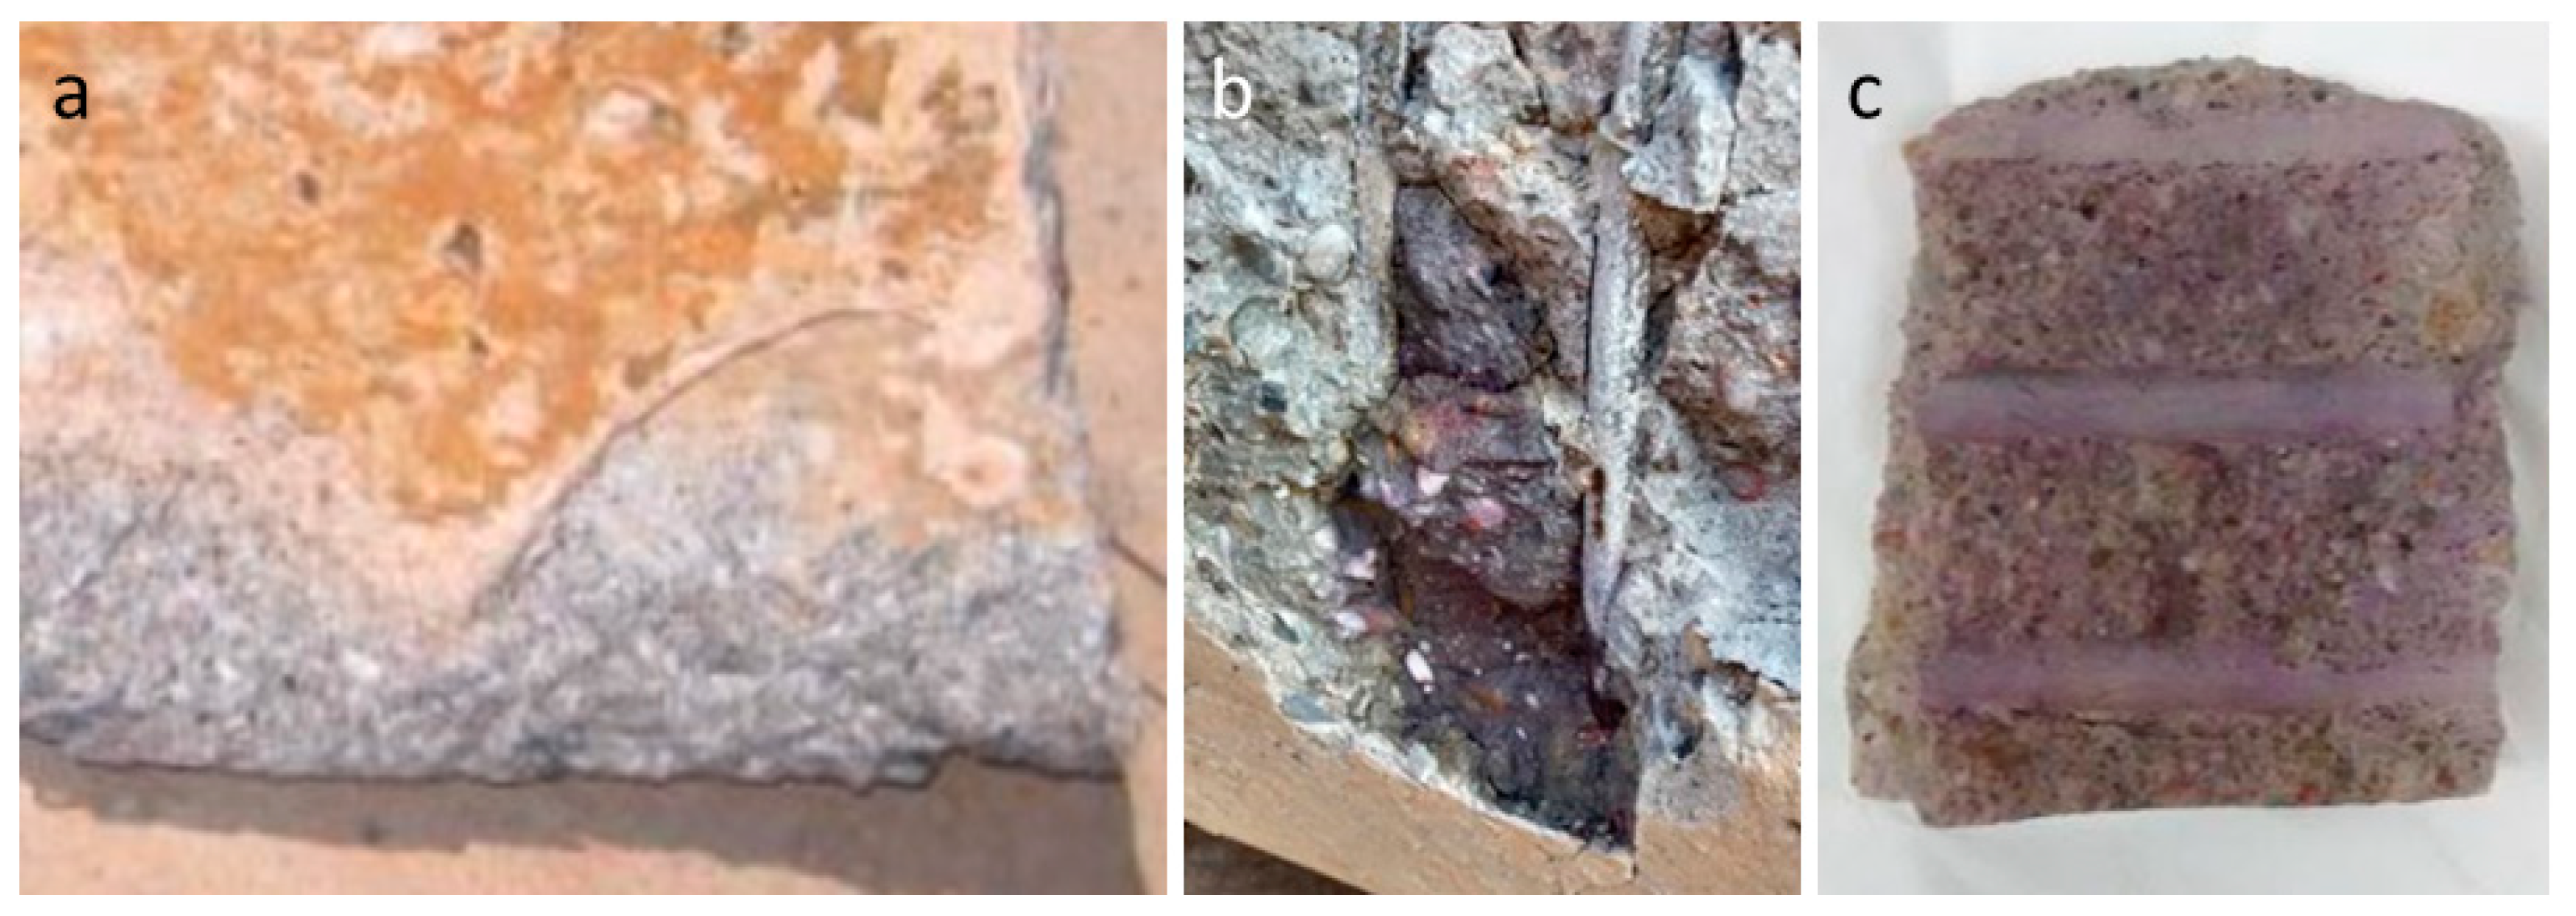
46]. The samples were obtained from undamaged areas of pipes on both sides, including external and internal coatings. In total, 36 samples were extracted (
Figure 8).
Regarding the testing processes, the samples were placed into an oven at 65 °C until they reached a constant weight after 96 h (m
dry). Next, they were immersed in water for 48 h until saturation, and their saturated mass with dry surface (m
sd) and their immersion mass were determined using a hydrostatic balance (m
inm). The densities of the material (ρ
real and ρ
apparent) and its porosity are obtained using Equations (1)–(3), respectively:
Table 5 shows the average values of apparent density and porosity from both sides of the pipe coating (internal and external). The sample densities were measured between 1.88 g/cm
3 and 2.18 g/cm
3, values lower than the usual values for conventional concrete (2.3 g/cm
3). In that sense, the sample porosities were measured between 16.6 and 28.5%. Regarding density, external density is not generally higher than internal density in the samples. A similar pattern is observed with porosity. However, in both cases, there is a significant range of values, indicating high heterogeneity among the samples.
In this scenario, the higher porosity and lower density of the concrete may have favored water infiltration into the steel casing and reinforcement (protected by almost 2 cm of external and internal concrete coating), resulting in corrosion, subsequent loss of section thickness, and ultimately, the pipe’s collapse due to insufficient reinforcement, as caused by steel oxidation.
2.3.4. Metallographic Testing
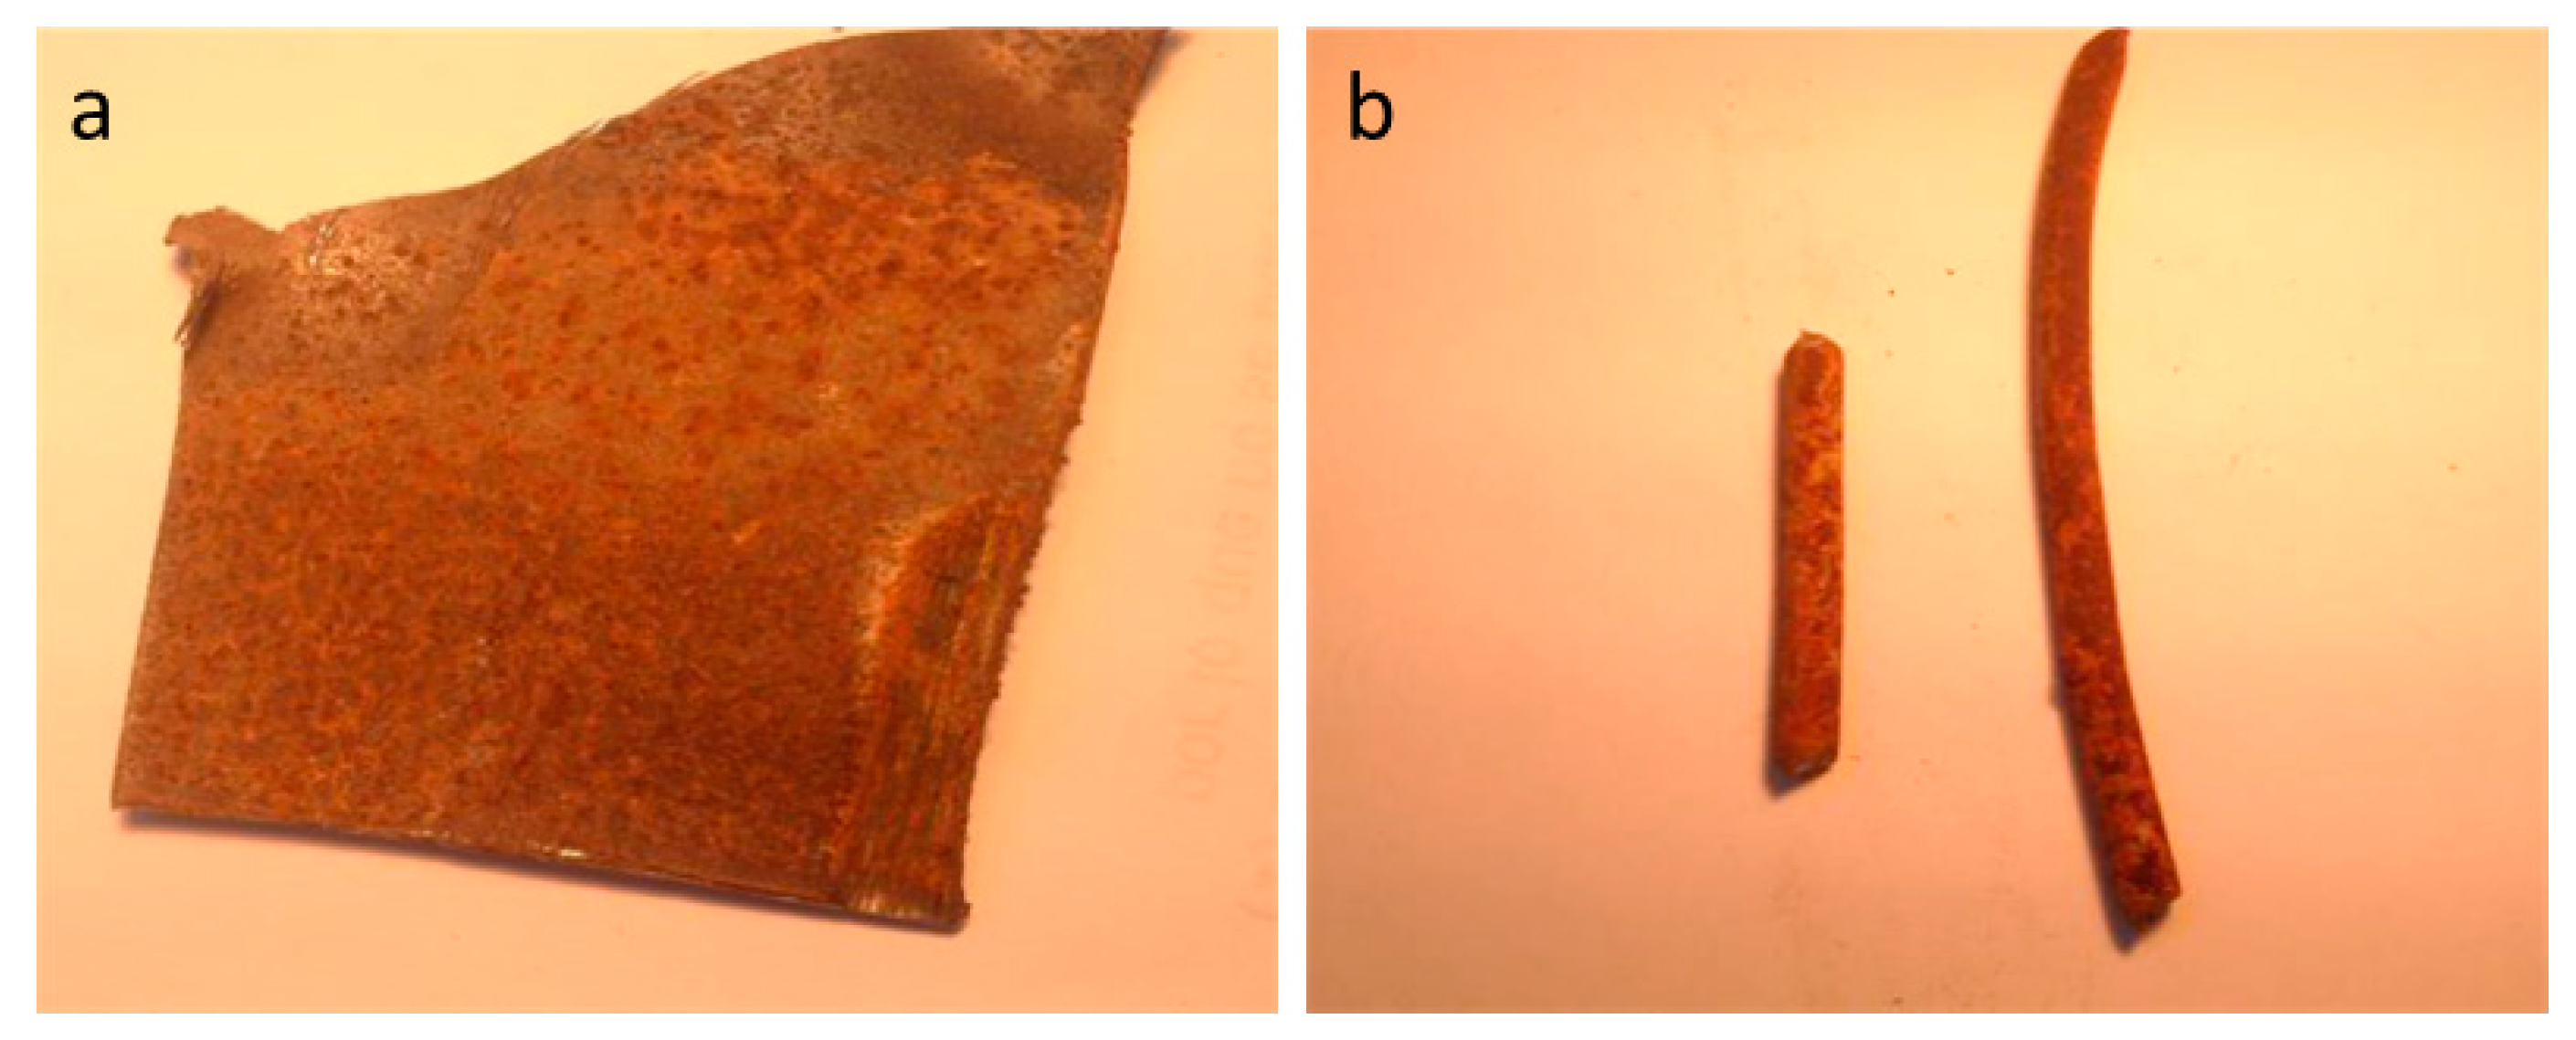
The steel alloy was analyzed, considering the high significance of this element in structural deterioration. In this sense, all pipe reaches were manufactured between the 1960s and the 1980s, so two pipe reach samples (from the 1960s and the 1980s) of steel casing and longitudinal and transversal reinforcement were analyzed to evaluate the steel composition (concretely, samples of pipe reach nº1 and nº4). These samples present generalized and uniform surface corrosion (
Figure 9,
Table 6). In general, this type of corrosion is not particularly negative; although the entire surface is corroded, the overall corrosion rate is low. This is because a surface layer of corrosion products is formed that protects the steel from further internal corrosion. However, this layer is not protective enough to prevent long-term degradation of the steel.
All samples were prepared for metallographic analysis, using a Fei Quanta 200 Scanning Electron Microscope (SEM) equipped with an energy-dispersive X-ray spectrometer detector (EDS), for semi-quantitative analysis of the oxides generated on the steel surface. The steel structures studied for pipe reaches No. 1 and No. 4, comprising steel casing and longitudinal and transversal reinforcement, are shown in
Figure 10.
The steel, as well as the steel casing and longitudinal and transversal reinforcement, has a ferritic–pearlitic structure, with low carbon content. On the other hand, the steel casing of pipe reach nº1 shows a high number of iron carbide particles (cementite, Fe3C) and a larger grain size than the rest of the steels examined, which suggests that it was subjected to a carbide globalization process. This process improves corrosion resistance, at the cost of sacrificing mechanical strength.
The grain size of almost all of the steels was estimated to be between 30–50 µm, which is a small grain size. The steel casing of pipe reach nº1 has an average grain size of 80–100 µm, which can be considered large.
The compositions of the different steels are provided in
Table 6. These are standard steels, without special alloying elements. The sulfur (S) content is within the normal range, although steels with lower sulfur content are currently manufactured. Sulfur is present in the form of manganese sulfide (MnS) and mixed calcium and manganese sulfide ((Mn,Ca)S). The presence of these sulfides indicates that the steel underwent desulfurization using products containing calcium, which is an effective desulfurizing agent.
From the metallographic analysis, the following conclusions can be drawn: (1) The steels exhibit a composition characteristic of standard, non-alloyed steels in all samples. (2) There is an absence of alloying elements in all samples. (3) These are cost-effective steels, with acceptable levels of corrosion resistance found in all samples.
In this context, it can be concluded that although the steel casing and the longitudinal and transversal reinforcements were designed to withstand corrosion, they were not intended to endure prolonged exposure to water. The mortar was supposed to act as a barrier against water, but in some cases, it failed to do so.
2.4. Predictive Model for Concrete Reinforcement Pipe Assessment
To elucidate the relationship between key parameters and the deterioration of the concrete reinforcement pipes, as well as to assess the condition of the pipes, a design of experiments (DoE) was carried out using the “Design Expert 7.0” software from Stat-Ease. The DoE approach is useful for identifying which variables (in our case, the key parameters estimated in
Section 2.4) have the greatest impact on the response (in our case, average concrete strength, which was measured by impact sclerometer testing, as described in
Section 2.3.1). Additionally, a reduction in average concrete strength is a sign of deterioration in concrete reinforcement pipes, as indicated by sources [
47,
48,
49], which will be examined in
Section 4. Furthermore, a DoE allows us to build a model to predict the average concrete strength in a reinforced concrete pipe, which can then be used to evaluate the status of the pipe’s deterioration. In this study, the status of the pipe’s deterioration was evaluated by water operators (good, fair, and bad), as described in
Section 2.2.
The DoE allows for a maximum of information with a minimum number of experiments performed to establish relationships among parameters. This technique helps to determine whether or not there is a synergistic effect between the variables as to the final results. Furthermore, a DoE allows researchers to deduce which of the parameters influence the optimal performance of the process and to quantify the effect on the process according to the variation of the factors analyzed.
The statistical design chosen to realize the DoE was the historical data design based on Response Surface Methodology (RSM), which allows a further optimization of the process. The analysis of DoE results is based on the analysis of variance (ANOVA), which is a statistical method used to determine whether there are significant differences between the means of three or more groups. In this case, p and F values have been used to interpret the obtained results. The p-value indicates whether the factor has made a significant contribution to the model. The F-value is defined as the ratio of the Model SS/Residual SS (Model SS and Residual SS refer to the regression and error sums of squares, respectively).
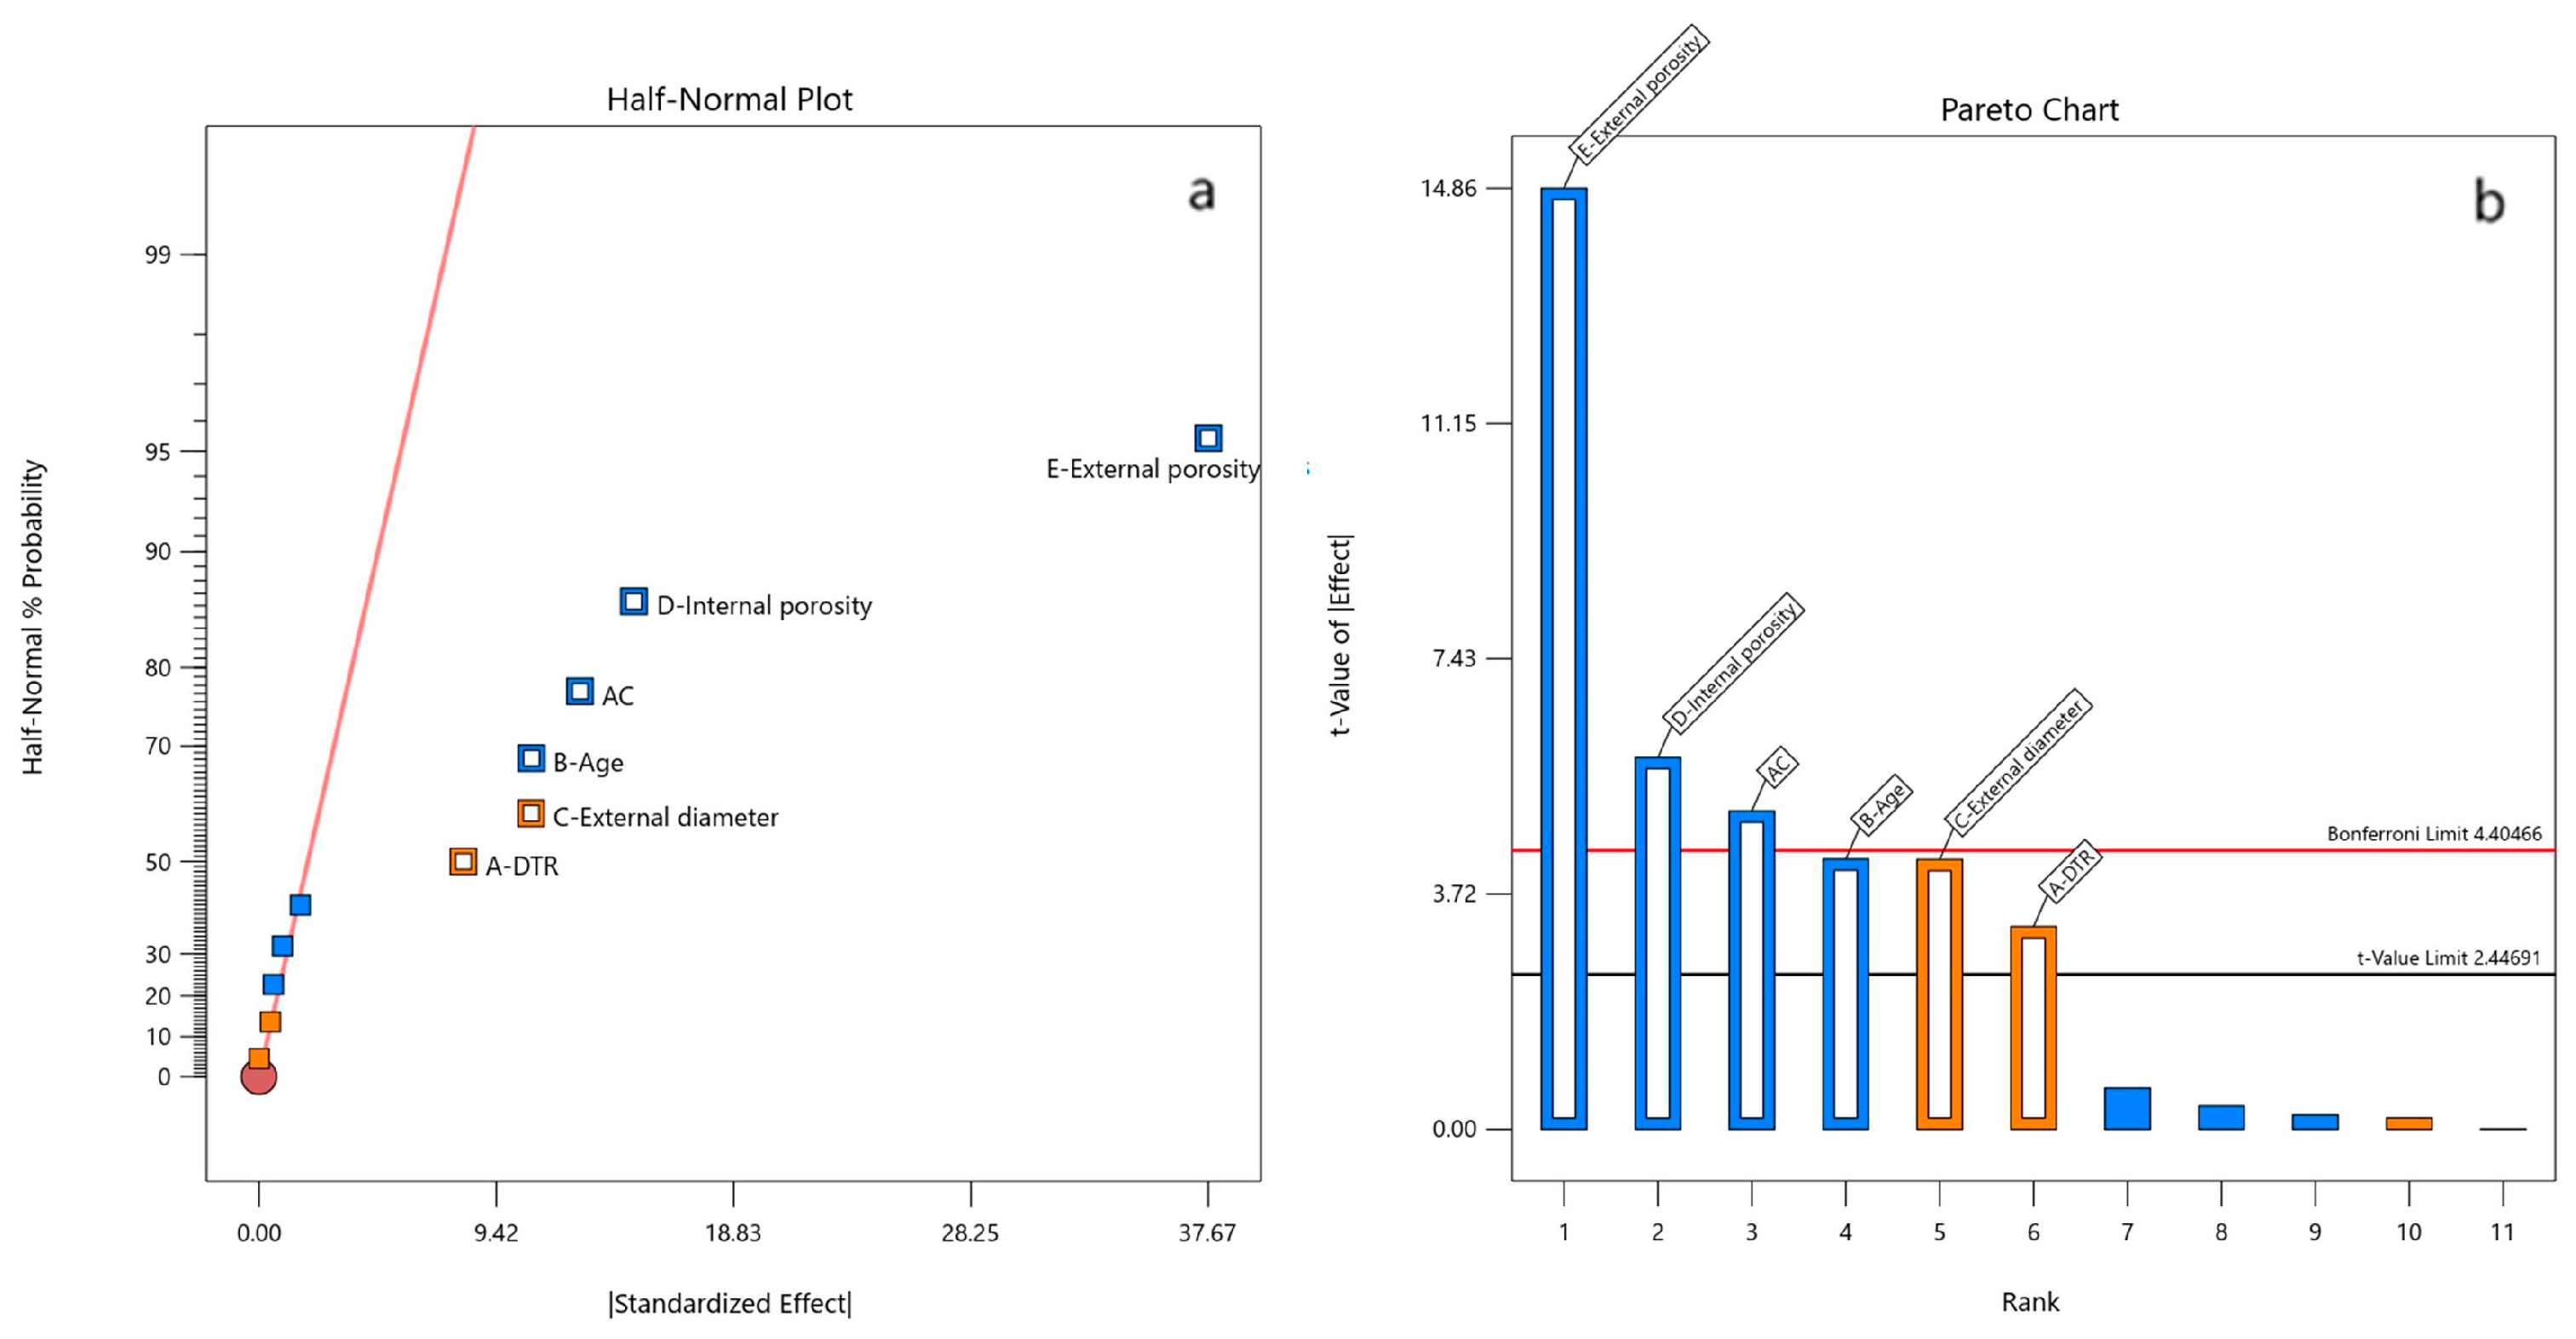
A preliminary analysis was conducted using all potential factors measured during testing, including internal density, external density, internal porosity, external porosity, DTR, internal diameter, external diameter, and age. A Pareto chart was generated, as shown in
Figure 11. Note that the factor “age” is derived from the manufacturing date. For example, a manufacturing date of 1982 is considered to be 42 years, since this paper is written in 2024.
This chart helps to elucidate which factors are statistically significant, with a 95% level of confidence. From all the factors, internal and external porosity, age, distance between transversal reinforcements (DTR), and external diameter were determined to be the factors that mainly affect the mechanical properties. This can be seen in
Figure 11, in which the Half-Normal % Probability and Pareto chart plots are displayed. These set of independent variables, also known as key parameters, were considered in order to develop the response surface model. The main factor that directly affects average concrete strength is external porosity. Both internal and external porosity show negative effects on mechanical properties while mainly external diameter shows positive effects.
The key factors identified in the previous analysis are presented in
Table 7, along with the model response variable, which is defined as the average concrete strength.
3. Results and Discussion
The results obtained using the DoE application were the key factors used in assessing deterioration in concrete reinforcement pipe; in addition, a predictive model was built to assess the average concrete strength.
The analysis of the DoE results is based on the analysis of variance (ANOVA). A
p-value lower than the level of significance (α = 0.05) indicates a significant contribution of the factor, with a 95% level of confidence. Large F-values indicate significant contributions, while small values denote that the variance could be affected by noise [
50]. The model obtained is statistically significant, with a lower
p-value and a small probability of being originated by noise. In this case, the best model fitting was the reduced factorial model, the ANOVA results for which are shown in
Table 8. The model F-value of 49.33 implies the model is significant, and there is only a 0.01% chance that an F-value this large could occur due to noise. The
p-values less than 0.0500 indicate that the model terms are significant. In this case all five variables, namely, external diameter, age, DTR, internal porosity, and external porosity, are significant model terms which directly have an effect on average concrete strength, with
p-values of 0.0053, 0.0053, 0.0186, 0.0011, and <0.0001, respectively; see
Table 8. Considering the results of the analysis, all variables show
p-values lower than 0.05, indicating that there is a statistically significant difference between at least one pair of groups. Therefore, the
p-values demonstrate the statistical significance of these results. In this sense, external porosity shows a
p-value lower than 0.0001, highlighting the significance of this parameter. Additionally, the F-values are quite high, further indicating significant differences between groups and that the explanatory variable has a significant impact on the response variable.
The fit statistics of the model are presented in
Table 9, where the predicted R
2, 0.8860, shows good agreement with the adjusted R
2, 0.9603. Adequate precision measures the signal-to-noise ratio, with a ratio greater than 4 being desirable. A predicted R
2 of 0.8860 (or 88.60%) suggests that the model has good predictive capability, though slightly less so, when compared to the R
2 and adjusted R
2. The model is strong in predicting new data, but slightly less effective than when explaining the training data.
The obtained ratio of 23.079 indicates sufficient signal. This model can be used to explore the design space.
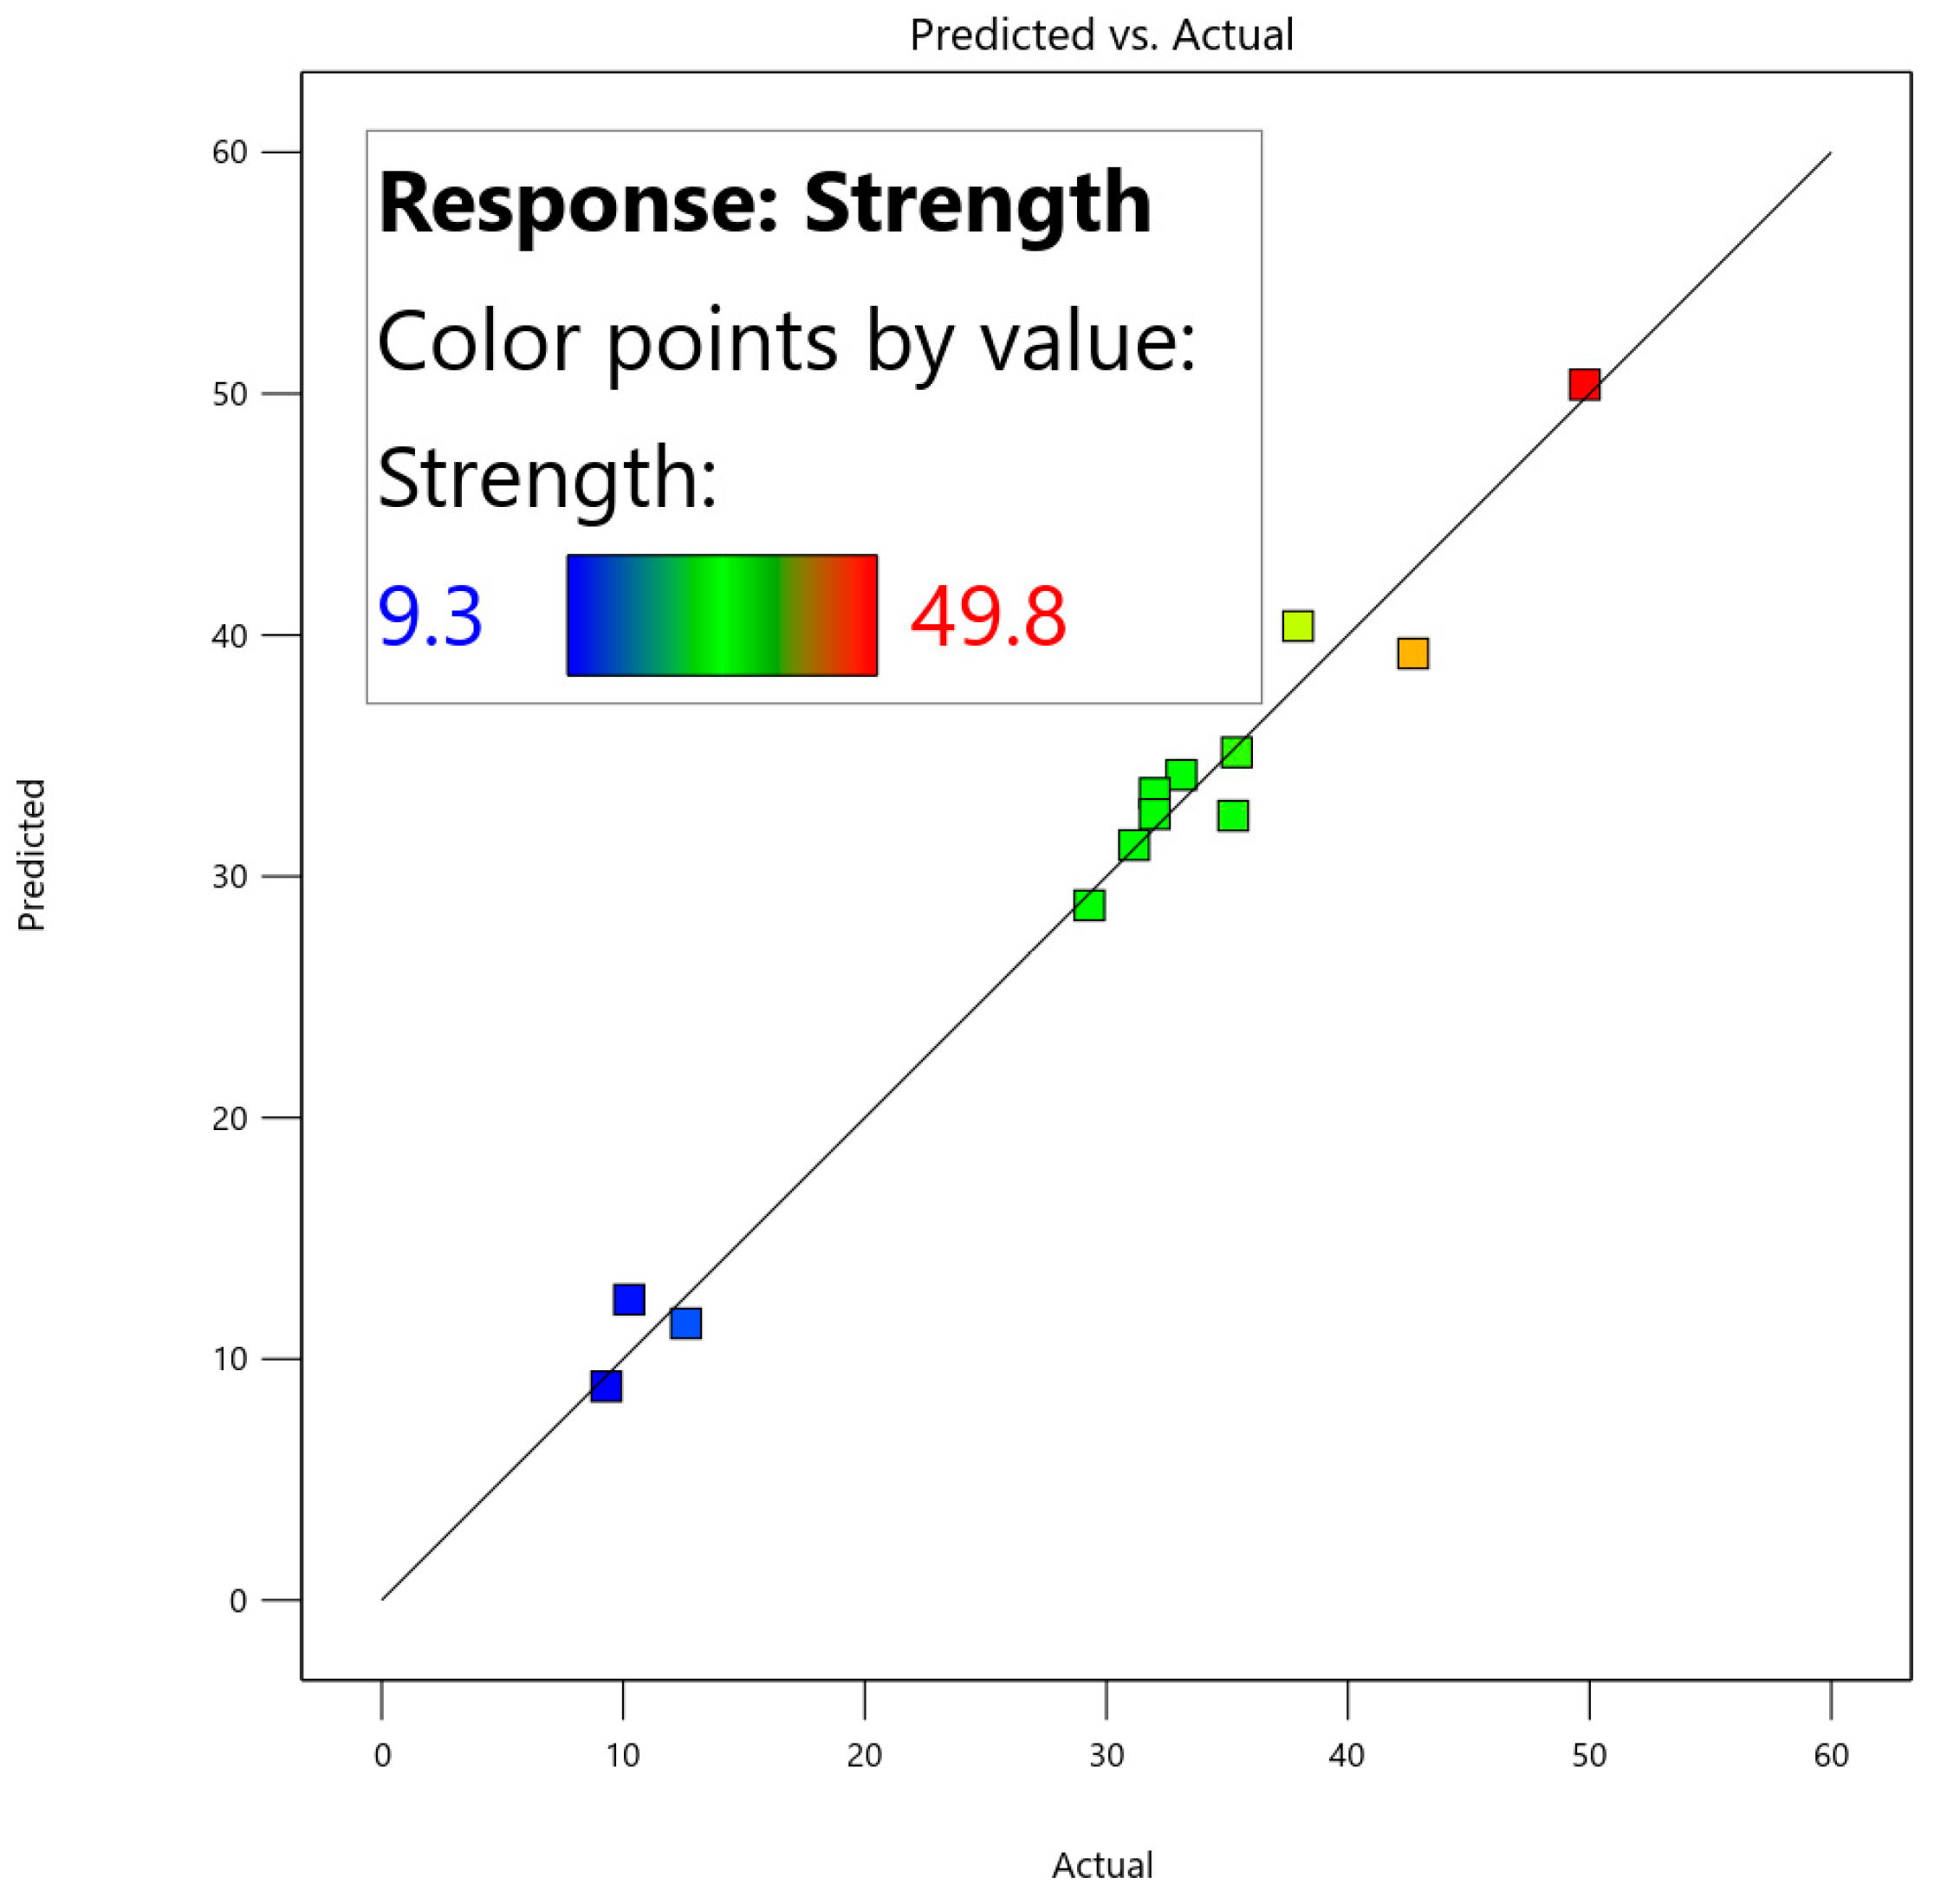
Figure 12 plots the predicted results versus the actual results for the mechanical properties, following a normal distribution.
All the results derived from the modification of any of the controllable variables can be translated into a predictive mathematical model. Considering the mechanical properties, the model can be written according to an equation, both in terms of coded factors (Equation (4)) and in terms of actual factors (Equation (5)). Both equations can be used to make predictions about the responses associated with given levels of each factor. The coded equation is useful for identifying the relative impact of the factors by comparing the factor coefficients. The equation in terms of actual factors should not be used to determine the relative impact of each factor, because the coefficients are scaled; it should be used to estimate average concrete strength.
Considering the coded equation, it is noted that external porosity has the highest effect on the mechanical properties, and this effect is negative, reducing mechanical properties. Age also acts in the same way; the longer the pipe has been in service, the worse its mechanical properties. To the contrary, DTR has the least effect on the response, but enhancing DTR and external diameter together reduces mechanical properties, which makes it difficult to evaluate DTR as a lone variable.
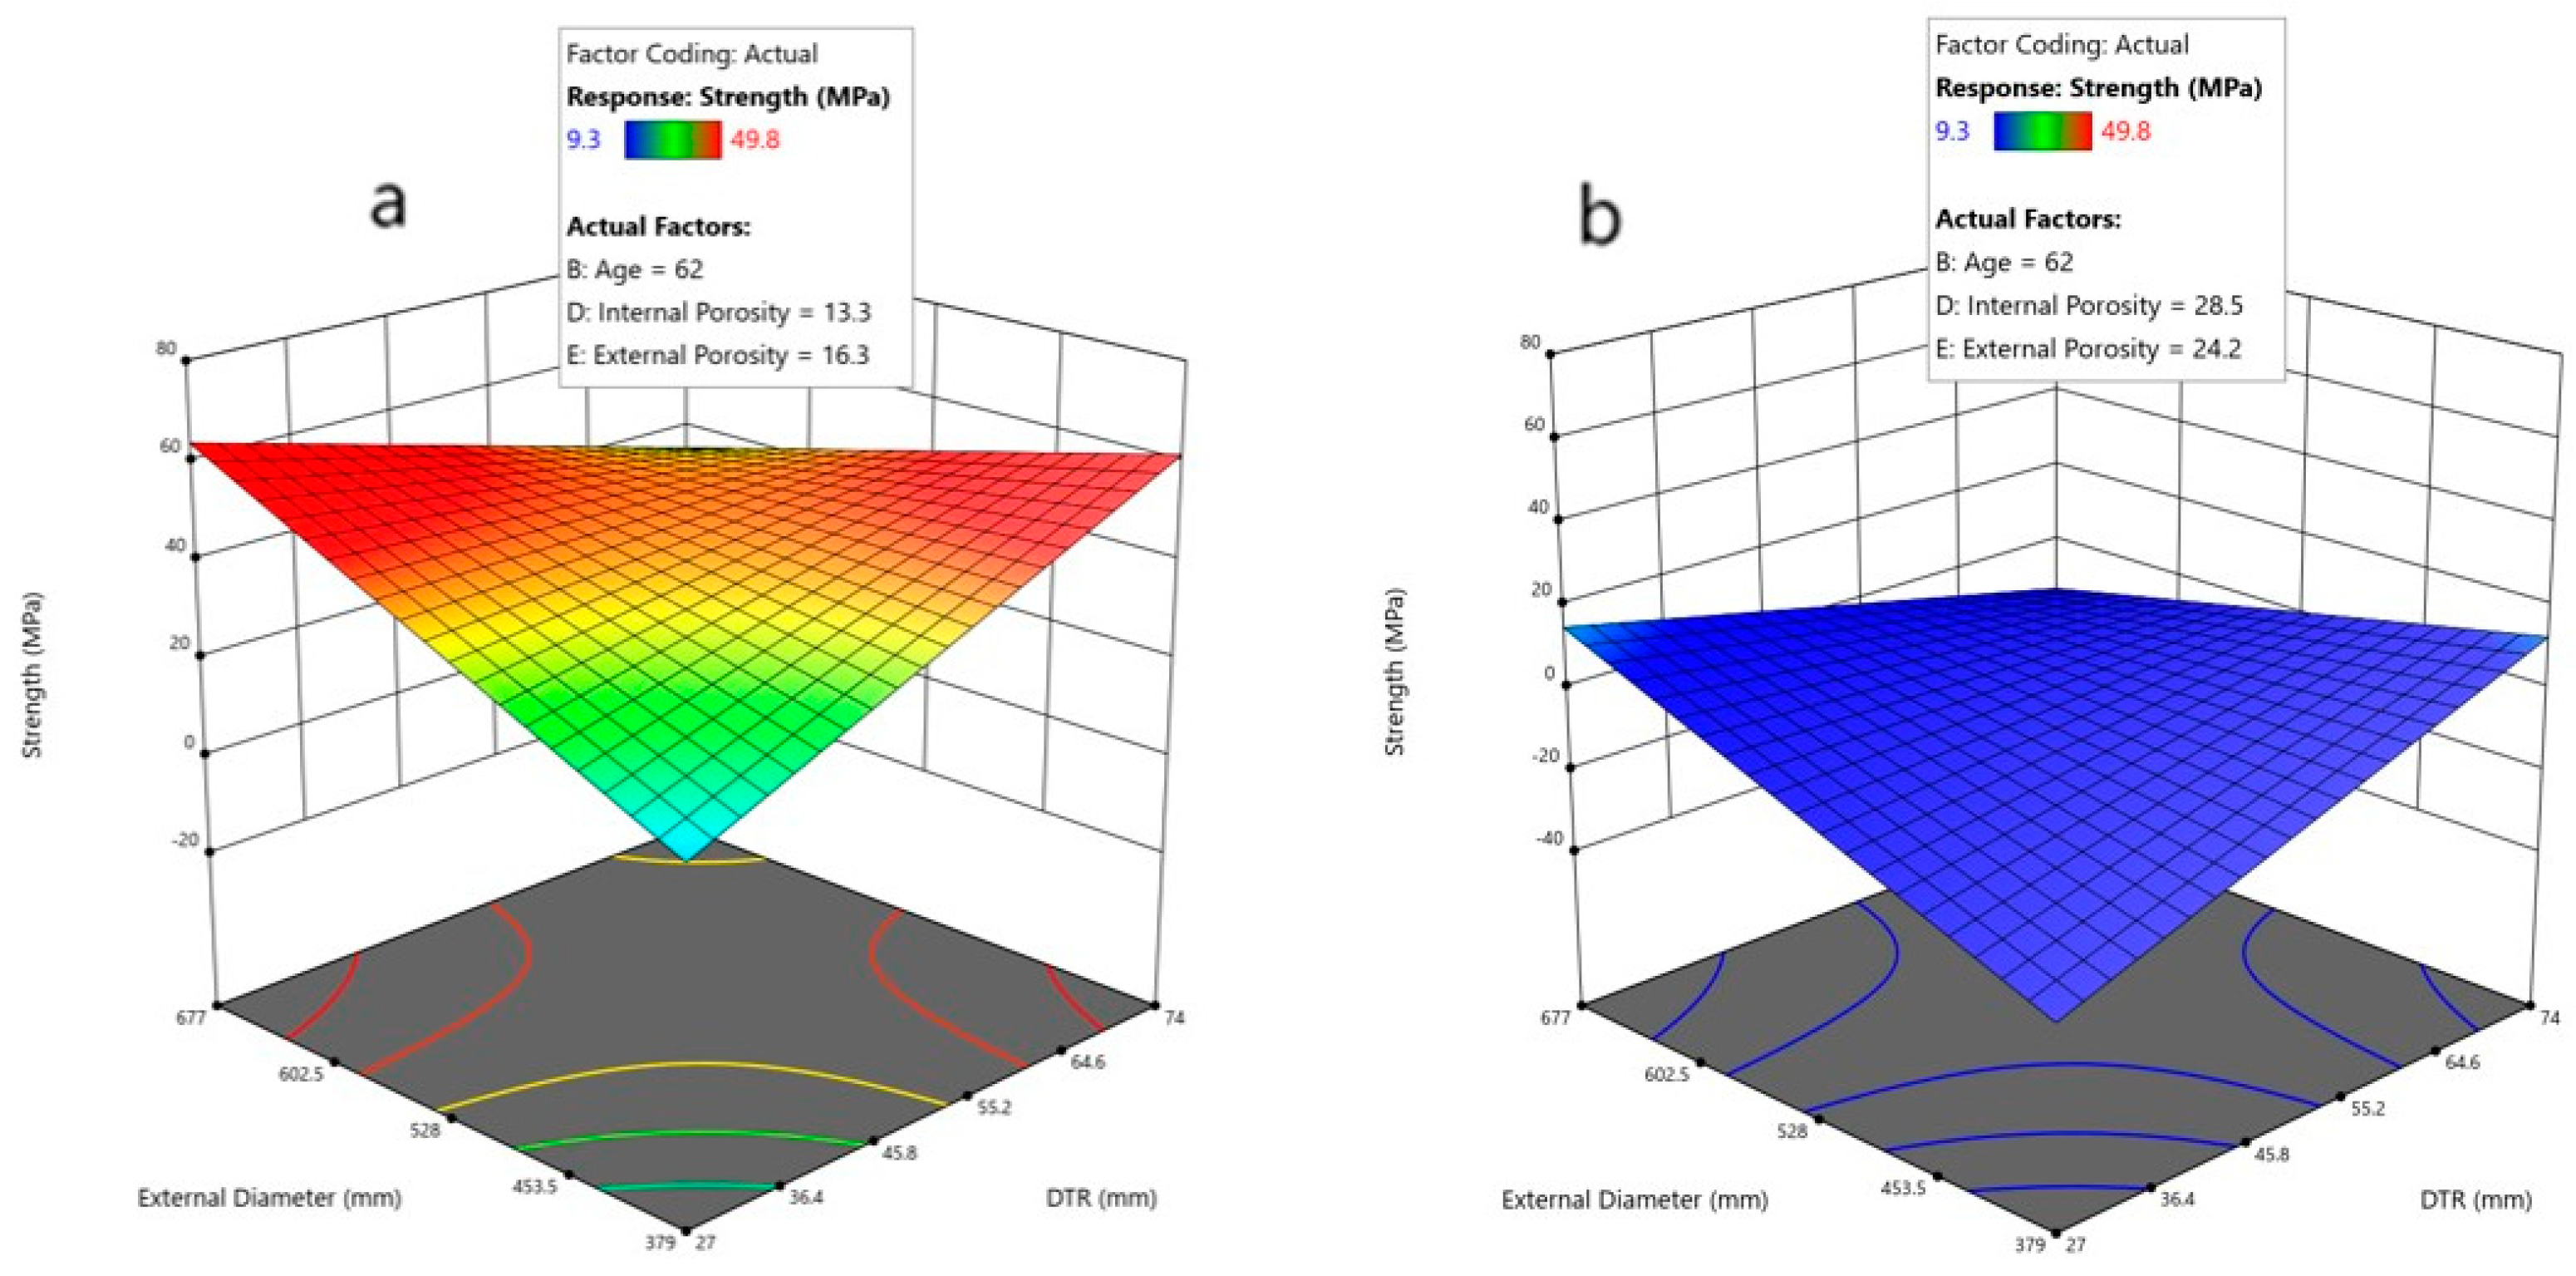
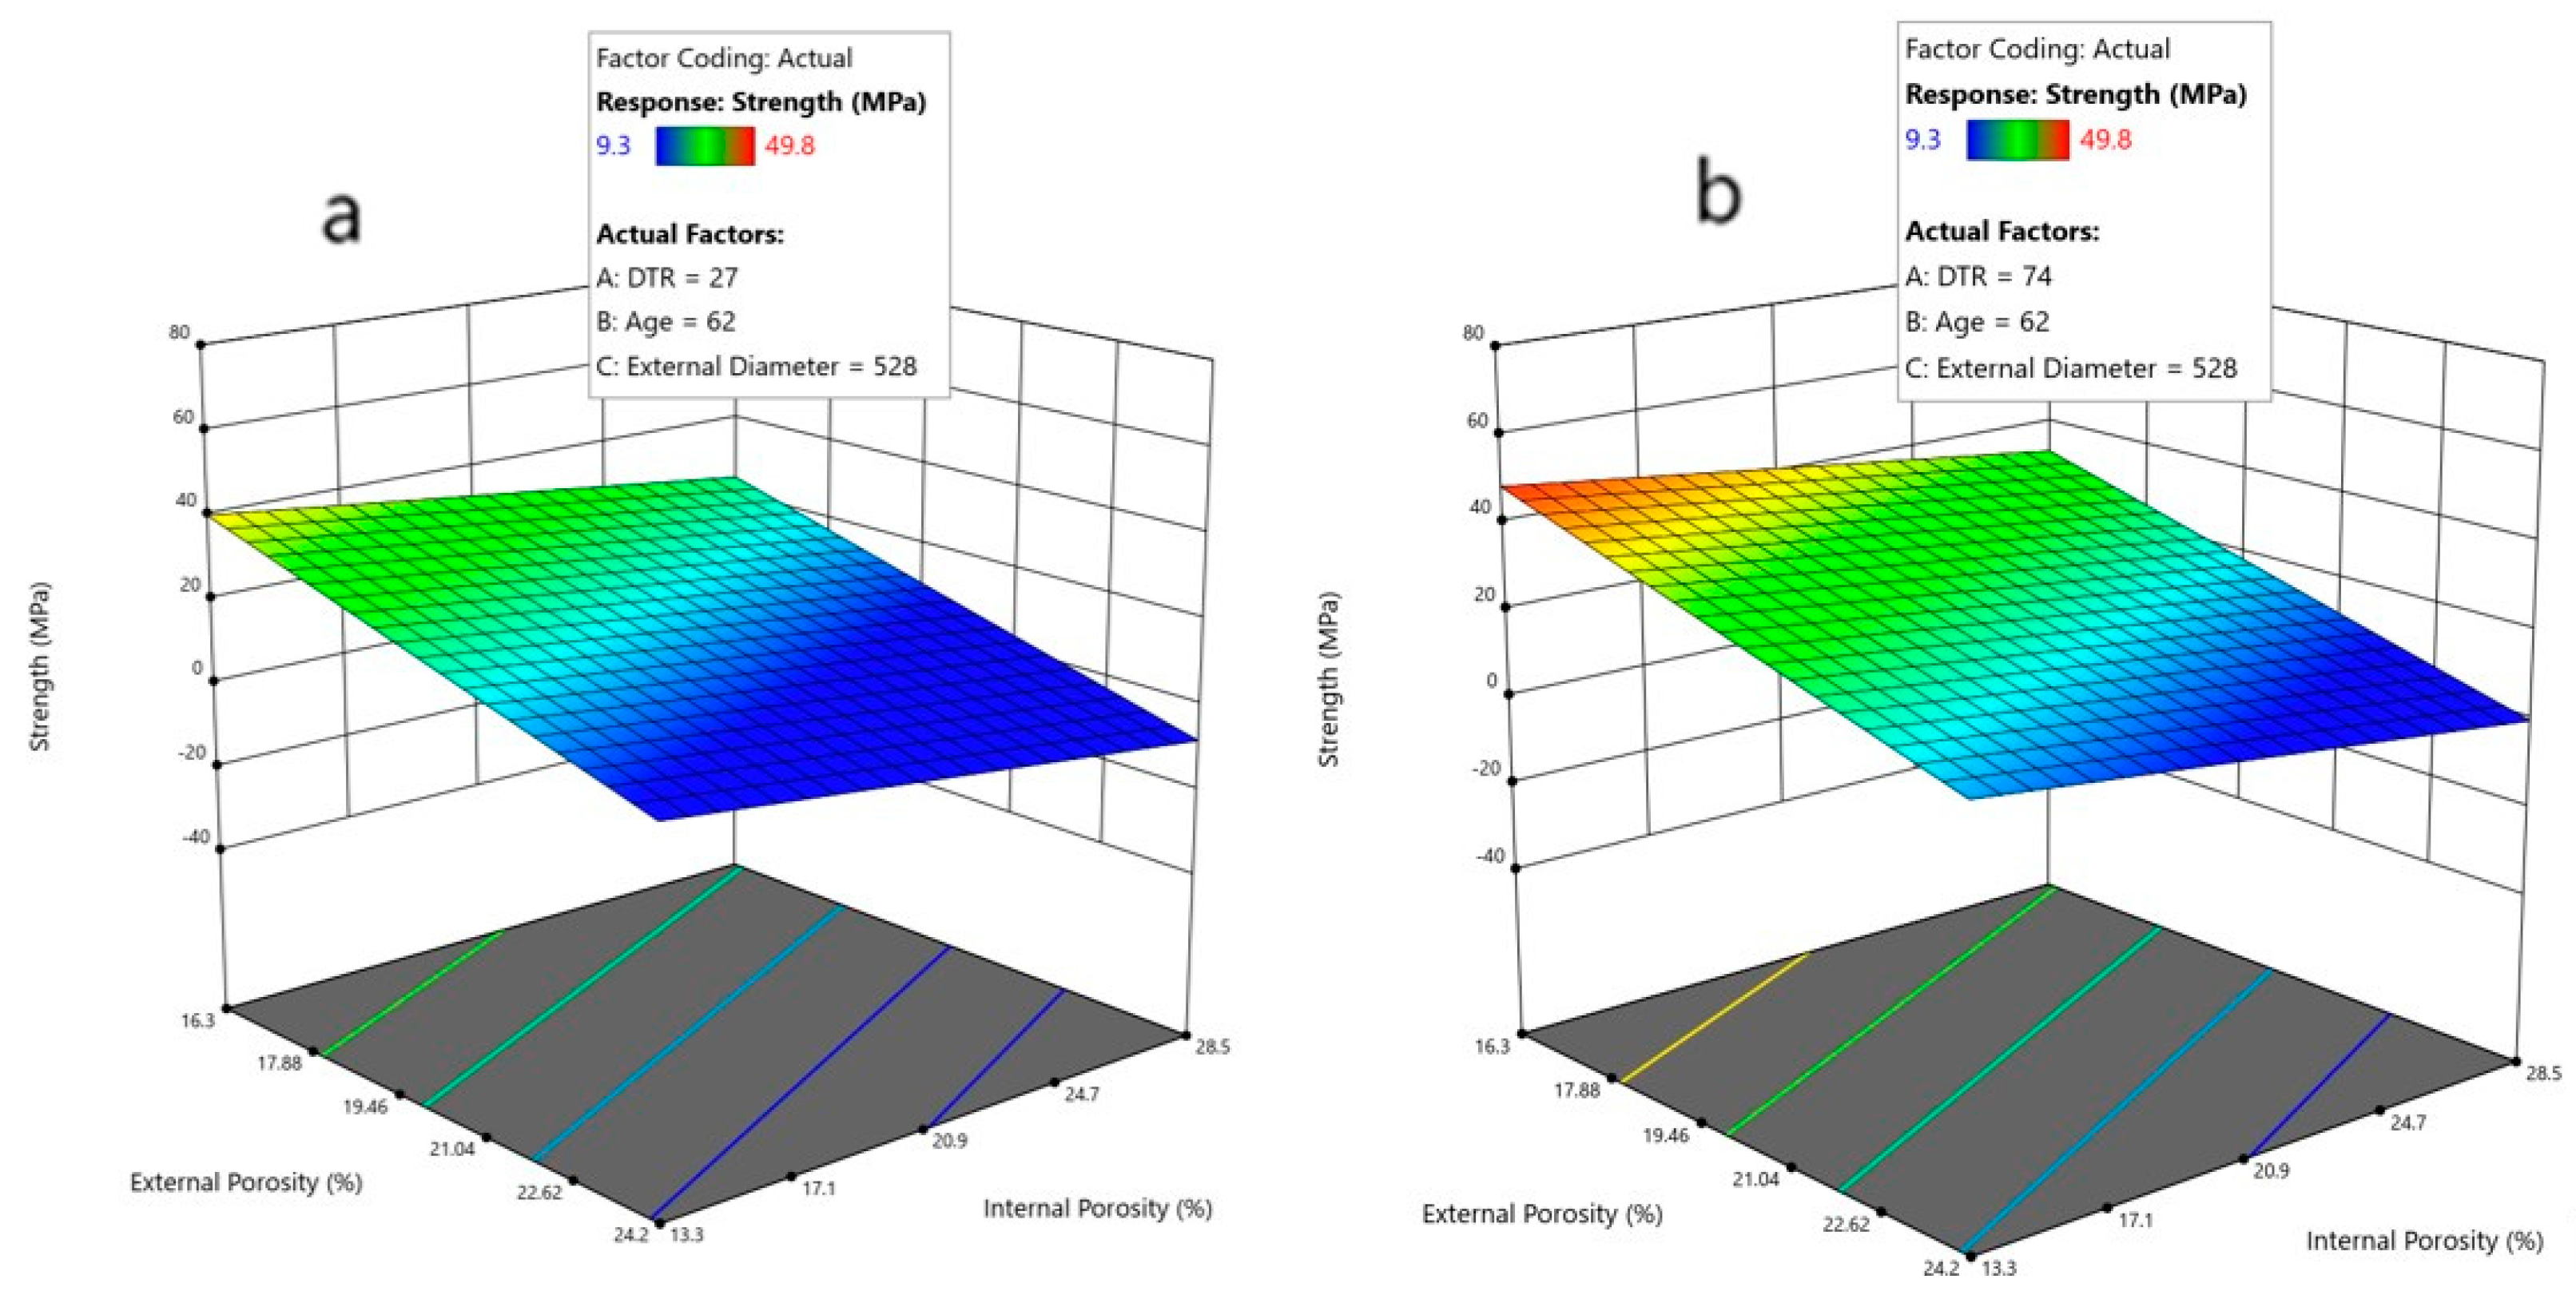
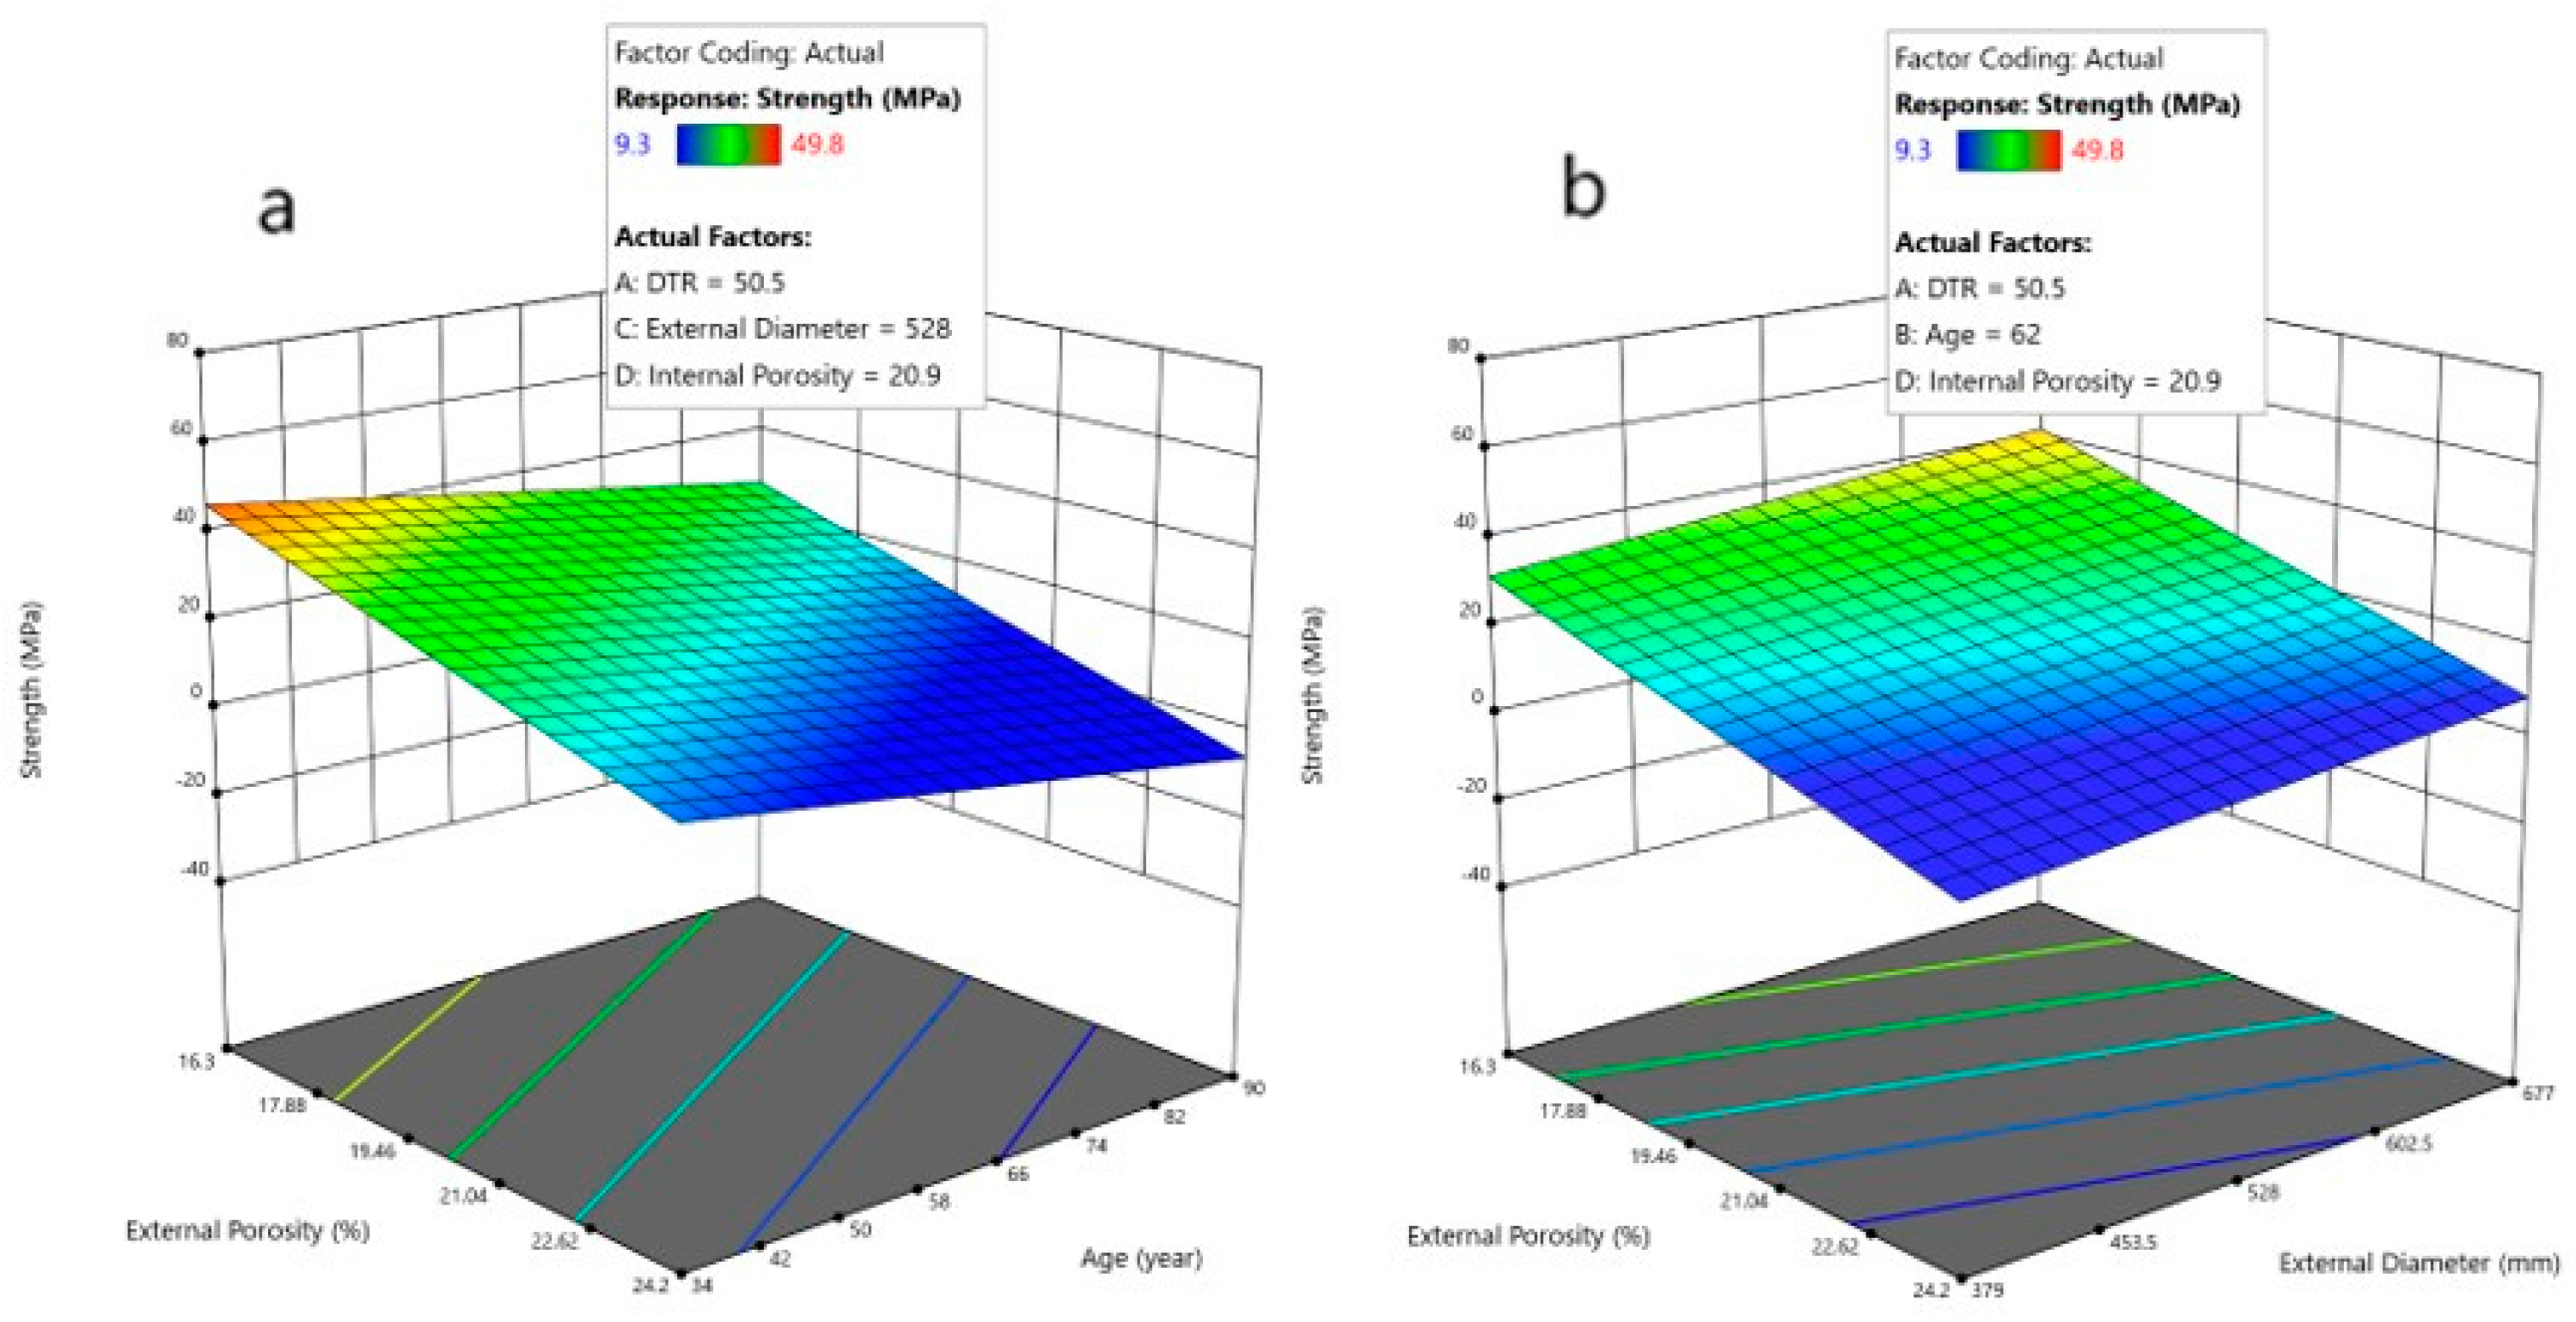
The response surfaces among the factors and mechanical properties are depicted in
Figure 13,
Figure 14,
Figure 15 and
Figure 16.
Figure 13 shows the strength surface plots obtained as a function of external diameter and DTR for average age and minimum (
Figure 13a) and maximum (
Figure 13b) internal and external porosity. According to the results, variations of external diameter and DTR have only slight effects on mechanical properties. In the case of an increase in external diameter, higher mechanical properties are typically achieved. This correlation is quite common, as an increase in external diameter also leads to a slight increase in pipe thickness, as well as in its reinforcement. Instead, there exists a great difference in the average concrete strength between the two scenarios (
Figure 13a,b), since porosity has a very significant effect, because minimum values of porosity provide high average concrete strength, while maximum values of porosity provide low average concrete strength.
In
Figure 14, the response surface plot of strength is depicted as a function of internal and external porosity for minimum (
Figure 14a) and maximum (
Figure 14b) age, while external diameter and DTR are the associated average values. As expected, mechanical properties decrease when porosity increases; this is due to several reasons; the most relevant include (1) reductions in the adherence between aggregate particles and the cement matrix; (2) an increasing presence of voids, which results in a reduced volume of concrete; and (3) the allowing of a higher level of water infiltration inside the pipe. Based on the plot, this behavior is more pronounced for external porosity than for internal porosity, indicating that external porosity has the main effect on mechanical properties. This could be attributed to the effects of water from an external source, which may contain more harmful conditions for the reinforcement than the water supplied by the water distribution system. The variability in external water quality is not controlled, and is influenced by different salt compositions that can change physical properties such as pH. This variability is directly related to oxidation processes and corrosion, which may result in poor mechanical behavior, or even failure. On the other hand, the structural reinforcement of the pipe is mainly provided by the longitudinal and transversal reinforcements, which are in contact with the external mortar, not with the internal mortar, so the presence of external defects in the external mortar significantly impacts the strength of the concrete pipes. The age of the pipes also exerts a direct influence on the strength of the concrete pipe; as expected, the older the pipes, the worse their mechanical properties, as shown in
Figure 14. Furthermore, as indicated in
Table 2, DTR does not play a significant role in assessing pipe condition.
Figure 15 shows that the response surface plot of strength is depicted as a function of the external porosity and age (
Figure 15a, considering DTR, internal porosity, and external diameter as average values), as well as external porosity and external diameter (
Figure 15b, considering a DTR, internal porosity, and age as average values). It can be seen that external porosity has a higher impact than age, as we mentioned previously.
Since corrosion is the main problem affecting mechanical properties, porosity is the main factor under review. Therefore, external porosity is the key and most immediate factor to control. Conversely, the external diameter has less impact on the average concrete strength than does porosity (
Figure 13). However, the average concrete strength increases when the external diameter increases, which can be attributed to the fact that larger external diameters also imply higher mortar thickness, as mentioned above.
Porosity has a significant influence on the average concrete strength, as there is a clear relationship between external porosity and concrete strength according to the model generated and several authors, such as Kumar R. [
51], who shows a similar average concrete strength in relation to similar porosity; also, see [
52,
53,
54]. On the other hand, concrete has a dual effect in a reinforced concrete pipe: it acts as a hard material, providing resistance to the pipe, allowing it to withstand internal water pressure, and it maintains the reinforcement in a basic pH environment, which reduces the corrosion risk of the bars [
55]. As a result, concrete condition has a substantial influence in pipe condition.
In this context, pipe porosity is directly related to average concrete strength, but also to concrete permeability [
56,
57,
58], as permeability parameter in cementitious materials is likely to be governed by a threshold pore diameter derived based on the percolation theory. Consequently, porosity also has influence in the steel corrosion process, reducing the tensile properties in a reinforced concrete pipe [
59], while also affecting the pipe lifespan [
60]. Therefore, concrete deterioration is directly correlated with average concrete strength and reinforcement corrosion, as we mentioned above when discussing the results of the study. In this sense, Cabrera J.G. [
61] also finds a relationship between average concrete strength reduction and increasing corrosion %; also, see [
62]. This correlation is also confirmed by testing of the pipes, since all deteriorated concrete pipes tested showed reinforcement corrosion, as seen in
Table 2 and
Table 4, which is related to poor or bad pipe condition and low average concrete strength, which can, in turn, be predicted by the model generated.
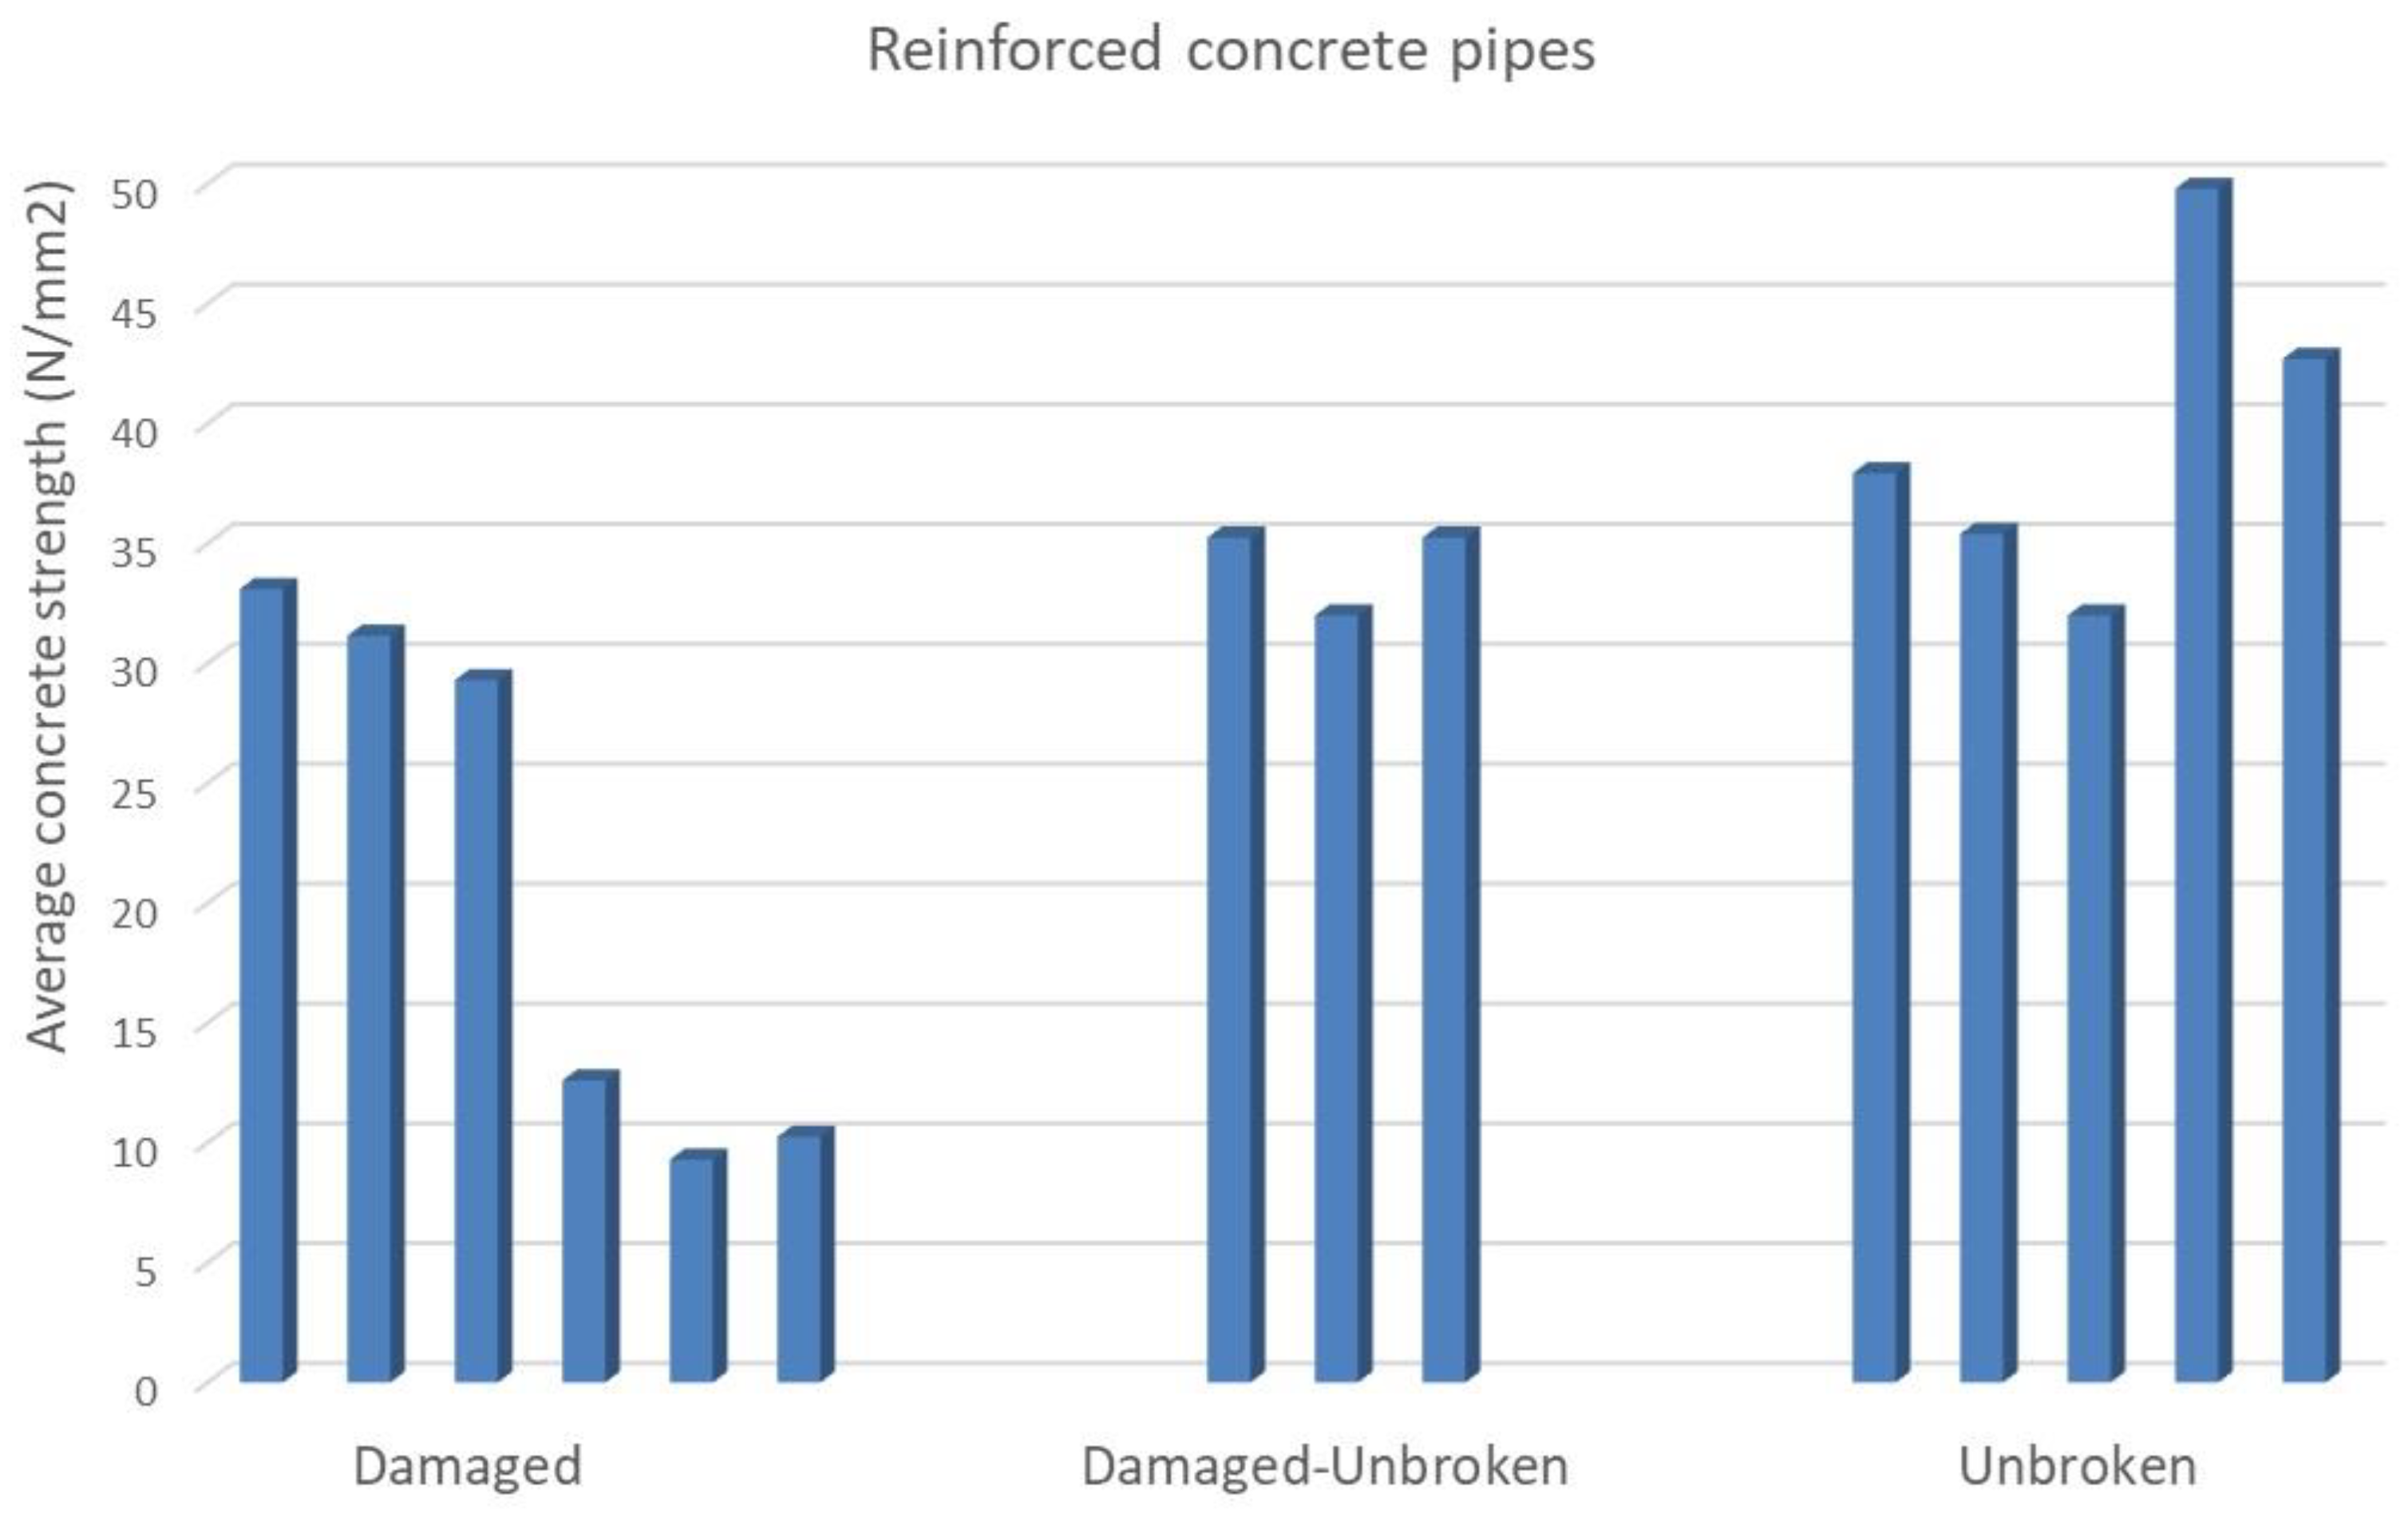
On the other hand, as we mentioned before, there is a link between average concrete strength and pipe condition assessment, as evaluated by water utility operators (
Table 2). The behavior of the samples with regard to pipe condition assessment (that is, damaged or in bad condition; damaged–unbroken; or in fair condition and unbroken, in good condition) is illustrated in
Figure 16. A minimum mechanical resistance is observed in the samples, one preventing them from breaking at around 30 MPa. Consequently, based on the results and the mathematical model obtained (Equation (5)), it is possible to determine the maximum acceptable porosity value in order to prevent sample breakage while maintaining a minimum mechanical resistance around of 30 MPa. In this way, the average values obtained by the mathematical model for DTR, external diameter, and internal porosity (50 mm, 528 mm, and 20.9%, respectively) can be applied. Hence, to comply with minimum mechanical resistance of 30 MPa, the external porosity must be a maximum of 18%.
Furthermore, the results obtained with the design of experiments (DoE) allow us to empirically and theoretically verify the relationship between the deterioration of reinforced concrete pipes in a distribution network and the characteristics of the mortar and the pipe itself [
63]. Additionally, it advances the field of the assessment of the structural conditions of concrete reinforcement pipes and, importantly, the state of deterioration of the pipes. This will enable us to draw significant conclusions in the field of maintenance and renewal of reinforced concrete distribution pipes in a water utility, such as which parameters need to be monitored to ensure a long service life for the pipes and determining when a section of pipe should be renewed [
64,
65].
5. Conclusions
The reinforced concrete pipes in water utilities are usually large-diameter, high-strength precast concrete pipes used in water and wastewater transmission mains, so the occurrence of a leak has huge consequences in water services, because the flow it carries is often substantial. As a result, this type of pipe presents a special interest for operators in pipe asset management. In this sense, a comprehensive understanding of these pipes is essential for any water utility, which is why this study was conducted.
In this matter, an extensive consultation of the literature was made, and professionals in the field were consulted in order to compile a list of the potential key parameters involved in the deterioration of reinforced concrete pipes. Additionally, a set of pipe samples (18 pipe sections) was collected from various locations in Catalonia, Spain, to conduct tests and compile a dataset that includes internal and external characteristics for each pipe section.
To estimate which parameters or characteristics measured from the tested pipes have more or less relevance in determining average concrete strength and pipe condition assessment, a design of experiments (DoE) was conducted using “Design Expert 7.0” software from Stat-Ease. DoE allows us to identify which parameters influence the optimal performance of the process and to quantify the effects based on variations in the analyzed factors.
Once a preliminary analysis was conducted by using all potential key factors measured during the testing, a set of independent variables, also known as key parameters, was considered in order to develop the predictive model. The key factors under consideration were the distance between transversal reinforcements (DTR), external diameter, age, internal porosity, and external porosity. The model response was defined as the average concrete strength, which also provides the reinforced concrete pipe condition.
The model obtained was statistically significant, with a lower p-value and a small probability of being originated by noise. In that sense, the statistical aspect of the model was quite accurate, with a predicted R2 of 0.8860, which is in reasonable agreement with the adjusted R2 of 0.9603.
The model shows that age and the external and internal porosity were the key factors, whereas external diameter was in the fourth position. However, the average concrete strength increases when the external diameter increases, which is attributed to the fact that larger external diameters imply a higher mortar thickness. On the other hand, DTR has the lowest effect on the response. The interaction between factors was found to be significant: DTR is only important when it increases together with external diameter, and this leads to the worst mechanical properties.
As a final conclusion, a minimum mechanical resistance is observed in the samples, preventing them from breaking, or being subject to a poor pipe condition assessment, at around 30 MPa. Consequently, based on the results and the mathematical model obtained, it is possible to determine the maximum acceptable porosity value in order to prevent sample breakage while maintaining a minimum mechanical resistance of 30 MPa; this is an external porosity around of 18% when internal porosity is around of 20%.
Additionally, this research advances the field of the assessment of the structural conditions of concrete reinforcement pipes and, importantly, the state of deterioration of the pipes. This will enable us to draw significant conclusions in the field of maintenance and renewal of reinforced concrete distribution pipes in a water utility, such as which parameters need to be monitored to ensure a long service life for the pipes and to determine when a section of pipe should be renewed.
Future research will evolve to consider how daily operations affect reinforced concrete pipes. Specifically, we aim to evaluate the impact of transient pressures from daily operations on pipe durability, treating these pressures as fatigue cycles. We will also estimate the impact considering pipe, concrete, and reinforcement characteristics. If daily operations significantly affect the condition of the pipes, we plan to refine our predictive model to account for these operations and improve our estimates of average concrete strength and pipe condition assessment. To achieve this, we will require a substantial number of samples to validate and enhance the current predictive model.
