Article

Characteristics of Soil Physical Properties and Spatial Distribution of Soil Erosion on Ridge-Slope Farmland in the Black Soil Areas of Northeast China

1
School of Forestry, Northeast Forestry University, Harbin 150040, China
2
Soil and Water Conservation Monitoring Center of Songliao Basin, Songliao Water Resources Commission, Changchun 130021, China
*
Author to whom correspondence should be addressed.
Water 2024, 16(16), 2353; https://doi.org/10.3390/w16162353
Submission received: 16 July 2024 / Revised: 13 August 2024 / Accepted: 20 August 2024 / Published: 22 August 2024

Abstract

To explore the spatial distribution characteristics of soil physical properties and soil erosion in sloping farmland with ridges in the black soil areas of northeast China, sloping farmland with ridges built with woven bags (RW) along the contour lines was selected as the research object, and another sloping farmland was selected as the control (CK). Soil samples were collected from both RW and CK at uniform spatial intervals to measure key indicators of soil properties in the surface layer (0–15 cm), including soil water-holding capacity, soil structure, and annual average soil loss (A). The results showed that: (i) RW exhibited a significantly higher overall field water-holding capacity compared to CK, with soil moisture characteristics more evenly distributed spatially. Soil bulk weight, fractal dimension, and soil aggregate destruction in RW were reduced by 1.09%, 0.65%, and 4.61%, respectively, compared to CK. Additionally, soil total porosity, capillary porosity, mean weight diameter (MWD), and geometric mean diameter (GWD) were more evenly distributed spatially in RW. (ii) On the up-slope, soil water content and DR>0.25 in RW had a higher increase than those of CK. On the mid-slope, soil field water-holding capacity, capillary porosity, MWD, and GWD in RW had a higher increase than those in CK. On the down-slope, RW had a 7.67–10.79% increase in soil water content, saturated water-holding capacity, field water-holding capacity, and capillary water-holding capacity compared to CK, with total soil porosity and soil capillary porosity increasing by 2.84% and 15.51%, respectively. (iii) Annual average soil loss (A) of RW was reduced by 61.85–99.64% compared to CK, based on the China Soil Loss Equation (CSLE). (vi) Soil water-holding capacity and soil structure characteristics of RW showed benefits compared to CK, with the benefits ranging from 1.01 to 1.09, while the benefit of A reached 2.46. This study is significant for understanding the spatial distribution of soil erosion on sloped farmland in black soil areas and for the effective application of soil and water conservation measures.

1. Introduction

Ridges typically refer to elevated sections of a field that are raised above the surrounding area, and they are often used to divide farmland and store water [1]. Ridges play a crucial role in soil and water conservation for sloping farmland and are integral to ecological construction projects, such as sloping farmland management and farmland preparation [2]. The construction of ridges on sloping farmland can interrupt or shorten the length of the slope, thereby reducing the runoff rate. The surface soil of the farmland will gather behind the ridge, reducing the slope angle and runoff speed and increasing the water penetration in the farmland [3]. Constructing ridges on sloping farmland can reduce soil loss and soil nutrient loss, positively impacting crop production and boosting agricultural productivity [1].
At present, many countries and regions have taken the ridge as an important measure to reduce the occurrence of soil erosion, and it has been proven that the construction of ridges on sloping farmland can effectively improve soil properties. Ogden et al. [4] proved that sloping farmland with ridges can maintain soil moisture content, increase organic matter content, significantly improve soil hydraulics, and maintain ecological diversity in wetlands. Taye et al. [2] showed that sloping farmland with ridges can significantly reduce runoff by 20–30% and also reduce soil erosion. Kabala et al. [5] found that the heavy metal content in soil can be reduced rapidly in a short period of time in sloping farmland with ridges. Sudhishri et al. [6]. showed that proper implementation of soil and water conservation measures on sloping farmland can increase the yield. There are also more areas in China where soil erosion is prevented by building ridges on sloping farmland to maintain soil and soil nutrients in the farmland. Song et al. [7]. showed that sloping farmland with ridges has the function of intercepting runoff, storing water, and conserving soil, and can effectively prevent soil erosion. Wang et al. [8] showed that sloping farmland with ridges has significant erosion resistance, and the soil humus content, water-stable aggregate content, aggregation condition, and intensity of aggregation of sloped farmland with ridges are better. Yuan et al. [9] found that ridges on sloping farmland could reduce erosion by approximately 95%. This reduction led to improved physical properties of farmland soils, increased porosity [10], enhanced water content, and a decrease in agricultural non-point source pollution in the Three Gorges Reservoir area [11].
Recent research has demonstrated that constructing ridges on slopes effectively divides the catchment area, reduces flood runoff, and enhances water infiltration. This approach significantly mitigates soil erosion and helps conserve soil and water resources. However, most studies focus on the broader benefits of soil and water conservation in sloping farmland with ridges. Fewer studies have investigated the spatial distribution characteristics of soil physical properties and the annual average soil loss in such areas. Clarifying these aspects is crucial for the rational deployment of soil and water conservation engineering measures and serves as a basis for optimizing these measures. Therefore, sloping farmland with ridges built along contour lines with woven bags (RW) in the black soil areas of Northeast China was selected for the study. Another sloping farmland was designated as the control (CK). To ensure a representative analysis, sampling points were selected in both RW and CK using a spatially uniform distribution method. The study had the following objectives:
(i)
To define the spatial distribution of soil water-holding capacity, soil structure characteristics, and the annual average soil loss for RW and CK.
(ii)
To evaluate the benefits of improved soil physical properties in RW compared to CK and to quantify and analyze the differences in spatial distribution between the two.
This study is significant for understanding the spatial distribution of soil erosion on sloped farmland in black soil areas and for the effective application of soil and water conservation measures.

2. Materials and Methods

2.1. General Description of the Study Area

The study area is located in Xingmu Village, Liaoyuan City, Jilin Province, China (E 125°22′40″~125°26′10″, N 42°58′05″~43°01′40″). The terrain predominantly features slopes ranging from 5° to 15°, with over 90% of the farmland exhibiting slopes greater than 5°. The soils in the area are classified as clay loam according to the USDA (1993) texture classification criteria [12,13]. The region falls within the semi-humid temperate monsoon climate zone, with an average elevation of 347 m, an average annual air temperature of 5.2 °C, and an annual rainfall of 658 mm.

2.2. Research Methodology

Field sampling was conducted in July 2022. In the study, sloping farmland with ridges built along contour lines with woven bags (RW) was selected. Another sloping farmland was selected as the control (CK), which was similar to RW in terms of slope direction, slope position, and area. Corn was planted on both RW and CK. Basic information about RW and CK is presented in Table 1.
The spatial uniform distribution method was applied to both RW and CK, with 40 sampling points selected for each. At each sampling point, measurements were taken for soil bulk density, moisture content, total porosity, capillary porosity, saturated water-holding capacity, field water-holding capacity, and capillary water-holding capacity. In situ soil samples were collected from each sample point for the determination of soil water-stable aggregates and mechanically stable aggregates. Soil aggregate composition in RW showed 20.48–32.94% clay, 42.53–61.01% silty soil, and 10.47–36.44% sandy soil.

2.3. Indicator Measurement and Methodology

Soil bulk density, soil moisture content, total porosity, capillary porosity, saturated water-holding capacity, field water-holding capacity, and capillary water-holding capacity were assessed at each sampling site using cutting ring sampling [14]. Soil capacity was determined by extracting the soil using a ring knife, weighing it, and performing calculations [14]. To determine soil saturated water-holding capacity and field water-holding capacity, the soil sample was first saturated with water in a flat-bottomed container, and its water content was measured. The sample was then placed on sandy soil to allow gravity to drain the water, and the water content was measured again [15]. Soil moisture content was determined by taking a portion of soil in its original state in an aluminum box, weighing and drying the soil, and then weighing it again to calculate the moisture content [15]. Soil water-stable aggregate content was determined using the wetting sieve method, with aggregates separated into particle sizes of >5 mm, 5–2 mm, 2–1 mm, 1–0.5 mm, 0.5–0.25 mm, and <0.25 mm based on soil aggregate particle size (d) [16].
Particle size ≥ 0.25 mm aggregate content represents the water-stable aggregate content (WR>0.25). The calculation formula is as follows [16]:
W R > 0.25 = M i M 0.25 × 100 ,
where WR>0.25 is the content of >0.25 mm water-stable aggregates (%); Mi is the mass of i-grain water-stable aggregates (g); and M0.25 is the total mass of >0.25 mm water-stable aggregates (g) [16].
The Mean Weight Diameter (MWD) [16] is used to characterize soil aggregate stability. The calculation formula is as follows:
M W D = n = 1 n W i X i ,
The Geometric Mean Diameter (GMD) is used to characterize the structural features and stability of soil water-stable aggregates. The calculation formula is as follows:
G M D = e x p [ i = 1 n ( W i ln X i ) i = 1 n W i ] ,
where Wi denotes the mass percentage (%) of soil aggregates in the i-th size; Xi denotes the average particle size (mm) of soil aggregates in the two neighboring sizes, and ln Xi denotes the natural logarithm of the average size of soil particles in the i-th particle size.
The fractal dimension (D) of soil aggregates was calculated using the soil fractal model proposed by Díaz-Zorita et al. [17]. The formula used for this calculation is as follows:
3 D lg x i ¯ / x m a x = lg M ( r < x i ¯ ) / M T ] ,
where M(r < x i ¯ ) is the mass of soil aggregates smaller than a certain particle size (g); MT is the total mass of aggregates (g); x i ¯ is the average size of each particle size of soil aggregates (mm); and xmax is the average size of the largest aggregate particle size (mm). The fractal dimension D can be obtained by fitting a linear regression equation to the data derived from this formula.
Soil aggregate destruction (PAD) [18] was used to characterize soil aggregate stability and fragmentation. The calculation formula is as follows:
P A D = D R > 0.25 W R > 0.25 D R > 0.25 × 100 % ,
where DR>0.25 is the mass fraction (%) of large aggregates greater than 0.25 mm after dry sieving, representing mechanically stable aggregates, WR>0.25 is the mass fraction (%) of large aggregates greater than 0.25 mm after wet sieving, representing water-stable aggregates.
Soil indicator benefit (E) was used to characterize the effect of RW on soil indicator M. When the soil indicator M is positively correlated with the soil benefit of RW, the formula is calculated as follows:
E P = M R W M C K ,
when the soil indicator M shows a negative correlation with the soil improvement benefit E of RW, the calculation formula is as follows:
E N = 1 M R W M C K ,
where EP is the benefit of RW in increasing soil indicator M, MRW is the soil indicator M for RW, and MCK is the soil indicator M for CK. EN is the benefit of RW in decreasing soil indicator M.

2.4. Calculation of the Annual Average Soil Loss

The Chinese Soil Loss Equation (CSLE) [19] is used to estimate soil erosion or soil loss in a given area. To calculate soil loss from Rainwater (RW) and the control (CK) using the CSLE, the equation is generally expressed as:
A = R × K × L × S × B × E × T
A is the annual average soil loss (t/ha·a). The parameterization of the CSLE model was described as follows:
R is the factor of rainfall erosivity (MJ·mm/(ha·h·a)). The rainfall erosivity factor R was calculated from the daily rainfall data [20]. In this study, the annual rainfall estimation model was used to calculate the R-factor, which was modeled as follows:
R = i = 1 12 1.735 × 10 1.5 log p i 2 p 0.08188
where R is the rainfall erosivity factor; Pi is the average monthly rainfall (mm) for the i-th month of year n; p is the average annual rainfall (mm) for year n [21]. The value of the R factor was 366.97 MJ·mm/(ha·h·a).
K is the soil erodibility factor (t·ha·h/(ha·MJ·mm·a)). Based on the EPIC model of Willians et al. [22]. The soil erodibility factor was calculated. The formula for calculating the K-factor is shown below:
K = 0.2 + 0.3 e x p 0.025 S a ( 1 S i 100 ) × ( S i C i + S i ) 0.3 × 1 0.25 C C + e x p ( 3.72 2.95 C ) × 1 0.7 S n 1 S n 1 + e x p ( 5.51 + 22.9 S n 1 )
where Sa is the percentage of sand (0.05–2 mm) (%); Si is the percentage of silt (0.002–0.05 mm) (%); Ci is the percentage of clay (<0.002 mm) (%); C is the organic carbon content (%) [23].
L is the factor of slope length; and S is the factor of slope steepness. The algorithm of Liu et al. [18,24,25] was used to calculate S and L. The formula is as follows:
S = 10.8 s i n   θ + 0.03 θ 5 ° 16.8 s i n   θ 0.5 5 ° < θ < 10 ° 1.9 s i n   θ + 0.56 θ 10 °
where θ is the slope value extracted by DEM.
L = λ 22.13 m
β = s i n   θ 0.0896 3 × s i n   θ 0.8 + 0.56              
m = β / β + 1
λ = l × c o s   θ
where L is the slope length factor; θ is the slope value extracted by DEM; λ is the horizontal projected slope length; l is the length of water flow along the flow direction on the surface; β is the ratio of the amount of fine-gully erosion to the amount of erosion between fine-gully erosion; and m is the index of the slope length factor [26].
B is the factor of biomass control in water and soil conservation. Based on the vegetation cover data, the value of B was 0.230.
E is the factor of engineering control in water and soil conservation. Based on the Soil and Water Conservation Engineering Measures Factor Assignment Table [27], E was determined to be 0.347 for RW and 0.647 for CK.
T is the factor of tillage practices in water and soil conservation. Based on the value of the tillage measure assignment table [27], the value of T was 0.331.
The annual average soil erosion loss by CSLE was categorized into soil erosion intensity classes (t/ha/a), which were <200 (Mild), 200–1000 (Low), 1000–2500 (Moderate), 2500–4000 (High), 4000–6000 (Extreme) and >6000 (Severe), according to Soil erosion intensity grading standard (SL 190-2007) [28].

2.5. Data Analysis

Basic calculations were performed on the raw data using MS Excel. IBM SPSS Statistics 26 software was used to conduct analysis of variance (ANOVA) and principal component analysis (PCA) on soil erosion factors and physical properties. The contribution rate of each principal component and the comprehensive evaluation scores were calculated. The principal components were identified, and the contribution of each indicator was assessed. Histograms were created using Origin (2021), and finally, ArcMap 10.7 was used to generate spatial distribution maps using the Inverse Distance Weighting (IDW) interpolation method.

3. Results and Discussion

3.1. Soil Bulk Density and Soil Porosity

The spatial distribution characteristics of the soil bulk density of RW and CK are shown in Figure 1. The soil bulk density did not change significantly with the decrease in slope position in RW and CK (p > 0.05). The variation range of soil bulk density for RW and CK was 1.16–1.55 g·cm−3 and 1.16–1.71 g·cm−3, respectively. The soil bulk density of RW was 2.14% and 4.32% lower than that of CK at the middle-slope and down-slope, respectively. The efficiency of RW in reducing soil bulk density is greater than that of CK, with a benefit of 1.01.
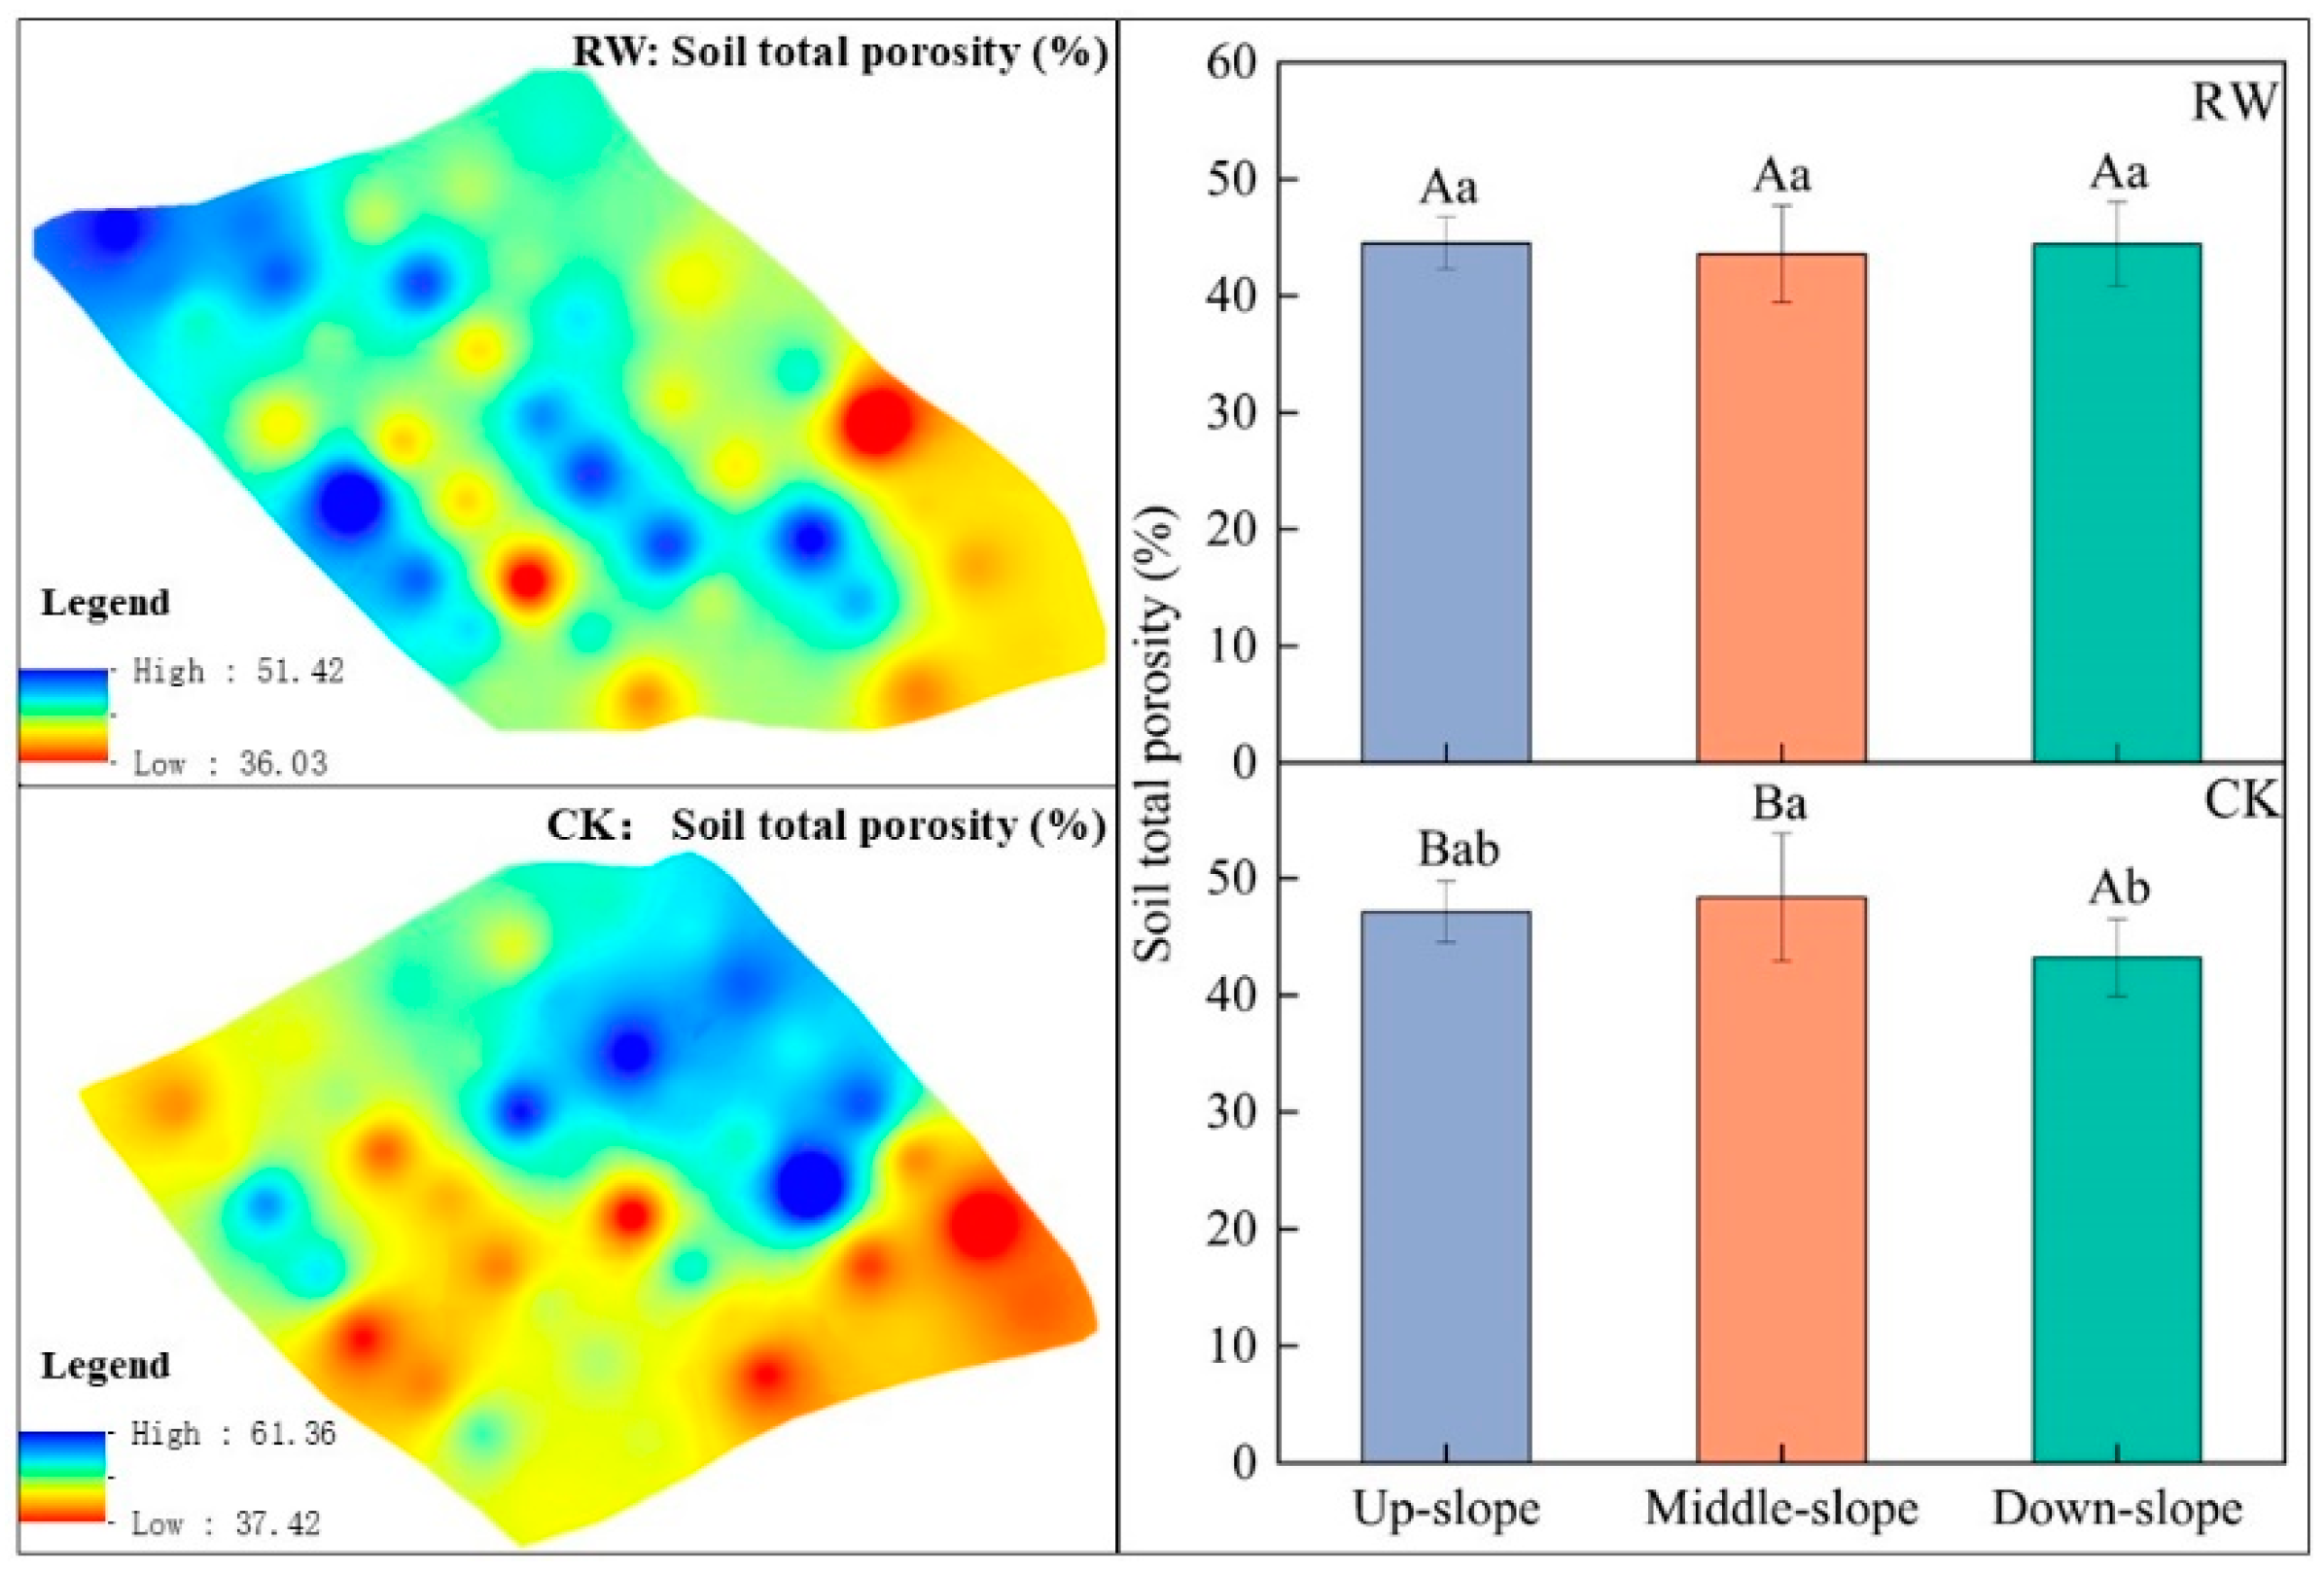
The spatial distribution characteristics of total soil porosity in RW and CK are shown in Figure 2. For RW, the variation range of total soil porosity was 36.03–51.42%, and the total soil porosity did not change significantly with the decrease in slope position (p > 0.05). For CK, the variation range of total soil porosity was 37.42–61.39%, and the total soil porosity changed significantly between mid-slope and down-slope (p ≤ 0.05). Overall, the total soil porosity of RW at the same slope position was more uniform than that of CK. Compared to CK, the total soil porosity increased by 2.84% at the down-slope of RW. The efficiency of RW in increasing total soil porosity surpassed that of CK, with a benefit of 1.05.
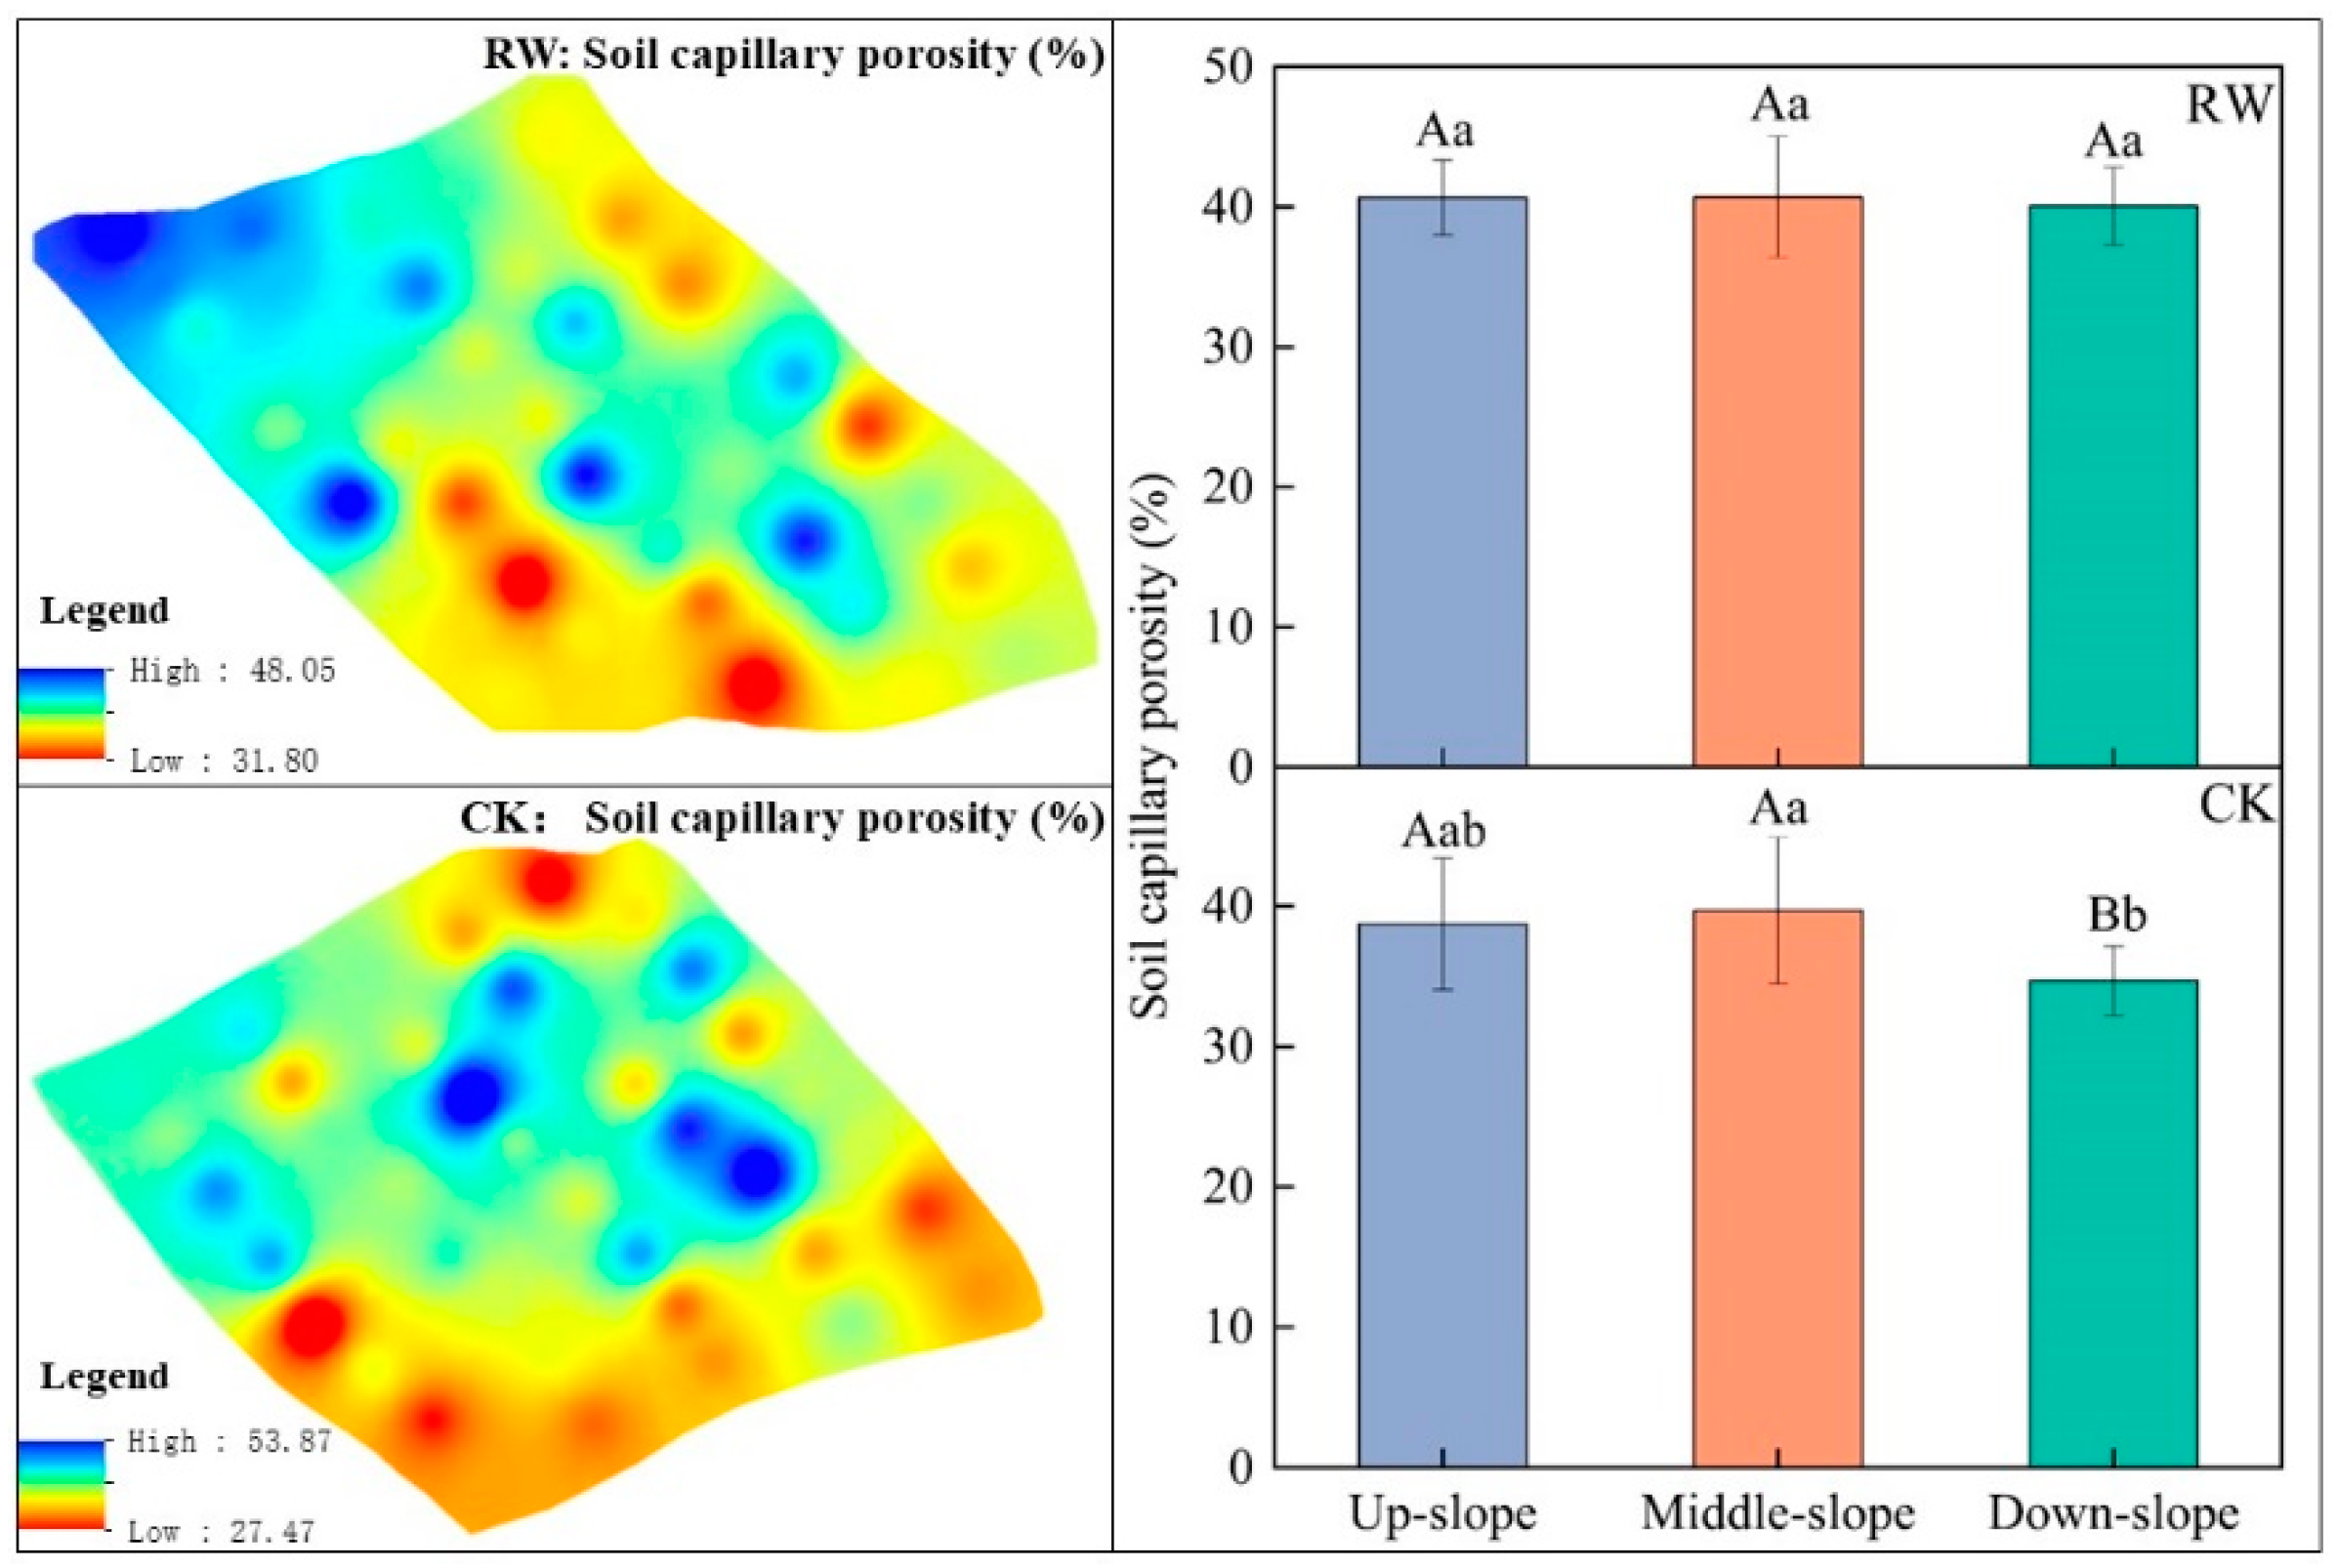
The spatial distribution characteristics of soil capillary porosity in RW and CK are shown in Figure 3. In RW, soil capillary porosity remained relatively stable across different slope positions (p > 0.05). In contrast, soil capillary porosity in CK exhibited a significant decreasing trend with slope position (p ≤ 0.05). The variation range of soil capillary porosity was 34.51–48.05% for RW and 27.46–48.46% for CK. At all slope positions, soil capillary porosity was higher in RW compared to CK. Specifically, soil capillary porosity in RW was 5.05%, 2.62%, and 15.51% greater than in CK at the up-slope, middle-slope, and down-slope positions, respectively.
It was found that RW effectively enhanced soil structure compared to CK. RW demonstrated a more pronounced effect on soil bulk density and soil capillary porosity. Soil capillary porosity increased by 7.40% compared to CK. Soil bulk density decreased by 1.09%. This is similar to the result found in the study by Li [29], which reported that soil bulk density in the root zone of grass hedges with ridges was significantly lower than in sloped farmland by 14.89%, and total soil porosity was significantly higher by 16.70% [29]. However, Li’s study showed greater improvements in soil structure characteristics compared to the current study. This discrepancy may be attributed to the fact that Li’s study involved sloping farmland with ridges planted with grass hedges. The presence of grass hedges, particularly the plant roots in the ridges, can have a mechanical blocking effect, which contributes to more effective improvements in soil bulk density and porosity. The capillary porosity of the soil affects the structural stability and water-holding capacity of the soil, thereby indirectly influencing the soil erosion risk. In this study, at all slope positions, the soil capillary porosity in the RW treatment was higher than in the CK treatment. Soil with higher capillary porosity is generally better at retaining moisture, which helps reduce surface runoff and erosion.

3.2. Soil Water-Holding Capacity

The spatial distribution characteristics of soil moisture content in RW and CK are shown in Figure 4. For RW, the variation range of soil moisture content was 17.63–32.23%, and the soil moisture content did not change significantly with the decrease in slope position (p > 0.05). For CK, the variation range of soil moisture content was 16.51–32.39%, and the soil moisture content changed significantly with the decrease in slope position (p ≤ 0.05). At the same slope position, the soil moisture content of RW increased compared to CK, especially with a significant increase of 7.67% (p ≤ 0.05) at the down-slope (p ≤ 0.05). The efficiency of RW in increasing soil moisture content exceeded that of CK, with a benefit of 1.01.
This study found that RW was more effective in improving soil water-holding capacity compared to CK. Soil water content, saturated water-holding capacity, and field water-holding capacity of RW were majorly affected and increased by 7.89%, 3.31%, and 6.58%, respectively, compared to CK (Figure 4, Figure 5 and Figure 6). This is more similar to the results of Liu et al. [30], who found that terraces contained more soil moisture than sloped farmland and that the average water content of terraces increased by 8.9–14.45% during the crop growth period compared to sloped farmland. The growth rate of soil water content in the results of Liu et al. [30] was higher than that of the present study. The results from Liu et al. are higher for two main reasons. First, it may be caused by the different soil textures of the sampling sites. The soil texture in the study is clay loam, the soil silt content was 22.21–34.77%, Liu et al.’s [30] study area was located in the Loess Plateau of northwest China, and the soil texture was sandy clay loam (silt content 57.39–62.24%). The study showed that the soil water content was positively correlated with the silt content [31]. Secondly, the crops grown were different. The crop grown in this study was corn, and the crops grown in the study by Liu et al. [30] were potatoes and wheat. Potato and wheat have more developed root systems than corn [32]. The root system can change the hydraulic properties of the soil. It can provide a preferential downward pathway for water infiltration into the soil [33,34], further improving soil permeability and influencing soil moisture distribution [35,36]. In the study, the benefit of woven bag ridges in increasing soil water content was 1.01, the benefit of increasing soil saturated water-holding capacity was 1.03, and the benefit of increasing soil capillary water content was 1.02. The results of the study by Wei [37] showed that terraces were more effective than sloped cropland in retaining soil moisture, with a benefit of 1.2 on soil water content, which is similar to the results of this study.
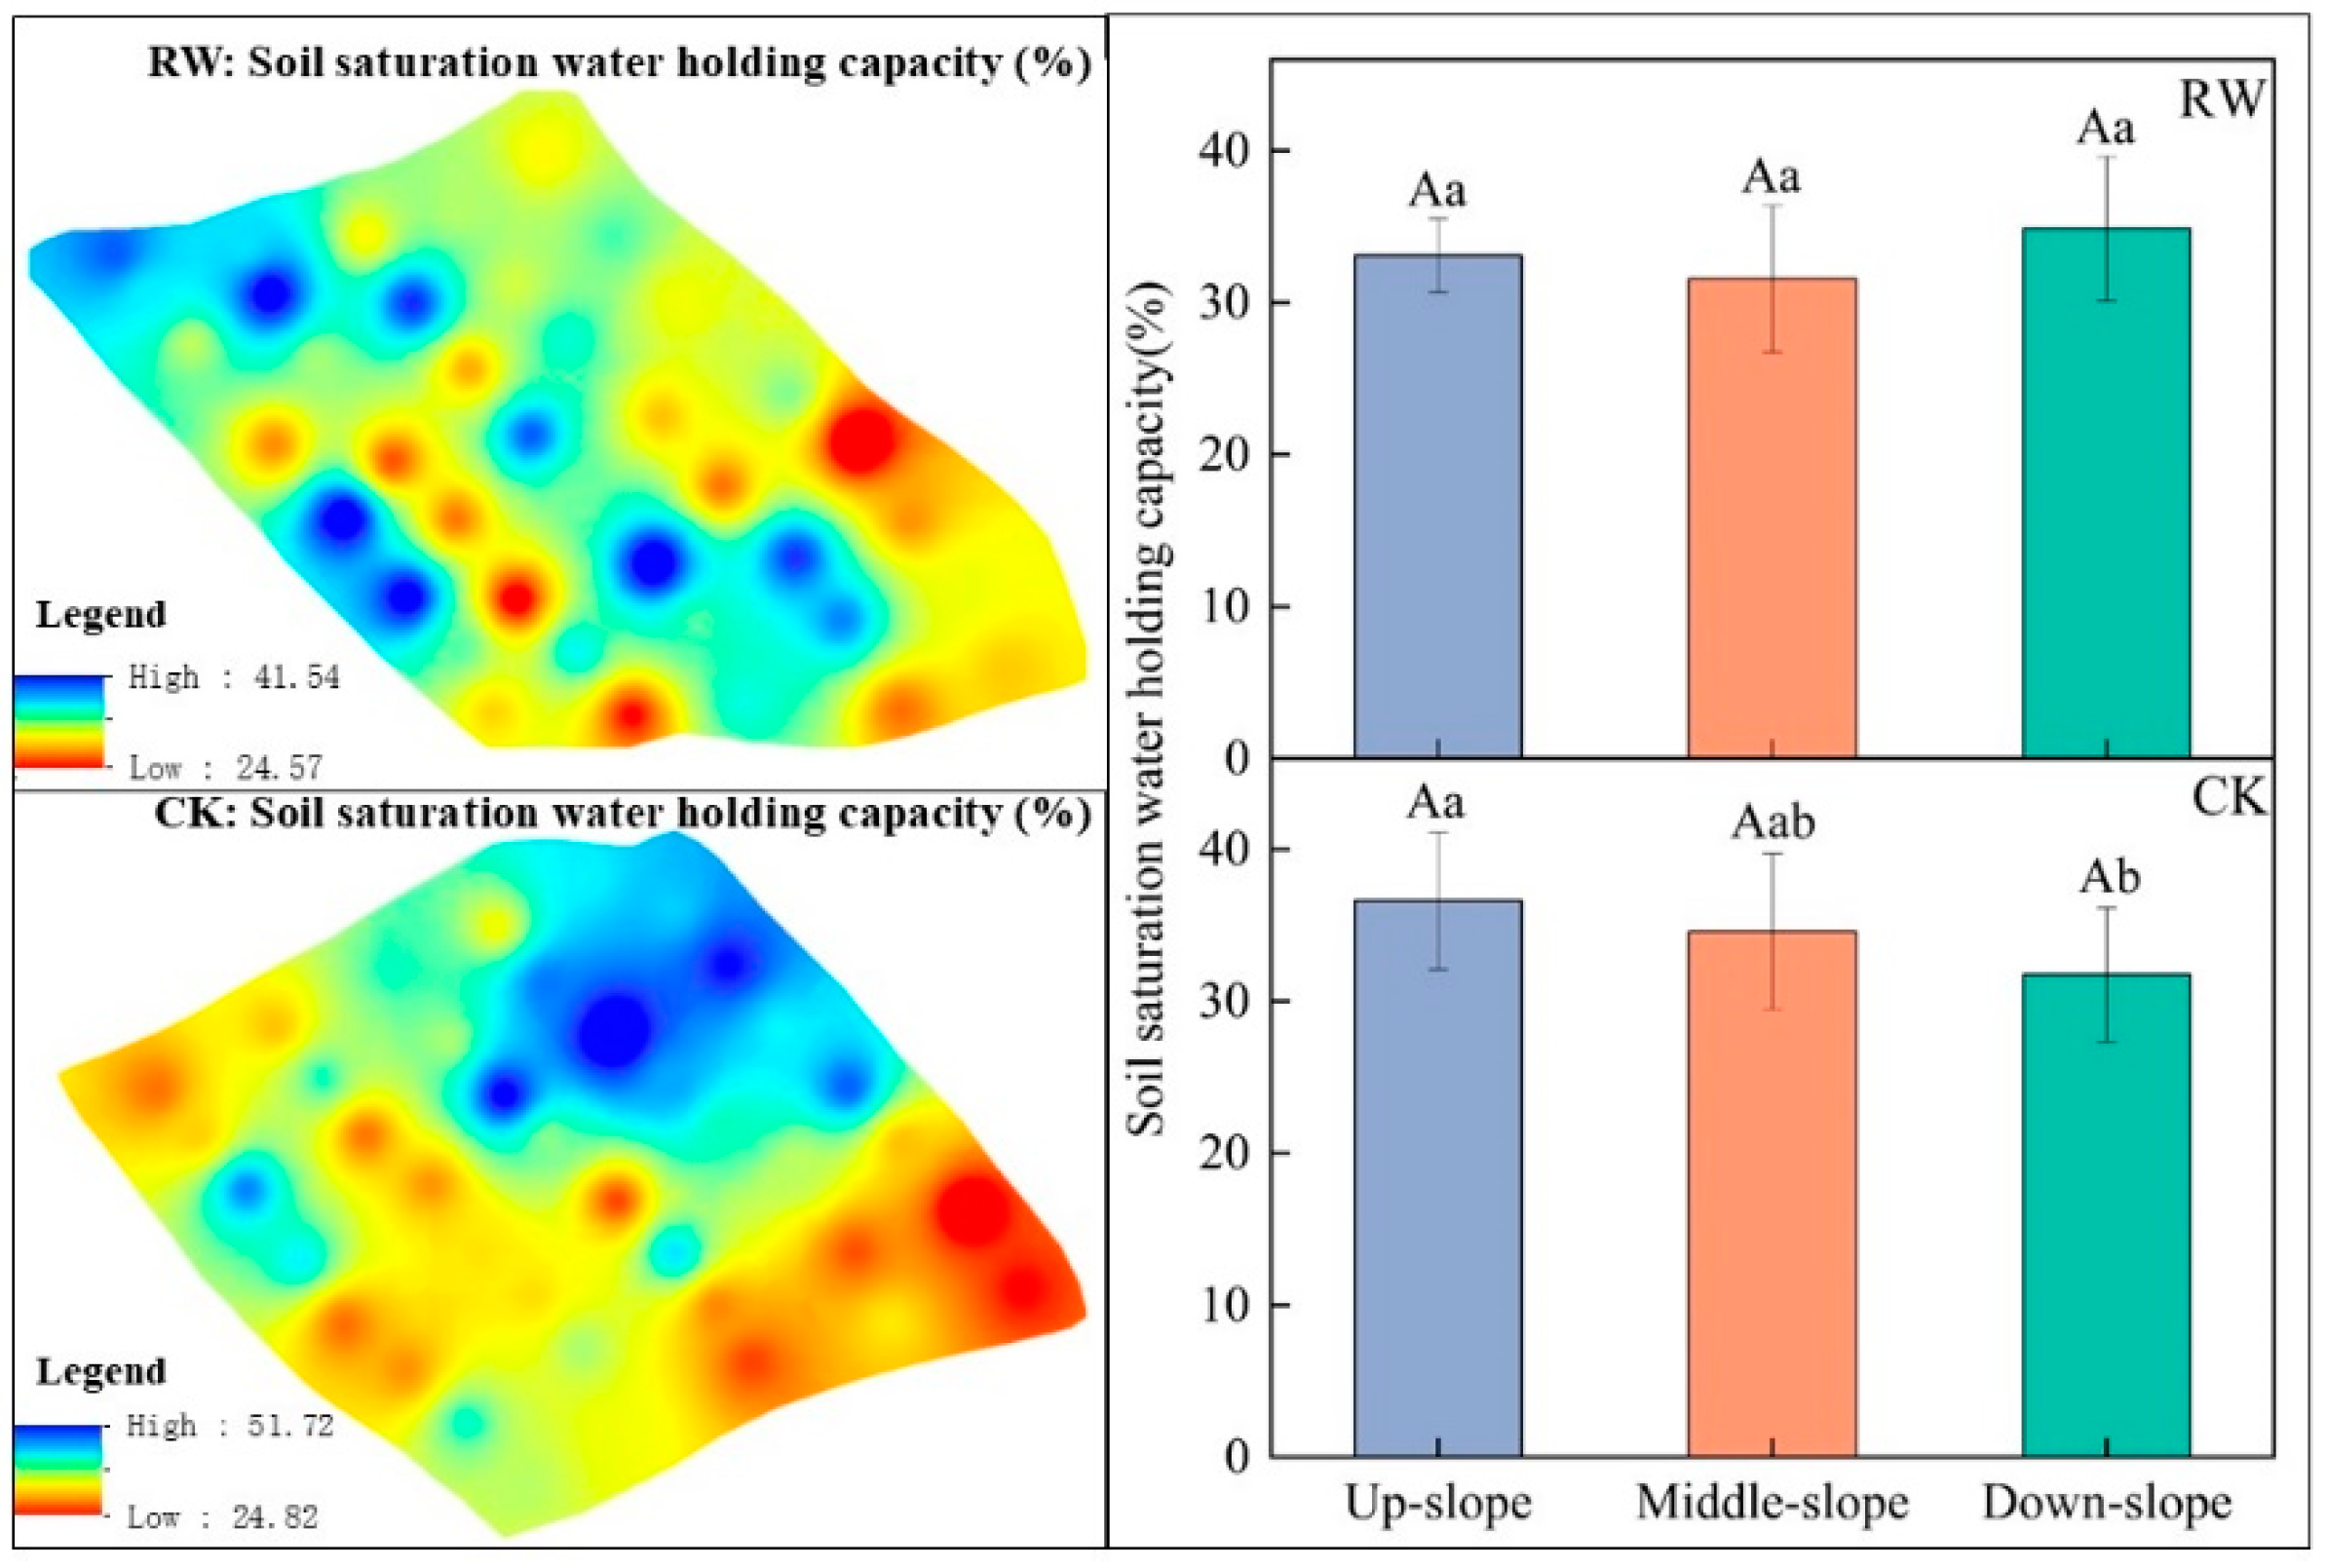
The spatial distribution characteristics of the soil saturation water-holding capacity of RW and CK are shown in Figure 5. For RW, the variation range of soil saturation water-holding capacity was 24.57–41.55%, and the soil saturation water-holding capacity did not change significantly with the decrease in slope position (p > 0.05). For CK, the variation range of soil saturation water-holding capacity was 24.82–44.74%, and the soil saturation water-holding capacity changed significantly between mid-slope and down-slope (p ≤ 0.05). On the down-slope, the soil saturated water-holding capacity of RW increased by 9.86% compared to CK. The efficiency of RW in increasing soil saturation water-holding capacity surpassed that of CK, with a benefit of 1.03.
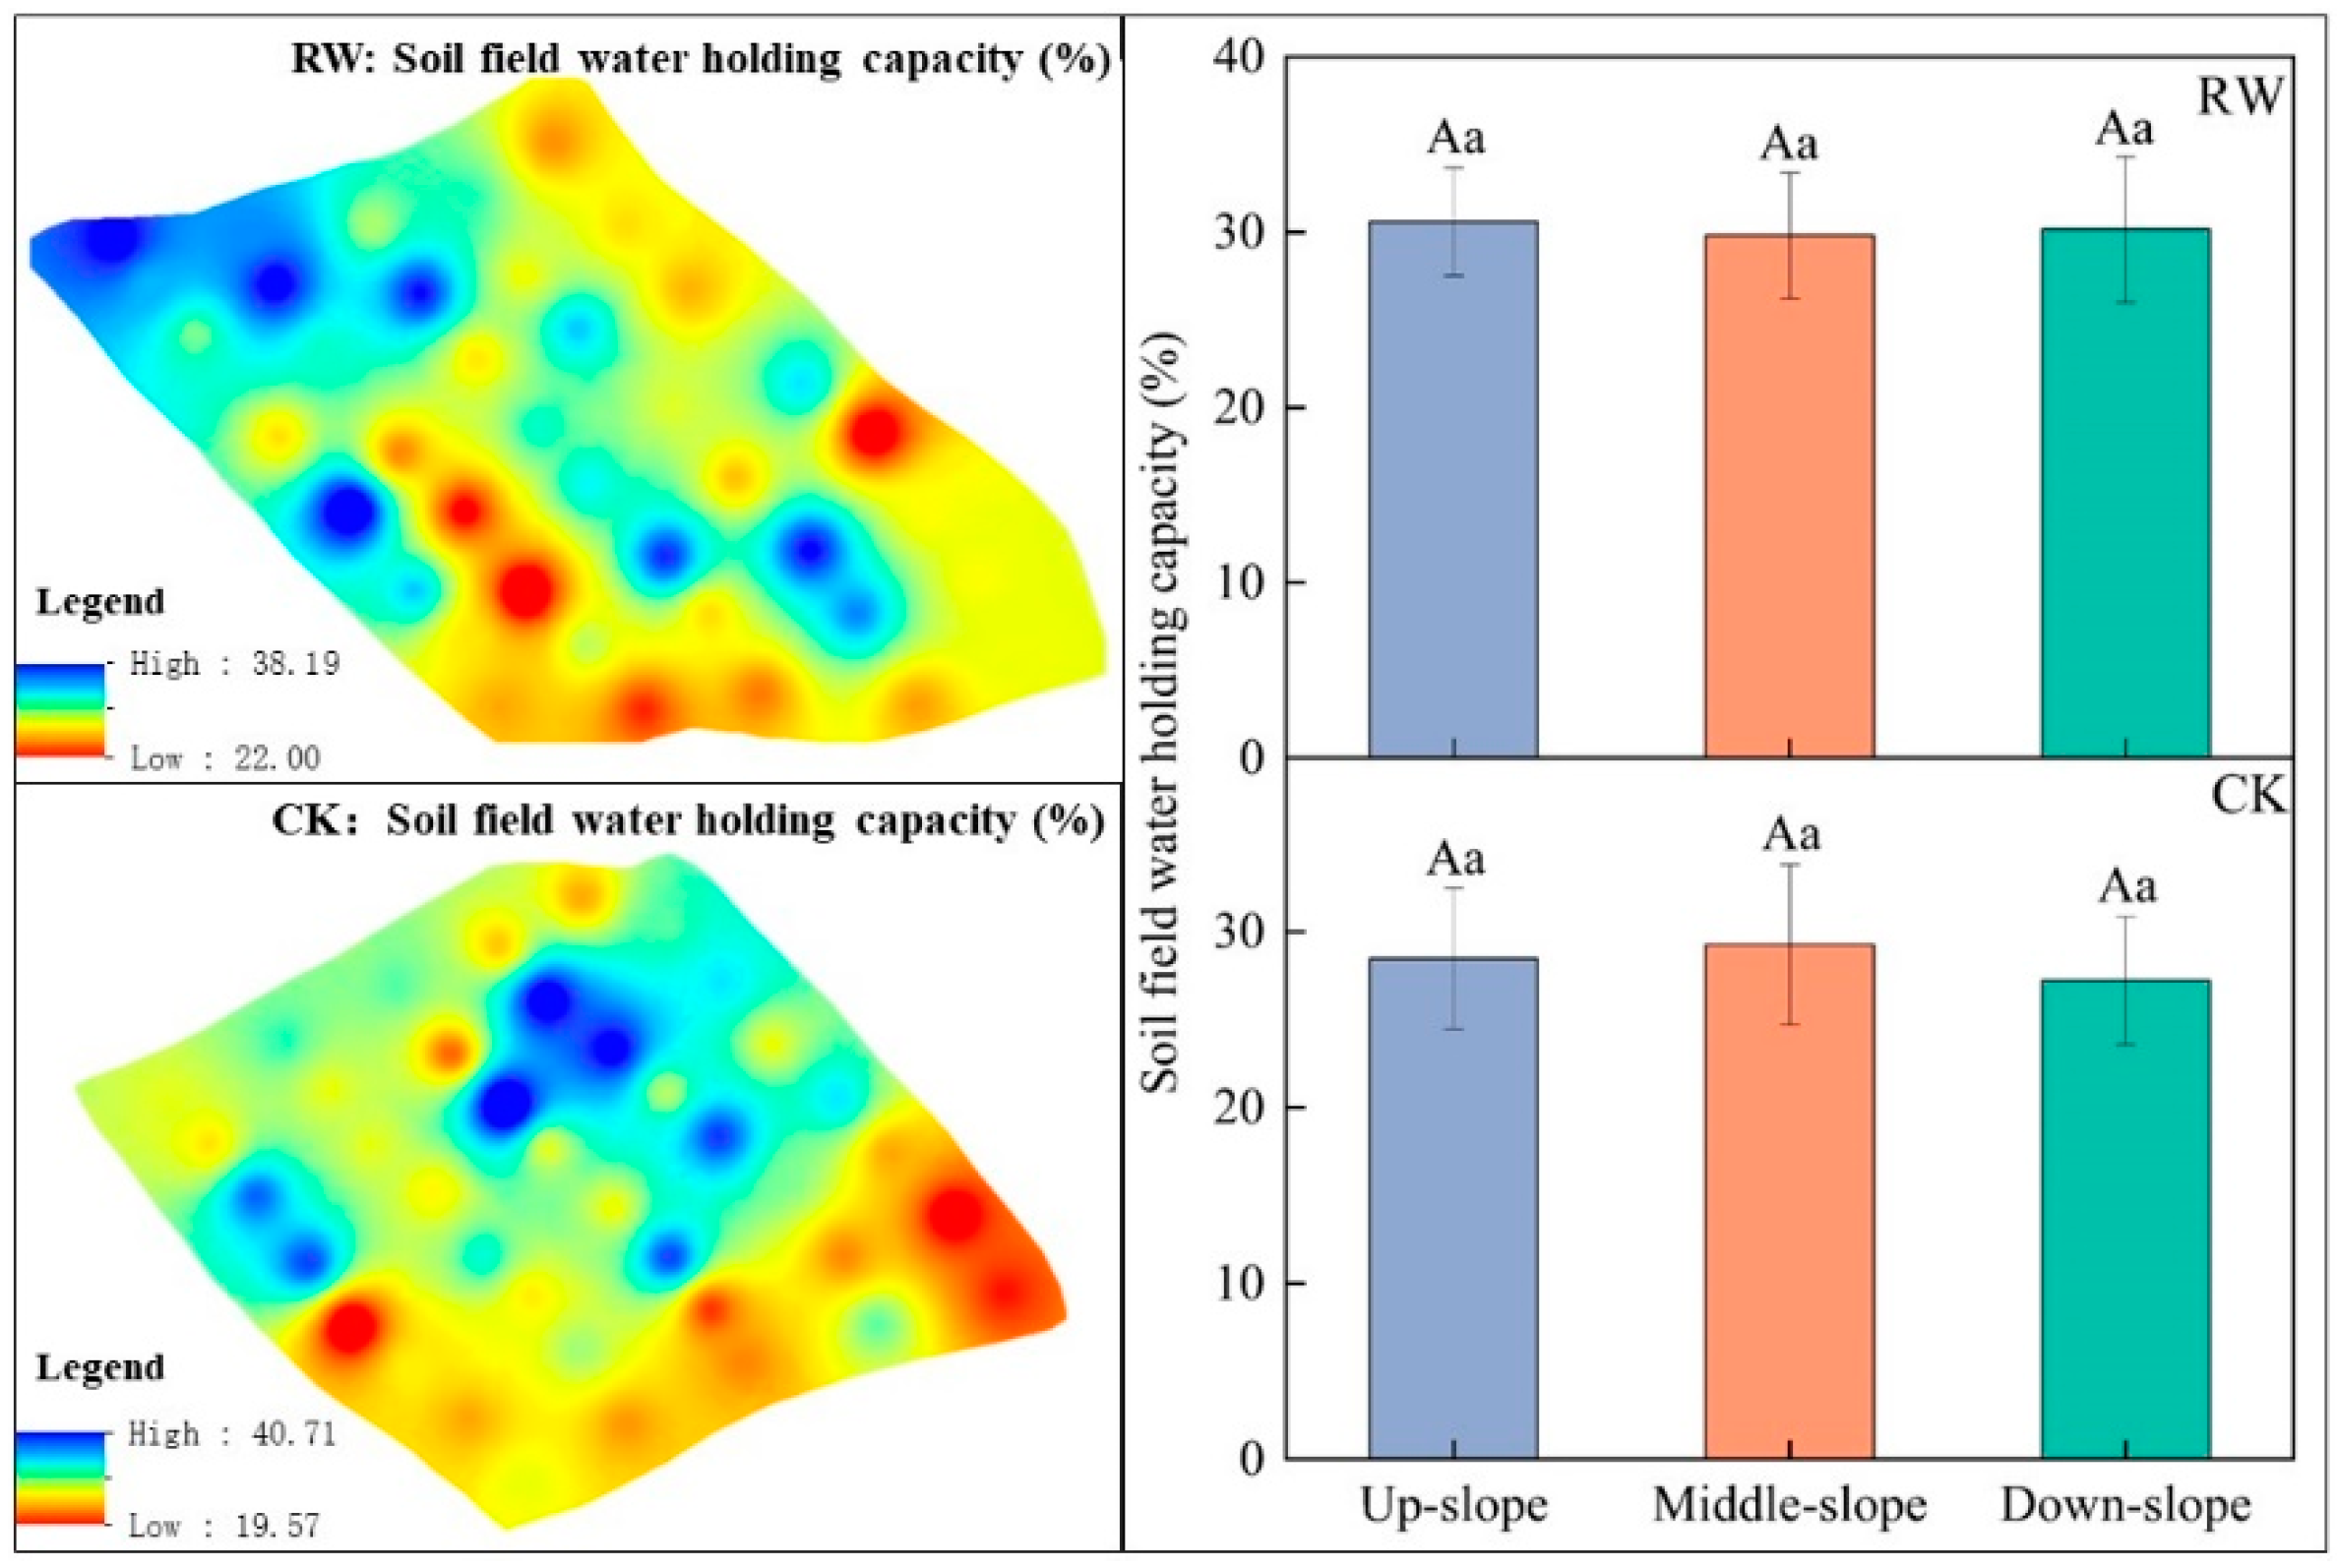
The spatial distribution characteristics of the field water-holding capacity of RW and CK are shown in Figure 6. The field water-holding capacity did not change significantly with the decrease in slope position in RW and CK (p > 0.05). At different slope positions, the field water-holding capacity of RW was all higher than that of CK. Compared to CK, the field water-holding capacity increased by 7.45%, 1.81%, and 10.79% in the up-slope, middle-slope, and down-slope of RW, respectively.
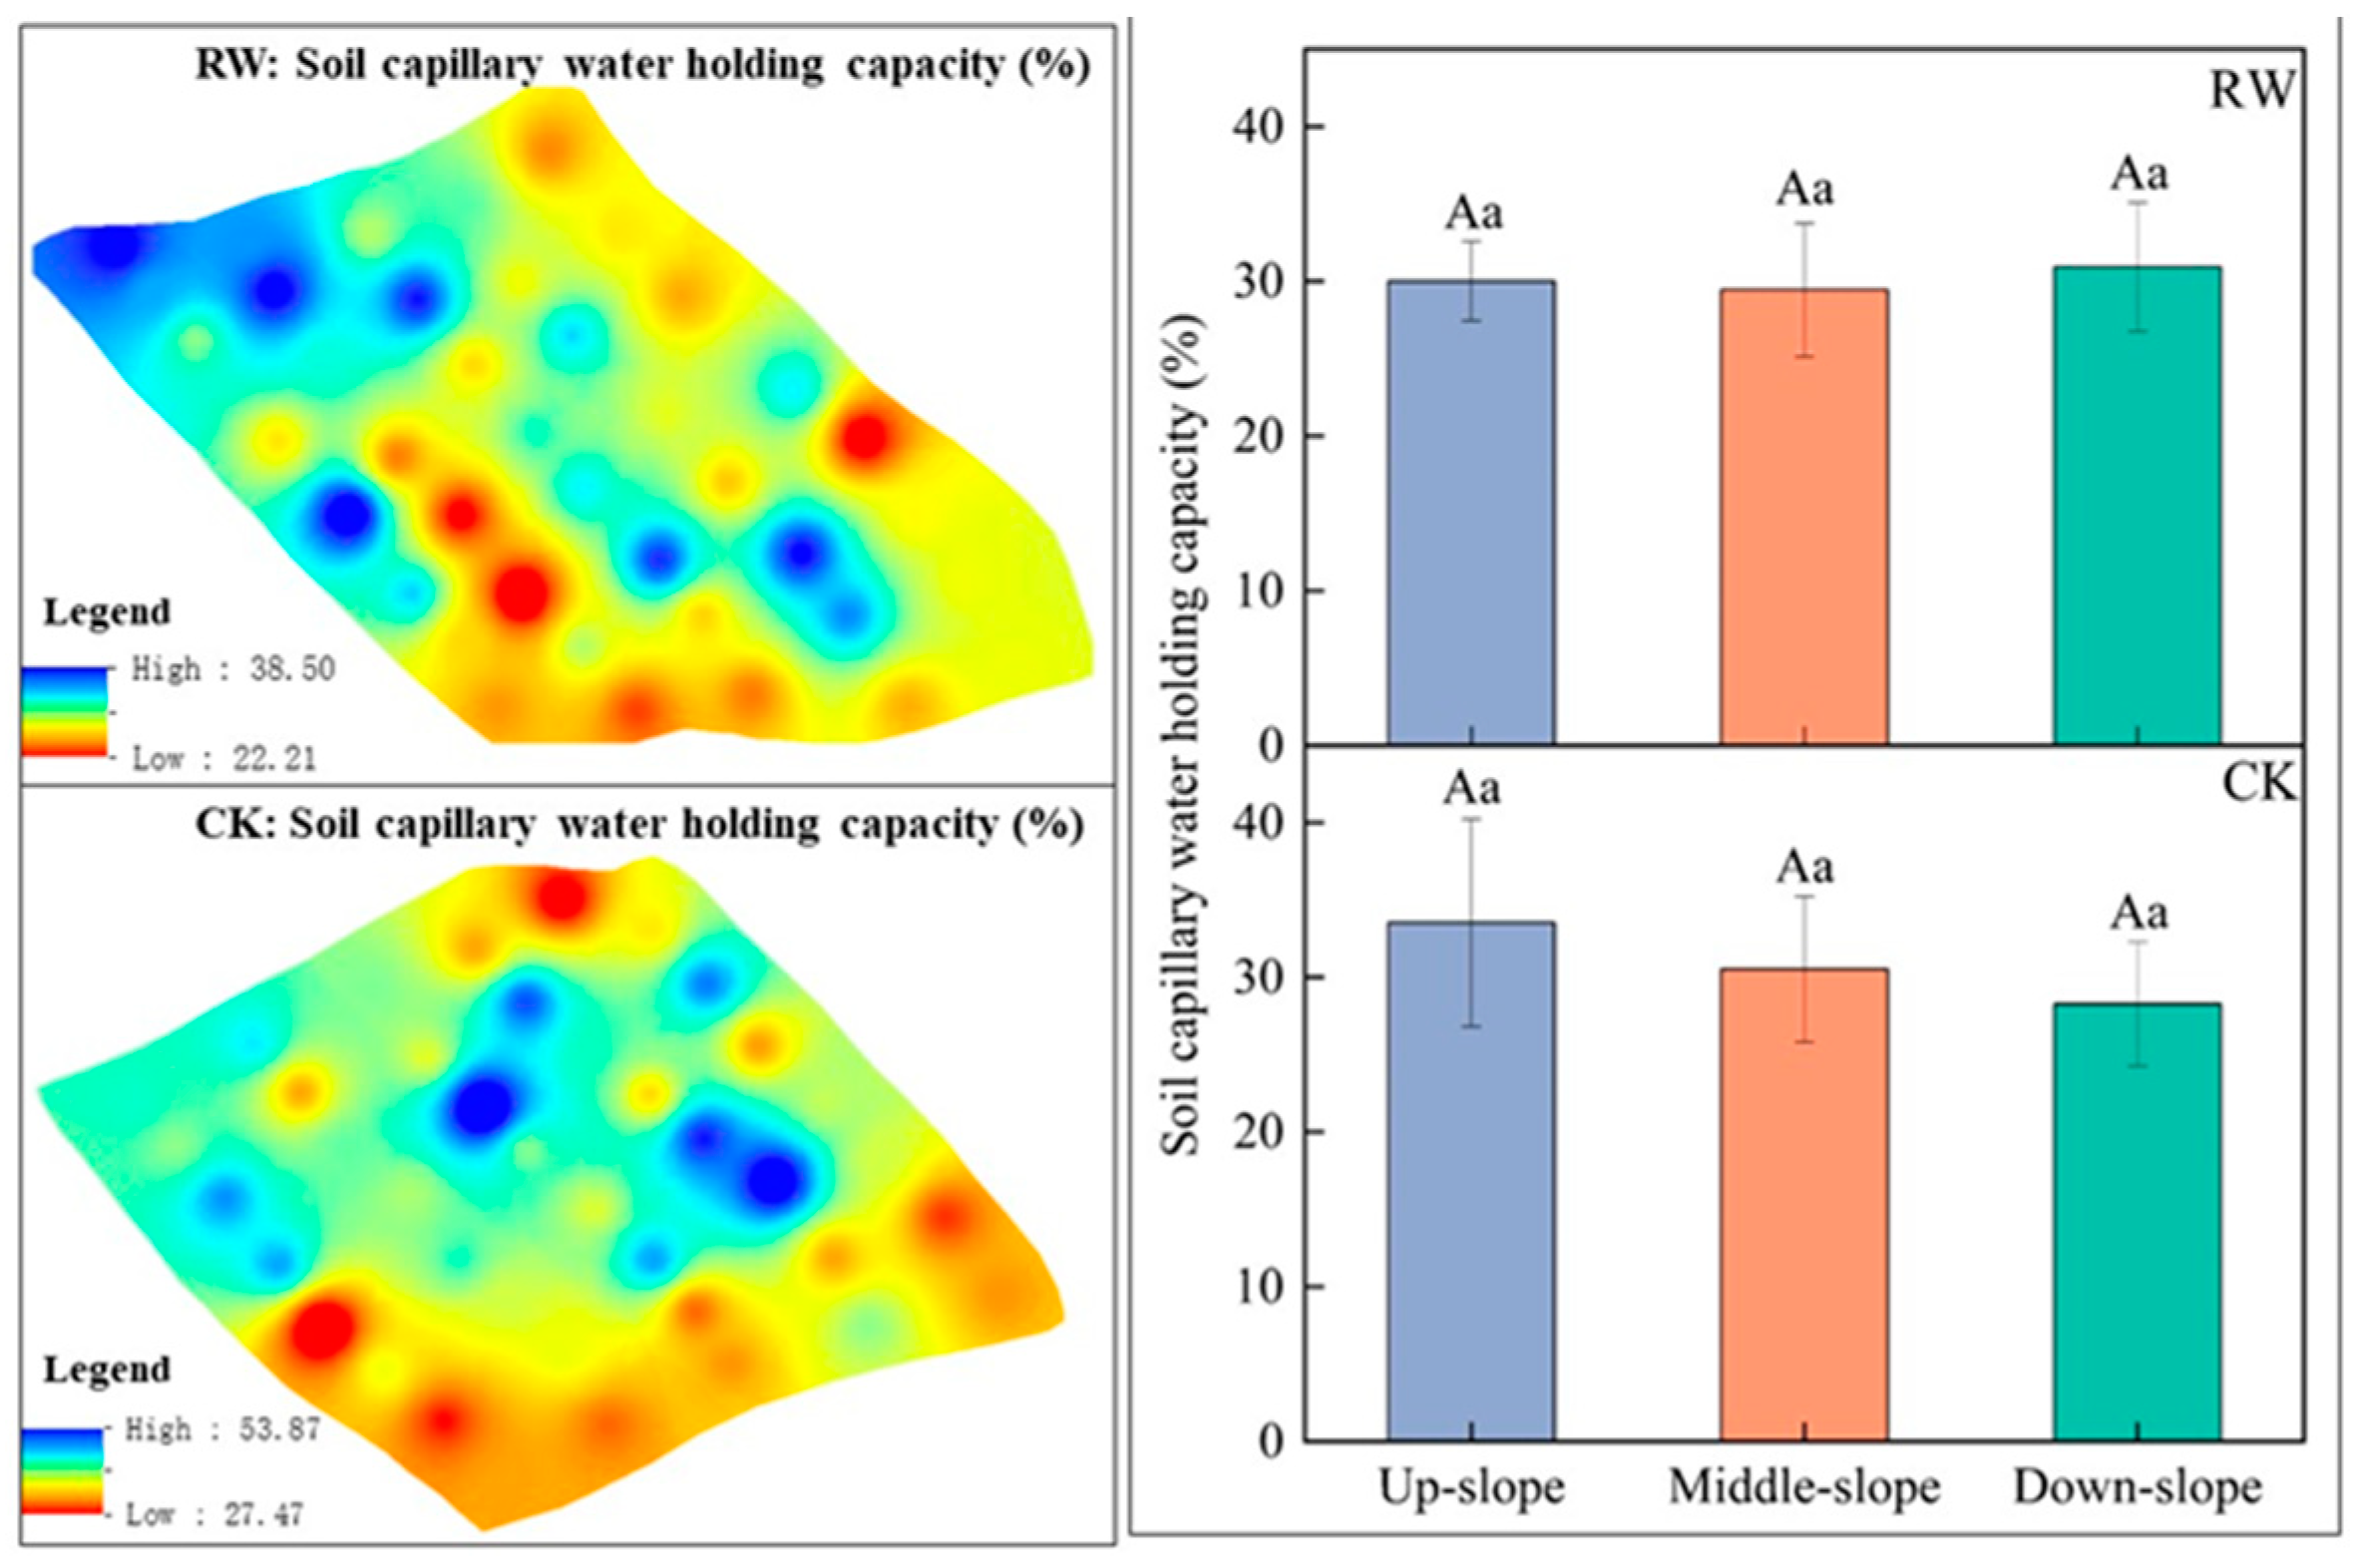
The spatial distribution characteristics of the soil capillary water-holding capacity of RW and CK are shown in Figure 7. For RW, the variation range of total soil porosity was 22.21–38.50%, and the soil capillary water-holding capacity did not change significantly with the decrease in slope position (p > 0.05). For CK, the variation range of total soil porosity was 20.33–46.84%, and the soil capillary water-holding capacity changed significantly with the decrease in slope position (p ≤ 0.05). On the down-slope, soil capillary water-holding capacity was significantly increased by 9.37% (p ≤ 0.05) in RW compared to CK. The efficiency of RW in increasing soil capillary water-holding capacity exceeded that of CK, with a benefit of 1.02.
In the study, RW was effective in affecting soil water-holding capacity, with the field water-holding capacity being mainly affected on the up-slope, which increased by 7.45% compared to CK. Compared to CK, the soil saturated water-holding capacity, capillary water-holding capacity, and field water-holding capacity of RW had significant impacts at the down-slope, increasing by 9.86%, 9.37%, and 10.79%, respectively (Figure 5, Figure 6 and Figure 7). The reason for this is that the construction of ridges changes the sloping farmland, traps rainwater, and increases soil moisture [38]. Terracing changes the slope gradient, shortens the slope length, and thus clearly alters the pattern of water and soil conservation [30]. Ridges reduce surface flow velocities by mechanically blocking surface runoff and increasing soil infiltration; therefore, soil moisture content is elevated [39]. Soil water content, soil saturated water-holding capacity, capillary water-holding capacity, and field water-holding capacity were more homogeneous in RW than in CK (Figure 4, Figure 5, Figure 6 and Figure 7). There are two major reasons why terracing plays a key role in water conservation. First, terracing can directly reshape hillslope micro-topography and create many micro-watersheds across the whole slopes or within slope channels [40,41,42]. These alterations can change the specific hydrological pathways and thus greatly increase the concentration, divergence, and efficiency of rainwater harvesting [43,44,45]. Second, terracing can increase soil roughness and vertical surface relief and decrease the connectivity of overland flow, both of which eventually alter raindrop penetration and increase soil moisture and water-holding capacity [46,47].

3.3. Soil Aggregate Stability

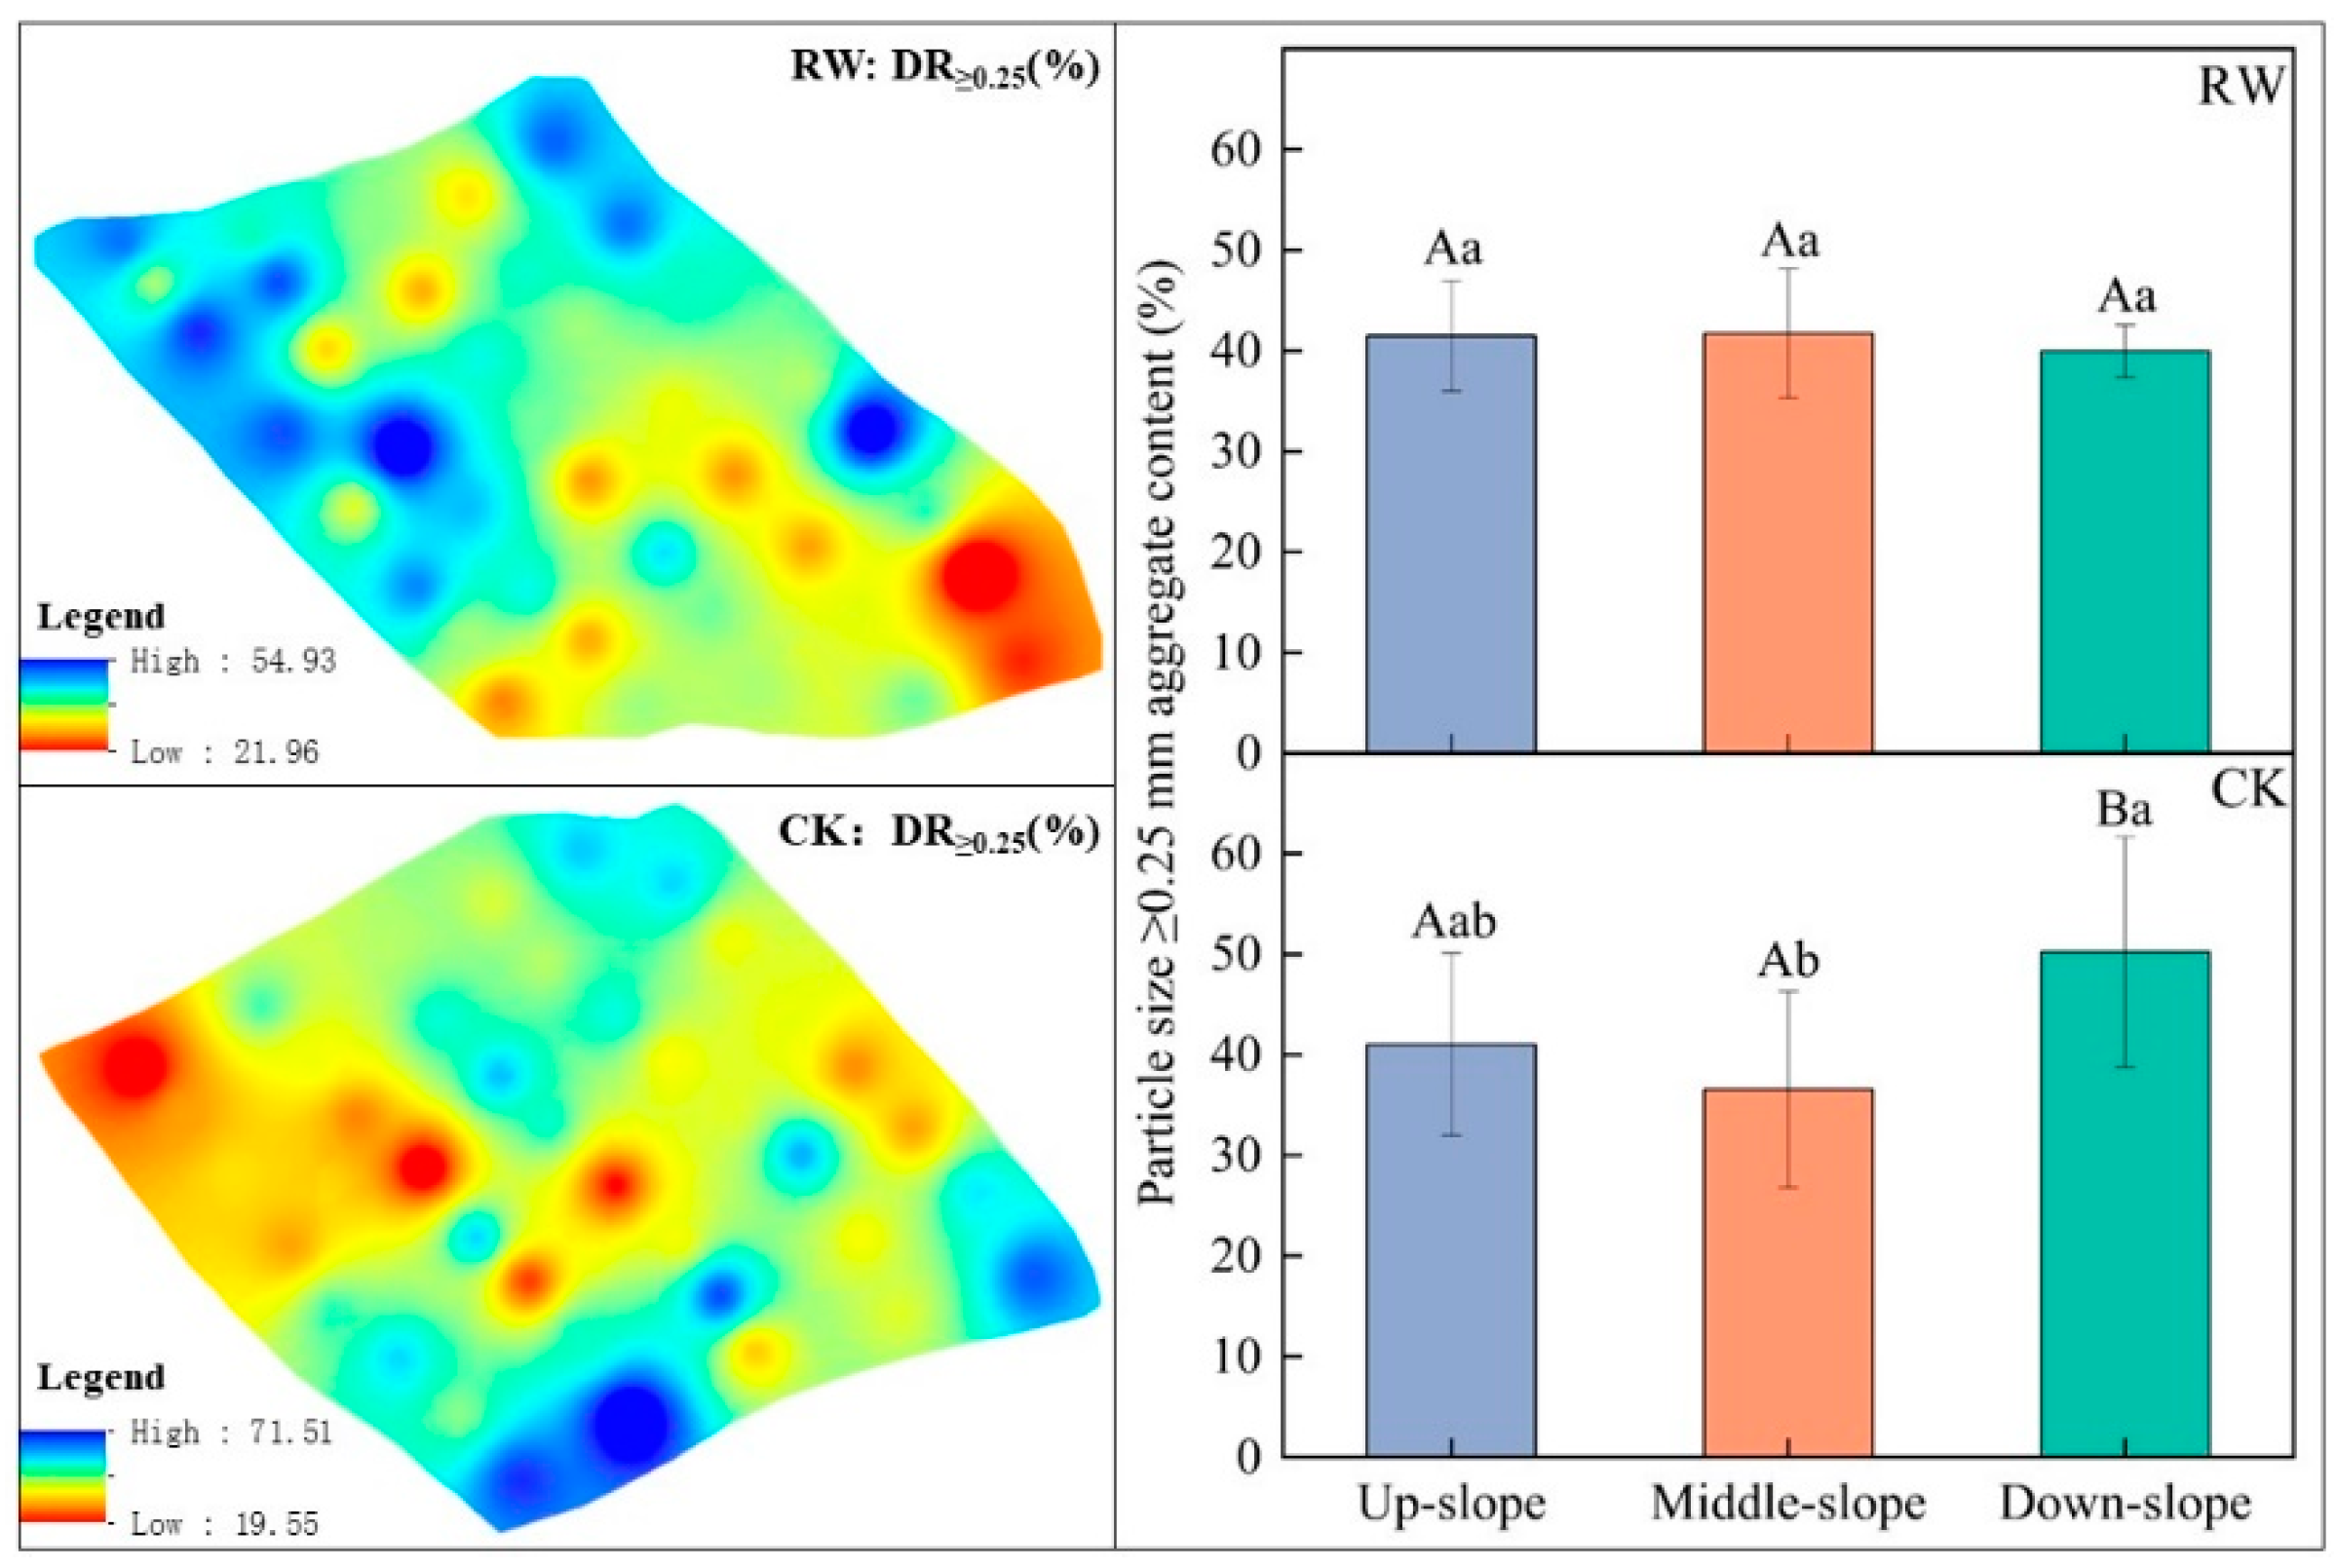
The spatial distribution characteristics of WR>0.25 for RW and CK are shown in Figure 8. For RW, the variation range of WR>0.25 was 32.03–54.94 g, and the WR>0.25 did not change significantly with the decrease in slope position (p > 0.05). For CK, the variation range of WR>0.25 was 19.52–71.51 g, and the WR>0.25 significantly decreased at the mid-slope location (p ≤ 0.05). Compared to CK, the WR>0.25 increased by 1.05% and 14.09% at the up-slope and middle-slope of RW, and the WR>0.25 at the down-slope position of RW was reduced by 20.43%. The efficiency of RW on increased WR>0.25 is greater than that of CK, and the benefit is 1.04.
The spatial distribution characteristics of the MWD in RW and CK are shown in Figure 9. The MWD did not change significantly with the decrease in slope position in RW and CK (p > 0.05). The variation ranges of MWD for RW and CK were 0.29–0.63 mm and 0.26–0.07 mm, respectively. Compared to CK, the MWD increased by 2.41% at the up-slope of RW, and the MWD at the middle-slope and down-slope of RW was reduced by 4.85% and 19.27%, respectively. The efficiency of RW in increasing MWD surpassed that of CK, with a benefit of 1.09.
The spatial distribution characteristics of the GMD of RW and CK are shown in Figure 10. The GMD did not change significantly with the decrease of slope position in RW (p > 0.05), but the GMD changed significantly with the decrease of slope position in CK (p ≤ 0.05). The variation ranges of GMD for RW and CK were 0.2–0.3 mm and 0.17–0.43 mm, respectively. Compared to CK, the GMD increased by 2.83% at the middle-slope of RW (p ≤ 0.05), and the GMD at the down-slope of RW was reduced by 22.66% (p > 0.05). The efficiency of RW in increasing GMD surpassed that of CK, with a benefit of 1.09.
The spatial distribution characteristics of D of RW and CK are shown in Figure 11. The D did not change significantly with the decrease in slope position under RW and CK (p > 0.05). The variation ranges of D for RW and CK were 2.63–2.85 and 2.60–2.92, respectively. Compared to CK, the D did not change significantly at the up-slope of RW, and the D at the down-slope of RW was reduced by 3.27%. The efficiency of RW in reducing D exceeds that of CK, with a benefit of 1.01.
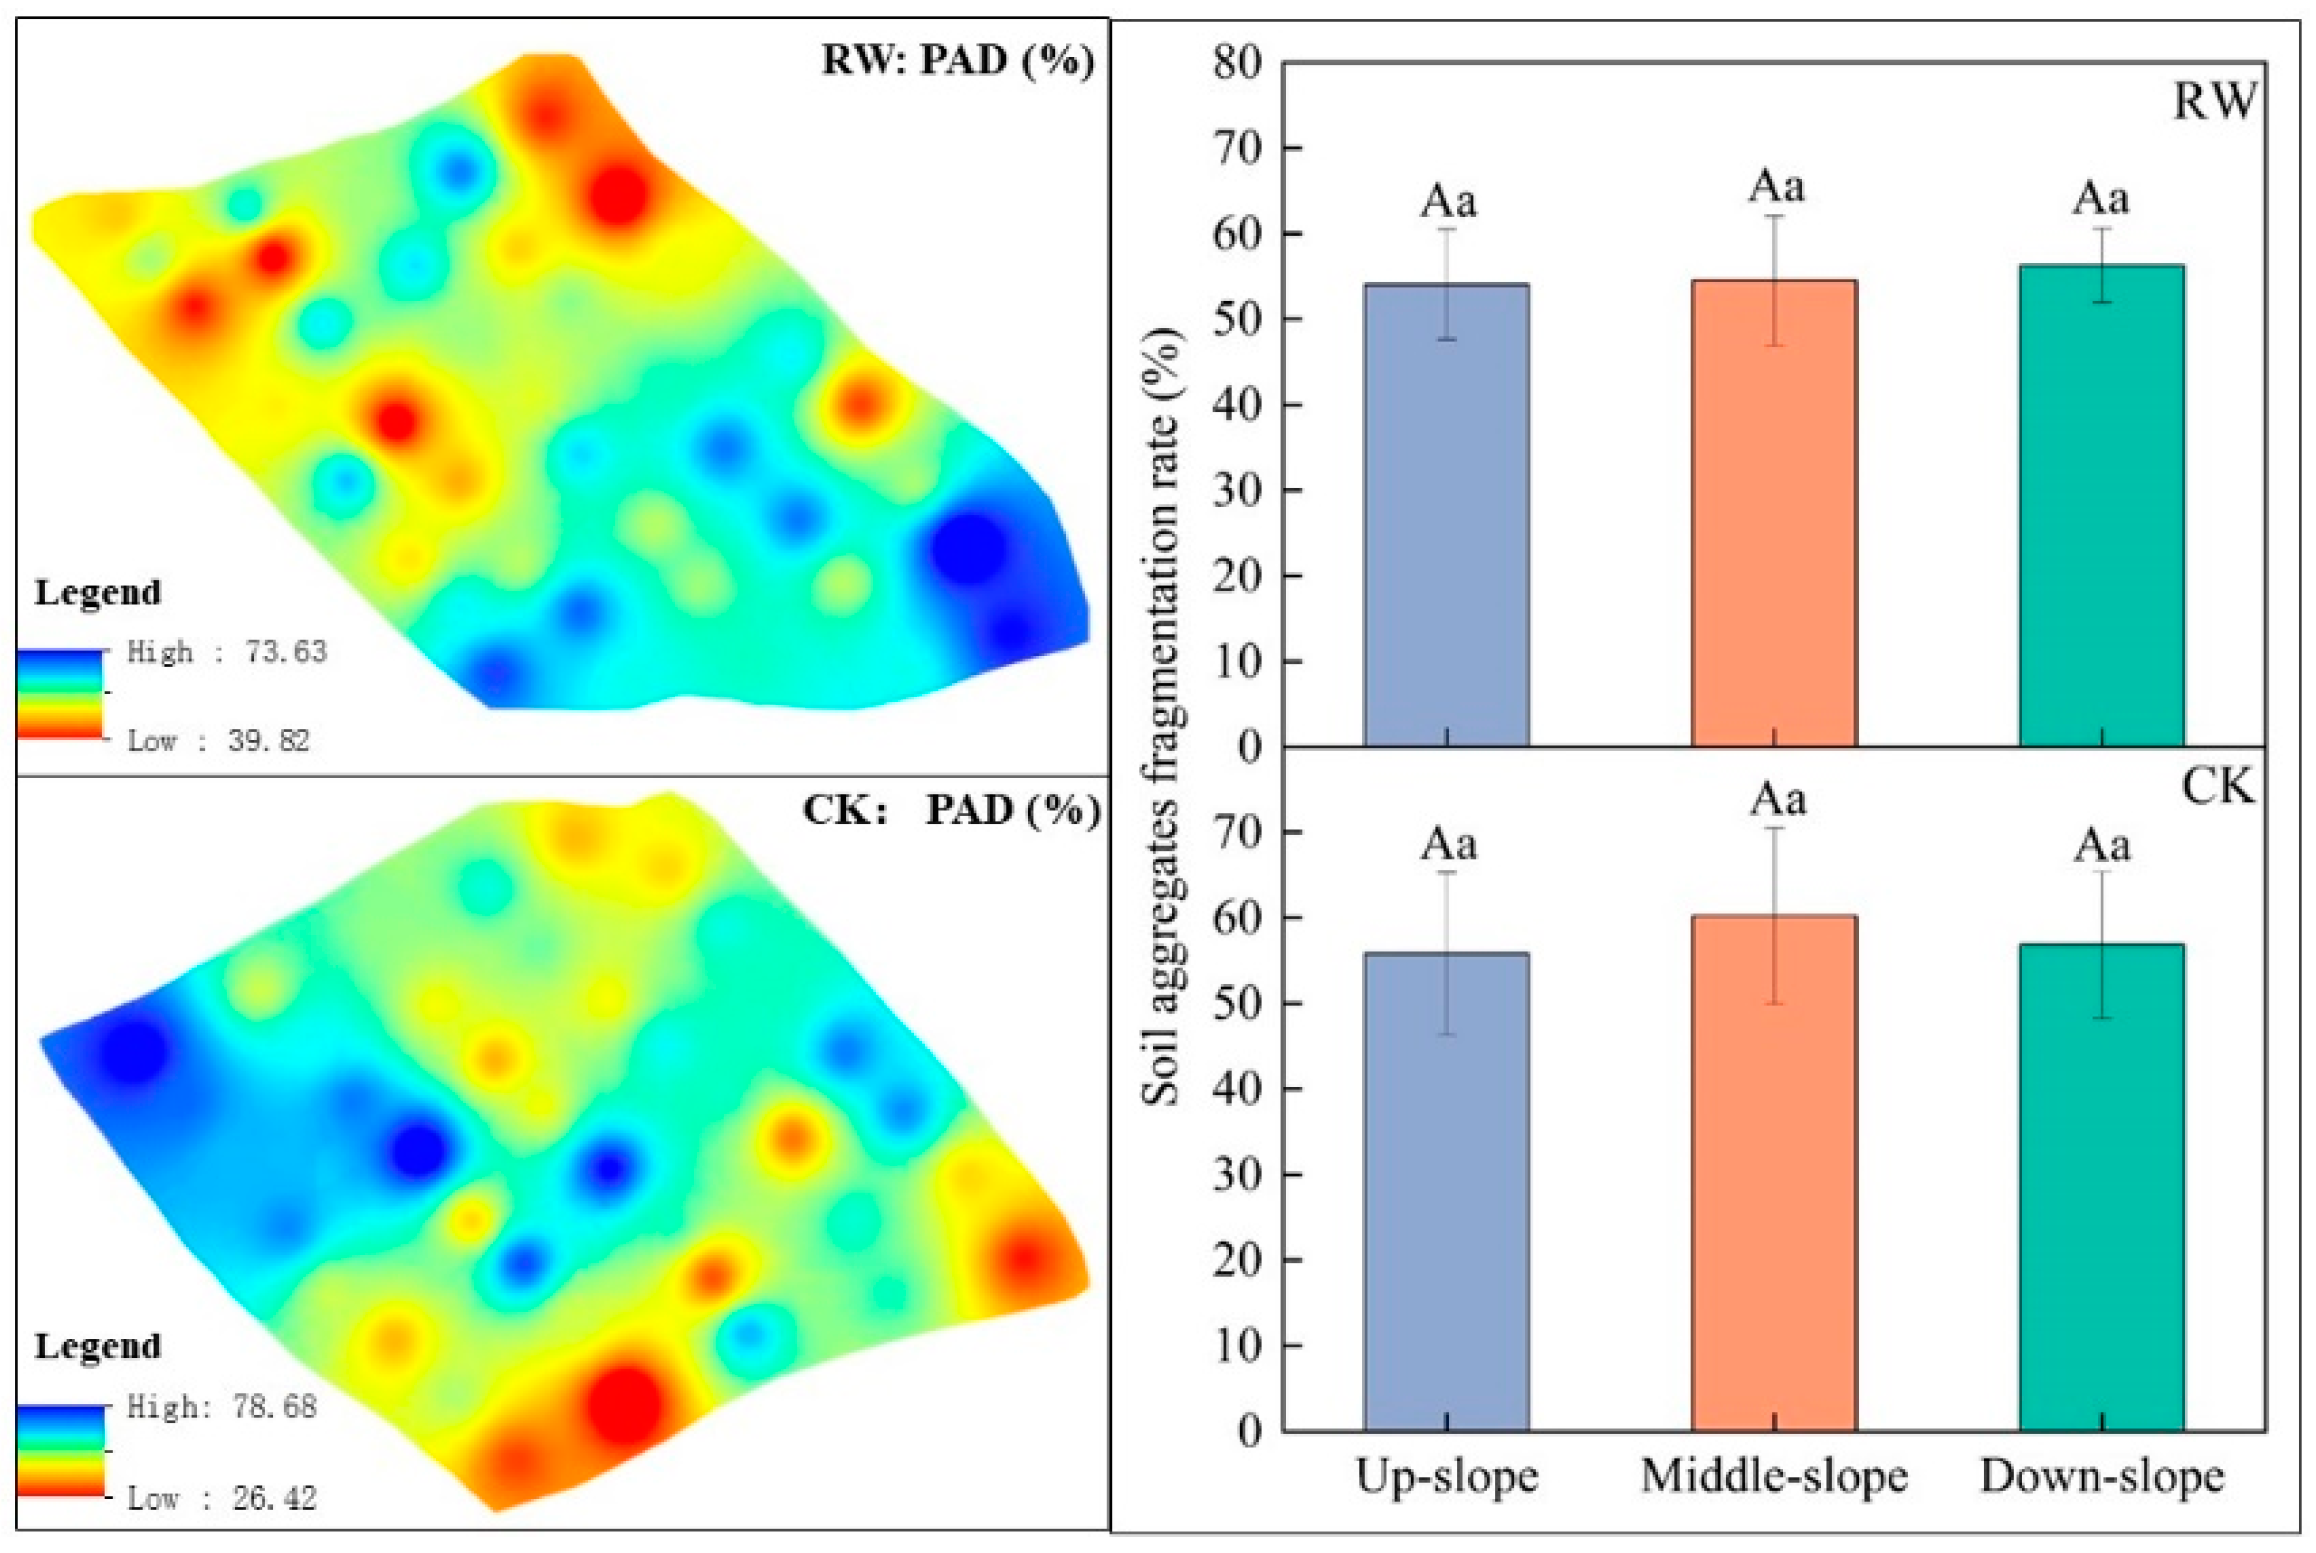
The spatial distribution characteristics of PAD for RW and CK are shown in Figure 12. The PAD did not change significantly with the decrease in slope position in RW and CK (p > 0.05). The variation range of PAD for RW and CK was 41.14–64.66% and 43.38–78.71%, respectively. Compared to CK, the PAD decreased by 3.15%, 9.45%, and 0.92% in the up-slope, middle-slope, and down-slope of RW, respectively. The efficiency of RW in reducing PAD exceeded that of CK, with a benefit of 1.05. The soil structural characteristics of RW were more homogeneous than those of the sloped farmland. Higher improvements were found in the total soil porosity, soil aggregate content >0.25, GMD, and PAD of RW (Figure 2, Figure 11, Figure 13 and Figure 14). This suggests that the construction of ridges has a strong influence on maintaining the stability of soil structure characteristics.
In the study, RW significantly affected soil structural characteristics compared to CK. At the up-slope, soil capillary porosity increased by 5.05% in RW. At the middle-slope, soil capillary porosity, >0.25 mm soil aggregate content, soil bulk density, and PAD in RW were mainly affected, and the soil capillary porosity and >0.25 mm soil aggregate content in RW increased by 2.62% and 14.09%, respectively. Soil bulk density and PAD in RW decreased by 2.14% and 9.45%, respectively, compared to CK. At the down-slope, soil capillary porosity, soil bulk density, and D were significantly affected in RW. Compared to CK, soil capillary porosity increased by 15.51%, while soil bulk density and D decreased by 4.32% and 3.27%, respectively, in RW. The results of the study are similar to those of Moges, et al. [48], who found that the soil D of sloping farmland with ridge construction varied as follows: up-slope > middle-slope > down-slope at different slope positions, and the soil D of sloping farmland with ridge at the same slope position was smaller than the D of sloping farmland. The decrease in D with slope position may be attributed to the fact that with the construction of ridges, the ridges improve soil structure and soil physical properties by intercepting the downward movement of soils along the slope, lowering the slope between ridges, intercepting runoff, slowing down the rate of water flow on the slope, and increasing infiltration [48]. Moges et al. reported that the D value of ridge soils ranged from 2.83 to 2.84, whereas in this study, the D value ranged from 2.60 to 2.87, indicating an overall smaller range compared to Moges, et al. [48]. In this study, the MWD and GMD of RW are higher than those of CK. Higher MWD and GMD indicate better soil aggregate structure and stability, which enhances erosion resistance. Larger and more stable soil particles are less prone to being washed away by water or wind, helping to reduce soil erosion. This lowers the risk of soil loss and positively impacts the reduction of surface runoff and sediment loss [49]. The MWD and GMD of soil affect pore structure, which can improve soil moisture retention, reduce moisture loss, and prevent soil structure collapse or compaction [50].

3.4. The Annual Average Soil Loss

The spatial distribution characteristics of the annual average soil loss (A) for RW and CK are shown in Figure 13. The annual average soil loss (A) was calculated as shown in Table 2. The spatial distribution characteristics of A of RW and CK. The range of soil erosion in RW was 0.01–2.77 t/ha. The soil erosion rate in RW was dominated by mild erosion, which accounted for about 65% of RW. The soil erosion rate in RW had a small portion of moderate erosion, which accounted for about 35% of RW. The range of soil erosion in CK was 2.81–7.26 t/ha. The soil erosion rate in CK was dominated by moderate erosion, which accounted for about 62.5% of CK. The soil erosion rate of CK had a small portion of strongly eroded soil, which accounted for about 37.5% of RW. The efficiency of RW in reducing A surpassed that of CK, with a benefit of 2.46.
The study calculated the annual average soil loss using the Chinese Soil Loss Equation (CSLE) equation. It was found that RW effectively reduced the annual average soil loss by 59.30% compared to CK. The annual average soil erosion in RW was reduced on all slopes compared to CK, with reductions of 51.60%, 64.41%, and 60.10% at the up-slope, middle-slope, and down-slope, respectively. In the study by Zheng [51], sloping farmland with ridges reduced runoff and soil erosion, thus lowering the annual average soil loss. This finding is similar to the results of the current study, which shows that sloped farmland with ridge construction can significantly decrease the annual average soil loss. This is mainly due to the fact that ridges allow rainwater to accumulate on sloping farmland, reducing runoff velocity and increasing water infiltration. By increasing soil surface roughness and promoting, surface soil aggregation ridges can mitigate soil erosion in sloped farmland [52].

3.5. Comprehensive Evaluation of Soil Physical Properties

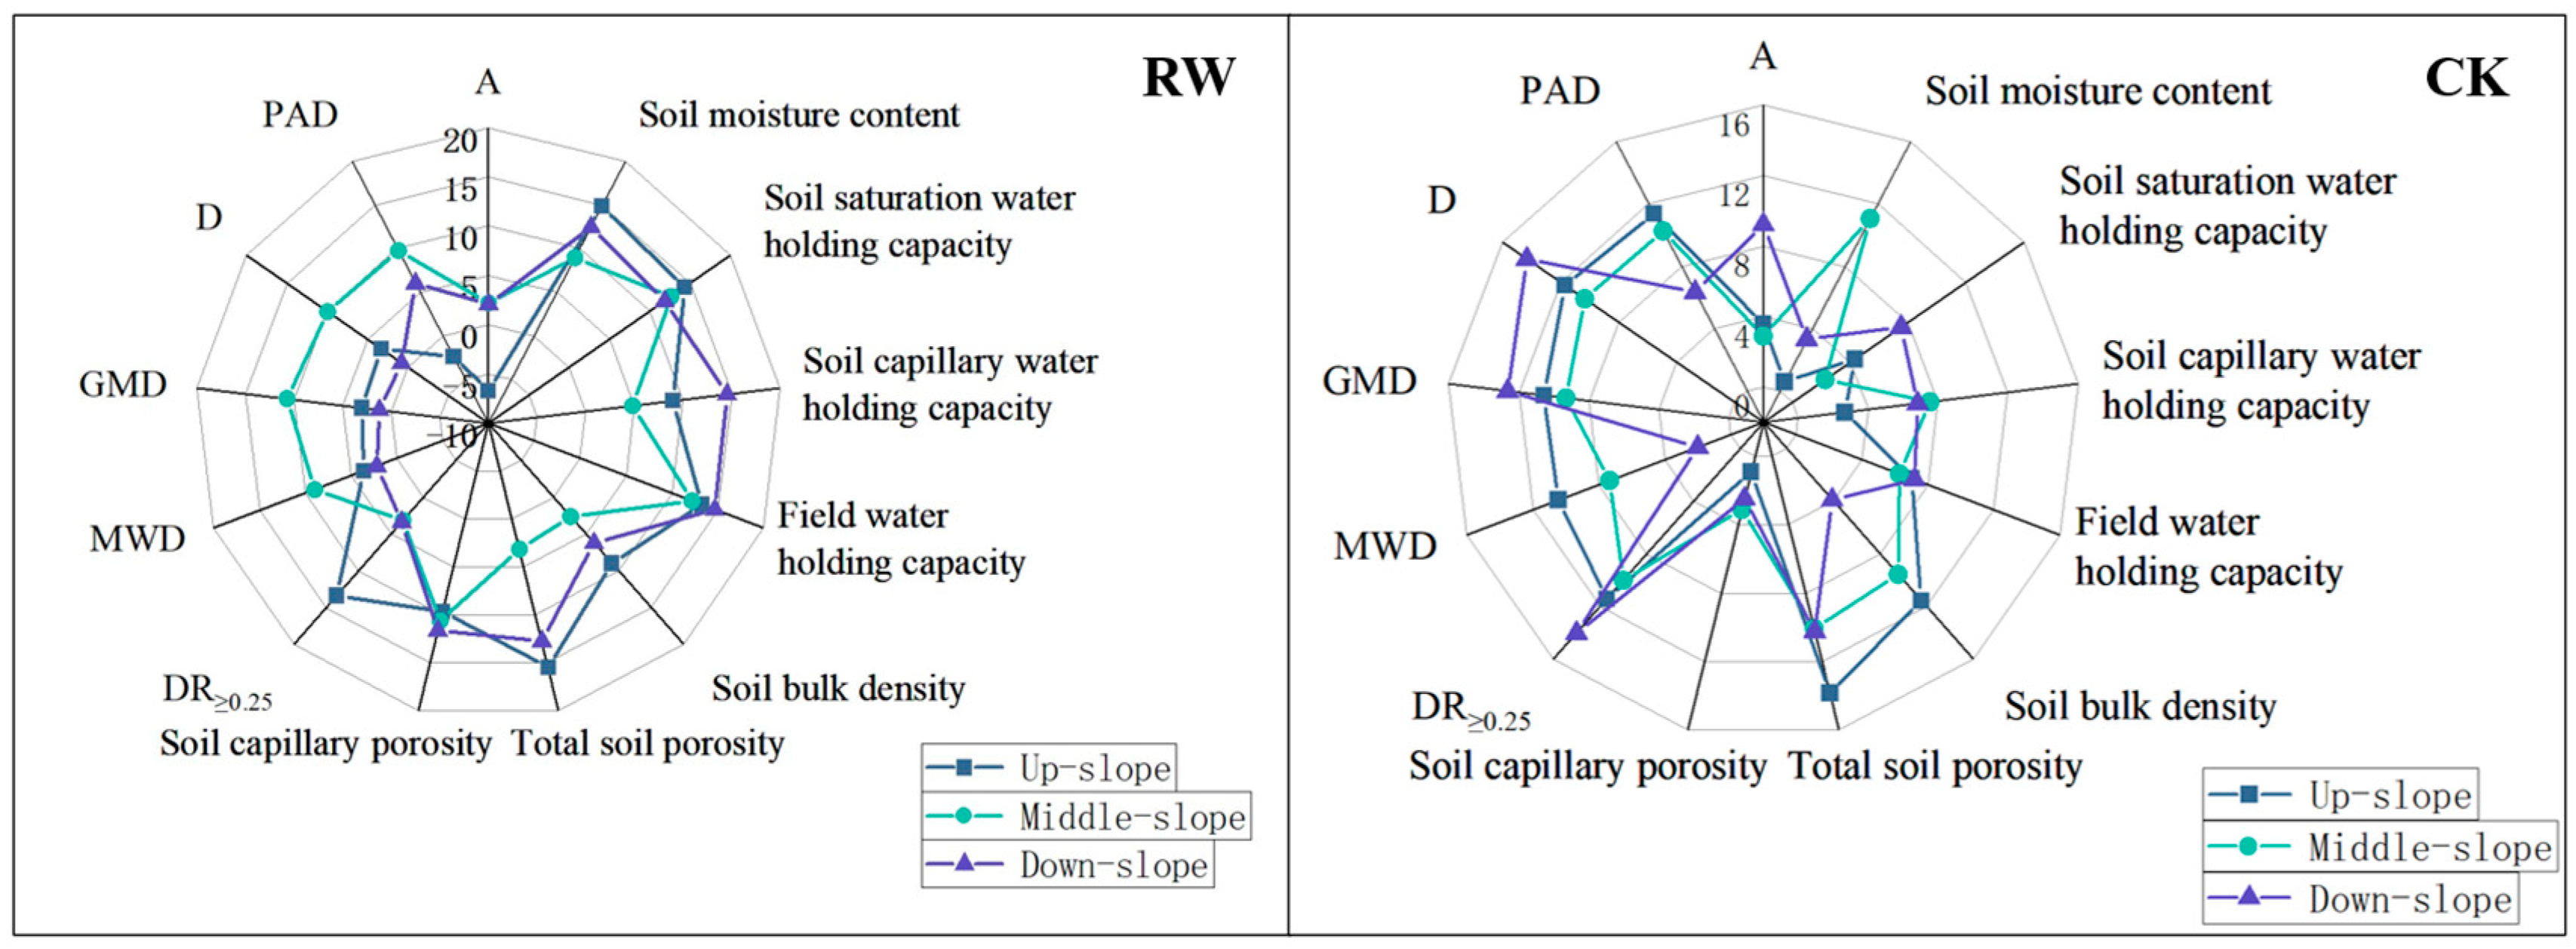
The combined score evaluation of soil moisture characteristics and soil structure characteristics of RW and CK at different slope positions is shown in Figure 14. On the up-slope, soil water content, saturated water-holding capacity, capillary water-holding capacity, field water-holding capacity, total porosity, capillary porosity, and DR>0.25 in RW had higher scores than those of CK. In the mid-slope, saturated water-holding capacity, field water-holding capacity, capillary porosity, MWD, and GWD in RW had higher scores than those of CK. On the down-slope, soil water content, saturated water-holding capacity, capillary water-holding capacity, field water-holding capacity, bulk density, total porosity, capillary porosity, and MWD in RW had higher scores than those of CK.
The combined score evaluation of soil water-holding capacity and soil structure for RW and CK is shown in Figure 15. The score of RW for soil water content, saturated water-holding capacity, capillary water-holding capacity, field water-holding capacity, soil bulk density, total soil porosity, and soil capillary porosity was higher than that of CK by 37.30%, 274.93%, 5526.34%, 174.74%, 47.96%, 209.69%, and 322.89%, respectively. The score of RW for DR> 0.25, MWD, GMD, fractal dimension, soil aggregate fragmentation, and the annual average soil loss score was less than that of CK. RW scored higher in soil water-holding capacity, whereas CK scored higher in soil structure.
Compared to CK, the soil water-holding capacity and soil pores of RW had higher scores on the up-slope. The soil aggregate structure characteristics of CK had higher scores on the up-slope. Compared to CK, the soil structure of RW had higher scores in the middle-slope, and the soil water-holding capacity of RW had higher scores in the down-slope. For RW, the scores for soil structure characteristics increased for the middle-slope and down-slope compared to the up-slope.

4. Conclusions

The water-holding capacity of the field was increased in RW, and the soil moisture characteristics were more uniformly distributed spatially. Compared to CK, RW showed a decrease in soil bulk density, D and PAD, while total soil porosity, capillary porosity, WR>0.25, MWD, and GMD were more uniformly distributed spatially. At the down-slope, the total soil porosity and soil capillary porosity of RW compared to CK increased by 2.84% and 15.51%, respectively. Sloping farmland with ridges can effectively improve the soil structure of the whole sloping farmland, increase the stability of the soil structural characteristics of the down-slope, and improve the erosion resistance of the soil. Compared to CK, the PAD decreased by 3.15%, 9.45%, and 0.92% in the up-slope, middle-slope, and down-slope of RW, respectively. Sloping farmland with ridges can effectively improve soil structure and prevent the collapse and compaction of soil. This, in turn, reduces the risk of soil erosion.
The annual average soil loss in RW was significantly lower than that in CK. The intensity of soil erosion in RW was characterized as mild. Soil erosion in CK was moderate. The annual average soil loss of RW was reduced by 61.85–99.64% compared to the annual average soil loss of CK. The annual average soil erosion in RW was reduced on all slopes compared to CK, with reductions of 51.60%, 64.41%, and 60.10% at the up-slope, middle-slope, and down-slope, respectively. Sloping farmland with ridges can effectively retain nutrients and fertility in the farmland soil. By benefit calculation, the soil water-holding capacity and soil structural characteristics of RW were more beneficial than those of CK, with benefits ranging from 1.01 to 1.09, while the annual average soil loss benefit reached 2.46.
In conclusion, sloped farmland with ridges can effectively improve the water-holding capacity of the soil, improve soil structure, and increase soil moisture, especially on the down-slope. The physical properties of the soil are more uniform on sloped farmland with ridges. Ridged sloped farmland can effectively intercept runoff, reduce annual average soil erosion, retain water and soil, and stabilize slope soil.

Author Contributions

Conceptualization, S.W. and Y.F.; methodology, S.W. and Y.F.; software, S.W. and Y.F.; validation, S.W., B.L. and Y.F.; formal analysis, B.L. and Y.F.; investigation, B.L., Y.Z. and Y.F.; resources, B.L., Y.Z. and Y.F.; data curation, S.W. and Y.F.; writing—original draft preparation, S.W. and Y.F.; writing—review and editing, S.W. and Y.F.; visualization, S.W.; supervision, S.S., X.Z., B.L. and Y.F.; project administration, S.W., B.L. and Y.F. All authors have read and agreed to the published version of the manuscript.

Funding

This study was sponsored by the National Key Research and Development Program of China (2021YFD1500705) and the Natural Science Foundation of Heilongjiang Province (YQ2022D003).

Institutional Review Board Statement

Not applicable.

Informed Consent Statement

Informed consent was obtained from all subjects involved in the study.

Data Availability Statement

All other sources of data are cited throughout the paper.

Acknowledgments

We would like to thank the laboratory of soil and water conservation and desertification control of the Forestry College of Northeast Forestry University and the laboratory of Maoershan Experimental Forest Farm in Harbin, Heilongjiang Province, for their technical support.

Conflicts of Interest

The authors declare no conflicts of interest.

References

  1. Teshome, A.; Rolker, D.; de Graaff, J. Financial viability of soil and water conservation technologies in northwestern Ethiopian highlands. Appl. Geogr. 2013, 37, 139–149. [Google Scholar] [CrossRef]
  2. Taye, G.; Poesen, J.; Vanmaercke, M.; Van Wesemael, B.; Martens, L.; Teka, D.; Hallet, V. Evolution of the effectiveness of stone bunds and trenches in reducing runoff and soil loss in the semi-arid Ethiopian highlands. Z. Für Geomorphol. 2015, 59, 477–493. [Google Scholar] [CrossRef]
  3. Haile, M.; Herweg, K.; Stillhardt, B. Sustainable Land Management–A New Approach to Soil and Water Conservation in Ethiopia. Land Resources Management and Environmental Protection Department; Mekelle University: Mekelle, Ethiopia, 2006. [Google Scholar]
  4. Ogden, J.C. Everglades ridge and slough conceptual ecological model. Wetlands 2005, 25, 810–820. [Google Scholar] [CrossRef]
  5. Kabala, C.; Bojko, O.; Medynska, A.; Szczepaniak, A. Spatial variability and temporal changes in the heavy metal content of soils with a deep furrow-and-ridge microrelief formed by an afforestation plowing. Environ. Monit. Assess. 2013, 185, 5141–5150. [Google Scholar] [CrossRef] [PubMed]
  6. Sudhishri, S.; Dass, A.; Lenka, N.K. Efficacy of vegetative barriers for rehabilitation of degraded hill slopes in eastern India. Soil Tillage Res. 2008, 99, 98–107. [Google Scholar] [CrossRef]
  7. Song, C.; Qu, Y.; Zhang, X.; Chen, Q.; Du, S. Retrospect of contour bund for soil and water conservation. Soils Crops 2018, 7, 1–12. (In Chinese) [Google Scholar] [CrossRef]
  8. Wang, Z.; Li, H.; He, X. Study on soil anti-erosion and anti-scour of prickly ash at edges of terraces in drought upland of Weibei. Res. Soil Water Conserv. 2000, 7, 33–37. (In Chinese) [Google Scholar]
  9. Yuan, D.; Wang, Z.; Chen, X.; Guo, X.; Zhang, R. Properties of soil and water loss from slope field in red soil in different farming systems. J. Soil Water Conserv. 2001, 15, 66–69. (In Chinese) [Google Scholar] [CrossRef]
  10. Zhao, P.; Tang, X.; Tang, J.; Zhu, B. The nitrogen loss flushing mechanism in sloping farmlands of shallow Entisol in southwestern China: A study of the water source effect. Arab. J. Geosci. 2015, 8, 10325–10337. [Google Scholar] [CrossRef]
  11. Zhao, Q.; Li, D.; Zhuo, M.; Guo, T.; Liao, Y.; Xie, Z. Effects of rainfall intensity and slope gradient on erosion characteristics of the red soil slope. Stoch. Environ. Res. Risk Assess. 2015, 29, 609–621. [Google Scholar] [CrossRef]
  12. USDA. Soil Survey Manual; Soil Survey Division Staff; Soil Conservation Service; Volume Handbook 18; U.S. Department of Agriculture: Washington, DC, USA, 1951.
  13. Moreno-Maroto, J.M.; Alonso-Azcárate, J. Evaluation of the USDA soil texture triangle through Atterberg limits and an alternative classification system. Appl. Clay Sci. 2022, 229, 106689. [Google Scholar] [CrossRef]
  14. Dong, L.G. Methods for determination of several soil physical properties by in situ soil samples. Ningxia Agric. Sci. Technol. 2019, 60, 51–52. (In Chinese) [Google Scholar]
  15. Zhang, Y.Y. Determination of field water holding capacity and error analysis in the east Yudong plain area. Henan Water Conserv. South-North Water Divers. 2023, 52, 20–22. (In Chinese) [Google Scholar]
  16. Haiou, Z.; Zhen, G.; Chendi, S.; Juan, L. Distribution characteristics and stability of soil aggregates as compounded by soft rock and sand under different planting years of corn in Mu Us sandy land in China. Bangladesh J. Bot. 2021, 50, 917–923. [Google Scholar] [CrossRef]
  17. Dıaz-Zorita, M.; Perfect, E.; Grove, J.H. Disruptive methods for assessing soil structure. Soil Tillage Res. 2002, 64, 3–22. [Google Scholar] [CrossRef]
  18. Tagar, A.A.; Adamowski, J.; Memon, M.S.; Do, M.C.; Mashori, A.S.; Soomro, A.S.; Bhayo, W.A. Soil fragmentation and aggregate stability as affected by conventional tillage implements and relations with fractal dimensions. Soil Tillage Res. 2020, 197, 104494. [Google Scholar] [CrossRef]
  19. Liu, B.Y.; Zhang, K.L.; Xie, Y. An empirical soil loss equation. In Proceedings of the 12th International Soil Conservation Organization Conference, Beijing, China, 26–31 May 2002; pp. 26–31. [Google Scholar]
  20. Yu, B.; Rosewell, C.J. An assessment of a daily rainfall erosivity model for New South Wales. Soil Res. 1996, 34, 139–152. [Google Scholar] [CrossRef]
  21. Zhang, Y.B.; Xie, Y.; Liu, B.Y. A study on the method of calculating the erosive power of rainfall using daily rainfall. Geoscience 2002, 6, 705–711. [Google Scholar]
  22. Williams, J.R. Epic-erosion/productivity impact calculator: 1. model documentation. Tech. Bull. United States Dep. Agric. 1990, 4, 206–207. [Google Scholar] [CrossRef]
  23. Sharpley, A.N. EPIC—Erosion/Productivity Impact Calculator: 1. Model Documentation; Sharpley, A.N., Williams, J.R., Eds.; Technical Bulletin No. 1768; US Department of Agriculture: Washington, DC, USA, 1990.
  24. Liu, B.Y.; Nearing, M.A.; Risse, L.M. Slope gradient effects on soil loss for steep slopes. Trans. ASAE 1994, 37, 1835–1840. [Google Scholar] [CrossRef]
  25. McCool, D.K.; Foster, G.R.; Weesies, G.A. Slope length and steepness factors (LS). In Predicting Soil Erosion by Water: A Guide to Conservation Planning with the Revised Universal Soil Loss Equation (RUSLE); US Department of Agriculture: Washington, DC, USA, 1997; Volume 703. [Google Scholar]
  26. Fu, S.H.; Liu, B.Y.; Zhou, G.Y. A tool for calculating slope length and gradient factor. Soil Water Conserv. Sci. China 2015, 13, 105–110. [Google Scholar] [CrossRef]
  27. Soil and Water Conservation Monitoring Centre of Ministry of Water Resources. Technical Provisions on Dynamic Monitoring of Regional Soil and Water Erosion (Trial); Ministry of Water Resources of the People’s Republic of China: Beijing, China, 2018; pp. 11–15. (In Chinese)
  28. SL 190-2007; Soil Erosion Intensity Grading Standard. Ministry of Water Resources of the People’s Public of China, China Water and Power Press: Beijing, China, 2008.
  29. Li, H.; Chen, Y.; Liu, X.; Liu, Y.; Du, Y. Factors affecting the soil erosion and scouring resistance of bank hedgerows in purple soil sloping cropland. Acta Prataculturae Sin. 2023, 32, 40–52. (In Chinese) [Google Scholar] [CrossRef]
  30. Liu, X.; He, B.; Li, Z.; Zhang, J.; Wang, L.; Wang, Z. Influence of land terracing on agricultural and ecological environment in the loess plateau regions of China. Environ. Earth Sci. 2011, 62, 797–807. [Google Scholar] [CrossRef]
  31. Zhang, X.; Zhao, W.; Wang, L.; Liu, Y.; Liu, Y.; Feng, Q. Relationship between soil water content and soil particle size on typical slopes of the Loess Plateau during a drought year. Sci. Total Environ. 2019, 648, 943–954. [Google Scholar] [CrossRef] [PubMed]
  32. Gregory, P.J.; Wojciechowski, T. Root systems of major tropical root and tuber crops: Root architecture, size, and growth and initiation of storage organs. Adv. Agron. 2020, 161, 917–923. [Google Scholar] [CrossRef]
  33. Backnäs, S.; Laine-Kaulio, H.; Kløve, B. Phosphorus forms and related soil chemistry in preferential flowpaths and the soil matrix of a forested podzolic till soil profile. Geoderma 2012, 189, 50–64. [Google Scholar] [CrossRef]
  34. Niemeyer, R.J.; Fremier, A.K.; Heinse, R.; Chávez, W.; DeClerck, F.A. Woody vegetation increases saturated hydraulic conductivity in dry tropical Nicaragua. Vadose Zone J. 2014, 13, vzj2013-01. [Google Scholar] [CrossRef]
  35. Hendrickx, J.M.; Flury, M. Uniform and preferential flow mechanisms in the vadose zone. Concept. Models Flow Transp. Fract. Vadose Zone 2001, 149–187. [Google Scholar]
  36. Jarvis, N.J. A review of non-equilibrium water flow and solute transport in soil macropores: Principles, controlling factors and consequences for water quality. Eur. J. Soil Sci. 2020, 71, 279–302. [Google Scholar] [CrossRef]
  37. Wei, W.; Chen, D.; Wang, L.; Daryanto, S.; Chen, L.; Yu, Y.; Lu, Y.; Sun, G.; Feng, T. Global synthesis of the classifications, distributions, benefits, and issues of terracing. Earth-Sci. Rev. 2016, 159, 388–403. [Google Scholar] [CrossRef]
  38. Han, J.; Ge, W.; Hei, Z.; Cong, C.; Ma, C.; Xie, M.; Liu, B.; Feng, W.; Wang, F.; Jiao, J. Agricultural land use and management weaken the soil erosion induced by extreme rainstorms. Agric. Ecosyst. Environ. 2020, 301, 107047. [Google Scholar] [CrossRef]
  39. Fernandes, F. Study application of soil conservation techniques along highway openings. J. Teknol. Pangan Dan Ilmu Pertan. 2024, 2, 43–50. [Google Scholar] [CrossRef]
  40. Li, Y.; Wang, K.; Liu, Z.; Wang, J.; Zhou, X. Effect of measure of engineering preparation to soil water in Yunnan dry-hot river valley. J. Soil Water Conserv. 2006, 1, 15–19. [Google Scholar] [CrossRef]
  41. He, J.; Cai, Q.; Fang, H.; Chen, X. Effect evaluation of spatial allocation of water and soil conservation measures in Zhangjiakou area. Trans. Chin. Soc. Agric. Eng. 2009, 25, 69–75. [Google Scholar] [CrossRef]
  42. Courtwright, J.; Findlay, S.E. Effects of microtopography on hydrology, physicochemistry, and vegetation in a tidal swamp of the Hudson River. Wetlands 2011, 31, 239–249. [Google Scholar] [CrossRef]
  43. Appels, W.M.; Bogaart, P.W.; van der Zee, S.E. Influence of spatial variations of microtopography and infiltration on surface runoff and field scale hydrological connectivity. Adv. Water Resour. 2011, 34, 303–313. [Google Scholar] [CrossRef]
  44. Adgo, E.; Teshome, A.; Mati, B. Impacts of long-term soil and water conservation on agricultural productivity: The case of Anjenie watershed, Ethiopia. Agric. Water Manag. 2013, 117, 55–61. [Google Scholar] [CrossRef]
  45. Rockström, J.; Falkenmark, M. Agriculture: Increase water harvesting in Africa. Nature 2015, 519, 283–285. [Google Scholar] [CrossRef]
  46. Díaz, A.R.; Sanleandro, P.M.; Soriano, A.S.; Serrato, F.B.; Faulkner, H. The causes of piping in a set of abandoned agricultural terraces in southeast Spain. Catena 2007, 69, 282–293. [Google Scholar] [CrossRef]
  47. Thompson, S.E.; Katul, G.G.; Porporato, A. Role of microtopography in rainfall-runoff partitioning: An analysis using idealized geometry. Water Resour. Res. 2010, 46, 7. [Google Scholar] [CrossRef]
  48. Moges, A.; Holden, N.M. Soil fertility in relation to slope position and agricultural land use: A case study of Umbulo catchment in southern Ethiopia. Environ. Manag. 2008, 42, 753–763. [Google Scholar] [CrossRef] [PubMed]
  49. Munkholm, L.J. Soil friability: A review of the concept, assessment and effects of soil properties and management. Geoderma 2011, 167, 236–246. [Google Scholar] [CrossRef]
  50. Zhang, Y.; Wu, T. Effects of water temperature on soil aggregate stability between soils developed from different parent materials in the subtropical hilly area of China. Catena 2024, 241, 108080. [Google Scholar] [CrossRef]
  51. Zheng, H.; Nie, X.; Liu, Z.; Mo, M.; Song, Y. Identifying optimal ridge practices under different rainfall types on runoff and soil loss from sloping farmland in a humid subtropical region of Southern China. Agric. Water Manag. 2021, 255, 107043. [Google Scholar] [CrossRef]
  52. Vermang, J.; Norton, L.D.; Huang, C.; Cornelis, W.M.; Da Silva, A.M.; Gabriels, D. Characterization of soil surface roughness effects on runoff and soil erosion rates under simulated rainfall. Soil Sci. Soc. Am. J. 2015, 79, 903–916. [Google Scholar] [CrossRef]
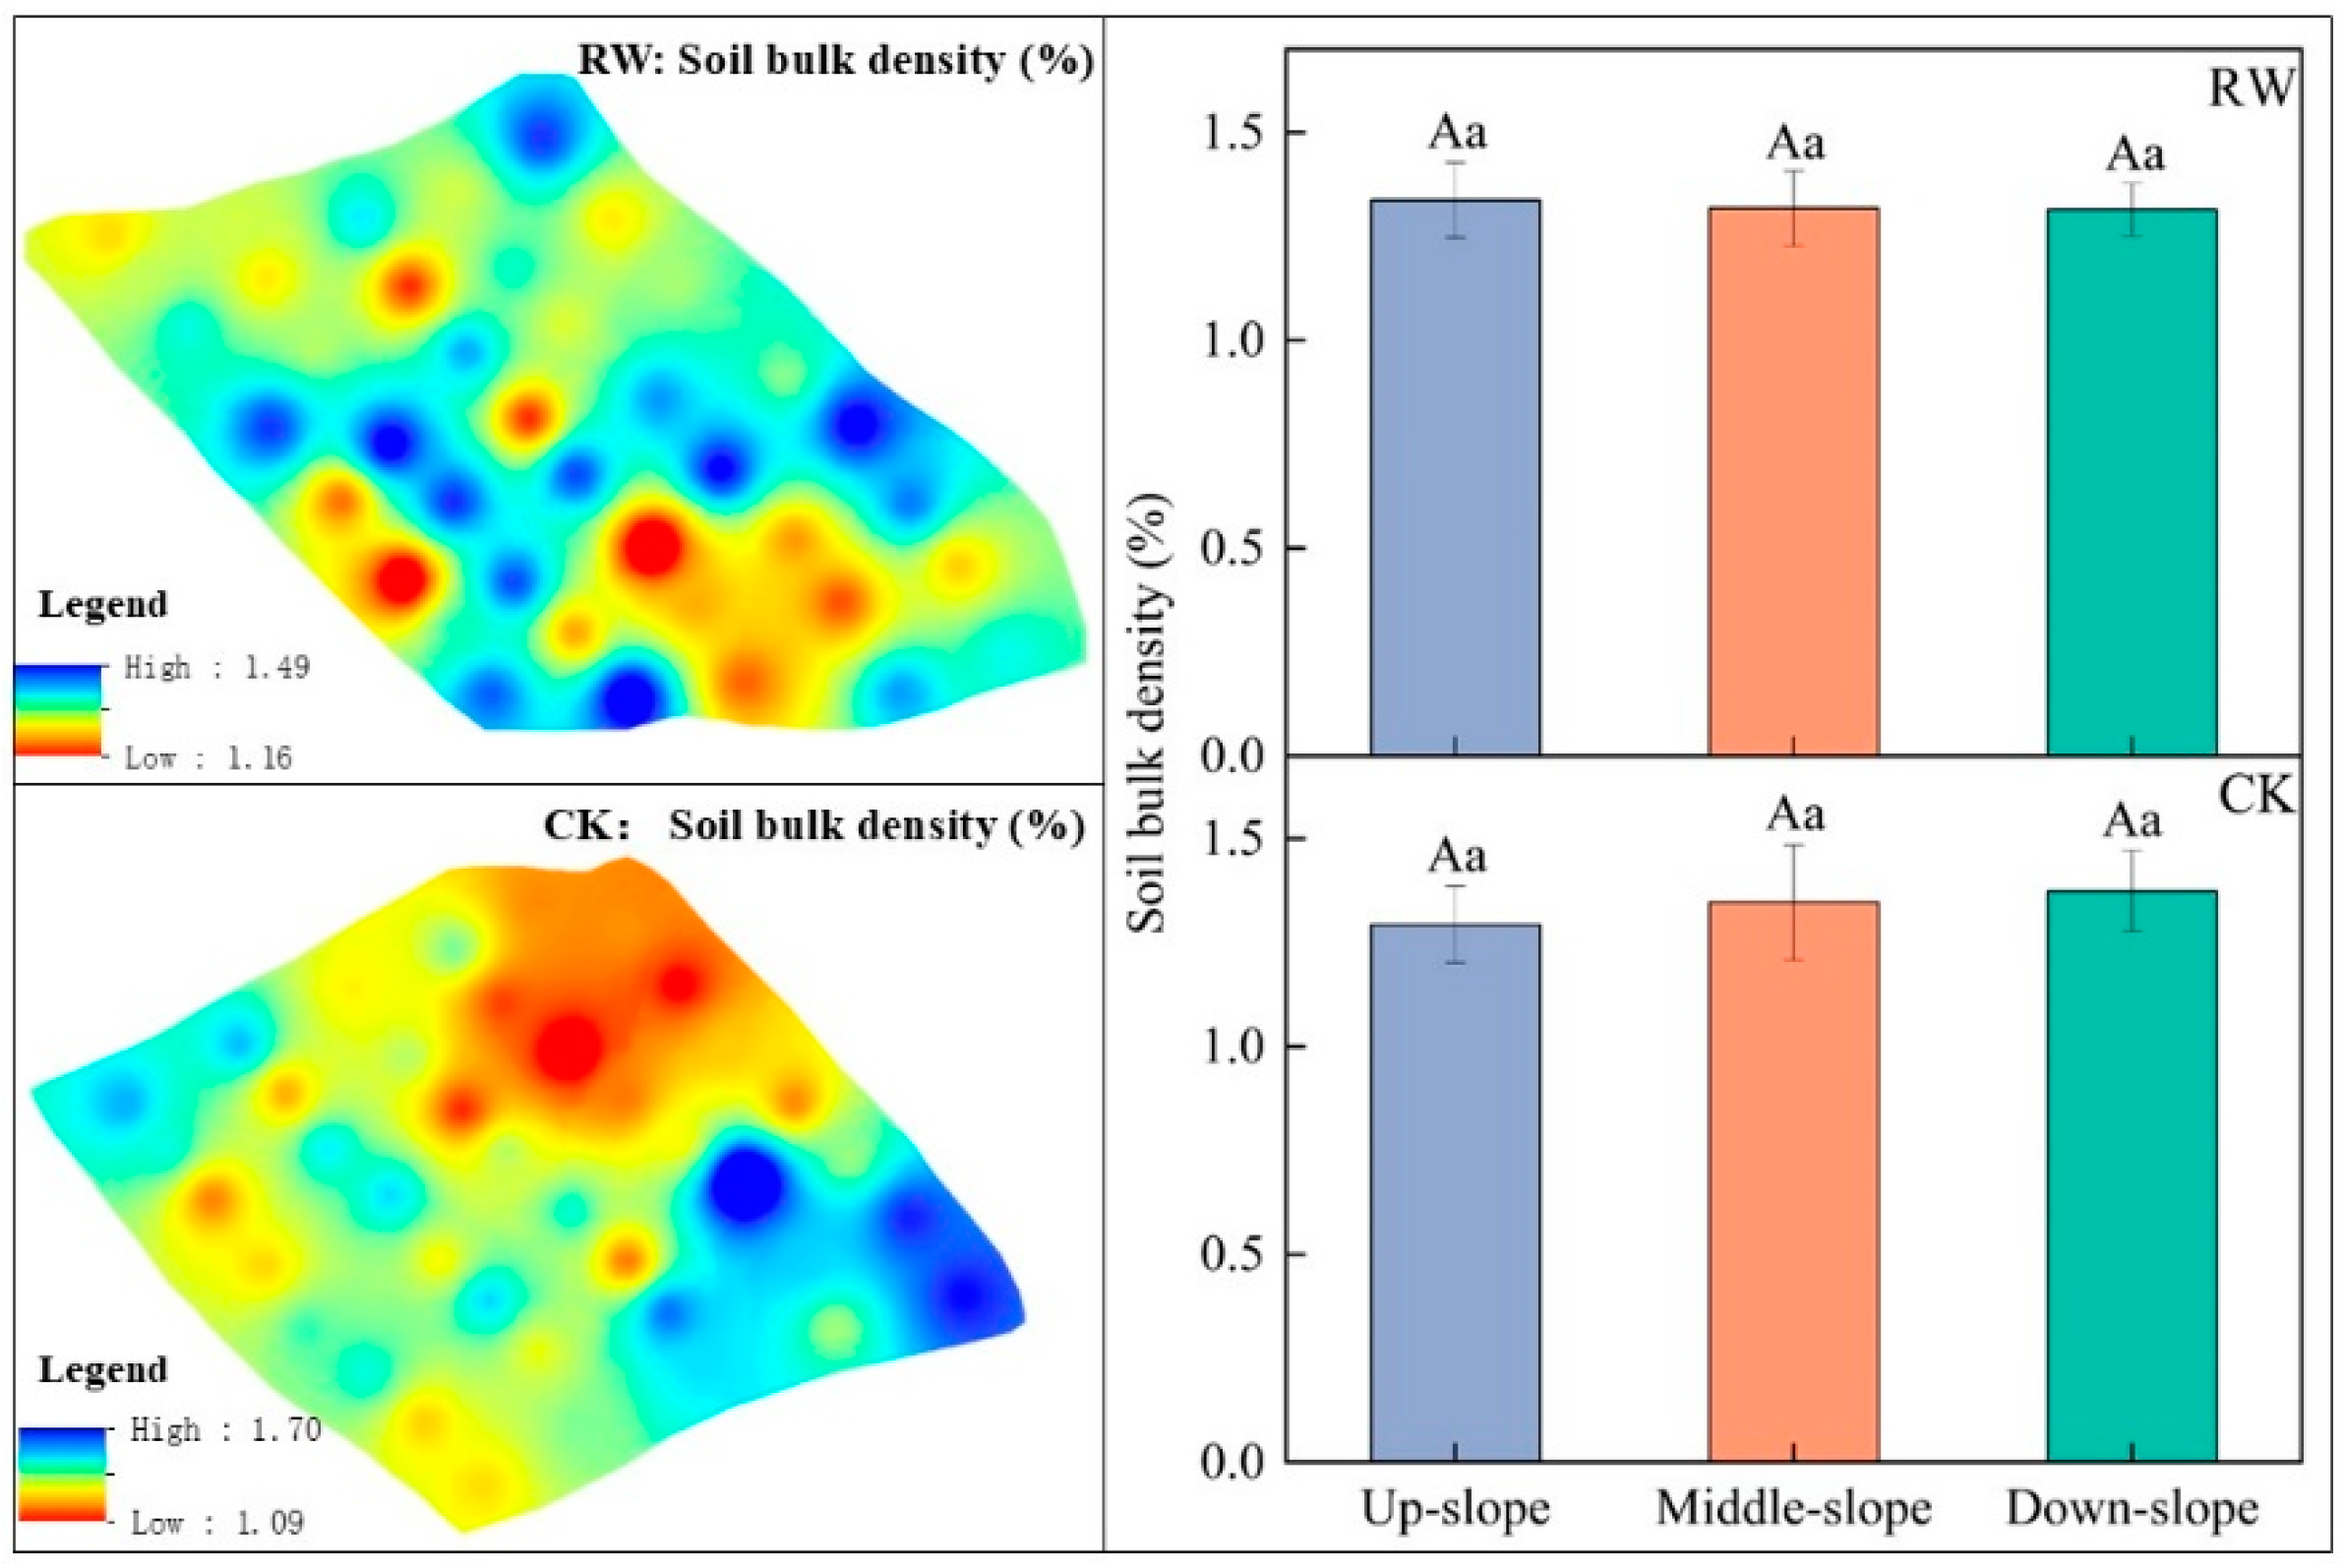
Figure 1. The spatial distribution characteristics of soil bulk density of RW and CK. Note: Different letters in the table indicate significant differences (p < 0.05). Uppercase letters denote differences in soil bulk density between different slope positions within the same plot, while lowercase letters denote differences in soil bulk density between different plots at the same slope position.
Water 16 02353 g001
Figure 2. The spatial distribution characteristics of total soil porosity of RW and CK. Note: Different letters in the table denote significant differences (p < 0.05). Uppercase letters indicate differences in total soil porosity across different slope positions within the same plot, while lowercase letters denote differences in total soil porosity between different plots at the same slope position.
Water 16 02353 g002
Figure 3. The spatial distribution characteristics of soil capillary porosity of RW and CK. Note: Different letters in the table denote significant differences (p < 0.05). Uppercase letters represent differences in soil capillary porosity between different slope positions within the same plot, while lowercase letters indicate differences between different plots at the same slope position.
Water 16 02353 g003
Figure 4. The spatial distribution characteristics of soil moisture content of RW and CK. Note: Different letters in the table indicate significant differences (p < 0.05). Uppercase letters denote differences in soil moisture content between different slope positions within the same plot, while lowercase letters denote differences in soil moisture content between different plots at the same slope position.
Water 16 02353 g004
Figure 5. The spatial distribution characteristics of soil saturation water-holding capacity of RW and CK. Note: Different letters in the table indicate significant differences (p < 0.05). Uppercase letters represent differences in soil saturation water-holding capacity between different slope positions within the same plot, while lowercase letters represent differences in soil saturation water-holding capacity between different plots at the same slope position.
Water 16 02353 g005
Figure 6. The spatial distribution characteristics of field water-holding capacity of RW and CK. Note: Different letters in the table indicate significant differences (p < 0.05). Uppercase letters denote differences in field water-holding capacity between different slope positions within the same plot, while lowercase letters denote differences in field water-holding capacity between different plots at the same slope position.
Water 16 02353 g006
Figure 7. The spatial distribution characteristics of soil capillary water-holding capacity of RW and CK. Note: Different letters in the table indicate significant differences (p < 0.05). Uppercase letters represent differences in soil capillary water-holding capacity between different slope positions within the same plot, while lowercase letters represent differences in soil capillary water-holding capacity between different plots at the same slope position.
Water 16 02353 g007
Figure 8. The spatial distribution characteristics of WR>0.25 of RW and CK. Note: Different letters in the table indicate significant differences (p < 0.05). Uppercase letters represent differences in WR>0.25 between different slope positions within the same plot, while lowercase letters represent differences in WR>0.25 between different plots at the same slope position.
Water 16 02353 g008
Figure 9. The spatial distribution characteristics of MWD of RW and CK. Note: Different letters in the table indicate significant differences (p < 0.05). Uppercase letters represent differences in MWD between different slope positions within the same plot, while lowercase letters represent differences in MWD between different plots at the same slope position.
Water 16 02353 g009
Figure 10. The spatial distribution characteristics of GMD of RW and CK. Note: Different letters in the table indicate significant differences (p < 0.05). Uppercase letters represent differences in GMD between different slope positions within the same plot, while lowercase letters represent differences in GMD between different plots at the same slope position.
Water 16 02353 g010
Figure 11. The spatial distribution characteristics of D of RW and CK. Note: Different letters in the table indicate significant differences (p < 0.05). Uppercase letters denote differences in D between different slope positions within the same plot, while lowercase letters denote differences in D between different plots at the same slope position.
Water 16 02353 g011
Figure 12. The spatial distribution characteristics of PAD of RW and CK. Note: Different letters in the table indicate significant differences (p < 0.05), uppercase letters indicate the difference in PAD of the same plot and different slope positions; lowercase letters indicate the difference in PAD of the same slope position and different plots.
Water 16 02353 g012
Figure 13. The spatial distribution characteristics of A of RW and CK. Note: Different letters in the table indicate significant differences (p < 0.05). Uppercase letters denote differences in variable A across different slope positions within the same plot, while lowercase letters denote differences in variable A across different plots at the same slope position.
Water 16 02353 g013
Figure 14. The combined score evaluation of soil moisture characteristics and soil structure characteristics of RW and CK at different slope positions.
Water 16 02353 g014
Figure 15. The combined score evaluation of soil water-holding capacity and soil structure for RW and CK.
Water 16 02353 g015
Table 1. Basic characteristics of the slope.
Slope TypeSoil TextureSlope (°)Slope Length (m)Area (m2)CropsRidge TypeRidge Height (m)Number of StripsDistance between Ridges
RWClay loam5~8°1209563.5CornsWoven bags0.5–0.8 m423–30 m
CK5~8°1209071.6CornsNoneNoneNoneNone
Table 2. Factors of soil erosion modulus.
SitesPositionR(MJ·mm/(ha·h·a))K(t·ha·h/(ha·MJ·mm))LSBETA (t/ha)
RWUp-slope366.970.38–0.420.09–0.300.73–6.110.230.350.330.51–3.35
Middle-slope0.34–0.420.02–0.173.02–10.200.86–3.35
Down-slope0.34–0.410.07–0.192.18–8.621.49–3.53
CKUp-slope366.970.35–0.400.01–0.173.27–10.830.230.620.330.56–5.88
Middle-slope0.35–0.410.01–0.173.27–10.830.56–7.26
Down-slope0.35–0.400.00–0.388.91–10.750.01–26.10
Note: where A is the annual average soil loss (t/ha); R is the factor of rainfall erosivity (MJ·mm/(ha·h·a). K is the factor of soil erodibility (t·ha·h/(ha·MJ·mm)). L is the factor of slope length; S is the factor of slope steepness; B is the factor of biomass control in water and soil conservation; E is the factor of engineering control in water and soil conservation; T is the factor of tillage practices in water and soil conservation. Soil erosion rate is divided into soil erosion classes: <200 (slight), 200–1000 (low), 1000–2500 (moderate), 2500–4000 (high), 4000–6000 (extremely high), and >6000 (severe).
Disclaimer/Publisher’s Note: The statements, opinions and data contained in all publications are solely those of the individual author(s) and contributor(s) and not of MDPI and/or the editor(s). MDPI and/or the editor(s) disclaim responsibility for any injury to people or property resulting from any ideas, methods, instructions or products referred to in the content.