Article

Impact of an Integral Management System with Constructed Wetlands in Pig Slurry Traceability and GHG/NH3 Emissions

by
Melisa Gómez-Garrido
*,
Martire Angélica Terrero Turbí
,
Oumaima El bied
and
Ángel Faz Cano
Sustainable Use, Management and Reclamation of Soil and Water Research Group, Agronomic Engineering Department, Technical University of Cartagena, Paseo Alfonso XIII, 48, 30203 Cartagena, Spain
*
Author to whom correspondence should be addressed.
Water 2024, 16(16), 2351; https://doi.org/10.3390/w16162351
Submission received: 19 July 2024 / Revised: 19 August 2024 / Accepted: 19 August 2024 / Published: 21 August 2024

Abstract

:
The sustainable management of pig slurry (PS) in intensive farms is essential to reduce adverse environmental impacts and reduce the ecological footprint. If not managed properly, PS can release GHG/NH3 gases into the atmosphere and contaminate waters. This study evaluates the impact of an integral management system with physical and biological stages to mitigate the impact of PS. The system resulted in effective PS traceability, studying its physicochemical properties. The synergism in the whole system allowed a decrease in the most analyzed parameters during the autumn, spring, and summer. The pretreatment contributed significantly to obtaining an appreciable percentage of reduction in the constructed wetlands of SS (99–100%), COD (56–87%), TN (50–57%), and PO43− (88–100%). The emission values (g/m2/day) were 0–2.14 (CH4), 0–473.76 (CO2), 0–179.77 (H2O), 0–0.265 (N2O), and 0–0.195 (NH3), highlighting the raw, separated and manure fractions with the highest values. It is concluded that the system proves to be a practical, low-cost, and efficient technique for the treatment of PS. It significantly reduces the concentration of nutrients, and the intercepted byproducts can be valuable for application to the soil. In addition, the system effectively reduces GHG/NH3 emissions in decanted, purified, and wetland PS fractions.

1. Introduction

The need to preserve natural resources and protect the environment, in addition to preventing potential negative effects that could result from pig farming, makes it essential to align the wealth of resources from this important livestock activity with the regulatory requirements of this sector at the worldwide level.
The development of modeling techniques for the sustainable and cost-effective treatment of agricultural wastewater is a widespread problem, especially across the European Union, where solutions and processes that contribute to nutrient recycling within a circular economy are increasingly required [1]. These solutions aim to prevent the contamination of groundwater and surface water, in addition to protecting the environment from greenhouse gases (GHG) and other pollutants that can result from livestock manure management.
Around Europe, pig slurry management is a significant challenge for farmers. Often, the environmental harm caused by pig farm effluents results from the high density of animals in confined areas and poor waste management practices. The EU aims to address this issue through the “Nitrate Directive” (91/676/EEC), which seeks to minimize environmental problems triggered by water pollution generated by nitrates from agricultural sources. This Directive requires EU Member States to identify vulnerable zones where action plans must be implemented to reduce nitrate leaching into the mass surface and/or subsurface water [2,3].
The properties of pig slurry can vary greatly from farm to farm, even though nitrogen is the component of main concern due to the environmental risk that its transformation and management may entail. In particular, untreated pig slurry contains considerable amounts of non-stabilized organic matter and high concentrations of ammonium, it depends on the farm characteristics. Separation of slurry generates a solid fraction with a high concentration of dry matter (DM) and phosphorus (P), and a liquid fraction with low DM content and a relatively high concentration of total ammoniacal nitrogen [4].
Pig slurry management has several options to be applied from more simple/economical to more sophisticated/expensive methods such as phase separation, drying, use of additives biological or chemical, nitrification-denitrification, composting, incineration of solid fractions, membrane filtration, and others [3,4,5]. Although, the combination of different technologies could result in suitable and effective legislation suggested for pig slurry treatment, resulting in a reduction in contaminants concentrations as well as emissions. Therefore, considering these guidelines, this study was focused on using an integrated system composed of phase separation, decanters, and constructed wetlands.
The separation process is well known and widely used firstly to obtain two fractions of slurries and as a pretreatment for other techniques. The different pathways to separate the solid and liquid fractions from slurry can be physical, mechanical, or chemical methods. Physical separation could reach over than 80% of the total solids [6,7]. In this study, physical and mechanical separation was used throughout a sieve separator plus screw followed by a decantation unit.
On the other hand, constructed wetlands (CW) are considered tertiary [7,8,9], capable of removing a wide range of contaminants, including pathogenic microorganisms [3,10,11].
Treatment with CW became a very attractive option for farmers because this system has been demonstrated to be effective, low-cost, low-maintenance, and environmentally friendly, further beneficial to pig slurry treatment by being a viable, sustainable, and cost-effective alternative to other traditional treatments (for instance, anaerobic digestion or bio-membranes) [2,9,12]. Constructed wetlands can be used for several treatments like agricultural wastewater [7,13,14], industrial dairy wastewater, industrial tannery, acid mine drainage wastewater [15,16] pulp and paper industry wastewater [17,18], industrial textile wastewater, etc. According to Vymazal [16,17] there are three basic concepts that constructed wetlands could be categorized, (1) hydrology (open water-surface flow and sub-surface flow), (2) type of macrophytic growth (emergent, submerged, free-floating, and floating-leaved) and (3) flow path in sub-surface wetlands (horizontal and vertical). It is possible to combine the different types of CW depending on the purpose of the design and the specific objective to achieve [9,16,19].
In accordance with the previous comment about the CW flow path, surface flow constructed wetlands closely resemble natural environments and are typically more suitable for wetland species due to the presence of permanent standing water; in contrast, subsurface flow wetlands direct water laterally through a porous medium, such as sand and gravel, supporting fewer macrophyte species and generally lacking standing water. Subsurface flow is categorized into vertical flow (VF) CW, horizontal flow (HF) CW, french vertical flow (FVF) CW, and hybrid type CW [20,21].
There is literature with practical evidence of physical and biological techniques for treating slurry, such as solid-liquid separation and phytoremediation with CW. However, there are hardly any publications with comprehensive results of slurry treatment systems that combine both techniques and also carry out analytical monitoring of slurry properties and GHG and NH3 emissions at all stages of processing and recycling. In this study, a Horizontal Flow Subsurface Constructed Wetland (was used for the integrated treatment of pig slurry. This type usually has predominant anoxic/anaerobic mechanisms and thus provides suitable conditions for the denitrification process if nitrate is present [20]. Conversely, it very much limited the nitrification process because of the lack of oxygen in the water-saturated filtration bed, and for this reason, ammonia reduction tends to be low.
Consequently, it is essential to address sustainable solutions for pig manure treatment with respect to nutrient removal like biodegradable organic matter, suspended solids, phosphorus, and nitrogen with special attention towards environmental and agricultural benefits, always in line with environmental legislation and European regulations.
The monitored parameters of pig slurry during the study were T, pH, CE, SS, COD, TN, NH4+, NO3, PO43−, K+, Cu, and Zn, as well as the measured gases were CH4, CO2, N2O, and NH3. The objective of this study was to evaluate the effects of three stages of treatment in an integrated management system on pig slurry, how it influences its composition, enhancing its properties, and which mechanisms are involved in mitigating the emissions of CH4, CO2, N2O, and NH3. Stages:
Stage 1: Physical stage of solid–liquid phase separation with phase separator with sieving and press filter.
Stage 2: Physical stage of solid–liquid phase separation with gravity decantation.
Stage 3: Biological stage of purification in artificial wetlands or biofilters.

2. Materials and Methods

2.1. Operation

In 2018, an integral slurry treatment system was implemented in the southeast of Spain in a maternity farm with a census of 2750 places for breeding sows and 232 replacement places. This farm generated a total of 14,605 m3/year of liquid and semi-liquid manure (Spanish Royal Decree 306/2020). Initially, 50% of the slurry production was processed, but currently, 100% of the slurry production is processed, being agronomic recycling is the final destination of all the slurry fractions generated (manure and pig slurry). A summary of the operation parameters is shown in Table 1 and Figure 1. The integral system consisted of different slurry treatment stages:

2.2. Pig Slurry Parameters and Methodology

The pig slurry samples were taken in triplicates when the measurements of gas emissions were carried out. The selected parameters for the characterization of the pig slurry were pH, electrical conductivity (EC), settleable solids (SS), chemical oxygen demand (COD), total nitrogen (TN), ammoniacal nitrogen (NH4+-N), nitrogen as nitrates (NO3-N), phosphate ion (PO43−) and potassium ion (K+), Copper (Cu) and Zinc (Zn).
The standardized methodology used to analyze the pig slurry was the following: the pH and EC were measured in situ using a HANNA multiparameter equipment (ref. HI98194). Settleable solids (SS) were measured in situ by natural sedimentation in an Inhoff vessel, after 60 min [22]. The COD was determined via photometric analysis of the chromium (III)concentration after 2 h of oxidation with potassium dichromate/sulfuric acid and silver sulfate at 148 C (Macherey–Nagel GmbH & Co., KG, Nanocolor Test; ref. 985 028/29, Weilheim, Germany) according to American standard methods, APHA, [22].
Total nitrogen was calculated from the sum of Kjeldahl N, N-NO3 and N-NO2; the Kjeldahl N content was measured using a modified Kjeldahl method [23], 1 mL of pig slurry was used for digestion and the form NH4+-N was determined via steam distillation, followed by titration with HCl 0.1 N. Kjeldahl N comprised Org.-N and NH4+-N. NH4+-N was determined with the previous methodology but did not include digestion. N-NO3, N-NO2, PO43−, and K+ were determined by ionic chromatography technique (Methrom, 861 Advanced Compact IC) after sample preparation. Copper (Cu) and zinc (Zn) were determined by inductively coupled plasma mass spectrometry (ICP-MS).

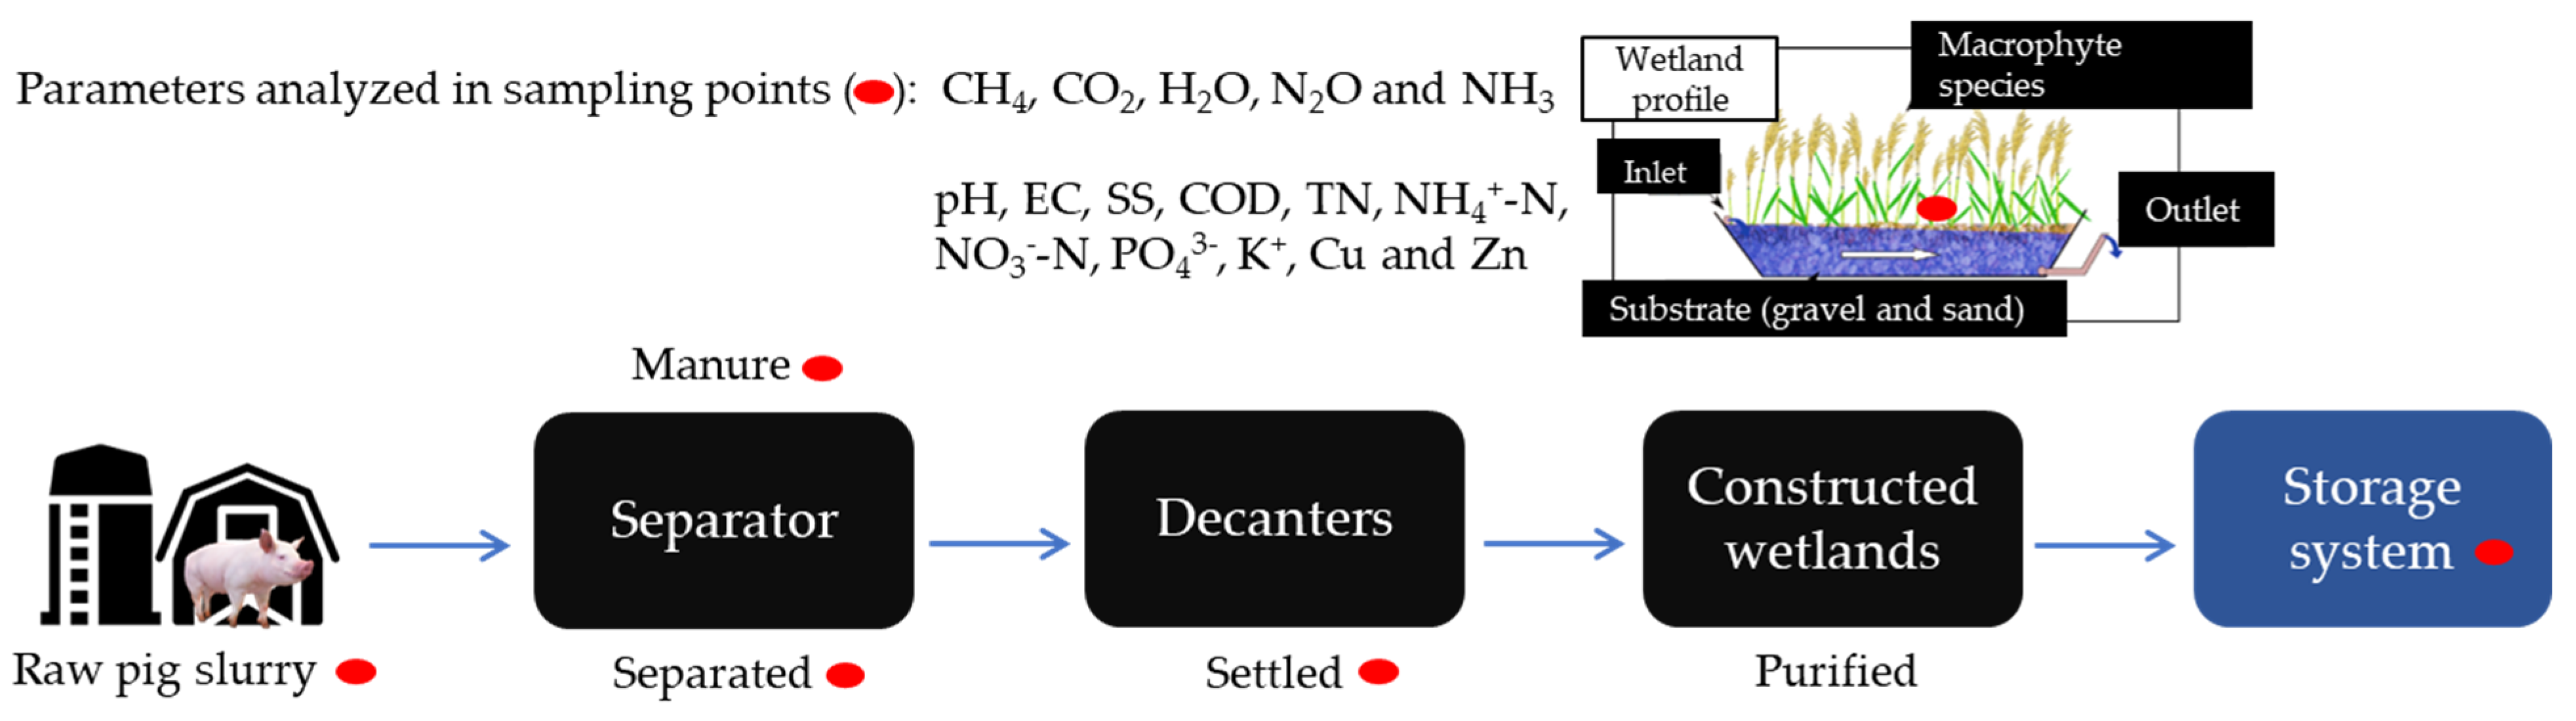
2.3. Experimental Design and Methodology for Measuring Emissions in Pig Slurry Storage Systems

Floating dynamic chambers are one of the most used systems to capture and measure GHG and contaminant gases (CH4, CO2, N2O, and NH3) in ponds or slurry storage systems. The principle of this technique is to isolate a part of the surface where the slurry is stored and measure the change in concentration of the gases in the chamber over time. The results are expressed per unit area of slurry and per unit volume. This method uses PVC plastic chambers with certain dimensions to isolate part of the surface from which emissions are to be determined. For its correct operation, an air pump of known flow brings air to the dynamic chamber (gas inlet), while another second pump of also known flow is placed at the other end (gas outlet). To measure GHG and NH3 emissions (F = flow measured with dynamic chambers), the analyzer determines the emission concentration of the gases at the inlet (Ce) and at the outlet (Cs) in mg/m3 and multiplies by the airflow (Qa) of the dynamic chamber (m3 air/h) using the following relationship for each of the gases: F = (Cs − Ce) × Qa.
The analyzer used to measure gas concentrations (CH4, CO2, H2O, N2O, and NH3) at both the inlet and outlet quantifies the concentrations in parts per million (ppm) by infrared spectrometry. The gas analyzer equipment allows continuous measurement of gases. The gases are introduced into the analyzer through a tube, the internal pump extracts the gas sample through the instrument displaying the measurements on the device. The analyzer measures and analyzes an infrared spectrum of gas samples using a photoacoustic sensor based on an optical microphone. To carry out this methodology, the principle described in the protocol “Vera of Environmental Technologies for Agricultural Production Test Protocol for Covers and other Mitigation Technologies for Reduction of Gaseous Emissions from Stored Manure” and the design according to “Reference procedures” have been considered for the measurement of gaseous emissions from livestock houses and storages of animal manure.” It is an international protocol used as a reference and recommended by the Ministry of Agriculture, Fisheries and Food of Spain. GHG and NH3 emissions in manure piles have been quantified using the same measurement equipment. However, a static gas chamber similar to that used to measure soil emissions has been used, being a cylindrical steel chamber that is inserted 5 cm into the soil or contact surface. For this study, measurements of GHG and NH3 emissions have been carried out for five consecutive weeks in autumn 2020, spring 2021, and summer 2021 seasons in five storage systems that correspond to the following systems of slurry fractions:
  • Raw slurry (RAW, measurements made in the storage tank that receives raw pig slurry).
  • Slurry after the phase separator (SEP, measurements made in the first settling pond).
  • Settled slurry (DEC, measurements made between the fifth and sixth settling pond).
  • Purified slurry (PUR, measurements made in the purified slurry storage pond subjected to drying conditions).
  • Manure (MAN, measurements made on a pile of fresh manure resulting from the phase separator).
  • Wetland surface without vegetation (WC).
  • Wetland surface planted with Phragmites australis (WV).
Emissions of the WC and WV fractions were only recorded in the spring 2021 season due to the availability of the measurement chambers. The emissions were taken after 3–4 h of filling the wetlands.

3. Results

3.1. Pig Slurry and Manure

The results presented in Table 2, Table 3 and Table 4 represent the average of the 3 replicates for each sampling at each stage of the integrated treatment system (RAW-SEP-DEC-PUR) and in each season of the study (autumn, spring, and summer). The same procedure was followed for manure. The physical-chemical and biological characterization from the analytical results were reported showing the traceability of the pig slurry quality throughout the integrated management system.
As can be observed there is a clear tendency to decrease the values for most parameters when pig slurry passed through each phase of the treatment for purification in all periods of the research, in autumn, spring, and summer.
Non-significant differences (p < 0.05) among phases of treatments were found for pH and EC, for the three periods of study, except the EC where differences were found between RAW and PUR during summer. Conversely, parameters like SS, COD, and TN were significantly different (p < 0.05) when comparing RAW to PUR in all seasons.
In general terms, the parameters Cu and Zn varied barely according to the tendency from season to season throughout the phases of the integrated management system.
Regarding to dose of application, it was calculated respecting the ceiling of 170 kg N ha−1 year−1 according European Normative prescribed in Annex III of the Nitrates Directive (91/676/EEC). Table 2, Table 3 and Table 4 exhibit that it is possible to achieve a greater volume of PUR for application purposes on land when pig slurry is treated with an integrated treatment system, therefore the following pattern was detected PUR > DEC > SEP > RAW.
In addition, the dose of macronutrients (N-P-K) that can be applied per hectare during a year is calculated. Obviously, nitrogen will be 170 kg N ha−1 year−1 according to the European Normative prescribed in Annex III of the Nitrates Directive (91/676/EEC), but P2O5 follows the pattern SEP > RAW > DEC > PUR in autumn and summer and in spring RAW > SEP > DEC > PUR; meanwhile, the behavior of K2O was PUR > DEC > SEP > RAW in autumn, DEC > PUR > RAW > SEP during the summer and PUR > DEC > RAW > SEP during spring.
Regarding manure properties, Table 5 presents the obtained results for the solid phase of pig slurry after separation (MAN) concerning media values and standard deviation (DS). As can be seen, in DM significant differences (p < 0.05) between seasons were detected. The parameters pH and EC showed the same behavior with no significant differences (p < 0.05) between autumn and spring, but there were differences in summer with respect to the previous seasons. According to TN, in autumn was observed the greatest mean values were significantly different (p < 0.05) when compared to spring and summer, and on the other hand, ammoniacal nitrogen as well as nitrates presented significant differences (p < 0.05) between seasons. Total organic carbon presented the highest mean values during summer, conversely phosphates and potassium exhibited the lowest in this season with significant differences (p < 0.05) with respect to previous seasons.

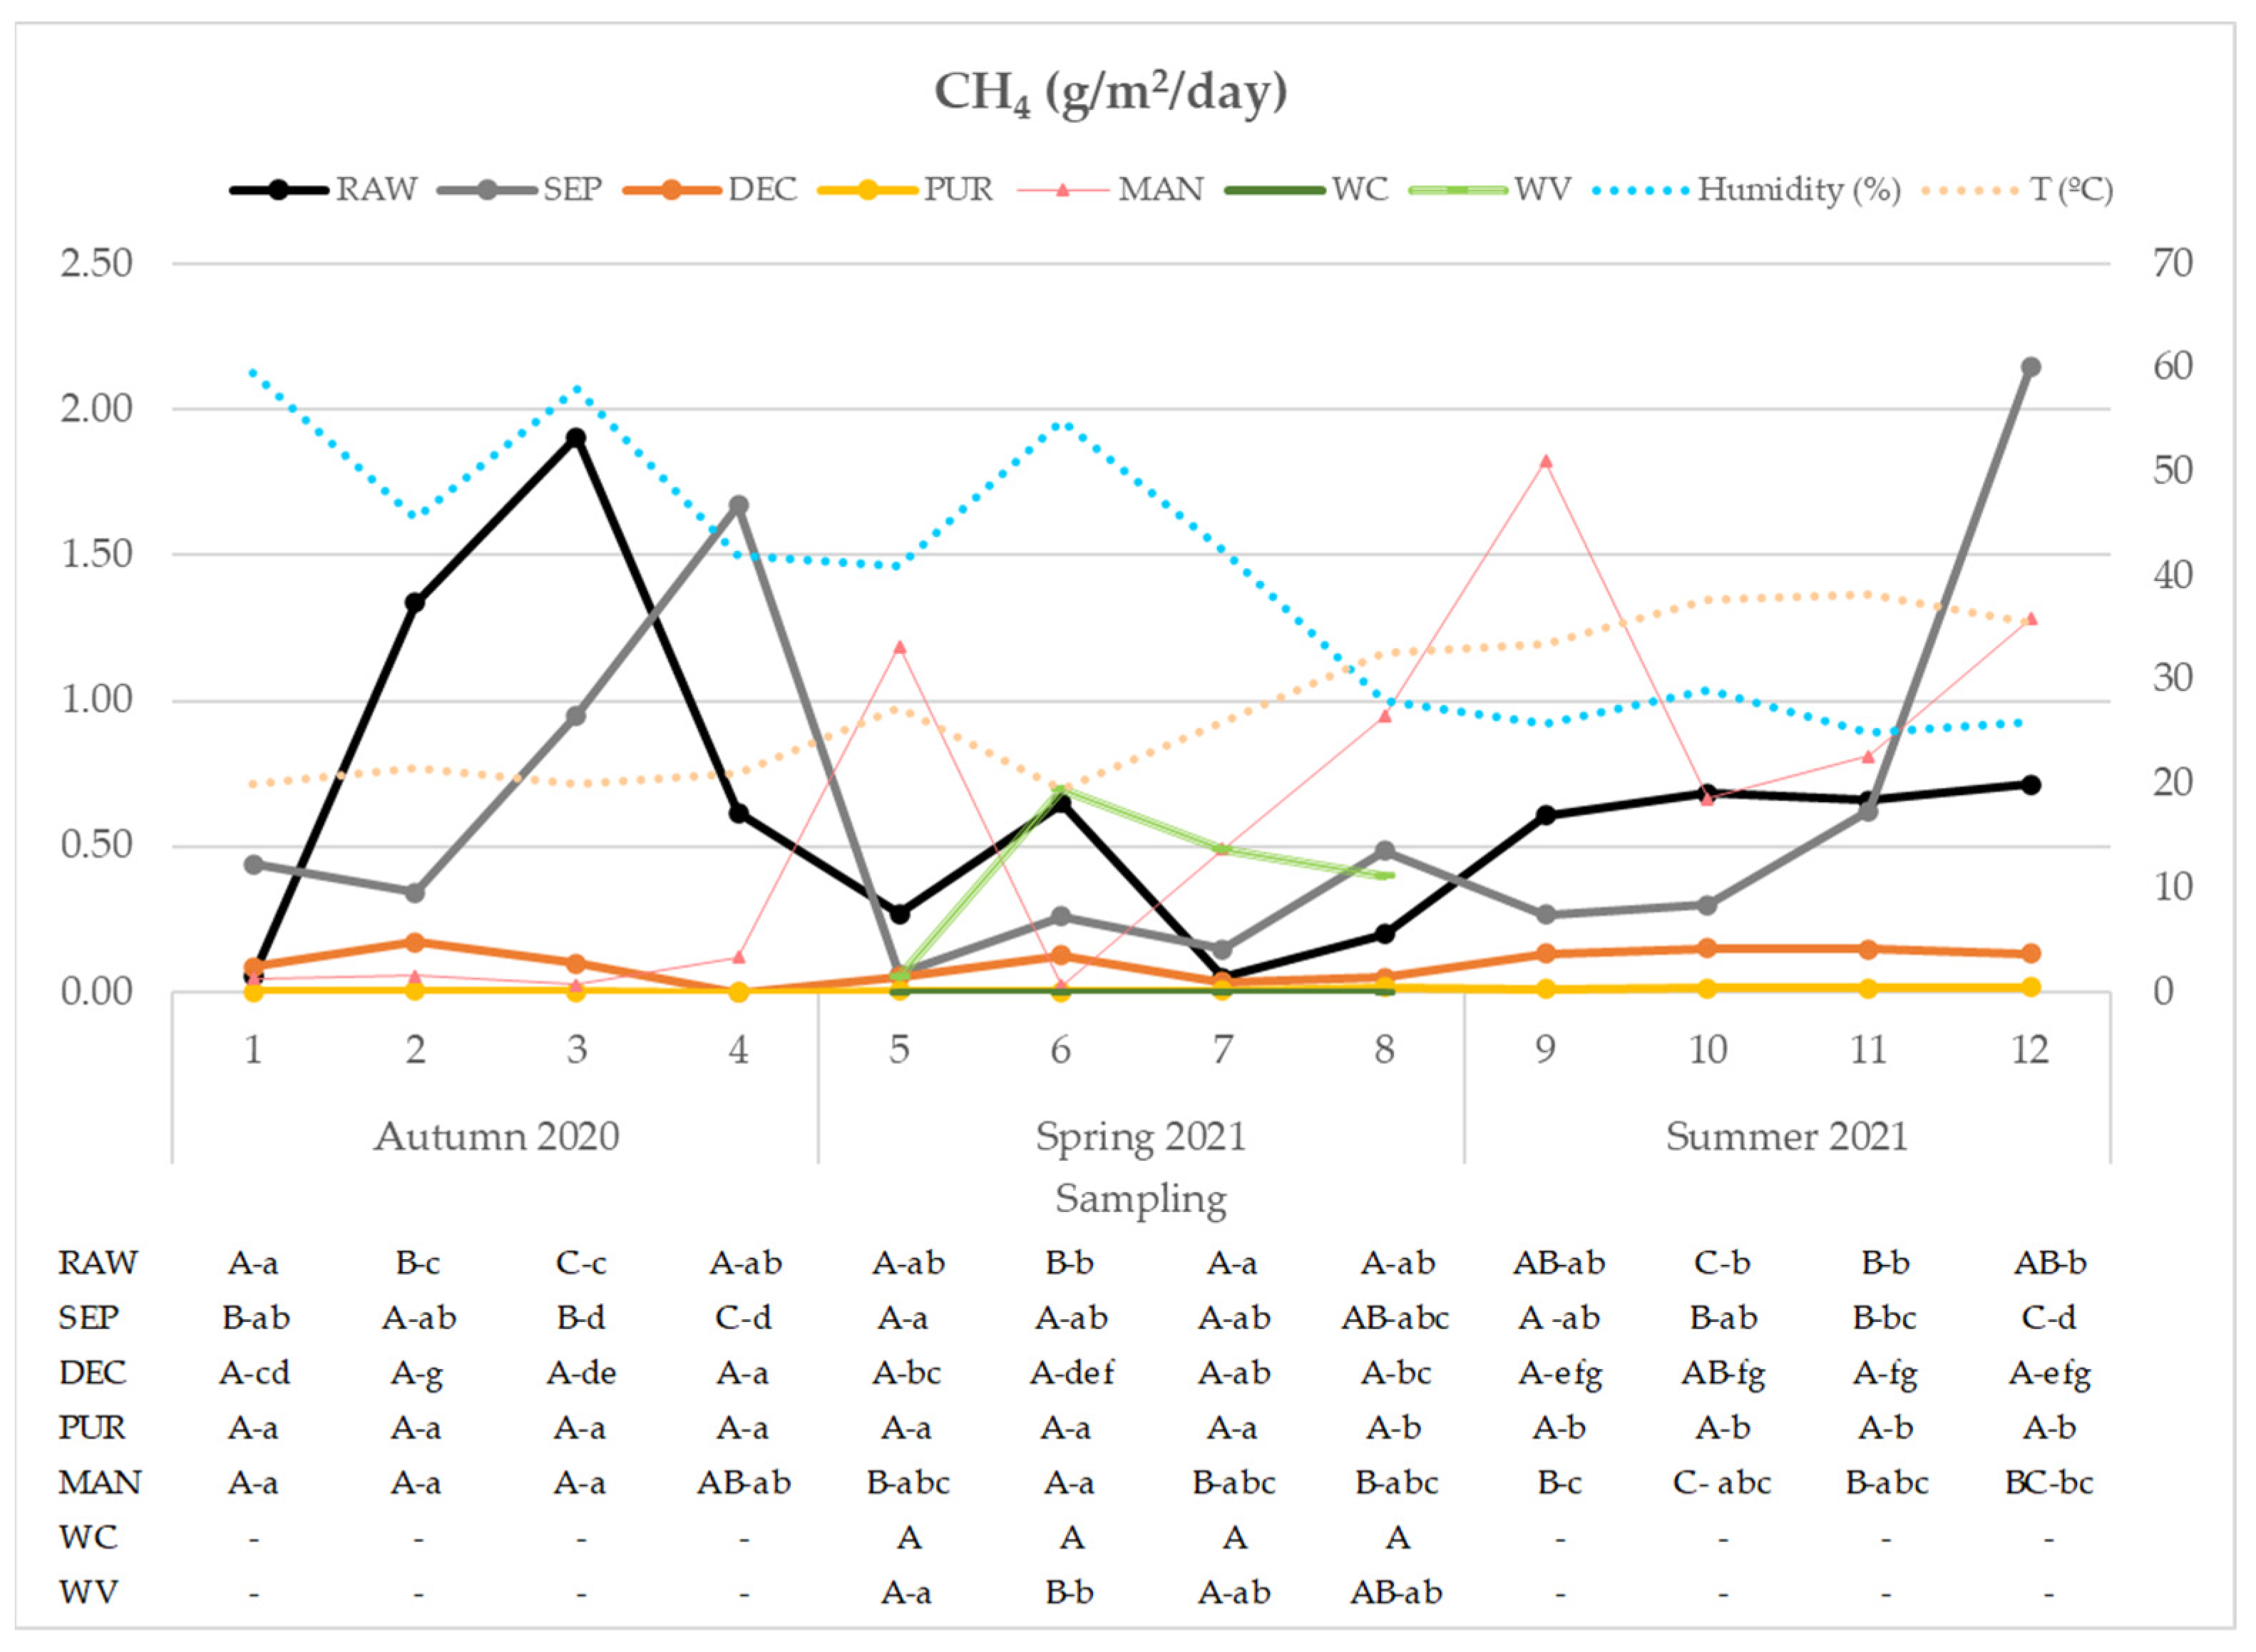
3.2. Gas Emissions during Storage

Figure 2, Figure 3, Figure 4, Figure 5 and Figure 6 show the results of atmospheric humidity, atmospheric T, and emissions of CH4, CO2, H2O, N2O, and NH3 during autumn 2020, spring 2021, and summer 2021. Atmospheric humidity values ranged between 25.0% (S11, summer) and 55.0% (S6, spring). The general trend is decreasing from autumn to summer, presenting values within a narrower range in summer. At the atmospheric level, T values varied from 19.5 °C (S6, spring) to 38.3 °C (S11, summer).
Figure 2 shows the results of CH4 emissions for all the slurry fractions. Values are between 0 g/m2/day (DEC (S4), PUR (S4), and WC (S5; S6; S7; S8)) and 2.14 g/m2/day (SEP (S12)). Over time, no well-defined trend is observed in the results. It can be seen that CH4 emissions present statistically higher values at the beginning of the autumn season and then decrease, later in spring display an increase (not as notable as in autumn) and then decrease (RAW, SEP, and DEC). In summer, CH4 emissions show an increasing trend for RAW, SEP, and MAN and a slightly increasing trend for DEC and PUR. Between treatments, significantly higher emissions are recorded for the RAW (0.05–1.91 g/m2/day), SEP (0.06–2.14 g/m2/day) and MAN (0.02–1.82 g/m2/day) treatments compared to DEC (0–0.17 g/m2/day), PUR (0–0.02 g/m2/day), WC (0 g/m2/day) and WV (0.05–0.70 g/m2/day). This fact reveals, on the one hand, a notable reduction in CH4 emissions in the slurry fractions generated in the decantation and phytopurification stages, and on the other hand, a peak in CH4 emissions from WV due to the recent filling, taking into account that the measurement of emissions was carried out 3–4 h after completing the filling of the wetland.
With respect to CO2 emissions (Figure 3) the range of values recorded ranges between 0 g/m2/day (DEC (S4) and 453.76 g/m2/day (MAN (S10). The concentration ranges recorded for the fractions are: RAW (0.15–7.53 g/m2/day), SEP (0.26–4.30 g/m2/day), DEC (0–1.08 g/m2/day), PUR (0.01–0.21 g/m2/day). day), MAN (0.50–453.76 g/m2/day), WC (0.12–1.22 g/m2/day) and WV (0.49–1.63 g/m2/day). MAN emissions are statistically the most outstanding, except for S4, which decreases drastically to a value of 0.50 g/m2/day, and RAW (3.87 g/m2/day) and SEP (4.30 g/m2/day) stand out. The emissions of the RAW and SEP fractions present in a certain way a similar trend line because they present a similar analytical characterization. The results recorded for all fractions display a fluctuating trend with peaks and decreases, as occurred with CH4 emissions. In this sense, the correlation analysis has shown a statistically significant correlation between CH4 and CO2 emissions (R = 0.626**).
The recorded emissions of H2O in slurry fractions range between 0 g/m2/day (DEC (S4) and 179.77 g/m2/day (MAN (S11)). For each fraction, the following ranges are detected: RAW (0.71–9.39 g/m2/day), SEP (0.47–21.60 g/m2/day), DEC (0–24.45 g/m2/day), PUR (0.49–23.38 g/m2/day), MAN (6.61–179.77 g/m2/day), WC (0.03–0.14 g/m2/day) and WV (0.01–0.12 g/m2/day), being in the summer season the highest values for all fractions. Statistically, the results of MAN stand out with respect to the rest of the fractions, possibly because it is not a liquid fraction and the water present in the manure tends to evaporate into the atmosphere. The WC and WV fractions present lower H2O emissions than the rest of the fractions. Although WC and WV do not stand out statistically, these values could be influenced by the fact that the slurry is not in aerobic conditions, with a layer of wetland fill substrate existing between the emissions-emitting surface and the emissions measurement chamber. Correlations are recorded with values of R = 0.32** (H2O emission/T) and R = 0.68** (H2O emission/NH3 emission). Although the H2O emission/T correlation presents a low regression coefficient (R = 0.32**), this proportionality can be notably seen in the trend recorded in the summer season, as the T increases (33.5–38.3 °C) H2O emissions increase.
For N2O gas, the global warming potential factor for a given time of 100 years is 298, being 1 for CO2 and 25 for CH4. N2O emissions are the lowest of all recorded emissions, ranging between 0 g/m2/day (RAW (S1; S5; S12), SEP (S1; S2; S6; S7; S9; S10) DEC (S1, S4, S6; S7, S9; S11; S12), PUR (S3; S4, S9; S10; S11) and 0.265 g/m2/day (MAN (S3)). The highest value recorded for each fraction is 0.002 g/m2/day (RAW), 0.001 g/m2/day (SEP), 0.001 g/m2/day (DEC), 0.001 g/m2/day (PUR), 0.265 g/m2/day (MAN), 0.003 g/m2/day (WC) and 0.004 g/m2/day (WV). During the weekly measurements of all stations and fractions, peaks of rise and fall in N2O emissions are recorded, being more notable in the autumn season for RAW, SEP, and MAN, and in spring for DEC and PUR. In the summer season, a drop in N2O emissions is recorded, which can be partially justified based on the low correlation recorded N2O emission/atmospheric humidity (R = −0.269**). Other correlations are also recorded: N2O emission/CO2 emission (R = 0.443**) and N2O emission/CH4 emission (R = 0.217**).
NH3 is a polluting and toxic gas at certain concentrations. Its concentrations in the atmosphere are combated to be mitigated in pig farms through nutritional and technical strategies. In this study, a range of NH3 concentrations is recorded between 0 g/m2/day (RAW (S1; S4), DEC (S4), WC (S6; S7) and WV (S6; S7) and 0.195 g/m2/day (MAN (S9)). In Figure 6 it can be seen how in most samples the emissions in the MAN fraction stand out. The slurry fractions resulting from the decanting and phytopurification stages present NH3 values closer to 0 g/m2/day, especially the WC and WV fractions, although these fractions do not stand out statistically. The NH3 emission/H2O emission correlation (R = 0.679**) stands out, influenced by the humidity/T correlation (R = −0.575**). In fact, similar trend lines are observed for both gases, influenced by parameters such as T (NH3 emission/T, R = 0.282**) and atmospheric humidity (NH3 emission/humidity, R = −0.172**). Also noteworthy are the correlations NH3 emission/CH4 emission (R = 0.387**) and NH3 emission/CO2 emission (R = 0.419**).

4. Discussion

4.1. Investigation Facilities and Schedule of the Integral Treatment with Wetlands

Physical stage of solid–liquid phase separation with phase separator with sieving and press filter (stage 1): the application of the solid–liquid phase separation technique is justified based on the BREF-MTD19/Group 12 on the In Situ Processing of Manure (Guide to the Best Available Techniques) [24]. This BAT indicates that the application of mechanical slurry separation reduces emissions of nitrogen, phosphorus, odors, and pathogenic microorganisms to the atmosphere and water, and facilitates the storage and/or application of manure to the field. It specifies that mechanical separation can be performed using a screw press separator, a centrifugal decanter, coagulation-flocculation, sieving, and filter presses. In this study, a static separator separates the solid and liquid fraction of the raw slurry by filtration through a sieve (500 µm) and pressing with an endless screw, with a working performance of 10–12 m3/h. The raw pig slurry initially passes through a sieve consisting of a mesh whose pore must allow the retention of solid particles (≥500 µm). The raw pig slurry that does not filter through the sieve is introduced into a cylinder with a filter-shaped wall (thickness 0.5–1 mm) inside which a helical screw is located. The raw slurry is introduced into the lower part of the cylinder, passing the separated liquid fraction through a filter and being drained into a separate container. Meanwhile, the solids in suspension are subjected to pressure by rotating the screw about its central axis. The solid phase is compacted by the loss of liquid and the result will be a solid fraction with a high dry matter content that exits the cylinder from the opposite end (manure). Increasing the applied pressure will increase the dry matter content. The sieved liquid fraction (separated pig slurry) and filtered is drained to a collector or storage system.
Physical stage of solid–liquid phase separation with gravity decantation (stage 2): the technique of settling solid-liquid phases by gravity is not recognized in the Guide to BAT [23] or the Implementing Decision (EU) 2017/302 of the Commission of February 15, 2017, which establishes the conclusions on BAT within the framework of Directive 2010/75/EU of the European Parliament and of the Council regarding the intensive farming of poultry or pigs. According to the BAT Guide, it is recognized as BAT when the decanter used is a centrifugal type, which is not the one used in the integral system of this study, given that decantation occurs with the sedimentation of the slurry as it moves through several interconnected ponds. The present stage consists of a separation of the solid and liquid fractions of the slurry separated by natural sedimentation by gravity in several decanters. It consists of decanting the slurry by gravity into a container shaped like an orthogonal rectangular prism with adequate dimensions. To improve sedimentation, it works with at least three decanters connected in series where the slurry is added constantly. At the present farm, the system works with six decanters in series, and the decanted liquid fraction overflows and drains to a storage system. The most solid fraction settles at the bottom of the decanters and is returned from time to time to the raw slurry storage system or is incorporated with the manure.
Biological stage of purification in artificial wetlands or biofilters: the biological purification of slurry with artificial wetlands or biofilters is considered in the BREF documents “Intensive Rearing of Poultry or Pigs” as a technique for wastewater purification [24]. It is a low-cost system, with high environmental integration and greater resistance to load variations than conventional systems [8,17] included in any BAT; however, it is included as a technique that reduces atmospheric emissions of wastewater according to the technical document Evaluation of Manure Management Techniques in Livestock (bovine, pork, poultry, and meat sectors) issued by the Ministry of Agriculture, Food and Environment in 2015 and also in Commission Implementing Decision (EU) 2017/302 of 15 February 2017 in which the conclusions on the BAT are established within the framework of Directive 2010/75/EU of the European Parliament and of the Council regarding the intensive farming of poultry or pigs. Specifically, it is indicated that in the purified slurry storage pond (compared to untreated raw slurry) the volatilization and rapid emission of ammonia is reduced by up to 50%. Furthermore, at an experimental level, a reduction in the concentration of NO3 of up to 22% has been recorded between the samples of the input effluent and the output effluent of the artificial wetlands. This fact shows that the treatment of manure with this biological technique also involves nitrification-denitrification and could also be included within the BREF/MTD19. At a conceptual level, artificial wetlands consist of a mono or polycrop of macrophyte plants arranged in lagoons, tanks, or shallow, waterproofed channels filled with different substrates (sand, fine gravel, medium gravel, and coarse gravel). The treated wastewater is filtered through the filter media and collected through a drainage system at the bottom.
Plants are the center of wastewater treatment, being an integral and indispensable part of these systems [25]. General requirements for selecting the appropriate plant in constructed wetlands for wastewater treatment include [26]: (a) ecological acceptability, (b) tolerant to local climatic conditions, pests and diseases, (c) tolerance to contaminants and submerged hypertrophic conditions, (d) easy propagation, rapid establishment, spreading and growth (e) high capacity for the removal of contaminants, either by direct assimilation and storage or indirectly by increasing microbial transformation such as nitrification (through the release of oxygen in the root zone) or denitrification (through the production of carbon in the substrates). The selection of plants in wetlands is a factor of great importance, due to their purification capacity and tolerance to contaminants. Plants are attributed to a high capacity for removing nitrogen and phosphorus. Root exudate positively influences microbial transformation, the amount of denitrifying bacteria, root biodegradation, and the purification capacity of wetlands [27]. In addition, wetlands provide greater oxygen transfer because when they are emptied, air penetrates the wetland, leading to the nitrification process. Subsequently, when filled and with the appropriate anaerobiosis conditions (influenced by hydraulic retention times among other factors), the biological process of denitrification could be completed to produce the conversion to forms of gaseous nitrogen that is released into the atmosphere [28,29]. In the case of artificial wetlands, the amount of sludge generated is not appreciable, so when the wetland cells are emptied, N2 escapes into the atmosphere and the output effluent is directed to a final storage pond. The purifying species Phagmites australis is the most used phytopurifying species in wetland treatment [3,27] in semiarid climates such as that of the Murcia Region, having adequate effectiveness for the elimination of physical-chemical and microbiological parameters [7,28,29]. This species has been planted in the present study (5 plants/m2).
It should be mentioned that in the slurry-purified ponds spontaneously certain types of microalgae overgrow. Those microalgae continue to promote the purification of the slurry [30]. Purification occurs through the photosynthesis of microalgae with solar irradiation, and among the processes that occur, denitrification also takes place. These types of microalgae grow mainly with the consumption of soluble phosphorus and NO3, and even have the capacity to take atmospheric nitrogen when the medium in which they are found lacks other nitrogen sources in oxidized form (being NO3 the most oxidized form of nitrogen [30]. Within this type of microalgae, benthic algae, and Scenedesmus sp. stand out. In a doctoral thesis on artificial wetlands with fattening pig slurry at the Integrated Center for Training and Agricultural Experiences (Lorca, Spain) it was recorded a certain degree of bioremediation in the purified slurry storage pond by the action of microalgae (Scenedesmus sp.); specifically, reductions were recorded in the concentrations of NO3, N-NH4+, total N, and soluble Cu and Zn [28]. Pig slurry presents a great variability in its composition, and for that reason is necessary to carry out an analysis before/after treatment with artificial wetlands. In this way, the purification efficiency of the system and the agronomic value of the purified effluent, which can be used as fertilizer, are known. Thus, the application dose adjusted to the type of crop and the characteristics of the soil and irrigation water can be calculated.
Agronomic recycling stage of water and nutrients: the agronomic recycling of pig slurry involves several recommendations and application techniques that are included in Group 13 Application of manure to the field MTD20-MTD22 [24] such as carrying out soil analysis, application recommendations on land with runoff, preparation of fertilization plans according to the demand of the soil–water–plant system and application techniques. Among the techniques for applying slurry to the soil, the application of slurry with deep injection (˃15 cm) is the most practiced, which reduces ammonia emissions by up to 90%, and also acidification with a view to reducing ammonia emissions. At an environmental level, it is highly recommended to carry out a fractional agronomic application when the agronomic doses are between 50,000 L/ha–100,000 L/ha, as well as carrying out environmental control of the receiving soil through periodic annual analyses. In addition, the Spanish Royal Decree 1051 on sustainable nutrition in agricultural soils will be taken into consideration in order to mitigate the environmental impact of the application of manures on agricultural soils. All this with the aim of achieving a sustainable supply of nutrients in agricultural soils and reducing greenhouse gas emissions and other polluting gases. Similarly, with the recommendations of the JRC SAFEMANURE working group created by the European Union to develop criteria and agricultural resources for the safe use of processed manure in areas vulnerable to contamination by nitrates at doses above the limits established in Directive 91/ 676/EEC. Such resources are known by the acronym ‘RENURE’ for “recovered nitrogen from manure” and are defined as “any substance containing nitrogen wholly or partially derived from livestock manure by means of a treatment that can be used in areas with contamination of the water for nitrogen.” For RENURE resources, similar provisions apply to nitrogen-containing chemical fertilizers as defined in the Nitrate Regulation (Directive (91/676/EEC), as long as compliance with the nitrate directive is ensured and adequate agronomic benefits are provided to achieve good productivity. Regarding the criteria for a purified pig slurry to be considered RENURE: mineral N/total N ratio ≥ 90% or TOC/TN ratio ≤ 3 and not exceeding the limits of Cu ≤ 300 mg/kg dry matter and Zn ≤ 800 mg/kg dry matter dry. The experimental analytical results of slurry on farms with integral slurry management systems approach or meet the aforementioned criteria. Analytical results can even be optimized by promoting certain techniques in some of the aforementioned stages, such as aeration, microfiltration (120–140 µm) of the slurry entering the wetlands and even working with longer hydraulic retention times. All actions aimed at transforming liquid manure or slurry into RENURE could be effective manure management strategies to protect waters from nitrate leaching and ensure adequate agronomic benefits. In this way, having an estimate of nitrogen emissions in RENURE fractions or agricultural soil from recycled RENURE fractions (or possible RENURE fractions) would be very useful from a bibliographic point of view according to the JRC since there is hardly any data at an international level.

4.2. Pig Slurry Traceability

As can be observed EC did not experience large variation after separation or decanter modules in any season (Table 2, Table 3 and Table 4) showing no significant differences (p < 0.05) when compared SEP and DEC with respect to RAW. Electrical conductivity is proportional to the content of dissolved salts and, therefore, is directly related to the sum of cations or anions that are determined chemically [31] and, in general, presents a close relation with the total dissolved solids.
As expected, PUR slurry resulted in highly effective SS removal. In this study, the system reached up to 99% reduction in autumn, spring, and summer. This finding agreed with previous studies [8,32,33]. Several authors [32,33,34] have demonstrated that planted CW is more effective in a reduction in SS, reporting high percentages of 100% 99%, and 98%.
The internal slope of the Horizontal subsurface constructed wetland could contribute to sedimentation, in addition to it, filtration phenomena because of the small space among particles also triggered the reduction in SS [8,35]. It is important to highlight that within the CW the processes by which wastewater is purified include a wide range of interacting biological, physical, and chemical mechanisms, as well as plant uptake, which may contribute to a synergism for the system. Nutrients are absorbed by plants from the water column through the roots, which serve as an ideal support medium for bacterial growth and the filtration/adsorption of suspended solids [9].
It should be noted that pretreatment of the pig slurry (separation and decantation), cooperates significantly on one hand to avoid media clogging, on the other hand with at least sedimentation of settleable solids in the CW beds [35]; therefore, these effects promoted the reduction in solids.
A range of 56–80% reduction in COD was achieved in the integral treatment system during the assessment for the three studied seasons. The main phenomena associated with COD reduction in pig slurry are volatilization, photochemical oxidation, sedimentation, adsorption, and biological degradation [8,19,20]. Scholz [33] reported 95% of removal for COD calculated in the outflow respect to the inflow; Caballero-Lajarín [32] observed an efficiency of 68% in a study using CW combined with a pretreatment composed by a separator, decanter, and sedimentation tanks, similar to the one used in this study for the comprehensive treatment of slurry. A study carried out by Haddis [20] highlighted CW as a natural solution to remove organic pollutants, reporting 65% and 62% of removal in planted systems.
Phosphate concentration reductions were generally greater with 100% in autumn, 92% in spring, and 88% in summer. Previous researchers reported the potential efficiency of the CW to remove this nutrient from the influent [36].
The solubility and reactivity of various forms of phosphorus are influenced by the physical, chemical, and biological properties of a wetland system. Previous authors suggest that the most important mechanisms phosphorus retention pathway in wetlands are via physical sedimentation [37], adsorption, and chemical precipitation associated with long-term storage in CW [32].
In a review concerning to treatment of industrial wastewater with CW, Vymazal [17] found in different studies that 5 days resulted be the most effective HRT for percentages of reduction. For instance, 84.4% for aquaculture wastewater, 35% for mixed wastewater, 80% for potato processing wastewater, and 85% for treating diluted olive mill wastewater. In an integral treatment system used in our study, Terrero [8] reported 95% of TP removal with an HRT of 7 days treating pig slurry, and Caballero-Lajarín [32] reported a significant reduction of 90% after 4 weeks of HRT.
Plants absorb nutrients to sustain their metabolism, they can also take in trace chemicals from the root zone, which may be stored or, in some cases, expelled as gases. This uptake primarily occurs through the roots, typically located in wetland soils, although fortuitous roots can sometimes extend into the water column. Submerged plants may also absorb nutrients and metals directly from the water into their stems and leaves. While plant uptake is a key removal mechanism for certain pollutants, it plays a principal role only in lightly loaded systems. Nevertheless, plants are essential for maintaining high-quality water treatment performance in most wetland systems [9]. This phenomenon can also explain the minimization of the TP content in the effluent, the purified slurry with the HSFCW treatment system. Likewise, TP reduction could be related to coprecipitation with Ca and Mg due to a limestone gravel bed as explained by Terrero [8]. Schulz [38] obtained a 49% removal in TP with a very short HRT of 7.5, 2.5, and 1.5 h, treating rainbow trout farm effluents in HSFCW with emergent plants.
Concerning adsorption via substrate, Vymazal [17] pointed out that to improve phosphorus removal, it is important to choose materials with high phosphorus adsorption capacity, which is determined by their chemical and physical properties. These materials may include minerals with reactive iron or aluminum hydroxide or oxide groups on their surfaces, or calcareous materials that can encourage the precipitation of calcium phosphate. Thus, previous studies observed that the decrease in TP could be related to adsorption and chemical precipitation with Ca+2 coupled with iron, aluminum, and organic matter fixed in the used substrate [8,32,35].
Results concerning nitrogen concentrations presented the highest percentage reduction of 57% during spring (Table 3) when compared to PUR to RAW slurry, followed by 50% during autumn (Table 2) and 22% in summer (Table 4). The different mechanisms that occur to reduce nitrogen forms throughout integrated treatment systems like those used in this study could be very wide, including separation, sedimentation, nitrification and denitrification, microbial transformation during storage [39,40], and other processes like adsorption that could take place during the whole treatment. Kadlec [9] exposed that when the wastewater moves through the wetland, it undergoes treatment through processes such as sedimentation, filtration, oxidation, reduction, adsorption, and precipitation. Additionally, the wetland nitrogen cycle includes a number of pathways like atmospheric nitrogen inputs, ammonia adsorption, and ammonia volatilization, affecting nitrogen compounds. Although nitrite and nitrate, the oxidized nitrogen forms do not adhere to solid substrates, but ammonia is capable of sorption to both organic and inorganic substrates, due to the positive charge of the ammonium ion, it is susceptible to cation exchange.
Wetlands plants need to assimilate nitrogen, especially in the forms of ammonia and nitrate nitrogen. In this process, plants absorb nitrogen primarily through their root systems, which are mostly situated in the wetland soil [9]; therefore, this is the main pathway to reduce the nitrogen in CW thanks to plant uptake. Our results are slightly below those experienced by Huang [41] with 73–61% TN reduction in a study concerning the effects of plants in a horizontal subsurface flow pilot-scale constructed wetlands, or Caballero-Lajarín [32] where a decrease of 63% was achieved for TN after wetland. A study presented by Hjorth [39] pointed out that around 25% of the nitrogen and phosphorous is retained in the solid fraction using a screw separator.
Taking into account the importance of the Spanish livestock subsector, it is considered necessary to accomplish the regulations for the dosage and application of manure to soils that ensure the protection of human health and the environment; therefore, the proper management of manure is crucial, with farmers being responsible for it within the scope of their respective obligations manifested in RD 306/2020 [42]. In this way, the calculation of the agronomic dosage is useful to estimate the agricultural land necessary for better application.
Nitrates Directive has established a maximum of 170 kg N ha−1 year −1 as application dosage; therefore, countries must adopt techniques in order to avoid unnecessarily high application levels of nitrogen per hectare of land. According to Bref documents [24], Best Available Techniques can be applied to pig slurry aiming to facilitate the manure’s agricultural use (better dosing).
Although in many cases the use of certain techniques is limited for technical and/or economic reasons, agricultural valorization as the final destination of slurry should be considered the main and most favorable option. But it should always be considered that when the agricultural application is not performed correctly and the capacity of the receiving agrosystem is exceeded, due to risks of contamination and alteration the environment may occur.
As can be observed in Table 2, Table 3 and Table 4, purified pig slurry allowed a greater volume of application compared with the previous phase a CW, and furthermore raw slurry. Regarding the volume of application respecting the limited agronomic dosage of 170 kg N ha−1 year−1, in the three studied seasons, the pattern followed by the modules of the integrated management system was RAW < DEC < PUR. In all cases of study, SEP resulted higher in TN concentrations compared to RAW.
The solid manure is a product of the separation of the RAW slurry and as well-known is composed basically of dried matter and phosphorous. The characterization of MAN in this study is in accordance with values reported by Møller [43] in terms of dried matter and TN. Those authors reported mean values of 21.9–31.7% of DM and 0.4–0.48% of TN, comparable with our findings of 43.7–25.8% of DM and 0.4–0.37% of TN.
Table 5 verifies that phosphate content in autumn and spring with mean values of 451.1 mg kg−1 and 939.1 mg kg−1 were higher than mean values found in RAW 323.7 mg kg−1 and 399.5 mg kg−1 during autumn and spring, respectively. Our findings are within the range 264.0–501.6 kg−1 presented in research carried out by Kowalski [44] during the same season.

4.3. GHG/NH3 Emissions in Pig Slurry Fractions

The emissions results are consistent with previous studies that have investigated CH4 emissions in slurry and animal waste management systems. In a study conducted by Dinuccio [45], CH4 emissions were evaluated in different slurry fractions and significant variability in emissions was observed between the different slurry fractions. Furthermore, the authors found that CH4 emissions were higher during certain seasons of the year and in liquid fractions (not in manure), which is consistent with the findings reported in this study, confirming an increase in CH4 emissions with the increase in T [46]. Another relevant study is the one carried out by Veillete [47], in which CH4 emissions in slurry treatment systems were investigated. The results showed that the decantation and phytopurification stages significantly reduced CH4 emissions compared to other treatment stages. These findings support the observation of a reduction in CH4 emissions in the slurry fractions generated in the settling and phytopurification stages reported in this study. Furthermore, a study conducted by Zhou [48] examined CH4 emissions in wetlands with the presence of vegetation. The results showed that newly filled wetlands with the presence of vegetation can experience methane emission peaks due to the decomposition of organic matter and associated microbial activity. These findings support the observation of a CH4 emission peak in WV in this study.
In manure, CO2 originates from three sources: (1) the rapid hydrolysis of urea into NH3 and CO2 catalyzed by the enzyme urease; (2) the anaerobic fermentation of organic matter into intermediate volatile fatty acids (VFA), CH4, and CO2; (3) the aerobic degradation of organic matter [49,50,51]. Based on the above, the positive correlation between the recorded emissions of CO2 and CH4 in waste and slurry management systems is justified. A study conducted by Dinuccio [45] examined CO2 emissions with temperature and at different stages of slurry treatment and found that the RAW and MAN fractions showed the highest CO2 emissions. These findings support the results recorded in this study, where MAN, RAW, and SEP also present notable CO2 emissions. Furthermore, a study carried out by Philippe [52] investigated CO2 emissions in agricultural waste management systems and found a significant correlation between CH4 and CO2 emissions. The authors highlighted that the decomposition and fermentation processes of organic matter in agricultural waste can generate both CO2 and CH4. These results support the statistically significant correlation between CH4 and CO2 emissions (R = 0.626**) reported in this study. Regarding H2O, little data concerning H2O emissions during storage of both liquid and solid fractions are currently available.
Appreciable N2O concentrations are only recorded for the MAN fraction, coinciding with other studies. Several studies support these findings for liquid slurry fractions in terms of the low N2O emissions recorded. For example, Dinuccio [45] conducted research on greenhouse gas emissions in agricultural systems and found that N2O emissions were generally lower compared to CO2 and CH4 emissions. These results can be attributed to the lower production and release of N2O compared to other gases, as well as the lower atmospheric persistence of N2O. The small N2O fluxes from cattle and pig slurry storage can be explained by the absence of crust during most of the storage period. N2O may be emitted during the storage of manure either as a byproduct of incomplete ammonium oxidation or as a by-product of incomplete denitrification [53]. Under aerobic conditions, NH4+ will be oxidized to NO2; as an intermediate, the diffusion of N2O from the nitrification reaction system to the atmosphere results in the emission of N2O [54]. Furthermore, previous research has indicated that the formation of N2O in CWs is mainly caused by a nitrification process [55,56], deducing that the process is favored under the aerobic conditions of cell filling. In this sense, the fact that the PUR fraction presents lower N2O emissions than WC and WV could be due to alterations in the structure of the microbial community involved in the transformation of nitrogen in the wetlands or in the final storage pond, particularly in denitrifying microbial species [57].
Gases such as hydrogen, hydrogen sulfide (H2S), NH3, and volatile organic compounds are also generated in slurry fractions [58]; however, they do not have a direct effect on global warming. The results confirm a positive relationship between NH3 emission and parameters like temperature, pH, and NH4+-N found by other studies [45,59,60]. A study conducted by Dinuccio [45] examined NH3 emissions in different pig manure fractions. The results showed that raw slurry had the highest ammonia emissions, followed by separated slurry and decanted slurry. These fractions, which contain a higher concentration of nitrogen, are more likely to release ammonia due to microbial decomposition and volatilization of ammoniacal nitrogen. Another study by Osada [61] investigated the emissions of CH4, N2O, and NH3 in pig manure treated with constructed wetlands. The study found that this slurry treatment method can significantly reduce ammonia emissions. Constructed wetlands act as biological filters and promote the transformation of ammonia into less volatile forms, such as nitrate. This helps reduce the release of ammonia into the atmosphere and reduce environmental impact. Furthermore, a study by Zhou [48] evaluated NH3 emissions in different stages of pig manure management. The study found that manure, as a solid slurry fraction, can have significant ammonia emissions due to its nitrogen-rich composition. However, slurry fractions settled and treated with artificial wetlands showed a considerable reduction in ammonia emissions due to the separation and biological transformation of nitrogen.

5. Conclusions

All efforts to convert liquid manure or slurry into RENURE can serve as effective manure management strategies, safeguarding water sources from nitrate leaching while also providing essential agronomic benefits. By adopting these practices, we can enhance nutrient utilization in agriculture, reducing environmental impact, and contributing to more sustainable farming systems. Therefore, the integral management system of this study has demonstrated: (1) to be a practical, low cost and efficient technique to pig slurry treatment that offers a successful opportunity to decrease the concentration of nutrients in pig slurry fractions in line with the European normative, (2) the interception of nitrogen, phosphorus, other nutrients, and organic matter could provide a valuable subproduct that subsequently can be useful to be applied to the soil for its nutritional and water value, (3) the potential of removal up to 95% of SS, 56% of COD, 52% of TN and 80% of PO43− in CW promoted by the pretreatment linked to the phytoextraction and several biological and physico-chemical processes in the system, (4) the results of emissions support the importance of the physical separation and phytopurification stages in reducing emissions of CH4, CO2, N2O, and NH3 and highlight the practical potential of artificial wetlands to treat slurry and reduce the impact of emissions derived from the pig sector and the related environmental and analytical factors, (5) with respect to the liquid fractions, the MAN fraction presents higher emissions of CO2 and N2O, this aspect could be the subject of future research due to its great contribution to the global warming potential and (6) the substrate surface of constructed wetlands (WC and WV) has an effect similar to that of a rigid coverage and stands out for displaying lower NH3 emissions compared to the rest of the fractions (RAW, SEP, DEC, and PUR).

Author Contributions

Conceptualization, M.G.-G. and M.A.T.T.; methodology, M.G.-G. and M.A.T.T.; validation, M.G.-G., M.A.T.T. and O.E.b.; formal analysis, M.G.-G.; investigation, M.G.-G., M.A.T.T., O.E.b. and Á.F.C.; resources, M.G.-G., M.A.T.T., O.E.b. and Á.F.C.; data curation, M.G.-G. and M.A.T.T.; writing—original draft preparation, M.G.-G., M.A.T.T. and O.E.b.; writing—review and editing, M.G.-G., M.A.T.T., O.E.b. and Á.F.C.; visualization, M.G.-G., M.A.T.T. and O.E.b.; supervision, Á.F.C. All authors have read and agreed to the published version of the manuscript.

Funding

This research received no external funding.

Data Availability Statement

The data presented in this study are confidential and belong to a finished project. This publication is the first associated with the project. Access to the information related to the complete project data is restricted to authorized personnel only due to privacy and confidentiality considerations. For further inquiries or potential data access requests, please contact the corresponding author.

Conflicts of Interest

The authors declare no conflicts of interest. The funders had no role in the design of the study; in the collection, analyses, or interpretation of data; in the writing of the manuscript; or in the decision to publish the results.

References

  1. Huygens, D.; Orveillon, G.; Lugato, E.; Tavazzi, S.; Comero, S.; Jones, A.; Gawlik, B.; Saveyn, H. Technical Proposals for the Safe Use of Processed Manure above the Threshold Established for Nitrate Vulnerable Zones by the Nitrates Directive (91/676/EEC), EUR 30363 EN, 2020th ed.; Publications Office of the European Union: Luxembourg, 2020. [Google Scholar] [CrossRef]
  2. Torrens, A.; Folch, M.; Salgot, M. Design and Performance of an Innovative Hybrid Constructed Wetland for Sustainable Pig Slurry Treatment in Small Farms. Front. Environ. Sci. 2021, 8, 577186. [Google Scholar] [CrossRef]
  3. Scholz, M. Piggery Wastewater Treatment with Integrated Constructed Wetlands. In Wetlands for Water Pollution Control; Elsevier: Amsterdam, The Netherlands, 2016; pp. 419–432. [Google Scholar] [CrossRef]
  4. Cocolo, G.; Hjorth, M.; Zarebska, A.; Provolo, G. Effect of acidification on solid–liquid separation of pig slurry. Biosyst. Eng. 2016, 143, 20–27. [Google Scholar] [CrossRef]
  5. Karakashev, D.; Schmidt, J.E.; Angelidaki, I. Innovative process scheme for removal of organic matter, phosphorus and nitrogen from pig manure. Water Res. 2008, 42, 4083–4090. [Google Scholar] [CrossRef]
  6. Burton, C.H. Manure management: Treatment strategies for sustainable agriculture, 2nd edition. Livest. Sci. 2006, 102, 256–257. [Google Scholar] [CrossRef]
  7. Burton, C.H. The potential contribution of separation technologies to the management of livestock manure. Livest. Sci. 2007, 112, 208–216. [Google Scholar] [CrossRef]
  8. Terrero, M.A.; Muñoz, M.Á.; Faz, Á.; Gómez-López, M.D.; Acosta, J.A. Efficiency of an integrated purification system for pig slurry treatment under mediterranean climate. Agronomy 2020, 10, 208. [Google Scholar] [CrossRef]
  9. Kadlec, H.R.; Wallace, D.S. Treatment Wetlands, 2nd ed.; Taylor & Francis Group: Boca Ratón, FL, USA, 2009. [Google Scholar]
  10. Parde, D.; Patwa, A.; Shukla, A.; Vijay, R.; Killedar, D.J.; Kumar, R. A review of constructed wetland on type, treatment and technology of wastewater. Environ. Technol. Innov. 2021, 21, 101261. [Google Scholar] [CrossRef]
  11. Ottová, V.; Balcarová, J.; Vymazal, J. Microbial characteristics of constructed wetlands. Water Sci. Technol. 1997, 35, 117. [Google Scholar] [CrossRef]
  12. Harrington, C.; Scholz, M.; Culleton, N.; Lawlor, P.G. The use of integrated constructed wetlands (ICW) for the treatment of separated swine wastewaters. Hydrobiologia 2012, 692, 111–119. [Google Scholar] [CrossRef]
  13. Scholz, M. Wetlands for Water Pollution Control; Elsevier: Amsterdam, The Netherlands, 2016; pp. 137–155. [Google Scholar] [CrossRef]
  14. Knight, R.L.; Payne, V.W., Jr.; Borer, R.E.; Clarke, R.A., Jr.; Pries, J.H. Constructed wetlands for livestock wastewater management. Ecol. Eng. 2000, 15, 41–55. [Google Scholar] [CrossRef]
  15. Hsu, C.-B.; Hsieh, H.-L.; Yang, L.; Wu, S.-H.; Chang, J.-S.; Hsiao, S.-C.; Su, H.-C.; Yeh, C.-H.; Ho, Y.-S.; Lin, H.-J. Biodiversity of constructed wetlands for wastewater treatment. Ecol. Eng. 2011, 37, 1533–1545. [Google Scholar] [CrossRef]
  16. García-Valero, A.; Martínez-Martínez, S.; Faz, Á.; Terrero, M.A.; Muñoz, M.Á.; Gómez-López, M.D.; Acosta, J.A. Treatment of wastewater from the tannery industry in a constructed wetland planted with Phragmites australis. Agronomy 2020, 10, 176. [Google Scholar] [CrossRef]
  17. Vymazal, J. Constructed wetlands for treatment of industrial wastewaters: A review. Ecol. Eng. 2014, 73, 724–751. [Google Scholar] [CrossRef]
  18. Vymazal, J. The use constructed wetlands with horizontal sub-surface flow for various types of wastewater. Ecol. Eng. 2009, 35, 1–17. [Google Scholar] [CrossRef]
  19. Kadlec, R.H.; Knight, R.L. Treatment Wetland; Lewis Publishers: Boca Ratón, FL, USA, 1997. [Google Scholar]
  20. Haddis, A.; Van der Bruggen, B.; Smets, I. Constructed wetlands as nature based solutions in removing organic pollutants from wastewater under irregular flow conditions in a tropical climate. Ecohydrol. Hydrobiol. 2020, 20, 38–47. [Google Scholar] [CrossRef]
  21. Vymazal, J.; Kröpfelová, L. Multistage hybrid constructed wetland for enhanced removal of nitrogen. Ecol. Eng. 2015, 84, 202–208. [Google Scholar] [CrossRef]
  22. American Public Health Association; American Water Works Association; Water Environment Federation. Standard Methods for the Examination of Water and Wastewater, 23rd ed.; American Public Health Association: Washington, DC, USA, 2017. [Google Scholar]
  23. Duchaufour, P. Precis de Pedologie; Masson: Paris, France, 1970. [Google Scholar]
  24. Santonja, G.G.; Georgitzikis, K.; Scalet, B.M.; Montobbio, P.; Roudier, S.; Sancho, L.D. Best Available Techniques (BAT) Reference Document for the Intensive Rearing of Poultry or Pigs; Publications Office of the European Union: Luxembourg, 2017. [Google Scholar] [CrossRef]
  25. Brix, H. Do macrophytes play a role in constructed treatment wetlands? Water Sci. Technol. 1997, 35, 11–17. [Google Scholar] [CrossRef]
  26. Tanner, C.C. Plants for constructed wetland treatment systems—A comparison of the growth and nutrient uptake of eight emergent species. Ecol. Eng. 1996, 7, 59–83. [Google Scholar] [CrossRef]
  27. Jiang, X.; Tian, Y.; Ji, X.; Lu, C.; Zhang, J. Influences of plant species and radial oxygen loss on nitrous oxide fluxes in constructed wetlands. Ecol. Eng. 2020, 142, 105644. [Google Scholar] [CrossRef]
  28. Vymazal, J. Constructed Wetlands for Wastewater Treatment: Five Decades of Experience. Environ. Sci. Technol. 2011, 45, 61–69. [Google Scholar] [CrossRef] [PubMed]
  29. Wu, H.; Zhang, J.; Ngo, H.H.; Guo, W.; Hu, Z.; Liang, S.; Fan, J.; Liu, H. A review on the sustainability of constructed wetlands for wastewater treatment: Design and operation. Bioresour. Technol. 2015, 175, 594–601. [Google Scholar] [CrossRef] [PubMed]
  30. Guzmán, F.R.; de Ursinos, J.A.F.R.; Escobar, F.C.; Mateos, P.A.; Barrantes, M.M.D. Proceso ecológico-fotosintético para la depuración de purines en granjas. Tecnol. Agua 2000, 201, 61–66. [Google Scholar]
  31. Caballero-Lajarín, A. Sistema de Depuración de Aguas Residuales de Origen Ganadero: Humedales artificiales. Ph.D. Thesis, Universidad Politécnica de Cartagena, Cartagena, Spain, 2013. [Google Scholar]
  32. Caballero-Lajarín, A.; Zornoza, R.; Faz, A.; Lobera, J.B.; Muñoz, M.A.; Domínguez-Oliver, S.G. Combination of Low-Cost Technologies for Pig Slurry Purification under Semiarid Mediterranean Conditions. Water Air Soil Pollut. 2015, 226, 1–15. [Google Scholar] [CrossRef]
  33. Scholz, M.; Harrington, R.; Carroll, P.; Mustafa, A. The Integrated Constructed Wetlands (ICW) concept. Wetlands 2007, 27, 337–354. [Google Scholar] [CrossRef]
  34. Mashauri, D.A.; Mulungu, D.M.M.; Abdulhussein, B.S. Constructed wetland at the University of Dar es Salaam. Water Res. 2000, 34, 1135–1144. [Google Scholar] [CrossRef]
  35. Polprasert, C.; Kittipongvises, S. Constructed Wetlands and Waste Stabilization Ponds. Treatise Water Sci. 2011, 4, 277. [Google Scholar] [CrossRef]
  36. Christensen, M.L.; Hjorth, M.; Keiding, K. Characterization of pig slurry with reference to flocculation and separation. Water Res. 2009, 43, 773–783. [Google Scholar] [CrossRef] [PubMed]
  37. Wang, N.; Mitsch, W.J. A detailed ecosystem model of phosphorus dynamics in created riparian wetlands. Ecol. Model. 2000, 126, 101–130. [Google Scholar] [CrossRef]
  38. Schulz, C.; Gelbrecht, J.; Rennert, B. Treatment of rainbow trout farm effluents in constructed wetland with emergent plants and subsurface horizontal water flow. Aquaculture 2003, 217, 207–221. [Google Scholar] [CrossRef]
  39. Hjorth, M.; Christensen, K.V.; Christensen, M.L.; Sommer, S.G. Soli-liquid separation of animal slurry in therory and practice. A review. Agron. Sustain. Dev. 2010, 30, 153. [Google Scholar]
  40. Stottmeister, U.; Wießner, A.; Kuschk, P.; Kappelmeyer, U.; Kästner, M.; Bederski, O.; Müller, R.A.; Moormann, H. Effects of plants and microorganisms in constructed wetlands for wastewater treatment. Biotechnol. Adv. 2003, 22, 93–117. [Google Scholar] [CrossRef] [PubMed]
  41. Huang, X.-F.; Ye, G.-Y.; Yi, N.-K.; Lu, L.-J.; Zhang, L.; Yang, L.-Y.; Xiao, L.; Liu, J. Effect of plant physiological characteristics on the removal of conventional and emerging pollutants from aquaculture wastewater by constructed wetlands. Ecol. Eng. 2019, 135, 45–53. [Google Scholar] [CrossRef]
  42. Real Decreto 306, de 11 de Febrero, por el que se Establecen Normas Básicas de Ordenación de las Granjas Porcinas Intensivas, y se Modifica la Normativa Básica de Ordenación de las Explotaciones de Ganado Porcino Extensivo, Boletín Oficial Del Estado (2020) 13761–13791. Available online: https://www.boe.es/buscar/doc.php?id=BOE-A-2020-2110 (accessed on 21 August 2020).
  43. Møller, H.B.; Lund, I.; Sommer, S.G. Solid–liquid separation of livestock slurry: Efficiency and cost. Bioresour. Technol. 2000, 74, 223–229. [Google Scholar] [CrossRef]
  44. Kowalski, Z.; Makara, A.; Fijorek, K. Changes in the properties of pig manure slurry. Acta Biochim. Pol. 1970, 60, 845–850. [Google Scholar] [CrossRef]
  45. Dinuccio, E.; Berg, W.; Balsari, P. Gaseous emissions from the storage of untreated slurries and the fractions obtained after mechanical separation. Atmos. Environ. 2008, 42, 2448–2459. [Google Scholar] [CrossRef]
  46. Husted, S. Seasonal Variation in Methane Emission from Stored Slurry and Solid Manures. J. Environ. Qual. 1994, 23, 585–592. [Google Scholar] [CrossRef]
  47. Veillette, M.; Girard, M.; Viens, P.; Brzezinski, R.; Heitz, M. Function and limits of biofilters for the removal of methane in exhaust gases from the pig industry. Appl. Microbiol. Biotechnol. 2012, 94, 601–611. [Google Scholar] [CrossRef] [PubMed]
  48. Zhou, S.; Wang, C.; Liu, C.; Sun, H.; Zhang, J.; Zhang, X.; Xin, L. Nutrient removal, methane and nitrous oxide emissions in a hybrid constructed wetland treating anaerobic digestate. Sci. Total Environ. 2020, 733, 138338. [Google Scholar] [CrossRef]
  49. Wolter, M.; Prayitno, S.; Schuchardt, F. Greenhouse gas emission during storage of pig manure on a pilot scale. Bioresour. Technol. 2004, 95, 235–244. [Google Scholar] [CrossRef]
  50. Jeppsson, K.-H. SE—Structure and Environment: Carbon Dioxide Emission and Water Evaporation from Deep Litter Systems. J. Agric. Eng. Res. 2000, 77, 429–440. [Google Scholar] [CrossRef]
  51. Møller, H.B.; Sommer, S.G.; Ahring, B.K. Biological Degradation and Greenhouse Gas Emissions during Pre-Storage of Liquid Animal Manure. J. Environ. Qual. 2004, 33, 27–36. [Google Scholar] [CrossRef]
  52. Philippe, F.-X.; Nicks, B. Review on greenhouse gas emissions from pig houses: Production of carbon dioxide, methane and nitrous oxide by animals and manure. Agric. Ecosyst. Environ. 2015, 199, 10–25. [Google Scholar] [CrossRef]
  53. Oenema, O.; Bannink, A.; Sommer, S.G.; Van Groenigen, J.W.; Velthof, G.L. Chapter 12—Gaseous Nitrogen Emissions from Livestock Farming Systems. In Nitrogen in the Environment, 2nd ed.; Hatfield, J.L., Follett, R.F., Eds.; Academic Press: San Diego, CA, USA, 2008; pp. 395–441. [Google Scholar] [CrossRef]
  54. Wrage, N.; Velthof, G.L.; Van Beusichem, M.L.; Oenema, O. Role of nitrifier denitrification in the production of nitrous oxide. Soil Biol. Biochem. 2001, 33, 1723–1732. [Google Scholar] [CrossRef]
  55. Inamori, R.; Wang, Y.; Yamamoto, T.; Zhang, J.; Kong, H.; Xu, K.; Inamori, Y. Seasonal effect on N2O formation in nitrification in constructed wetlands. Chemosphere 2008, 73, 1071–1077. [Google Scholar] [CrossRef] [PubMed]
  56. Søvik, A.K.; Kløve, B. Emission of N2O and CH4 from a constructed wetland in southeastern Norway. Sci. Total Environ. 2007, 380, 28–37. [Google Scholar] [CrossRef] [PubMed]
  57. Mander, Ü.; Dotro, G.; Ebie, Y.; Towprayoon, S.; Chiemchaisri, C.; Nogueira, S.F.; Jamsranjav, B.; Kasak, K.; Truu, J.; Tournebize, J.; et al. Greenhouse gas emission in constructed wetlands for wastewater treatment: A review. Ecol. Eng. 2014, 66, 19–35. [Google Scholar] [CrossRef]
  58. Zahn, J.A.; Hatfield, J.L.; Laird, D.A.; Hart, T.T.; Do, Y.S.; DiSpirito, A.A. Functional Classification of Swine Manure Management Systems Based on Effluent and Gas Emission Characteristics. J. Environ. Qual. 2001, 30, 635–647. [Google Scholar] [CrossRef] [PubMed]
  59. Dewes, T. Effect of pH, temperature, amount of litter and storage density on ammonia emissions from stable manure. J. Agric. Sci. 1996, 127, 501–509. [Google Scholar] [CrossRef]
  60. Ni, J. Mechanistic Models of Ammonia Release from Liquid Manure: A Review. J. Agric. Eng. Res. 1999, 72, 1–17. [Google Scholar] [CrossRef]
  61. Osada, T.; Shiraishi, M.; Hasegawa, T.; Kawahara, H. Methane, nitrous oxide and ammonia generation in full-scale swine wastewater purification facilities. Front. Environ. Sci. Eng. 2017, 11, 10. [Google Scholar] [CrossRef]
Figure 1. Operational design diagram of the treatment system with artificial wetlands.
Water 16 02351 g001
Figure 2. Methane (CH4) emissions evolution of pig slurry fractions. Different letters indicate significant differences between the fractions and samplings (p ˂ 0.05). RAW: raw pig slurry; SEP: separated pig slurry; DEC: decanted pig slurry; PUR: purified pig slurry; WC: wetland control; WV: wetland vegetation; S: sampling.
Water 16 02351 g002
Figure 3. Carbon dioxide (CO2) emissions evolution with stacked upper scale of pig slurry fractions. Different letters indicate significant differences between the fractions and samplings (p ˂ 0.05). RAW: raw pig slurry; SEP: separated pig slurry; DEC: decanted pig slurry; PUR: purified pig slurry; WC: wetland control; WV: wetland vegetation; S: sampling.
Water 16 02351 g003
Figure 4. Water (H2O) emissions evolution with stacked upper scale of pig slurry fractions. Different letters indicate significant differences between the fractions and samplings (p ˂ 0.05). RAW: raw pig slurry; SEP: separated pig slurry; DEC: decanted pig slurry; PUR: purified pig slurry; WC: wetland control; WV: wetland vegetation; S: sampling.
Water 16 02351 g004
Figure 5. Nitrous oxide (N2O) emissions evolution with stacked upper scale of pig slurry fractions. Different letters indicate significant differences between the fractions and samplings (p ˂ 0.05). RAW: raw pig slurry; SEP: separated pig slurry; DEC: decanted pig slurry; PUR: purified pig slurry; WC: wetland control; WV: wetland vegetation; S: sampling.
Water 16 02351 g005
Figure 6. Ammonia (NH3) emissions evolution with stacked upper scale of pig slurry fractions. Different letters indicate significant differences between the fractions and samplings (p ˂ 0.05). RAW: raw pig slurry; SEP: separated pig slurry; DEC: decanted pig slurry; PUR: purified pig slurry; WC: wetland control; WV: wetland vegetation; S: sampling.
Water 16 02351 g006
Table 1. Main design characteristics for the integral system of pig slurries with constructed wetlands.
StageWork UnitsProcessed VolumeCharacteristic *
Phase separator (Segalés, Kompact 1-100)110–12 m3/hMesh: 500 µm
Decanters (bricklaying and plumbing work)6 units in series160 m3/week3.20 × 36.25 × 0.42 m
Constructed wetlands (bricklaying and plumbing work)25 independent units50–100 m3/weekCell size: 25 × 1.7 × 1.2 m
Filling substrates (from below):
30 cm fine gravel (ø = 2–20 mm)
50 cm coarse gravel (ø = 20–40 mm) 10 cm fine gravel
30 cm washed sand
HRT: 3-5-20 days
Phragmites australis (5 plants/m2)
Notes: (*) HRT: hydraulic retention time. The gravels are composed of hydrated carbonates of alkaline and alkaline earth metals.
Table 2. Mean and standard deviation values, percentage of reduction, agronomic dose of application and macronutrients (N-P-K) content per year during autumn (n = 3).
SeasonAutumn
Sample type **RAWSEPDECPURRed (%) ***
Parameter *Mean±SD Mean±SD Mean±SD Mean±SD
pH7.37±0.02a7.55±0.01b7.92±0.03c7.90±0.06c-
EC (ds m−1)15.34±0.13c15.62±0.22c12.77±0.20b12.05±0.26a21
SS (mg L−1)483.3±28.9c366.7±28.9b4.2±3.4a0.0±0.0a100
COD (g L−1)25.67±3.79c17.67±3.21b5.47±0.40a5.15±1.24a80
TN (g L−1)2.13±0.51b1.97±0.41b1.29±0.05ab1.05±0.06a50
NH4+-N (g L−1)1.52±0.04b1.65±0.36b1.00±0.02a0.70±0.05a54
NO3-N (mg L−1)5.87±0.19b6.55±0.11b5.74±0.56b4.26±0.34a27
PO43− (mg L−1)323.7±302.3ab553.2±3.1b78.2±11.4a0.0±0.0a100
K+ (mg L−1)1348.8±51.2d1279.7±3.6c1021.7±1.8b917.2±11.1a32
Cu (mg L−1)0.05±0.01b0.05±0.01b0.04±0.00b0.00±0.00a-
Zn (mg L−1)0.07±0.12a0.08±0.14a0.03±0.05a0.00±0.00a-
1 Agronomic dosage
(L ha−1 yr−1)
79,98286,364131,734161,250
1 N (kg ha−1)170.0170.0170.0170.0
1 P2O5 (kg ha−1)19.3535.717.700.00
1 K2O (kg ha−1)129.9133.1162.1178.2
Notes: (*) EC: electrical conductivity; SS: settleable solids; COD: chemical oxygen demand; TN: total nitrogen; NH4+-N: ammoniacal nitrogen; NO3-N: nitrogen as nitrates; PO43−: phosphates; K+: potassium ion; Cu: copper; Zn: Zinc. (**) RAW: raw pig slurry, SEP: separated pig slurry, DEC: decanted pig slurry, PUR: purified pig slurry. (***) Percentage reduction = 100 − ((PUR/RAW) × 100)); (-) indicates not reduction. Different letters indicate significant differences (p < 0.05) between phase of treatment. 1 Considering the ceiling of 170 kg N ha−1 yr−1 according to Nitrates Directive (91/676/EEC) for vulnerable areas.
Table 3. Mean and standard deviation values, percentage of reduction, agronomic dose of application and macronutrients (N-P-K) content per year during spring (n = 3).
SeasonSpring
Sample type **RAWSEPDECPURRed (%) ***
Parameter *Mean±SD Mean±SD Mean±SD Mean±SD
pH7.39±0.31a7.30±0.31a7.50±0.32a7.86±0.33a −6
EC (ds m−1)8.18±0.35a8.34±0.35a8.27±0.35a7.58±0.35a7
SS (mg L−1)172.7±7.3b276.3±11.7c168.7±7.1b1.0±0.5a99
COD (g L−1)10.56±0.45c19.73±0.83d7.70±0.32b4.64±0.20a56
TN (g L−1)1.37±0.06c2.23±0.09d1.08±0.05b0.59±0.02a57
NH4+ -N (g L−1)0.90±0.04b1.21±0.05c0.86±0.04b0.41±0.02a54
NO3 -N (mg L−1)0.00±0.00a0.00±0.00a0.00±0.00a0.19±0.01b-
PO43− (mg L−1)399.5±16.9c624.5±26.4d132.1±5.6b31.9±1.3a92
K+ (mg L−1)831.2±35.1a831.8±35.1a868.1±36.6a830.9±35.1a0
Cu (mg L−1)0.04±0.00a0.04±0.00a0.05±0.00b0.04±0.00ab-
Zn (mg L−1)0.16±0.01a0.14±0.01a0.19±0.01b0.15±0.01a-
1 Agronomic dosage
(L ha−1 yr−1)
124,36976,328157,330287,452
1 N (kg ha−1)170.0170.0170.0170.0
1 P2O5 (kg ha−1)37.1435.6315.546.86
1 K2O (kg ha−1)124.576.5164.5287.7
Notes: (*) EC: electrical conductivity; SS: settleable solids; COD: chemical oxygen demand; TN: total nitrogen; NH4+-N: ammoniacal nitrogen; NO3-N: nitrogen as nitrates; PO43−: phosphates; K+: potassium ion; Cu: copper; Zn: Zinc. (**) RAW: raw pig slurry, SEP: separated pig slurry, DEC: decanted pig slurry, PUR: purified pig slurry. (***) Percentage reduction = 100 − ((PUR/RAW) × 100)); (-) indicates not reduction. Different letters indicate significant differences (p < 0.05) between phase of treatment. 1 Considering the ceiling of 170 kg N ha−1 yr−1 according to Nitrates Directive (91/676/EEC) for vulnerable areas.
Table 4. Mean and standard deviation values, percentage of reduction, agronomic dose of application and macronutrients (N-P-K) content per year during summer (n = 3).
SeasonSummer
Sample type **RAWSEPDECPURRed (%) ***
Parameter *Mean±SD Mean±SD Mean±SD Mean±SD
pH7.29±0.31a7.30±0.31a7.83±0.04a7.86±0.33a-
EC (ds m−1)9.85±0.42b9.22±0.39b9.36±0.06b7.92±0.73a20
SS (mg L−1)197.3±8.3b444.0±18.7c1.4±2.3a1.0±0.5a99
COD (g L−1)10.75±0.45b29.60±1.25c5.93±1.01a4.64±0.20a57
TN (g L−1)1.71±0.07b2.26±0.10c1.47±0.18ab1.33±0.06a22
NH4+ -N (g L−1)1.10±0.05ab1.26±0.05b0.91±0.16a1.00±0.04a9
NO3 -N (mg L−1)2.05±0.09b2.09±0.09b2.11±0.13b0.19±0.01a91
PO43− (mg L−1)271.2±11.4b620.8±26.2c81.2±35.3a31.9±1.3a88
K+ (mg L−1)910.0±38.4a954.5±40.3ab1077.8±69.5b830.9±35.1a9
Cu (mg L−1)0.16±0.05ab0.08±0.08ab0.05±0.05a0.20±0.01b-
Zn (mg L−1)0.51±0.10a0.29±0.22a0.25±0.21a0.54±0.02a-
1 Agronomic
dosage (L ha−1 yr−1)
99,53275,065115,811127,609
1 N (kg ha−1)170.0170.0170.0170.0
1 P2O5 (kg ha−1)20.1734.837.033.05
1 K2O (kg ha−1)109.186.3150.4127.7
Notes: (*) EC: electrical conductivity; SS: settleable solids; COD: chemical oxygen demand; TN: total nitrogen; NH4+-N: ammoniacal nitrogen; NO3-N: nitrogen as nitrates; PO43−: phosphates; K+: potassium ion; Cu: copper; Zn: Zinc. (**) RAW: raw pig slurry, SEP: separated pig slurry, DEC: decanted pig slurry, PUR: purified pig slurry. (***) Percentage reduction = 100 − ((PUR/RAW) × 100); (-) indicates not reduction. Different letters indicate significant differences (p < 0.05) between phase of treatment. 1 Considering the ceiling of 170 kg N ha−1 yr−1 according to Nitrates Directive (91/676/EEC) for vulnerable areas.
Table 5. Mean and Standard Deviation of manure (n = 3).
Sample TypeManure
SeasonAutumnSpringSummer
* ParameterMean DS Mean DS Mean DS
DM (%)25.80±0.01a30.71±0.10b43.66±1.54c
pH7.57±0.02a7.45±0.05a8.62±0.30b
EC (dS m−1)1.18±0.01a1.31±0.16a2.00±0.07b
TN (g kg−1)3.95±0.01b3.56±0.01a3.72±0.13a
N-NH4+ (g kg−1)1.37±0.00b1.05±0.02a2.54±0.09c
NO3 -N (mg kg−1)4.72±0.13c0.00±0.00a0.28±0.04b
TOC (%)10.56±0.02a10.56±0.26a15.81±0.15b
PO43− (mg kg−1)451.4±2.8b939.4±0.0c84.5±3.0a
K+ (mg kg−1)741.2±4.5c701.0±0.0b0.1±0.0a
Cu (mg kg−1)1.20±0.02b0.15±0.01a1.86±0.07c
Zn (mg kg−1)1.47±0.05b0.42±0.02a0.51±0.02a
Notes: * DM: dry matter; EC: electrical conductivity; TN: total nitrogen; NH4+-N: ammoniacal nitrogen; NO3-N: nitrogen as nitrates; TOC: total organic carbon; PO43−: phosphates; K+: potassium ion; Cu: copper; Zn: Zinc. Different letters indicate significant differences (p < 0.05) between seasons.
Disclaimer/Publisher’s Note: The statements, opinions and data contained in all publications are solely those of the individual author(s) and contributor(s) and not of MDPI and/or the editor(s). MDPI and/or the editor(s) disclaim responsibility for any injury to people or property resulting from any ideas, methods, instructions or products referred to in the content.

