Article

Improving Urban Stormwater Management Using the Hydrological Model of Water Infiltration by Rain Gardens Considering the Water Column

1
Department of Environmental Protection Technologies and Labour Safety, Kyiv National University of Construction and Architecture, Povitrianykh Syl pr., 31, 03037 Kyiv, Ukraine
2
Institute of Civil Engineering, Warsaw University of Life Sciences—SGGW, Nowoursynowska 159, 02 776 Warsaw, Poland
3
Department of Heat-Gas Supply and Ventilation, National University of Construction and Architecture, Povitrianykh Syl pr., 31, 03037 Kyiv, Ukraine
4
Department of Architectural Design of Civil Buildings and Structures, National University of Construction and Architecture, Povitrianykh Syl pr., 31, 03037 Kyiv, Ukraine
*
Author to whom correspondence should be addressed.
Water 2024, 16(16), 2339; https://doi.org/10.3390/w16162339
Submission received: 15 July 2024 / Revised: 16 August 2024 / Accepted: 18 August 2024 / Published: 20 August 2024

Abstract

:
Implementing rain garden (RG) designs is widespread worldwide to reduce peak flow rates, promote stormwater infiltration, and treat pollutants. However, inadequate RG design degrades its hydrological behaviour, requiring the development and validation of an appropriate hydrological model for the design and analysis of structures. This study aimed to improve a hydrological infiltration model based on Darcy’s law by taking into account the height of the water column (HWC) at the surface of the RG and the filtration coefficients of soil materials. The model was tested by simulating the hydrological characteristics of a rain garden based on a single rain event of critical intensity (36 mm/h). Using the validated model, design curves were obtained that predict the performance of the RG as a function of the main design parameters of the structure: water column height, ratio of catchment area to structure area, layer thickness, and soil filtration coefficient. The hydrological efficiency of the RG was evaluated in terms of the time of complete saturation, filling of the structure with water, and determining the change in HWC caused by changes in the parameters. The filtration coefficient and thickness of the upper and intermediate infiltration layers of the RG are the main parameters that affect the depth of saturation of the layers of the structure and the HWC on the surface. The model is not very sensitive to the model parameters related to the lower gravel layer. If the top layer’s thickness increases by 10 cm, it takes longer to fill the structure with water, and the HWC on the surface reaches 0.341 m. The rain garden’s performance improves when the filtration coefficient of the top layer is 7.0 cm/h. Complete saturation and filling of the structure with rainwater do not occur within 7200 s, and the water column reaches a height of 0.342 m at this filtration coefficient. However, the rain garden’s effectiveness decreases if the filtration coefficient of the upper and intermediate layers exceeds 15 cm/h and 25 cm/h, respectively, or if the catchment area to RG area ratio decreases to values below 15. The modelling results confirm that considering the HWC in RG hydrological models is essential for designing structures to minimise the risk of overflow during intense rainfall events.

1. Introduction

Stormwater management measures and practices, also known as Sustainable Urban Drainage Systems (SUDS) [1], Low Impact Development (LID) and Low Impact Urban Design and Development (LIUDD) [2], Best management practices (BMPs) [3], Water Sensitive Urban Design (WSUD) and Nature-based solutions (NbS) [4], are technical elements designed to prevent and mitigate the negative effects of uncontrolled stormwater flow (urban flooding or excessive combined sewer overflows) in the urban environment [5]. A common feature of all these approaches is decentralised (or local) stormwater management using processes typical of the natural water cycle (e.g., infiltration, retention), which simultaneously provides ecosystem services and additional benefits to the city [6]. Another well-known concept is the use of advanced environmental engineering structures called green infrastructure (GI) [7]. GI combines traditional engineering design with natural elements to develop solutions that reduce environmental impact. We are focusing on a special type of green infrastructure—rain gardens. These are simple, inexpensive, and effective solutions for sustainable rainwater management. In a city’s green infrastructure system, rain gardens are the last link before water is discharged into the storm sewer system, and they take on the greatest responsibility after systems such as green roofs and permeable pavements [8]. With a properly designed rain garden, the downpipes of buildings can be disconnected from the sewer system, directing the outflow directly to the rain garden. However, an improperly designed rain garden can cause problems. To prevent such issues, several tools, guides, and instructions have been developed to describe the project steps, as well as models to predict negative consequences.
Rain gardens (bioretention) are systems used to capture and filter stormwater runoff from various small drainage areas such as car parks, city roads, motorways, and buildings in urban areas [9]. The water entering the system infiltrates into the surrounding soil (and ultimately into groundwater aquifers), drains into receiving waters (for systems with underground drainage), and is absorbed by plants through evaporation and transpiration (ET) [10]. RG systems have been widely accepted in the engineering community due to numerous field and laboratory studies that demonstrate a significant reduction in the volume of rainwater runoff from the catchment area, a reduction in the speed and delay of peak flows in the sewer system, groundwater recharge through infiltration, and the removal of pollutants from water before it enters local watercourses [11]. The effectiveness of reducing the volume of runoff and reducing the rate of peak runoff by RGs has been documented in scientific papers from around the world: in Poland [12], Serbia [13], Japan [14], the USA [15], Thailand [16], Brazil [17], China [18], Indonesia [19], Sweden [20], and Norway [21], ranging from 50 to 98% for different studies.
A typical RG design includes the following components (from top to bottom): a plant layer (a depression area to collect water from the surface), a soil layer for planting, an intermediate infiltration layer (usually sand), a gravel drainage layer, and, if necessary, an overflow hole and additional drainage (using a perforated pipe) [22]. A layer of mulch made of shredded hardwood, 5 to 8 cm thick, which decomposes on the surface, can also be considered. This layer is designed to preserve the soil moisture and filter the incoming sediment [23]. A critical function of an RG is the ability to increase the rate of rainwater infiltration into the soil environment. Thus, the design and material properties of each layer are important. Various designs have been described in the literature; for example, Australian guidelines [24] recommend the following RG design: 20–30 cm depth of the zone for the formation of a water column, 30 cm topsoil for planting, 40 cm transitional infiltration layer, and 20–30 cm gravel drainage layer. The materials for the top layer are sand and sandy loam, fine gravel or sand for the transition layer, and coarse gravel for the drainage layer. The Wisconsin and Minnesota RG design guidelines recommend using a mixture of 50–85% sand and 15–50% leaf compost by volume [25,26]. The infiltration capacity of the medium generally increases with increasing amounts of sand [27].
Davis et al. [28] point out that the effectiveness of an RG depends on the characteristics of the rain event, the design features of the system, and the processes that take place within the system, such as infiltration.
Infiltration is an important hydrological process that describes the vertical penetration of water into the soil environment of an RG [29]. Typically, the higher the infiltration rate, the higher the effectiveness of the RGs in reducing the volume and velocity of stormwater runoff. Many scientific studies have been conducted on the various factors that affect the infiltration rate in RGs. The main ones are the physicochemical composition of the soil [30] and the thickness of the functional layers of the system [31], their water-holding capacity [32], filtration coefficient (hydraulic conductivity) [33], plant assortment [34], consideration of the HWC on the surface of the system, and the size of the structure [35,36]. Most RG design methods, when considering these key hydrological variables and soil mix properties, are based on assumptions and benchmark data.
One of the key elements of RG design that has received little attention in the scientific literature is the sinkhole on the surface of the RG. The depression zone on the surface of the RG is designed to collect stormwater runoff from the catchment area and rainwater itself during precipitation. This slows down the water flow rate and allows it to penetrate the ground [22]. In this zone, a column of water is formed (Figure 1), the height of which depends on the intensity of the rainfall event and the hydraulic permeability of the system. This parameter is important for predicting the hydrological efficiency of the structure and possible overflow. Overtopping of a structure can occur if the medium is saturated and the shallow depth of the water collection area reaches a maximum height, after which the water begins to overflow [37]. Typically, the depth of the buried zone is designed as a standard in the range of 0 to 60 cm [38]. In addition, a water collection zone is necessary for plant and microbial survival during prolonged dry periods and can create an oxygen-free condition that can facilitate the removal of pollutants [39,40].
In general, there are very few scientific studies or technical feasibility studies to determine the optimal depth of the water column zone. However, an overview of the technical factors that influence the determination and selection of this parameter is important. For example, choosing a depth of 30 cm instead of 15 cm reduces the surface area of the facility by 50%. Using a depth of 50 cm further reduces the surface area to 25% of the original design, which significantly affects the economic component of the system [41]. On the other hand, choosing a depth of 30 cm with a 45 cm high water column will lead to an overflow of the structure. At the same time, it is unknown how long the stormwater remains in the system and when it is completely removed. Some studies show that a greater depth of the immersion zone, for example, 0.9 m, can promote the development of healthy vegetation but with a possible increase in undesirable weed species, which in turn allows for an increase in storage volume [42]. Thus, the choice of the optimal size of the burial zone is a critical factor, and neglecting it can lead to the irrational design of RGs and reduce their efficiency.
Recently, numerous advanced software programs have been created to aid in designing RG structures by numerically modelling the characteristics of the system. Modelling is an important tool in infiltration research, as it allows for predicting and evaluating the infiltration properties of systems operated under different regional conditions and can scale local impacts to larger catchment areas [43]. In addition, modelling techniques allow for the detection of any deviations in the system at the initial stages of their design and the necessary adjustments to be made while continuing to analyse the physical properties of the site [44]. Models can be based on processes and parameters obtained from laboratory studies, allowing for a better understanding of the hydrological behaviour of RGs in the field.
Modelling is a common approach in hydrological research. Event-based simulations allow analyses of natural or modelled rainfall events of different scales. In turn, modelling uses a time series of precipitation data for simulation, which allows for the assessment of the time intervals between events and their relationship with other modelled outputs. There are many models of the infiltration process and hydrological behaviour of RGs, the characteristics, advantages, and disadvantages of which have been described in previous studies [10,45]. The most common single-site hydrological models include Regarga, Drainmod, Hydrus, Music, and SWMM.
All models of water infiltration in RG soil media can be categorised into three main types: empirical, Green-Ampt, and Richards equation [46]. Examples of empirical models are the modified Kostyakov equation [47] and Horton equation [48]. Empirical models usually have a simple form and are not based on fundamental physical principles. The parameters of the equations are calibrated by inputting the actual measured infiltration data. The applicability of empirical models is limited by the conditions under which they were calibrated, such as the initial amount of water in the soil. The original Green-Ampt equation [49] was the first approximate mechanistic model of the infiltration process for a homogeneous soil medium with a uniform initial water content. Although originally developed for idealised conditions (homogeneous soil and constant surface water level), the Green-Ampt model has been extended to address a variety of hydrological problems in practice. The Richards equation [50] is a classic physical basis for describing water flow in unsaturated soils. Its application requires a significant number of calculations and complex soil parameters that determine unsaturated hydraulic properties. In addition, the Richards equation has several assumptions and limitations [51]: the soil is considered as a homogeneous inert porous material; water movement is taken into account only in the liquid phase; air circulation in soil pores, temperature, and osmotic gradients are not taken into account; the effect of water absorption by plant roots is ignored; and there is no preferential flow.
Several studies [45,52,53] on the infiltration performance of RGs have used the method of modelling soil infiltration based on Darcy’s law. In 1856, Darcy found that the infiltration rate is positively correlated with the filtration coefficient of the soil medium and the cross-sectional area perpendicular to the direction of infiltration and inversely proportional to the remote infiltration when water passes through a saturated layer of the medium. Thus, when using Darcy’s law to model the dynamic process of infiltration in an RG design, the main parameter is the hydraulic permeability or filtration coefficient of soil mixtures.
Within the RGs, the infiltration process can occur with or without the presence of surface water column zones, with a saturated or unsaturated intermediate infiltration layer, as well as with percolation and/or subsurface flow in the lower part of the system. Therefore, the choice of equations for modelling the infiltration process has a significant impact on the prediction of RG productivity and requires the use of a combination of equations for different flow directions. For example, the Green-Ampt equation is only applicable in the case of high-intensity rain events when a water column zone is formed on the surface of the structure. For low- and medium-intensity rain events, where a water column does not form on the upper part of the RG, modelling changes in the system water content and bottom flow requires additional assumptions and/or equations. Even the most sophisticated equations, such as the Richards equation, require additional equations to account for changes in the water column levels over time, seepage between layers, and the presence of subsurface runoff (if any).
In general, most existing models include the HWC and possible overflow of the RG design when the volume of stormwater runoff exceeds the volume that can be accommodated by the surface water collection area. Drainmod-Urban, Recarga, and SWMM use a simple surface water balance to control changes in water volume in the water column area. Drainmod-Urban uses a groundwater characteristic curve to recalculate the water level in the layers of the system at each time step and to determine if the depth of the water column zone has been filled. SWMM also includes the berm height for RG, including the portion of the volume occupied by vegetation in the berm. In all models, the overflow process (when the water collection area is full) is modelled using a surface water balance, precipitation, and catchment runoff minus infiltration and evaporation at the surface. This is calculated as the water level above the maximum depth of the water column zone for each given time step. Hydrus uses the seepage boundary condition to model water leaving the saturated zone as surface runoff. In GifMod, the water column zone is modelled as a separate block with a constant relationship between the catchment runoff volume and the retained water volume. Music uses a simple spillway equation to describe the flow from the water column zone after the maximum fill depth is reached. However, not all models take into account the interdependence of the water column height and the filtration coefficient parameter. The filtration coefficient is an important design parameter that depends on the characteristics and structure of the medium. The value of the filtration coefficient should be high enough to prevent prolonged stagnation of water on the surface of the RG or overflow of the structure but low enough to ensure that the runoff is cleaned during the contact time [37].
The appropriate range for the filtration coefficient of soil materials in a layered RG structure in a temperate climate is 50 to 200 mm/h [54]. According to recommendations [55], the value of the filtration coefficient of the soil medium for an RG should be in the range of 1.26 to 50.4 cm/h. This range is lower than that of gravel (36 to 36 × 102 cm/h), but comparable to sand (3.6 to 360 cm/h).
In our previous work [45], we developed an infiltration model that takes into account Darcy’s law and allows us to describe the dynamic vertical processes of water movement and saturation of the layers of an RG system at a certain point in time. The accuracy of the improved model was confirmed by calculating the key parameters of the RG design using a real rain episode with extreme rainfall intensity. The main variable parameters of the model are the water retention capacity and thickness of the construction layers. The filtration coefficient and the water column height parameter are not included in the hydrological model.
The objectives of this study were (1) to improve the infiltration model based on the Darcy equation by considering the HWC and filtration coefficient of the RG soil materials and (2) to predict the performance of the modelled RG structure in terms of infiltration capacity as a function of engineering design parameters such as water column height, structure to catchment area ratio, thickness, and filtration coefficient of soil media.
The scientific novelty of this work is to improve the model that describes the infiltration vertical movement of stormwater and the saturation of a multilayer RG structure with water at a particular point in time, taking into account the HWC and the filtration coefficient. The practical value of this work is to predict the performance of the RG and calculate its main parameters, including the water column, to avoid system overflow during operation.
The study was performed in the following stages: the selection of materials and methods (Section 2), determination of the main parameters of soils through laboratory tests (Section 2.1), carrying out the rainfall event test (Section 2.2), creation (Section 2.3) of the improved hydrological model considering the water column appeared at intensive rains, software implementation of the model using the appropriate algorithm (Section 2.4, Appendix A), validation of the different RG construction, and comparison of the results with the literature data to validate the model.

2. Materials and Methods

2.1. Determination of the Main Parameters of Soil Mixtures

Verification of the correctness of the improved model, which takes into account the water column, requires the introduction of the main parameters of the soil materials of the multilayer structure of the RG. In [45,56], simulation experimental designs of RGs were developed on a laboratory scale, which made it possible to measure the parameters of water retention capacity and filtration coefficients of soil materials necessary for modelling. The soil materials for the study were obtained from an uncontaminated area in one of the districts of Kyiv, where the laboratory is situated.

2.2. Rainfall Event

Modelling the infiltration process in RGs is based on the simulation of rain events to predict the response of the system to changes in rainfall intensity and duration. It is recommended to consider extreme rainfall event scenarios for dynamic parameter analysis when designing RGs. The size of the RG should be designed to retain at least 80% of stormwater runoff [57]. Among the three types of simulations (continuous, single event, and user input), a single event simulation with a rainfall intensity of 36 mm/h was performed to assess the effectiveness of the RG under extreme conditions. The same rainfall event as in the study [45] was used to verify the correctness of the improved model and to investigate the effect of the water column height on the hydrological characteristics of the RG. This event was modelled based on observational data from the meteorological station of the Borys Sreznevsky Central Geophysical Observatory, which recorded the amount of precipitation for the last 16 years in Kyiv (Ukraine) on 22 July 2023, which was 36 mm/h.
The event lasted for 60 min, during which the intensity changed. It initially increased, continued for a while, and then decreased. Therefore, it was necessary to model the unsteady state of the infiltration process from the beginning to the end of the rain event, including the full rise-peak-fall process over time. Modelling infiltration while considering the HWC involves simulating a rain event with varying intensity over time (Figure 2).
The hydrological model developed in this study was implemented in the Scilab software [58].

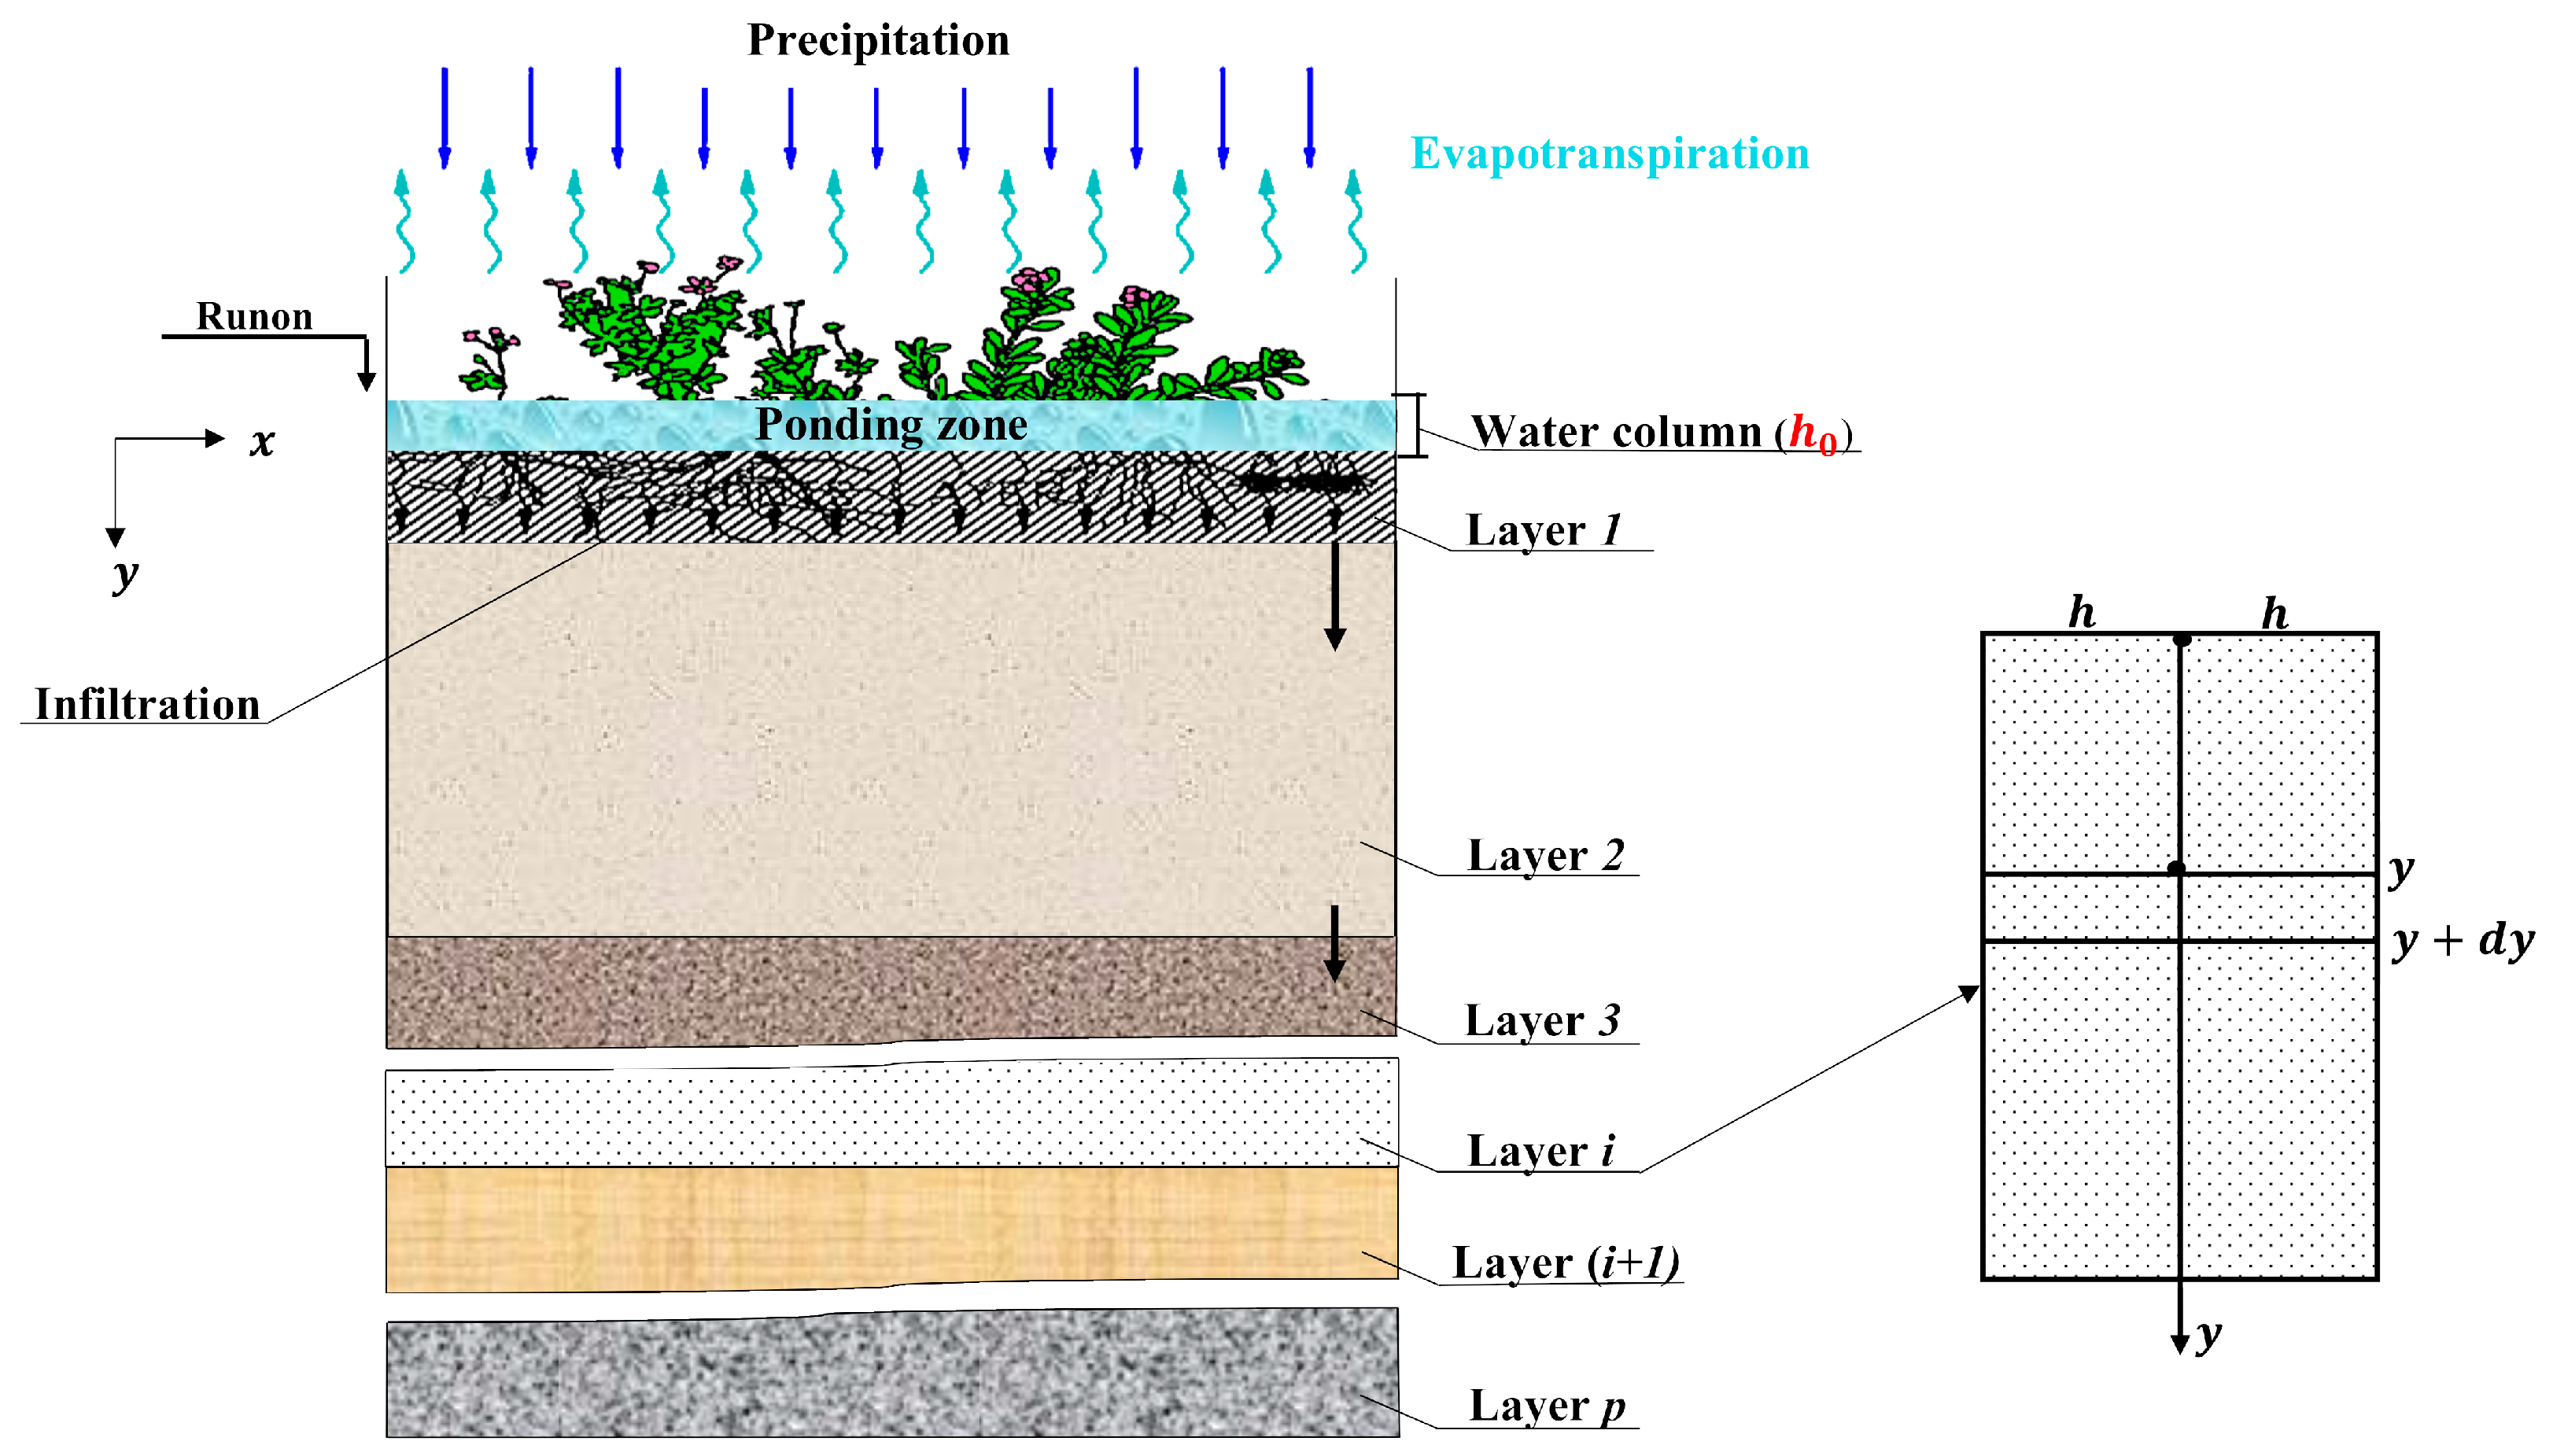
2.3. A Mathematical Hydrological Model Considering the Water Column Height and Filtration Coefficient

To model the process of infiltration inside the RG structure, we will select a separate layer of soil between the levels y and y + d y (Figure 3). Let the area of the catchment basin be A b a s s i n , m2 and the area of the RG be A s p o n g e , m2. During rainfall, water enters the RG structure with an average velocity v r , m/s. On the surface of the RG, there is a depression zone for collecting stormwater, height h 0 , m. The construction area of the RG as a function of height h 0 from the upper level A h o , m2. Between the soil layers, there is initial saturation with water at the level y , m, with an increase in the amount of moisture w , m3/m3 to the saturated state w s a t , m3/m3.
The vertical infiltration flow is described using a filtering coefficient k f i , which varies depending on the soil materials of the multilayer structure:
v = k f y · d h y i d y
Rainwater enters the saturating multilayer structure of the RG according to a system of equations that takes into account the HWC ( h 0 ) in the upper part of the structure:
{ v = v r · A bassin A sponge d ( h 0 · A ho ) A sponge · d r , y < y i v · d τ = w ( y i ) · d y , w ( y i ) < w sat , y = y i v = 0 , y > y i
Given system (2), we obtain the interpretation of Darcy’s law:
v r · A b a s s i n A s p o n g e d h o · A h 0 A s p o n g e d τ · d y = k f y · d h y
We integrate the equations of infiltration and saturation from the top surface of the system to the level of y i :
A b a s s i n A s p o n g e · 0 τ v r · d τ 0 h 0 · A h 0 A s p o n g e d h 0 · A h 0 A s p o n g e = 0 y i w s a t · d y i +   + w s a t , m · y i j = 1 m 1 δ j
Or
A b a s s i n A s p o n g e · 0 τ v r · d τ h 0 τ · A h 0 τ A s p o n g e = 0 y i w s a t · d y i = j = 1 m 1 w s a t , j · δ j + w s a t , m · y i j = 1 m 1 δ j
Hence, we determine the position y i at time τ , taking into account the height h 0 on the surface of the structure:
y i τ = A b a s s i n A s p o n g e · 0 τ v r · d τ h 0 τ · A h 0 τ A s p o n g e j = 1 m 1 ( w s a t , j · δ j ) w s a t , m + i = 1 m 1 δ j
Any multilayer structure can be represented as a single-layer structure with a variable saturation function w s a t y , in which case the sum i = 1 m 1 δ j loses its meaning, and Equation (6) takes on the form:
y i τ = A b a s s i n A s p o n g e · 0 τ v r · d τ h 0 τ · A h 0 τ A s p o n g e w s a t y
For convenience in engineering calculations, it is advisable to adopt a spatial grid that corresponds to the layers of the structure. Then, Equation (7) can be used as a simpler version of Equation (6).
Given the HWC and the filtration coefficient, we integrate Darcy’s law:
v r · A b a s s i n A s p o n g e d h o · A h 0 A s p o n g e d τ = k f y · d h d y
Integrating the head loss between levels y a and y b , we obtain:
Δ h y b y a = v r · A b a s s i n A s p o n g e d h o · A h 0 A s p o n g e d τ · j = 1 n a δ j y a k f , n 1 + j = n a + 1 n b 1 δ j k f , j + y b j = 1 n b 1 δ j k f , m
To integrate from the free surface y a = 0 to the current level y b = y in the current layer n :
h y 0 = v r · A b a s s i n A s p o n g e d h o · A h 0 A s p o n g e d τ · j = 1 n 1 δ j k f , j + y j = 1 n δ j k f , n
Bernoulli’s equation between levels y a and y b for the zero level at y b :
y b y a + p c y a ρ g + v 2 2 g = p c y b ρ g + v 2 2 g + Δ h y a y b
Taking into account the excess static pressure in the structure, we have
y b y a + p c y a ρ g + v 2 2 g = p c y b ρ g + v 2 2 g + Δ h y a y b
Considering Bernoulli’s equation for the layer below the upper level of the water column h 0 , where the static pressure at y = 0, we have:
p c 0 ρ g + v r 2 2 g = h 0 + v r 2 2 g
Using Equation (13):
h 0 = p c 0 ρ g
The process of infiltration from the upper boundary y a = 0 to the current coordinate of the structure y b = y will be described:
y + h 0 = p c y ρ g + Δ h 0 y
We substitute (10) into (15) and obtain the following:
y + h 0 = p c y ρ g + v r · A b a s s i n A s p o n g e d h o · A h 0 A s p o n g e d τ · j = 1 n 1 δ j k f , j + y j = 1 n δ j k f , n
At the level y = y i , there is no water, and the overpressure in the section y is zero. Then:
y i + h 0 = v r · A b a s s i n A s p o n g e d h o · A h 0 A s p o n g e d τ · j = 1 n 1 δ j k f , j + y i j = 1 n δ j k f , n
Hence, under the assumption of instantaneous water absorption at a negative value h 0 :
h 0 = m a x v r · A b a s s i n A s p o n g e d h o · A h 0 A s p o n g e d τ · j = 1 n 1 δ j k f , j + y i j = 1 n δ j k f , n y i , 0
If the multilayer structure is completely saturated with water, the rate of its discharge to the drainage system can be determined according to the following equation:
v o u t = v r · A b a s s i n A s p o n g e d h o · A h 0 A s p o n g e d τ
Water leakage from the RG structure Q o u t (m3/s) will be defined as:
Q o u t = v r · A b a s s i n A s p o n g e d h o · A h 0 A s p o n g e d τ · A s p o n g e
According to the proposed model, the infiltration process will occur when there is an inflow of water or a water column level on the surface of the RG.
Taking into account Equation (18), Equation (7) can be written in the form
y i , l + 1 = A b a s s i n A s p o n g e · τ l τ l + 1 v r · d τ h 0 τ l + 1 · A h 0 τ l + 1 A s p o n g e + h 0 τ l · A h 0 τ l A s p o n g e w s a t y l
The infiltration process will continue until the multilayer RG structure is completely saturated and filled with water.

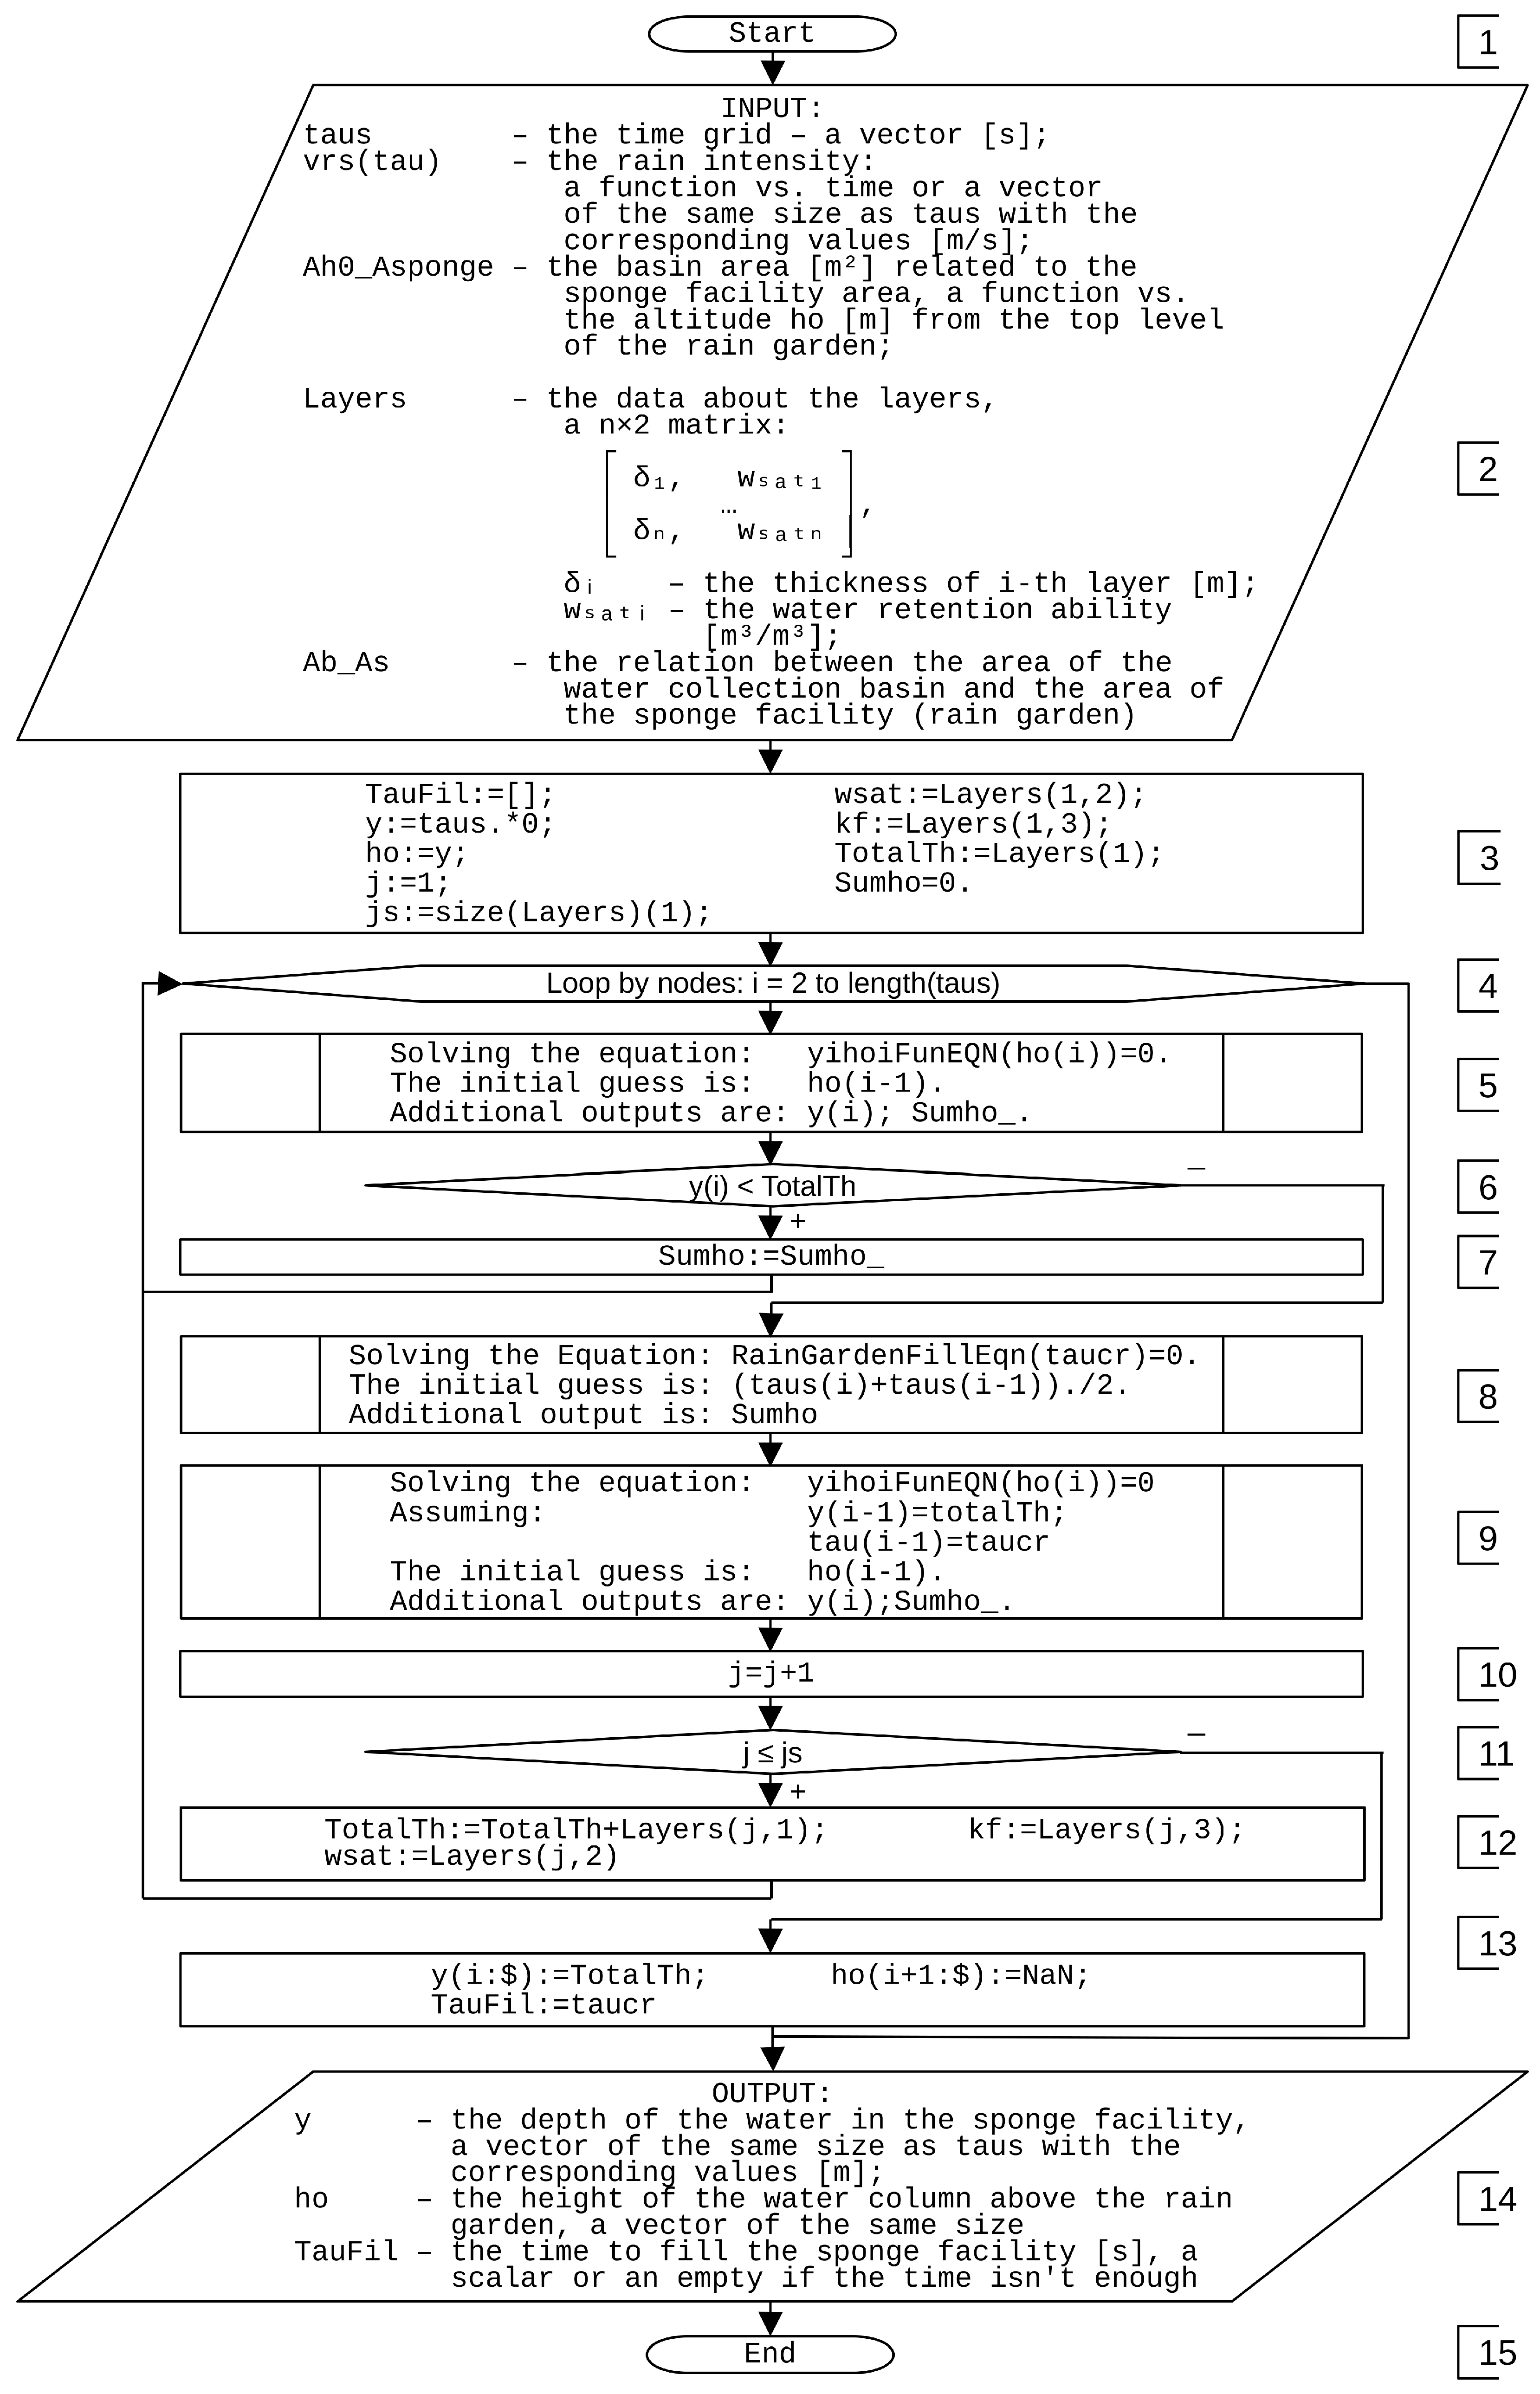
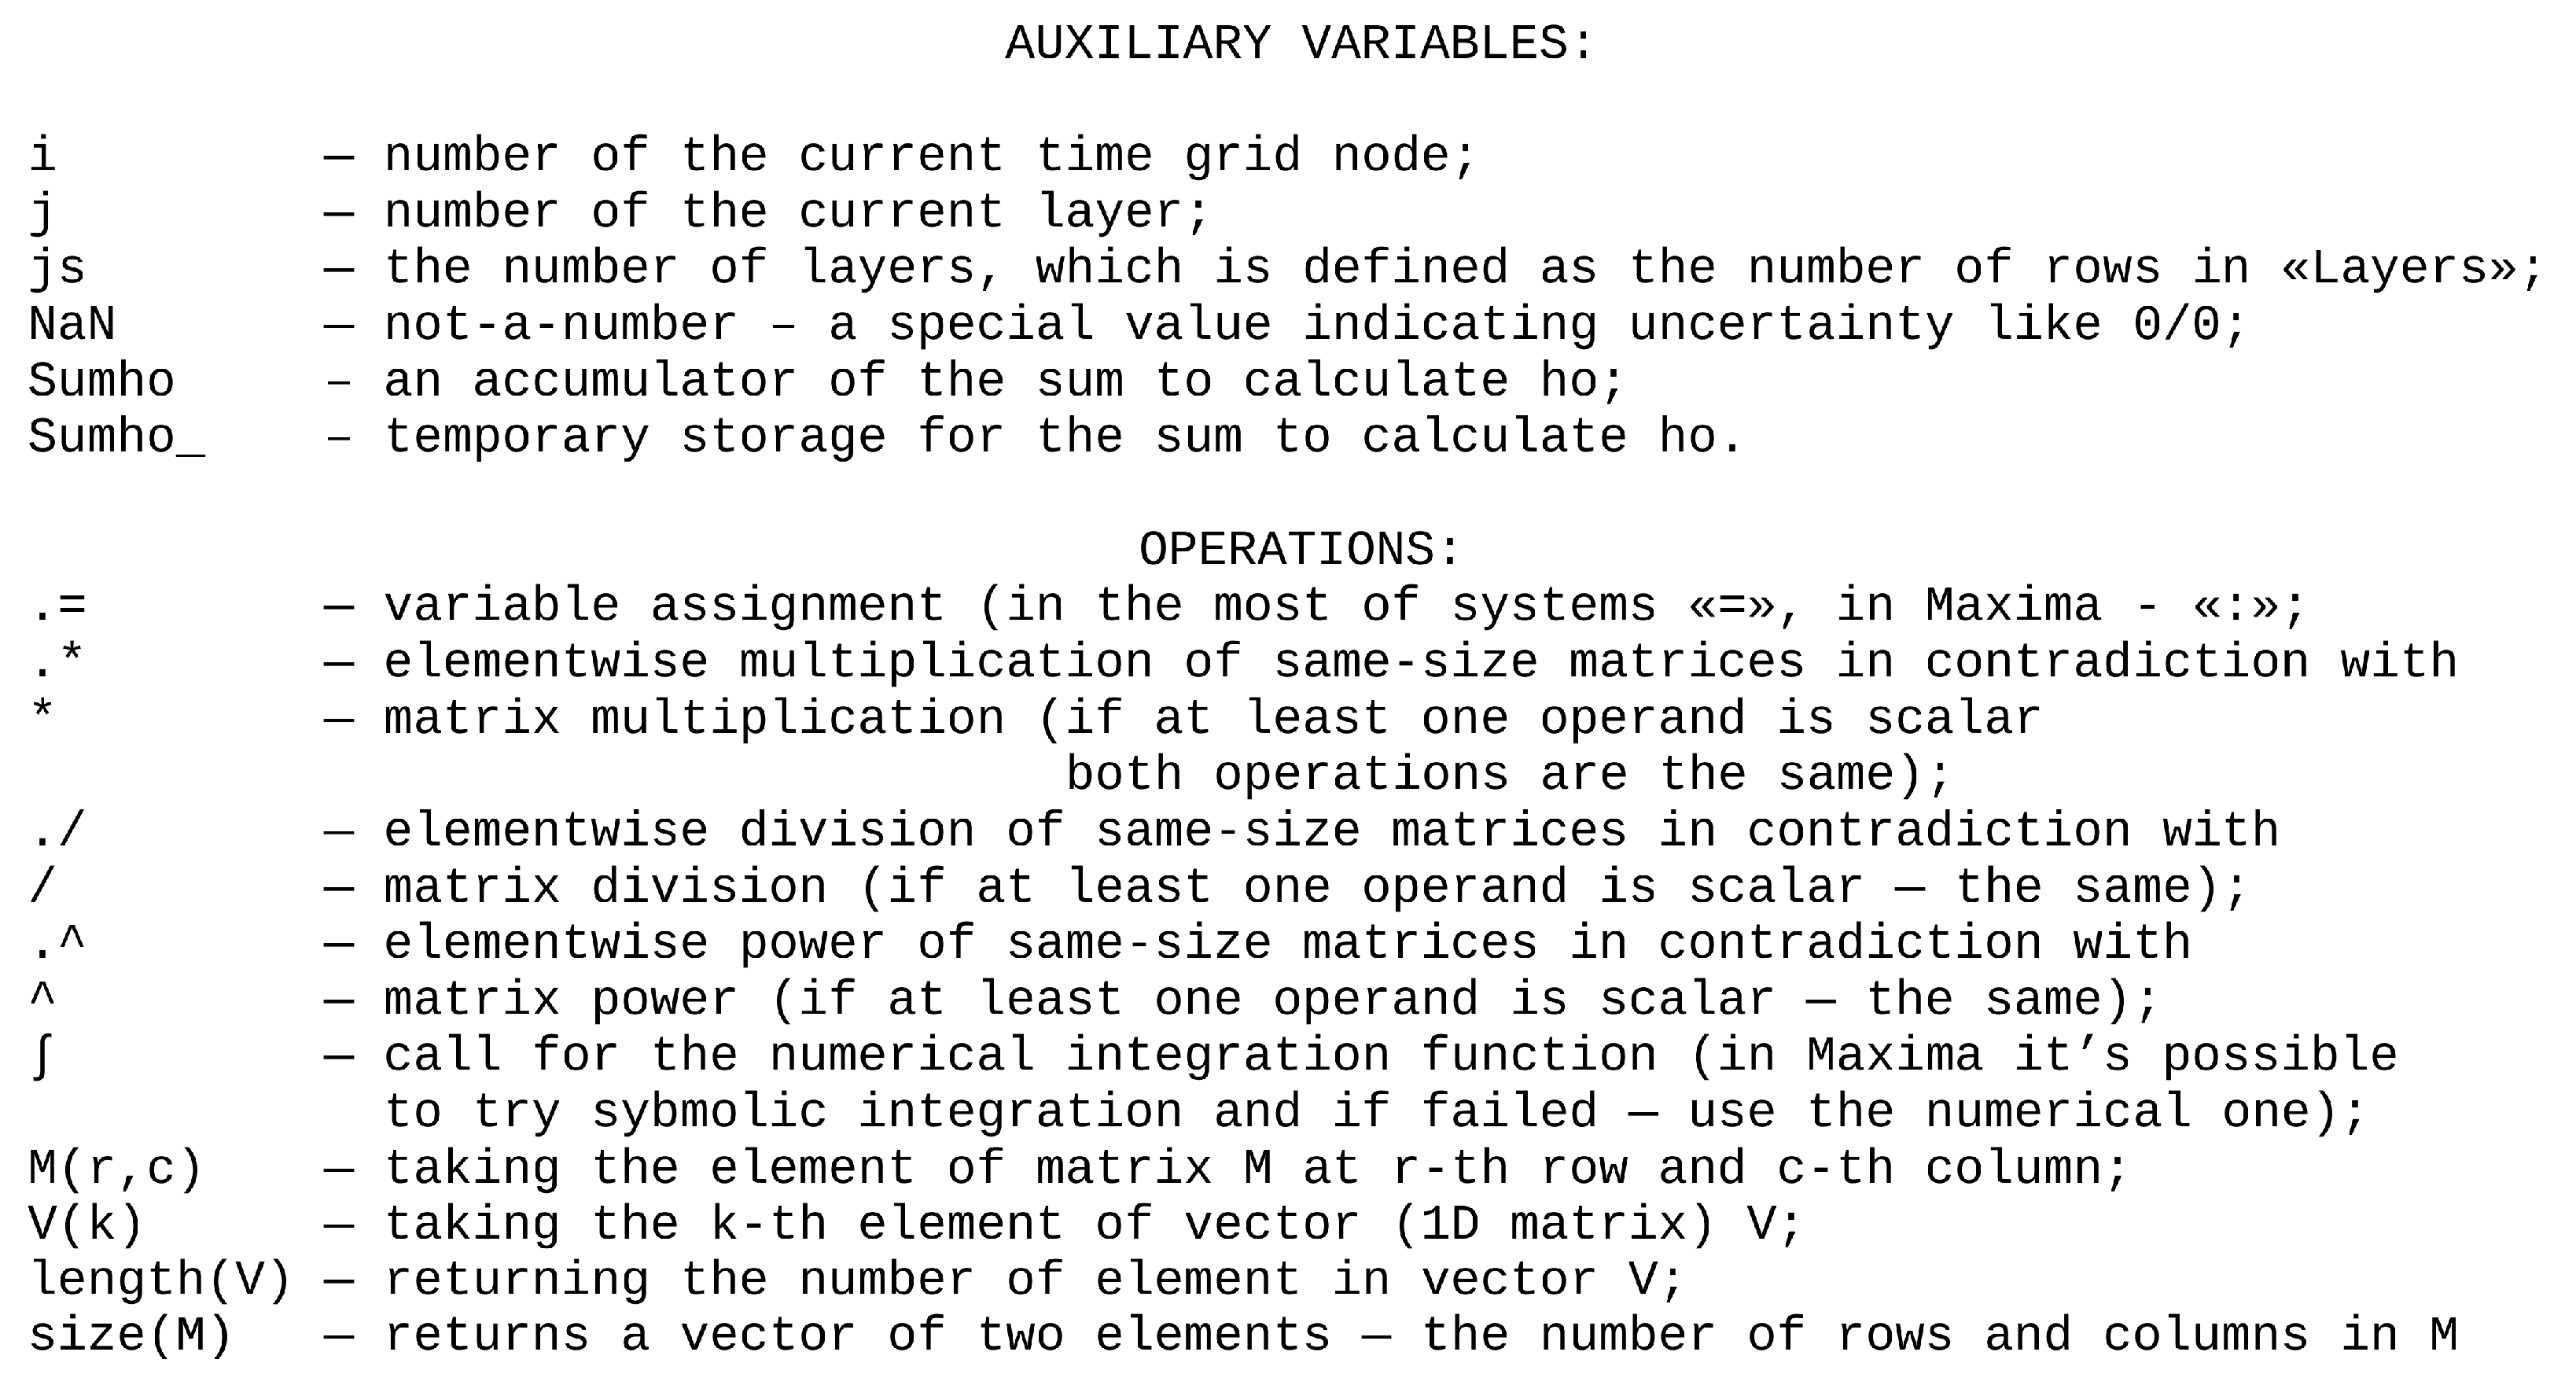
2.4. Algorithm and Software

After starting the execution of block 1 of the algorithm (Figure A1), enter the parameters listed and described in block 2. In this case, all data should be obtained by the CI system; the filtration coefficient in cm/h should be divided by 360,000 (m/s)/(cm/h). Block 3 involves the initialisation of the results and service functions. The time allocated for filling is too short to fill the structure. We start the modelling process from the outermost level of the surface of the multilayer structure (y = 0). The first layer, from which the system starts to be filled with water, is assigned a layer number j = 1. The number of positions in the Layers matrix block corresponds to the number of layers in the system. Read the water retention capacity wsat and the filtration coefficient kf, m/s, from the Layers matrix block for the first layer since j = 1. Given the presence of water in the first layer of the system, we considered its thickness as a general parameter. We also need to reset the sum accumulator to zero to calculate the HWC Sumho. The iteration starts at the points of the time grid (block 4). Given that, at the beginning of the process, the system is dry, and the first point corresponds to a depth value of y = 0, we start the cycle from the second point. The solution of Equation (7) (block 5) corresponds to the depth of saturation at point y(i). To solve this equation, we create the A-E block using the fsolve function in the Scilab system. Due to the need for additional checking in block 6, the updated value of the sum for calculating the HWC is returned to the additional buffer Sumho_. This is provided by the A–F unit. To ensure that the boundary of the current layer is not crossed, block 6 must be involved. When the indicator is “+”, you can write the amount calculated in block 5 to the corresponding disk (block 7) and continue the cycle for the next node in the time grid (block 4).
When encountering a layer boundary “−”, the equation for the depth of total water saturation (y) needs to be solved based on the layer’s boundary structure (TotalTh) (block 8). In this case, the accumulated sum Sumho does not take into account the last result in block 5, which turned out to be incorrect. The equation is solved for HWC τ(i), m, at which the water crosses the layer boundary. In this method, the initial approximation is the average between the time of the current point (tau(i)) and the time of the previous point (tau(i − 1)). The equation is solved under the assumption that the previous time node is a virtual time node that corresponds to the time taken to cross the layer boundary. For this node, the water saturation depth y(i − 1), m, corresponds to the layer boundary (TotalTh), and time (tau(i − 1)) corresponds to the specified time taucr. It does not allow the actual replacement of values in the previous node, which most solvers (including fsolve) allow by passing the appropriate input data. The equation can be solved in the same way.
If registration block 11 indicates that complete filling of the structure has not been achieved (“+”), the next step must be modelled. The next layer is added by taking into account its thickness to the total depth of the layers of the system that are saturated with water (Block 12). In the same block, read the water-holding capacity wsat and the filtration coefficient kf, m/s, from the Layers matrix for the new current layer. Next, move to the next step of the time grid in the cycle (Block 4). The time it takes for the system to completely fill corresponds to the critical time it takes to cross the boundary of the last layer. Since the hydrological characteristics of the layers are unknown, it is impossible to calculate the HWC. Fill with non-numeric values (NaN).
At the end of the process, the algorithm of the model involves the data describing block 14 and completes its work (block 15). The programme also performs similar actions if all mesh nodes in cycle 4 have been calculated. However, in this case, the time for filling in the structure is not reached, so an empty matrix will be returned (or a non-number, negative number, text (for languages without variable typing), etc. can be returned). The required value should be entered into block 3 instead of an empty matrix “[]”.
The equations in blocks 5, 8, and 9 are placed in two separate subroutines. Consider the first of them, called yihoiFunEQN. After it is launched in block A, the programme receives as arguments all the data described in block B. Then, in block C, it calculates:
-
grid approximation of the derivative of the free area of the horizontal water level at the HWC ho, m
-
analysis of water saturation in the system, m, while modelling the current layer without any constraints;
-
sum for calculating the depth of water saturation of the structure;
-
is the inviscid equation for the HWC, m;
During the solution of the equations, this deviation will decrease to a minimum value approaching zero. The function returns the deviation (block D) along with other necessary intermediate results, as specified in block D. After execution, the function returns to the starting point of the call (block E).
Consider the second subroutine called RainGardenFillEqn. After it is launched in block α, the programme receives the same data as the previous one as arguments (block β). Next, the previous equation is solved for block γ. The viscosity is calculated in block δ as the difference between the result of solving the equation and the total thickness of the layers with water. This function returns the deviation, along with the updated sum (block ε). After this execution, the function returns to the starting point of the call (block ζ).

3. Results

Using the experimental data obtained in [45,56], the following values of the RG parameters were adopted in the modelling:
  • topsoil layer: w s a t 1 = 0.33 m3/m3; k f 1 = 7.0 cm/h;
  • intermediate/infiltration sand layer: w s a t 2 = 0.31 m3/m3; k f 2 = 45.0 cm/h;
  • lower gravel layer: w s a t 3 = 0.1 m3/m3; k f 3 = 200.0 cm/h.
In [45], the hydrological efficiency of the RG design was simulated using the developed infiltration model and Scilab software (version 2024.0.0) without considering the HWC. We investigated the impact of changing the thickness of layers in a system with constant water-holding capacity of soil materials (0.33/0.33/0.1 m3/m3) and given layer thickness (0.4/0.5/0.3 m) on construction efficiency. We determined the optimal area ratio that allows the multilayered structure of the RG to fully retain the volume of stormwater at the intensity of precipitation embedded in the model. It was found that the intermediate infiltration layer is a key factor affecting the degree of infiltration of the system. Adjusting the thickness of the intermediate infiltration layer allows you to modify the ratio of areas, thereby impacting the RG s‘ productivity and stormwater management efficiency. We improved the hydrological model by considering the water column height. This allowed us to derive new relationships between the saturation depth of the RG over time while taking into account the filtration coefficients of the soil materials in the structure layers (Figure 4b). The upper half of the coordinate axis shows curves corresponding to the HWC on the surface of the RG structure, and the lower half shows the saturation curves of all layers of the structure. According to the results of laboratory tests, the filtration coefficients of the three layers of the laboratory installation—natural soil, river sand, and gravel are 7.0, 45.0, and 200.0 cm/h, respectively. A comparison of the results of modelling the infiltration behaviour of RGs with and without HWC with the same design parameters shows a significant difference. As depicted in Figure 4a, the multilayer structure is fully filled with an area ratio of 10.2 within a time of τ = 3492.5 s. At the same time, the area of the structure is 9.8% of the catchment area, which is an effective indicator according to the recommendations [59] and suggests a range of 5–10%. The modelling results, taking into account the HWC ( h 0 ), show (Figure 4b) that the ratio of areas A b a s s i n A s p o n g e = 10.2, the structure does not fill. The HWC on the surface of the structure is 0.16 m. Full saturation and filling of the structure does not occur even at A b a s s i n A s p o n g e = 15.0, while in the case of not taking into account h 0 , the structure is filled in τ = 2353.5 s. According to Figure 4b, the beginning of the full saturation of the structure, taking into account the 0.38 m burial zone, occurs at A b a s s i n A s p o n g e = 17.5 in a time of τ = 7100.0 s. For comparison, the structure with the same parameters but at h 0 = 0, is filled in a time of τ = 2051.6 s. Full saturation and filling of the structure at h 0 = 0.48 m occurs in 7165 s with an area ratio of 20.
An important conclusion from the results obtained is that improving the hydrological model, taking into account the HWC and filtration coefficient of soil layers, allows the design of RGs with a pre-known value of the depth of the surface zone for stormwater collection. This helps to increase the time it takes for the system to fully saturate and fill with water and helps to avoid overflows and flooding.
Given the constant values of the water-holding capacity (0.33/0.33/0.1 m3/m3) and the filtration coefficient (7/45/200 cm/h) of the soil materials in the RG, the hydrological performance of the structure was calculated by considering the HWC based on the variation in the layers’ thickness. The value of the area ratio in the modelling was taken as constant and equal to 15. The size of the RG should be between 4 and7% of the area of the catchment basin from which the runoff will be collected, as recommended in the guidelines [60]. That is, if the catchment area is 100 m2, then with A b a s s i n A s p o n g e = 15, the area of the RG will be 6.6 m2. The dependence of the water column height on the change in layer thickness was modelled by changing the thickness of the topsoil ( δ 1 ), intermediate infiltration layer ( δ 2 ) and gravel layer ( δ 3 ). Table 1 shows the value of the h 0 and the time τ at which all layers of the structure are completely saturated and filled with water when the thickness of the top layer is changed.
The top layer of soil in the system is a mixture of natural soil, sand, and clay, which serves as a medium for plant growth. The thickness of this layer should be chosen based on the plants’ ability to resist flooding and the soil’s capacity for infiltration. Typically, it ranges from 10 to 40 cm [61].
Figure 5 presents the modelling results in the form of curves showing the change in the saturation depth of the layers of the RG structure and the HWC over time depending on the thickness of the topsoil layer δ 1 , m. Each curve in the figure contains four sections that represent the infiltration process in the corresponding layer of the structure. The first section describes the process of passage and saturation of the upper soil layer (which has a curvilinear character and starts at 0). The second section describes the process occurring in the intermediate layer of the structure. The third section is related to the last gravel layer. The fourth section runs parallel to the x-axis and indicates the complete water saturation of all layers of the structure.
The time required for the complete saturation of all layers of the RG and filling the structure with water increases when the top layer thickness is increased by 10 cm. At a layer thickness of 0.1 m, the complete filling of the structure with water is observed at a time of τ = 4202.5 s. In this case, a column of water 0.262 m high is formed on the surface of the RG. An increase in the layer thickness by 10 cm led to the filling of the structure in 5975 s and an increase in the HWC to 0.321 m. At layer thicknesses δ 1 = 0.3, 0.4, and 0.5 m, the complete filling of the structure is not observed at 7200 s. The height of the pillar on the surface does not increase significantly, and it is 0.338, 0.341, and 0.341 m, respectively. This is consistent with scientific literature, which states that the minimum effective thickness of the topsoil layer in an RG should be 50 cm [62].
The rain garden’s depression zone depth allows for initial stormwater accumulation and vertical penetration, ensuring full structure saturation. The results indicated that HWC below 30 cm, along with a top layer thickness of 0.1 and 0.2 m, resulted in inadequate runoff distribution across the entire surface, decreased efficiency, and reduced time required to fill the system. The authors of [61] reached similar conclusions, indicating that as the depression depth on the surface of the RG increases, the infiltration efficiency increases while the volume of drainage and overflow decreases.
After conducting the simulation, we obtained data on how the productivity of the RG, in relation to the HWC, changes with variations in the thickness of the intermediate (sand) layer δ 2 (Table 2). The thickness of the intermediate layer, as indicated in the literature, usually ranges from 20 to 90 cm [22]. In the course of modelling, we varied the value of δ 2 from 0.2 to 0.6 m in increments of 10 cm.
When testing the developed hydrological model without taking into account the HWC and the filtration coefficient [45], it was concluded that the main layer that affects the hydrological efficiency of the structure is the intermediate infiltration layer. By adjusting the thickness of the intermediate layer in hydrological modelling, while taking into account the HWC and the filtration coefficient, new curves were simulated (Figure 6). The modelling was carried out at constant values of water-holding capacity (0.33/0.33/0.1 m3/m3), filtration coefficient (7/45/200 cm/h) of the soil layers of the RG, and the value of the area ratio A b a s s i n A s p o n g e =15.
The simulation results indicate that the productivity of the RG structure and the HWC change over time in direct proportion to the thickness δ 2 . At a thickness of δ 2 = 2.0 m, complete water saturation and filling of the structure occurs in 4769 s. An increase in the sand layer thickness by 10 cm results in an average 601.25-s increase in the time it takes to fill the structure. At depths of 0.3 m, 0.4 m, 0.5 m, and 0.6 m, it takes 5397 s, 6005.5 s, 6595.5 s, and 7174 s, respectively, to completely fill the structure with water. It is important to note that changing the thickness of the layer only affects the performance of the system inside, while the HWC on the surface remains unchanged and is equal to 0.34 m.
When simulating the RG’s productivity, similar results were achieved when varying the thickness of the lower drainage layer ( δ 3 ), as depicted in Table 3. The gravel layer performs the function of drainage in the RG system. The typical depth of this layer in RGs usually ranges from 20 to 50 cm [61]. In our study, we tested different values ranging from 0.1 to 0.5 m.
The graph of RG performance and HWC over time, depending on the thickness of the gravel layer, demonstrates that this parameter has no influence on the HWC (Figure 7).
When changing the layer thickness δ 3 from 0.1 to 0.5 m, the HWC on the surface of the system remains unchanged at 0.338 m. Changing δ 3 every 10 cm only affects the structure’s performance, increasing by an average of 158.3 s.
These results are consistent with those obtained during modelling in a previous study [45], where it was found that the effect of the thickness of the drainage gravel layer on the parameters of the system is insignificant. This is justified by the significant differences in the values of the water-holding capacity of various soil materials. The gravel drainage layer is intended primarily for the temporary storage and drainage of water accumulated by the RG into the drainage system.
The modelling results show that the thickness of the topsoil layer δ 1 has the greatest impact on the change in the HWC on the surface of the system, compared to the thicknesses δ 2 and δ 3 . This can be explained by the fact that the topsoil layer directly interacts with rainfall, and its properties determine the initial rate of infiltration and water retention on the surface of the structure. In addition, as determined in laboratory conditions, the topsoil medium has a lower filtration coefficient (7.0 cm/h) compared to sand (45.0 cm/h) and gravel (200.0 cm/h). Therefore, as the thickness of the topsoil increases, the time required for water to penetrate this layer increases, resulting in a higher water table at the surface. Changes in the thicknesses of the intermediate and lower layers affect the time required for the system to function fully at a given event intensity. However, these changes do not significantly impact the formation of HWC on the surface. This is because water has already passed through the upper soil layer before reaching the lower layers. Therefore, the relationship between the HWC and the filtration coefficient of the different layers needs to be investigated to ensure that the design parameters of the system can be optimally designed for stormwater management.
There is a shortage of data in the scientific literature regarding the impact of soil media thickness on the change in water column height in RGs. Existing references only mention the influence of substrate thickness on pollutant residence time, number of functional sorption sites, and surface area contributing to HWC, but specific data are lacking [63]. However, research confirms that the thickness of the soil layer controls the system performance. For instance, in a study by Li et al. [62], the impact of soil layer thickness on the effectiveness of RGs was explored. The researchers discovered that a depth of 1.2 m can retain 80% of the water volume, whereas a media thickness of 0.5–0.6 m is only capable of managing 44%. The results of the study by Rezaei et al. [64] show that even a small change in the filtration coefficient or thickness of the layers of a structure significantly affects the modelled stormwater runoff volume. As part of the study [16], two variants of the RG in Thailand were implemented and investigated. The first option was to use a 0.6 m thick topsoil for planting, a 0.3 m thick transition layer, and a 0.4 m thick gravel layer. The second option included a 0.4 m thick topsoil for planting, a 0.7 m thick transition layer, and a 0.2 m thick gravel layer. The materials used for the structures were soil mixed with sandy loam (for the top layer), sand (for the transition layer), and gravel (for the storage layer). The results of the study showed that the rainwater harvesting efficiency was higher in the first variant with a thicker top layer compared to the second variant. However, the second variant was more efficient than the unchanged original soil and many other designs.
The performance of RGs is determined by various factors, including their location, ratio of the structure to the catchment area, thickness of the layers, and filtration coefficient of the soil media [65].
The influence of the filtration coefficient of the soil layers of the RG on the hydrological behaviour of the system and the HWC was investigated using the model improved in this paper. Study how the degree of saturation of the structure changes over time based on the thickness of the layers, simulations were conducted using an area ratio A b a s s i n A s p o n g e = 15. The thickness of the topsoil, infiltration, and gravel layers were 0.4 m, 0.5 m, and 0.3 m, respectively. Table 4 demonstrates how the change in the filtration coefficient of the topsoil layer k f 1 affects the rainwater retention efficiency and the HWC.
In Figure 8, the relationship between the filling time and change in HWC is illustrated based on the filtration coefficient of the upper soil layer. This coefficient ranges from 7.0 to 40 cm/h. It is important to note that the filtration coefficients of the sand and gravel layers remain constant at 45.0 and 200.0 cm/h, respectively.
The greatest increase in the performance of the modelled RG structure is observed at a filtration coefficient of k f 1 = 7.0 cm/h when the structure is not completely saturated and filled with rainwater for 7200 s. However, it is important to note that in this case, the height h 0 reaches the highest value among all the options of 0.342 m. An increase in the value of k f 1 leads to a decrease in HWC, but the performance of the system for a given rain event decreases. For example, at k f 1 = 15.0 cm/h, the h 0 value is 0.257 m, and the structure is filled in 4800 s. On the other hand, the highest value of k f 1 = 40.0 cm/h almost eliminates the HWC ( h 0 = 0.063 m), but the filling time is 2776 s. This highlights the particular sensitivity of RG performance at low k f 1 values (e.g., k f 1 < 15 cm/h).
Our results confirm the conclusions of the authors of [33] regarding the influence of the filtration coefficient of the top layer of natural soil on the time of vertical penetration of rainwater into the structure. According to their data, an increase in the filtration coefficient leads to a reduction in the time of water penetration and filling of the RG.
The material for the intermediate infiltration layer of the RG is sand, for which a filtration coefficient of 45.0 cm/h was determined under laboratory conditions. According to scientific data, the filtration coefficient of sand usually varies in the range of 10–57 cm/h [66], so in our study, we changed this value from 15.0 to 55.0 cm/h.
The results in Table 5 illustrate the relationship between RG design productivity, HWC, and changes in the filtration coefficient of the intermediate infiltration layer ( k f 2 ).
In contrast to Figure 5, which shows a pronounced dependence of hydrological processes, including the formation of a water column on the surface of the RG, on changes in the filtration coefficient of the upper layer, the effect of this parameter on the infiltration layer is insignificant (Figure 9).
The modelling results show that an increase in the value of k f 2 by every 10 cm/h leads to a decrease in the HWC on the surface of the system by an average of 0.007 m and a reduction in the time of filling the system. In extreme cases, with a filtration coefficient of 15.0 cm/h, it takes 4418.5 s to fill the structure with water at a HWC of 0.253 m. At a filtration coefficient of 55.0 cm/h, it takes 3915.5 s to fill the structure, and the HWC is 0.234 m, indicating an insignificant difference.
Thus, the value of the infiltration layer filtration coefficient has an impact on the time of filling and saturation of the RG structure, but this impact is relatively low. An increase in k f 2 leads to a decrease in the HWC on the surface of the structure and a reduction in the filling time of the system. However, the changes in HWC are insignificant, even with a significant increase in the filtration coefficient of the sand layer, indicating that k f 2 has a limited impact on the hydrological behaviour of the system compared to k f 1 .
The determined value of k f 3 in the laboratory was 200 cm/h. The RG design’s productivity dependence on the change in the drainage layer filtration coefficient k f 3 is presented in Table 6, with variable values ranging from 100.0 to 300 cm/h.
In the case of modelling the change in the saturation depth of the RG structure and the HWC over time, depending on the filtration coefficient of the gravel layer k f 3 , the curves for all five different values of k f 3 overlap and have the same character (Figure 10).
An RG model with the dimensions of 0.4 m × 0.5 m × 0.3 m and an area factor of 15 was filled with rainwater in 4045.5 s. This occurred at a filtration rate ranging from 100.0 to 300.0 cm/h. Simultaneously, a water column with a height of 0.263 m was formed on the surface of the system. This means that with the same structural features of the rain garden, the same specified parameters of the water retention capacity of all layers of the system, and the filtration coefficients of the upper and intermediate layers, a change in the filtration coefficient of the lower gravel layer does not affect the infiltration inside the structure. This confirms that the bottom layer functions solely as a drainage layer for water drainage.
The modelling was conducted based on a scenario of heavy rainfall, which represents the maximum precipitation recorded over the past 16 years. The results of the modelling indicated that the rain garden is fully efficient under such extreme conditions. Therefore, it can be inferred that the efficiency of the structure is maintained even with lower rainfall intensity.

4. Discussion

The modelling results show that the hydraulic behaviour, saturation, and filling times of an RG are directly dependent on the buried area on its surface for stormwater collection, as well as on the thickness and filtration coefficient of the soil layers of the structure. Winston et al. [67] observed three RGs built on low filtration coefficient soils in northeastern Ohio. They found that the infiltration rate and soil layer thickness were the main factors determining the volume reduction efficiency. The topsoil has the greatest influence on the infiltration processes within the RG and the HWC, and increasing its thickness and filtration coefficient increases the time to complete the filling of the structure. Our findings are consistent with the results of the modelling, which showed that the filtration coefficient of the top layer of the RG is a key factor affecting the water flow in the system [68]. Beck et al. [69] found that the infiltration mechanism in an RG can be significantly influenced by the filtration coefficient of soil materials, as analysed in the Van Genuchten equation. Other authors [70] modelled the hydrological behaviour of RGs in terms of runoff reduction, groundwater infiltration, retention time, and total treatment volume. The results showed that the filtration coefficient was the most important factor affecting runoff reduction, groundwater recharge, and water retention time in the structure. The results from modelling the performance of an RG in Singapore’s tropical climate using the recharge numerical model [71] revealed that when the filtration rate is below 5.0 cm/h, the model predicts an extended period of saturation and filling of the structure with water, lasting about 20 h. This means that at low values of k f , water infiltration into the soil is slow, and the water remains in the surface zone of the burial for a longer period, which, in our case, corresponds to a higher water column height. In the case of frequent rain events, this pattern will result in the buried area being constantly filled with water, which can increase the risk of mosquito-spread, excessive plant flooding, and soil compaction.
A significant role in describing the hydrological processes in the structure is played by the indentation zone on the surface of the RG, where rainwater collects and forms a column of a certain height. When the amount of rainwater exceeds the depth of this depression, the RG structure overflows with overflow [72]. When the soil infiltration rate reaches the saturated hydraulic conductivity, the ability to retain rainwater inside the RG is limited by the water storage capacity of the surface depression [73]. In addition, the depth of the depression affects the infiltration capacity of the soil [74]. The modelling results of the present work showed that in all cases, the average optimal value of the HWC, at which the RG functions effectively, is 0.34 m, which fully corresponds with Figure 5, Figure 6, Figure 7 and Figure 8. Moreover, the higher the HWC on the surface of the RG, the slower the structure fills. Research by Wang et al. [75] also showed that increasing the depth of the submergence zone (aquifer) can reduce the risk of overflowing RGs and increase the efficiency of the stormwater management system. Such conditions are rare but can be achieved in some unfortunate designs (Figure 4).
In [45], taking into account the change in the HWC in which water accumulates led to a significant change in the obtained dependencies and complication of the calculation algorithm. In particular, while the calculation of the depth of saturation of the structure with water in [45] was reduced to integrating the inflow of rainwater between the grid nodes, in this study, at each step, an equation containing a similar integral is numerically solved. When moving to the next layer, it becomes necessary to numerically solve an equation that contains a nested numerical solution of another equation, which, in turn, contains integration. Such complications are the reason why the water column was not taken into account when developing such models.
As the direct modelling shows, the results of the proposed work coincide with the results of [45] only if the layers can pass all the rainwater without forming a water column. In other cases, the results are significantly different. Thus, the proposed work shows for the first time the limitations of commonly used approaches without taking into account the water column. For high rainfall intensities, the importance of considering the water column in hydrological models of RGs is shown.
The data provided in the literature on the value of the zone depth for the formation of a water column are recommendatory and are not confirmed by the results of experimental studies and modelling. Li et al. [76] proposed an RG depression depth of 150 mm and investigated its ability to remove heavy metals, emphasising its effectiveness. Other authors [40] found that the optimal height of the depressed zone to maintain the functional efficiency of an RG is 100–300 mm. Vegetation guidelines for RGs in southwestern Australia indicate that depression depths are typically less than 300 mm and do not have a significant impact on public safety [77].
The hydraulic performance of the RG and the retention time of stormwater in the structure can be adjusted by changing the filtration coefficient by adding different types of soil mixtures to the layers of the system. For example, sandy loam and sand increase infiltration [78], while high clay content reduces the permeability and pore size of the soil, which reduces the retention capacity of the entire system. In addition, high clay content causes surface cracking during dry weather, which disrupts the hydrological flow of stormwater when the first runoff is collected in the buried area [79]. Various additives are added to obtain the required basic characteristics of the substrate, such as high hydraulic conductivity, sorption capacity, and water retention capacity. Several soil media additives studied in various studies include vermiculite [80], zeolite [81], fly ash [82], perlite [74], and other sorbents [83]. Le Coustumer et al. [84] found that a filter medium containing sandy loam with vermiculite and perlite had a significantly higher initial filtration coefficient than a standard sand medium. However, after 60 weeks, the sandy loam had a statistically lower filtration rate (51 mm/h) compared to systems with compost (174 mm/h) or vermiculite and perlite (196 mm/h).
Many field and laboratory studies have confirmed the influence of vegetation and its roots on changing infiltration within an RG through the creation of macropores [85,86,87]. Archer et al. [88] found that plants with thick roots can form macropores and allow water to infiltrate deeper, resulting in higher hydraulic conductivity. Vegetation can increase infiltration rates by several orders of magnitude higher than those predicted by soil properties alone [89]. The influence of plants on the infiltration process was not taken into account in the improved model, which will be the goal of further research.
The results of the study [90] showed that water retention inside the RG strongly depends on the amount of precipitation during one storm event. It should be noted that the modelling results were obtained for the case of an extreme rain event with an intensity of 36 mm/h. Typically, precipitation of this intensity leads to localised flooding in cities. However, in this case, no flooding was observed because the intense precipitation was short-lived. Therefore, these conditions can make the design parameters of the RG even more productive.
The results of our modelling, along with research by other authors, confirm the importance of studying the functional aspects of RGs in engineering practice. This helps us identify key factors in designing the size and features of the structure, the physical and chemical properties of the soil layers, and the depression zone. Unreasonable sizing of the depression zone can cause the entire system to overflow. The study results are valuable for urban planners, designers, and engineers aiming to incorporate RGs into urban stormwater management strategies. It will be used for the design of the author’s rain-garden bands [91,92].
The upcoming research will centre on creating a numerical model capable of simulating a sequence of rain events and the subsequent drying of the upper layers. This will involve solving a two-dimensional problem that considers both spatial and temporal dimensions and will also require a more comprehensive study of soil rock productivity and infiltration capacity. Furthermore, the study will delve into the impact of plants and root systems on the infiltration process in RGs, specifically focusing on their evapotranspiration activity, which is a crucial element of the water balance. Additionally, research will explore other advantages of RGs, such as their air-cleaning abilities [93,94] and carbon sequestration [95] by plants.

5. Conclusions

  • The enhanced universal hydrological model, which is based on Darcy’s law, effectively simulates the dynamic processes of rain garden layer saturation at a specific time. It takes into consideration the water column height on the structure’s surface. The model’s accuracy was confirmed using Scilab software, which assessed the rain garden’s performance under extreme conditions during a single excessive rainfall event (36 mm/h). The validated model was then used to simulate the water level on the rain garden surface (water column height) and the saturation depth of the structural layers.
  • In our model, the filtration coefficient and thickness of the upper and intermediate infiltration layers of the rain garden are the main parameters that influence the saturation depth of the structure layers and the water column height at the surface. The model is less sensitive to the model parameters associated with the lower gravel layer.
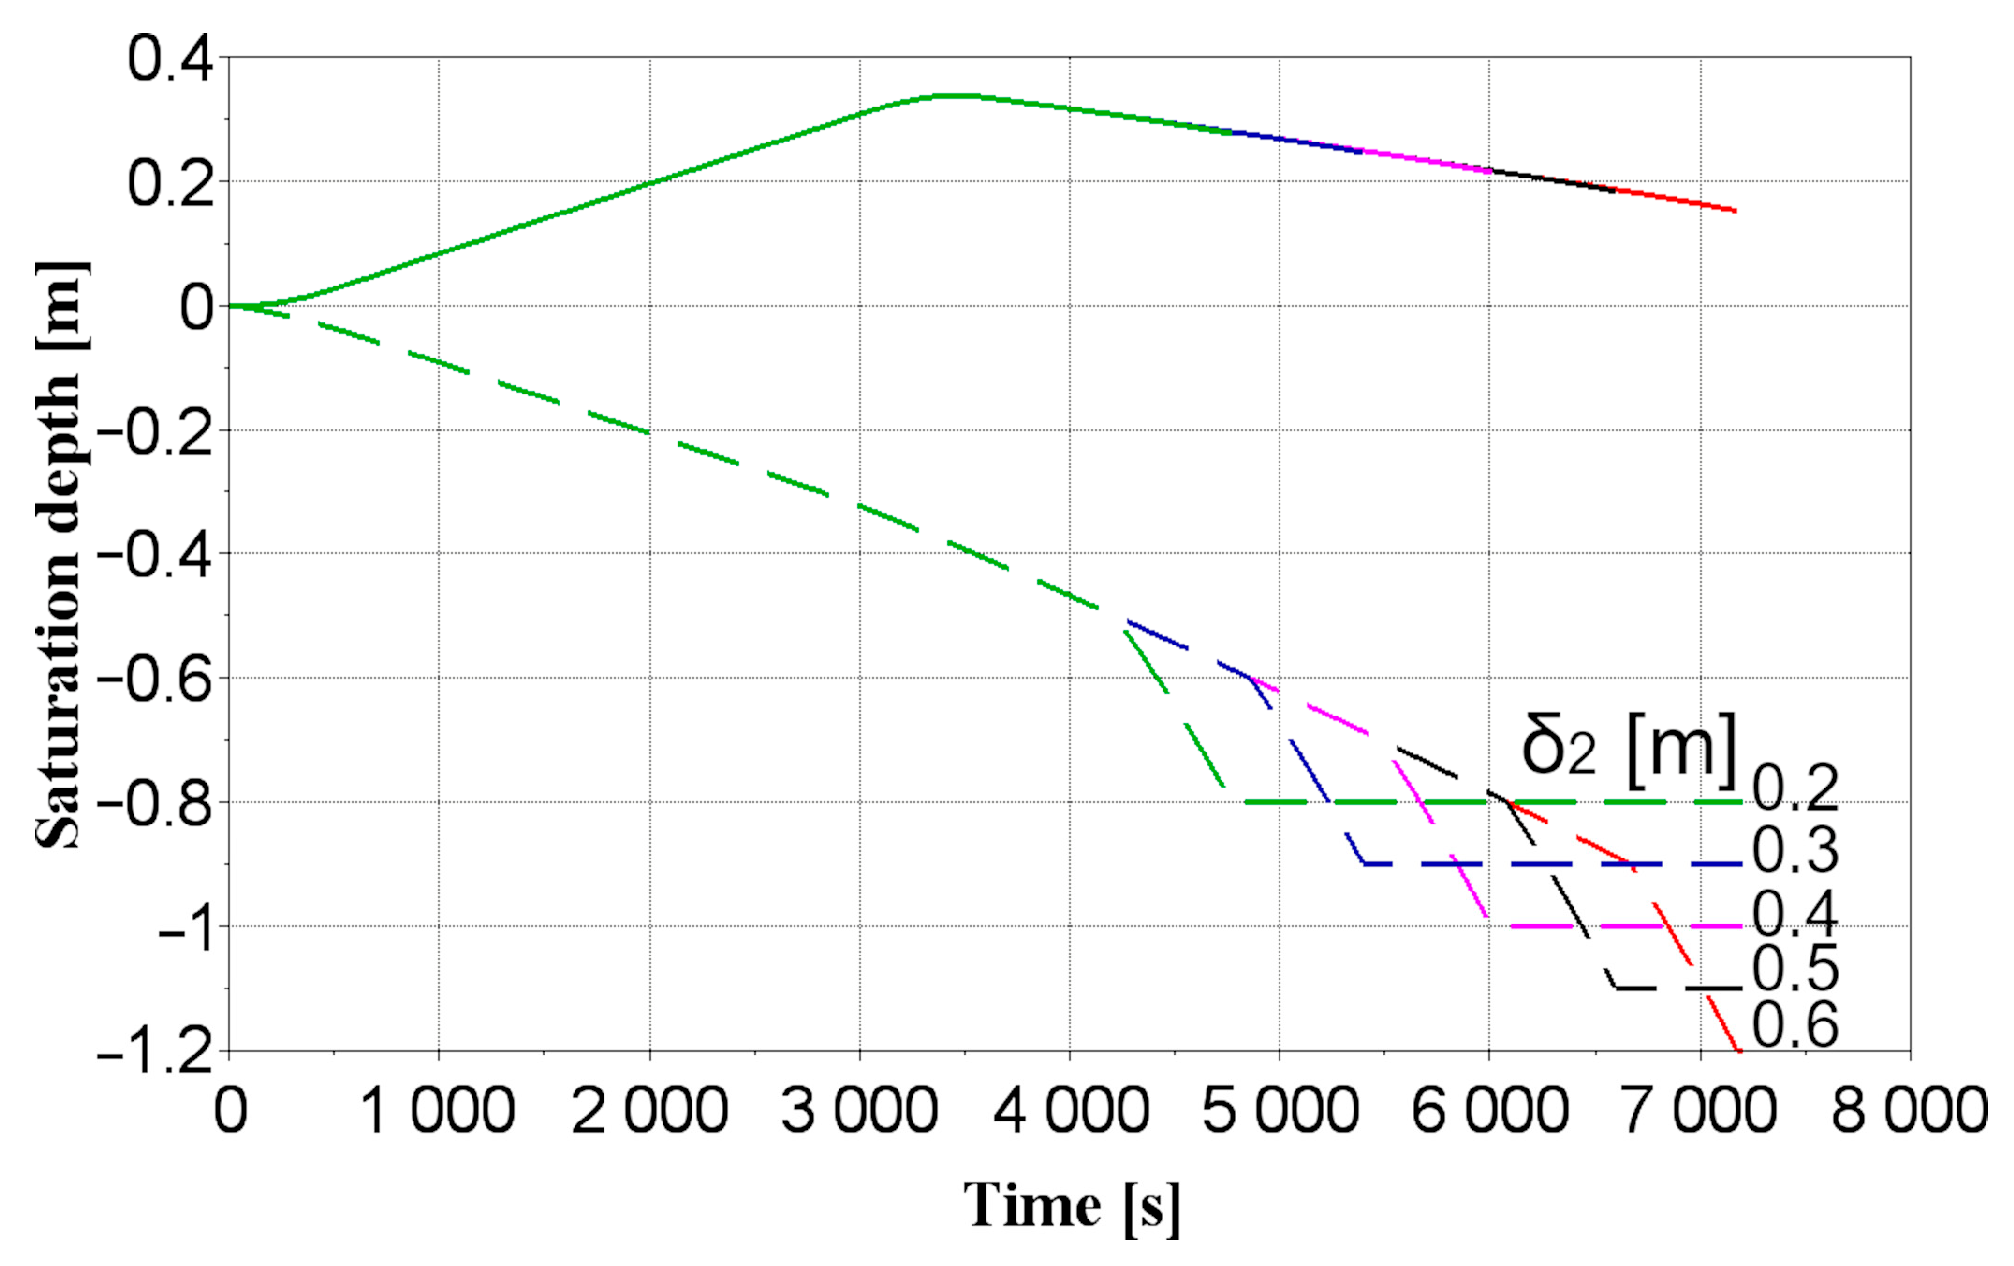
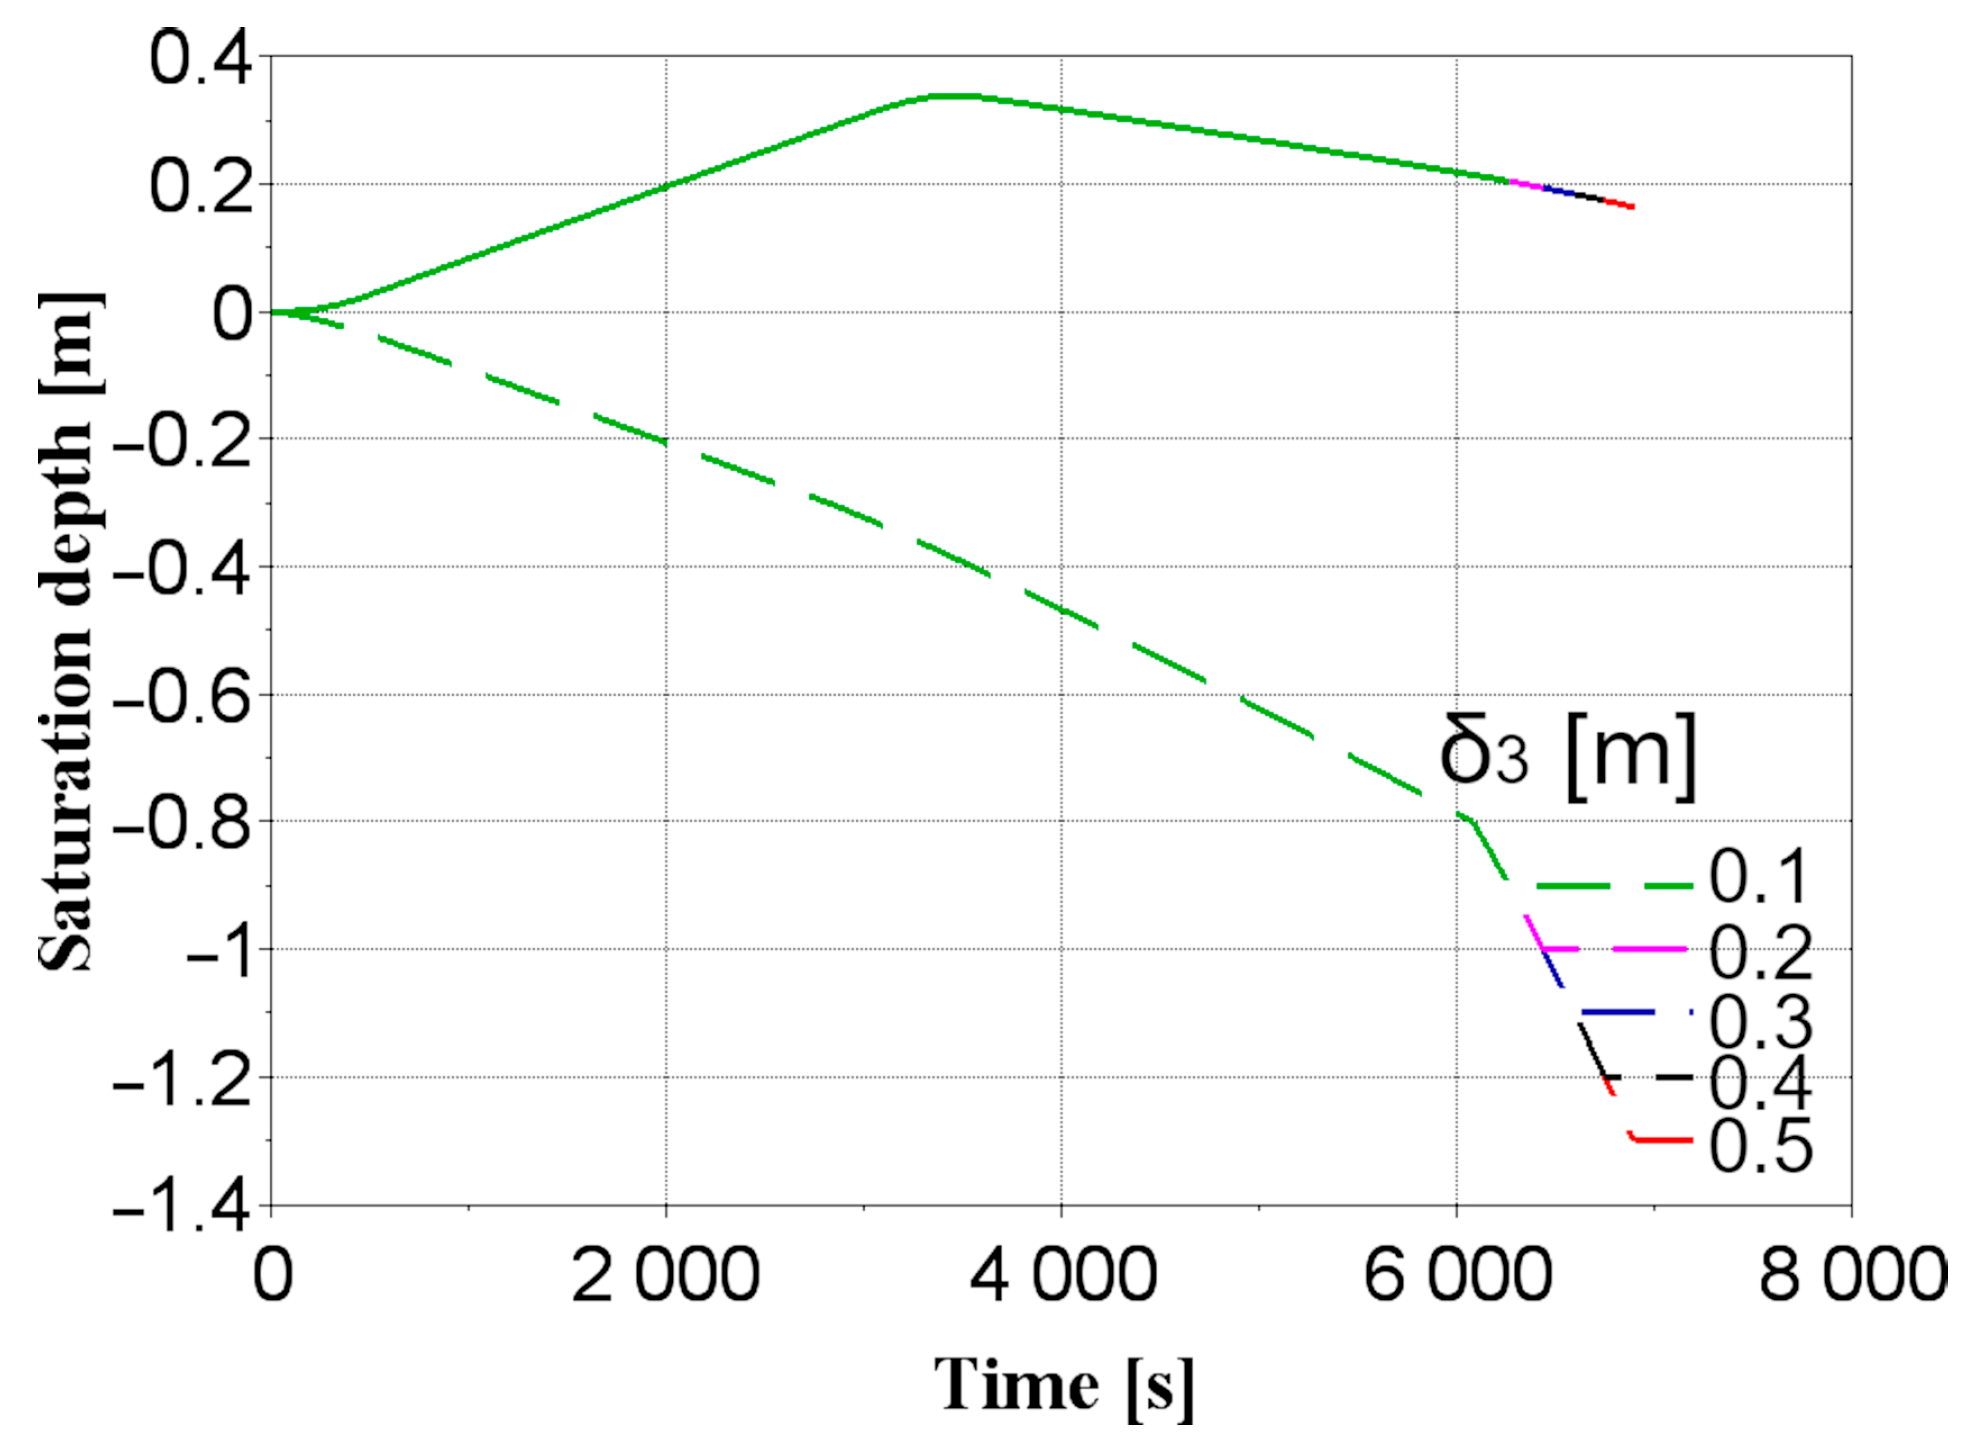
  • Increasing the thickness of the top layer by 10 cm results in a longer filling time and a surface column height of 0.341 m. It is recommended to have a top layer thickness of at least 0.3 m. A top layer thickness of less than 0.3 m leads to uneven runoff distribution, reducing efficiency and delaying complete system filling. Adjusting the thickness of the infiltration and gravel layers increases the filling time by an average of 601.25 s and 158.3 s, respectively, with a resulting water column height of 0.34 m. The recommended thicknesses for the infiltration and gravel layers are 0.5–0.6 m and 0.3 m, respectively.
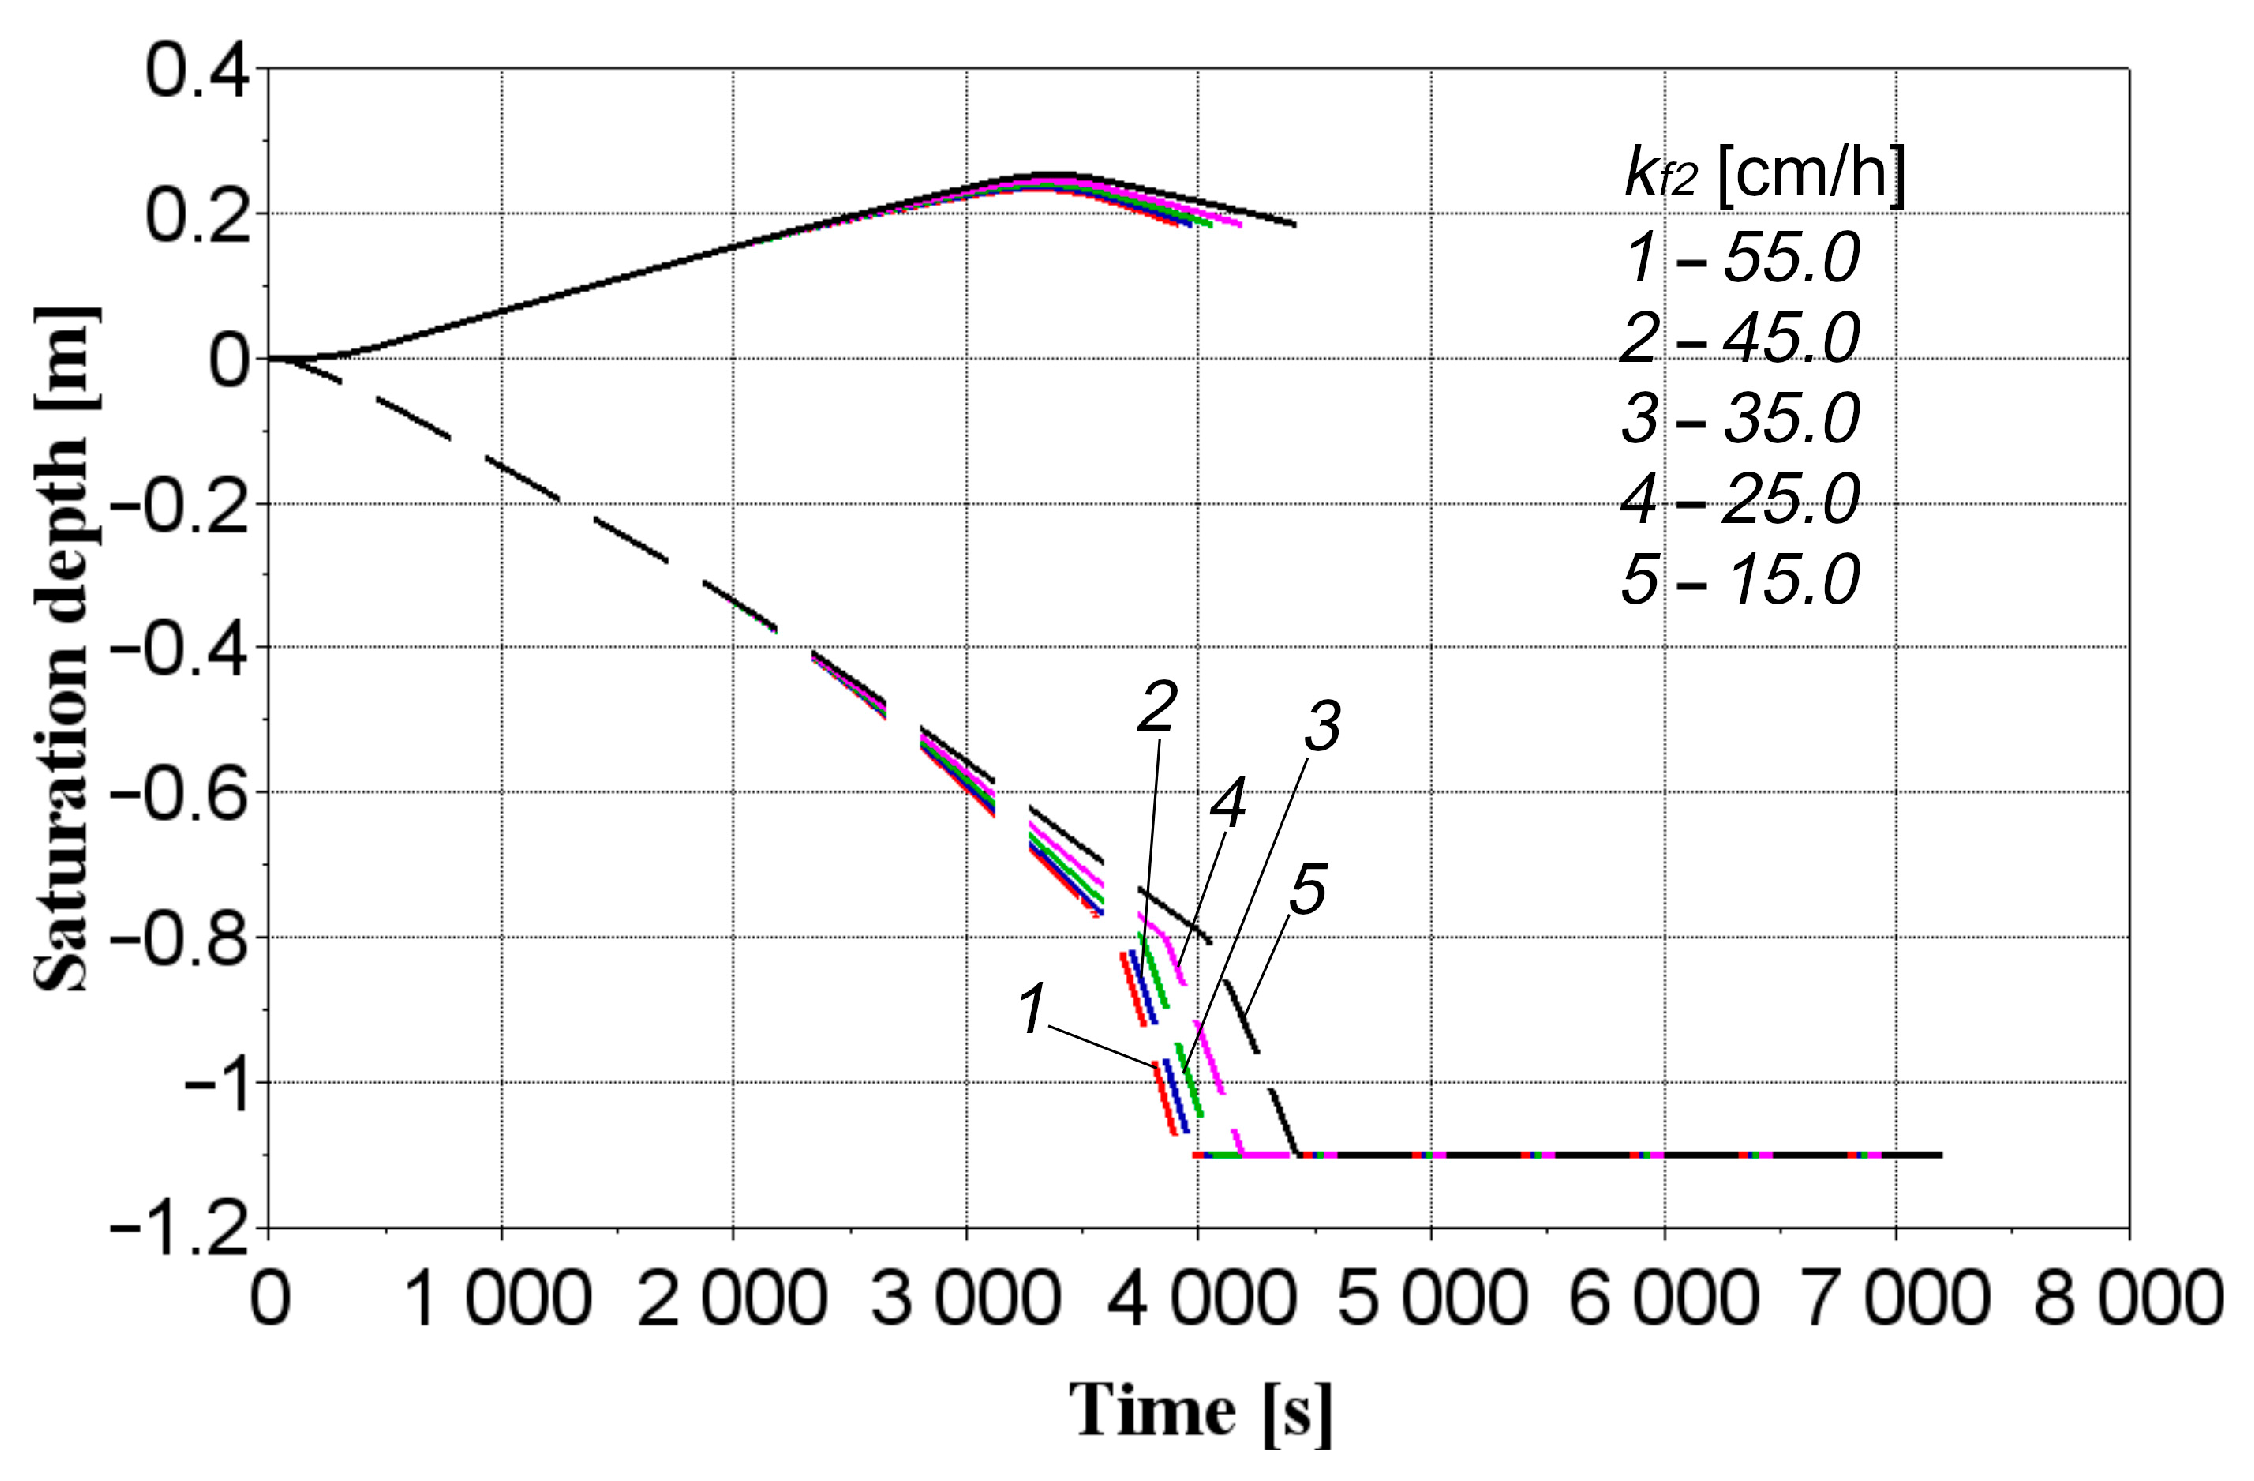
  • Changes in the soil mixture’s filtration coefficient significantly affect the rain garden’s hydrological behaviour. Enhanced productivity occurs when the filtration coefficient of the upper layer reaches 7.0 cm/h. At this value, complete saturation and filling of the structure with rainwater takes 7200 s, and the water column height reaches 0.342 m. Increasing the filtration coefficient of the intermediate layer reduces the water column height by an average of 0.007 m and shortens the filling time. When modelling the saturation depth and water column height over time based on the gravel layer’s filtration coefficient, curves for different values overlap and exhibit the same behaviour.
  • The depth of the depression zone on the surface of the rain garden is crucial for creating a water column and accumulating stormwater runoff. This allows water to saturate the entire structure vertically. The thicker the top layer of the rain garden and its filtration coefficient, the higher the resulting water column on the surface. The lower gravel layer has a minimal impact on the height of the water column and primarily functions as a drainage layer for water drainage.
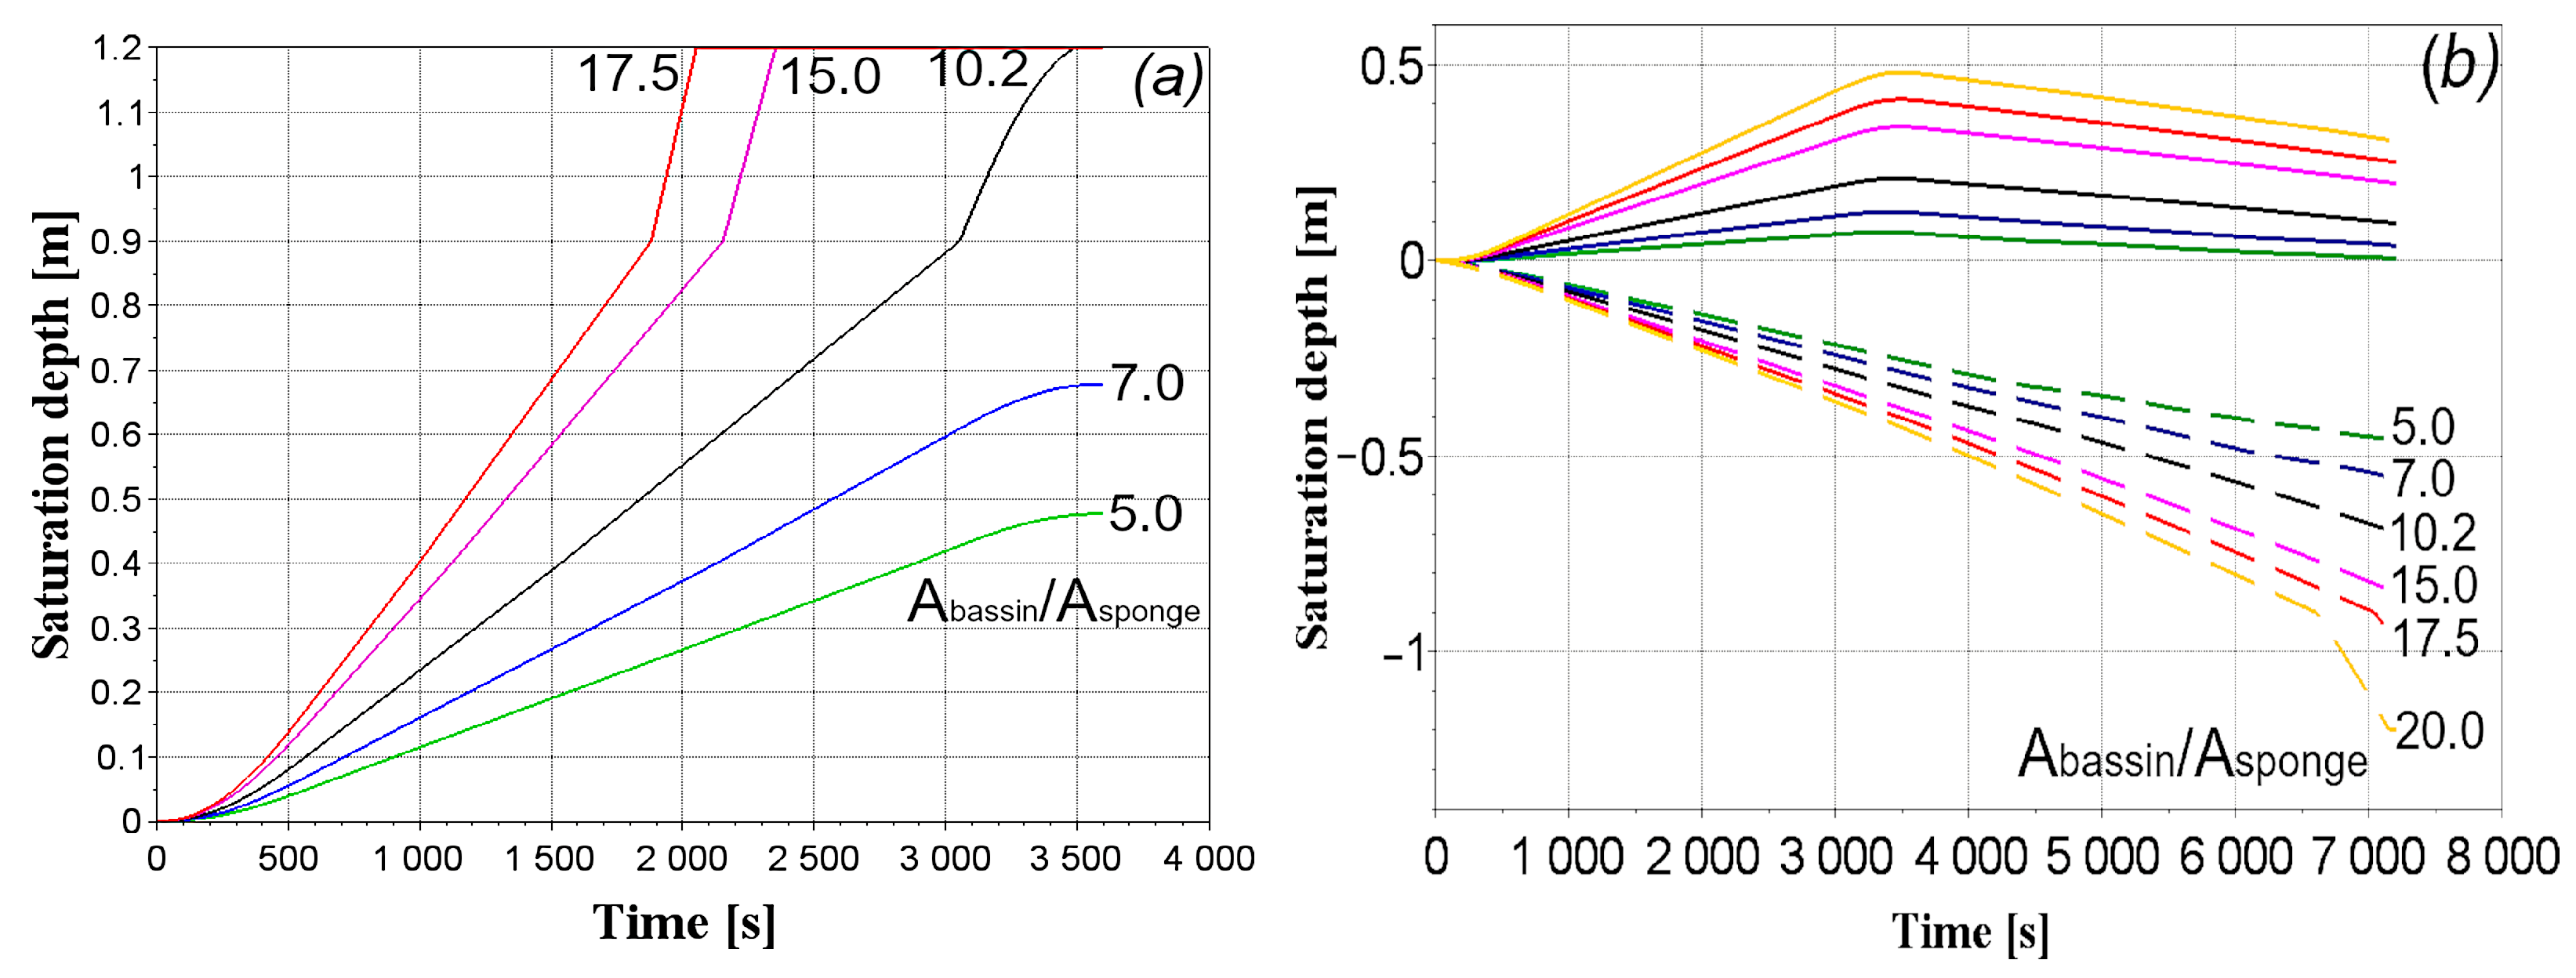
  • The tested model can predict the performance of rain gardens in stormwater infiltration based on the saturation depth, water column height, drainage area to basin area ratio, and soil filtration coefficient. The effectiveness of the rain garden design decreases when the thickness of the top layer is less than 0.3 m, the thickness of the intermediate infiltration layer is less than 0.5 m when the catchment area to rain garden area ratio falls below 15, or when the filtration coefficient of the top and intermediate infiltration layers surpasses 15 cm/h and 25 cm/h, respectively.

Author Contributions

Conceptualisation, T.T., V.M., M.K. and O.Z.; methodology, M.K. and T.T.; software, V.M.; validation, T.T., K.P. (Katarzyna Pawluk) and M.L.-S.; formal analysis, T.T. and O.Z.; investigation, V.M.; resources, T.T., M.K. and O.Z.; data curation, T.T. and M.L.-S.; writing—original draft preparation, T.T.; writing—review and editing, S.S., A.M., K.P. (Katarzyna Pawluk), K.P. (Konrad Piechowicz) and G.W.; visualisation, V.M., K.P. (Katarzyna Pawluk), A.M. and G.W.; supervision, T.T.; project administration, S.S., A.M., G.W. and K.P. (Konrad Piechowicz). All authors have read and agreed to the published version of the manuscript.

Funding

This research received no external funding.

Data Availability Statement

The data presented in this study are available upon request from the corresponding author.

Conflicts of Interest

The authors declare no conflicts of interest.

Appendix A

Figure A1. Model software algorithm.
Water 16 02339 g0a1aWater 16 02339 g0a1bWater 16 02339 g0a1c

References

  1. Guptha, G.C.; Swain, S.; Al-Ansari, N.; Taloor, A.K.; Dayal, D. Assessing the Role of SuDS in Resilience Enhancement of Urban Drainage System: A Case Study of Gurugram City, India. Urban Clim. 2022, 41, 101075. [Google Scholar] [CrossRef]
  2. Prayogi, L.; Yandri, S.; Schneider, V. Adaptation and Application of Low Impact Urban Design and Development (LIUDD) in Resistencia, Argentina. IOP Conf. Ser. Earth Environ. Sci. 2022, 1092, 012018. [Google Scholar] [CrossRef]
  3. Liu, Y.; Engel, B.A.; Flanagan, D.C.; Gitau, M.W.; McMillan, S.K.; Chaubey, I. A Review on Effectiveness of Best Management Practices in Improving Hydrology and Water Quality: Needs and Opportunities. Sci. Total Environ. 2017, 601–602, 580–593. [Google Scholar] [CrossRef] [PubMed]
  4. De Jesús Arce-Mojica, T.; Nehren, U.; Sudmeier-Rieux, K.; Miranda, P.J.; Anhuf, D. Nature-Based Solutions (NbS) for Reducing the Risk of Shallow Landslides: Where Do We Stand? Int. J. Disaster Risk Reduct. 2019, 41, 101293. [Google Scholar] [CrossRef]
  5. Joshi, P.; Leitão, J.P.; Maurer, M.; Bach, P.M. Not All SuDS Are Created Equal: Impact of Different Approaches on Combined Sewer Overflows. Water Res. 2021, 191, 116780. [Google Scholar] [CrossRef] [PubMed]
  6. Radinja, M.; Škerjanec, M.; Džeroski, S.; Todorovski, L.; Atanasova, N. Design and Simulation of Stormwater Control Measures Using Automated Modeling. Water 2021, 13, 2268. [Google Scholar] [CrossRef]
  7. Li, C.; Peng, C.; Chiang, P.-C.; Cai, Y.; Wang, X.; Yang, Z. Mechanisms and Applications of Green Infrastructure Practices for Stormwater Control: A Review. J. Hydrol. 2019, 568, 626–637. [Google Scholar] [CrossRef]
  8. Kaykhosravi, S.; Khan, U.; Jadidi, A. A Comprehensive Review of Low Impact Development Models for Research, Conceptual, Preliminary and Detailed Design Applications. Water 2018, 10, 1541. [Google Scholar] [CrossRef]
  9. Kravchenko, M.V.; Tkachenko, T.M. Problems of Improving the Terminology and Modern Classification of “Green” Constructions for the Creation of Ukrainian “Green” Standards. Collect. Sci. Publ. NUS 2023, 493, 194–204. [Google Scholar] [CrossRef] [PubMed]
  10. Lisenbee, W.A.; Hathaway, J.M.; Burns, M.J.; Fletcher, T.D. Modeling Bioretention Stormwater Systems: Current Models and Future Research Needs. Environ. Model. Softw. 2021, 144, 105146. [Google Scholar] [CrossRef]
  11. Morash, J.; Wright, A.; LeBleu, C.; Meder, A.; Kessler, R.; Brantley, E.; Howe, J. Increasing Sustainability of Residential Areas Using Rain Gardens to Improve Pollutant Capture, Biodiversity and Ecosystem Resilience. Sustainability 2019, 11, 3269. [Google Scholar] [CrossRef]
  12. Burszta-Adamiak, E.; Biniak-Pieróg, M.; Dąbek, P.B.; Sternik, A. Rain Garden Hydrological Performance—Responses to Real Rainfall Events. Sci. Total Environ. 2023, 887, 164153. [Google Scholar] [CrossRef] [PubMed]
  13. Greksa, A.; Blagojević, B.; Grabić, J. Nature-Based Solutions in Serbia: Implementation of Rain Gardens in the Suburban Community Kać. Environ. Process. 2023, 10, 41. [Google Scholar] [CrossRef]
  14. Zhang, L.; Ye, Z.; Shibata, S. Assessment of Rain Garden Effects for the Management of Urban Storm Runoff in Japan. Sustainability 2020, 12, 9982. [Google Scholar] [CrossRef]
  15. Ge, M.; Huang, Y.; Zhu, Y.; Kim, M.; Cui, X. Examining the Microclimate Pattern and Related Spatial Perception of the Urban Stormwater Management Landscape: The Case of Rain Gardens. Atmosphere 2023, 14, 1138. [Google Scholar] [CrossRef]
  16. Wanitchayapaisit, C.; Suppakittpaisarn, P.; Charoenlertthanakit, N.; Surinseng, V.; Yaipimol, E.; Rinchumphu, D. Rain Garden Design for Stormwater Management in Chiang Mai, Thailand: A Research-through-Design Study. NJEDP 2022, 21, 222. [Google Scholar] [CrossRef]
  17. Corrêa, C.J.P.; Nnadi, E.O.; Mbanaso, F.U.; Tonello, K.C. Urban Gardens’ Potential to Improve Stormwater Management: A Comparative Analysis among Urban Soils in Sorocaba, São Paulo, Brazil. Sustainability 2022, 14, 2965. [Google Scholar] [CrossRef]
  18. Tang, S.; Luo, W.; Jia, Z.; Liu, W.; Li, S.; Wu, Y. Evaluating Retention Capacity of Infiltration Rain Gardens and Their Potential Effect on Urban Stormwater Management in the Sub-Humid Loess Region of China. Water Resour Manag. 2016, 30, 983–1000. [Google Scholar] [CrossRef]
  19. Syafriana, A.; Arifin, H.S. Rain Garden Model for Stormwater Management in Sentul City, Bogor, Indonesia. IOP Conf. Ser. Earth Environ. Sci. 2020, 477, 012031. [Google Scholar] [CrossRef]
  20. Öhrn Sagrelius, P.; Blecken, G.; Hedström, A.; Ashley, R.; Viklander, M. Environmental Impacts of Stormwater Bioretention Systems with Various Design and Construction Components. J. Clean. Prod. 2022, 359, 132091. [Google Scholar] [CrossRef]
  21. Venvik, G.; Boogaard, F. Infiltration Capacity of Rain Gardens Using Full-Scale Test Method: Effect of Infiltration System on Groundwater Levels in Bergen, Norway. Land 2020, 9, 520. [Google Scholar] [CrossRef]
  22. Kravchenko, M.V.; Tkachenko, T.M.; Mileikovskyi, V.O. Study of the Influence of the Main Parameters of the Rain Garden on Its Hydrological Parameters by Modeling. Collect. Sci. Publ. NUS 2024, 1, 166–176. [Google Scholar] [CrossRef] [PubMed]
  23. Na Nagara, V.; Sarkar, D.; Boufadel, M.; Datta, R. Green Engineered Mulch for Phosphorus and Metal Removal from Stormwater Runoff in Bioretention Systems. Chemosphere 2023, 331, 138779. [Google Scholar] [CrossRef]
  24. Request Unavailable—Melbourne Water. Available online: https://www.melbournewater.com.au/media/446/download (accessed on 12 March 2024).
  25. Design Criteria for Bioretention—Minnesota Stormwater Manual. Available online: https://stormwater.pca.state.mn.us/index.php/Design_criteria_for_bioretention (accessed on 18 April 2024).
  26. Wisconsin Department of Natural Resources. Available online: https://dnr.wisconsin.gov/ (accessed on 18 April 2024).
  27. Paus, K.H.; Morgan, J.; Gulliver, J.S.; Hozalski, R.M. Effects of Bioretention Media Compost Volume Fraction on Toxic Metals Removal, Hydraulic Conductivity, and Phosphorous Release. J. Environ. Eng. 2014, 140, 04014033. [Google Scholar] [CrossRef]
  28. Davis, A.P.; Traver, R.G.; Hunt, W.F. Improving Urban Stormwater Quality: Applying Fundamental Principles. Contemp. Water Res. 2010, 146, 3–10. [Google Scholar] [CrossRef]
  29. Ren, X.W.; Santamarina, J.C. The Hydraulic Conductivity of Sediments: A Pore Size Perspective. Eng. Geol. 2018, 233, 48–54. [Google Scholar] [CrossRef]
  30. Carpenter, D.D.; Hallam, L. Influence of Planting Soil Mix Characteristics on Bioretention Cell Design and Performance. J. Hydrol. Eng. 2010, 15, 404–416. [Google Scholar] [CrossRef]
  31. Gregory, J.H.; Dukes Michael, D.; Jones Pierce, H.; Miller Grady, L. Effect of Urban Soil Compaction on Infiltration Rate. J. Soil Water Conserv. 2006, 3, 117–124. [Google Scholar]
  32. Ren, X.; Kang, J.; Ren, J.; Chen, X.; Zhang, M. A Method for Estimating Soil Water Characteristic Curve with Limited Experimental Data. Geoderma 2020, 360, 114013. [Google Scholar] [CrossRef]
  33. Boancă, P.; Dumitraș, A.; Luca, L.; Bors-Oprișa, S.; Laczi, E. Analysing Bioretention Hydraulics and RunoffRetention through Numerical Modelling UsingRECARGA: A Case Study in a RomanianUrban Area. Pol. J. Environ. Stud. 2018, 27, 1965–1973. [Google Scholar] [CrossRef] [PubMed]
  34. Le Coustumer, S.; Fletcher, T.D.; Deletic, A.; Barraud, S.; Poelsma, P. The Influence of Design Parameters on Clogging of Stormwater Biofilters: A Large-Scale Column Study. Water Res. 2012, 46, 6743–6752. [Google Scholar] [CrossRef]
  35. Zhou, Z.; Guo, Q. Drainage Alternatives for Rain Gardens on Subsoil of Low Permeability: Balance among Ponding Time, Soil Moisture, and Runoff Reduction. J. Sustain. Water Built Environ. 2022, 8, 05022002. [Google Scholar] [CrossRef]
  36. Jackisch, N.; Weiler, M. The Hydrologic Outcome of a Low Impact Development (LID) Site Including Superposition with Streamflow Peaks. Urban Water J. 2017, 14, 143–159. [Google Scholar] [CrossRef]
  37. Liu, J.; Sample, D.; Bell, C.; Guan, Y. Review and Research Needs of Bioretention Used for the Treatment of Urban Stormwater. Water 2014, 6, 1069–1099. [Google Scholar] [CrossRef]
  38. Gilchrist, S.; Borst, M.; Stander, E.K. Factorial Study of Rain Garden Design for Nitrogen Removal. J. Irrig. Drain Eng. 2014, 140, 04013016. [Google Scholar] [CrossRef]
  39. Goh, H.W.; Lem, K.S.; Azizan, N.A.; Chang, C.K.; Talei, A.; Leow, C.S.; Zakaria, N.A. A Review of Bioretention Components and Nutrient Removal under Different Climates—Future Directions for Tropics. Env. Sci Pollut Res 2019, 26, 14904–14919. [Google Scholar] [CrossRef]
  40. Payne, E.G.I.; Fletcher, T.D.; Cook, P.L.M.; Deletic, A.; Hatt, B.E. Processes and Drivers of Nitrogen Removal in Stormwater Biofiltration. Crit. Rev. Environ. Sci. Technol. 2014, 44, 796–846. [Google Scholar] [CrossRef]
  41. Clar, M.; Laramore, E.; Ryan, H. Rethinking Bioretention Design Concepts. In Proceedings of the Low Impact Development, Seattle, WA, USA, 16–19 November 2008; American Society of Civil Engineers: Wilmington, NC, USA, 2008; pp. 119–127. [Google Scholar]
  42. Hunt, W.F.; Davis, A.P.; Traver, R.G. Meeting Hydrologic and Water Quality Goals through Targeted Bioretention Design. J. Environ. Eng. 2012, 138, 698–707. [Google Scholar] [CrossRef]
  43. Wang, X.; Zhang, J.; Babovic, V.; Gin, K.Y.H. A Comprehensive Integrated Catchment-Scale Monitoring and Modelling Approach for Facilitating Management of Water Quality. Environ. Model. Softw. 2019, 120, 104489. [Google Scholar] [CrossRef]
  44. Heasom, W.; Traver, R.G.; Welker, A. Hydrologic modeling of a bioinfiltration best management practice. J. Am. Water Resour. Assoc. 2006, 42, 1329–1347. [Google Scholar] [CrossRef]
  45. Kravchenko, M.; Trach, Y.; Trach, R.; Tkachenko, T.; Mileikovskyi, V. Improving the Efficiency and Environmental Friendliness of Urban Stormwater Management by Enhancing the Water Filtration Model in Rain Gardens. Water 2024, 16, 1316. [Google Scholar] [CrossRef]
  46. Eestimation of Infiltration Rate in the Vadose Zone: Compilation of Simple Mathematical Models—Volume I|Science Inventory|US EPA. Available online: https://cfpub.epa.gov/si/si_public_record_report.cfm?Lab=NRMRL&dirEntryId=99481 (accessed on 24 May 2024).
  47. Smith, R.E. The Infiltration Envelope: Results from a Theoretical Infiltrometer. J. Hydrol. 1972, 17, 1–22. [Google Scholar] [CrossRef]
  48. Horton RE The Rôle of Infiltration in the Hydrologic Cycle. Eos Trans. AGU 1933, 14, 446–460. [CrossRef]
  49. Heber Green, W.; Ampt, G.A. Studies on Soil Phyics. J. Agric. Sci. 1911, 4, 1–24. [Google Scholar] [CrossRef]
  50. Richards, L.A. Capillary conduction of liquids through porous mediums. Physics 1931, 1, 318–333. [Google Scholar] [CrossRef]
  51. Ali, M.H. Fundamentals of Irrigation and On-Farm Water Management: Volume 1; Springer: New York, NY, USA, 2010; ISBN 978-1-4419-6334-5. [Google Scholar]
  52. Gray, W.G.; Miller, C.T. Examination of Darcy’s Law for Flow in Porous Media with Variable Porosity. Environ. Sci. Technol. 2004, 38, 5895–5901. [Google Scholar] [CrossRef]
  53. Wang, J.; Song, J.; Lin, H.; Peng, L.; Li, K.; Wang, Z. Comparison of Infiltration Models to Describe Infiltration Characteristics of Bioretention. J. Hydro-Environ. Res. 2021, 38, 35–43. [Google Scholar] [CrossRef]
  54. Adoption Guidelines for Stormwater Biofiltration Systems: Cities as Water Supply Catchments—Sustainable Technologies—CRC for Water Sensitive Cities. Available online: https://watersensitivecities.org.au/content/stormwater-biofilter-design/ (accessed on 18 April 2024).
  55. Fassman, E.A.; Simcock, R.; Wang, S. Media Specification for Stormwater Bioretention Devices, Prepared by Auckland UniServices for Auckland Council. Auckland Council Technical Report, TR2013/011. 2013. Available online: https://knowledgeauckland.org.nz/media/1616/tr2013-011-media-specification-for-stormwater-bioretention-devices.pdf (accessed on 17 August 2024).
  56. Kravchenko, M.; Trach, Y.; Trach, R.; Tkachenko, T.; Mileikovskyi, V. Behaviour and Peculiarities of Oil Hydrocarbon Removal from Rain Garden Structures. Water 2024, 16, 1802. [Google Scholar] [CrossRef]
  57. Guo, J.C.Y.; Luu, T.M. Hydrologic Model Developed for Stormwater Infiltration Practices. J. Hydrol. Eng. 2015, 20, 06015001. [Google Scholar] [CrossRef]
  58. Azure, I.; Wiredu, J.K.; Musah, A.; Akolgo, E. AI-Enhanced Performance Evaluation of Python, MATLAB, and Scilab for Solving Nonlinear Systems of Equations: A Comparative Study Using the Broyden Method. AJCM 2023, 13, 644–677. [Google Scholar] [CrossRef]
  59. Rain Gardens. Available online: https://www.susdrain.org/delivering-suds/using-suds/suds-components/infiltration/rain-gardens.html (accessed on 12 March 2024).
  60. Rinchumphu, D.; Suriyanon, N.; Phichetkunbodee, N.; Munlikawong, S.; Wanitchayapaisit, C.; Sitthikankun, S. Economics and Cost Effectiveness of a Rain Garden for Flood-Resistant Urban Design. Glob. J. Environ. Sci. Manag. 2024, 10, 1–12. [Google Scholar] [CrossRef]
  61. Zhang, B.; Li, J.; Li, Y. Simulation and Optimization of Rain Gardens via DRAINMOD Model and Response Surface Methodology. Ecohydrol. Hydrobiol. 2020, 20, 413–423. [Google Scholar] [CrossRef]
  62. Li, H.; Sharkey, L.J.; Hunt, W.F.; Davis, A.P. Mitigation of Impervious Surface Hydrology Using Bioretention in North Carolina and Maryland. J. Hydrol. Eng. 2009, 14, 407–415. [Google Scholar] [CrossRef]
  63. Vijayaraghavan, K.; Biswal, B.K.; Adam, M.G.; Soh, S.H.; Tsen-Tieng, D.L.; Davis, A.P.; Chew, S.H.; Tan, P.Y.; Babovic, V.; Balasubramanian, R. Bioretention Systems for Stormwater Management: Recent Advances and Future Prospects. J. Environ. Manag. 2021, 292, 112766. [Google Scholar] [CrossRef]
  64. Rezaei, A.R.; Ismail, Z.; Niksokhan, M.H.; Dayarian, M.A.; Ramli, A.H.; Shirazi, S.M. A Quantity–Quality Model to Assess the Effects of Source Control Stormwater Management on Hydrology and Water Quality at the Catchment Scale. Water 2019, 11, 1415. [Google Scholar] [CrossRef]
  65. Skorobogatov, A.; He, J.; Chu, A.; Valeo, C.; Van Duin, B. The Impact of Media, Plants and Their Interactions on Bioretention Performance: A Review. Sci. Total Environ. 2020, 715, 136918. [Google Scholar] [CrossRef] [PubMed]
  66. Blecken, G.-T.; Zinger, Y.; Deletić, A.; Fletcher, T.D.; Viklander, M. Impact of a Submerged Zone and a Carbon Source on Heavy Metal Removal in Stormwater Biofilters. Ecol. Eng. 2009, 35, 769–778. [Google Scholar] [CrossRef]
  67. Winston, R.J.; Dorsey, J.D.; Hunt, W.F. Quantifying Volume Reduction and Peak Flow Mitigation for Three Bioretention Cells in Clay Soils in Northeast Ohio. Sci. Total Environ. 2016, 553, 83–95. [Google Scholar] [CrossRef]
  68. Jiang, C.; Li, J.; Li, H.; Li, Y. Experiment and Simulation of Layered Bioretention System for Hydrological Performance. J. Water Reuse Desalination 2019, 9, 319–329. [Google Scholar] [CrossRef]
  69. Baek, S.-S.; Ligaray, M.; Park, J.-P.; Shin, H.-S.; Kwon, Y.; Brascher, J.T.; Cho, K.H. Developing a Hydrological Simulation Tool to Design Bioretention in a Watershed. Environ. Model. Softw. 2019, 122, 104074. [Google Scholar] [CrossRef]
  70. Tansar, H.; Duan, H.-F.; Mark, O. Global Sensitivity Analysis of Bioretention Cell Design for Stormwater System: A Comparison of VARS Framework and Sobol Method. J. Hydrol. 2023, 617, 128895. [Google Scholar] [CrossRef]
  71. Wang, J.; Chua, L.H.C.; Shanahan, P. Hydrological Modeling and Field Validation of a Bioretention Basin. J. Environ. Manag. 2019, 240, 149–159. [Google Scholar] [CrossRef]
  72. Mangangka, I.R.; Liu, A.; Egodawatta, P.; Goonetilleke, A. Performance Characterisation of a Stormwater Treatment Bioretention Basin. J. Environ. Manag. 2015, 150, 173–178. [Google Scholar] [CrossRef] [PubMed]
  73. Dussaillant, A.R.; Wu, C.H.; Potter, K.W. Richards Equation Model of a Rain Garden. J. Hydrol. Eng. 2004, 9, 219–225. [Google Scholar] [CrossRef]
  74. Hatt, B.E.; Fletcher, T.D.; Deletic, A. Hydrologic and Pollutant Removal Performance of Stormwater Biofiltration Systems at the Field Scale. J. Hydrol. 2009, 365, 310–321. [Google Scholar] [CrossRef]
  75. Wang, J.; Song, Y.; Ma, T.; Raza, W.; Li, J.; Howland, J.G.; Huang, Q.; Shen, Q. Impacts of Inorganic and Organic Fertilization Treatments on Bacterial and Fungal Communities in a Paddy Soil. Appl. Soil Ecol. 2017, 112, 42–50. [Google Scholar] [CrossRef]
  76. Li, Y.; Wen, M.; Li, J.; Chai, B.; Jiang, C. Reduction and Accumulative Characteristics of Dissolved Heavy Metals in Modified Bioretention Media. Water 2018, 10, 1488. [Google Scholar] [CrossRef]
  77. Homepage—Water Sensitive Cities Australia. Available online: https://wscaustralia.org.au/ (accessed on 18 April 2024).
  78. Le Coustumer, S.; Fletcher, T.D.; Deletic, A.; Barraud, S.; Lewis, J.F. Hydraulic Performance of Biofilter Systems for Stormwater Management: Influences of Design and Operation. J. Hydrol. 2009, 376, 16–23. [Google Scholar] [CrossRef]
  79. Tahvonen, O. Adapting Bioretention Construction Details to Local Practices in Finland. Sustainability 2018, 10, 276. [Google Scholar] [CrossRef]
  80. Bratieres, K.; Fletcher, T.D.; Deletic, A.; Zinger, Y. Nutrient and Sediment Removal by Stormwater Biofilters: A Large-Scale Design Optimisation Study. Water Res. 2008, 42, 3930–3940. [Google Scholar] [CrossRef]
  81. Jiang, C.; Li, J.; Li, H.; Li, Y. An Improved Approach to Design Bioretention System Media. Ecol. Eng. 2019, 136, 125–133. [Google Scholar] [CrossRef]
  82. Kandel, S.; Vogel, J.; Penn, C.; Brown, G. Phosphorus Retention by Fly Ash Amended Filter Media in Aged Bioretention Cells. Water 2017, 9, 746. [Google Scholar] [CrossRef]
  83. Sang, M.; Huang, M.; Zhang, W.; Che, W.; Sun, H. A Pilot Bioretention System with Commercial Activated Carbon and River Sediment-Derived Biochar for Enhanced Nutrient Removal from Stormwater. Water Sci. Technol. 2019, 80, 707–716. [Google Scholar] [CrossRef]
  84. William, R.; Gardoni, P.; Stillwell, A.S. Reliability-Based Approach to Investigating Long-Term Clogging in Green Stormwater Infrastructure. J. Sustain. Water Built Environ. 2019, 5, 04018015. [Google Scholar] [CrossRef]
  85. Sharma, R.; Malaviya, P. Management of stormwater pollution using green infrastructure: The role of rain gardens. WIREs Water 2021, 8, e1507. [Google Scholar] [CrossRef]
  86. Meng, Y.; Wang, H.; Chen, J.; Zhang, S. Modelling Hydrology of a Single Bioretention System with HYDRUS-1D. Sci. World J. 2014, 2014, 1–10. [Google Scholar] [CrossRef]
  87. Paus, K.H.; Morgan, J.; Gulliver, J.S.; Leiknes, T.; Hozalski, R.M. Assessment of the Hydraulic and Toxic Metal Removal Capacities of Bioretention Cells After 2 to 8 Years of Service. Water Air Soil Pollut. 2014, 225, 1803. [Google Scholar] [CrossRef]
  88. Archer, N.A.L.; Quinton, J.N.; Hess, T.M. Below-Ground Relationships of Soil Texture, Roots and Hydraulic Conductivity in Two-Phase Mosaic Vegetation in South-East Spain. J. Arid Environ. 2002, 52, 535–553. [Google Scholar] [CrossRef]
  89. Lucas, W.C. Design of Integrated Bioinfiltration-Detention Urban Retrofits with Design Storm and Continuous Simulation Methods. J. Hydrol. Eng. 2010, 15, 486–498. [Google Scholar] [CrossRef]
  90. Lee, J.Y.; Moon, H.J.; Kim, T.I.; Kim, H.W.; Han, M.Y. Quantitative Analysis on the Urban Flood Mitigation Effect by the Extensive Green Roof System. Environ. Pollut. 2013, 181, 257–261. [Google Scholar] [CrossRef] [PubMed]
  91. Hlushchenko, R.; Tkachenko, T.; Mileikovskyi, V.; Kravets, V.; Tkachenko, O. “Green Structures” for Effective Rainwater Management on Roads. Prod. Eng. Arch. 2022, 28, 295–299. [Google Scholar] [CrossRef]
  92. Tkachenko, T.; Kravchenko, M.; Voloshkina, O.; Mileikovskyi, V.; Tkachenko, O.; Sipakov, R. Evaluating Rain-Garden Bands: Filtration Properties and Implications for Urban Water Management. In Proceedings of the World Environmental and Water Resources Congress 2024, Milwaukee, WI, USA, 19–22 May 2024; American Society of Civil Engineers: Milwaukee, WI, USA, 2024; pp. 960–968. [Google Scholar]
  93. Tkachenko, T.; Mileikovskyi, V.; Dziubenko, V.; Tkachenko, O. Improvement of the Safety of Multi-Floor Housing. IOP Conf. Ser. Mater. Sci. Eng. 2020, 907, 012064. [Google Scholar] [CrossRef]
  94. Tkachenko, T.; Voloshkina, O.; Mileikovskyi, V.; Sipakov, R.; Hlushchenko, R.; Tkachenko, O. Using Rain-Garden Bands for Rainwater Drainage from Roads. In Proceedings of the World Environmental and Water Resources Congress 2023, Henderson, NV, USA, 21–25 May 2023; American Society of Civil Engineers: Henderson, NV, USA, 2023; pp. 1207–1214. [Google Scholar]
  95. Tkachenko, T.; Mileikovskyi, V. Capturing Carbon Dioxide from Human-Driven Vehicles by Green Structures for Carbon Neutrality. IOP Conf. Ser. Earth Environ. Sci. 2022, 1111, 012056. [Google Scholar] [CrossRef]
Figure 1. An example of the formation of a water column on the soil surface (Kyiv, author’s photo).
Water 16 02339 g001
Figure 2. Critical intensity rainfall event curve.
Water 16 02339 g002
Figure 3. Design scheme of hydrological processes in the thickness of the RG structure (adapted from [45]).
Water 16 02339 g003
Figure 4. Changes in RG performance over time: (a) without taking into account the HWC and the filtration coefficient; (b) with taking into account the HWC and the filtration coefficient. The solid lines represent HWC, and the dashed lines represent the saturation depth of the RG layers.
Water 16 02339 g004
Figure 5. Changes in RG performance and the HWC in time depending on the thickness of the upper soil layer δ 1 , m. The solid lines—HWC, the dashed lines—saturation depth of the RG layers.
Water 16 02339 g005
Figure 6. Changes in RG performance and the HWC in time depending on the thickness of the infiltration layer δ 2 , m. The solid lines—HWC, the dashed lines—saturation depth of the RG layers.
Water 16 02339 g006
Figure 7. Changes in RG performance and HWC over time, depending on the thickness of the gravel layer. The solid lines—HWC, the dashed lines—saturation depth of the RG layers.
Water 16 02339 g007
Figure 8. Changes in rain garden performance and the HWC in time depending on the filtration coefficient of the upper soil layer k f 1 , cm/h. The solid lines—HWC, the dashed lines—saturation depth of the RG layers.
Water 16 02339 g008
Figure 9. Changes in RG performance and the HWC in time depending on the filtration coefficient of the infiltration layer k f 2 , cm/h. The solid lines—HWC, the dashed lines—saturation depth of the RG layers.
Water 16 02339 g009
Figure 10. Changes in RG performance and the HWC in time depending on the drainage coefficient of the infiltration layer k f 3 , cm/h. The solid line—HWC, the dashed line—saturation depth of the RG layers.
Water 16 02339 g010
Table 1. Effect of topsoil layer thickness on stormwater retention by RG considering HWC.
Variable
Parameters
Construction of a Rain Garden
Sample 1Sample 2Sample 3Sample 4Sample 5
H s p o n g e , m1.11.21.31.41.5
δ 1 , m0.10.20.30.40.5
δ 2 , m0.70.70.70.70.7
δ 3 , m0.30.30.30.30.3
h 0 , m0.2620.3210.3380.3410.341
τ , s4202.55975---
Table 2. Influence of the thickness of the intermediate layer on the stormwater retention efficiency of the RG structure, taking into account the HWC.
Variable
Parameters
Construction of a Rain Garden
Sample 1Sample 2Sample 3Sample 4Sample 5
H s p o n g e , m0.80.91.01.11.2
δ 1 , m0.30.30.30.30.3
δ 2 , m0.20.30.40.50.6
δ 3 , m0.30.30.30.30.3
h 0 , m0.340.340.340.340.34
τ , s476953976005.56595.57174
Table 3. Effect of gravel layer thickness δ 3 (m) on stormwater retention efficiency of an RG structure, taking into account the HWC.
Variable
Parameters
Construction of a Rain Garden
Sample 1Sample 2Sample 3Sample 4Sample 5
H s p o n g e , m0.91.01.11.21.3
δ 1 , m0.30.30.30.30.3
δ 2 , m0.50.50.50.50.5
δ 3 , m0.10.20.30.40.5
h 0 , m0.3380.3380.3380.3380.338
τ , s6264.564366596.56747.56898
Table 4. Effectiveness of RG design regarding changes in topsoil filtration coefficient with HWC.
Variable
Parameters
Construction of a Rain Garden
Sample 1Sample 2Sample 3Sample 4Sample 5
k f 1 , cm/h7.015.025.030.040.0
k f 2 , cm/h45.045.045.045.045.0
k f 3 , cm/h200.0200.0200.0200.0200.0
h 0 , m0.3420.2570.1650.1270.063
τ , s-48003538.532122776
Table 5. RG design performance and HWC change based on infiltration layer filtration coefficient.
Variable
Parameters
Construction of a Rain Garden
Sample 1Sample 2Sample 3Sample 4Sample 5
k f 1 , cm/h7.07.07.07.07.0
k f 2 , cm/h15.025.035.045.055.0
k f 3 , cm/h200.0200.0200.0200.0200.0
h 0 , m0.2530.2450.240.2370.234
τ , s4418.541854055.53972.53915.5
Table 6. RG design performance and HWC change based on the drainage layer filtration coefficient.
Variable
Parameters
Construction of a Rain Garden
Sample 1Sample 2Sample 3Sample 4Sample 5
k f 1 , cm/h7.07.07.07.07.0
k f 2 , cm/h45.045.045.045.045.0
k f 3 , cm/h100.0150.0200.0250.0300.0
h 0 , m0.2630.2630.2630.2630.263
τ , s4045.54045.54045.54045.54045.5
Disclaimer/Publisher’s Note: The statements, opinions and data contained in all publications are solely those of the individual author(s) and contributor(s) and not of MDPI and/or the editor(s). MDPI and/or the editor(s) disclaim responsibility for any injury to people or property resulting from any ideas, methods, instructions or products referred to in the content.

