Article

Significant Rise in Sava River Water Temperature in the City of Zagreb Identified across Various Time Scales

by
Ognjen Bonacci
1,
Ana Žaknić-Ćatović
2,* and
Tanja Roje-Bonacci
1
1
Faculty of Civil Engineering, Architecture and Geodesy, Split University, Matice Hrvatske 15, 21000 Split, Croatia
2
Department of Physical and Environmental Sciences, University of Toronto Scarborough, 1265 Military Trail, Toronto, ON M1C 1A4, Canada
*
Author to whom correspondence should be addressed.
Water 2024, 16(16), 2337; https://doi.org/10.3390/w16162337
Submission received: 8 July 2024 / Revised: 2 August 2024 / Accepted: 16 August 2024 / Published: 20 August 2024

Abstract

:
The study analyzed available data series of the Sava River’s water temperature measured at the Zagreb gauging station. Official data from the Croatian Meteorological and Hydrological Service (DHMZ) in Zagreb were utilized. Over the 73 years from 1948 to 2020, there are only 53 years with complete measurement records. Despite this limiting fact, it was considered important to analyze the behavior of the Sava River’s water temperatures in Zagreb over the past 70 years, during which a significant increase in air temperatures has been observed in the region, particularly in the city of Zagreb. Analyses were conducted on the characteristic (minimum, mean, and maximum) water temperatures over timescales of years, months, and days. The relationship between water temperatures (TW) and air temperatures (TA) measured at the Grič Observatory and the flows (Q) of the Sava River in Zagreb were investigated. A trend of rising water temperatures was observed throughout the entire period from 1948 to 2020, with the intensity significantly increasing in the recent period starting from 1988. The trend of rising air temperatures is the primary driver of the increase in the water temperatures of the Sava River in Zagreb. However, the impact of reduced water flow, especially during the warm season, should not be overlooked. This effect is amplified by the observed trend of decreasing minimum flows of the Sava during the warm season, from June to September. As a result, the most significant rise in water temperatures of the Sava River in Zagreb occurs during prolonged low-water summer periods, particularly in July. A strong trend has been observed in the increasing number of days per year with mean daily water temperatures of the Sava River exceeding 20 °C. This higher water temperature occurs increasingly earlier in the year, lasts longer, and ends later, often extending into September.

1. Introduction

The water temperature in rivers is an important and highly variable characteristic in both space and time, with a significant impact on numerous physical, chemical, and biological processes of watercourses and their environment. It is considered a primary indicator of water quality. According to the latest IPCC report river water temperatures are projected to increase due to rising air temperatures and altered hydrological regimes [1]. The variability of the thermal regime of river water has strong consequences for both short-term and long-term aspects of the river environment and its aquatic habitats. Increased water temperature can result in significant changes in species composition and the functioning of aquatic ecosystems. It is essential to predict its future development as accurately and reliably as possible. To achieve this goal, it is crucial to study its historical development based on easily accessible and available meteorological and hydrological characteristics, primarily air temperature and water flow. The water temperature of large European rivers has increased by 1–3 °C over the past century. It is predicted that the surface water temperature of rivers will further increase with the anticipated rise in air temperatures caused by global warming [2]. Climate change and numerous anthropogenic interventions differently affect river water temperature at all levels, from local to regional to global. For sustainable river management, as well as for developing effective adaptation strategies, it is essential to have a comprehensive understanding of the dynamics of river water temperatures in each specific open watercourse. It is important to consider this issue within an integrated framework of climate–landscape (geology, geomorphology, soil, vegetation, etc.)–hydrology–people [3].
Apart from changes in water availability, climate change driven by global warming already significantly affects river water temperatures today [4]. River ecosystems are highly sensitive to climate change [5]. Therefore, it is realistic to expect that the predicted future increase in air temperature will significantly increase the stress on these ecosystems. At the same time, rivers represent an important socioeconomic factor that affects numerous key socioeconomic aspects, such as agriculture, tourism, electricity production, water supply, and drinking water quality. Their socioeconomic impact is especially important in cases where the river flows through the complex urban structures of large cities. Such is the case with the Sava River as it flows through the city of Zagreb. All the previously mentioned aspects can be subjected to significant threats as a result of rising water temperatures.
There is strong evidence that river water temperatures are increasing worldwide in response to climate change and human activities, especially the construction of dams and the formation of reservoirs. Current research on river water temperatures, however, is mainly focused on predominantly natural basins or the impacts of reservoir management, primarily during summer months and on relatively small spatial scales [6,7,8]. Such an approach results in limited attention to anthropogenic impacts on river water temperatures, thereby reducing the ability to sustainably manage river systems, protect ecosystems, and balance the interests of stakeholders in the complex and often controversial system of river water resource usage. Abdi et al. [9] highlighted that the quality of river water and habitats is degraded by thermal pollution from urban areas, caused by warm surface runoff, the lack of riparian forests, and impervious channels that transmit heat and block cold groundwater flows.
Sudden spikes in river water temperatures often occur during extremely low flows observed during prolonged low-water periods and droughts, which have become more frequent and devastating in recent decades, practically worldwide. Analyzing river water temperature series in the UK, White et al. [10] highlighted this potentially dangerous occurrence. Extremely high river water temperatures were observed across the UK during summer drought periods in recent decades, during low-water events. This is due to the fact that extremely low flows coincide with high air temperatures, which result in significant atmospheric energy input. This phenomenon can significantly and very quickly affect the health of freshwater ecosystems, causing great damage to river ecosystems and preventing the practical implementation of their sustainable management. The authors emphasize that modern science has not yet sufficiently studied the extent to which different meteorological and hydrological processes interact during droughts and how they impact river ecosystems. As an example, a fish die-off occurred on the Sava River between Zagreb and Sisak on 23 July 2024. It is estimated that between two and three tons of fish died [11]. It must always be borne in mind that each individual open watercourse behaves differently and reacts individually.
Johnson et al. [12] and Suárez et al. [13] studied the interaction of surface water temperatures with groundwater temperatures and found that the dynamics of this process play a key role in the physical, biological, and geochemical functions of river systems and associated groundwater systems. Observing the behavior of exchange flows in heterogeneous systems is a primary challenge, especially when the flows are managed by dynamic hydrological stages of the river.
Understanding the spatial-temporal variability of changes in river water temperature caused by climate is crucial for identifying hotspots and assessing impacts on ecological and socioeconomic systems. Souaissi et al. [14] analyzed local frequencies of extreme river water temperatures at 25 independent and identically distributed stations in Switzerland. Probability distributions were fitted to the data to estimate maximum water temperatures corresponding to different return periods. Their results indicate regional homogeneity in the thermal regime of the studied area.
Briciu et al. [15] analyzed the impact of the urban heat island (UHI) effect on the water temperature of the Suceava River, which flows through the Suceava city in Romania. After passing through the city, the daily thermal profile of the Suceava River’s water temperature shows a steeper decline and earlier occurrences of maximum and minimum temperatures compared with upstream. The authors attribute this phenomenon to the UHI effect.
Shrestha et al. [16] analyzed river water temperature data at 106 stations in Canada. They analyzed changes in summer water temperatures over the period 1980–2018. The results reveal a widespread increase in water temperatures from June to September, with statistically significant increasing trends at about 50% of the stations. They definitively determined that trends in rising average air temperatures are the primary drivers of rising average water temperatures in rivers across Canada. They warn that with the predicted increased rise in air temperatures across Canada, increased summer heating of river waters can be expected in the near future. Such development could have serious negative consequences, especially in river systems that are already thermally stressed.
In analyzing variations in water temperature in open watercourses, it is important to consider the fact that they are most influenced by groundwater inflow, evaporation, back radiation, atmospheric radiation, solar radiation, and vegetative topographic radiation. These factors are responsible for about 90% of the heat flow in rivers [17,18]. Van Vliet et al. [19] assessed the impact of climate change on global river flows and water temperatures, identifying regions that could become more critical for freshwater ecosystems and water use sectors.
Rivers flowing through cities contribute to the urban cooling islands (UCI). Cheng et al. [20] analyzed the impact of rivers on the UCI effect in Chongqing, China, finding that different soil types have varying impacts, with impervious surfaces being most sensitive to the UCI effect of nearby water bodies compared with agricultural land. Murakawa et al. [21] reported field observations of microclimate around the Ota River flowing through Hiroshima noting that air temperature above the river dropped by more than 5 °C on sunny days during warmer seasons, proportional to the surface temperature difference between the river water and the asphalt pavement. These thermal effects extended at least several hundred meters horizontally and more than 80 m vertically. Air temperatures were influenced by the density of built-up areas and the direction and speed of the wind.
Rivers in urban areas affect the thermal environment by altering air temperature and relative humidity. Wang et al. [22] studied the cooling effect of the Yangtze River in Wuhan on surrounding urban areas during a hot and humid summer day. They concluded that the river’s cooling and humidifying effect was up to 3.55 °C, 1741 m, and 17.25% 1369 m during the day, much more than at night. The river significantly reduced thermal stress on pedestrians within 1200 m of the riverbank during the day but had a weak negative effect at night. Apart from global warming, some of these properties can be significantly managed by anthropogenic interventions, such as dam construction and reservoir formation, as well as stream channel regulation, groundwater extraction, land use changes in the catchment area, etc. It would be of great importance to determine whether and to what extent the chain of small hydropower plants on the Sava in Slovenia has influenced the change in the water temperature regime of the Sava downstream, particularly in the area of the city of Zagreb.
The scarcity of river water temperature observations limits our understanding of river thermal regimes. It is important to note that Landsat surface temperature measurements remain an underexplored resource that can significantly improve hydrologic modeling by providing better spatial and temporal resolution data for studying smaller systems such as rivers and urbanized areas [23].
The objectives of our analysis are as follows:
(i)
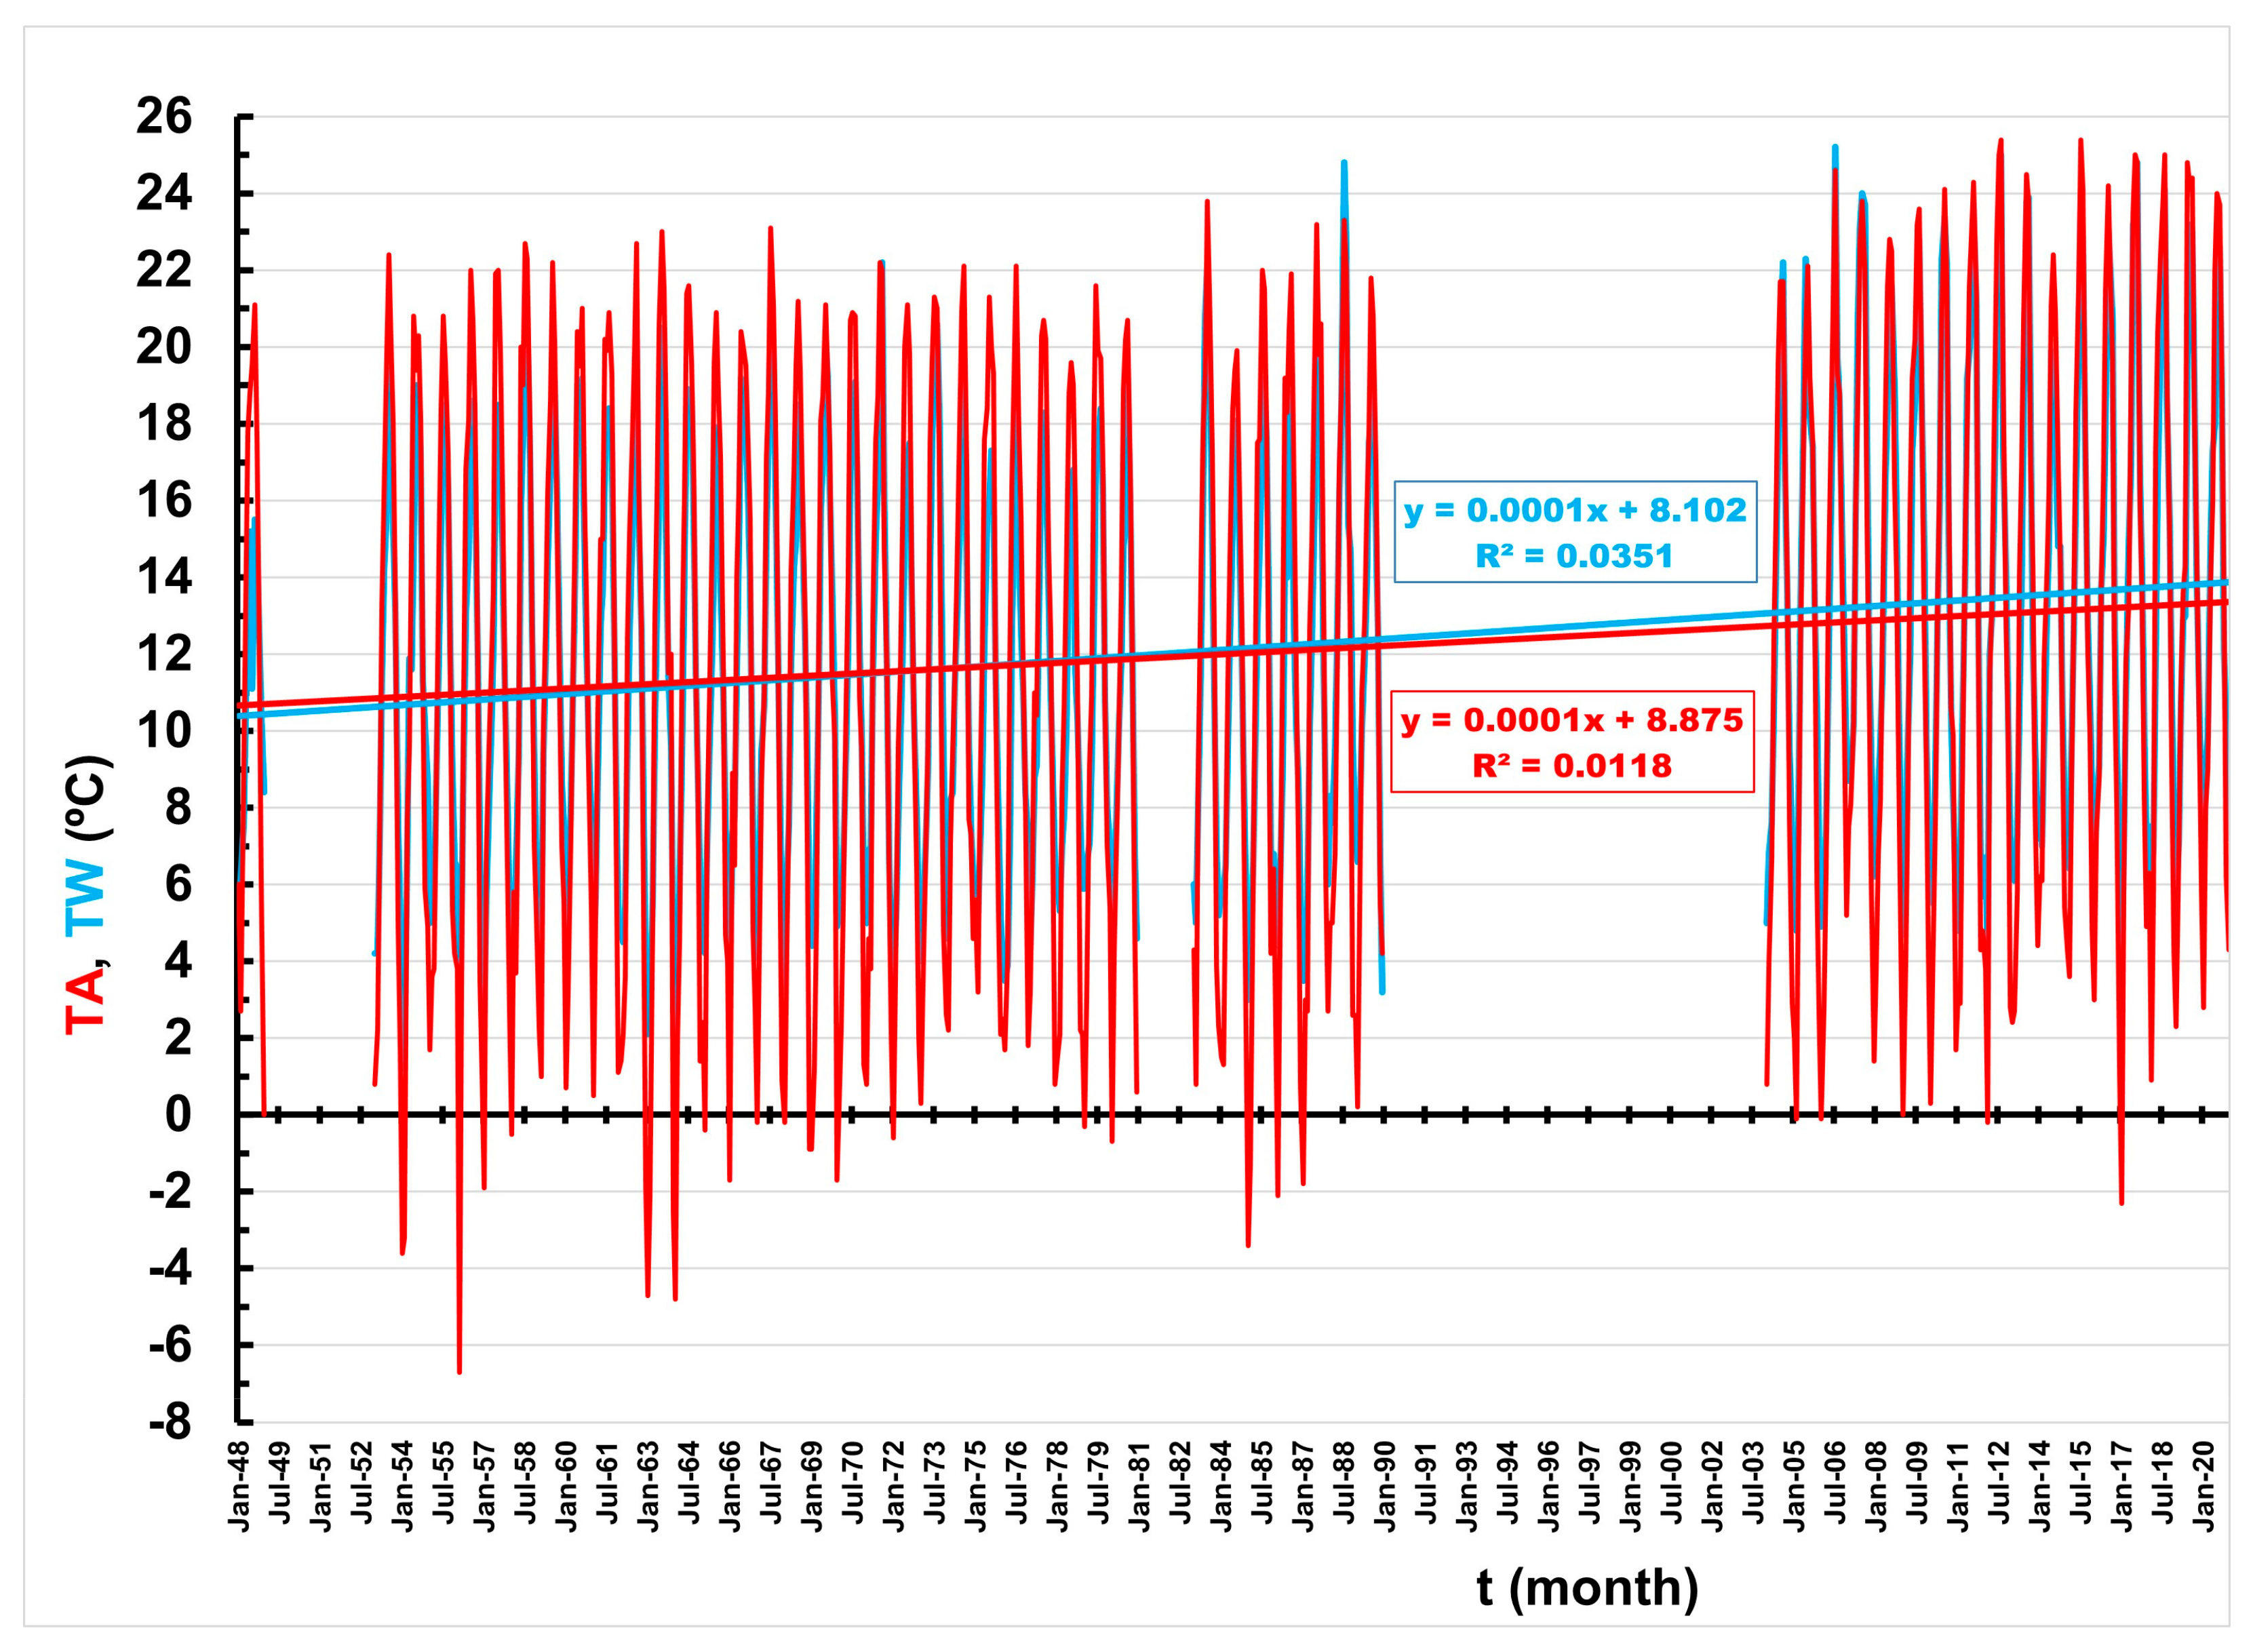
Analyze the long-term trends of the Sava River water temperature starting from 1948.
(ii)
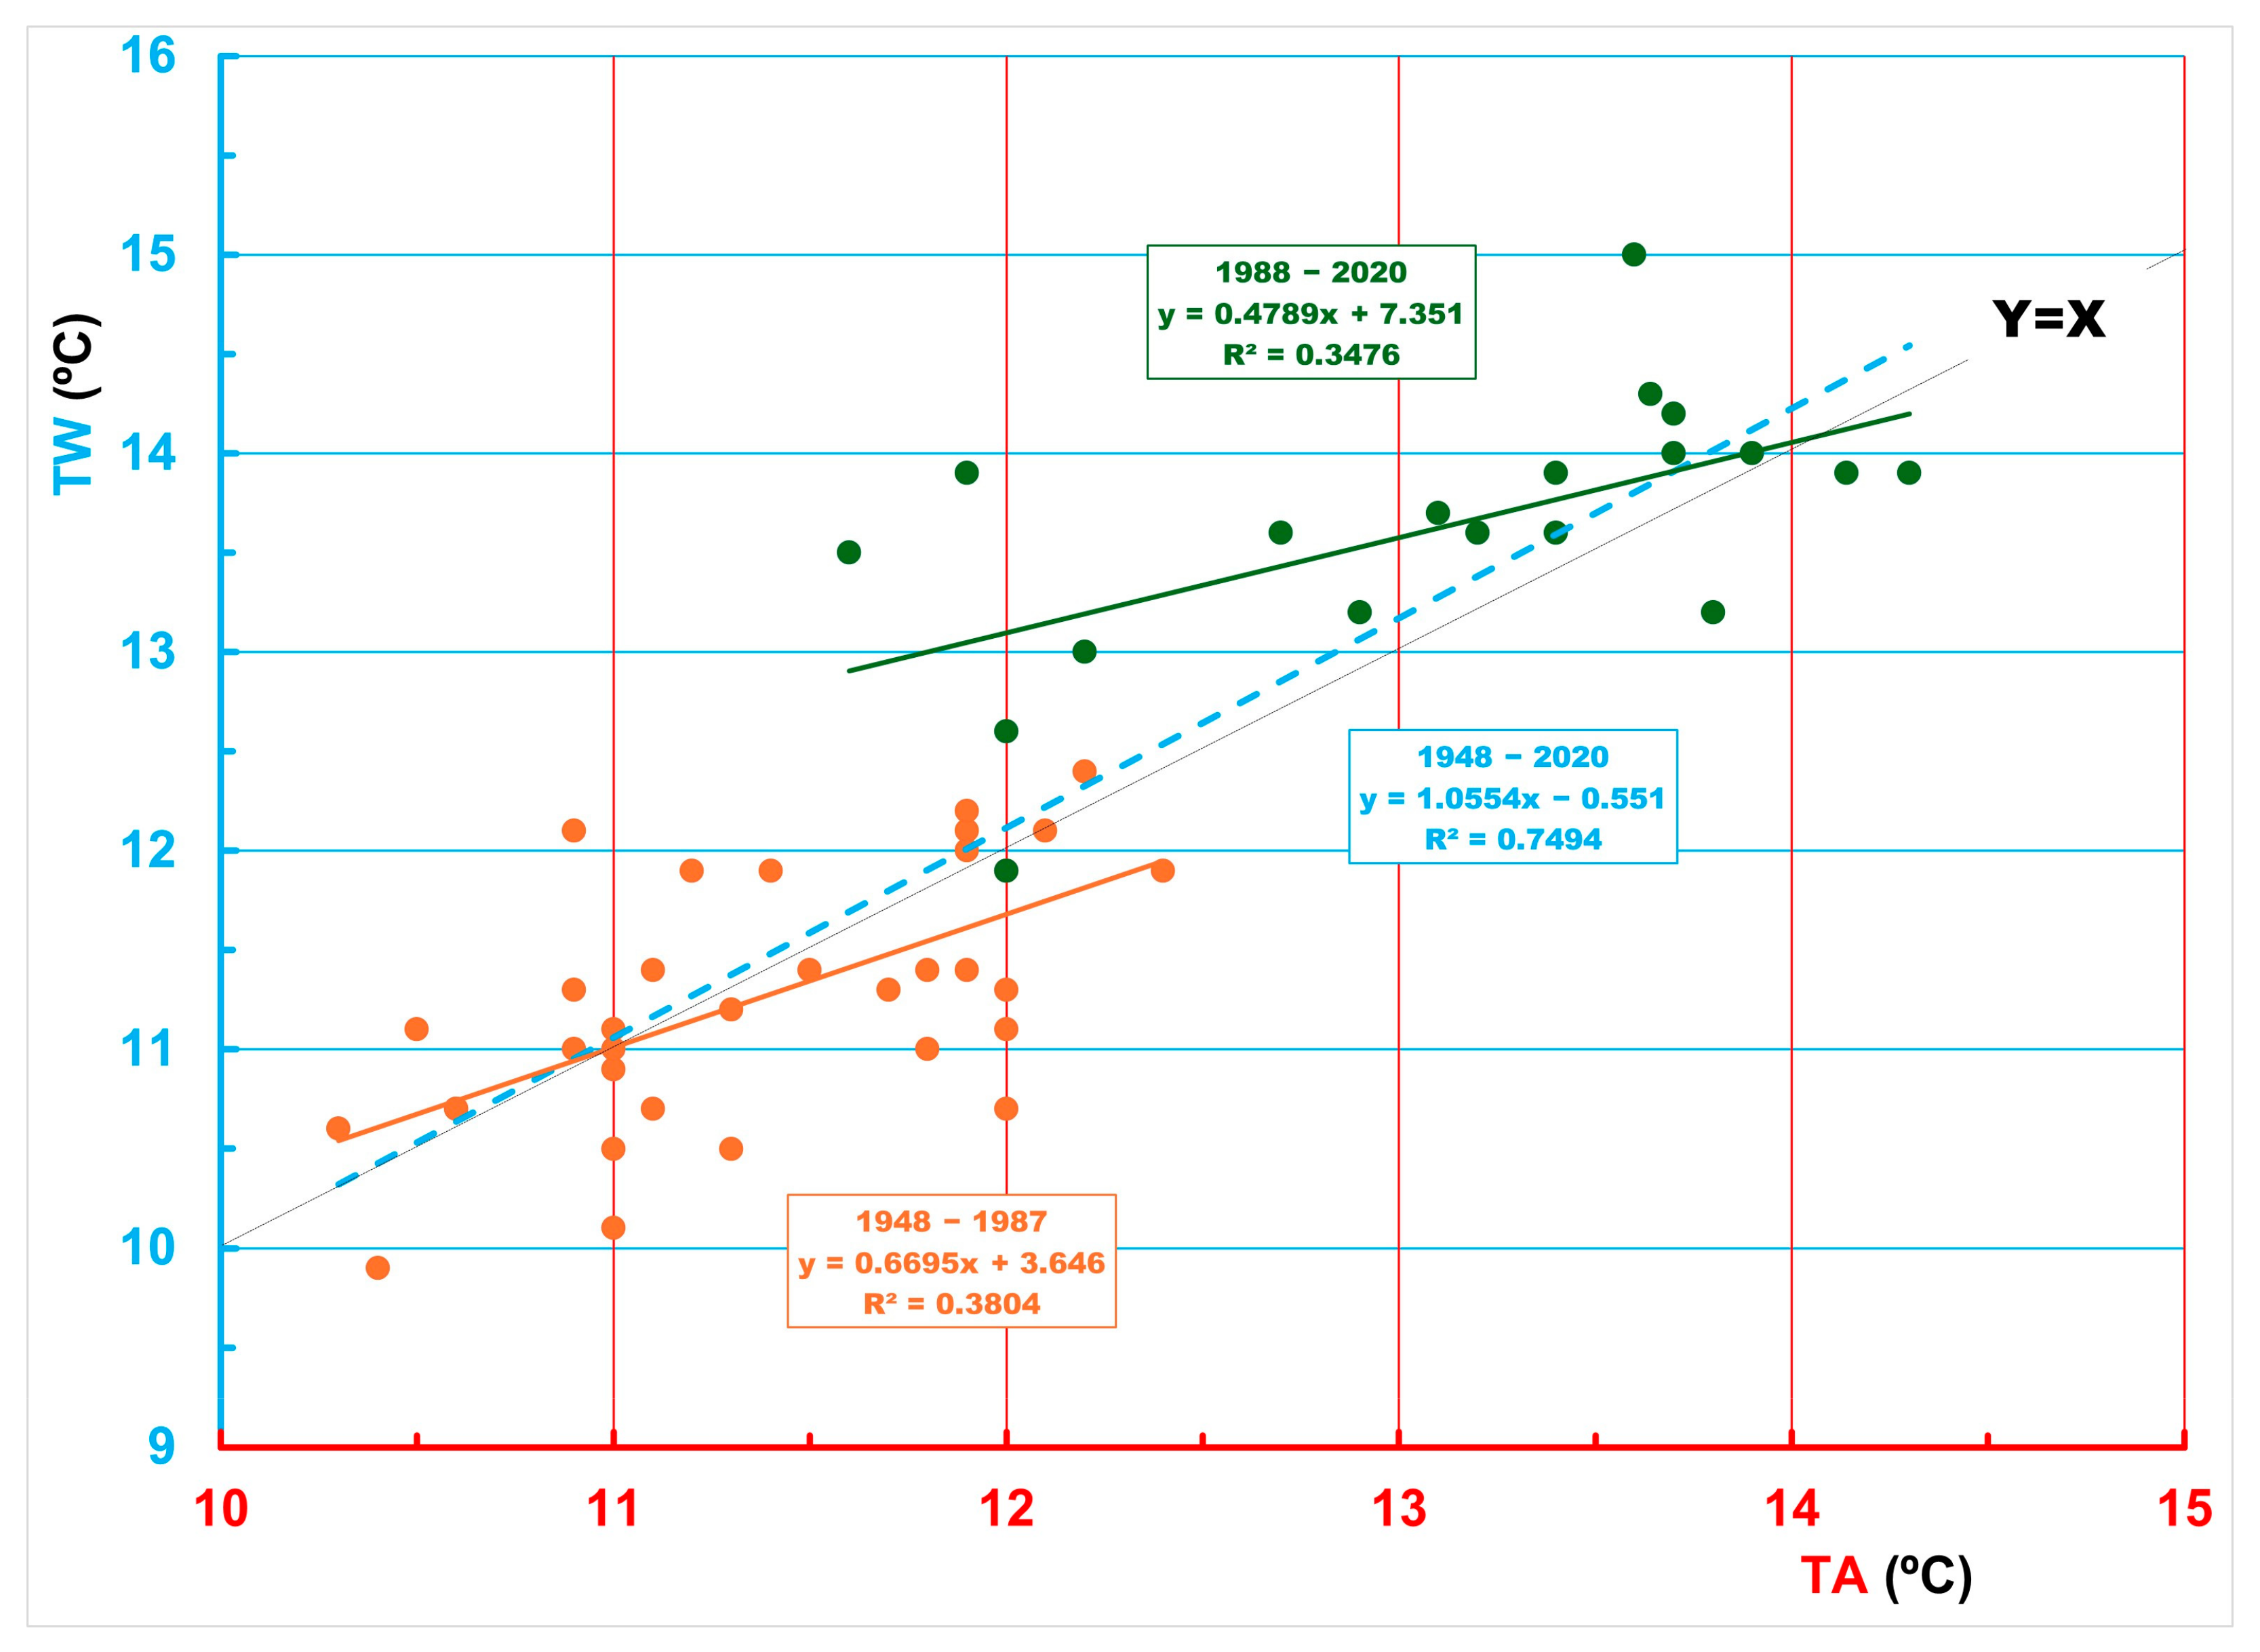
Identify the relationship between the air temperature and water temperature of the river that flows through it.
(iii)
Analyze the relationship between air and water temperature on various time scales.
(iv)
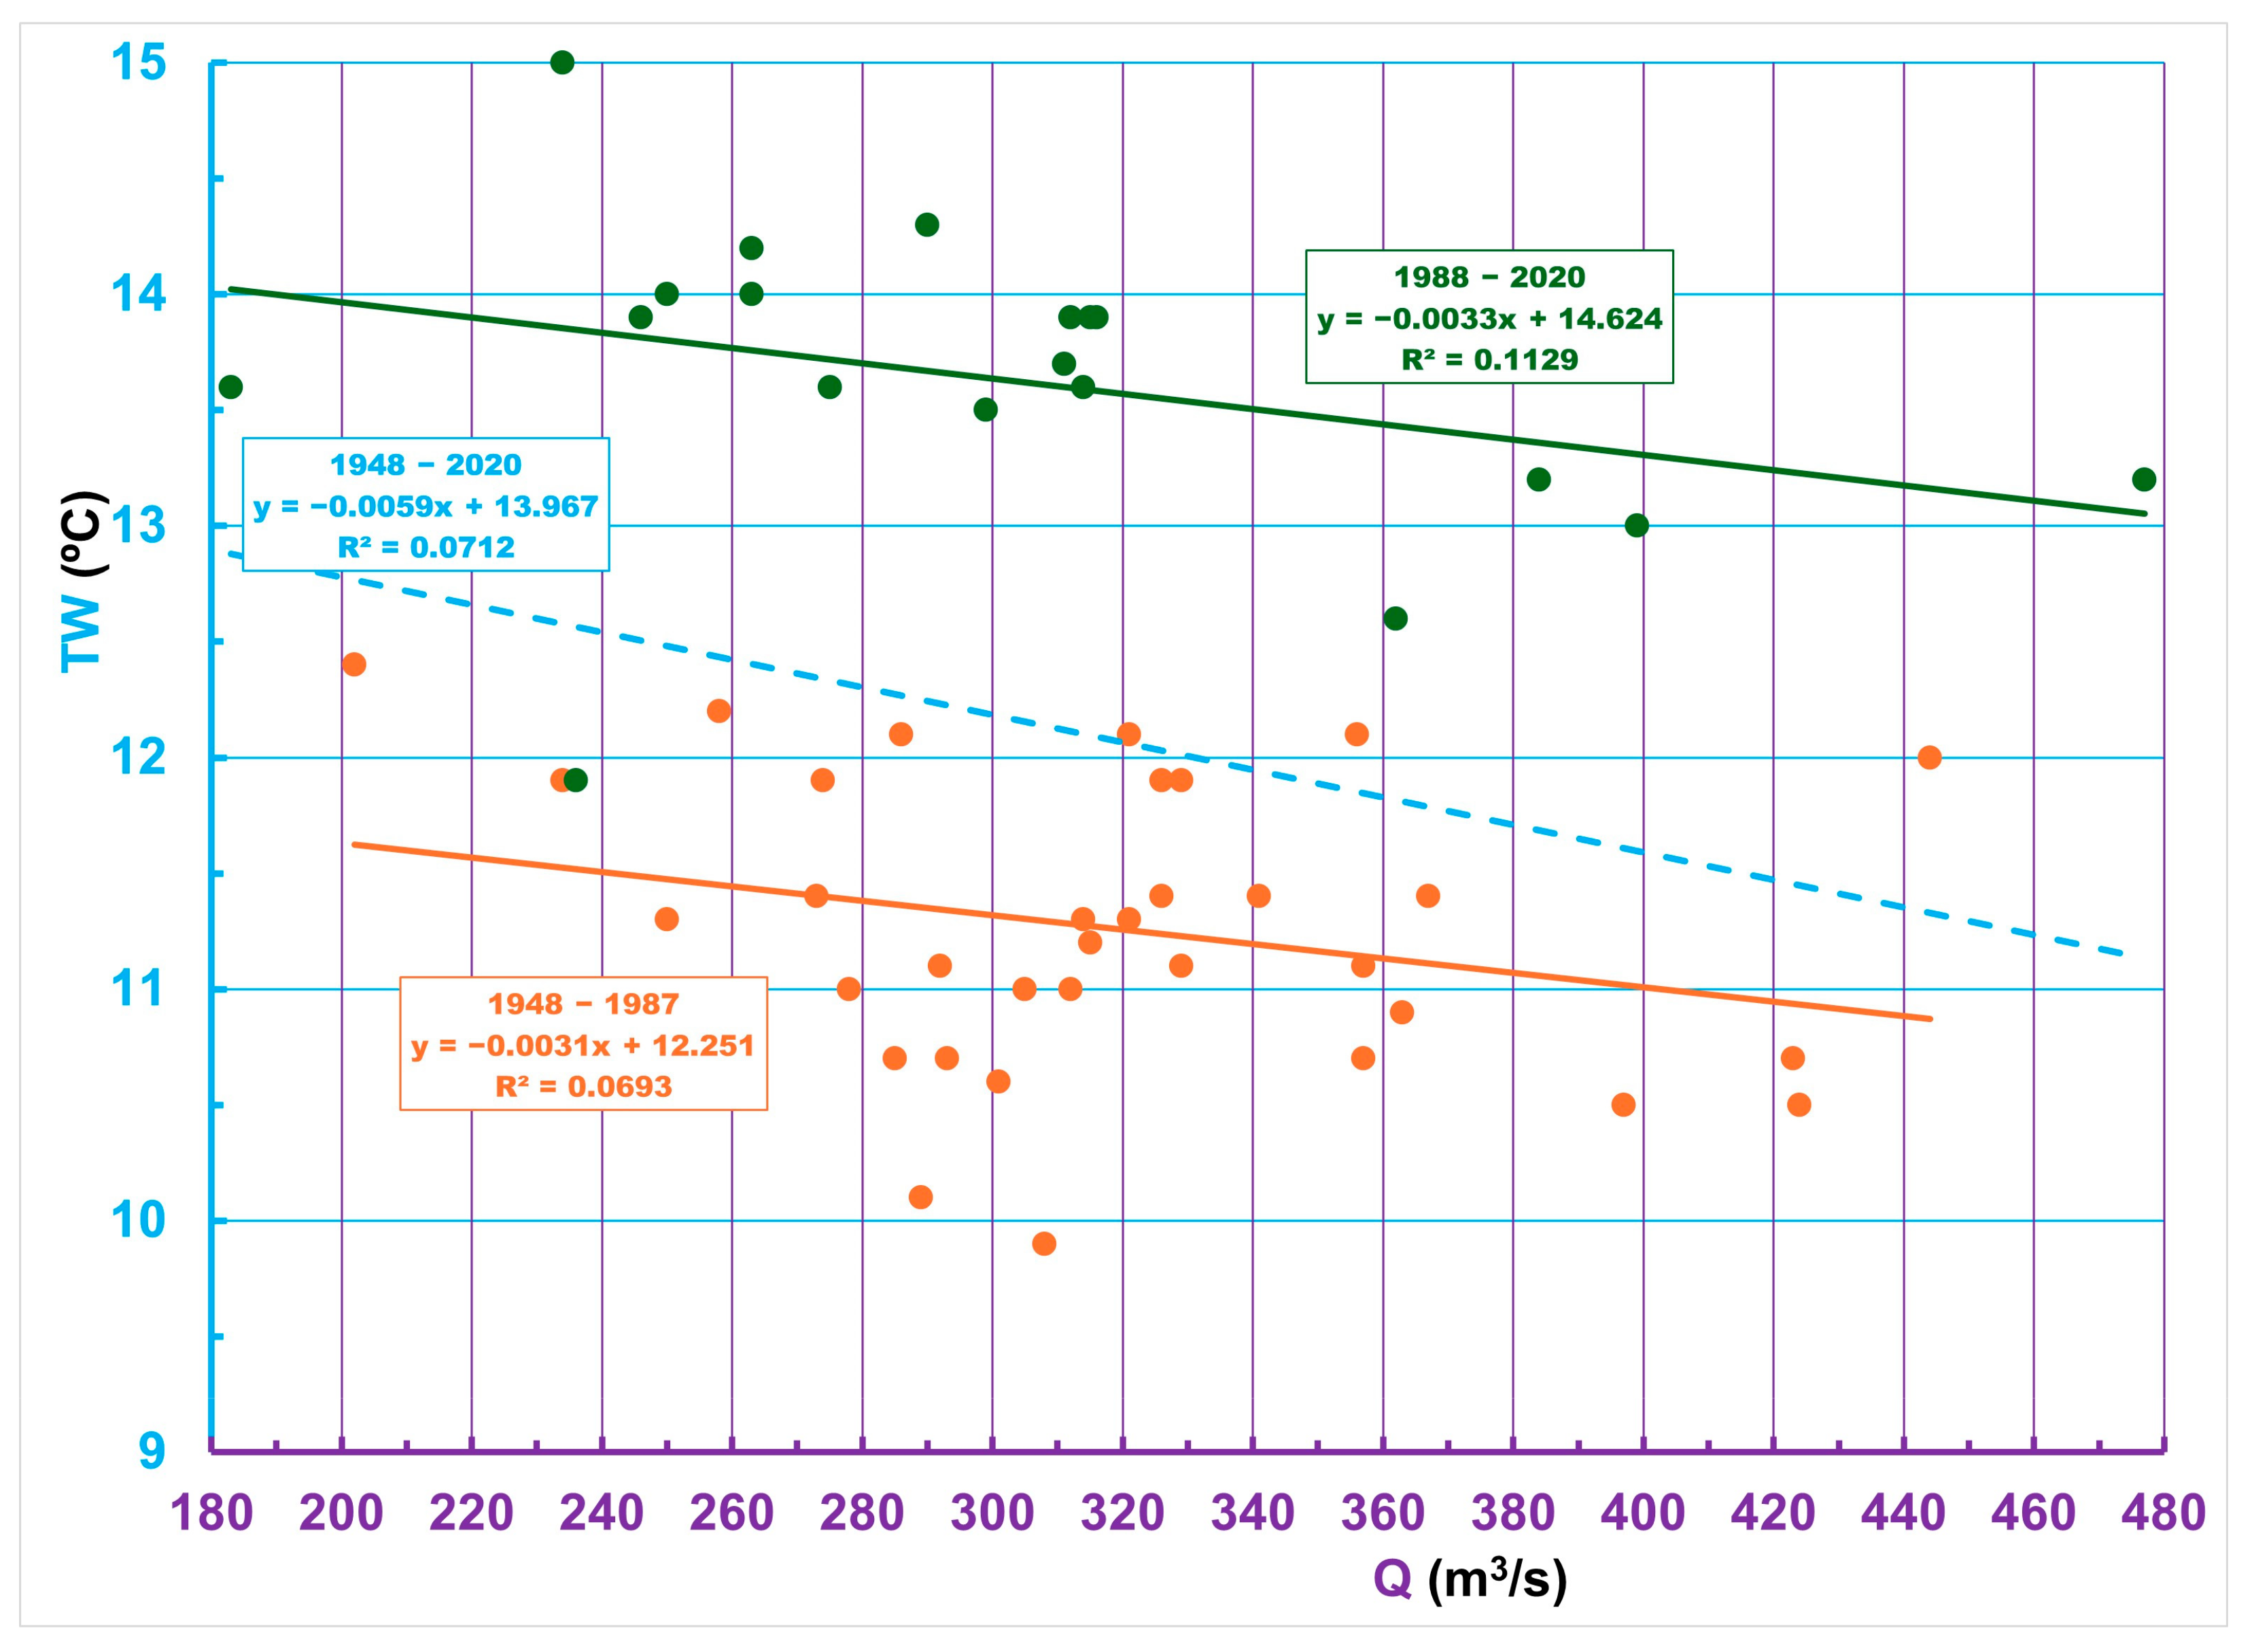
Analyze the relationship between water temperature and Sava River flow rates on various time scales.
The importance of our study lies in its being the first and only analysis of the Sava River water temperature in Zagreb to date.

2. Data and Methods

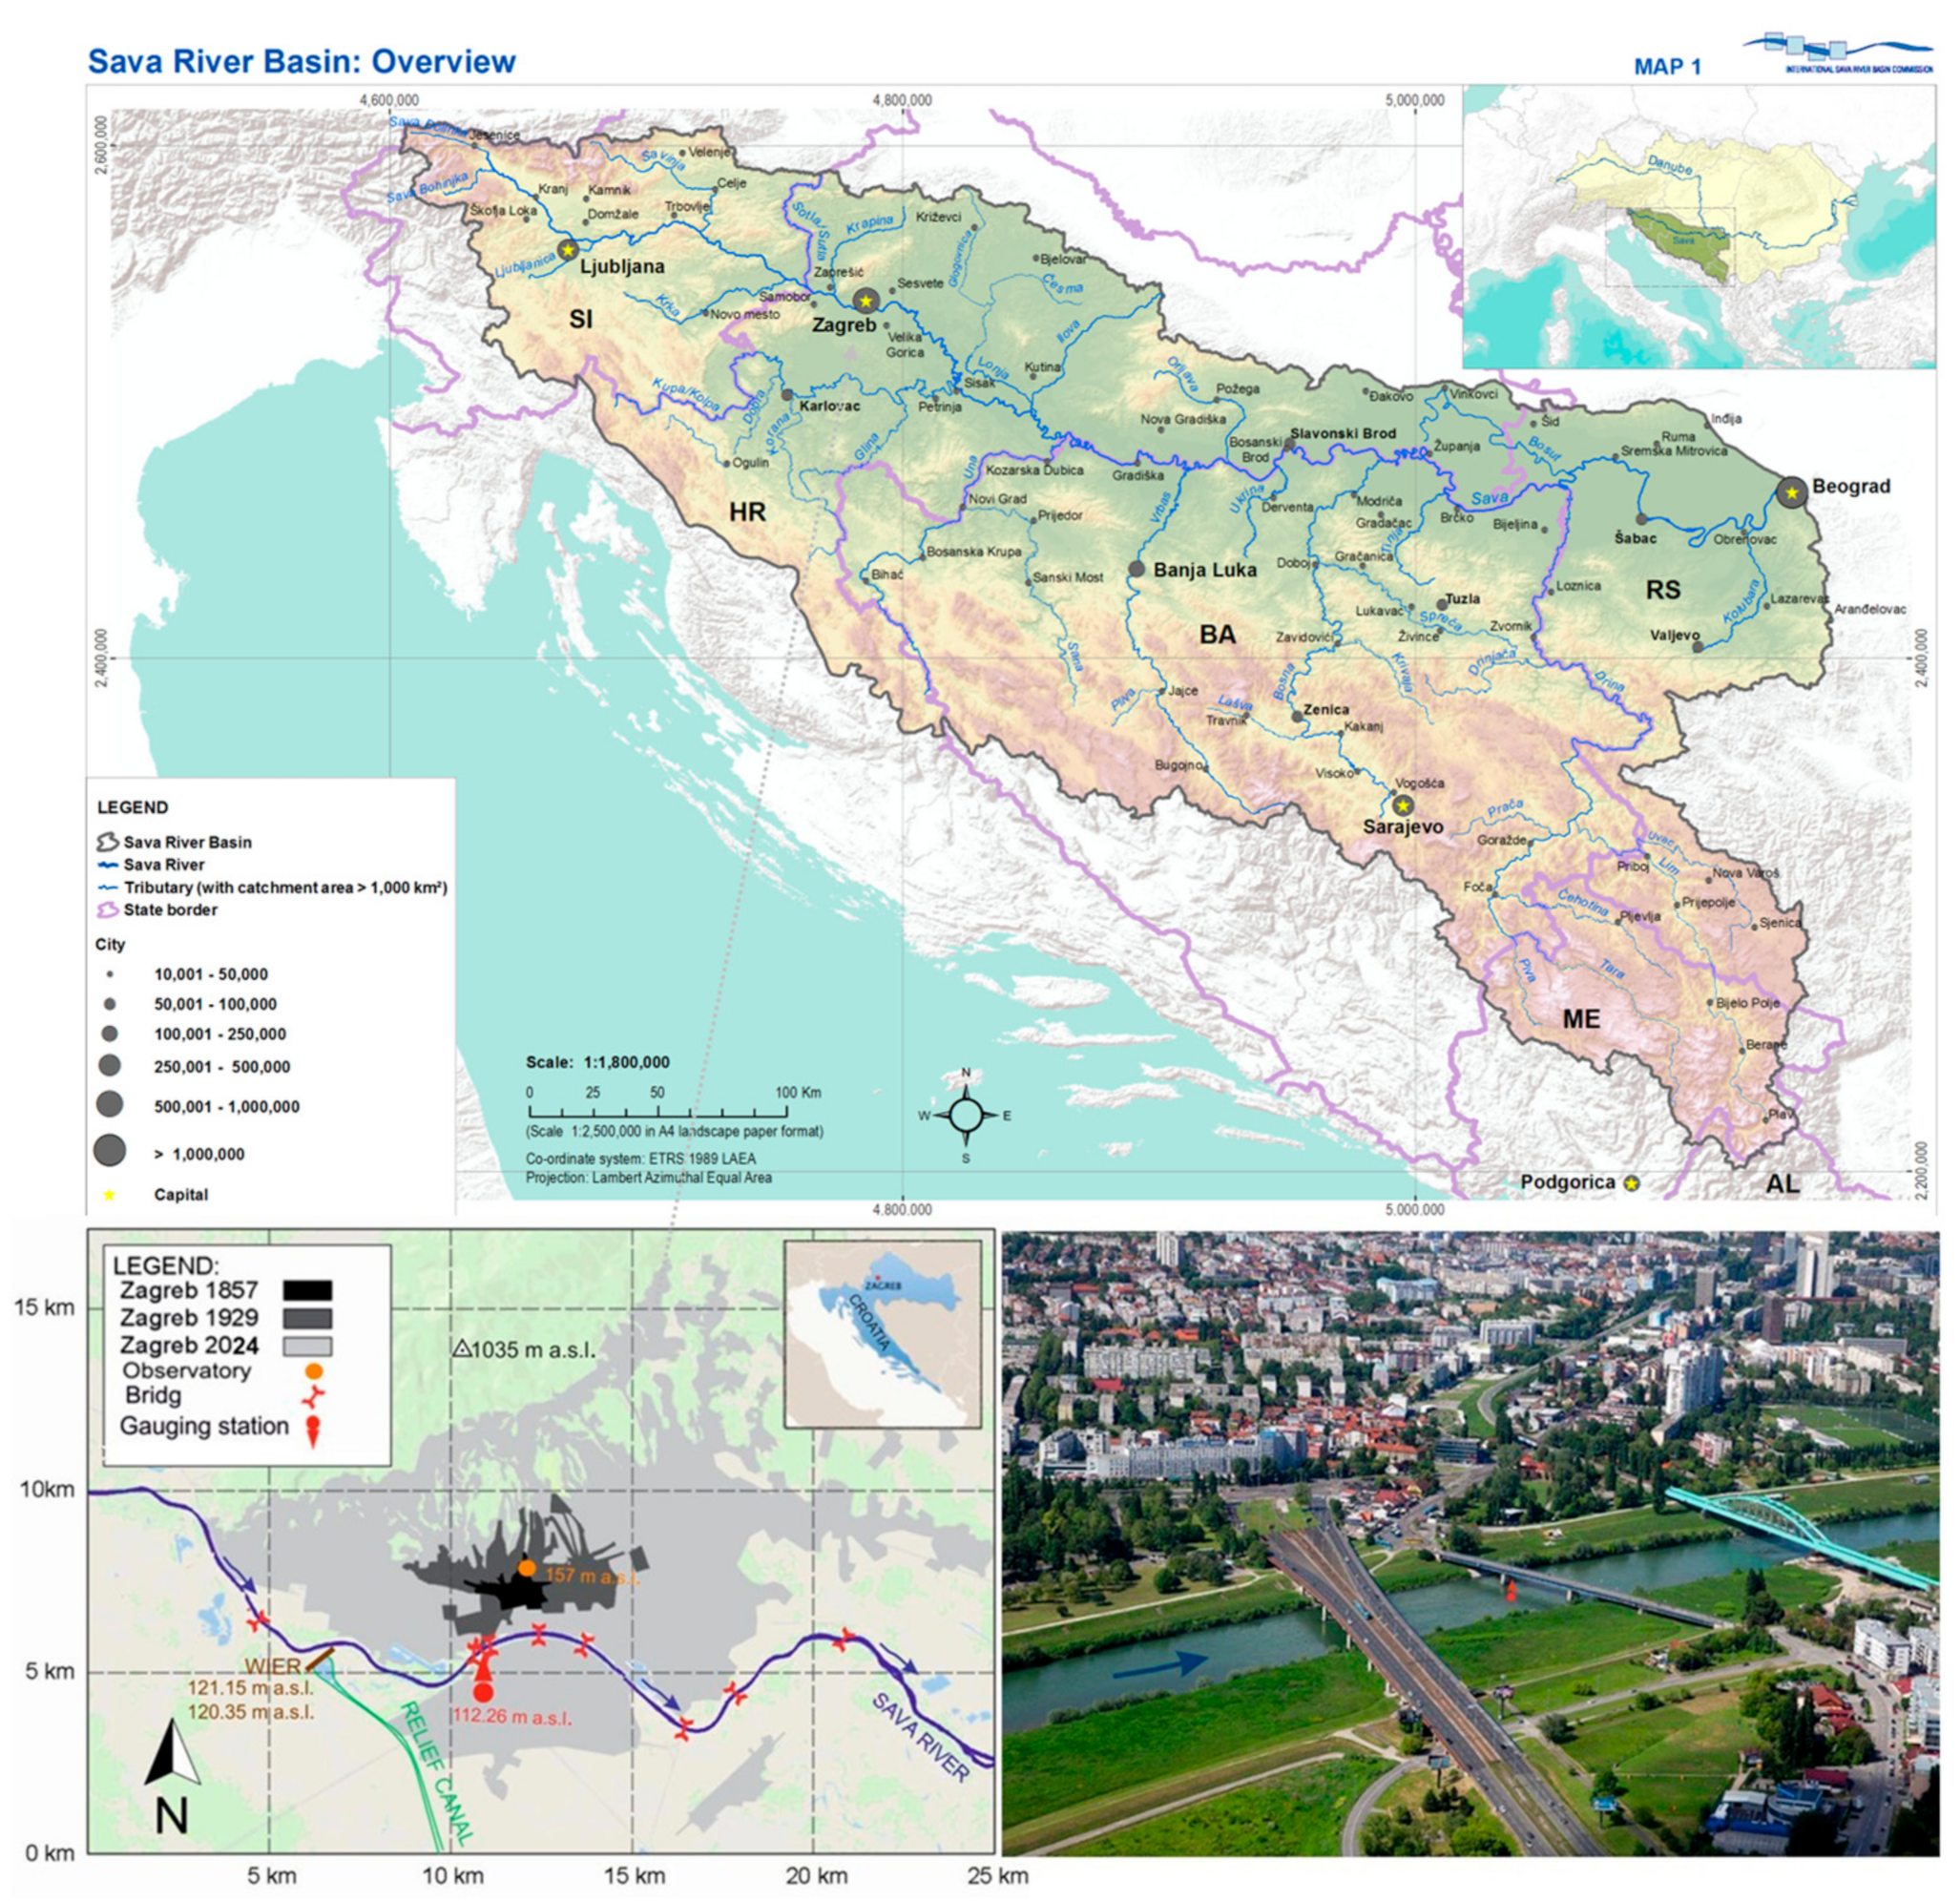
2.1. Research Area and Problematics Description

As the Sava River flows through the capital city of Croatia, Zagreb, it represents both a blessing and a threat. In the past 170 years, the urban area of Zagreb has grown from less than 100 km2 to 1700 km2, and the population has increased from 5000 to 800,000 inhabitants (Figure 1). In recent decades, urbanization processes have been rather intensive in this area. Hectares of asphalt and roofs have been constructed and exposed to the sun. The city is supplied with water from a gravel aquifer directly connected to the Sava River. Water is drawn from 30 wells at 7 water pumping stations located near the urban area.
Numerous regulatory works on the Sava River bed in Zagreb began in the late 19th century, with the majority of the interventions carried out between 1900 and 1918 when the Sava riverbed in Zagreb took on its present form [24]. The length of the regulated riverbed of the Sava from the Podsused Bridge to the Sava-Ivanja Reka Bridge is 28 km, and the average width of the riverbed is about 100 m [25].
In the area of the city of Zagreb, the Sava riverbed has a tendency to deepen, which has a significant impact on the groundwater regime and, very likely, on the thermal regime of both groundwater and the Sava River [26,27]. This paper is specific in that it analyzes the change in river water temperature at a location through a large city that is rapidly developing and expanding, thus certainly influencing the thermal regime of the Sava water in its wider surroundings. This issue has not been sufficiently studied so far. This article aims to encourage numerous colleagues from various fields to start dealing with this problem in more detail. It is apparent that a very complex process is in question whose components are not sufficiently understood. This presents a particular problem when a river flows through a large city such as Zagreb and when large amounts of groundwater are extracted from its aquifers [28,29].
For the city of Zagreb, the Sava River is a key ecological, social, and economic resource that unfortunately has not yet been sufficiently recognized and adequately treated. This is evident from the fact of how little and inadequately the issue of strong changes in its thermal regime has been studied so far. The Sava River and its entire basin upstream of Zagreb have been under great pressure in recent decades, both from human interventions and from current climate changes. The intention of the analyses carried out in this article is to highlight to our professional community the necessity of more detailed studies of the thermal regime changes of the Sava water along its course, with a strong emphasis on the wider area upstream and downstream of the capital of Croatia, Zagreb. The existing data, although unfortunately insufficient and with numerous interruptions, indicate the seriousness of the situation and the great potential for worsening conditions in the near future.

2.2. Utilized Data with a Basic Description of Measurement Locations

The primary task of this paper was to study the variations in water temperature of the Sava River measured at the Zagreb profile. The study utilized all available data from the archives of the Croatian Meteorological and Hydrological Service (DHMZ) in Zagreb and the analyses were performed over yearly, monthly, and daily timescales. For detailed analyses, during the 73-year period from 1948 to 2020, only 53 years with complete measurement series were available. The missing sub-periods were (1) 1949–1952; (2) 1981–1982; and (3) 1990–2003.
Until 2012, a classic thermometer was used to measure the water temperature, with a lower measurement limit from 0 °C to −5 °C, housed in a protective metal casing perforated at the bottom to allow free water circulation around the lower part of the thermometer. Measurements were taken in the middle of the river channel, and the thermometer was held at a specific depth for three to five minutes. Such measurements were conducted once daily. From 1 January 2012, onward, water temperature measurements of the Sava have been carried out continuously using an OTT PT-100 temperature probe. The probe was installed on 5 May 2018, on the pedestrian bridge outside the railing. Before the installation of the temperature probe, up to 31 December 2011, measurements were taken by an observer once a day (usually at 7:30 AM) along the riverbank near the bridge and the limnigraph.
In this study, air temperature data measured at the Zagreb Grič observatory were used. The observatory was located on a small hill in the city center, at the foothills of Medvednica (45°48′52″ N–15°58′19″ E) at 157 m above sea level (ASL). Its location has not been moved during the entire period of operation. Although the Zagreb-Grič observatory was surrounded by urban areas, its location on top of the hill reduced the urban heat island effect. The observatory is 3.7 km away in a straight line from the water gauge station Sava Zagreb.
The Sava Zagreb water gauge station (45°47′04″ N–15°57′12″ E) has a zero-point elevation at 112.260 m ASL. It is located at a river kilometer 702.80 rkm of the Sava, and the catchment area to this station is 12,450 km2. The official data from the DHMZ in Zagreb were used for this station as well.
Only the series of minimum and average annual discharges of the Sava River in Zagreb were analyzed for the period 1926–2022. Statistical significance probabilities, p, of the trend were calculated using the Mann–Kendall test exclusively for these two series. In all other analyses, data from the series 1948–2020 with gaps were used: (1) 1949–1952; (2) 1981–1982; (3) 1990–2003.

2.3. Utilized Methods

The linear regression method was used to quantitatively express the relationship (correlation) between the dependent and independent variables and to determine the trend of the analyzed time series. Linear trends were calculated for the available time series of water temperatures (TW), the Sava River flow (Q) in Zagreb, and air temperatures (TA) at Zagreb Grič. The regression equation (linear trend) is expressed as:
Y = (A × t) + B
where Y represents the value of the analyzed parameter in year t, and A and B are the linear regression coefficients calculated by the least squares method. The coefficient A represents the slope of the regression line, measured in °C or m3/s over the analyzed period, depending on the time series being analyzed. As such, it indicates the average intensity of the trend, increasing or decreasing. For linear trends, the coefficient of determination (R2) values were calculated and presented in the study. The sign of coefficient A indicates the direction of the linear relationship: a negative value denotes a decreasing trend, while a positive value indicates an increasing trend. The statistical significance of linear trends in this study was not assessed due to numerous interruptions in the water temperature time series.
The nonlinear regression method (second-order curve) was used to analyze the relationship between the mean monthly water temperatures of the Sava (TW) as the dependent variable and the mean monthly air temperatures at Zagreb Grič (TA) as the independent variable. The nonlinear regression equation is
TW = (C × TA2) + (D × TA) + E
where TW represents the mean monthly water temperature of the Sava, TA is the mean monthly air temperature at Zagreb Grič, and C, D, and E are the coefficients of the second-order curve. Nonlinear determination indices IR2 were also calculated.
The F-test was used to determine the statistical significance of differences in variances, while the t-test was used to assess the statistical significance of differences in the average values of the analyzed parameters in two adjacent time sub-periods [30]. For both tests, a significance level of p < 0.05 was used.

3. Results and Discussion

3.1. Analyses on an Annual Time Scale

In Figure 2, the series of characteristic (minimum, mean, and maximum) annual water temperatures of the Sava River (TW, blue) measured at the Zagreb gauging station and air temperatures (TA, red) observed at the Grič observatory are plotted. The regression lines are drawn, and their equations and determination coefficients R2 are noted. A rising trend is observed in all six analyzed series. By comparing the values of the linear regression coefficient A, it can be concluded that the most intense rising trends are observed in the series of maximum annual water temperatures of the Sava (A = 0.757 °C/10 years) and minimum air temperatures of Grič (A = 0.691 °C/10 years). It should be noted that the mean annual water temperatures of the Sava are rising faster (A = 0.468 °C/10 years) than the mean annual air temperatures of Grič (A = 0.372 °C/10 years). It is significant to note that the minimum annual water temperature of the Sava in Zagreb, TV = 0 °C, occurred in 1964, 50 years ago.
Table 1 presents the average values of characteristic water temperatures of the Sava (TW) and air temperatures at Grič (TA), as well as their differences ΔT = TW − TA for the period 1948–2020. While the minimum annual air temperatures at Grič are always significantly lower than those of the Sava water, the situation is reversed for maximum temperatures. The average values of the annual mean temperatures of the Sava water and the Grič air during the analyzed period and based on the available 53 years of joint observation are practically the same, differing by only 0.11 °C, with the Sava water temperature being higher.
Interruptions in observations certainly affect the ability to draw reliable conclusions about the behavior of the analyzed time series. Regardless, trends of increase are clearly observed in all six analyzed time series. The mean annual temperatures of water and air show almost identical values and very similar behavior during the available period of water temperature measurements.
In a series of published papers, it has been definitively confirmed that in the recent period starting from 1988, there has been an intensification of the rising trend of mean annual air temperatures at Grič [31,32,33,34]. The average values of the annual mean air temperatures not only at Grič but also at other climatological stations in the area of the city of Zagreb up to 1987 were statistically significantly lower than those in the recent period starting from 1988. This fact indicates the necessity to attempt to analyze the behavior of the Sava water temperatures in the following two sub-periods: (1) 1948–1987 and (2) 1988–2020.
Table 2 presents the values of average water temperatures of the Sava (TW), air temperatures at Grič (TA), and their differences ΔT = TW − TA in two sub-periods: (1) 1948–1987 and (2) 1988–2020. The probability (p) of statistical differences between the average values of the adjacent sub-periods was determined by the t-test. Cases where the average values of the three analyzed parameters (TW, TA, ΔT) in the two adjacent sub-periods are statistically significantly different, i.e., when the probability is p < 0.05, are marked in red. For the Sava water temperatures (TW), the differences are statistically significant for all three characteristic annual temperatures.
Figure 3 shows the relationships between the mean annual water temperatures of the Sava in Zagreb (TW) and the mean annual air temperatures at Grič (TA) during the joint period 1948–2020 (blue), for the sub-period 1948–1987 (brown), and the recent sub-period 1988–2020 (green). The regression lines are drawn, and their equations and determination coefficients R2 for all three mentioned periods are noted. A clear difference observed in the last thirty years compared with the previous sub-period is apparent. There has been a significant increase in both water and air temperatures.
The relationships between the mean annual water temperatures of the Sava in Zagreb (TW) and the mean annual flows of the Sava in Zagreb (Q) for the period 1948–2020 (blue), in the sub-period 1948–1987 (brown), and the recent sub-period 1988–2020 (green) are plotted in Figure 4. The regression lines are drawn, and their equations and determination coefficients R2 for all three mentioned periods are noted. Their relationship is inversely proportional. With a decrease in mean annual flows, there is an increase in mean annual water temperatures of the Sava. This process is significantly greater in the recent period (1988–2020) than in the previous one (1948–1987).

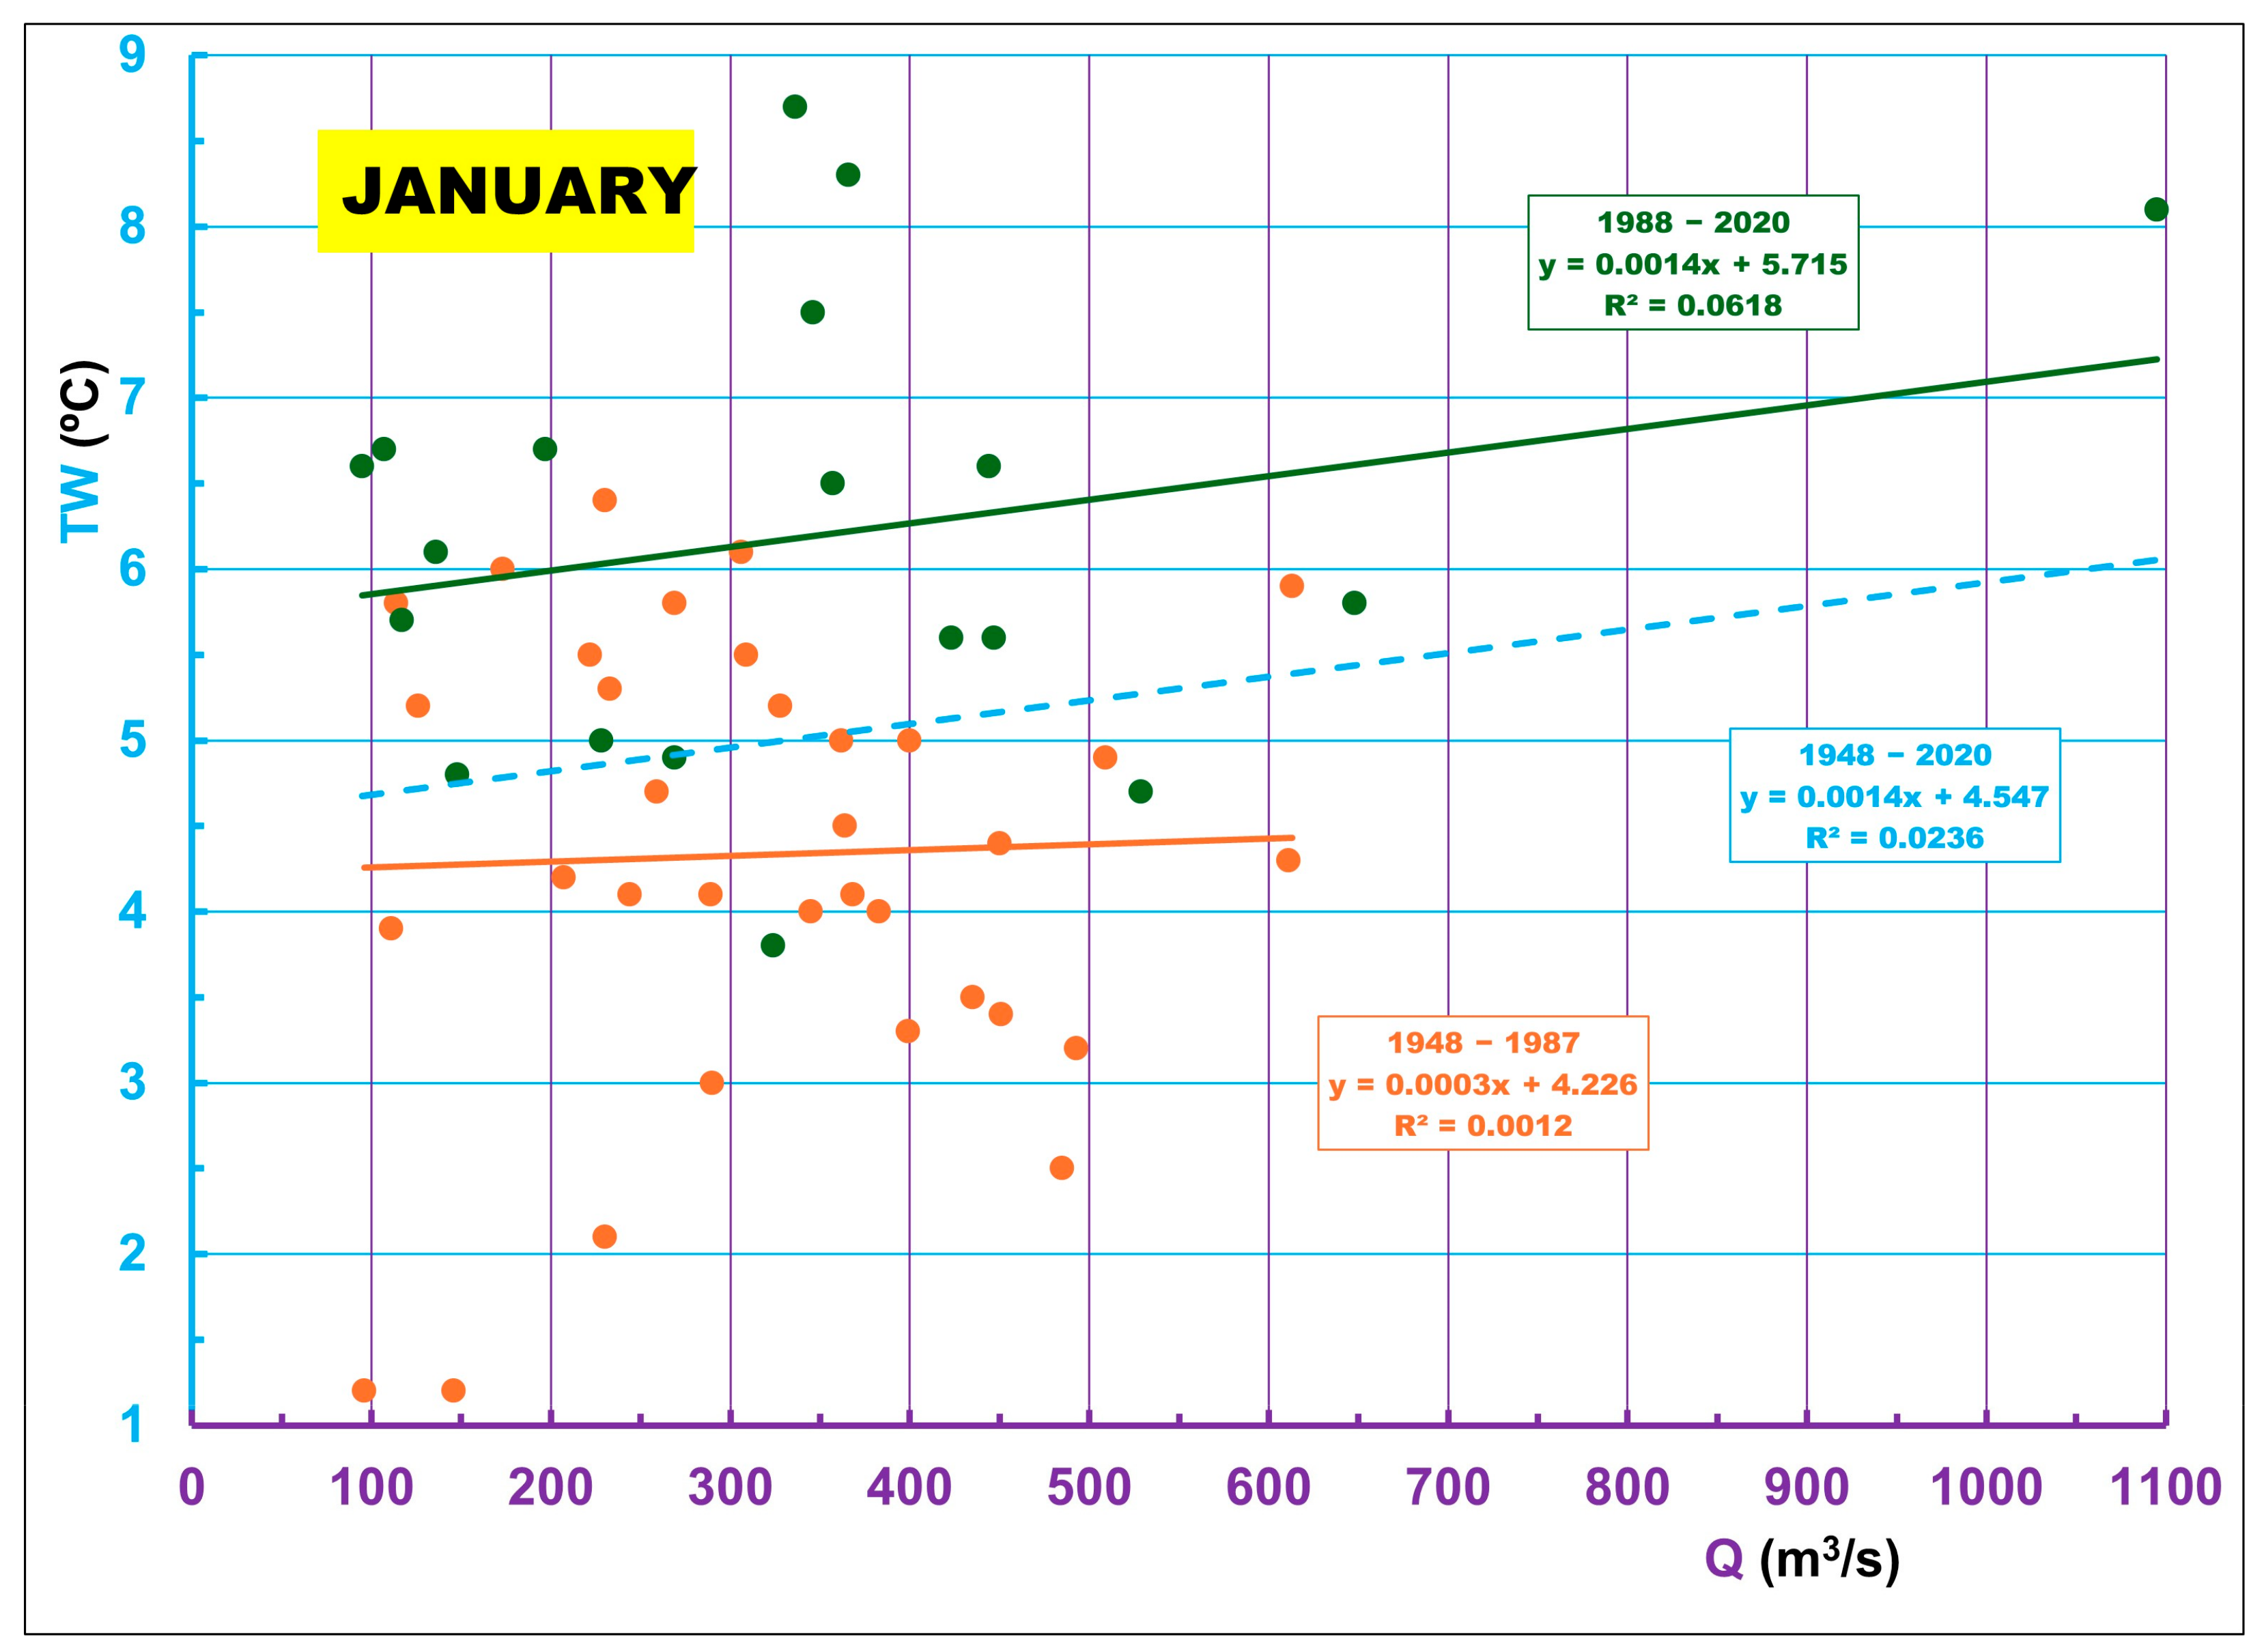
3.2. Analyses on a Monthly Time Scale

Analyses conducted on a shorter time scale will allow for a more subtle investigation of the variation processes of the Sava River water temperatures in Zagreb. This chapter analyzes the behavior of the mean monthly water temperatures of the Sava River. Given that there are 53 complete years in the period from 1948 to 2020, it was possible to analyze data collected over 636 months.
In Figure 5, two series of mean monthly water temperatures of the Sava River in Zagreb (TW, blue) and mean monthly air temperatures at Grič (TA, red) during the joint period from January 1948 to December 2020 are shown. The regression lines are drawn, and their equations and determination coefficients R2 are indicated. Both series exhibit a slight upward trend, with the trend being slightly more pronounced for the water temperature series compared with the air temperature series at Grič.
The graphical representation of the relationship between the mean monthly water temperatures of the Sava River in Zagreb (TW, ordinate axis) and the mean monthly air temperatures at Grič (TA, abscissa axis) during the two sub-periods of joint observation, from January 1948 to December 1987 (brown) and from January 1988 to December 2020 (green), is shown in Figure 6. It is evident that the relationship is nonlinear (second-order parabola) and that the determination index (IR2) values in both sub-periods are very high. It is also clearly noticeable that the temperatures of both water and air are significantly higher in the recent sub-period 1988–2020.
To analyze the differences in the behavior of the Sava River water temperatures during each month of the year in the two previously selected sub-periods (1948–1987 and 1988–2020), Table 3 lists the average monthly water temperatures of the Sava (TW) in the mentioned sub-periods and their differences (ΔTW). Using the F-test and t-test, the probabilities (p) of the differences in variances and average values of the sub-series were calculated. The smallest difference, ΔTW = 1.18 °C, occurred in December, while the largest difference, ΔTW = 3.97 °C, occurred in July. The differences are significantly higher in the warm part of the year (June–August) than in the cold part of the year (November–February). In all months, the difference between the average monthly water temperatures of the Sava in the second, recent, sub-period (1988–2020) is statistically significantly higher than in the previous one (1948–1987), with p << 0.01. Based on the results of the previous analysis, it can be concluded that the rise in the Sava River water temperatures in the recent period is intensifying and that this process is much faster in the warm part of the year than in the cold season.
Histograms of the average monthly water temperatures of the Sava River in Zagreb (TW, blue) and the average monthly flows of the Sava in Zagreb (Q, purple) during the joint period from January 1948 to December 2020, shown in Figure 7, indicate that the highest water temperatures (TW) (and air temperatures TA) coincide with the lowest average flows of the Sava in Zagreb (Q).
From an ecological perspective, this is the most dangerous possible interaction of low flows and high water temperatures. Most dangerously, this process is intensifying in the recent period, as can be seen from Figure 8 and Figure 9. Figure 8 shows the relationships between the mean monthly water temperatures of the Sava River in Zagreb (TW) and the mean monthly flows of the Sava in Zagreb (Q) in January during the period 1948–2020 (blue), for the sub-period 1948–1987 (brown), and for the recent sub-period 1988–2020 (green).
Figure 9 shows the same relationships but this time in July. While there is no dependence between TW and Q in January, it is inversely proportional and significantly strong in July, as evidenced by the high determination coefficient values R2 > 0.79 in both analyzed sub-periods.

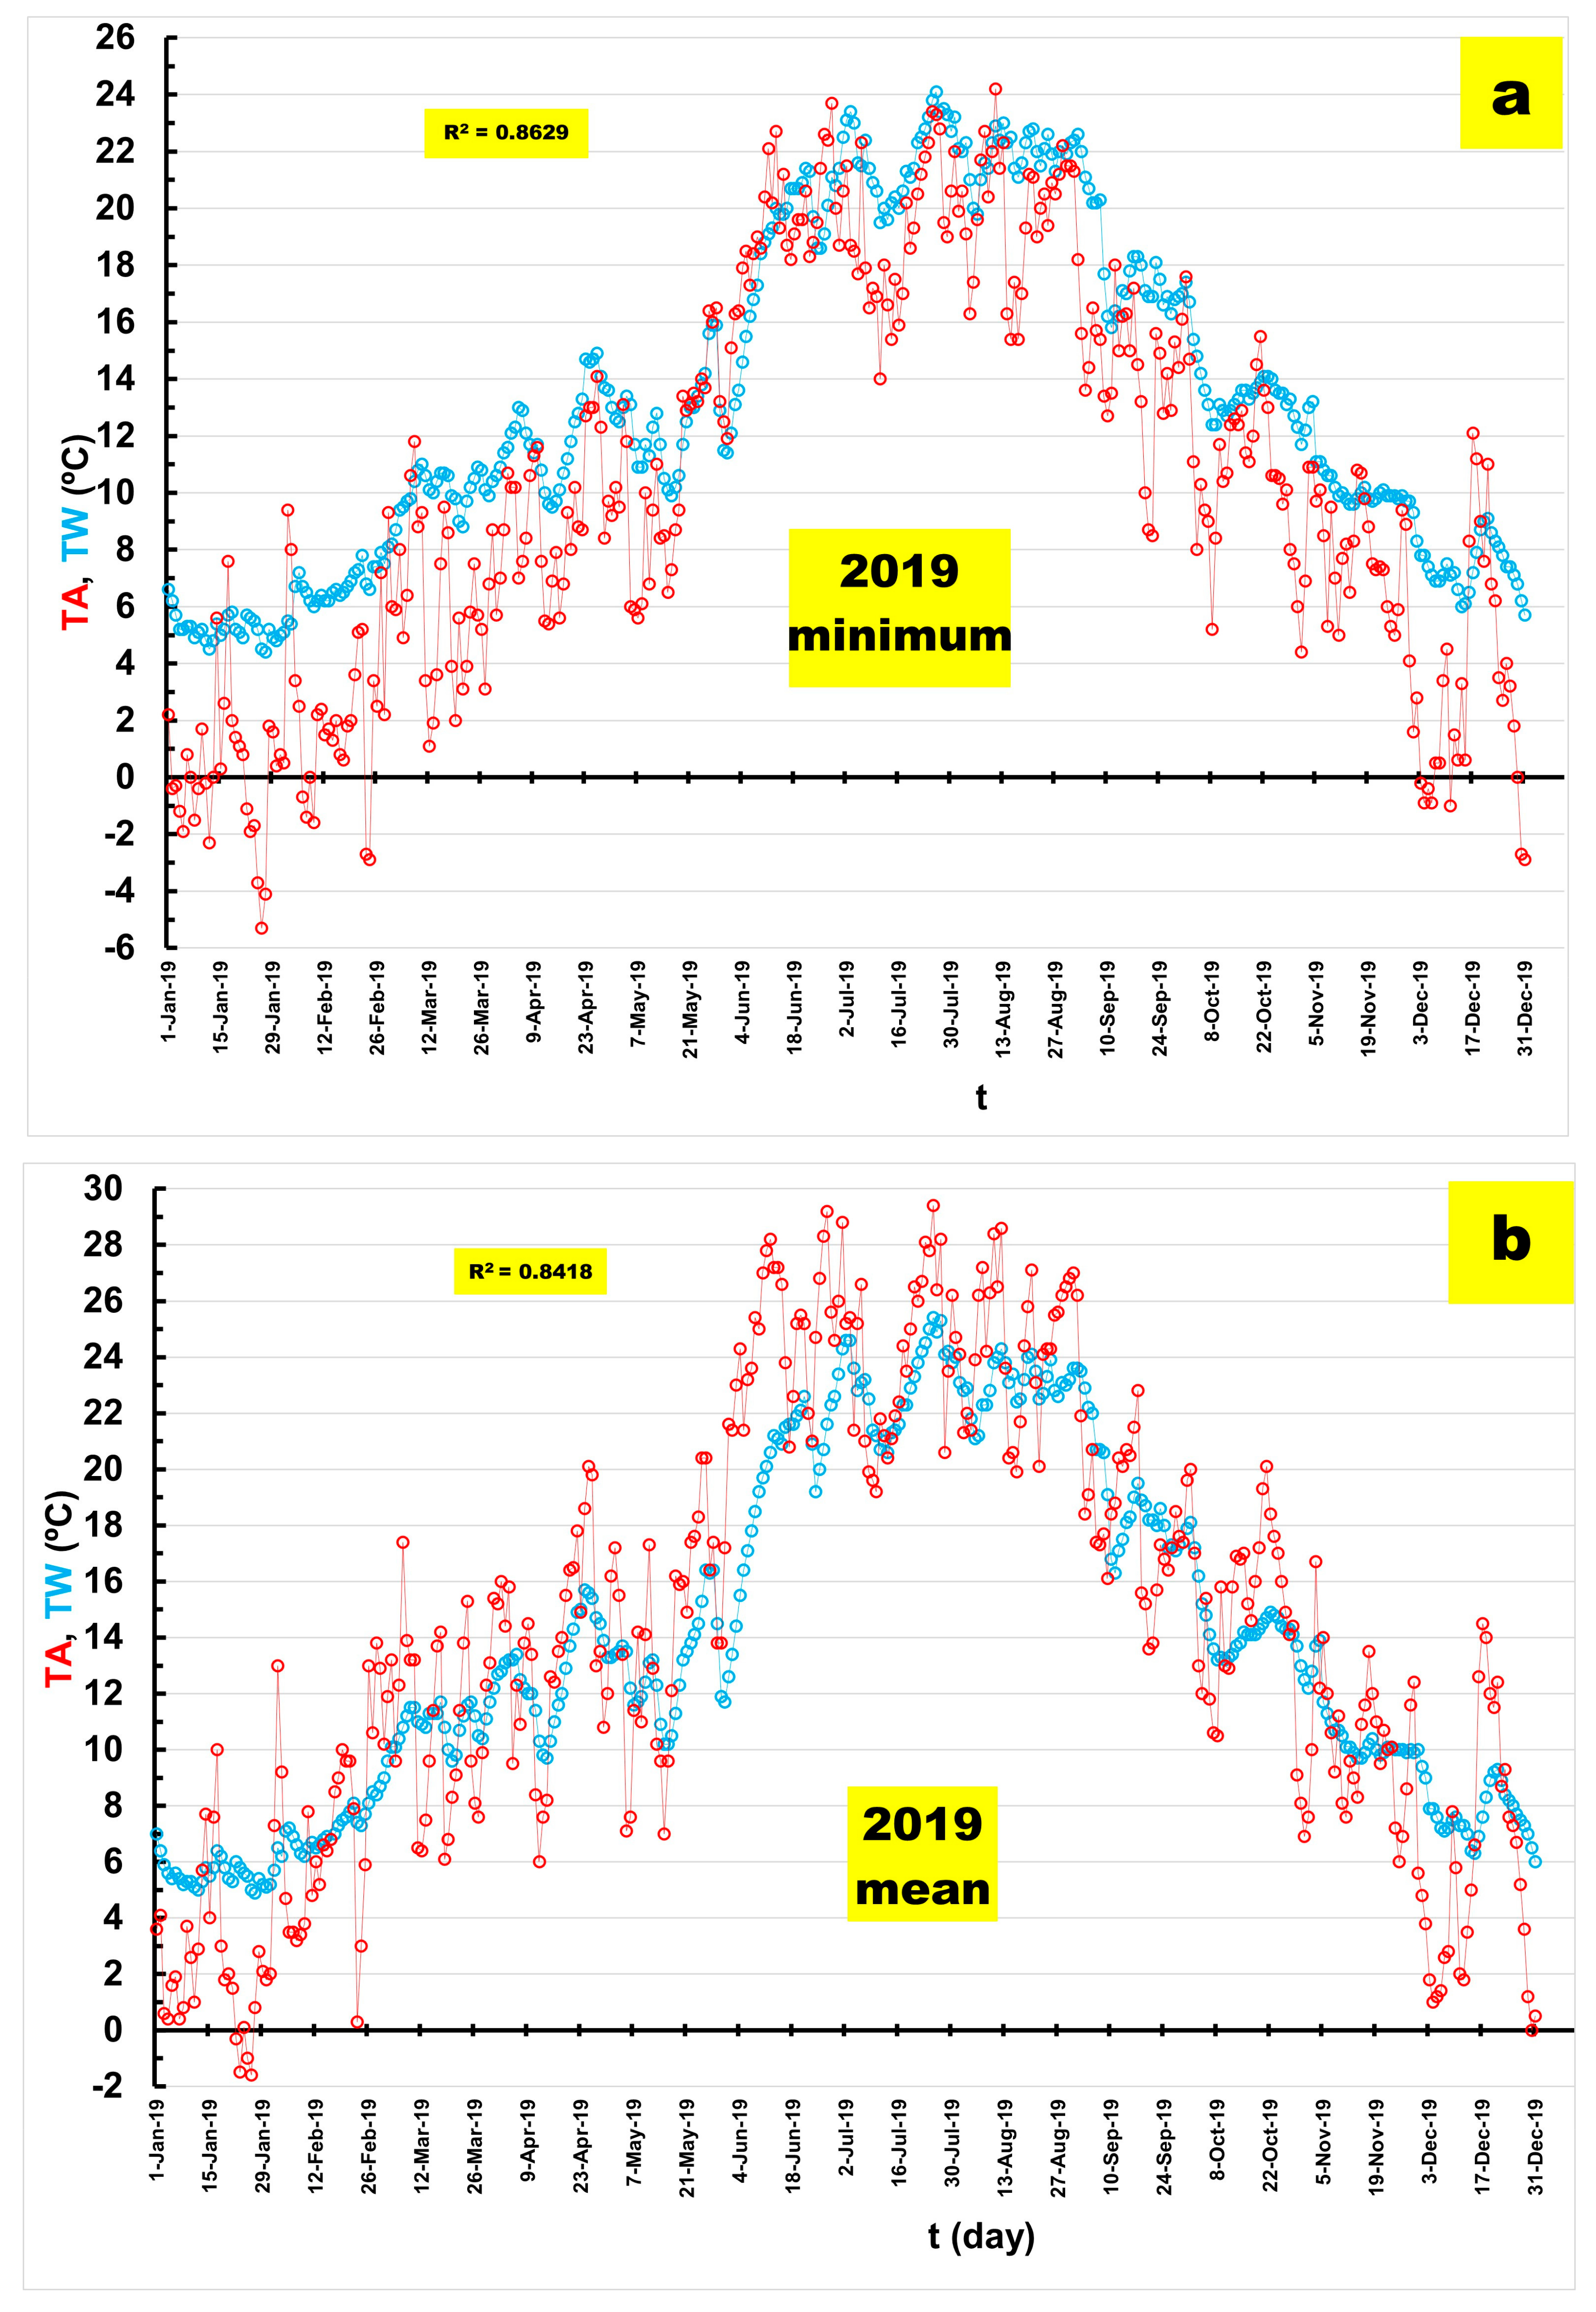
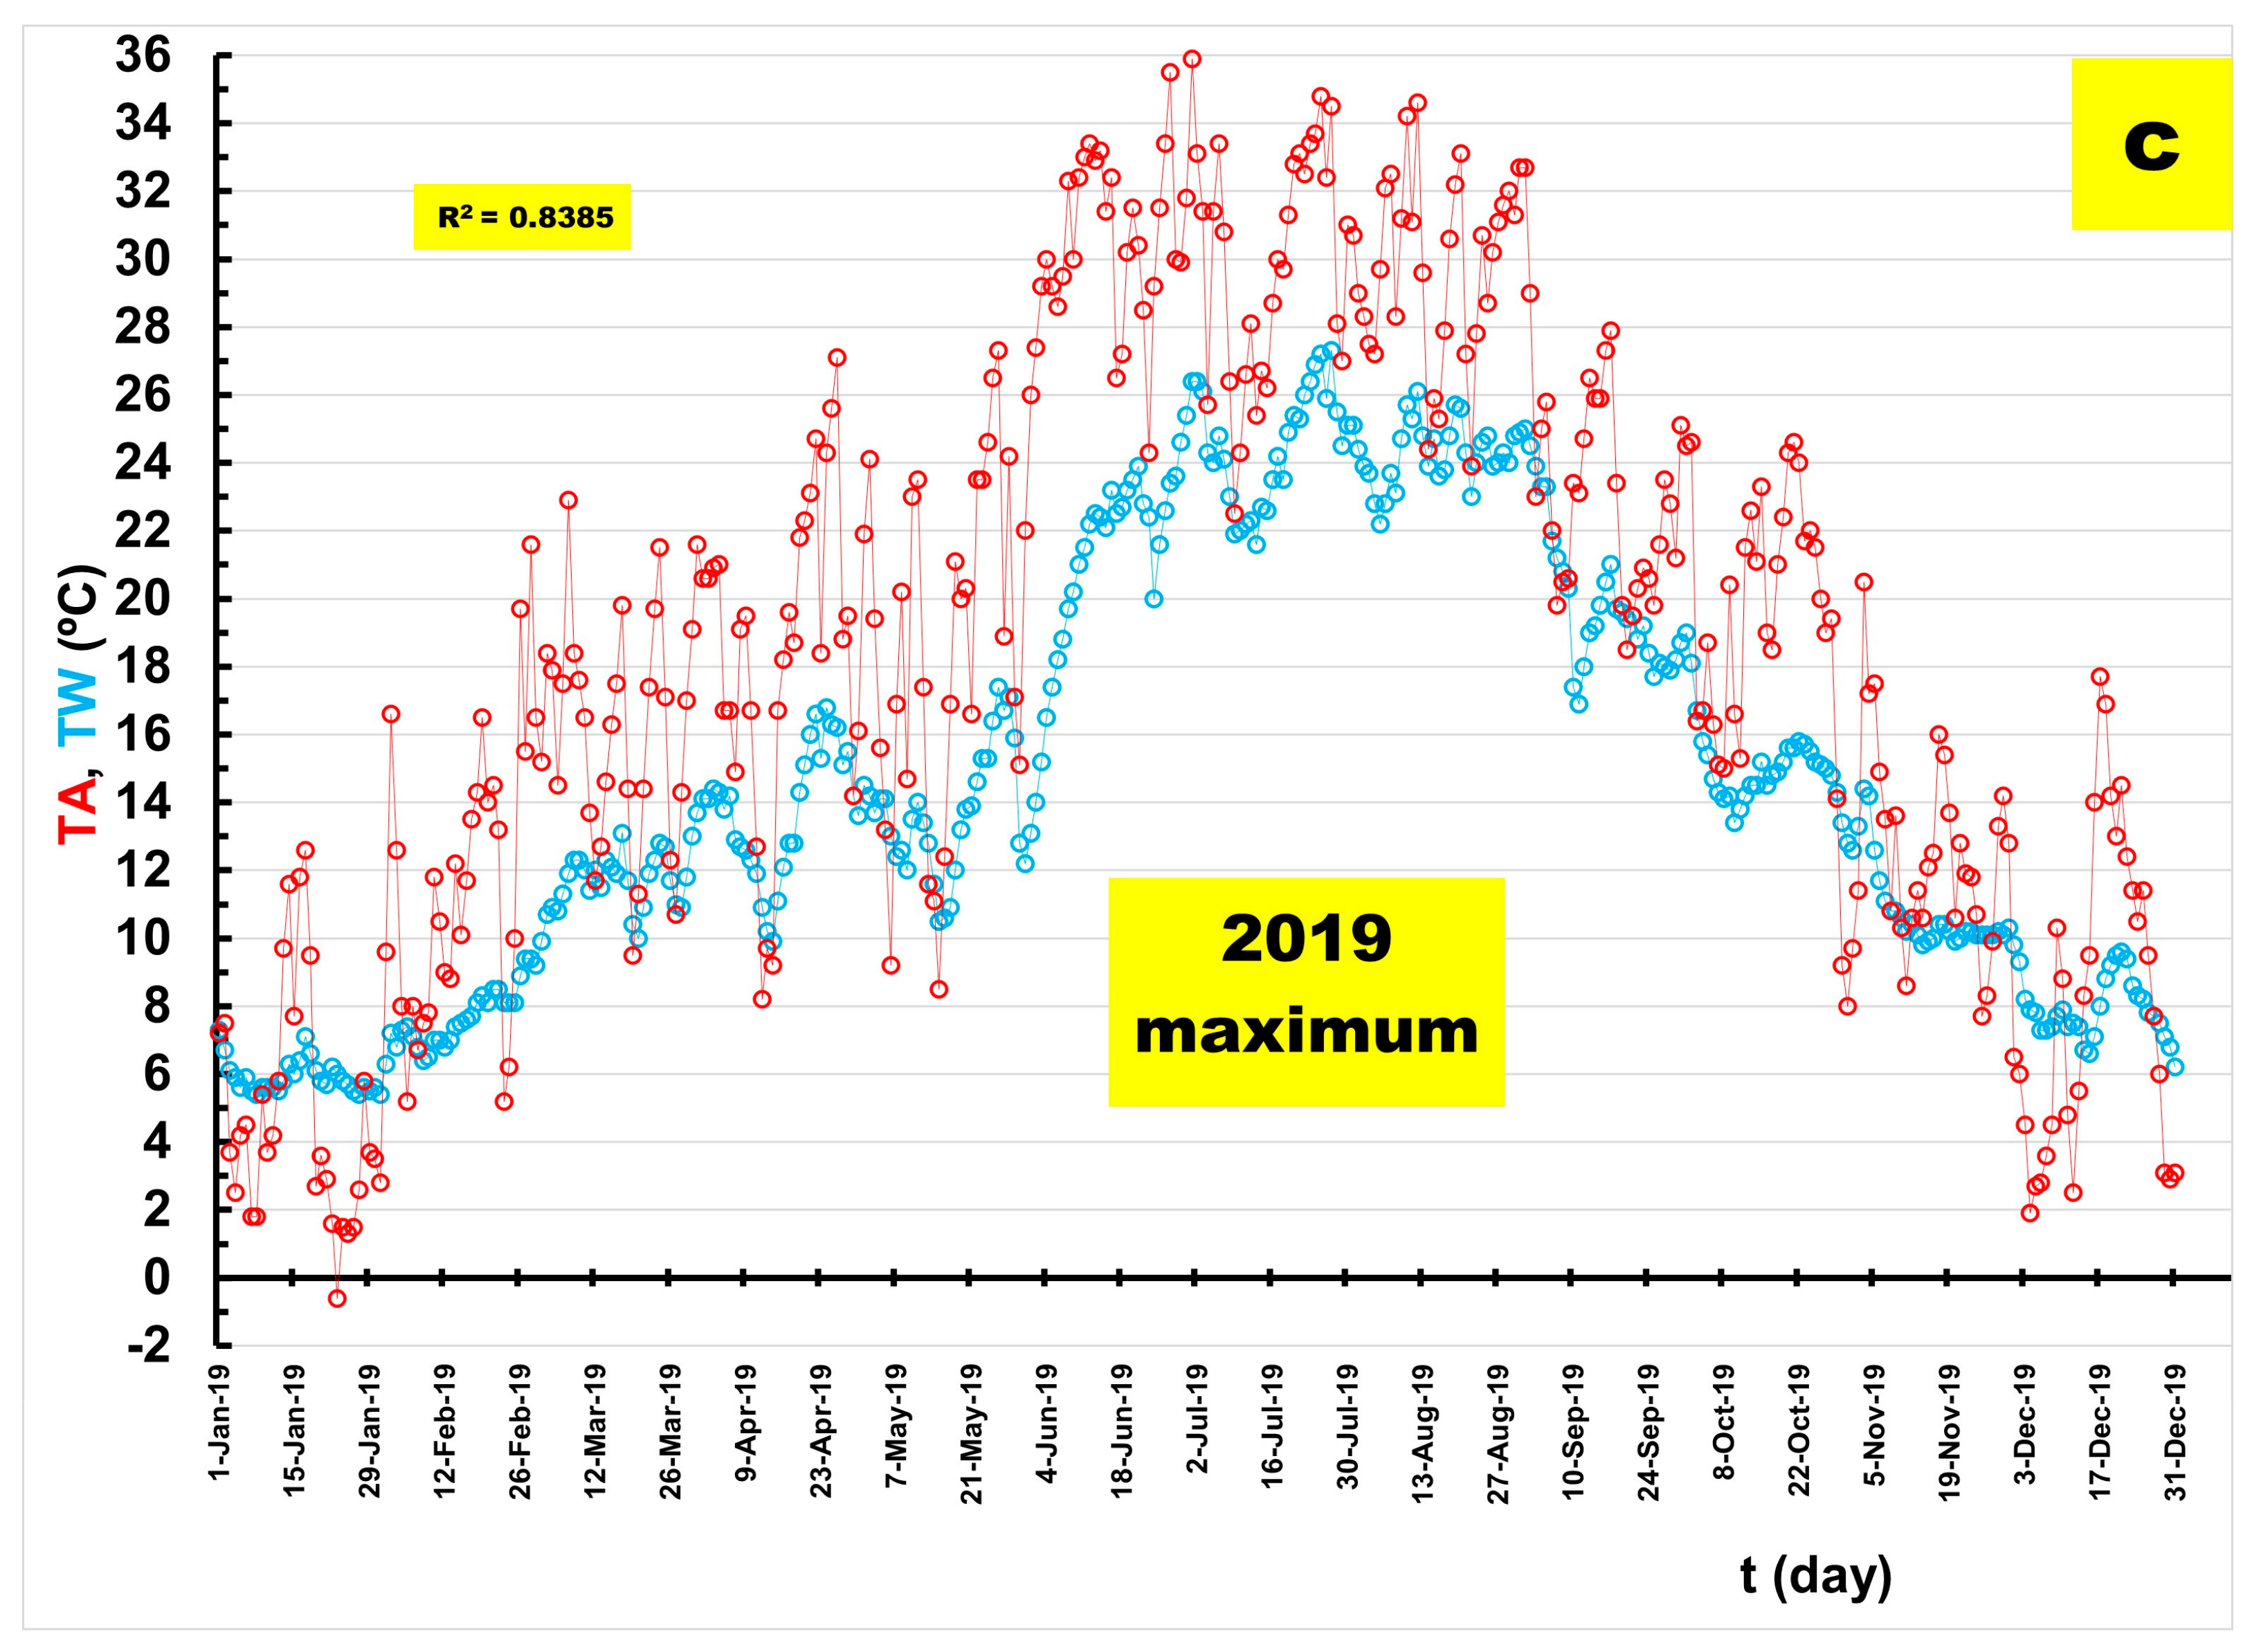
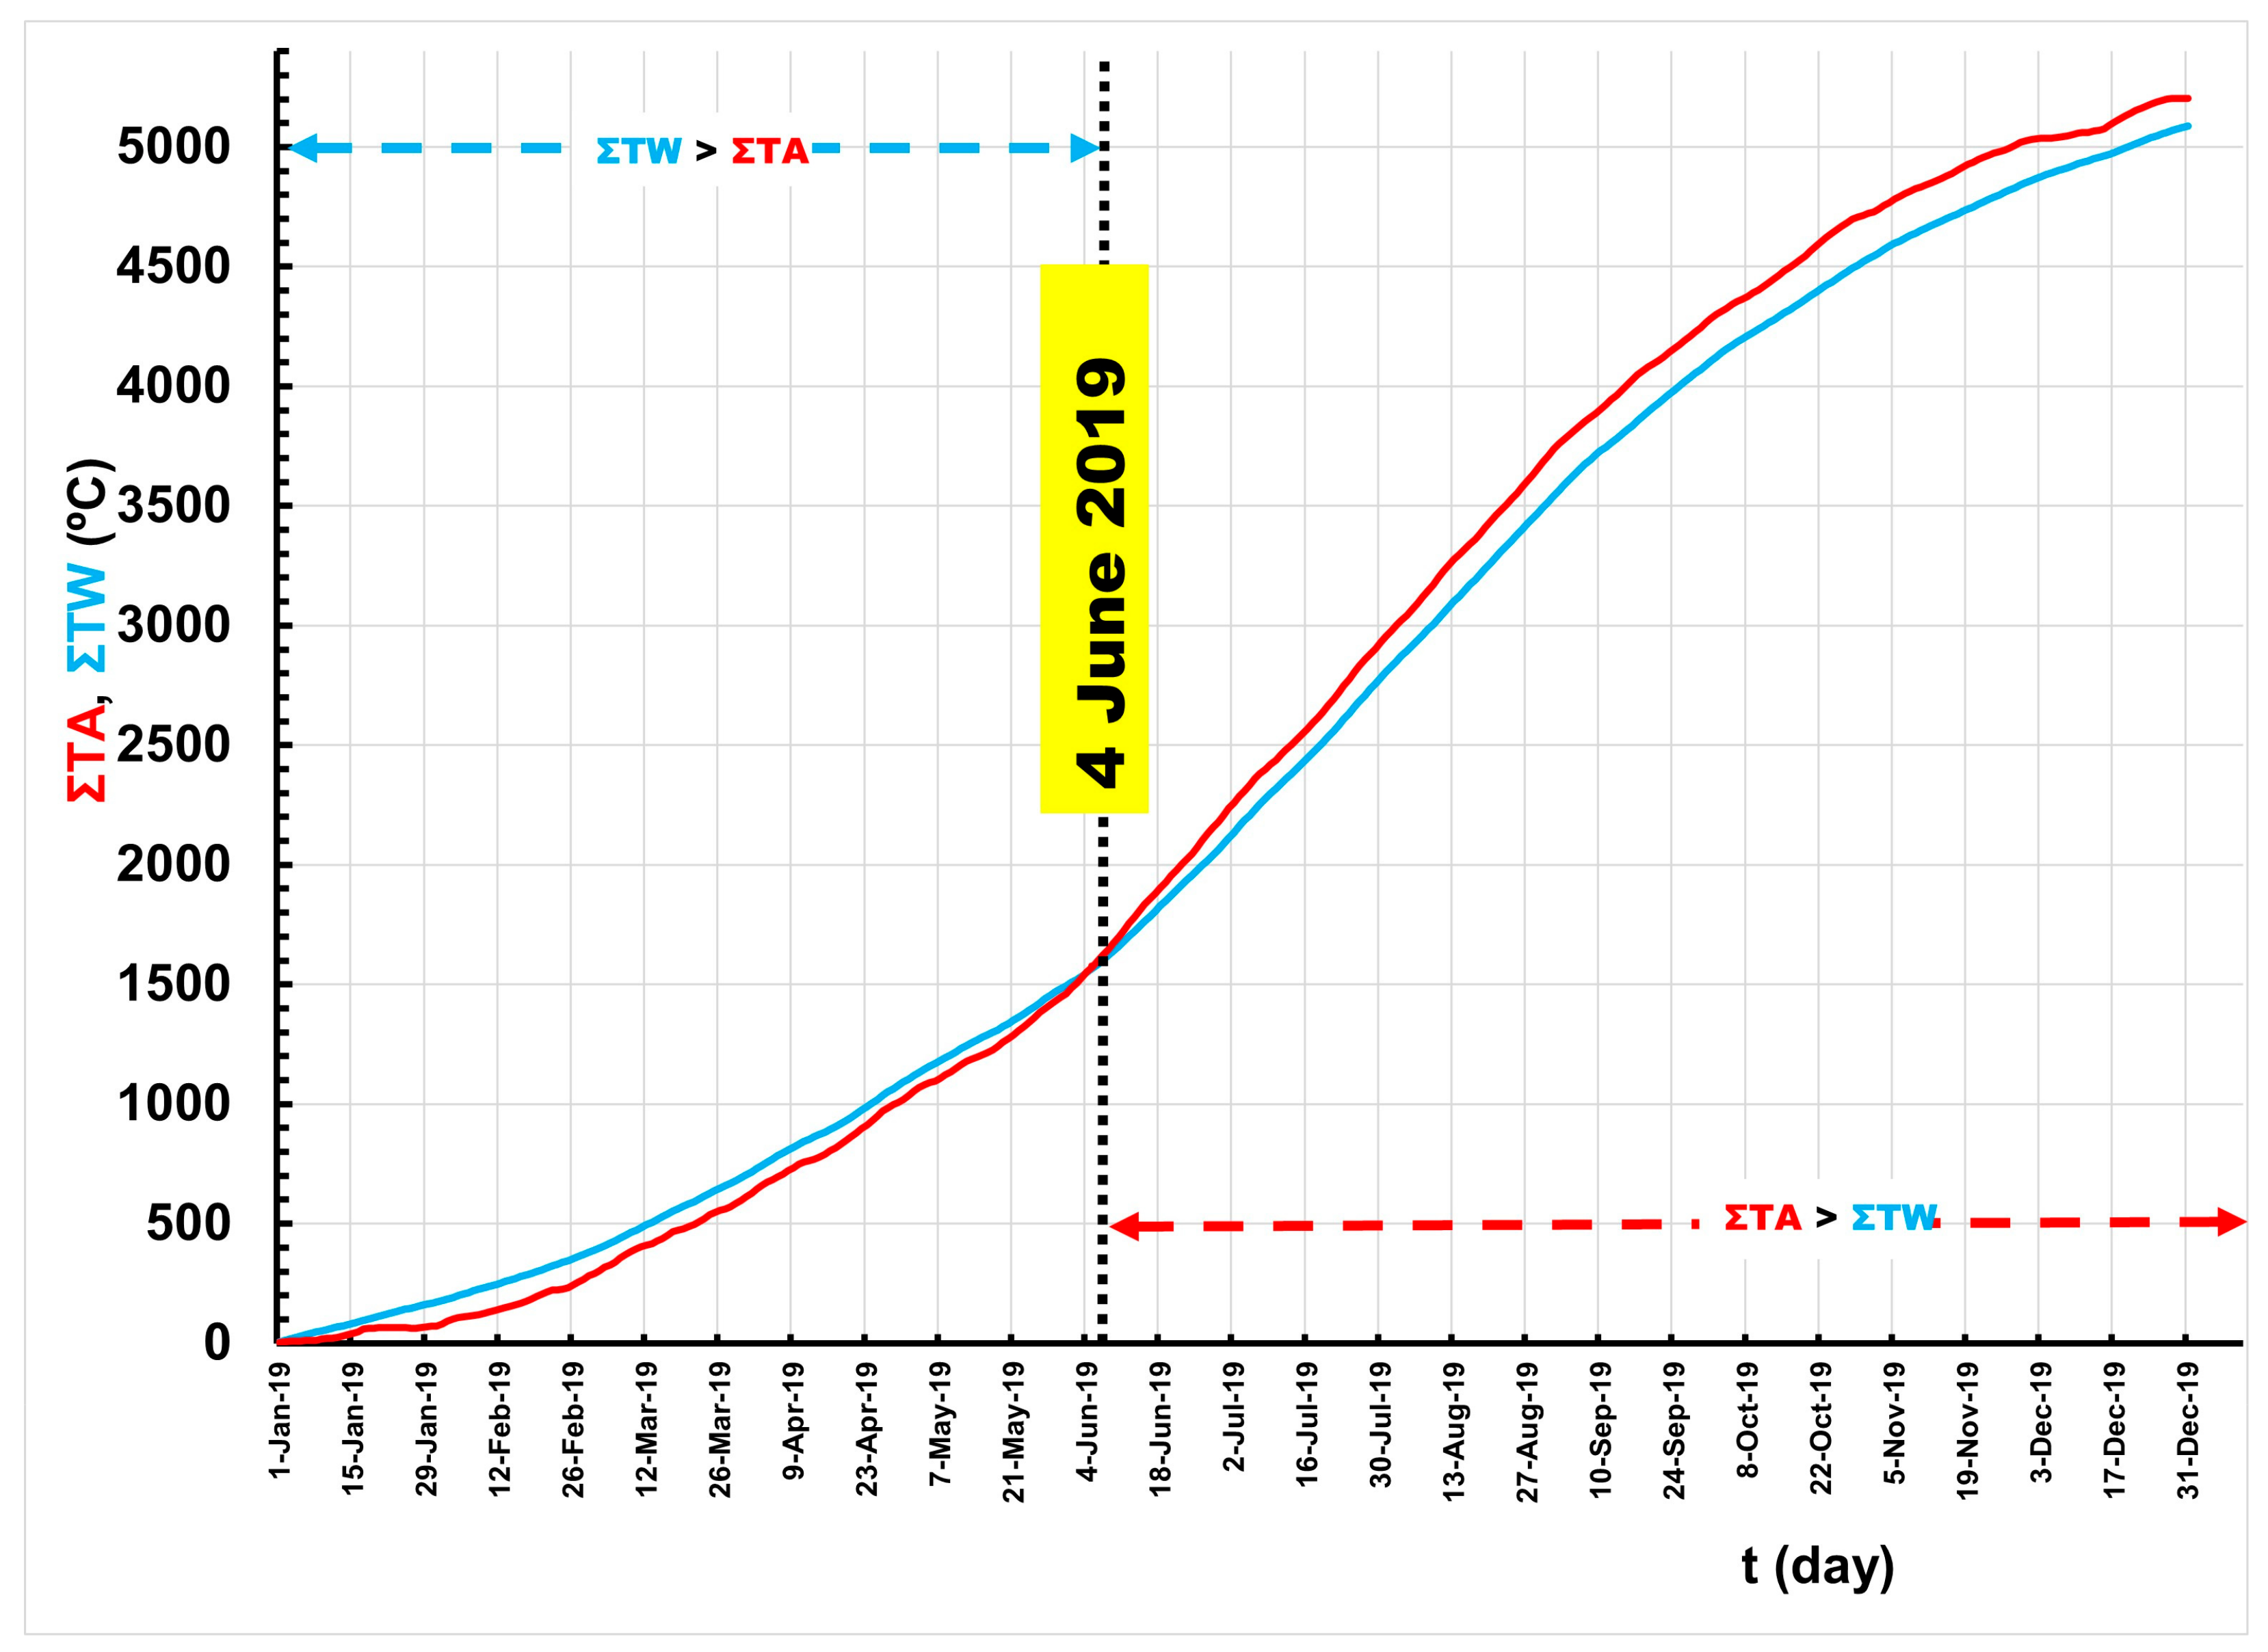
3.3. Analyses on a Daily Time Scale

The graphical representation of the time series of minimum (Figure 10a), mean (Figure 10b), and maximum (Figure 10c) daily water temperatures of the Sava River in Zagreb (TW, blue) and air temperatures at Grič (TA, red) observed during the year 2019 clearly indicates the similarity in the behavior of water and air temperatures. This is confirmed by the high values of the determination coefficients R2. The highest value appeared for the minimum daily temperatures and is R2 = 0.8629. In the case of mean daily temperatures, it is R2 = 0.8418, while for the series of maximum daily temperatures, it is slightly lower at R2 = 0.8385.
A summary graph of the mean daily water temperatures of the Sava River in Zagreb (TW, blue) and air temperatures at Grič (TA, red) observed over 365 days in 2019 indicates that the cumulative curves intersect on 4 June 2019 (Figure 11). Until that day, the sum of the mean daily water temperatures of the Sava in Zagreb was higher than the sum of the mean daily air temperatures at Grič. After that date, the situation changes, i.e., the sum of the mean daily water temperatures of the Sava in Zagreb (TW) becomes lower than the sum of the mean daily air temperatures at Grič. Analyses conducted for other years indicate similar behavior. In all years, the intersection point appeared in the first half of June.
During the 53 years with complete daily data series, the water temperature of the Sava (TW ≥ 20 °C) first appeared at the end of May in six years (15.1% of available years). The water temperature (TW) ≥ 20 °C first occurred on 22 May 1983 and then consistently every other year since 2005. In 32 years (60.4% of available years), it appeared in June, in 13 years (24.5% of available years) in July, and in 1 year each in August and September. It was observed that TW ≥ 20 °C appears earlier, lasts longer, and ends later, most often in September.
Since continuous measurements of water temperature using the OTT PT-100 temperature probe have been conducted only since 1 January 2012, it was possible to calculate the number of days per year (N1) when the water temperature of the Sava TW ≥ 20 °C, even if the mean daily water temperature was less than 20 °C, for the period 2012–2020. Table 4 lists the data on the number of days per year (N1) when the measured TW ≥ 20 °C regardless of whether the mean daily water temperature was less than 20 °C.
It also lists the number of days per year (N2) when the mean daily water temperature of the Sava TW ≥ 20 °C during the nine-year period (2012–2020). The difference ranges between 7 and 22 days.
The Sava River is a crucial ecological, social, and economic resource for the city of Zagreb, which unfortunately is still not sufficiently recognized and adequately treated. This is evident from the fact that the issue of strong changes in its temperature regime has been inadequately studied so far. The Sava River and its entire basin upstream of Zagreb have been under significant pressure in recent decades, both from human interventions and from the effects of current climate changes. The intention of the analyses conducted in this article is to highlight to experts the necessity of more detailed studies of the thermal regime changes of the Sava’s water along its course, with a particular emphasis on the area upstream and downstream of Croatia’s capital, Zagreb. Existing data, although unfortunately insufficient and with numerous interruptions, have indicated the seriousness of the situation and the great potential for deterioration in the near future. The authors of this paper hope it will serve as an incentive to improve the current unsatisfactory state of the thermal regime of the Sava River as urgently as possible.
When organizing water temperature monitoring or developing water temperature models for rivers, it is necessary to comprehensively treat this issue as an interdisciplinary problem involving climate, land, and hydrology in a context dominated by human activities. Numerous studies addressing river water temperature have emphasized the need to reconsider how water temperature is conceptualized, analyzed, and modeled to include the role of human activities. To achieve this, continuous and more organized observations of river water temperatures and numerous other parameters in those areas must be intensified. This is particularly important in cases where the river flows through large, important, and vulnerable urban areas. The case of the Sava River in Zagreb is one of the glaring examples.
The hydrological regime of the Sava in Croatia, influenced by changes in the hydrological regime in the upstream part of the river and within the basin located in Slovenia, is significantly—but so far insufficiently—studied. In Slovenia, eight small hydroelectric power plants have been built on the Sava so far. There are plans to build another hydroelectric power plant, Mokrice, which will be the closest to the city of Zagreb. We did not find any published studies on their impact on the hydrological regime, particularly the thermal regime of the Sava in Croatia, which does not necessarily mean that this issue has not been addressed. Research related to this issue clearly needs to be intensified.
With widespread and inadequately controlled urbanization and the intensification of climate change, challenges to protecting the water quality of rivers and their ecosystems associated with cities will significantly increase. A fundamental part of the challenge includes ensuring sufficient accuracy in assessing the impacts of urbanization and climate change. There is a need for a mathematical model that can estimate the degree of change and the potential benefits of different protective measures. However, to ensure that such needs are properly addressed, it is crucial to provide reliable information on numerous parameters and their interactions to ensure that the models are robust enough for accurate impact assessment [35]. A key prerequisite for achieving this goal is the detailed study of existing measurements, primarily water and air temperatures at specific locations. In this sense, the analyses conducted in this paper on the case of the Sava River in Zagreb can serve as an useful indicator.
This paper is the first to analyze all available data on the characteristic water temperatures of the Sava in Zagreb. They have been compared with simultaneous air temperatures measured at the Grič Observatory and Sava water flows in Zagreb. Despite the numerous interruptions in the data, it seems that these analyses have enabled the drawing of well-founded conclusions.
It is evident that the overall, very complex, and extremely urgent issue of the Sava River temperatures in Zagreb is insufficiently understood. This paper clearly indicates the necessity of significantly intensifying the interdisciplinary approach to researching the changes in the thermal regime of the Sava River in the wider area of Zagreb. This message is particularly resonant considering the recent massive die-off of fish in the Sava River near Zagreb. Such events are unfortunately becoming more common and are speculated to be the result of abrupt increases in river water temperature [36].
A strong and increasingly intense rise in the water temperatures of the Sava in Zagreb has been definitively and reliably established, along with a simultaneous trend of decreasing minimum and mean annual flows. The number of days per year with a mean daily water temperature exceeding 20 °C is worryingly increasing. While until 1989, this number averaged about 25 days, in the recent period from 2004 to 2020, it increased to 80 days per year. Even during three years (2007, 2011, and 2017), there were more than 100 days with mean daily water temperature above 20 °C. This can be only partially explained by the increase in air temperatures caused by global climate change. The process is obviously more complex and influenced by a large number of other factors that need to be thoroughly examined in order to take appropriate effective measures. It is necessary to understand primarily the impacts associated with human activities in the upstream part of the basin as well as in the wider urban area of Zagreb.

4. Conclusions and Future Research Recommendations

Based on the analyses conducted in this paper, an increase in the water temperatures of the Sava River, especially during the summer months, and a trend of decreasing Sava flows during the same period of the year can be realistically expected. It is, therefore, urgently necessary to study the potential consequences of such intensifying behavior on ecological processes in the river, on groundwater in the associated aquifer that supplies Zagreb with water, and on urban processes in the city of Zagreb or some of its parts, especially those located near the river.
To better understand the processes affecting the Sava River in the city of Zagreb and its surroundings, especially in the aquifer supporting the river during low water periods, it is crucial to improve the monitoring of surface and groundwater temperatures, as well as flows, throughout the year under various climatic and hydrological conditions. Modern technology enables this task to be carried out efficiently and cost-effectively. Thorough monitoring is essential for grasping this complex issue and implementing appropriate measures to mitigate negative consequences. Addressing this urgent and complex issue undoubtedly necessitates a holistic approach and collaboration among experts from various scientific disciplines.
The authors hope this work will incentivize systematic research into the complex processes occurring in this crucial area and drive urgent improvements in managing the Sava River’s thermal regime.

Author Contributions

Conceptualization, O.B. and T.R.-B.; methodology, O.B.; software, O.B. and A.Ž.-Ć.; validation, O.B. and T.R.-B.; formal analysis, O.B.; investigation, A.Ž.-Ć.; resources, A.Ž.-Ć.; data curation, O.B. and A.Ž.-Ć.; writing—original draft preparation, O.B.; writing—review and editing, A.Ž.-Ć.; visualization, O.B. and A.Ž.-Ć.; supervision, T.R.-B.; project administration, T.R.-B. All authors have read and agreed to the published version of the manuscript.

Funding

This research was partially funded through project KK.01.1.1.02.0027, which is co-financed by the Government of Croatia and the European Union through the “European Regional Development Fund—the Competitiveness and Cohesion Operational Programme”.

Data Availability Statement

The raw data supporting the conclusions of this article will be made available by the authors on request.

Conflicts of Interest

The authors declare no conflict of interest.

References

  1. IPCC. Climate Change 2023: Synthesis Report. Contribution of Working Groups I, II and III to the Sixth Assessment Report of the Intergovernmental Panel on Climate Change; Lee, H., Romero, J., Eds.; IPCC: Geneva, Switzerland, 2023; pp. 35–115. [Google Scholar] [CrossRef]
  2. European Environment Agency. Water Temperature. Available online: https://www.eea.europa.eu/data-and-maps/indicators/water-temperature-2/assessment (accessed on 18 November 2021).
  3. Ficklin, D.L.; Hannah, D.M.; Wanders, N.; Dugdale, S.J.; England, J.; Klaus, J.; Kelleher, C.; Khamis, K.; Charlton, M.B. Rethinking river water temperature in a changing, human-dominated world. Nat. Water 2023, 1, 125–128. [Google Scholar] [CrossRef]
  4. Michel, A.; Schaefli, B.; Wever, N.; Zekollari, H.; Lehning, M.; Huwald, H. Future water temperature of rivers in Switzerland under climate change investigated with physics-based models. Hydrol. Earth Syst. Sci. 2022, 26, 1063–1087. [Google Scholar] [CrossRef]
  5. Nelson, K.C.; Palmer, M.A. Stream temperature surges under urbanization and climate change: Data, models, and responses. J. Am. Water Resour. Assoc. 2007, 43, 2. [Google Scholar] [CrossRef]
  6. Lessard, J.L.; Hayes, D.B. Effects of elevated water temperature on fish and macroinvertebrate communities below small dams. River Res. Appl. 2003, 19, 21–32. [Google Scholar] [CrossRef]
  7. Bonacci, O.; Đurin, B.; Roje-Bonacci, T.; Bonacci, D. The influence of reservoirs on water temperature in the downstream part of an open watercourse: A case study at Botovo Station on the Drava River. Water 2022, 14, 3534. [Google Scholar] [CrossRef]
  8. Xiao, Z.; Sun, J.; Yuan, B.; Lin, B.; Zhang, X. Roles of dam and climate change in thermal regime alteration of a large river. Environ. Res. Lett. 2022, 17, 094016. [Google Scholar] [CrossRef]
  9. Abdi, R.; Endreny, R.; Nowak, D.A. A model to integrate analysis of urban river thermal cooling in river restoration. J. Environ. Manage. 2020, 258, 110023. [Google Scholar] [CrossRef]
  10. White, J.C.; Khamis, K.; Dugdale, S.; Jackson, F.L.; Malcolm, I.A.; Krause, S.; Hannah, D.M. Drought impacts on river water temperature: A process-based understanding from temperate climates. Hydrol. Process. 2023, 37, e14958. [Google Scholar] [CrossRef]
  11. Večernji.hr. Pomor Ribe U Savi. Available online: https://www.vecernji.hr/vijesti/pomor-ribe-u-savi-716910 (accessed on 23 May 2002).
  12. Johnson, T.C.; Thomle, J.; Stickland, C.; Goldman, A.; Stegen, J. Riverbed temperature and 4D ERT monitoring reveals heterogenous horizontal and vertical groundwater-surface water exchange flows under dynamic stage conditions. Front. Earth Sci. 2022, 10, 910058. [Google Scholar] [CrossRef]
  13. Suárez, F.; Sandoval, V.; Méndez, A.S.; Muñoz, J.F. Investigating river–aquifer interactions using heat as a tracer in the Silala river transboundary basin. Wiley Interdiscip. Rev. Water 2023, 11, e1639. [Google Scholar] [CrossRef]
  14. Souaissi, Z.; Taha, B.M.J.O.; St-Hilaire, A. River water temperature quantiles as thermal stress indicators: Case study in Switzerland. Ecological Indicators 2021, 131, 108234. [Google Scholar] [CrossRef]
  15. Briciu, A.-E.; Dumitru, M.; Graur, A.; Oprea, D.E.; Prisăcariu, A.; Bistricean, P.I. Changes in the water temperature of rivers impacted by the urban heat island: Case study of Suceava City. Water 2020, 12, 1343. [Google Scholar] [CrossRef]
  16. Shrestha, R.R.; Pesklevits, J.C.; Bonsal, B.R.; Brannen, R.; Guo, T.; Hoffman, S. Rising summer river water temperature across Canada: Spatial patterns and hydroclimatic controls. Environ. Res. Lett. 2024, 19, 044058. [Google Scholar] [CrossRef]
  17. Ahmadi-Nedushan, B.; St-Hilaire, A.; Ouarda, T.B.M.J.; Bilodeau, L.; Robichaud, É.; Thiémonge, N.; Bobée, B. Predicting river water temperatures using stochastic models: Case study of the Moisie River (Québec, Canada). Hydrol. Process. 2007, 21, 21–34. [Google Scholar] [CrossRef]
  18. Laszewski, M. Stream water temperature: A short review with special reference to diurnal dynamics. Misc. Geogrphica 2013, 17, 34–41. [Google Scholar] [CrossRef]
  19. Van Vliet, M.T.; Franssen, W.H.; Yearsley, J.R.; Ludwig, F.; Haddeland, I.; Lettenmaier, D.P.; Kabat, P. Global river discharge and water temperature under climate change. Glob. Environ. Change 2013, 23, 450–464. [Google Scholar] [CrossRef]
  20. Cheng, L.; Guan, D.; Zhou, L.; Zhao, Z.; Zhou, J. Urban cooling island effect of main river on a landscape scale in Chongqing, China. Sustain. Cities Soc. 2019, 47, 101501. [Google Scholar] [CrossRef]
  21. Murakawa, S.; Sekine, T.; Narita, K.; Nishina, D. Study of the effects of a river on the thermal environment in an urban area. Energy Build. 1991, 16, 993–1001. [Google Scholar] [CrossRef]
  22. Wang, Y.; Ouyang, W.; Zhan, Q.; Zhang, L. The cooling effect of an urban river and its interaction with the littoral built environment in mitigating heat stress: A mobile measurement study. Sustainability 2022, 4, 11700. [Google Scholar] [CrossRef]
  23. Tavares, H.M.; Cunha, A.H.F.; Motta-Marques, D.; Ruhoff, A.L.; Fragoso, C.R., Jr.; Munar, A.M.; Bonnet, M. Derivation of consistent, continuous daily river water temperature data series by combining remote sensing and water temperature models. Remote Sens. Environ. 2020, 241, 111721. [Google Scholar] [CrossRef]
  24. Slukan Altić, M. Povijest regulacije rijeke Save kod Zagreba i njezine posljedice na izgradnju grada. Hrvatske Vode 2010, 18, 205–212. [Google Scholar]
  25. Pavlek, K. Utjecaj regulacija na promjene korita Save kod Zagreba od kraja 19. stoljeća do danas. Geografski Horizonti 2019, 65, 56–57. [Google Scholar]
  26. Biondić, D. Erozijski proces u savskom koritu kod Zagreba. In Zbornik Radova Okruglog Stola “Hidrologija i Vodni Resursi Save u Novim Uvjetima”; Trninić, D., Ed.; Hrvatsko Hidrološko Društvo: Zagreb, Croatia, 2000. [Google Scholar]
  27. Gilja, G.; Oskoruš, D.; Kuspilić, N. Erosion of the Sava riverbed in Croatia and its foreseeable consequences. In Proceedings of the 12th Conference on Water Observation and Information System for Decision Support, Ohrid, North Macedonia, 27 May–2 June 2012; Morell, M., Ed.; Faculty of Civil Engineering (Sts Cyril and Methodius University—Skopje): Skopje, North Macedonia, 2010; pp. 1–9. [Google Scholar]
  28. Kuspilić, G.; Gilja, G. Potencijalan Učinak Morfoloških Promjena Rijeke Save na Zagrebački Vodonosnik. Znanstveno-Stručni Skup: Strategija Razvoja Vodoopskrbe i Odvodnje Grada Zagreba; Andročec, V., Ed.; Društvo Građevinskih Inženjera: Zagreb, Croatia, 2016; pp. 13–22. [Google Scholar]
  29. Vujević, M.; Posavec, K. Identification of groundwater level decline in the Zagreb and Samobor-Zaprešić aquifers since the sixties of the twentieth century. Min. Geol. Pet. Eng. Bull. 2018, 33, 55–64. [Google Scholar] [CrossRef]
  30. Pavlić, I. Statistička Teorija i Primjena; Panorama: Zagreb, Croatia, 1965. [Google Scholar]
  31. Bonacci, O.; Andrić, I.; Roje-Bonacci, T. Increasing trends of air temperature in urban area: A case study from four stations in Zagreb city area. Vodoprivreda 2018, 50, 203–214. [Google Scholar]
  32. Bonacci, O.; Roje-Bonacci, T. Analyses of the Zagreb Grič observatory air temperatures indices for the period 1881 to 2017. Acta Hydrotech. 2018, 31, 67–85. [Google Scholar] [CrossRef]
  33. Bonacci, O.; Roje-Bonacci, T.; Vrsalović, A. The day-to-day temperature variability method as a tool for urban heat island analysis: A case of Zagreb-Grič Observatory (1887–2018). Urban Clim. 2022, 45, 101281. [Google Scholar] [CrossRef]
  34. Bonacci, O.; Đurin, B. The behavior of diurnal temperature range (DTR) and annual temperature range (ATR) in the urban environment: A case of Zagreb Grič, Croatia. Atmosphere 2023, 14, 1346. [Google Scholar] [CrossRef]
  35. McBean, E.; Bhatti, M.; Singh, A.; Mattern, L.; Murison, L.; Delaney, P. Temperature modeling, a key to assessing impact on rivers due to urbanization and climate change. Water 2022, 14, 1994. [Google Scholar] [CrossRef]
  36. Tone Mrtve Ribe Plutaju Savom: “Prve Lešine Smo Vidjeli Sinoć, Još Uvijek Dolaze Nove”—Doznali Smo Što se Događa. 22 July 2024. Available online: https://www.jutarnji.hr/vaumijau/aktualno/tone-mrtve-ribe-plutaju-savom-prve-lesine-smo-vidjeli-sinoc-jos-uvijek-dolaze-nove-doznali-smo-sto-se-dogada-15484777 (accessed on 25 July 2024).
Figure 1. Map of the Sava River Basin overview (top) and the city of Zagreb with the locations of the Grič Observatory and the Zagreb water gauge station on the Sava River (lower left). The aerial photograph of the Sava River with the position of a gauging station (lower right). Image source: Wikipedia, “Sava River Basin,” 2024. via https://creativecommons.org/licenses/by-sa/3.0/legalcode accessed on 25 July 2024.
Water 16 02337 g001
Figure 2. Series of available characteristic annual water temperatures (minimum, mean, maximum) of the Sava River (TW, in blue) measured at the Zagreb gauge station and air temperatures (TA, in red) observed at the Grič Observatory in the period from 1948 to 2020. Regression lines with corresponding equations and coefficients of determination (R2) are included.
Water 16 02337 g002
Figure 3. Relationships between mean annual water temperatures of the Sava River in Zagreb (TW) and mean annual air temperatures at Grič (TA) during the common operational period from 1948 to 2020 (blue), sub-period 1948–1987 (brown), and the recent sub-period 1988–2020 (green). Regression lines with corresponding equations and coefficients of determination (R2) for all three periods are included.
Water 16 02337 g003
Figure 4. Relationships between mean annual water temperatures of the Sava River in Zagreb (TW) and mean annual flows of the Sava River in Zagreb (Q) during 1948–2020 (blue), sub-period 1948–1987 (brown), and the recent sub-period 1988–2020 (green). Regression lines with corresponding equations and coefficients of determination (R2) for all three periods are included.
Water 16 02337 g004
Figure 5. Series of mean monthly water temperatures of the Sava River in Zagreb (TW, blue) and mean monthly air temperatures at Grič (TA, red) during the common operational period from January 1948 to December 2020. Regression lines with corresponding equations and coefficients of determination (R2) are included.
Water 16 02337 g005
Figure 6. Relationship between mean monthly water temperatures of the Sava River in Zagreb (TW, ordinate) and mean monthly air temperatures at Grič (TA, abscissa) in two sub-periods of common operation: (1) January 1948 to December 1987 (brown) and (2) January 1988 to December 2020 (green). Regression parabolas with corresponding equations and determination index (IR2) values are included.
Water 16 02337 g006
Figure 7. Histograms of average mean monthly water temperatures of the Sava River in Zagreb (TW, blue) and mean monthly flows of the Sava River in Zagreb (Q, purple) during the common operational period from January 1948 to December 2020.
Water 16 02337 g007
Figure 8. Relationships between mean monthly water temperatures of the Sava River in Zagreb (TW) and mean monthly flows of the Sava River in Zagreb (Q) in January during the common operational period from 1948 to 2020 (blue), sub-period 1948–1987 (brown), and the recent sub-period 1988–2020 (green). Regression lines with corresponding equations and the coefficients of determination (R2) for all three periods are included.
Water 16 02337 g008
Figure 9. Relationships between mean monthly water temperatures of the Sava River in Zagreb (TW) and mean monthly flows of the Sava River in Zagreb (Q) in July during the common operational period from 1948 to 2020 (blue), sub-period 1948–1987 (brown), and the recent sub-period 1988–2020 (green). Regression lines with corresponding equations and the coefficients of determination (R2) for all three periods are included.
Water 16 02337 g009
Figure 10. Series of minimum (a), mean (b), and maximum (c) daily water temperatures of the Sava River in Zagreb (TW, blue) and air temperatures at Grič (TA, red) observed during 2019. The coefficient of determination (R2) between the series of daily water and air temperatures is noted on each of the three figures.
Water 16 02337 g010aWater 16 02337 g010b
Figure 11. Summary of mean daily water temperatures of the Sava River in Zagreb (TW, blue) and air temperatures at Grič (TA, red) observed over 365 days of 2019.
Water 16 02337 g011
Table 1. Average values of characteristic Sava River water temperatures (TW), air temperatures at Grič (TA), and their differences (ΔT = TW − TA) from 1948 to 2020.
°CMinimumMeanMaximum
TW2.2912.1124.2
TA−10.1212.0033.8
ΔT = TW − TA12.410.11−9.6
Table 2. Average values of characteristic Sava River water temperatures (TW), air temperatures at Grič (TA), and their differences (ΔT = TW − TA) in two sub-periods: 1948–1987 and 1988–2020. Probability (p) of the statistical difference between the mean values of temperatures of adjacent sub-periods determined by the t-test.
°CMinimumMeanMaximum
1948–19871988–20201948–19871988–20201948–19871988–2020
TW1.793.1811.2613.6322.926.7
p9.0 × 10−41.1 × 10−174.2 × 10⁻¹¹
TA−11.13−8.3311.3713.1132.935.6
p6.2 × 1033.9 × 10−122.3 × 10⁻⁶
ΔT = TW − TA12.9411.39−0.050.43−9.89−9.03
p0.0889.8 × 1030.060
Note: Statistically significant differences (p < 0.05) are marked in red.
Table 3. Results of the probability p calculated using the F-test and t-test for the sub-series of mean monthly temperatures of the Sava River water in Zagreb during the two analyzed sub-periods (1948–1987 and 1988–2020).
MonthSub-PeriodTW (°C)ΔTW (°C)p (F-Test)p (t-Test)
January1948–19874.331.860.9919.2 × 10−6
1988–20206.19
February1948–19875.041.690.3701.9 × 10−4
1988–20206.73
March1948–19877.072.280.6851.4 × 10−7
1988–20209.35
April1948–198710.222.620.5974.0 × 10−9
1988–202012.84
May1948–198713.532.640.1684.5 × 10−7
1988–202016.17
June1948–198716.383.440.4802.0 × 10−9
1988–202019.82
July1948–198718.343.970.8458.3 × 10−9
1988–202022.32
August1948–198718.553.660.1048.1 × 10−10
1988–202022.21
September1948–198715.652.050.3905.8 × 10−5
1988–202017.69
October1948–198711.861.680.1859.5 × 10−6
1988–202013.54
November1948–19878.351.340.2812.4 × 10−4
1988–20209.69
December1948–19875.701.180.9061.5 × 10−3
1988–20206.88
Note: Statistically significant differences (p < 0.05) are marked in red.
Table 4. Annual comparison of the number of days N1 with the occurrence of TW ≥ 20 °C with the number of days N2 when the mean daily water temperature of the Sava River water in Zagreb was equal to or higher than 20 °C.
YearN1N2ΔN = N1 − N2
20121038617
201390837
2014543915
2015948311
20161008614
20171121048
20181038122
201997898
2020927715
Disclaimer/Publisher’s Note: The statements, opinions and data contained in all publications are solely those of the individual author(s) and contributor(s) and not of MDPI and/or the editor(s). MDPI and/or the editor(s) disclaim responsibility for any injury to people or property resulting from any ideas, methods, instructions or products referred to in the content.

