Article

Influence of Valvular Structures on the Flow Characteristics in an Island-Type Fishway

1
College of Metrology Measurement and Instrument, China Jiliang University, Hangzhou 310018, China
2
Institute of Intelligent Manufacturing, Zhejiang Guangsha Vocational and Technical University of Construction, Dongyang 322100, China
3
College of Energy Engineering, Zhejiang University, Hangzhou 310027, China
*
Authors to whom correspondence should be addressed.
Water 2024, 16(16), 2336; https://doi.org/10.3390/w16162336
Submission received: 20 July 2024 / Revised: 15 August 2024 / Accepted: 19 August 2024 / Published: 20 August 2024

Abstract

:
Fishways act as ecological corridors, enabling migratory fish species to surmount barriers such as weirs or dams, which are crucial for the restoration of river ecosystems. The island-type fishway is a novel design that utilizes a combination of island structures and valvular configurations to dissipate the kinetic energy of water flow, decelerate the water velocity, and thus reduce the challenge faced by fish attempting to ascend the watercourse. The impact of valvular configurations on the hydrodynamic characteristics within an island-type fishway was explored. The results showed that the main high-velocity flow exhibits a nearly “S”-shaped characteristic, while a low-velocity region develops downstream of the valvular. The valvular configuration has a significant effect on the internal flow dynamics of the island-type fishway. Specifically, the smaller the valvular arc angle, the broader the high-velocity main flow becomes, and the smaller the area of the low-velocity region. When the valvular arc angle is set at 180°, the area dominated by low flow velocities maintains a coverage of over 60%. As the valvular arc angle decreases, turbulent kinetic energy rises, leading to an approximate 70% increase in the maximum turbulent kinetic energy across different water layers relative to the model with the initial angle setting. Within the range of valvular arc angles studied, an island-type fishway with a 180° valvular arc angle is most conducive to supporting the upstream migration of fish. This study can provide a reference for the further development of island-type fishways.

1. Introduction

Globally, the proportion of clean energy is steadily increasing, and among its various forms, hydropower stands out due to its safety, stability, and environmental friendliness, making it widely utilized. However, the construction of hydropower stations disrupts the natural connectivity of rivers, leading to escalating ecological issues, one of the most prominent being the obstruction of fish migration. This impediment directly affects the reproductive, feeding, and wintering needs of migratory fish, disrupting their life cycles and potentially leading to the extinction of certain species [1].
River ecosystem research and restoration have gained significant attention from scholars worldwide [2]. Fish passage facilities primarily include fish locks, fish lifts, fish transport vessels, and fishways [3]. Among them, fish locks and fish lifts offer advantages in terms of compact design but suffer from issues like difficulties in attracting fish and high operational costs. In contrast, fishways, with their lower operational costs, extensive design history, and the ability for fish to actively traverse them, are preferred for replicating natural upstream migration scenarios.
Fishways can be categorized into traditional and modern types [4]. Traditional fishways encompass vertical slot fishways, pool-and-weir fishways, and Denil fishways [5]. A vertical slot fishway consists of interconnected chambers separated by baffles with full-height vertical slots, allowing fish to move between chambers [6]. Its simple interior and relatively stable flow field make it adaptable to fluctuations in water levels, serving a wide range of fish species [7]. Puertas et al. [8] measured the three-dimensional velocity distribution in vertical-slot fishways under large flow rates at different gradients. Their findings indicated a linear relationship between the dimensionless flow rate in the fishway and the mean water depth in the pools. Additionally, they observed two distinct flow regions within the pools: one characterized by the main flow with maximum velocities, and the other by a recirculation zone formed by low velocities and horizontal vortices. Wu et al. [9] systematically investigated the effect of fishway slope on the flow structure in the pools through model experiments. Their results showed that when the slope is less than 10%, the flow through the vertical slots can be approximated as a planar jet. As the slope increases, the flow gradually exhibits the characteristics of a three-dimensional jet. Bermudez et al. [10] used a combination of physical model experiments and numerical calculations to study the flow characteristics of 16 different structural designs of vertical-slot fishways at two different slopes. The results indicated that the length of the pool is an important geometric dimension that affects the flow distribution within the fishway. To facilitate comparisons of the energy dissipation effectiveness of vertical-slot fishways, they introduced the concept of the energy dissipation rate for vertical-slot fishways. However, the high velocities generated at the slot can pose challenges to fish. Pool-and-weir fishways are designed for strong-swimming or jumping fish, featuring a series of channels or weirs with openings [11]. Fish use their burst swimming speeds to cross over or jump through these openings, which are typically rectangular and located mid-depth or at the bottom. The water cushion in each chamber effectively dissipates energy when water flows over the weir from one chamber to another. The earliest fish passage facility constructed by humans was the pool-and-weir fishway, which first appeared in Europe in the 17th century. In 2001, Kim [12] conducted physical model experiments to compare and analyze three types of pool-and-weir fishways. The results showed that choosing a rectangular weir with both bottom slots and notches could stabilize the flow within the pools more effectively compared to zigzag or trapezoidal weirs, providing a better environment for migrating fish. William et al. [13], after studying pool-and-weir fishways, pointed out that when designing the structure of fishways, the ecological function should be maximized. Two key considerations arise: economic efficiency is one aspect, and the issue of fish migration is also an important research direction. Despite its effective energy dissipation, this type of fishway does not accommodate significant water level variations. Denil fishways, exemplifying channel-type fishways, utilize inclined “U-shaped” plates arranged against the water flow to dissipate energy and create low-velocity zones beneath the plates for weaker-swimming fish [14]. However, the velocity increases with depth, necessitating controlled fishway height. In fact, the passage efficiency of traditional fishways was not that high [15]. The mean passage efficiencies of Denil fishway, vertical-slot fishway and pool-and-weir fishway were 51%, 45%, and 40%, respectively [16]. As for energy dissipation factor (EDF), the rates of the Denil fishway, the culvert fishway, and the weir fishway were 50 W/m3, 250 W/m3, and 500 W/m3, respectively [17].
Although traditional fishways have proven effective over time, many installations fall short of expectations. Common issues include homogeneous flow states and high velocities at critical points in simple designs, while complex designs face challenges in engineering complexity and higher construction costs.
Scholars now focus on enhancing traditional fishway designs, combining elements, and exploring new configurations such as V-shaped pooled weir [18], rock-ram weir [19,20], labyrinth weir [21], and vortex fishways [22]. Stuart et al. [23] evaluated rock fishways in Australia from an engineering and economic perspective and found they were hydraulically stable over a long design life. Cassan et al. [24] numerically investigated flow in rock-rampfishways with a transversal slope and protruding blocks either emergent or submerged and found that the methodology for assessing stage–discharge relationships and maximum velocities was still relevant, whatever the lateral slope. Mirkhorli et al. [25] evaluated the effects of geometric parameters on the flow regime and the relationship between discharge and depth in straight weirs and rectangular labyrinth weirs. Vowles et al. [26] experimentally studied the hydraulic conditions created by an array of large-diameter cylindrical bristle clusters and found a multi-species fish passage solution at sloped weirs provided by cylindrical bristle clusters.
Inspired by the Tesla valve, a new island-type fishway concept has emerged, offering simplicity, no moving parts, and effective flow obstruction and energy dissipation [27]. Although Tesla valves have industrial applications, their application for fishways is nascent, presenting ample room for exploration [28]. Despite the straightforward design of island-type fishways, the relationship between structural parameters and internal flow distribution and its impact on fish passage remains unclear. Preliminary research indicates that valvular structures play a pivotal role in controlling and guiding water flow [29]. Investigating these valves is crucial for understanding the internal flow dynamics and suitability for fish passage within island-type fishways. This study focuses on the effects of valvular structures on internal flow characteristics and fish passage, aiming to contribute to the development of novel fishways and improve aquatic ecosystems in river systems.

2. Materials and Methods

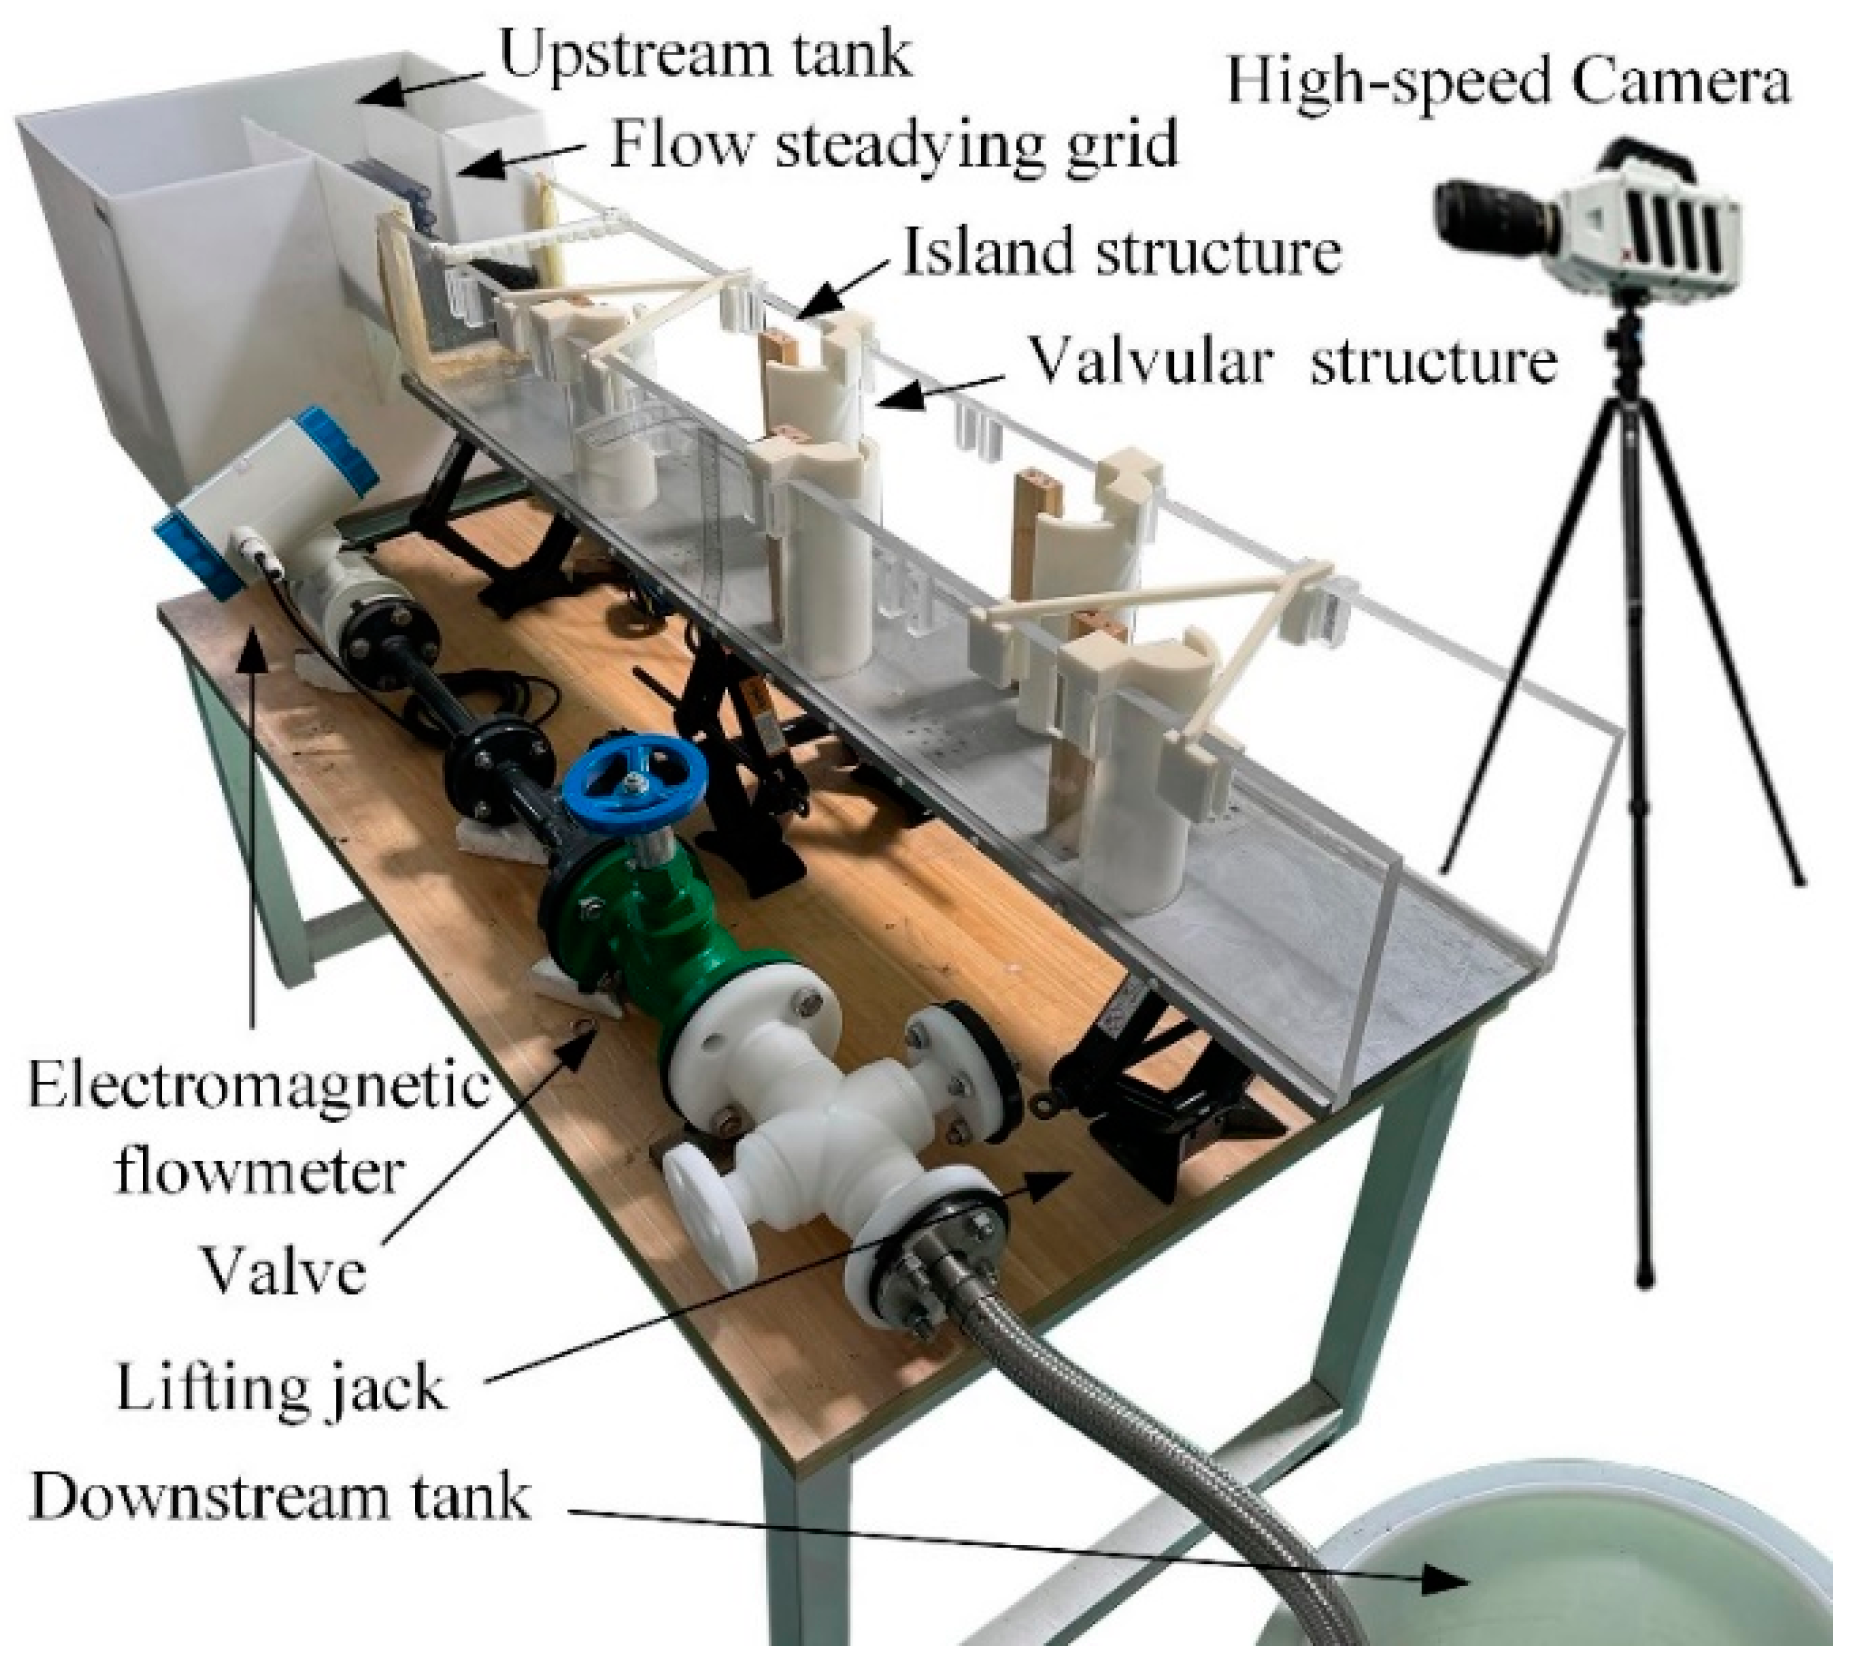
2.1. Island-Type Fishway Experimental Platform and Testing Methodology

In an island-type fishway, the upstream fluid flows downstream due to gravity. The fluid is divided into two streams by the island structure; one stream continues downstream through the gap in the valvular structure and is referred to as the main flow. The other stream, impeded by the valvular structure, changes direction and is termed the energy-dissipating flow, which moves in the opposite direction. These two flows with opposing velocities separate at the outlet of the valvular structure, merge, and mix, achieving energy dissipation.
In the context of fishways, achieving gravity similarity in the design and testing phase ensures that the flow conditions, such as velocities and turbulence, are realistic and will not impede the migration of fish. By adhering to the gravity similarity criterion, engineers can create models that accurately reflect the behavior of the full-scale fishway, helping to optimize the design for safe and efficient fish passage. Following the principle of similarity based on gravity, the experimental platform for the island-type fishway shown in Figure 1 was designed. The gradient of the fishway device can be adjusted by altering the height of lifting jacks at different positions. The bottom of the model is made from 15-mm-thick stainless steel, with water level measurement points set every 100 mm along the side of the base plate. The side walls are constructed from 15-mm-thick high-transparency acrylic glass to facilitate observation of the flow within the island-type fishway. The valvular structures are fabricated from nylon material, while the island structure is made of wood. The entire system is powered by a submersible pump, which transports water from the downstream tank to the upstream tank, where it then flows back to the downstream tank through the island-type fishway under the influence of gravity. The flow rate is controlled by a valve located at the pump’s outlet, and the flow volume is measured using an electromagnetic flow meter (precision of 0.5 grade).
A dedicated measuring panel was installed above the chambers, which, in conjunction with an open-channel velocity meter (measurement error ≤ 1.5%), enables the measurement of flow velocities at various water layer positions. In this experiment, the flow velocities were measured at water layers h1 = 12 mm and h2 = 22 mm above the bottom of the island-type fishway. As depicted in Figure 2, solid blue dots represent the measurement points. The dimensions of the island-type fishway experimental platform are as follows: The fishway constructed in the test chamber measures 1350 mm in length, 200 mm in width, and has a pool depth of 200 mm. The radial distance between opposing valvular structures is referred to as the pseudo-vertical seam, with a width b of 20 mm. Considering the limitations imposed by the overall model scale, the fundamental island shape was determined to be rectangular with dimensions of 2b × b (40 mm × 20 mm). The experimental platform consists of five chambers, each equipped with valvular structures that are 0.5b (10 mm) thick and have a diameter of 2b (40 mm). The spacing between valvular structures on the same side is 20b (400 mm), whereas the spacing between valvular structures on opposing sides is 10b (200 mm). The angle of the valvular arcs is denoted by θ. Viewing from the upstream to the downstream direction, there are three valvular structures situated on the left bank, positioned at distances of 300 mm, 700 mm, and 1100 mm, respectively, along the flow direction from the starting point of the island-type fishway. In addition, there are two valvular structures situated on the right bank, positioned at 500 mm and 900 mm, respectively.
In this experiment, a no-Island (NI) model with a valvular arc angle (θ) of 180° was employed as a control group to validate the feasibility of subsequent numerical simulations. By adjusting the height of the lifting jacks, the experimental slope was set at 2.27%. By controlling the valve aperture, the flow rate was 3.32 m3/h. After the flow was stabilized, a high-speed camera (Revealer X113M, HF Agile Device Co., Ltd. Hefei, China) was used to record the change in water level lines at a speed of 1000 fps (frames per second). Utilizing the measurement panel in conjunction with a velocity meter, the velocities at various measurement points within the chambers were recorded (velocity measurements were taken at two water layers within each chamber for each operational condition).

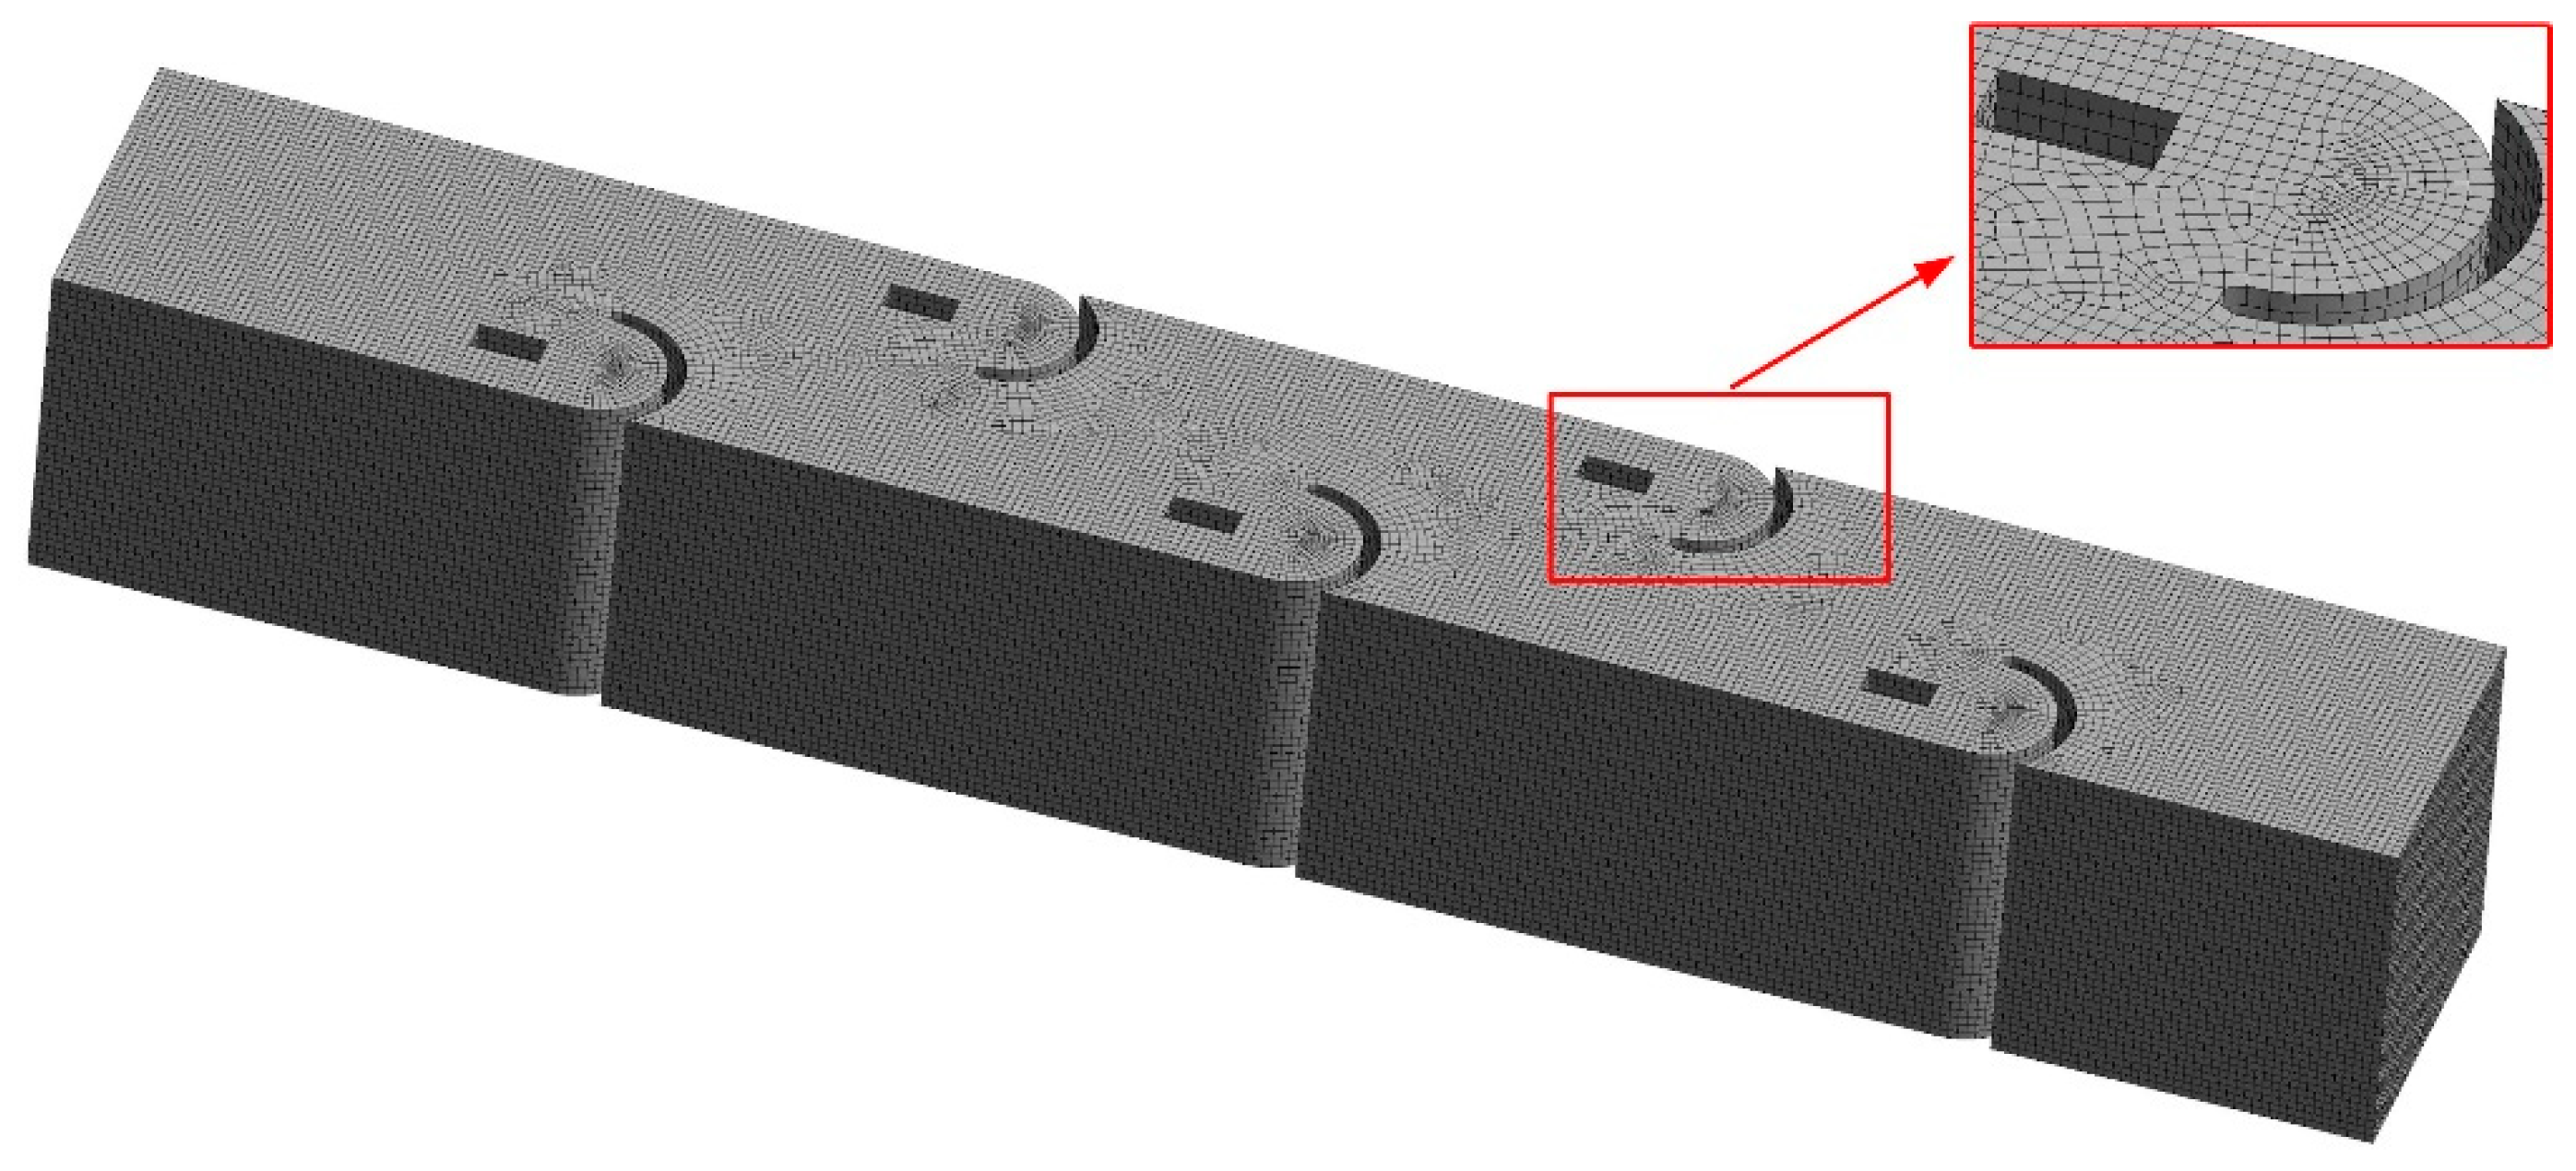
2.2. Numerical Modeling Approach and Computational Methods

To achieve a more precise understanding of the flow details, this study not only conducts experimental research on the flow within an island-type fishway but also employs computational fluid dynamics (CFD) methods to solve for the water flow [30]. The governing equations are shown as follows:
Conservation of mass (continuity equation) is as follows:
u = 0
Here, u is the velocity vector.
Conservation of momentum (Navier–Stokes Equations) is as follows:
ρ ( u t + u u ) = p + τ + f
Here, ρ is the fluid density, p is the pressure, τ is the viscous stress tensor, f represents external forces, such as gravity or body forces.
The numerical computation model maintains the same geometric dimensions as the actual fishway [31]. The fluid domain mesh primarily consists of hexahedral cells combined with other cell types to form a hybrid mesh. The calculations employ the RNG k-ε turbulence model integrated with the volume-of-fluid (VOF) free surface model.
The RNG k-ε model consists of two transport equations: one for the turbulent kinetic energy (k) and another for the dissipation rate of turbulent kinetic energy (ε).
The turbulent kinetic energy equation is as follows:
( ρ k ) t + · ρ u k = · v + v t σ k k + P k ρ ε Y k + S k
Here, v is the kinematic viscosity, vt is the turbulent viscosity, σk is the Prandtl number for k, Pk is the production term of turbulent kinetic energy, ρε is the dissipation term of turbulent kinetic energy, Yk is the user-defined source term for k, and Sk is the user-defined explicit source term for k.
The dissipation rate equation is as follows:
( ρ ε ) t + · ρ u ε = · v + v t σ ε ε + C ε ε k P k C k ρ ε 2 1 k + C μ 1 6 ω k Y ε + S ε
Here, σε is the Prandtl number for ε, Cε is a model constant, ω is the vorticity magnitude, Yε is the user-defined source term for ε, and Sε is the user-defined explicit source term for ε.
The VOF model introduces a volume fraction, α, which represents the fraction of a computational cell occupied by one of the fluids. The transport equation for the volume fraction is written as follows:
( α ρ ) t + ( α ρ u ) = 0
Here, α is the volume fraction of the primary fluid (usually water); ρ is the density, which is a function of the volume fraction αα and the densities of the two fluids, typically written as follows: ρ = αρ1 + (1 − α)ρ2; ρ1 and ρ2 are the densities of the two fluids, and u is the velocity vector.
The model’s slope is established using a gravity decomposition technique [32]. The semi-implicit method for pressure-linked equations (SIMPLE) algorithm is utilized to solve the pressure–velocity coupling problem. The numerical simulation employs an open channel setup within the VOF method. The inlet water level height (38.6 mm) is configured according to the actual experimental settings, and the velocity is set using the flowrate used in the actual experiment (3.32 m3/h). The top surface of the flow channel is an open boundary, acting as a pressure boundary that allows both inflow and outflow. The outlet of flow channel is treated as the standard atmospheric pressure. Standard wall functions are used for the wall model to handle the near-wall behavior accurately. The iteration step size is set to 2000, with a maximum number of iterations capped at 20. Convergence is considered achieved when the error falls below a threshold of 10−4.
To ensure grid independence, this study investigates four different mesh cell size schemes (as shown in Table 1), and calculates the error e between the numerical simulation and the experimental average water level at the wall, using the following method:
e = ( h e h s ) h e × 100 %
In the formula, he represents the experimentally measured average water level at the wall, and hs stands for the numerically computed average water level at the wall.
The results indicate that when using the M3 mesh scheme, the relative computational error is minimal, and the number of grid cells is appropriate, thus balancing computational efficiency and accuracy effectively. This study also compared the experimental results of the average velocity at measurement points in the pool chamber area with the numerical simulation outcomes (as shown in Table 2), and the M3 mesh performed outstandingly. Therefore, the M3 mesh generation method is adopted for the numerical investigation.
After validating the grid independence, this study employs the same meshing methodology to construct five numerical models of fishways featuring island cross-sections in the shape of rectangles (as illustrated in Figure 2). The valvular arc angles (θ) for these models are set at 180° (Model 1), 157.5° (Model 2), 135° (Model 3), 112.5° (Model 4), and 90° (Model 5). The purpose of this modeling effort is to investigate the influence of the valvular structures on the flow characteristics within the island-type fishways. The mesh generation schematic is shown in Figure 3.

3. Results and Discussion

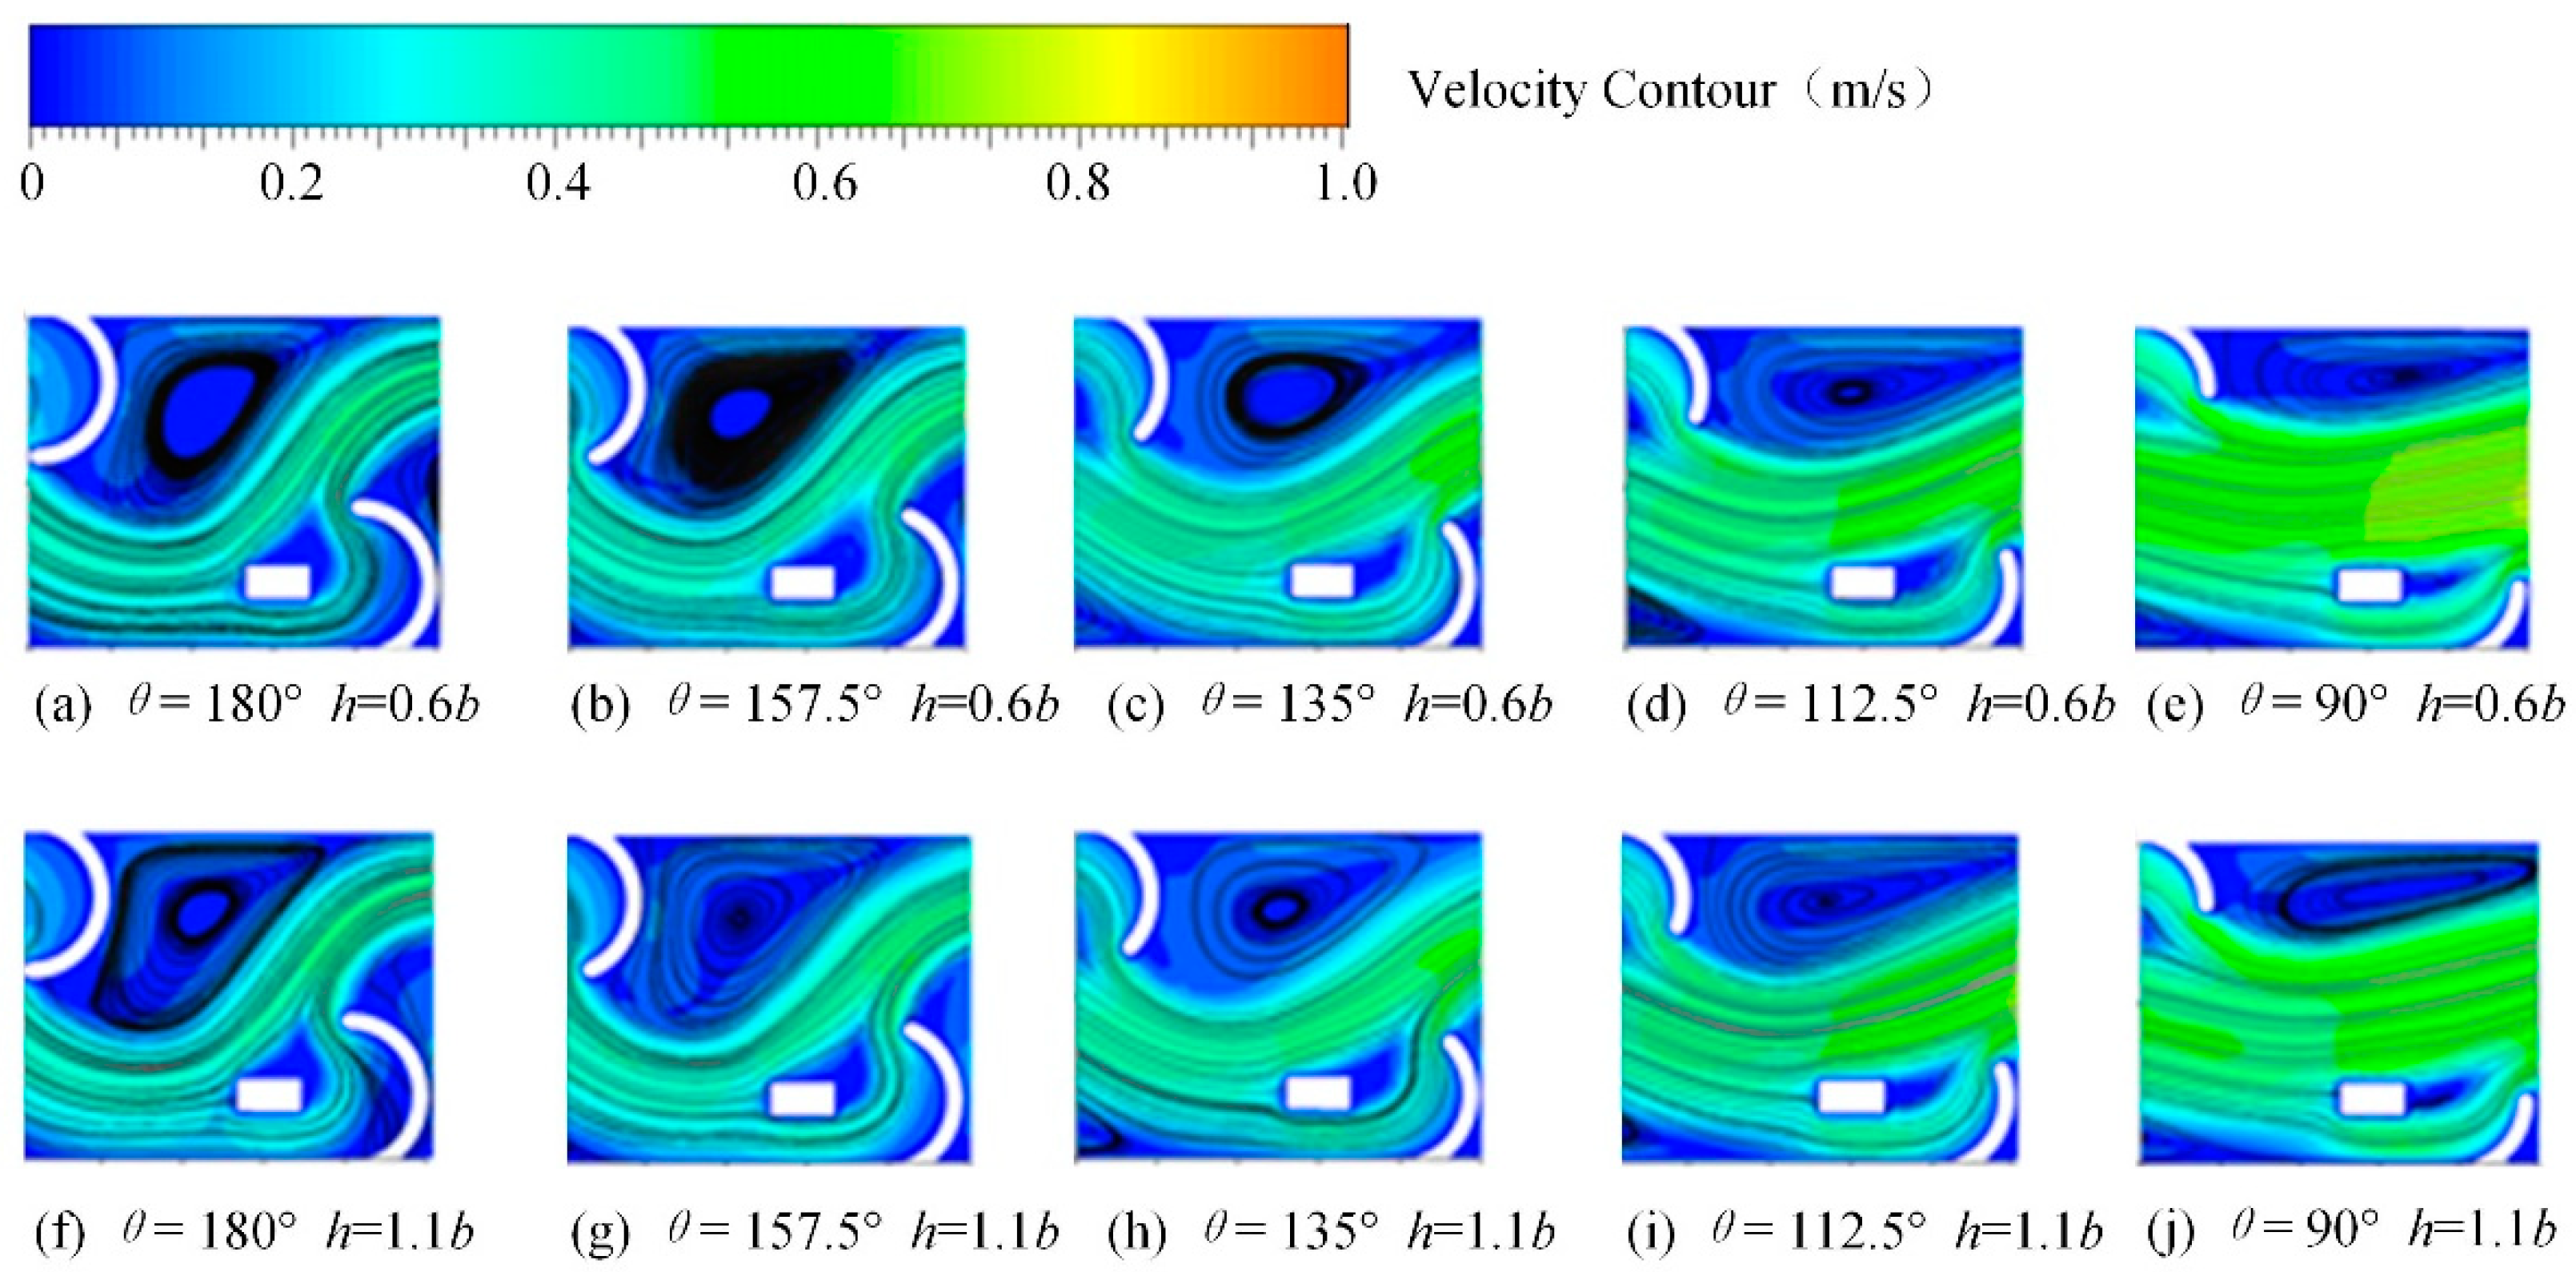
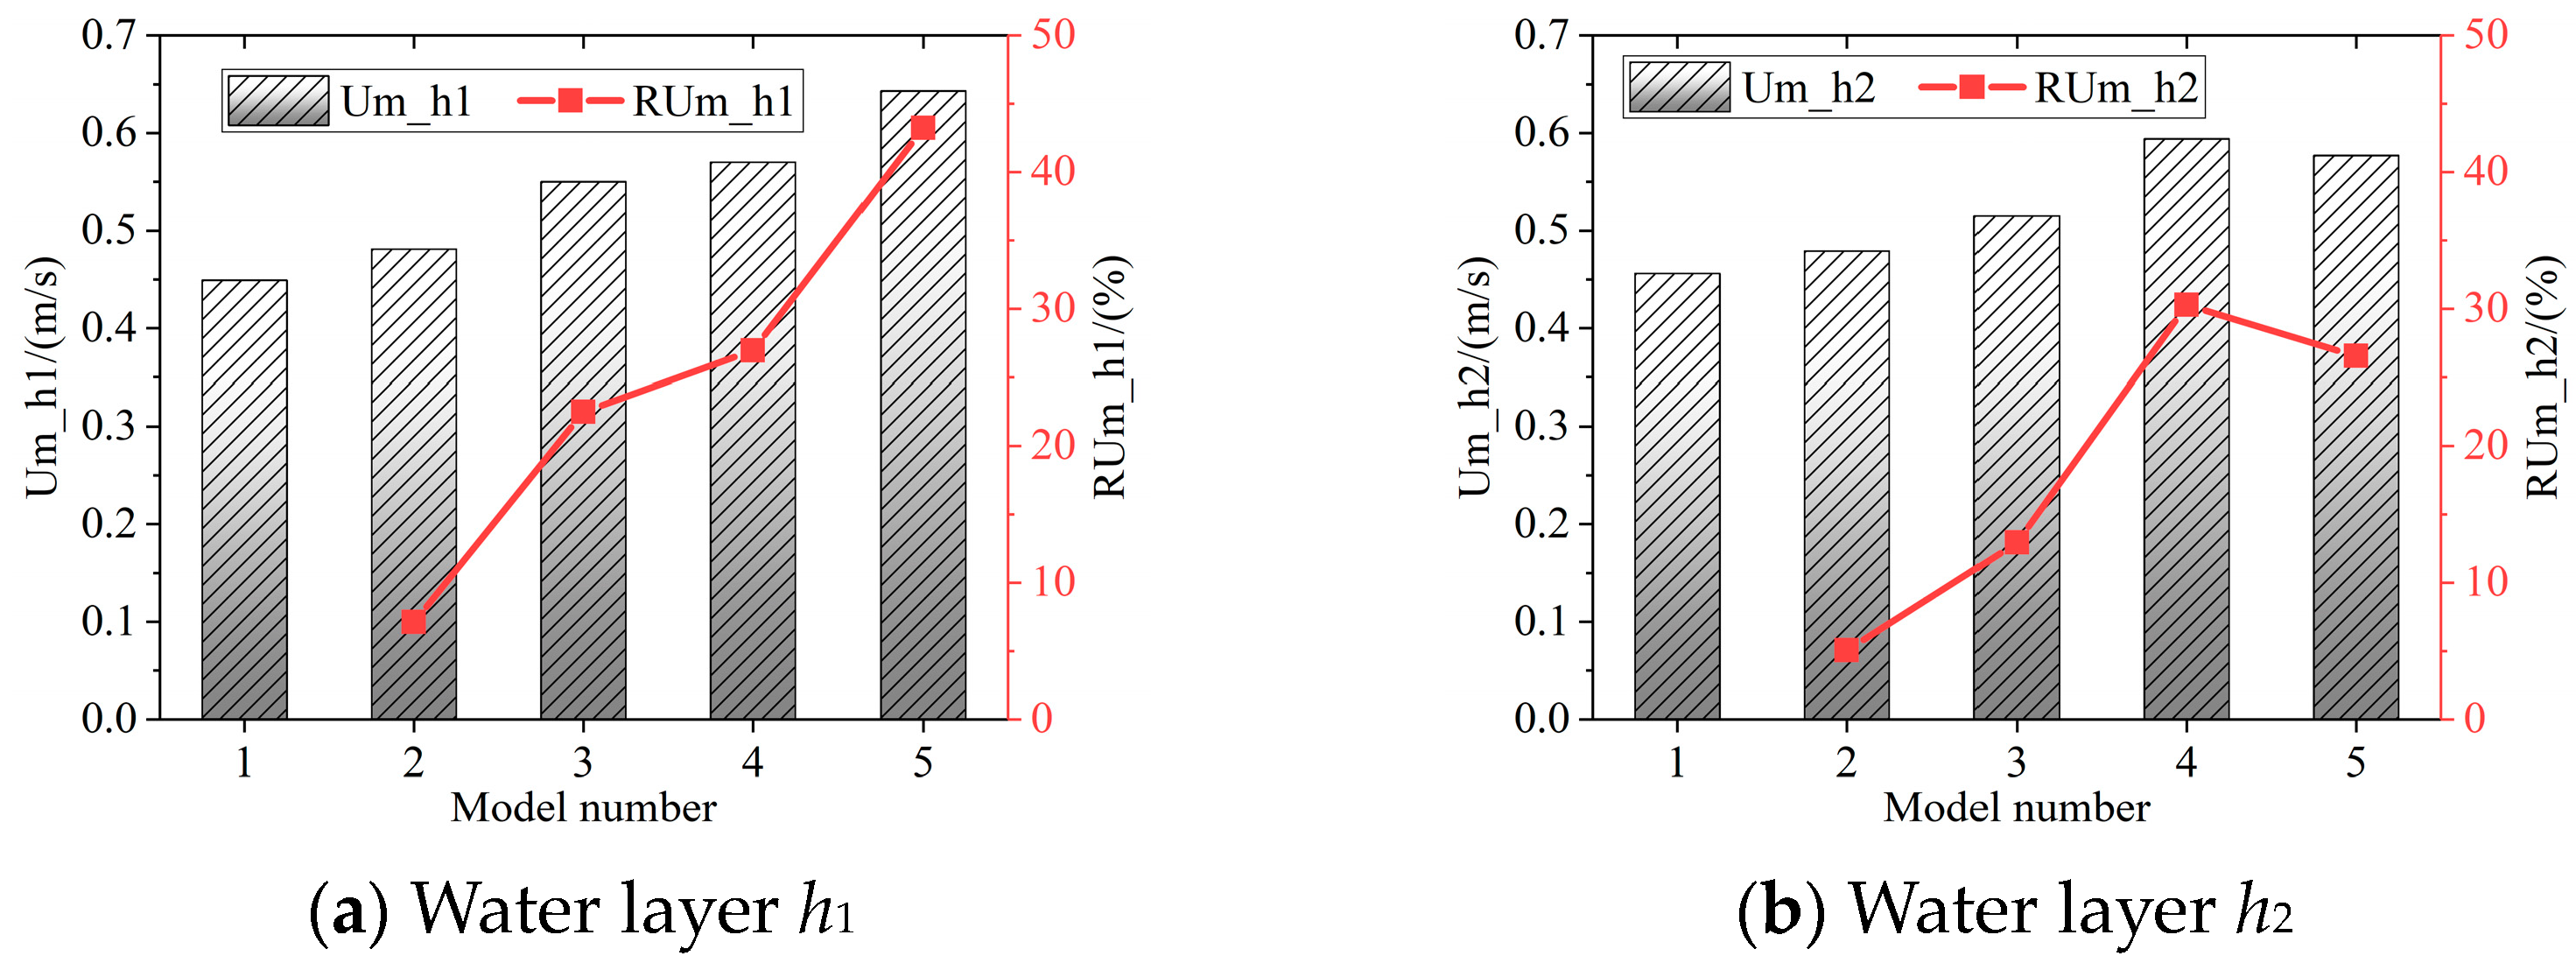
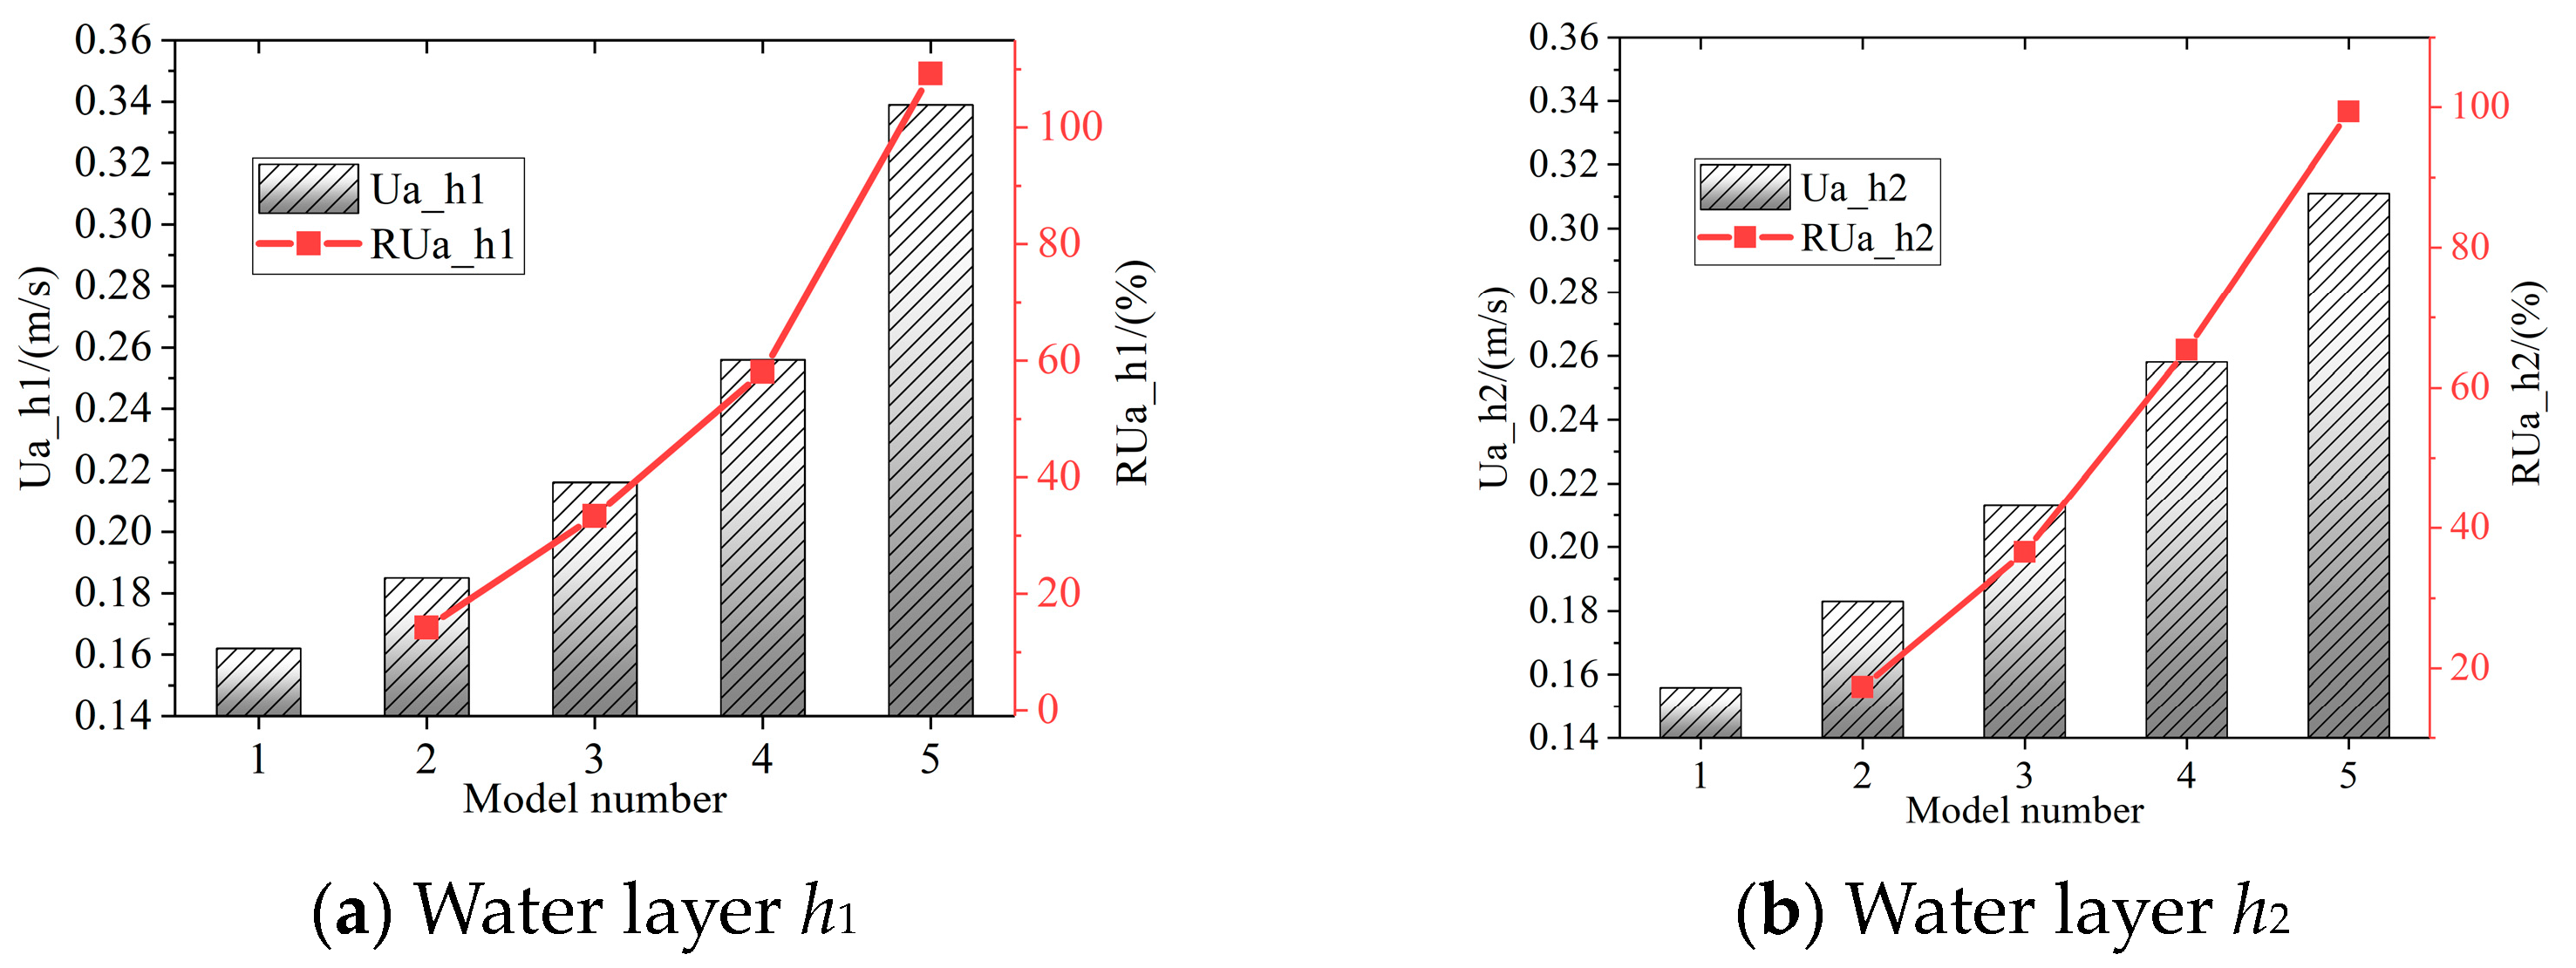
3.1. Velocity Field Distribution

Among the various behaviors of fish, swimming is a fundamental behavior essential for their survival, and its characteristics are important considerations in the design and construction of fishways. An excellent fishway design should accommodate the swimming capabilities. Based on swimming duration, fish swimming capabilities can be categorized into sustained swimming capacity (swimming time greater than 200 min), endurance swimming capacity (swimming time between 20 s and 200 min), and burst swimming capacity (swimming time less than 20 s). Sustained swimming capacity and burst swimming capacity are two critical parameters in fishway design. In a sustained swimming state, fish experience mild physiological stress, and thus, sustained swimming capacity is often used to evaluate fishway velocity design. When fish traverse high-velocity areas within a fishway, they enter a burst swimming state, and their degree of fatigue and recovery time serve as the basis for designing the number and spacing of rest pools in the fishway.
One of China’s “Four Major Carp Species”, the grass carp, exhibits migratory behavior, making it an ideal subject for studying fish passage dynamics [33]. Building upon the migratory traits of grass carp, this study delves deeper into the velocity field of an island-type fishway. According to previous academic findings, the stimulus for initiating grass carp migration is a flow velocity of 0.2 m/s [34]. Consequently, we establish a threshold of 0.2 m/s, categorizing areas within the fishway with velocities exceeding this value as high-velocity zones, and those below as low-velocity zones. Streamline diagrams (Figure 4) reveal two predominant flow patterns within the chambers of the island-type fishway: a nearly “S”-shaped main flow region (high-velocity zone) and a recirculation zone (low-velocity zone). Guided by their innate migratory instincts, fish can discern the high-velocity main flow areas to select optimal upstream routes. Conversely, the recirculation zones within the fishway offer resting spots for fish during their migratory journey, thereby supporting their physical endurance and successful navigation through the fishway.
Due to the obstruction posed by the rectangular island, the high-speed flow entering the pool chamber cannot pass directly through. The main flow is divided into two parts under the influence of the island structure and the valvular structure, forming distinct flow patterns within the pool chamber. Figure 4 demonstrates the effects of valvular structures with valvular arc angles of 180°, 157.5°, 135°, 112.5°, and 90° on the velocity distribution within the fishway at water layers h1 = 0.6b and h2 = 1.1b. From the contour plot results, it becomes evident that the reduction in valvular arc angle leads to significant changes in the flow patterns. As the valvular arc angle decreases, the main flow impacting the wall opposite the valvular structure begins to separate, and the curvature of the “S”-shaped main flow region diminishes. Concurrently, the width of the main flow region gradually increases, accompanied by a notable rise in velocity. When the valvular arc angle reduces to 90°, almost the entirety of the pool chamber is dominated by the main flow, a scenario that is less favorable for successful fish ascent. The area of low velocity adjacent to the un-valvular wall narrows, and the low-velocity region behind the rectangular island also diminishes. The small, low-velocity areas that previously existed on the flow-facing side of the valvular structure shrink accordingly. The fluid velocity in the portion of the main flow that enters the circuit after being divided by the rectangular island shows a significant increase. These phenomena are closely tied to the valvular arc angle, with the valvular structure playing a pivotal role in obstructing the flow within the pool chamber. Around the valvular structures, there exists a rich variety of flow patterns, with the main flow closely adhering to the end of the valvular before entering the next pool chamber. For the two different water layers, the patterns of velocity field change remain largely consistent across the same valvular arc angle models.
Based on the results from the numerical simulations, the maximum velocity Um and the average velocity Ua within each of the island-type fishway models were obtained. Using the island-type fishway model with a valvular arc angle of 180° as the reference, the maximum velocity variation rate RUm and the average velocity variation rate RUa among different valvular structures are calculated as follows:
R U m = ( U m x U m 180 ) U m 180 × 100 %
In the formula, Umx represents the maximum water flow velocity within an island-type fish passage with varying valvular arc angles, and Um180 is the maximum water flow velocity within an island-type fish passage that has a valvular arc angle of 180°.
R U a = ( U a x U a 180 ) U a 180 × 100 %
In the formula, Uax represents the average water flow velocity within an island-type fish passage with varying valvular arc angles, and Ua180 is the average water flow velocity within an island-type fish passage that has a valvular arc angle of 180°.
From the results of the maximum velocity Um and average velocity Ua in different water layers of the pool (as shown in Figure 5 and Figure 6), it can be observed that the effect of the unidirectional evolution of the valvular structure on velocity-related outcomes generally exhibits a unidirectional increasing trend. Looking at the results for the maximum velocity under different water layers as depicted in Figure 5, we find that when the valvular arc angle decreases from 180°, the maximum velocity in the lower water layer rises sharply. A peculiarity occurs during the transition from a valvular arc angle of 135° to 112.5°, where the change in the maximum velocity in the pool is relatively less pronounced. The behavior of the maximum velocity in the upper water layer differs; it initially shows a sharp increase followed by a gradual one, culminating in a distinctive phenomenon during the evolution from 112.5° to 90°, where the rate of increase in maximum velocity decelerates relative to the previous state. Considering the unidirectional changes in valvular arc angle, the overall trend in the maximum velocity of the entire upper water layer also demonstrates a unidirectional pattern—initially a sharp increase, then a slowdown, and finally a further deceleration in the rate of increase. However, the acceleration of the maximum velocity varies across different water layers and evolutionary stages. Relative to the initial condition of a 180° valvular arc angle, all subsequent evolutions result in an increased maximum velocity, suggesting that the initial configuration may be optimal from the perspective of maximizing velocity. The results for the average velocity in different water layers, as shown in Figure 6, reveal that all changes relative to the initial state of valvular arc angle evolution also exhibit a relatively increasing trend. This indicator’s unidirectional variation is more pronounced and stable than that of the maximum velocity. The rate of change in the average velocity RUa across different water layers and evolutionary processes consistently shows a further increase.
From Figure 7, which depicts the percentage area occupied by high and low velocity regions within the chamber, a unidirectional trend similar to that observed in the average velocity metric can be discerned. As the valvular arc angle decreases, the proportion of the area characterized by high flow velocities consistently increases. This finding aligns with the analysis of the velocity contour plots, reinforcing the notion that the initial configuration of the valvular structure might be more suitable for fish ascending through the chamber. A closer look at the specific changes across two water layers reveals that the distribution of velocity areas remains relatively consistent as the valvular arc angle diminishes from 180° to 112.5°. However, when the valvular arc angle is reduced to 90°, there is a marked increase in the proportion of high flow velocity area in the upper water layer compared to the lower layer. This observation reflects the intensified flow in the upper water layer at this particular valvular arc angle setting. Overall, when the valvular arc angle is set at 180°, the area dominated by low flow velocities maintains a coverage of over 60%, which appears to be more advantageous for fish seeking rest during their upstream journey compared to other valvular arc angle configurations studied in this context.

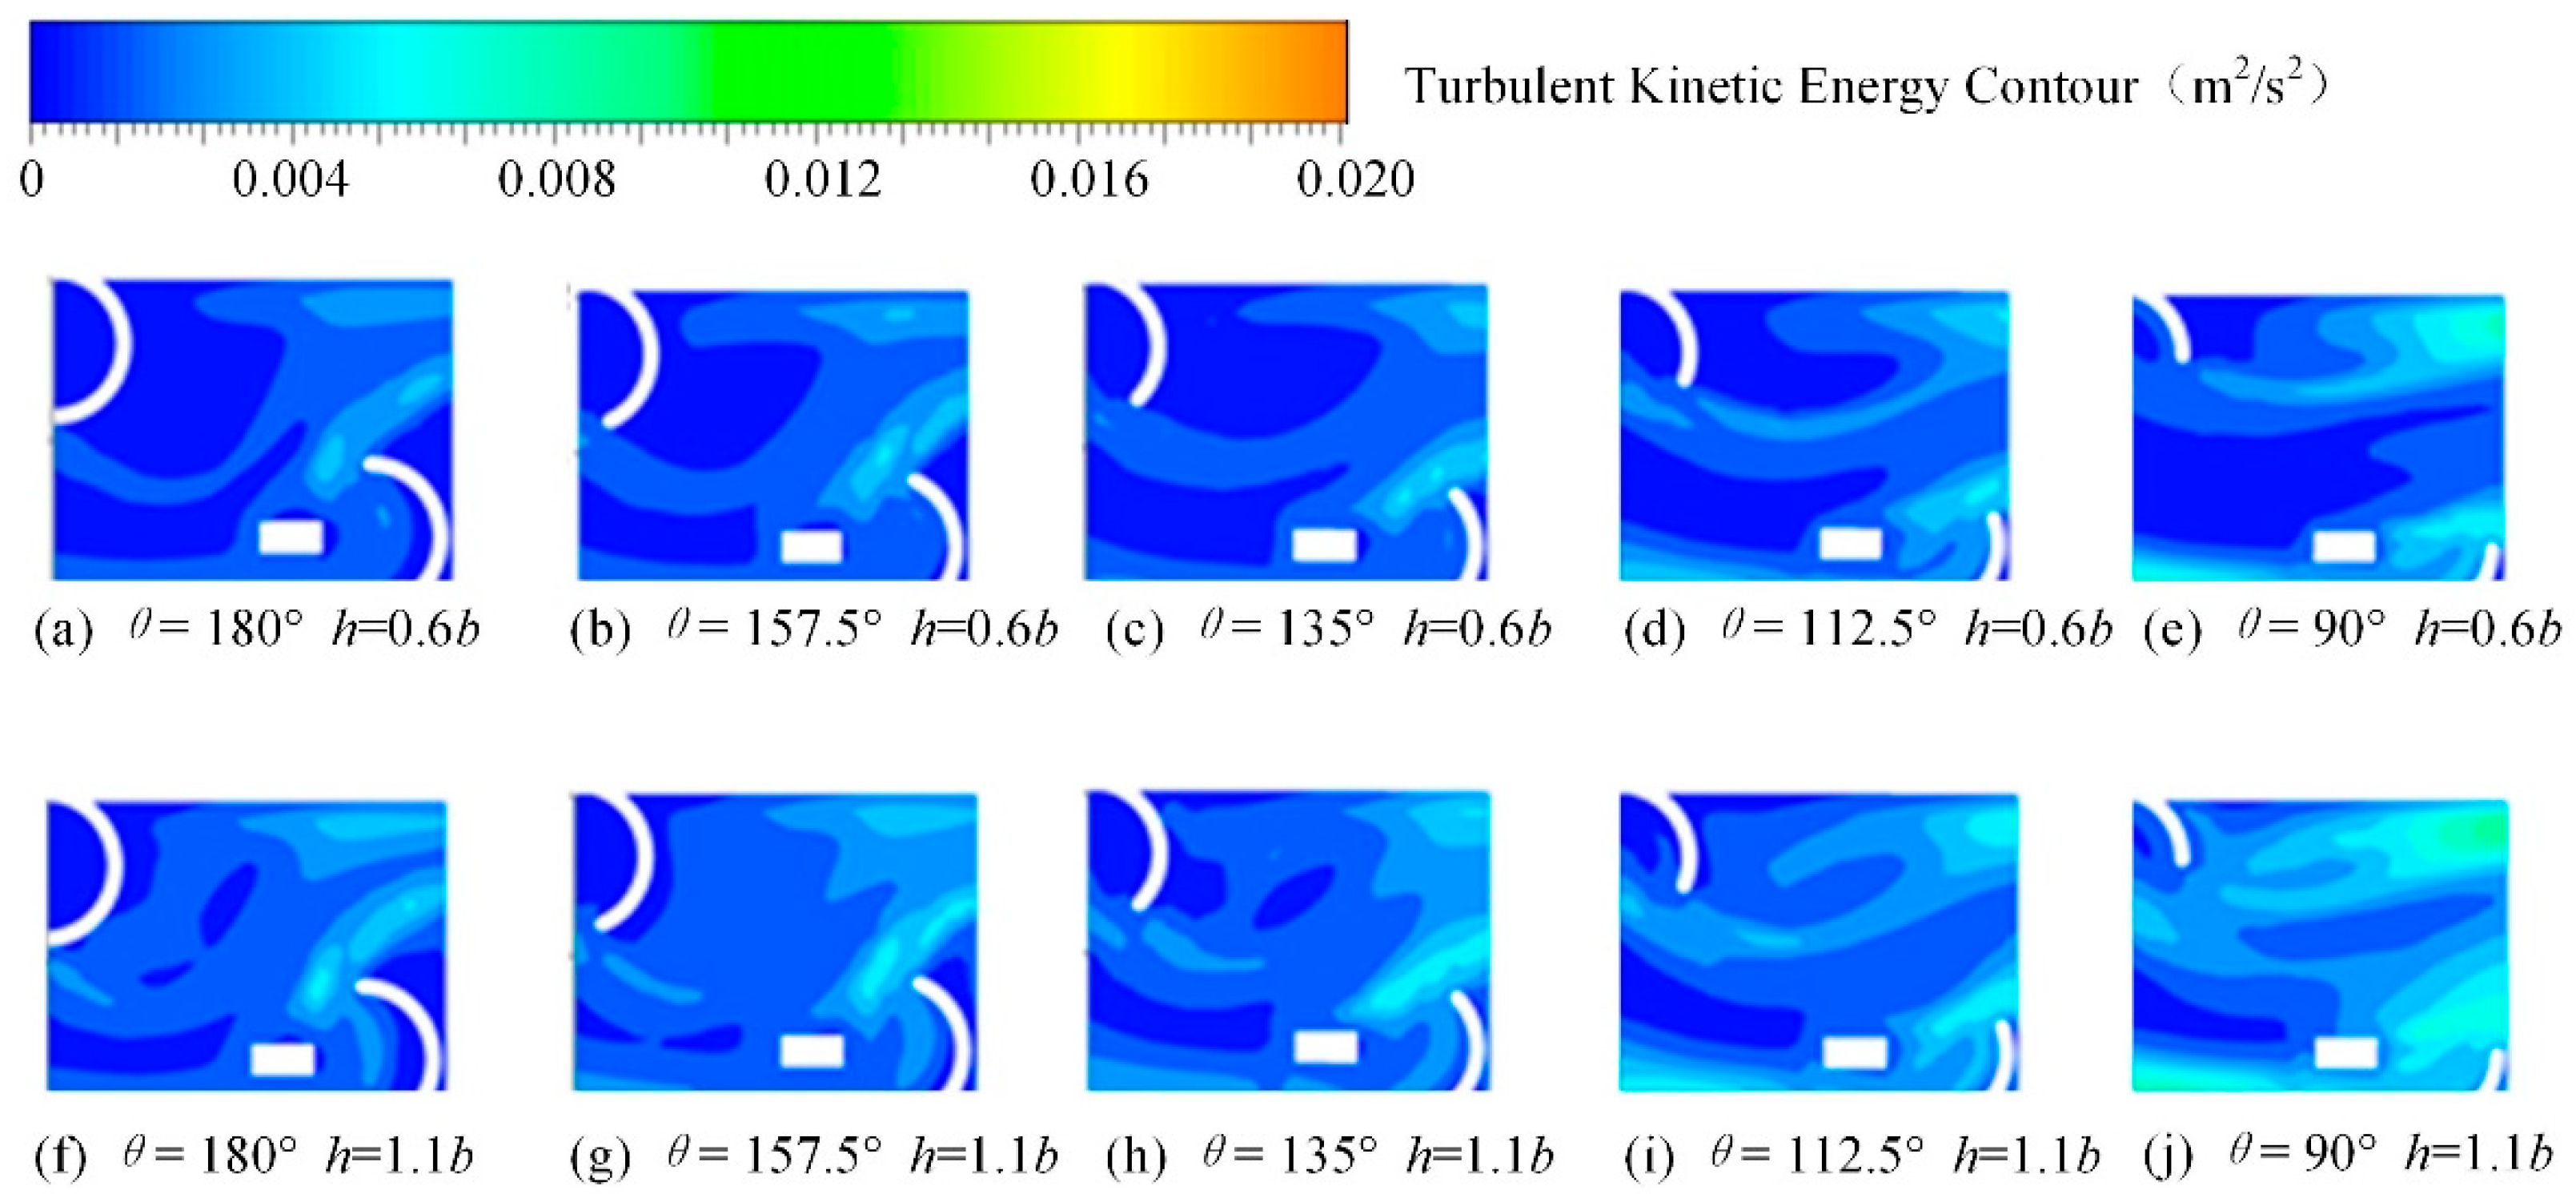
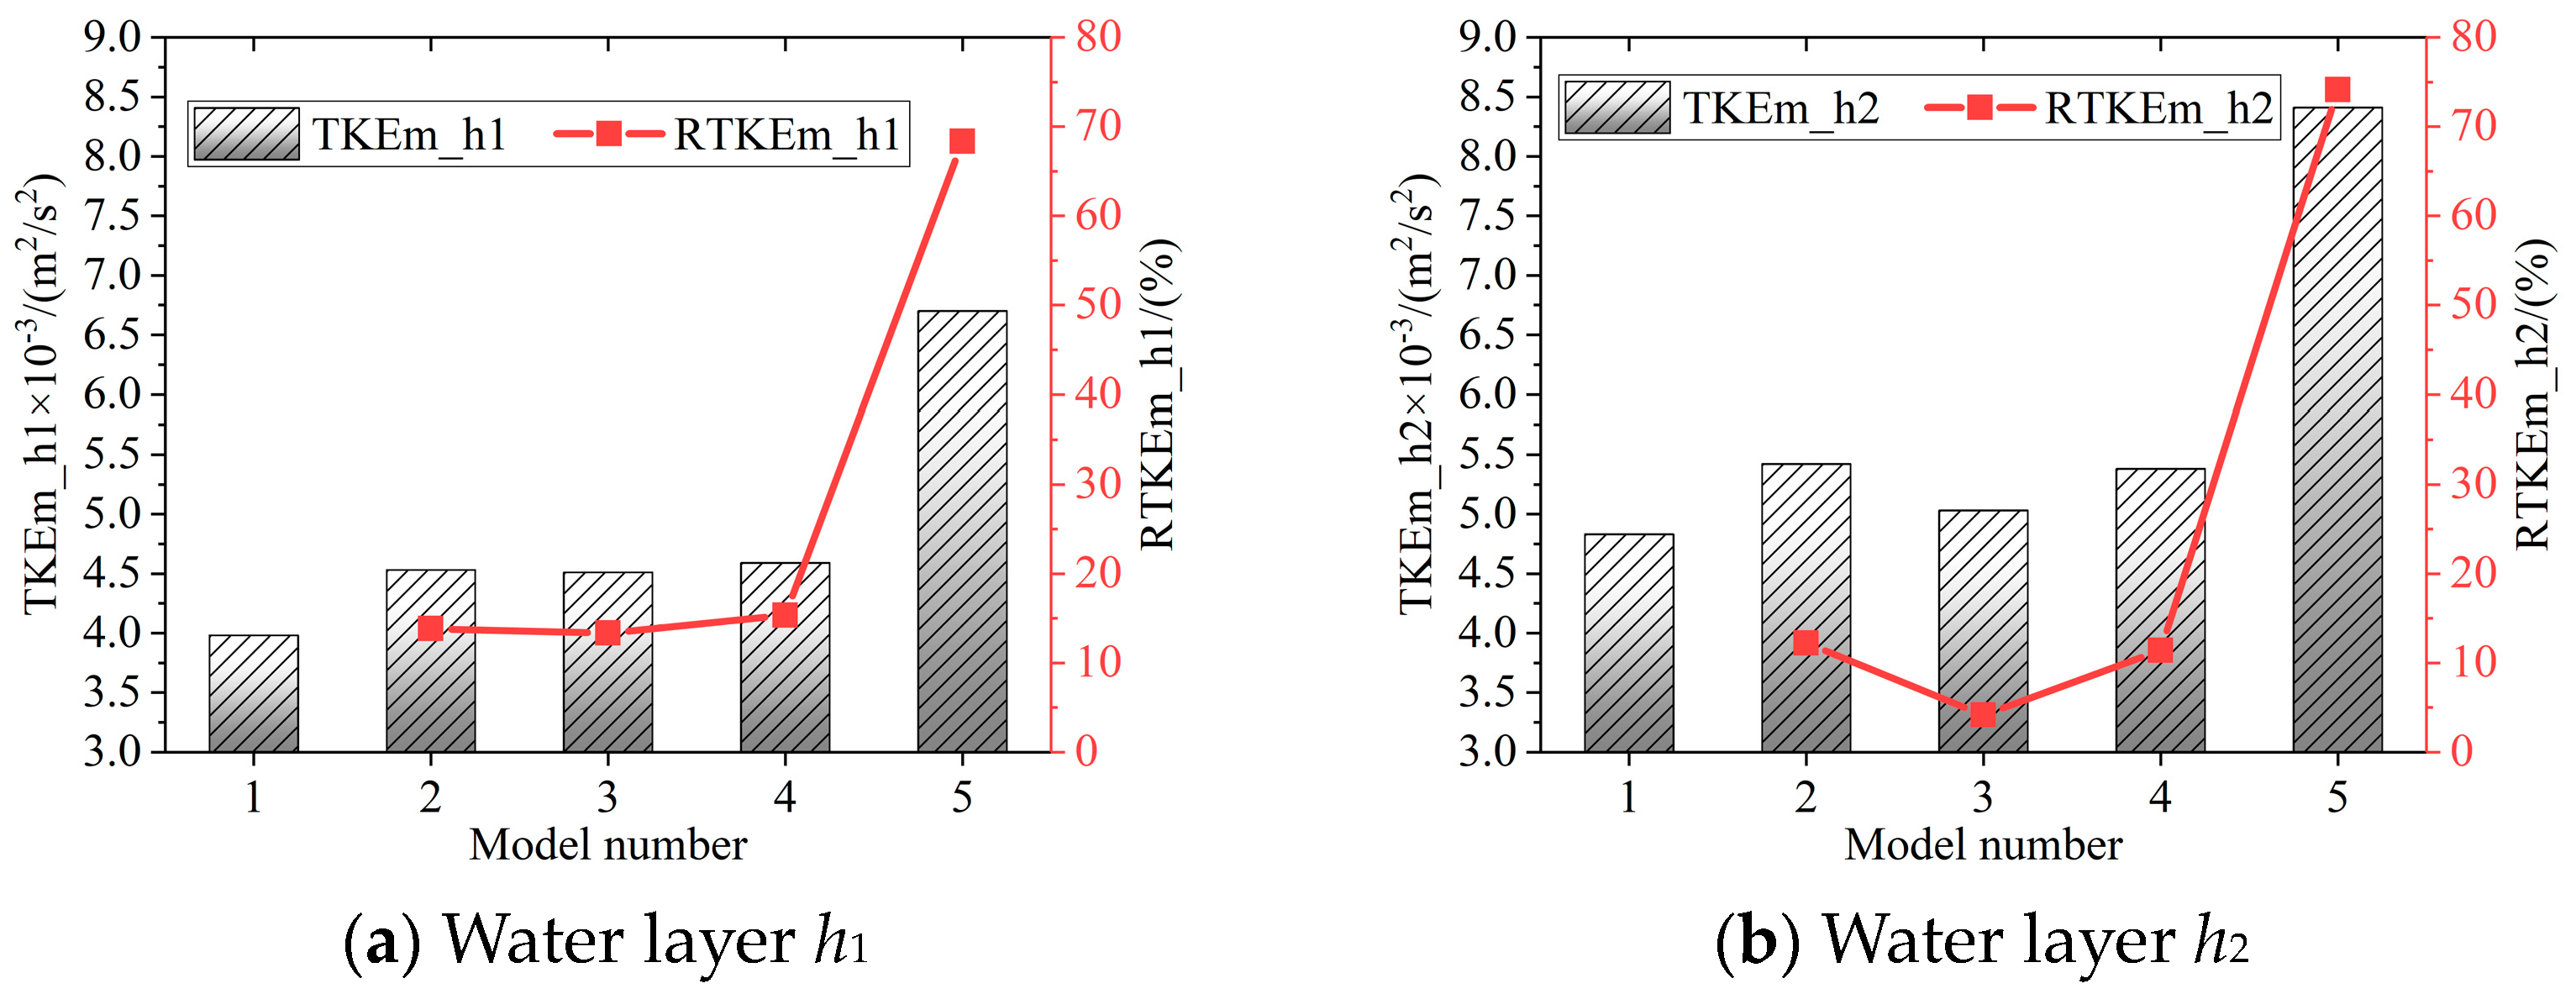
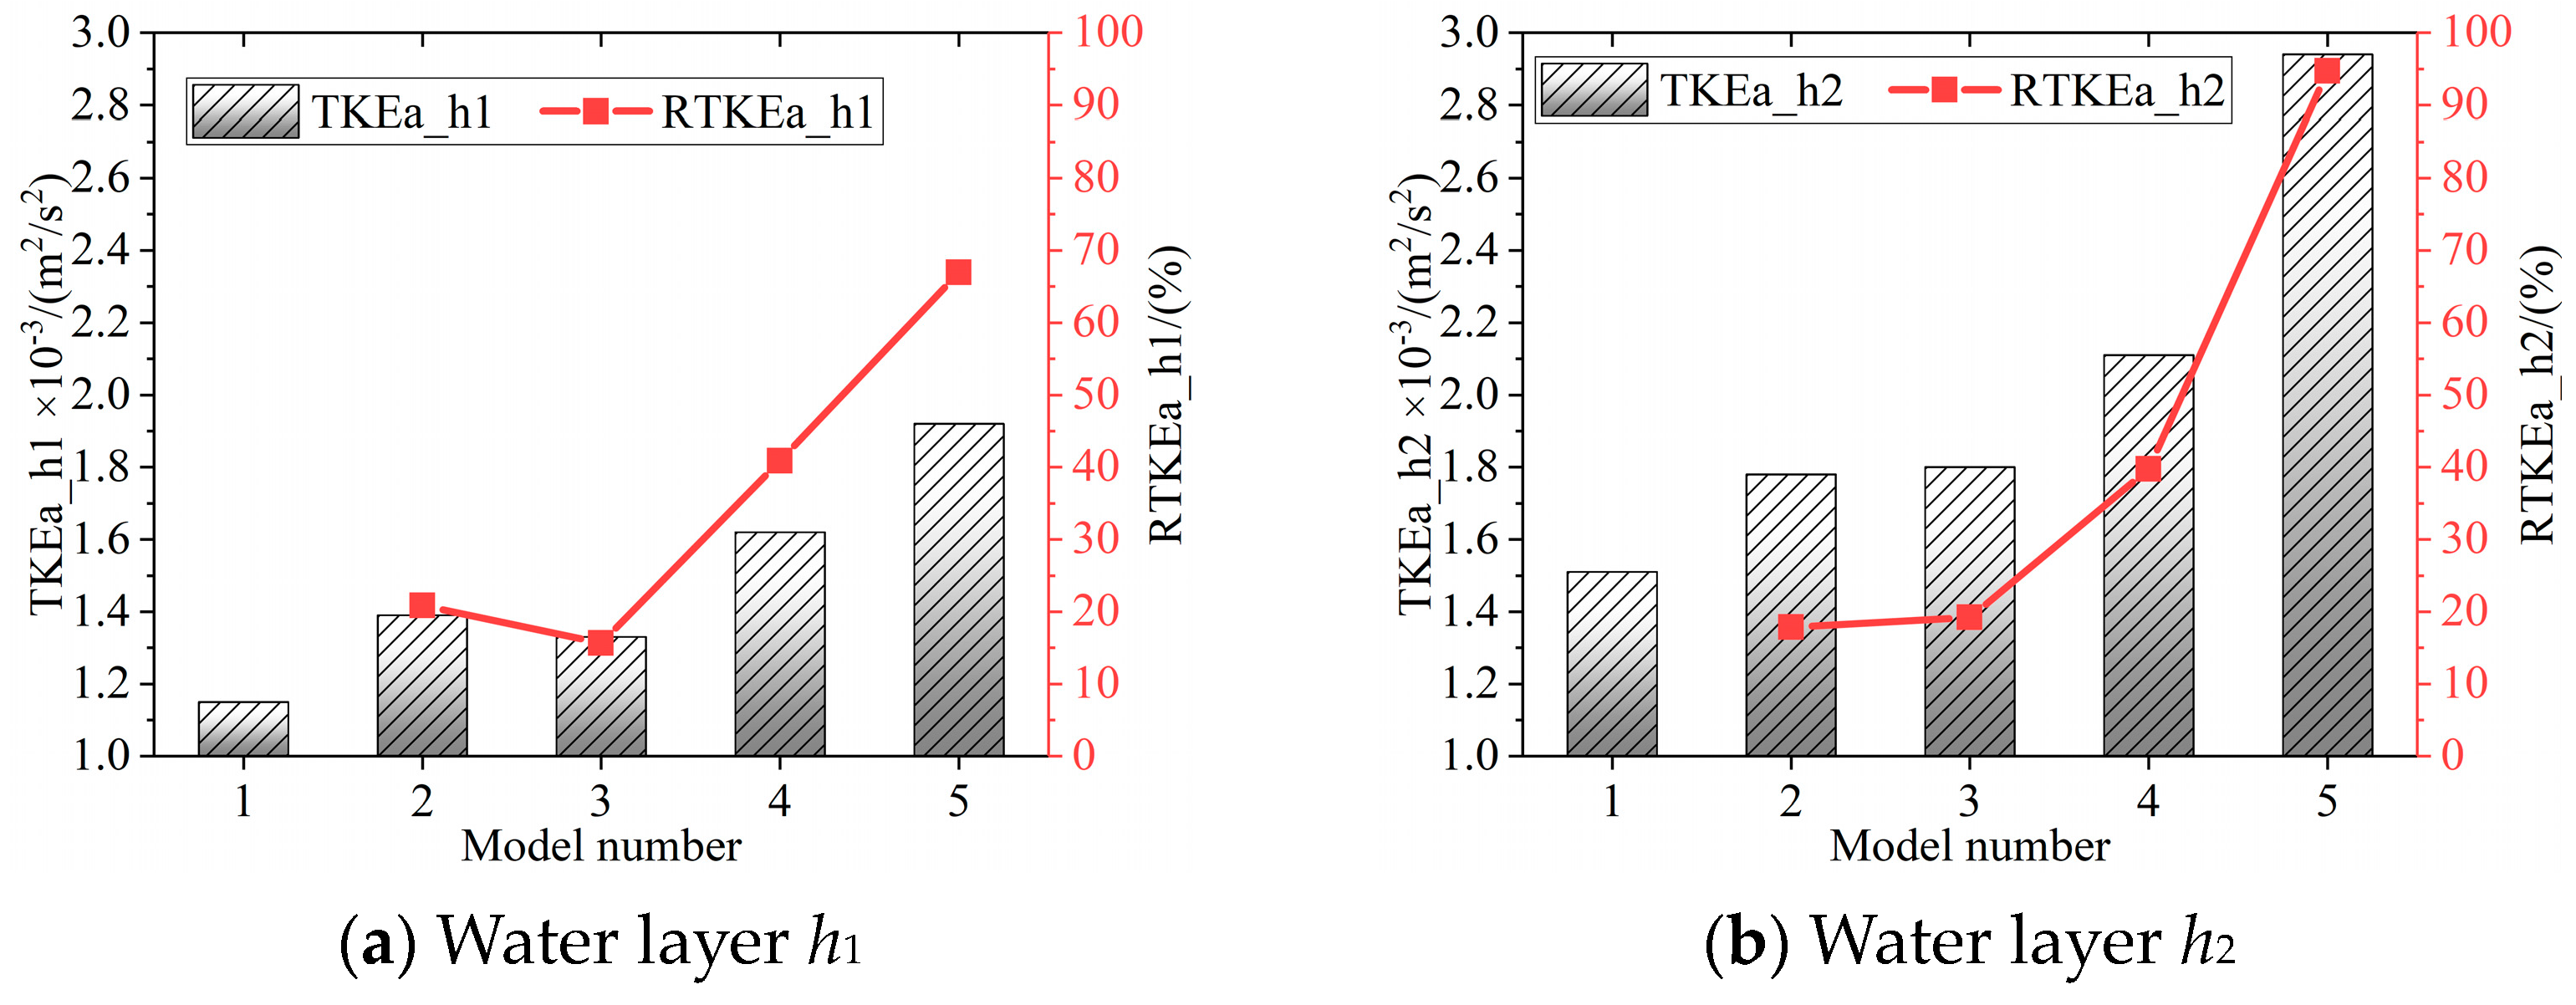
3.2. Turbulent Kinetic Energy Distribution

The impact of turbulence on fish swimming behavior is fundamental. Turbulence arises from the superposition of irregular and random variations in vortices of various scales in both time and space during the flow of water. Turbulent kinetic energy (TKE) represents the magnitude of energy changes within the range of velocity fluctuations. The magnitude of TKE has a significant effect on the swimming energy consumption of fish. Previous experiments found that turbulence with low TKE has minimal impact on fish swimming behavior and energy consumption, but excessively high TKE can lead to disorientation and increased swimming energy expenditure. An increase in TKE can cause fish to frequently adjust their swimming posture through body movements to maintain balance, and an increase in TKE intensity can result in an increase in total swimming energy expenditure. Additionally, TKE affects fish ascending behavior; previous experiments have shown that most test fish tend to avoid high-turbulence regions during ascent. Fish expend more energy to counteract high TKE, and high TKE also implies that the time for fish to successfully pass through may be prolonged, impacting their transit efficiency. Figure 8 displays the distribution of TKE within the chamber for models with different valvular arc angles. Comparing different water layer heights, higher TKE is observed at relatively greater depths; additionally, as the valvular arc angle decreases at the same depth, the TKE increases, and the area of high turbulence expands. The distribution of TKE within the chamber reveals that higher TKE frequently occurs at the ends of the valvular structures. This phenomenon is due to the main flow encountering the valvular tip, where the direction of the main flow becomes distorted by the obstruction of the valvular structure, leading to intense turbulent mixing. Within the chamber, higher TKE is also noted in the region where the distorted main flow impacts the wall opposite the valvular-free side, which is more pronounced at higher water layers. For the same water layer height, as the valvular arc angle decreases, the TKE near the wall also increases, making the high TKE region more distinct, with its area progressively expanding. This is because, with a reduced valvular arc angle, the degree of distortion of the main flow is lessened, altering the area where the main flow impacts the wall opposite the valvular-free side, thus shifting the high TKE region downstream. Furthermore, the impact of the valvular structure on the main flow is reduced, effectively widening the pseudo-vertical gap, allowing for smoother flow passage and an increase in the velocity of the main flow. Consequently, the impact of the main flow on the wall intensifies, resulting in elevated TKE.
Based on the results from the numerical simulations, the maximum velocity TKEm and the average velocity TKEa were obtained within each of the island-type fishway models. Using the island-type fishway model with a valvular arc angle of 180° as the reference, the maximum velocity variation rate RTKEm and the average velocity variation rate RTKEa among different valvular structures are calculated as follows:
R T K E m = ( T K E m x T K E m 180 ) T K E m 180 × 100 %
In the formula, TKEmx represents the maximum water flow velocity within an island-type fish passage with varying valvular arc angles, and TKEm180 is the maximum water flow velocity within an island-type fish passage that has a valvular arc angle of 180°.
T K E a = ( T K E a x T K E a 180 ) T K E a 180 × 100 %
In the formula, TKEax represents the average water flow velocity within an island-type fish passage with varying valvular arc angles, and TKEa180 is the average water flow velocity within an island-type fish passage that has a valvular arc angle of 180°.
Figure 9 and Figure 10, respectively, display the maximum turbulent kinetic energy TKEm and the average turbulent kinetic energy TKEa for different water layers and models, with the relative change rate in turbulent kinetic energy calculated using a 180° valvular arc angle as the initial state. These figures visually demonstrate that all valvular arc angles other than the initial 180° result in an increase in both the maximum and average turbulent kinetic energy within the chamber. Moreover, the magnitude of the increase in turbulent kinetic energy-related outcomes becomes more pronounced as the valvular arc angle decreases relative to the initial setting. Specifically, Figure 9 presents statistics on the variations of the maximum turbulent kinetic energy in different water layers. It is evident from the figure that the maximum turbulent kinetic energy values at water layer h2 are consistently higher than those at h1 for the same valvular arc angle settings. The most significant changes in the maximum turbulent kinetic energy occur as the valvular arc angle transitions from 112.5° to 90°, with an approximate 70% increase in the maximum turbulent kinetic energy across different water layers relative to the model with the initial angle setting. Figure 10 provides a statistical overview of the changes in average turbulent kinetic energy across different water layers. It clearly shows that the average turbulent kinetic energy in the upper water layer is considerably higher than in the lower layer. The trends in changes to the average turbulent kinetic energy as a result of alterations to the valvular structure angle are largely similar to those seen for the maximum turbulent kinetic energy. What sets the change in average turbulent kinetic energy apart from the maximum is that the increase is notably higher, indicating that the rise in turbulent kinetic energy is not confined to localized areas but is instead a comprehensive elevation throughout the chamber. Considering the migratory habits of fish, models with higher turbulent kinetic energy are less favorable for their upstream migration. In light of the aforementioned analysis, setting the valvular structure at the initial 180° angle appears to be a more suitable choice for accommodating fish passage.

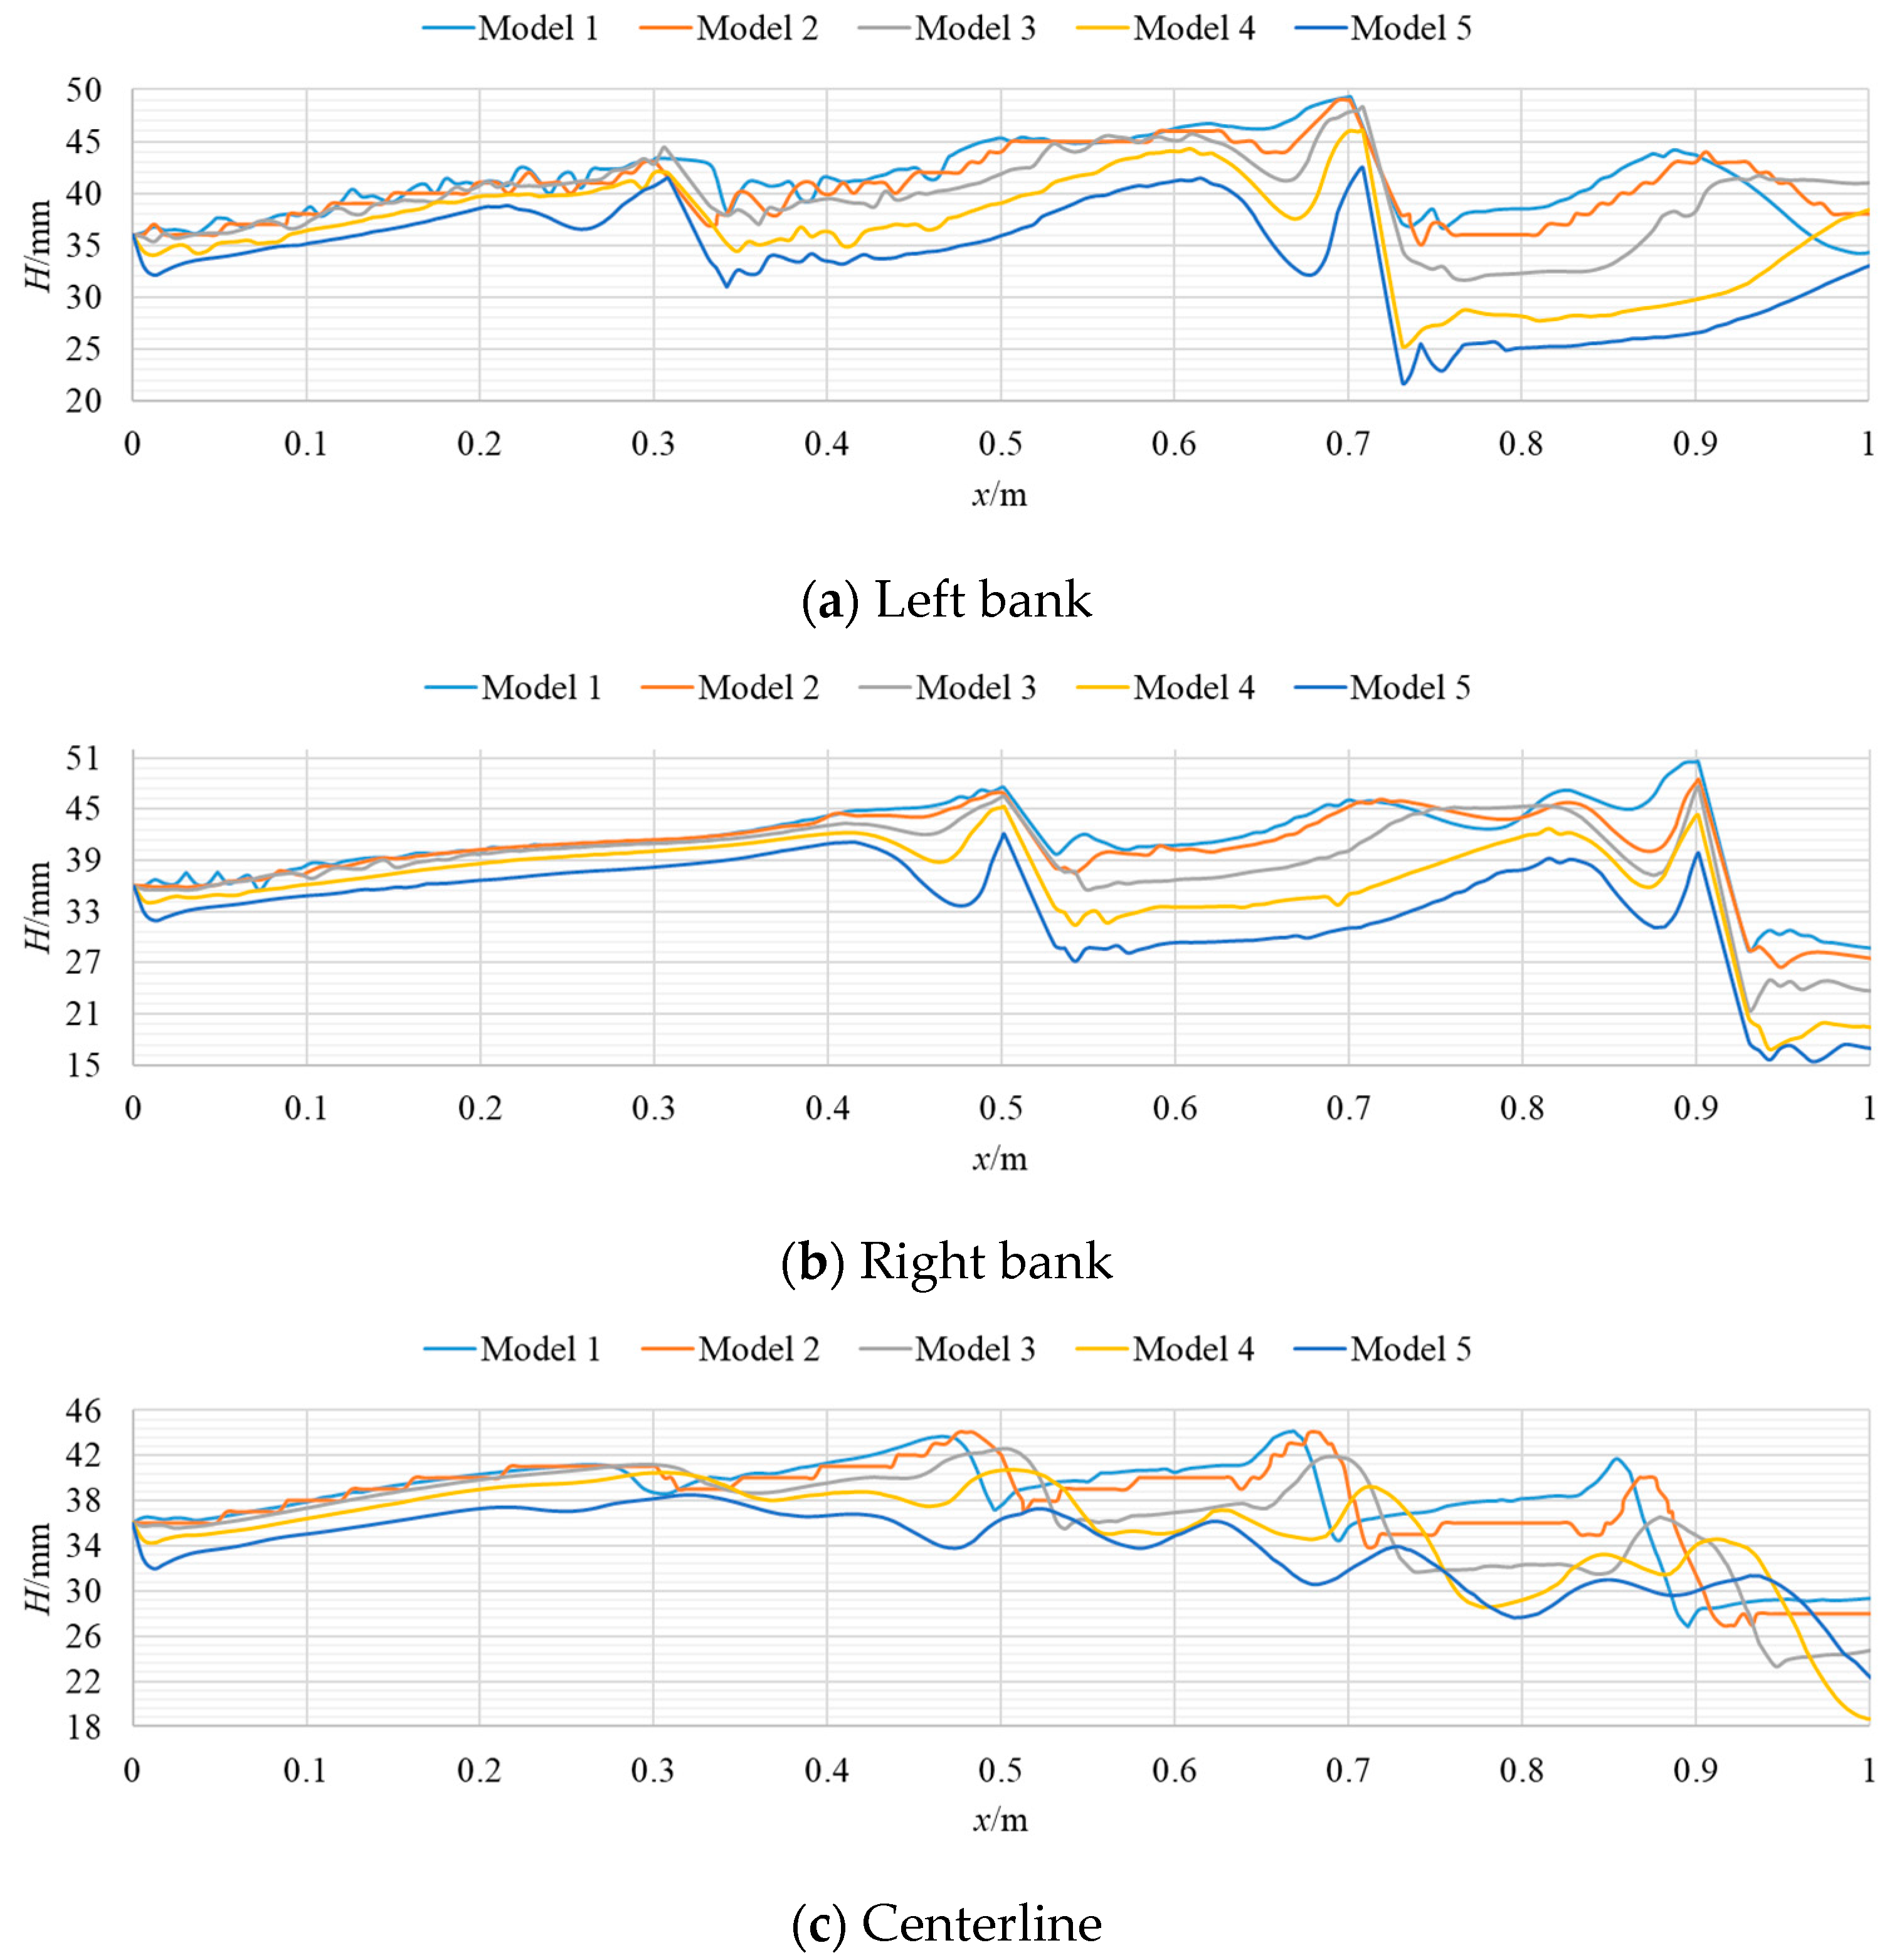
3.3. The Change in Water Level

Water levels have significant impacts on fish life and migration. Water levels affect water quality, including temperature, dissolved oxygen levels, and salinity, all of which are crucial for fish survival. Additionally, some fish species migrate based on seasonal changes in water levels. Therefore, studying the variations in water levels within island-type fishways is of great significance.
The variation in water level serves as an indicator of the degree of fluctuation at the water surface. Figure 11 demonstrates the changes in water depth along both sides and the centerline of the island-type fish passage. Given that the valvular structures positions, the water level results from both sides exhibit an alternating stair step pattern. This observation is consistent with the findings from hydraulic model tests, indicating that the arrangement of the valvular structures on either side of the chamber influences the alternating changes in water level along the course. Similarly, the water level along the centerline of the island-type fish passage shows a stair step effect occurring every 200 mm. For the fish passage, the centerline is a critical route for fish ascending, and the changes in water level here are more moderate compared to those at the sides. From the figure, it is noticeable that as the valvular arc angle decreases, the waveform of the water level gradually exhibits a lagging effect, which is primarily observed at the water levels near the left bank and along the centerline, with the latter showing this characteristic more prominently. Analyzing the centerline specifically, when the valvular arc angle is set at 180°, the entire channel demonstrates relatively higher water levels with a pronounced stair step effect. As the valvular arc angle decreases further, the water level starts to decline slowly, and the waveforms of the water level become increasingly delayed, causing the stair step feature to weaken. When the valvular arc angle is reduced to 90°, the characteristic features of the water level changes along the centerline are virtually absent. Based on the magnified view of the water level changes in the local area of the chamber along the centerline, a valvular arc angle of 180° is found to be most favorable for fish passage.
As illustrated in Figure 12, the average water level within the chamber of the island-type fishway changes as the valvular arc angle is reduced. It is visually evident that the average water levels on both sides of the chamber decrease for different models as the valvular arc angle decreases. Due to the greater number of valvular structures on the left bank side of the island-type fishway compared to the right bank side, the average water level on the left bank is generally higher. The average water level along the centerline of the chamber is lower than the sides because the pseudo-vertical gap is located in the middle of the flow channel, offering less resistance to the water flow.
However, when the valvular arc angle is set at 112.5°, the relative relationship between the average water levels on the right bank side, the left bank side, and the centerline changes. Specifically, the average water level on the right bank side becomes lower than that on the centerline, a phenomenon that is particularly pronounced when the angle is reduced to 90°. On one hand, the overall reduction in the valvular arc angle on the right bank side significantly weakens its obstructive effect on the water flow. On the other hand, as the pseudo-vertical gap widens further, more fluid passes through this path. The flow that was previously deflected by the valvular structures and impacted the side walls is significantly reduced, leading to a substantial drop in the water level on the side without valvular. In conjunction with the analysis of the flow field and turbulent kinetic energy, it can be concluded that setting the valvular arc angle at 180° is relatively appropriate. As the angle is reduced, the water level environment becomes less favorable for fish migration, suggesting that maintaining a larger valvular arc angle could provide a more conducive habitat for fish attempting to ascend the fishway.

4. Conclusions and Outlook

The effects of valvular structures on the internal flow characteristics of an island-type fishway were investigated through hydraulic model experiments and numerical simulation calculations. The main conclusions are summarized as follows:
(1) Within the chamber of the island-type fishway, a high-velocity mainstream exhibits a nearly “S”-shaped flow pattern, while a low-velocity recirculation zone forms downstream of the valvular structures. Continuous and smooth high-velocity regions are beneficial for guiding fish during upstream migration, whereas the recirculation zones within the fishway provide resting spaces for fish that have been swimming against the current for extended periods. The valvular structures significantly influence the flow characteristics within the fishway. Among the valvular structures studied, a smaller valvular arc angle corresponds to a wider high-velocity mainstream and a smaller area of low-speed recirculation. As the valvular arc angle decreases, the average flow velocity gradually increases. However, the impact of valvular structures on the maximum flow velocities at different water layers is inconsistent. As the valvular arc angle decreases, the maximum flow velocity in the lower water layer continuously increases, whereas the maximum flow velocity in the upper water layer exhibits fluctuations in models with smaller valvular arc angles.
(2) Turbulent kinetic energy (TKE) reflects the fluctuation intensity of the water flow, and the distribution of TKE within the island-type fishway directly affects the efficiency of fish passage. At the end of the valvular structures, the TKE values are noticeably higher than in other parts of the fishway. For the distribution of TKE at different water layer heights, TKE is higher in the upper water layers of the fishway. In the same water layer, as the valvular arc angle decreases, the TKE increases, and the area of high turbulence also grows. When the valvular arc angle is within a smaller range, the changes in TKE are particularly drastic.
(3) Variations in the water level line indicate the degree of fluctuation at the water surface. Due to the presence of valvular structures within the fishway, the water level along the course shows a stepped change. As the valvular arc angle decreases, the water level within the fishway drops gradually, and the stepped characteristic weakens. When the valvular arc angle is reduced to 90°, the stepped feature of the water level along the centerline is virtually absent.
Based on the results from experiments and numerical calculations, the variations in flow velocity, TKE, and water level line characteristics were analyzed within the chamber due to changes in the valvular arc angle. Within the range of valvular arc angles studied, an island-type fishway with a 180° valvular arc angle is the most favorable for fish ascending during migration.
While the results provide valuable insights into the optimal design of the island-type fishway, it is important to acknowledge the limitations of the study design that might affect the interpretation of the results. In terms of experiments, experimental data used to validate simulations can contain measurement errors due to instrumentation limitations. In terms of numerical simulation, the simulation assumed steady-state flow conditions and did not account for transient effects that may occur in real-world scenarios. This may have led to an oversimplification of the flow dynamics. The grid resolution used in the simulation may not have been sufficiently fine to accurately resolve all the relevant scales of the flow, especially in regions of high turbulence or complex geometries. Coarse grids can lead to numerical diffusion and inaccuracies in the prediction of flow features. In addition, the calculations employ the RNG k-ε turbulence model integrated with the VOF free surface model. Although this is a common method for solving open channel flows, the choice of turbulence model and multiphase flow mode may not fully capture all aspects of the flow, leading to inaccuracies. In addition, different schemes have different levels of accuracy and stability. Higher-order schemes can reduce numerical diffusion but may increase computational costs. This numerical simulation selects a compromise calculation scheme that takes into account computational efficiency and accuracy. Moreover, convergence criteria, underrelaxation factors, and other solver settings can affect the solution quality.
Based on the limitations and findings of the current study, further research can be pursued in the following areas:
(1) Despite the simplicity of the island-type fishway structure, since the research is in its early stages, in addition to the valvular arc angle, further studies can investigate the effects of structural parameters such as the island shape and island angle on the flow dynamics.
(2) There are many species of migratory fish in rivers, each with varying swimming abilities. Designing an island-type fishway structure that accommodates the migratory needs of diverse fish species presents a challenging task. It may even be worthwhile to consider designing adjustable or adaptable island-type fishway structures to meet the migratory demands of fish at different times.
(3) Conducting a comprehensive sustainability assessment of island-type fishway designs, evaluating the environmental, economic, and social impacts of different design options. This will ensure that the island-type fishway designs are not only effective but also sustainable, benefiting both the ecosystem and local communities.

Author Contributions

Conceptualization, M.X.; methodology, M.D.; investigation, G.Z.; resources, J.M.; data curation, Y.G.; writing—original draft preparation, M.D.; writing—review and editing, M.X.; visualization, G.Z. All authors have read and agreed to the published version of the manuscript.

Funding

This work was financially supported by the National Natural Science Foundation of China (Project No. 51909235), the Zhejiang Provincial Natural Science Foundation of China (Project No. LGG22E090001), and the Zhejiang Provincial Department of Education Science and Technology Plan Project (Project No. Y202249406).

Data Availability Statement

Data are contained within the article.

Acknowledgments

The authors are very grateful to the Institute of Fluid Equipment and Inspection Technology, China Jiliang University, for supporting this study.

Conflicts of Interest

The authors declare no conflicts of interest.

References

  1. Pavlova, A.; Beheregaray, L.B.; Coleman, R.; Gilligan, D.; Harrisson, K.A.; Ingram, B.A.; Kearns, J.; Lamb, A.M.; Lintermans, M.; Lyon, J. Severe consequences of habitat fragmentation on genetic diversity of an endangered Australian freshwater fish: A call for assisted gene flow. Evol. Appl. 2017, 10, 531–550. [Google Scholar] [CrossRef] [PubMed]
  2. Baharvand, S.; Lashkar-Ara, B. Hydraulic design criteria of the modified meander C-type fishway using the combined experimental and CFD models. Ecol. Eng. 2021, 164, 106207. [Google Scholar] [CrossRef]
  3. Birnie-Gauvin, K.; Franklin, P.; Wilkes, M.; Aarestrup, K. Moving beyond fitting fish into equations: Progressing the fish passage debate in the Anthropocene. Aquat. Conserv. 2019, 29, 1095–1105. [Google Scholar] [CrossRef]
  4. Katopodis, C.; Williams, J.G. The development of fish passage research in a historical context. Ecol. Eng. 2012, 48, 8–18. [Google Scholar] [CrossRef]
  5. Mao, X. Review of fishway research in China. Ecol. Eng. 2018, 115, 91–95. [Google Scholar] [CrossRef]
  6. Sanagiotto, D.G.; Rossi, J.B.; Bravo, J.M. Applications of computational fluid dynamics in the design and rehabilitation of nonstandard vertical slot fishways. Water 2019, 11, 199. [Google Scholar] [CrossRef]
  7. Kasischke, K.; Oertel, M. Discharge Coefficients of a Specific Vertical Slot Fishway Geometry—New Fitting Parameters. Water 2023, 15, 1193. [Google Scholar] [CrossRef]
  8. Puertas, J.; Pena, L.; Teijeiro, T. Experimental approach to the hydraulics of vertical slot fishways. J. Hydraul. Eng. 2004, 130, 10–23. [Google Scholar] [CrossRef]
  9. Wu, S.; Rajaratnam, N.; Katopodis, C. Structure of flow in vertical slot fishway. J. Hydraul. Eng. 1999, 125, 351–360. [Google Scholar] [CrossRef]
  10. Bermúdez, M.; Puertas, J.; Cea, L.; Pena, L.; Balairón, L. Influence of pool geometry on the biological efficiency of vertical slot fishways. Ecol. Eng. 2010, 36, 1355–1364. [Google Scholar] [CrossRef]
  11. Dong, Z.; Tong, J.; Huang, Z. Turbulence characteristics in a weir-orifice-slot combined fishway with an identical layout. J. Turbul. 2022, 23, 327–351. [Google Scholar] [CrossRef]
  12. Kim, J. Hydraulic characteristics by weir type in a pool-weir fishway. Ecol. Eng. 2001, 16, 425–433. [Google Scholar] [CrossRef]
  13. Foulds, W.L.; Lucas, M.C. Extreme inefficiency of two conventional, technical fishways used by European river lamprey (Lampetra fluviatilis). Ecol. Eng. 2013, 58, 423–433. [Google Scholar] [CrossRef]
  14. Odeh, M. Discharge rating equation and hydraulic characteristics of standard Denil fishways. J. Hydraul. Eng. 2003, 129, 341–348. [Google Scholar] [CrossRef]
  15. Katopodis, C.; Rajaratnam, N.; Wu, S.; Tovell, D. Denil fishways of varying geometry. J. Hydraul. Eng. 1997, 123, 624–631. [Google Scholar] [CrossRef]
  16. Bunt, C.; Castro-Santos, T.; Haro, A. Performance of fish passage structures at upstream barriers to migration. River Res. Appl. 2012, 28, 457–478. [Google Scholar] [CrossRef]
  17. Towler, B.; Mulligan, K.; Haro, A. Derivation and application of the energy dissipation factor in the design of fishways. Ecol. Eng. 2015, 83, 208–217. [Google Scholar] [CrossRef]
  18. Li, S.; Yang, J.; Ma, X.; Li, X. Flow features in a pooled fishway with V-shaped weir formation. Eng. Appl. Comput. Fluid Mech. 2020, 14, 1337–1350. [Google Scholar] [CrossRef]
  19. Baki, A.B.M.; Zhu, D.Z.; Rajaratnam, N. Turbulence characteristics in a rock-ramp-type fish pass. J. Hydraul. Eng. 2015, 141, 04014075. [Google Scholar] [CrossRef]
  20. Baki, A.B.M.; Zhu, D.Z.; Harwood, A.; Lewis, A.; Healey, K. Hydraulic design aspects of rock-weir fishways with notch for habitat connectivity. TJoE 2020, 5, 94–109. [Google Scholar] [CrossRef]
  21. Li, S.; Yang, J.; Ansell, A. Evaluation of pool-type fish passage with labyrinth weirs. Sustainability 2022, 14, 1098. [Google Scholar] [CrossRef]
  22. Zhang, D.; Liu, C.; Shi, X.; Liu, Y.; Qu, Y. A novel H-shape fishway with excellent hydraulic characteristics. J. Hydrol. Hydromech. 2022, 71, 64–79. [Google Scholar] [CrossRef]
  23. Stuart, I.G.; Marsden, T.J.; Jones, M.J.; Moore, M.T.; Baumgartner, L.J. Rock fishways: Natural designs for an engineered world. Ecol. Eng. 2024, 206, 107317. [Google Scholar] [CrossRef]
  24. Cassan, L.; Miranda, F.C.; Laurens, P.; Courret, D. Hydraulic of rock-ramp fishway with lateral slope. Environ. Fluid Mech. 2024, 24, 1–18. [Google Scholar] [CrossRef]
  25. Mirkhorli, P.; Ghaderi, A.; Alizadeh Sanami, F.; Mohammadi, M.; Kuriqi, A.; Kisi, O. An investigation on hydraulic aspects of rectangular labyrinth pool and weir fishway using FLOW-3D. Arab. J. Sci. Eng. 2024, 49, 6061–6087. [Google Scholar] [CrossRef]
  26. Vowles, A.S.; Montali-Ashworth, D.; Karageorgopoulos, P.; Kemp, P.S. Hydraulic conditions created by a ‘large’diameter Cylindrical Bristle Cluster fish pass. Ecol. Eng. 2024, 207, 107337. [Google Scholar] [CrossRef]
  27. Zeng, G.; Xu, M.; Mou, J.; Hua, C.; Fan, C. Application of Tesla Valve’s Obstruction Characteristics to Reverse Fluid in Fish Migration. Water 2022, 15, 40. [Google Scholar] [CrossRef]
  28. Qian, J.-y.; Wu, J.-y.; Gao, Z.-x.; Wu, A.; Jin, Z.-j. Hydrogen decompression analysis by multi-stage Tesla valves for hydrogen fuel cell. Int. J. Hydrogen Energy 2019, 44, 13666–13674. [Google Scholar] [CrossRef]
  29. Zeng, G.; Xu, M.; Mou, J.; Wang, K.; Ren, Y. Research on the Hydraulic Characteristics of Island Fishways by Experimental and Numerical Methods. Water 2023, 15, 2592. [Google Scholar] [CrossRef]
  30. Feurich, R.; Boubée, J.; Olsen, N.R.B. Improvement of fish passage in culverts using CFD. Ecol. Eng. 2012, 47, 1–8. [Google Scholar] [CrossRef]
  31. Richmond, M.C.; Deng, Z.; Guensch, G.R.; Tritico, H.; Pearson, W.H. Mean flow and turbulence characteristics of a full-scale spiral corrugated culvert with implications for fish passage. Ecol. Eng. 2007, 30, 333–340. [Google Scholar] [CrossRef]
  32. Cea, L.; Pena, L.; Puertas, J.; Vázquez-Cendón, M.; Peña, E. Application of several depth-averaged turbulence models to simulate flow in vertical slot fishways. J. Hydraul. Eng. 2007, 133, 160–172. [Google Scholar] [CrossRef]
  33. Chen, Q.; Zhang, J.; Chen, Y.; Mo, K.; Wang, J.; Tang, L.; Lin, Y.; Chen, L.; Gao, Y.; Jiang, W. Inducing flow velocities to manage fish reproduction in regulated rivers. Engineering 2021, 7, 178–186. [Google Scholar] [CrossRef]
  34. Yang, Q.; Hu, P.; Yang, Z.; Chu, L.; Yang, J. Suitable flow rate and adaptive threshold for grass carp (Ctenopharyngodon idellus) migration. J. Hydroecology 2019, 40, 93–100. [Google Scholar]
Figure 1. Experimental platform for the island-type fishway.
Water 16 02336 g001
Figure 2. Schematic diagram of the chamber structure within an island-type fishway.
Water 16 02336 g002
Figure 3. Mesh generation schematic.
Water 16 02336 g003
Figure 4. Velocity field contour plots for chambers with different valvular arc angles.
Water 16 02336 g004
Figure 5. The maximum flow velocity and its relative change rate in different water layers within the chamber for models with varying valvular arc angles.
Water 16 02336 g005
Figure 6. The average flow velocity and its relative change rate in different water layers within the chamber for models with varying valvular arc angles.
Water 16 02336 g006
Figure 7. The area proportion of high and low flow velocity area in different model pools under the change of valvular arc angles.
Water 16 02336 g007
Figure 8. Distribution of TKE within the chamber for models with different valvular arc angles.
Water 16 02336 g008
Figure 9. The maximum TKE and its relative change rate in different water layers within the chamber for models with varying valvular arc angles.
Water 16 02336 g009
Figure 10. The average TKE and its relative change rate in different water layers within the chamber for models with varying valvular arc angles.
Water 16 02336 g010
Figure 11. Changes in water level along the paths at both sides and the centerline under varying valvular angles.
Water 16 02336 g011
Figure 12. Changes in the average water level within the chamber of an island-type fish passage under different valvular arc angles.
Water 16 02336 g012
Table 1. Meshing scheme.
Grid SchemeAverage Mesh Size (mm)Number of Mesh (Thousand)e (%)
M11059 7.01
M281126.08
M362575.95
M454615.98
Table 2. Velocities comparation between experiment and numerical simulation along the centerline in the 2nd chamber.
Measurement Point NumberVelocity Measured by Experiment (m/s)Velocity Calculated by CFD with M3 Mesh (m/s)
10.0650.068
20.0570.063
30.0360.039
40.0780.081
50.1430.147
60.2480.265
70.3810.389
80.2530.273
90.0810.087
100.0550.061
Disclaimer/Publisher’s Note: The statements, opinions and data contained in all publications are solely those of the individual author(s) and contributor(s) and not of MDPI and/or the editor(s). MDPI and/or the editor(s) disclaim responsibility for any injury to people or property resulting from any ideas, methods, instructions or products referred to in the content.

