Article

Evaluation of a Desalination System Combining Photovoltaic and Membrane Technology: A Case Study on the Benefit Analysis of an Apple Orchard

Ocean College, Zhejiang University, Hangzhou 310058, China
*
Author to whom correspondence should be addressed.
Water 2024, 16(16), 2306; https://doi.org/10.3390/w16162306
Submission received: 2 July 2024 / Revised: 8 August 2024 / Accepted: 13 August 2024 / Published: 16 August 2024
(This article belongs to the Section Wastewater Treatment and Reuse)

Abstract

:
Water shortage is one of the main issues affecting agricultural development in many regions, and the problem of crop yield reduction caused by the salinisation of irrigation water has become increasingly prominent. Xinjiang is a major agricultural development province in China, with mostly remote agricultural land and an unstable electricity supply. We have introduced a combination of photovoltaic and reverse osmosis technology in the local Aksu region, using wastewater for irrigation to improve returns. In order to verify the feasibility of two schemes, we evaluated the benefits of the apple orchard after irrigation with desalinated water. The result shows that the net present value of the orchard has become 2.4 times that of the initial. It not only used secondary wastewater resources in the drainage canal, but also changed the trend of apple orchard profits declining year by year. The influence of various factors on the income of the orchard has obviously reduced, and the possibility of investment profit is greatly improved.

1. Introduction

Freshwater resources are an important component of sustainable global development. The increase in population and continuous development of industry and agriculture have created higher requirements for the quantity and quality of fresh water. Globally, more than 70% of freshwater resources are used for agricultural development [1], and the shortage of fresh water has become a serious problem affecting and restricting the socio-economic development of many countries, especially in Northwest China, Central Middle East, and other regions. Globally, brackish water is mainly distributed in Saudi Arabia, Egypt, Turkey, the Mediterranean coast, and the western United States.
The global average salt content of surface water is 6.3 g/L, and the average salt content of groundwater is 3.5 g/L. The worldwide distribution of brackish water is shown in Table 1. The amount of fresh water directly available worldwide accounts for only 0.8% of the total. To increase the total amount of freshwater resources, nearly 150 countries have used renewable desalination technology to produce fresh water, and nearly 300 million people worldwide have access to desalinated fresh water. It is widely used in Saudi Arabia, Italy, India, Japan, China, and other countries, and has played a positive role in guaranteeing local production and life [2]. According to the statistics, 400 million people used desalinated water in 2015, and it is estimated that by 2025, 14% of the global population will be forced to use or drink desalinated water [3]. Figure 1 shows that by 2030, the global water demand will reach 6.9 trillion m3, and the gap between the demand and supply of fresh water will be 2.400 billion m3, but the demand can be met by various desalination processes.
Water scarcity has severely affected the agricultural sector in most countries of the Middle East and North Africa and in many other parts of the world. Desalination technology in Israel has increased the usage of brackish water, and large desalination plants along the Mediterranean coast have ensured that a large amount of desalinated water can be supplied for agricultural irrigation. In Spain, the United Arab Emirates, and other countries, brackish water desalination technology has also been actively used for agricultural irrigation [13]. Although reverse osmosis technology has quickly taken a share of the desalination market, thermal desalination technology still occupies a dominant position in the Middle East. In Europe, the brackish water desalination capacity is mainly concentrated in Spain and Italy, where brackish water desalination is used to develop tourism and agricultural water [14]. Although the development of membrane and thermal desalination technologies has made great progress, the wide application of brackish water desalination technologies is still limited, owing to energy consumption limitations. Turkey and other countries use wind power generation combined with reverse osmosis desalination systems to produce drinking water [15]. In the desert areas of Egypt, sunshine is plentiful and solar energy is abundant. Therefore, miniaturised PV-RO systems that combine photovoltaic energy with brackish water desalination have been widely used [16]. Australia and Japan have used PV power generation to solve the power supply problem of brackish water desalination systems in remote areas [17,18]. In these areas, solar reverse osmosis desalination is a promising technology. Because it has the characteristics of being suitable for remote and arid areas, this technology has a great potential for solving the problem of brackish water in remote areas and has attracted widespread attention [19]. The concentration of the coating on solar desalination absorbers, which varies seasonally, can yield significant economic benefits [20]. Water pollution was severe during the COVID-19 pandemic, making the assessment of desalination systems’ technical reliability a critical area of research [21].
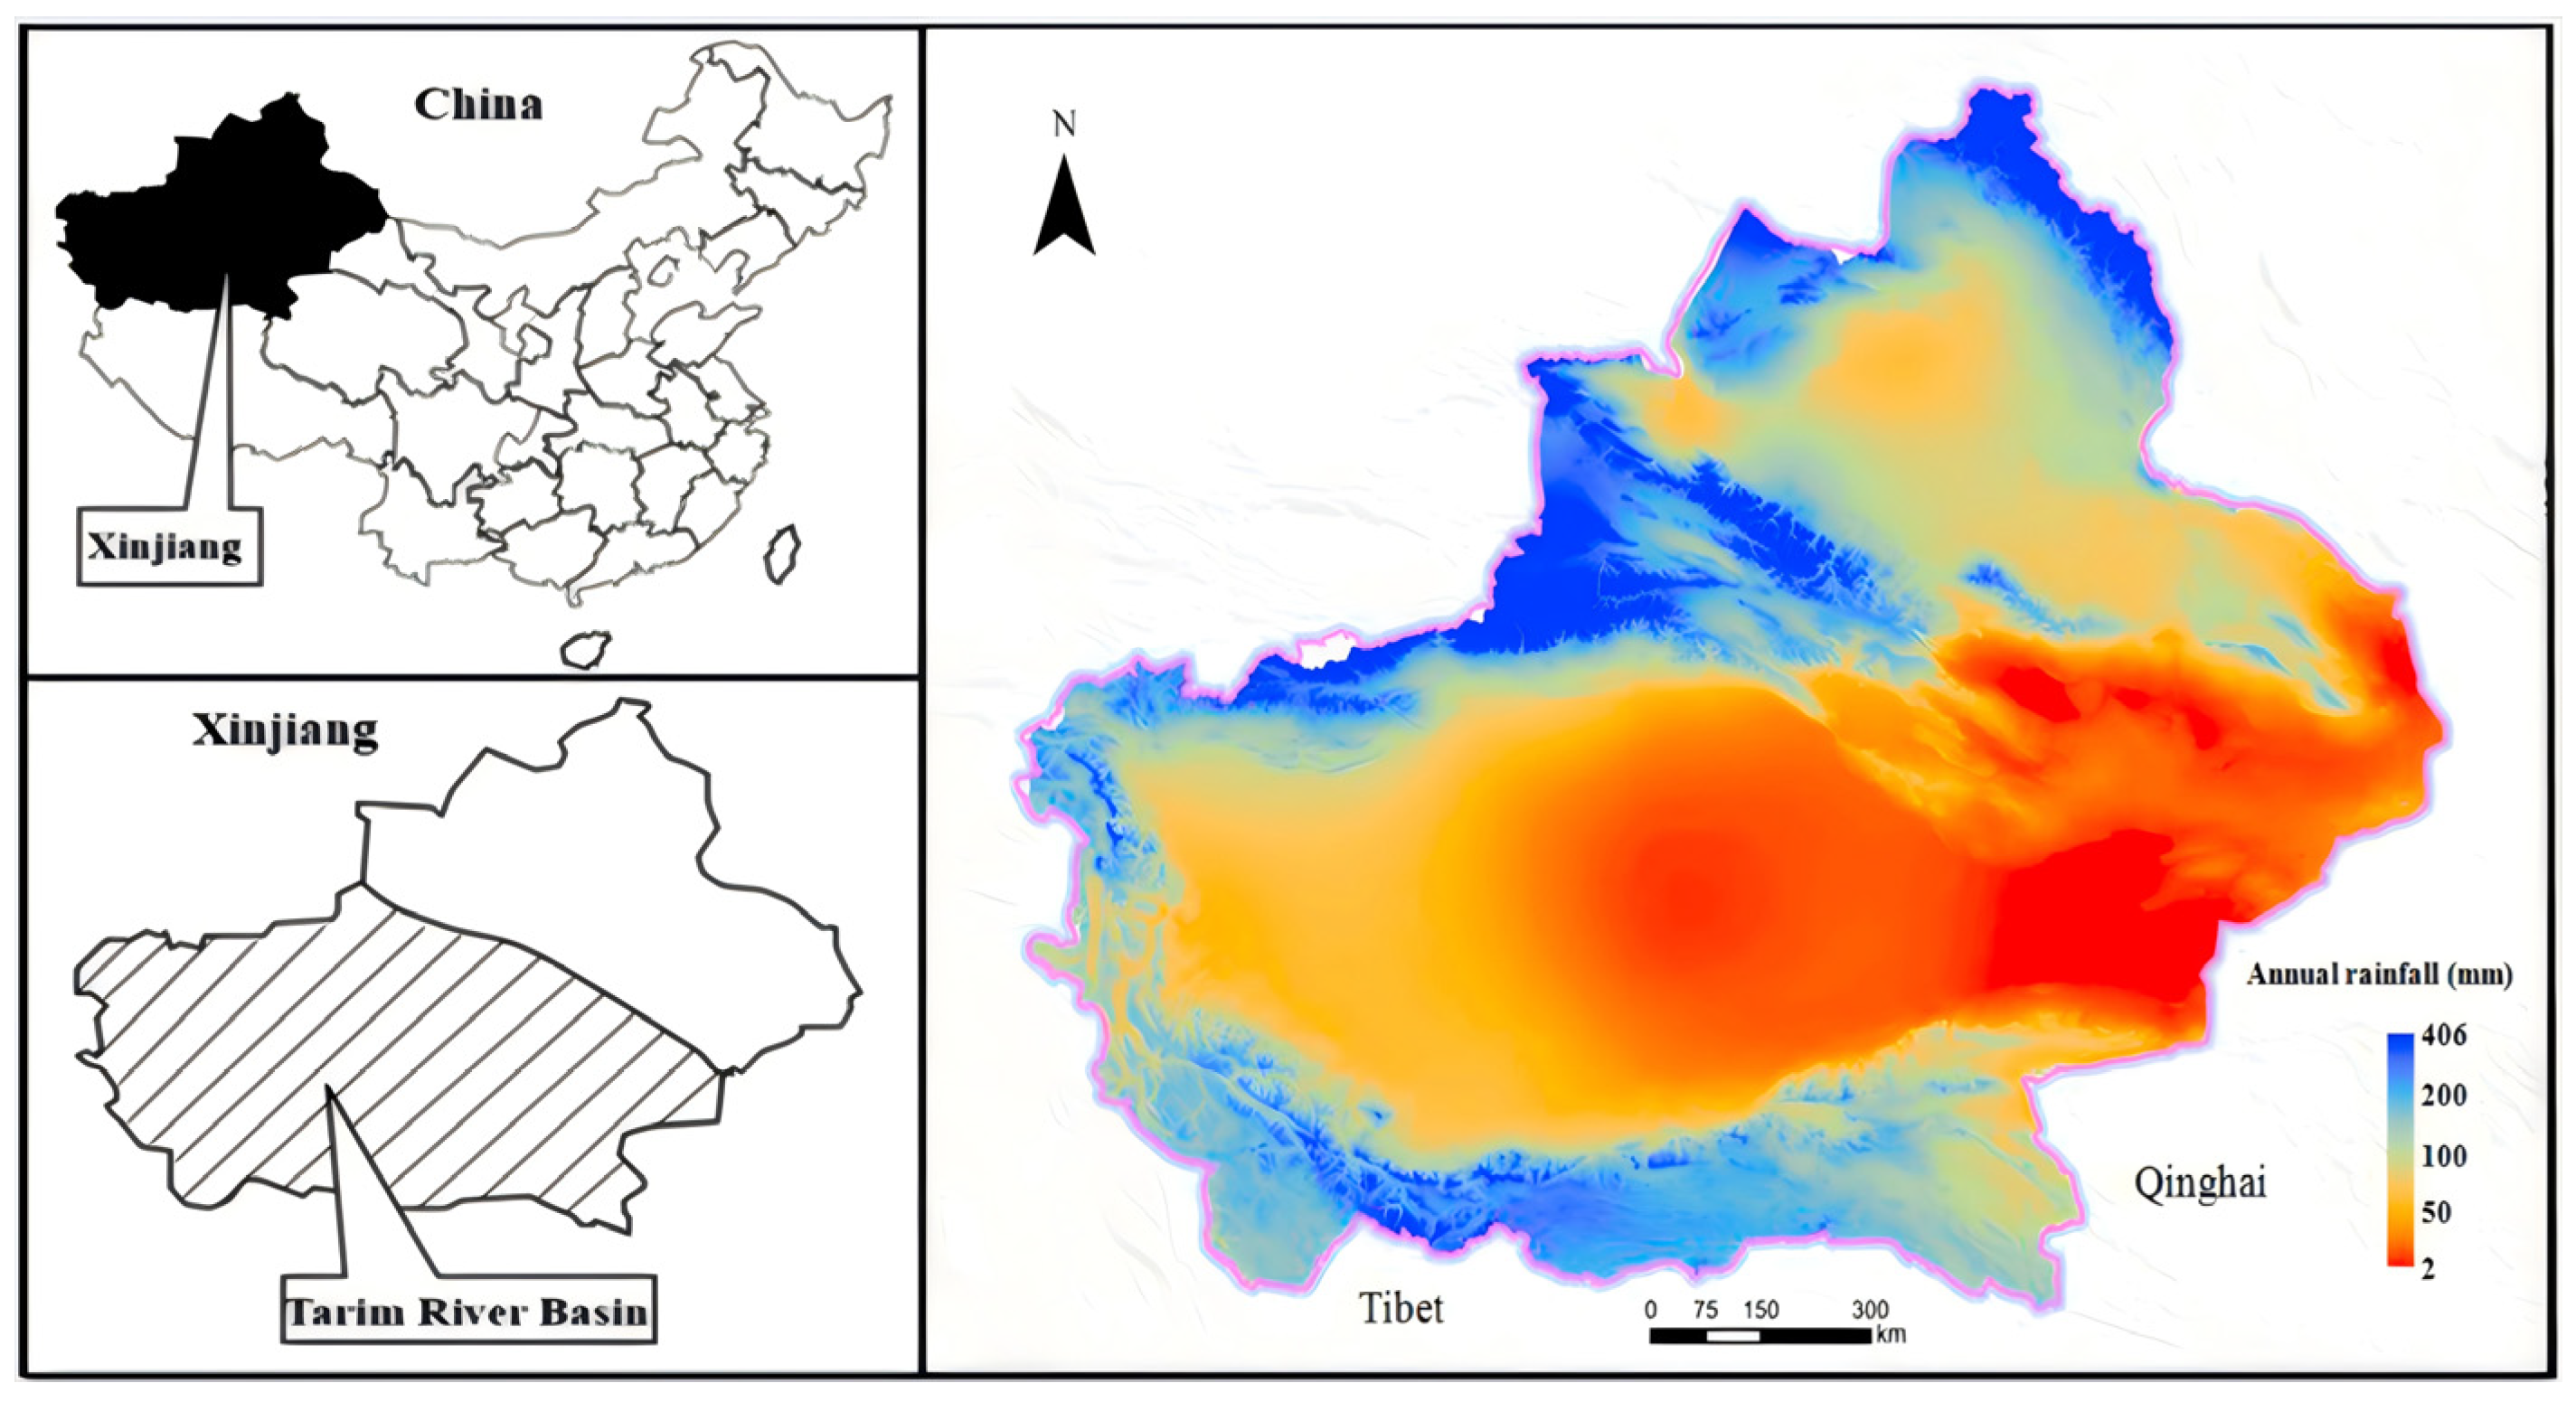
Southern Xinjiang is an area with a high saline water content that is located at the southern foot of China’s Tianshan Mountains, accounting for approximately 10% of the country’s area. It has a dry climate, with an annual evaporation of 1877.5–2337.4 mm, annual precipitation of less than 100 mm, and some areas below 50 mm, making it an extremely arid zone. Since the 1950s, a large-scale wasteland reclamation campaign has been conducted in the Tarim Basin, with a total of 51 million ha of saline–alkali waste being reclaimed. In the local traditional method of surface flood irrigation [22,23,24,25,26,27,28], a large amount of water infiltration removes the salt in the upper part of the soil, so that the soil salt content in the flood irrigation area is significantly reduced; however, this does not fundamentally solve the problem of soil salinisation. Instead, there is a trend of “partial improvement and overall deterioration”. Because of the generally high soil salinity in the Tarim Basin, the 0–30 cm soil layer has a salt content of 50–300 mg/kg, and the surface soil can reach a salt content of up to 600–800 mg/kg. Forty-seven percent of the area was abandoned because of secondary salinisation. The actual reserved area is only 28 million ha [29,30]. According to a survey by the agricultural department [31], soil salinisation reduces Xinjiang’s grain output by approximately 720 million kg each year, accounting for approximately 8.6% of the total annual grain output, causing economic losses of approximately USD 55 million. In 2019, Xinjiang’s total social water consumption reached 55.443 billion m3, of which agricultural water consumption was 51.175 billion m3, accounting for 92.3% of the total water consumption. In 2019, Xinjiang’s total social water consumption reached 55.443 billion m3, of which agricultural water consumption was 51.175 billion m3, accounting for 92.3% of the total water consumption [32] (Figure 2). At present, the utilisation efficiency of agricultural water resources is low, and the problem of extensive amounts of wasted water is prominent. We should reduce the total amount and intensity of agricultural water use, alleviate the high agricultural water use and water shortage situation in Xinjiang, and simultaneously optimise the industrial water use structure, which will help improve the agricultural water use efficiency and promote the need for sustainable social and economic development. Although Xinjiang’s agricultural water sector has begun to turn to the recycling of saline drainage to relieve drought pressure and increase water supply conflicts, the lack of effective treatment technology for saline water has caused the saline–alkali water discharged from the irrigation area to be re-irrigated, resulting in more serious secondary issues. Pollution has a significant effect on crop yield and quality. The large amount of untreated saline–alkali water discharged from farmland not only wastes limited water resources but also poses a threat to agricultural production and the environment. The water in the drainage channel enters the Tarim River, increasing the mineralisation of the Tarim River and causing a series of ecological and environmental problems in the basin.
For the Xinjiang region, which has a large amount of brackish water [33,34], solar energy combined with saltwater desalination technology is a good choice to increase the total amount of local freshwater resources and meet the demand for agricultural water. Because desalinated water is more expensive than traditional freshwater resources, its use for agricultural purposes is limited to high-value crops such as dates and apples. In terms of technology and economics, the desalination process for agricultural purposes is different from that of seawater for drinking purposes. Because agricultural water requires lower water quality as well as lower energy consumption and operating costs, the cost of these desalination systems is much lower than the cost to produce drinking water [35]. In addition, because the calcium and magnesium content in the permeate stream is reduced, it must be remineralised by mixing it with surface or groundwater resources, which can further reduce the total cost.
This study was conducted in Aksu, southern Xinjiang. High-quality apples are representative of local agricultural development, and their annual water demand is 12,000–13,500 m3/ha. China has the highest apple production in the world. Taking 2020 as an example, the world’s apple production was 76.21 million tons; the output of each country is shown in Figure 3. Apple planting is at the core of Xinjiang’s agricultural development. In 2020, the apple output in Aksu was 2.09 tons/ha. As a comparison, the annual output of apples in Xinjiang in 2018 was 1,633,000 tons, dropping to 1,366,000 tons in 2020. The reason for the sharp decline in apple production is still uncertain; however, the salinisation of irrigation water is considered to be an important reason. Local people improved the irrigation method to a certain extent to alleviate the decline in output caused by the water salinisation, but the effect was not satisfactory. The salinisation of groundwater also affects the efficiency of the irrigation system.
The desalination device used in this study was situated between a drain with sufficient water and an orchard. The high-salinity brackish water in the drainage canal is discharged after irrigating various farmlands, and the local area rarely uses this water resource. Therefore, the use of wastewater resources for desalination to irrigate apple trees in orchards meets the demands for resource reuse and local sustainable development.
This study proposes a method to increase the yield of high-value crops in remote areas based on water reuse technology. As mentioned earlier, we aimed to demonstrate the importance of combining the advantages of sunshine in Xinjiang with desalination technology for the sustainable development of local agriculture. Therefore, the economic benefits of the system are the focus of our analysis. We provided relevant technical parameters and system operation diagrams and used part of the experimental data for a subsequent benefit analysis to verify the significance and feasibility of this method for improving local agricultural economic development.

2. Material

Common solar desalination technologies include multi-stage flash evaporation (MSF) [36], electro dialysis (ED) [37], solar distillation [38], membrane distillation (MD) [39], and reverse osmosis (RO) [40]. With the rapid technology development, the desalination production capacity is continuously increasing. In 1980, the global desalination capacity was 5 million m3 per day, and by 2018, it had grown to 63 million m3 per day [41]. RO, MSF, and MED technologies account for 54%, 31%, and 10% of the total global production capacity, respectively. In terms of the number of projects, RO, MSF, and MED account for 71%, 11%, and 14% of the total global desalination projects, respectively. Some combination technologies have been introduced in the desalination market, such as photovoltaic desalination (PV-RO) and wind energy desalination [19,42]. The best renewable energy source to drive reverse osmosis desalination devices is solar PV panels, especially in places that cannot be connected to the grid. The PV-RO system accounts for approximately 43% of the global renewable seawater desalination processes [43]. Because the location of the orchard has solar potential, the addition of solar panels is also considered a good choice. The primary reason for choosing apple orchards is that Aksu is the main producing area for this crop in China (Aksu is one of the areas with the highest quality apples in China); however, the quality and yield of apples have also been affected by local water shortages in recent years. Therefore, while meeting the irrigation requirements for apple agriculture, the aim is to increase the output and overall benefits of the orchard. On this basis, a small amount of drinking-grade fresh water can be produced, which can be used in the daily lives of local residents.
The main research route of this study is to design the system process first and then conduct an economic analysis on the benefits after operation, discuss the various factors that affect the benefits, and verify the feasibility of the system for improving economic efficiency. This study provides a reference for solving agricultural water shortages and improving orchard efficiency in southern Xinjiang.
We divided the desalination device into two levels: the Nano filtration and reverse osmosis devices. The structural diagram of the system is shown in Figure 4. The main equipment of the system includes photovoltaic panels, water storage tanks, sand filters, NF devices, reverse osmosis devices, light and heat desalination devices, salt baths, desalinated water collection tanks, and pumps. The original liquid was pumped under pressure by a submersible pump and then entered the storage tank after pre-treatment. The raw liquid is filtered through sand filtration to remove larger solid contaminants (such as sand, plants). During the debugging process, to prevent iron and manganese ion contamination, we have conducted a pre-treatment by fully contacting the wastewater with the ground and air, allowing oxygen to quickly dissolve in the water. The iron and manganese ions are oxidized to a high valence state and are not easily soluble in water. After filtration, they can be trapped by the filter material and adsorbed in the filter material, achieving the goal of removing iron and manganese through backwashing.
After pretreatment, brine (state 1) enters the NF device. Following the initial processing by the NF device, most divalent ions, such as calcium and sulfate ions, are removed from the brine (state 2). The desalinated water, containing a small amount of divalent and monovalent ions, is then processed by the reverse osmosis device to yield fresh water (state 3). Water containing calcium and magnesium plasma (state 4) was mixed with desalinated water and groundwater to produce agricultural water that meets the irrigation needs. After the reverse osmosis treatment, a small amount of high-concentration salty water (state 5) could be treated using a solar energy distillation device.
The apple orchard used in this study was located in the Alar region south of Aksu and covered an area of 14.5 ha. The current annual output of the orchard is approximately 1.4 tons/ha, that is, the annual output is 20.3 tons. Currently, in this apple orchard, a pump is used to pump 24 m3/h of water (14,500 m3/ha per year) that has a salinity of 4300 ppm from a nearby canal for irrigation. The salinity of the drainage channel we used for desalination irrigation was approximately 6500 ppm (see Appendix A), and the salinity of the irrigation water after desalination should be kept below 2500 ppm (this is suitable for apples). Then, the effective irrigation of the orchard is 9300 m3/year/ha on average. This gap in water volume demonstrates the need of this study for the efficient use of water resources. The average irrigation demand can be reduced to a more efficient level by using desalination systems and improving the irrigation water quality.
In this study, we designed a system to produce irrigation water with a standard salinity. By improving the irrigation water quality, the annual output of the orchard could reach 2.27 tons/ha, an increase of 62% compared to the current output. This highlights the impact of improving the irrigation water quality on the orchard output. The relevant economic benefits are described in detail later in this study.
To analyse the advantages and disadvantages of the equipment in terms of economics and energy consumption, we considered the current situation, the grid directly powering the RO device, and the PV-RO combination. Although solar energy can provide a clean power supply for the system as a renewable energy source, it is subject to changes in the day and night and sunshine intensity, which will lead to the instability of the desalination system and the continuity of the water supply. In addition, the investment cost of the PV equipment is high. To reasonably choose the most economical equipment program, this comparison is necessary. Additionally, in the economic analysis of the existing PV-RO system, it is proposed that the excess power generated by the PV system can be sold back to the grid to reduce the overall operating cost of the system. This method is known to improve economic benefits.

3. Technology and Analytical Methods

3.1. Desalination Device

According to Cao [44], the impact of irrigation water on local apple production can be described as
Y = 0.0018 x 2 + 19.601 x 24,333
where x is the fixed irrigation water quantity (m3/ha), and Y is the apple output (kg/ha). For an RO device, we first needed to ensure operational stability. Because the process routes adopted in this project were NF and RO, the water produced by NF entered the reverse osmosis system for further concentration. The NF membrane retained the main pollutants in the influent water. Therefore, membrane fouling mainly occurred during the NF concentration. To avoid membrane blockage caused by severe scaling during desalination, we tested the water in the drain. From the calcium, sulphate, iron, manganese, carbonate, silicon, and fluoride ion concentrations, we determined the maximum allowable concentration multiple according to the corresponding solubility product constant, and we finally determined the NF system recovery rate. During the debugging process, to prevent iron and manganese ion contamination, we have conducted a pre-treatment by fully contacting the wastewater with the ground and air, allowing oxygen to quickly dissolve in the water. The iron and manganese ions are oxidised to a high valence state and are not easily soluble in water. After filtration, they can be trapped by the filter material and adsorbed in the filter material, achieving the goal of removing iron and manganese through backwashing. Membrane is chemically cleaned with hydrochloric acid 14 days. According to the conductivity, the scaling is mainly calcium sulfate, without the risk of calcium carbonate scaling. The method of controlling pH value is used to maintain the recovery rate of NF and RO devices in a stable state, and the membrane is replaced every 29 days by local operators. In the above scheme, the desalination process was considered to inject water from the drainage canal at a rate of 440 m3/day, with an initial salinity of 6500 ppm. We produced 370 m3 of irrigation water per day with a salinity of 2500 ppm. From the water quality parameters, such as the amount of irrigation water and pH value required by the orchard, we selected FilmTec™ DOW™ NF245-390-FF and FilmTec™ Hypershell™ RO-8038 (Hangzhou, China) to meet the salinity range. After pretreatment, most of the large suspended solids and impurities were effectively removed. Figure 5 shows the process of saltwater desalination, and the relevant data are presented in Table 2. As listed in the table, approximately 23% of the concentrated irrigation water was mixed with the permeate water produced by the RO device to meet the salinity standard of agricultural water for irrigating apple trees. The total power of the desalination system was approximately 31 kW, which means that the specific power consumption was 2 kWh/m 3.

3.2. Photovoltaic Device

Considering that there may be unexpected power outages due to natural disasters such as sandstorms, we equipped the desalination system with photovoltaic inverters with an installed capacity of 80 kW. The parameters of the PV modules and inverters are presented in Table 3. The PV modules can generate approximately 122,700 kWh of electricity annually. Under the local encouragement policy for PV energy, a certain amount of incentive funds can be obtained every year. The photovoltaic device contained 128 modules and covered a total area of 210 m2.

3.3. Economic Evaluation

For the economic evaluation of this system, we conducted a more detailed analysis of the amount of capital and operating costs based on economic assumptions. The net present value ( N P V ) is an important indicator for evaluating the profitability of an investment [37]:
N P V o r = y = 1 n I n c o m e y ( 1 + i ) y T C
where i is the discount rate. The unit desalination cost ( U D C ) can also be calculated using Equation (3):
U D C = C A P C · C C R F + O P E C 365 · D P · f
where C C R F is the capital cost recovery factor, which is a function of the discount rate and lifecycle of the desalination device. D P represents the daily water production (m3/day), and f is the stability factor of the system operation. The C C R F calculation is given by Equation (4):
C C R F = ( 1 + i ) n · i ( 1 + i ) n 1
It was initially estimated that the provision of desalination to irrigate apple trees would produce higher yields and more income to the orchard. To analyse the impact of discount rates, subsidised power grids, and selling prices on the NPV of the orchard, we used a Monte Carlo analysis to evaluate the risk and profitability of the system investment.
For the existing PV-RO desalination device, the economic cost analysis mainly included capital cost ( C A P C ) and operating cost ( O P E C ). The C A P C included the equipment costs of the desalination systems, photovoltaic systems, venues, and other instruments. The O P E C mainly included electricity costs, membrane cleaning and replacement costs, desalination and photovoltaic system operation and maintenance costs, inverter replacement costs, and labour costs. The calculation method is as follows:
C A P C = C A P C P V + C A P C R O + C A P C o i
O P E C = O P E C e l e + O P E C c & r + O P E C P V o & m + O P E C R O o & m + O P E C i n r + O P E C l a
To facilitate the estimation of various economic indicators of the system, we made assumptions regarding some parameters, as shown in Table 4. To ensure the normal operation of the desalination system and prevent the risk of calcium carbonate scaling, we required the pH of the water to be kept below 6 during the operation; therefore, the corresponding chemical reagent costs were also included in the cleaning and replacement of the desalination system. The operation and maintenance cost of the PV system was considered to be 1% of its capital cost, and the operation and maintenance cost of the desalination system was considered to be 1.5% of its capital cost. The replacement cost of an inverter is related to its life cycle. Considering that the effective operating life of the PV system was 20 years, the inverter would need to be replaced twice. The labour cost was calculated as USD 4700/year according to the local flat income. Considering that the labour cost of adding a PV system would also increase, because the workload is difficult to evaluate, it was calculated according to the standard of adding one labour force. The electricity cost of the desalination system was calculated using Equation (7):
O P E C e l e = 365 · D p · f · S E C · E P
where D p is the daily water production of the desalination system (m3/day); f is the operating stability factor, considering the need to shut down and replace membrane elements, f = 0.98; E P represents the electricity price; and S E C represents the specific power consumption of the desalination plant (kWh/m3). Owing to the different lifecycles of each piece of equipment, except for the frequent replacement of membranes, the inverter lifecycle was used as the minimum standard for system equipment analysis. The selling price of apples was based on the local wholesale price.

4. Results and Discussion

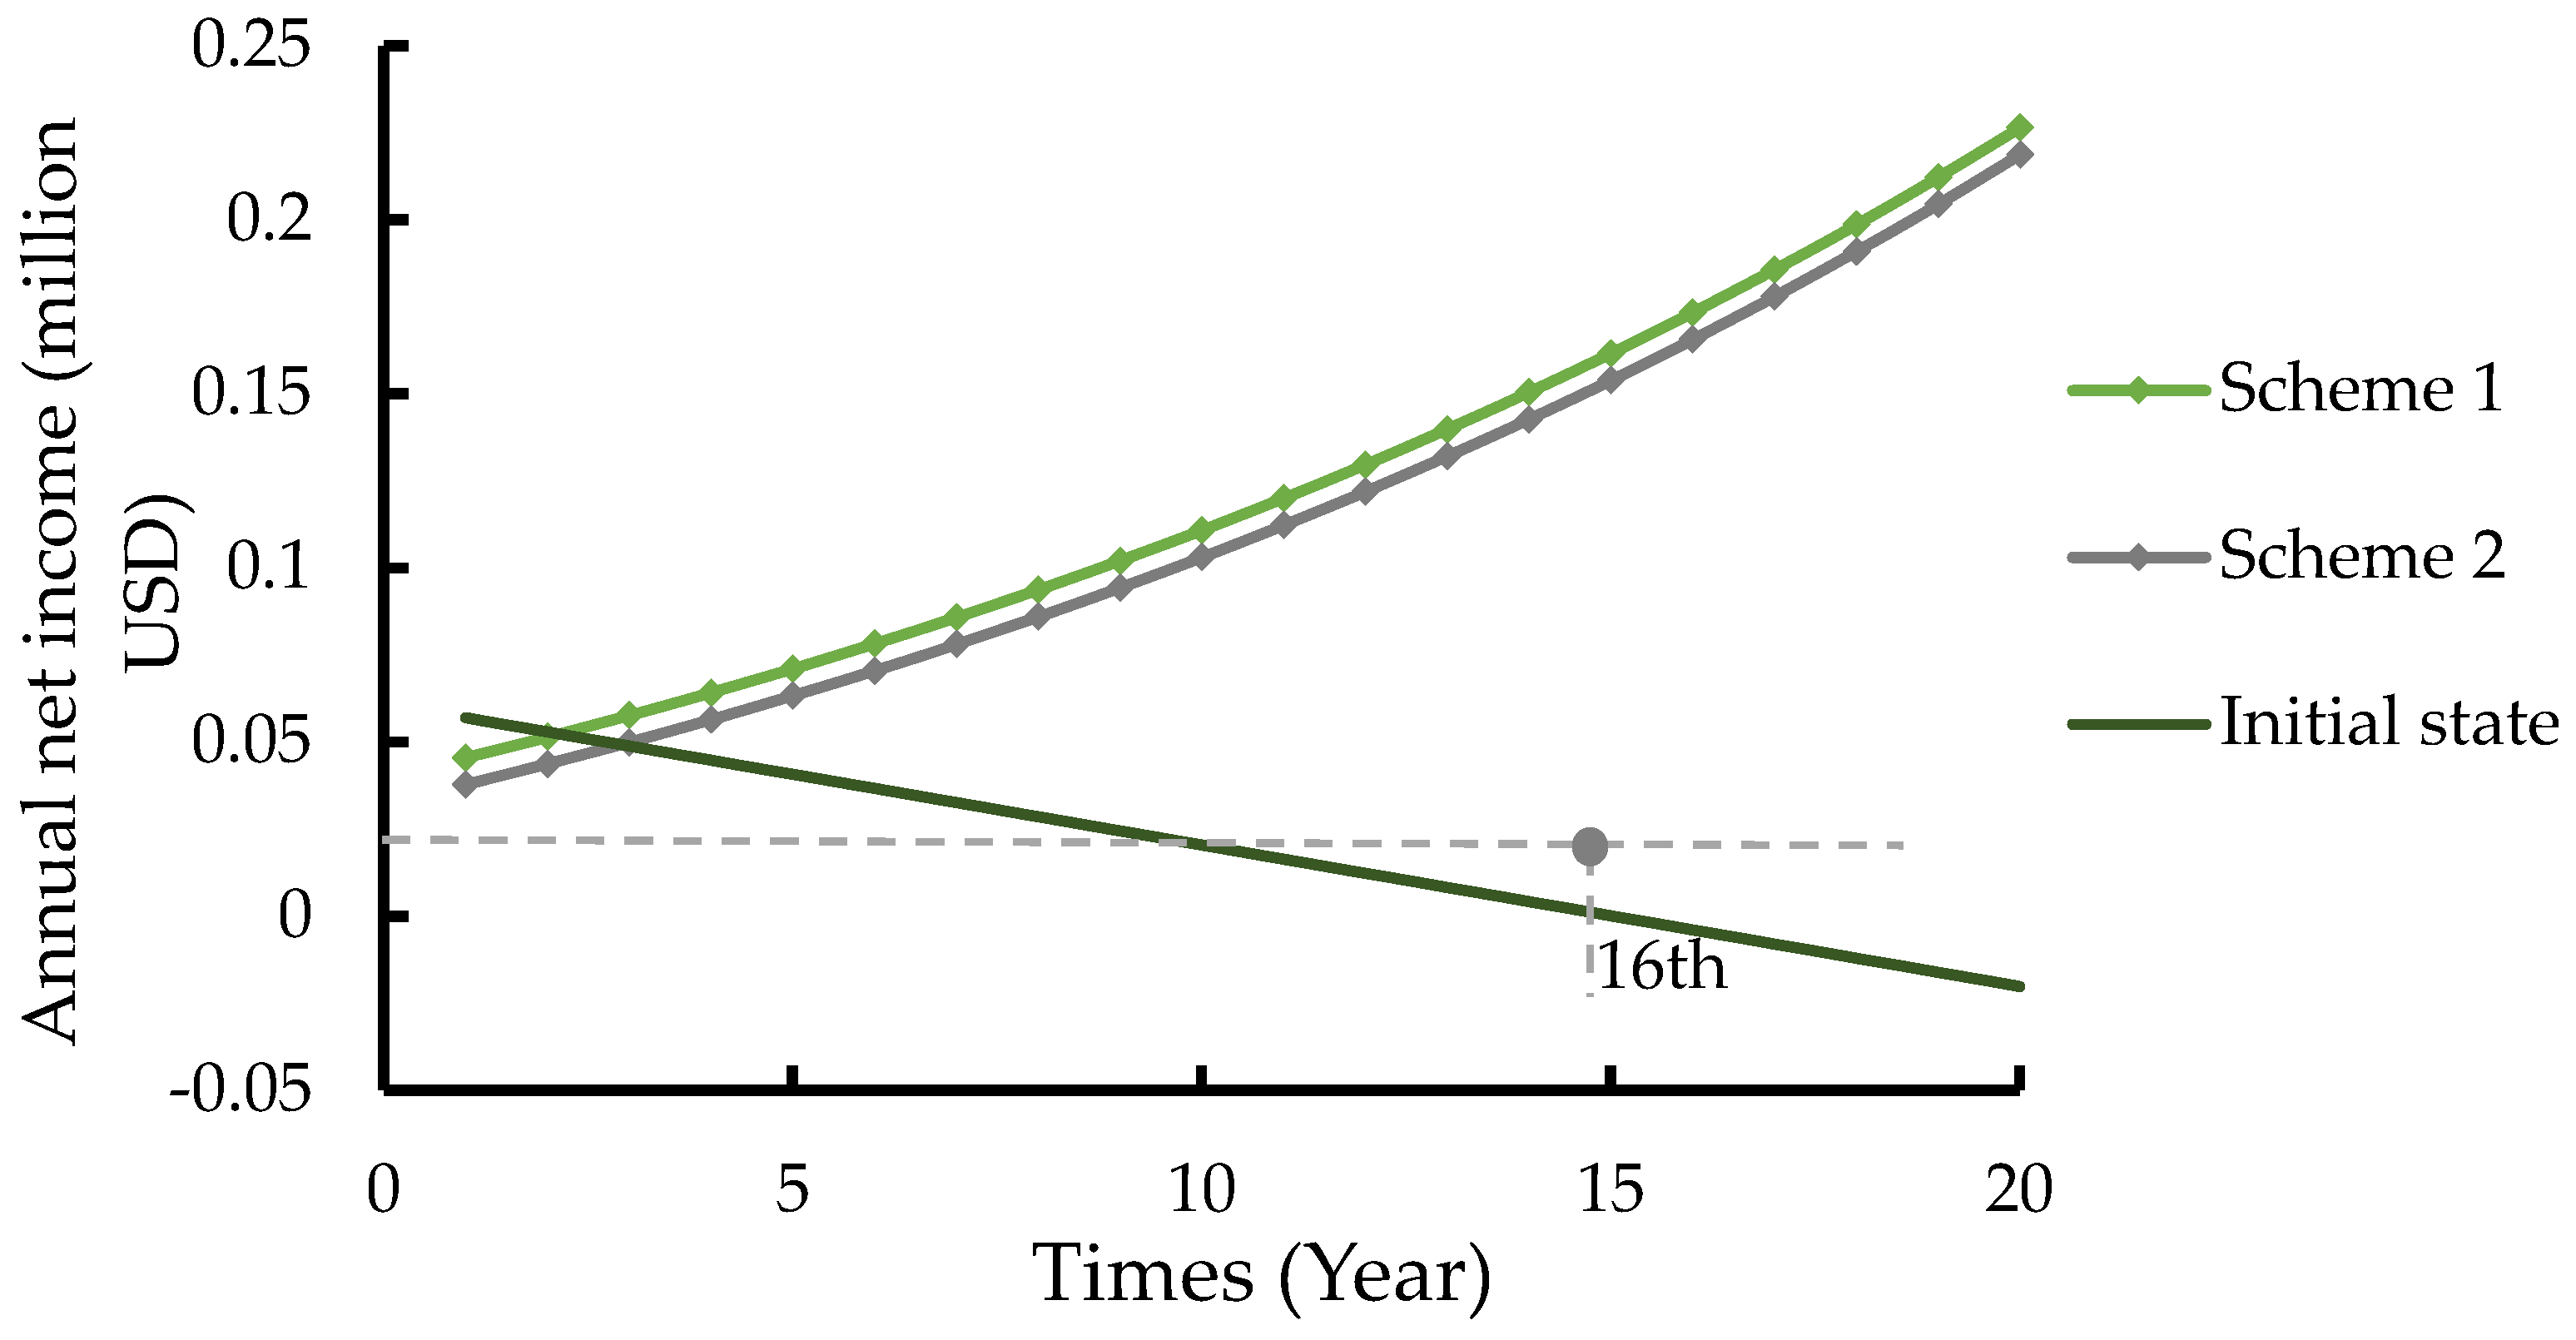
Under the assumptions listed in Table 4, the capital and operating costs of the two schemes are listed in Table 5. Comparing the two options, the capital cost of the RO device accounts for approximately 79% of the total investment. By adding a PV device, the capital cost of the system increased by 24% and the operating cost increased by 15%. Considering that the operation of photovoltaic equipment does not require additional power, we believe that the power costs of the two solutions are the same and are only related to the power consumption of the desalination equipment. In addition, we included the cost of the pretreatment, pump, booster pump, and other components required by the system in the cost of the RO device. The ratios of capital and operating costs are shown in Figure 6. Calculated by Equation (3), the unit desalination costs of schemes 1 and 2 were USD 0.6/m3 and USD 0.75/m3, respectively. Through PV power generation, an additional subsidy of USD 7362 can be obtained every year. As the output of orchards in this area has continued to decline in recent years, the annual output reduction ratio has been 0.08 t/ha. When considering the net income of the system, we compared the two schemes with the current income effect, as shown in Figure 7. According to the current production trend of the orchard, due to the continuous salinisation of irrigation water, its annual net income has been declining. Starting from the 16th year, the profit obtained through apple sales was lower than its current operating costs; that is, the net income was negative. However, by adding an RO device to provide agricultural water that satisfies the orchard irrigation standards, the output of the orchard increased annually. In the first two years, because of the high initial investment cost of equipment, the annual net income was lower than the initial state; however, after the third year, as the output increased, the income from apple sales gradually increased. At the same time, in scheme 2, owing to the grid subsidies for PV installations, the net income of the system in the first year increased by 6.2% compared to scheme 1. Subsequently, owing to the increase in production, the income from apple sales increased, and the proportion of electricity subsidies in the net income decreased annually.
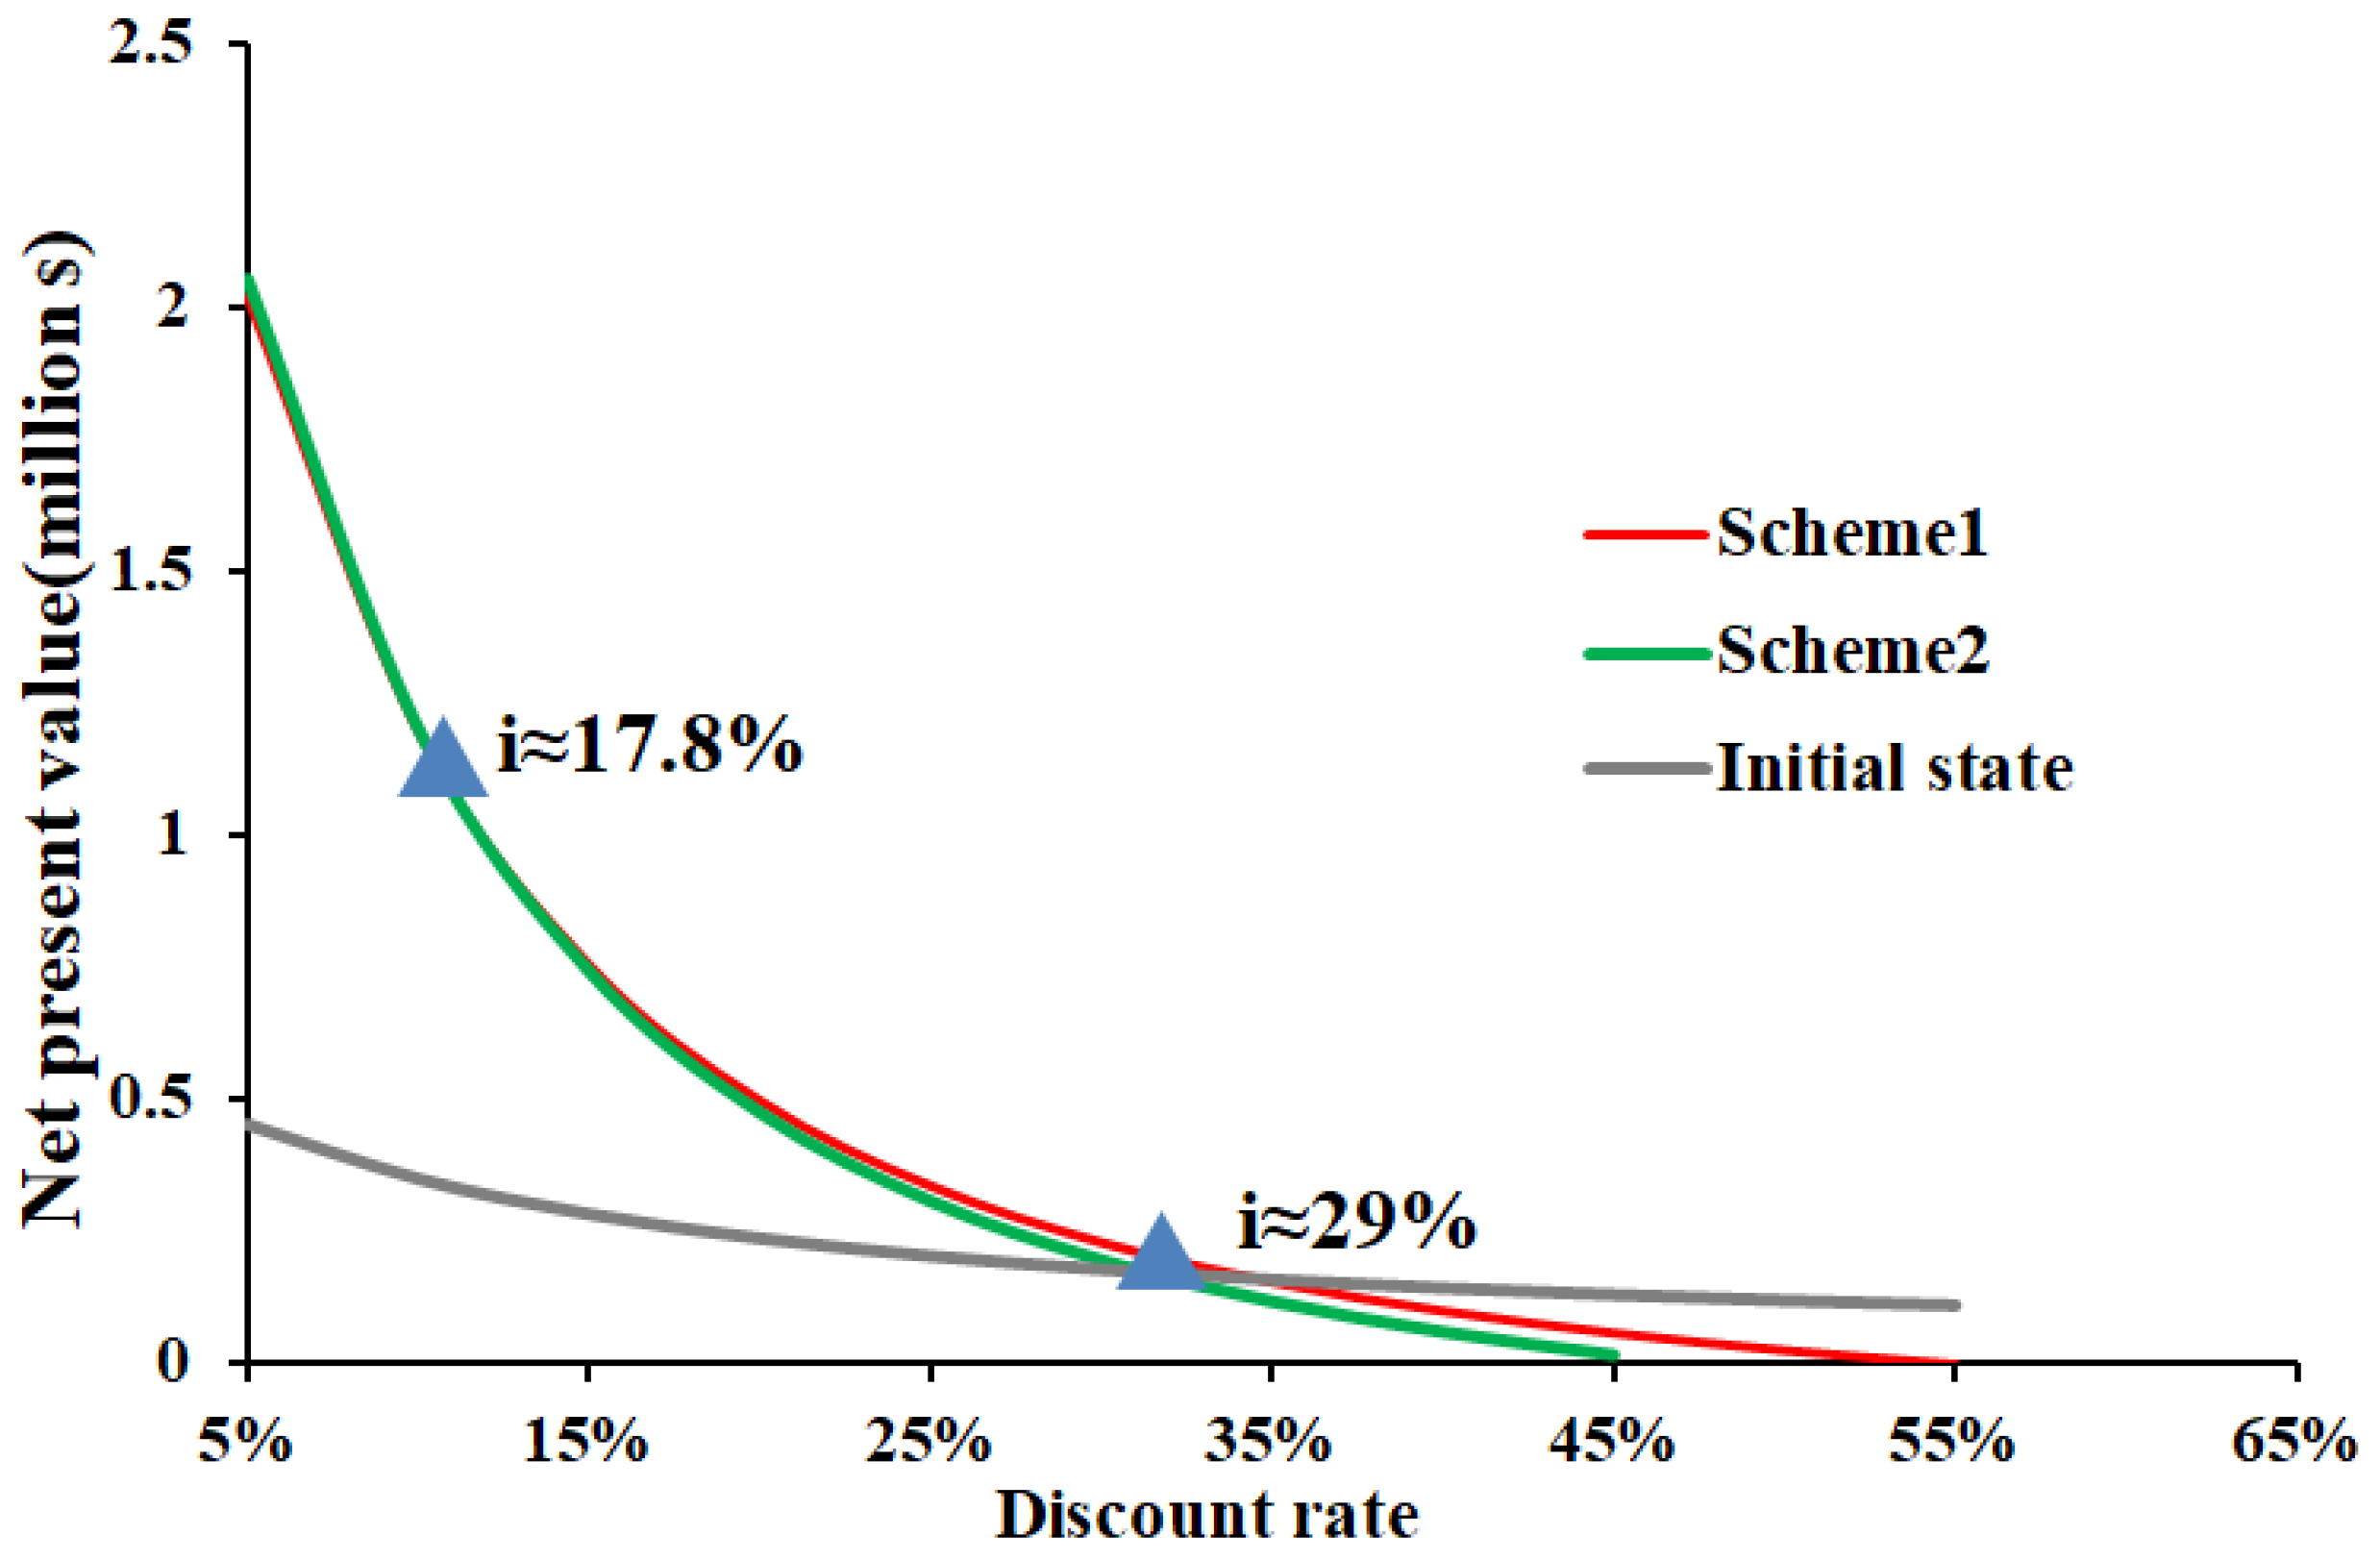
We also performed an NPV analysis of our schemes based on the assumptions listed in Table 3 and Table 4. Figure 8 shows the sensitivity of the NPV to the discount rate. When the discount rate is 5–17.8%, scheme 2 has a higher NPV and is a better choice. When the discount rate is 17.8–29%, scheme 1 has a higher NPV. When the discount rate is higher than 29%, because a high discount rate will accelerate the depreciation of the equipment cost, the NPV of the equipment will drop faster; thus, maintaining the status quo is the best choice. The minimum NPV is zero; that is, the maximum discount rate is 45.6%. Under the current conditions (i.e., the discount rate is 17%), the NPV of scheme 2 is slightly higher than that of scheme 1. We considered the additional capital cost brought by the increase in the PV system, and the increased cost recovery time of the system for scheme 1 was 2.7 years and scheme 2 was 3.3 years. Figure 8 indicates that when the system operates normally (without prolonged equipment degradation due to extreme weather like sandstorms), the difference in NPV between schemes 1 and 2 at equivalent discount rates is minor. PV devices raise the capital costs; although the resultant photovoltaic subsidies bring some extra income, they also heighten the project’s vulnerability to fluctuations in discount rates. Therefore, when the discount rate is below 17.8%, the PV system enhances the revenue growth beyond that of scheme 1; however, when the discount rate exceeds 17.8%, integrating PV systems merely escalates the costs of operation and maintenance, subsequently diminishing the overall revenue.
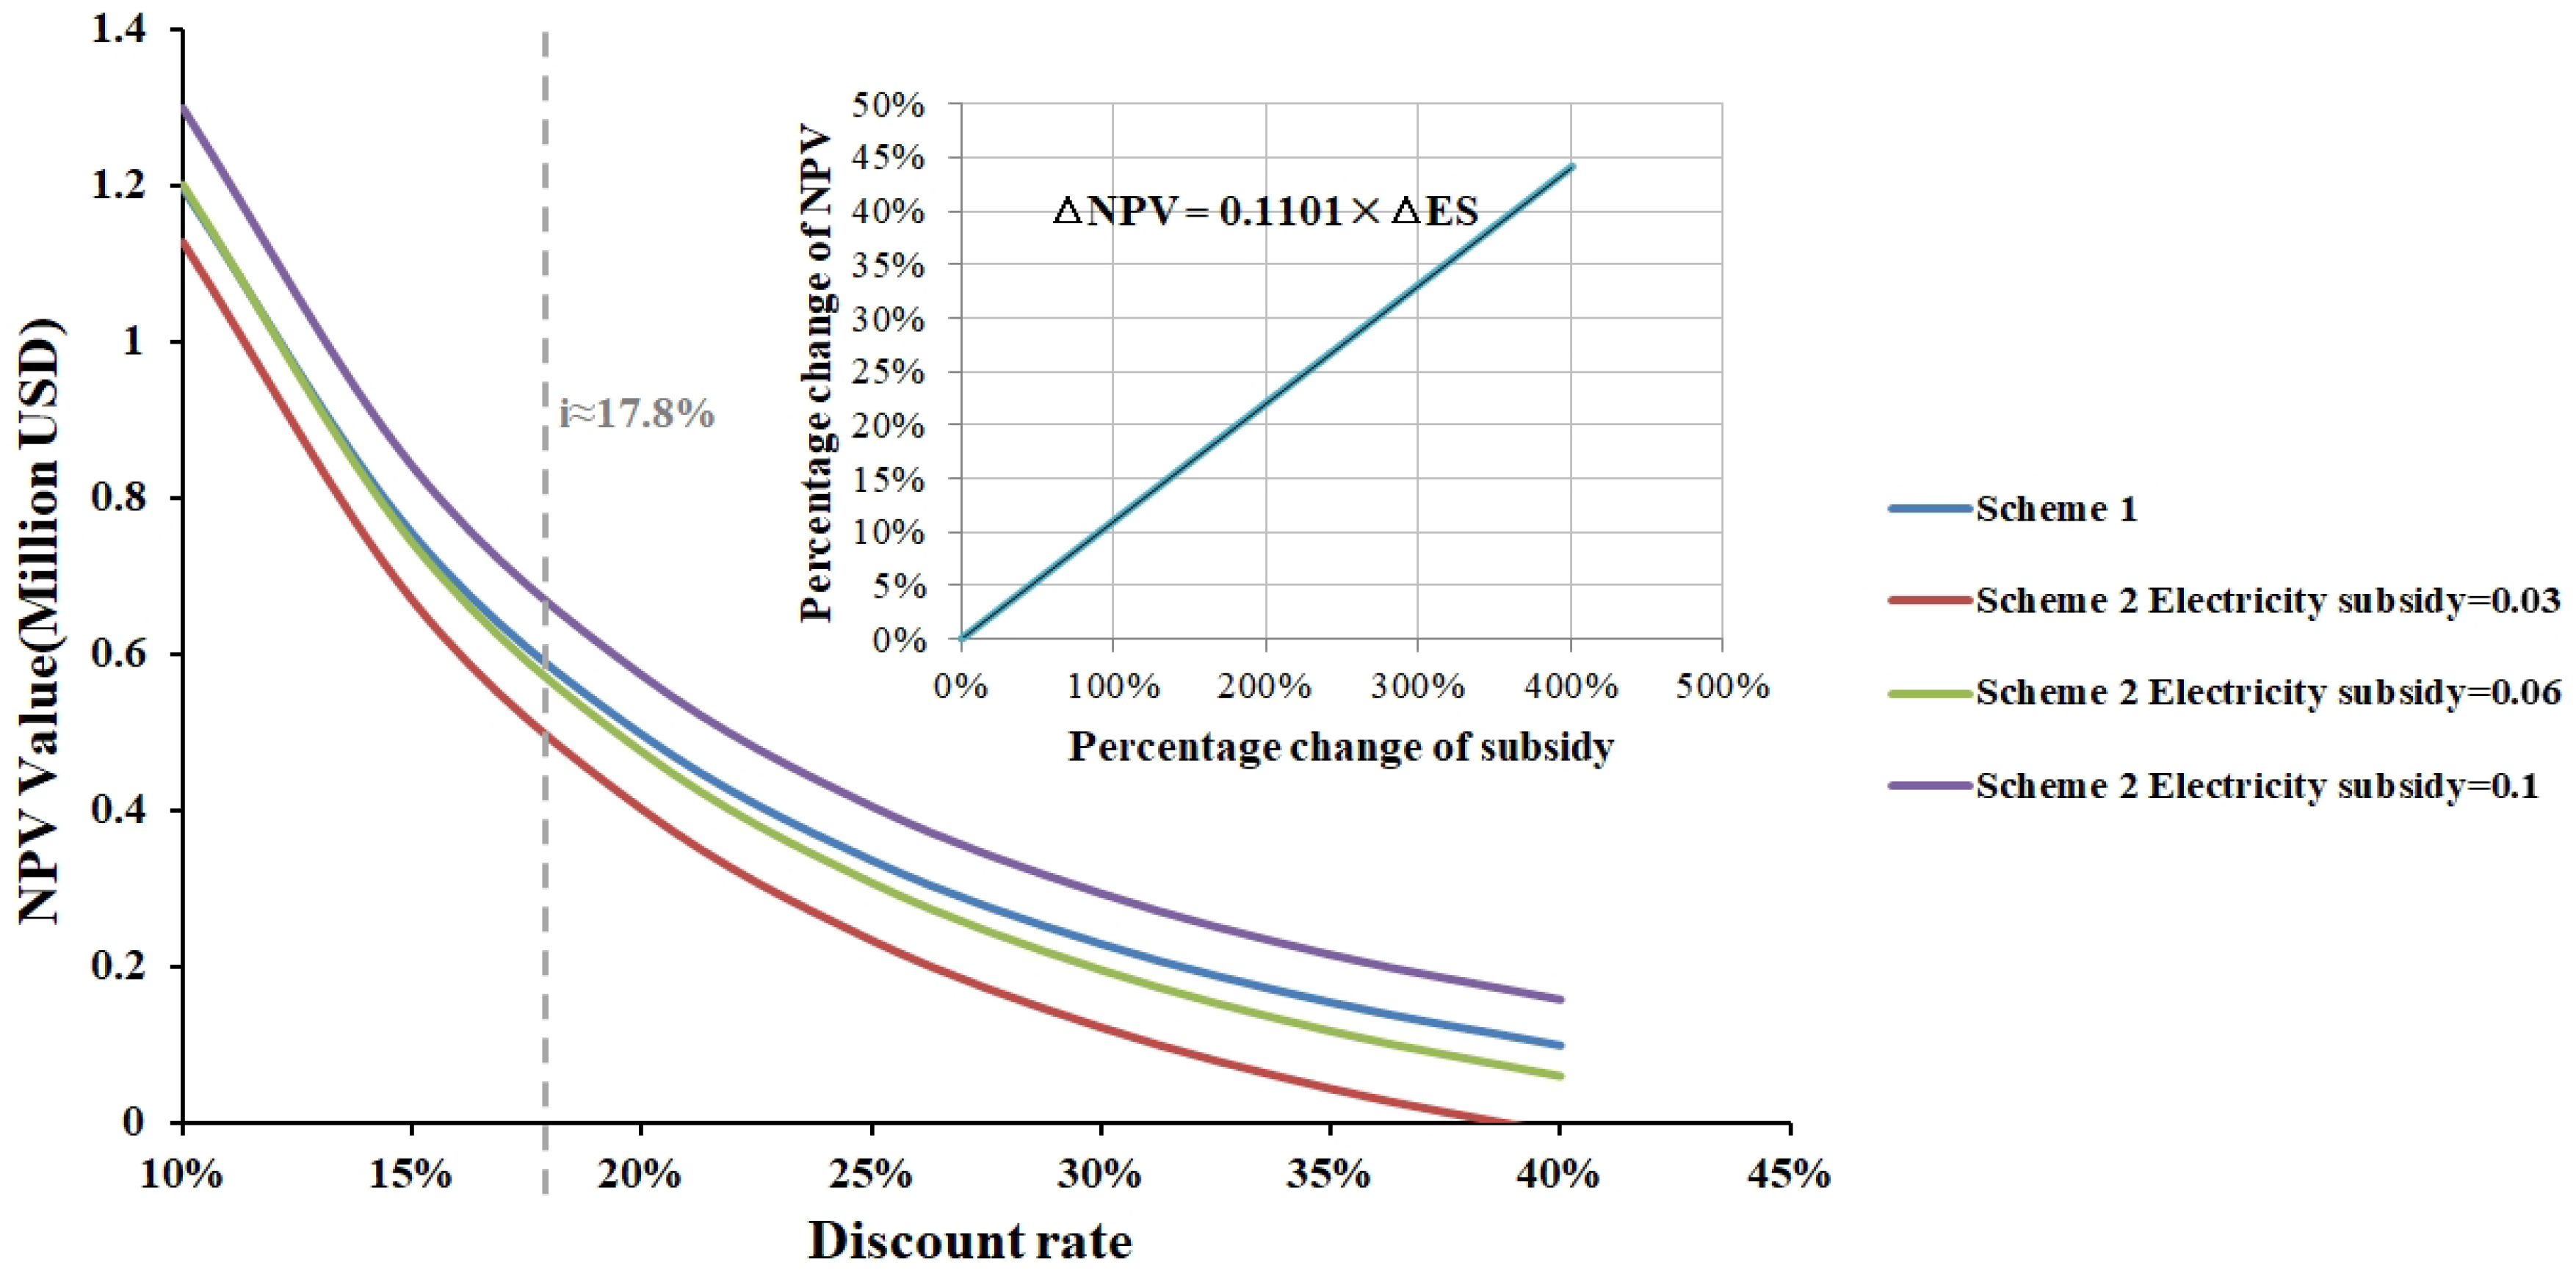
In Xinjiang, the government’s electricity subsidies for the PV power grids are not uniform. Considering that the economic value of the system is promoted in multiple regions, it is necessary to analyse the impact of different electricity subsidies on the system NPV. We selected the upper and lower limits of subsidies in Xinjiang. Figure 9 illustrates the NPV trends for different electricity subsidies. Taking the current discount rate of 17.8% as an example, for every 10% increase in the electricity subsidy, the NPV only increases by 1.1%. However, in addition to increasing electricity subsidies, the maximum capacity of the PV system can be increased according to the irrigation needs of the orchards in various places, making the use of the PV-RO system more economical than in scheme 1.
The profit of the orchard mainly comes from the sale of apples, which is the key to the project’s profitability. Figure 10 illustrates the effect of the sale price on the NPV of the scheme under consideration. As shown in Figure 10, under the current discount rate of 17%, the NPV of scheme 1 was always slightly higher than that of scheme 2. The price of apples is determined by the international market and is the main factor affecting the income of the orchard. From Figure 10, for a selling price of more than 1.79 $/kg, the NPVs of schemes 1 and 2 will be positive. For the initial state, the price of apples cannot be lower than 3.24 $/kg; otherwise, the orchard will suffer losses. This means that with the current selling price of 3.5 $/kg, a small unit price drop is more likely to cause the orchard’s revenue to approach zero, which reflects the economic instability in the current state. To reflect the improvement in the orchard’s income stability in schemes 1 and 2, Figure 10b describes the sensitivity change in the orchard’s NPV to the selling price of apples by adding PV and RO systems. That is, under the current selling price, the price of apples decreases when the orchard reaches the breakeven point. As shown in Figure 10b, for every 10% change in the current selling price, the initial NPV changes by approximately 130%. By contrast, for schemes 1 and 2, the NPV change is only approximately 20%. This means that through this system, the profitability of the orchard is much less affected by fluctuations in apple prices.
Figure 11 shows the sensitivity of the scheme 2 NPV to various parameters, including discount rate, electricity subsidies, and apple selling price. As shown in Figure 11, the profit and loss changes are selected to analyse the sensitivity of each factor under the condition of ±50%, and the electricity subsidy situation is only for scheme 2. The NPV is less sensitive to power subsidies (only 5%); however, this proportion increases slightly as the installed capacity increases. The discount rate has a significant impact on the NPV because its rate of change is nonlinear and exhibits asymmetric sensitivity. Finally, the price of apples is the core factor that affects the profit and loss of an orchard. By adding the system, the sensitivity of the NPV to apple selling price fluctuations was reduced from 650% to 101%, thereby reducing the risk of investment income caused by market price fluctuations.
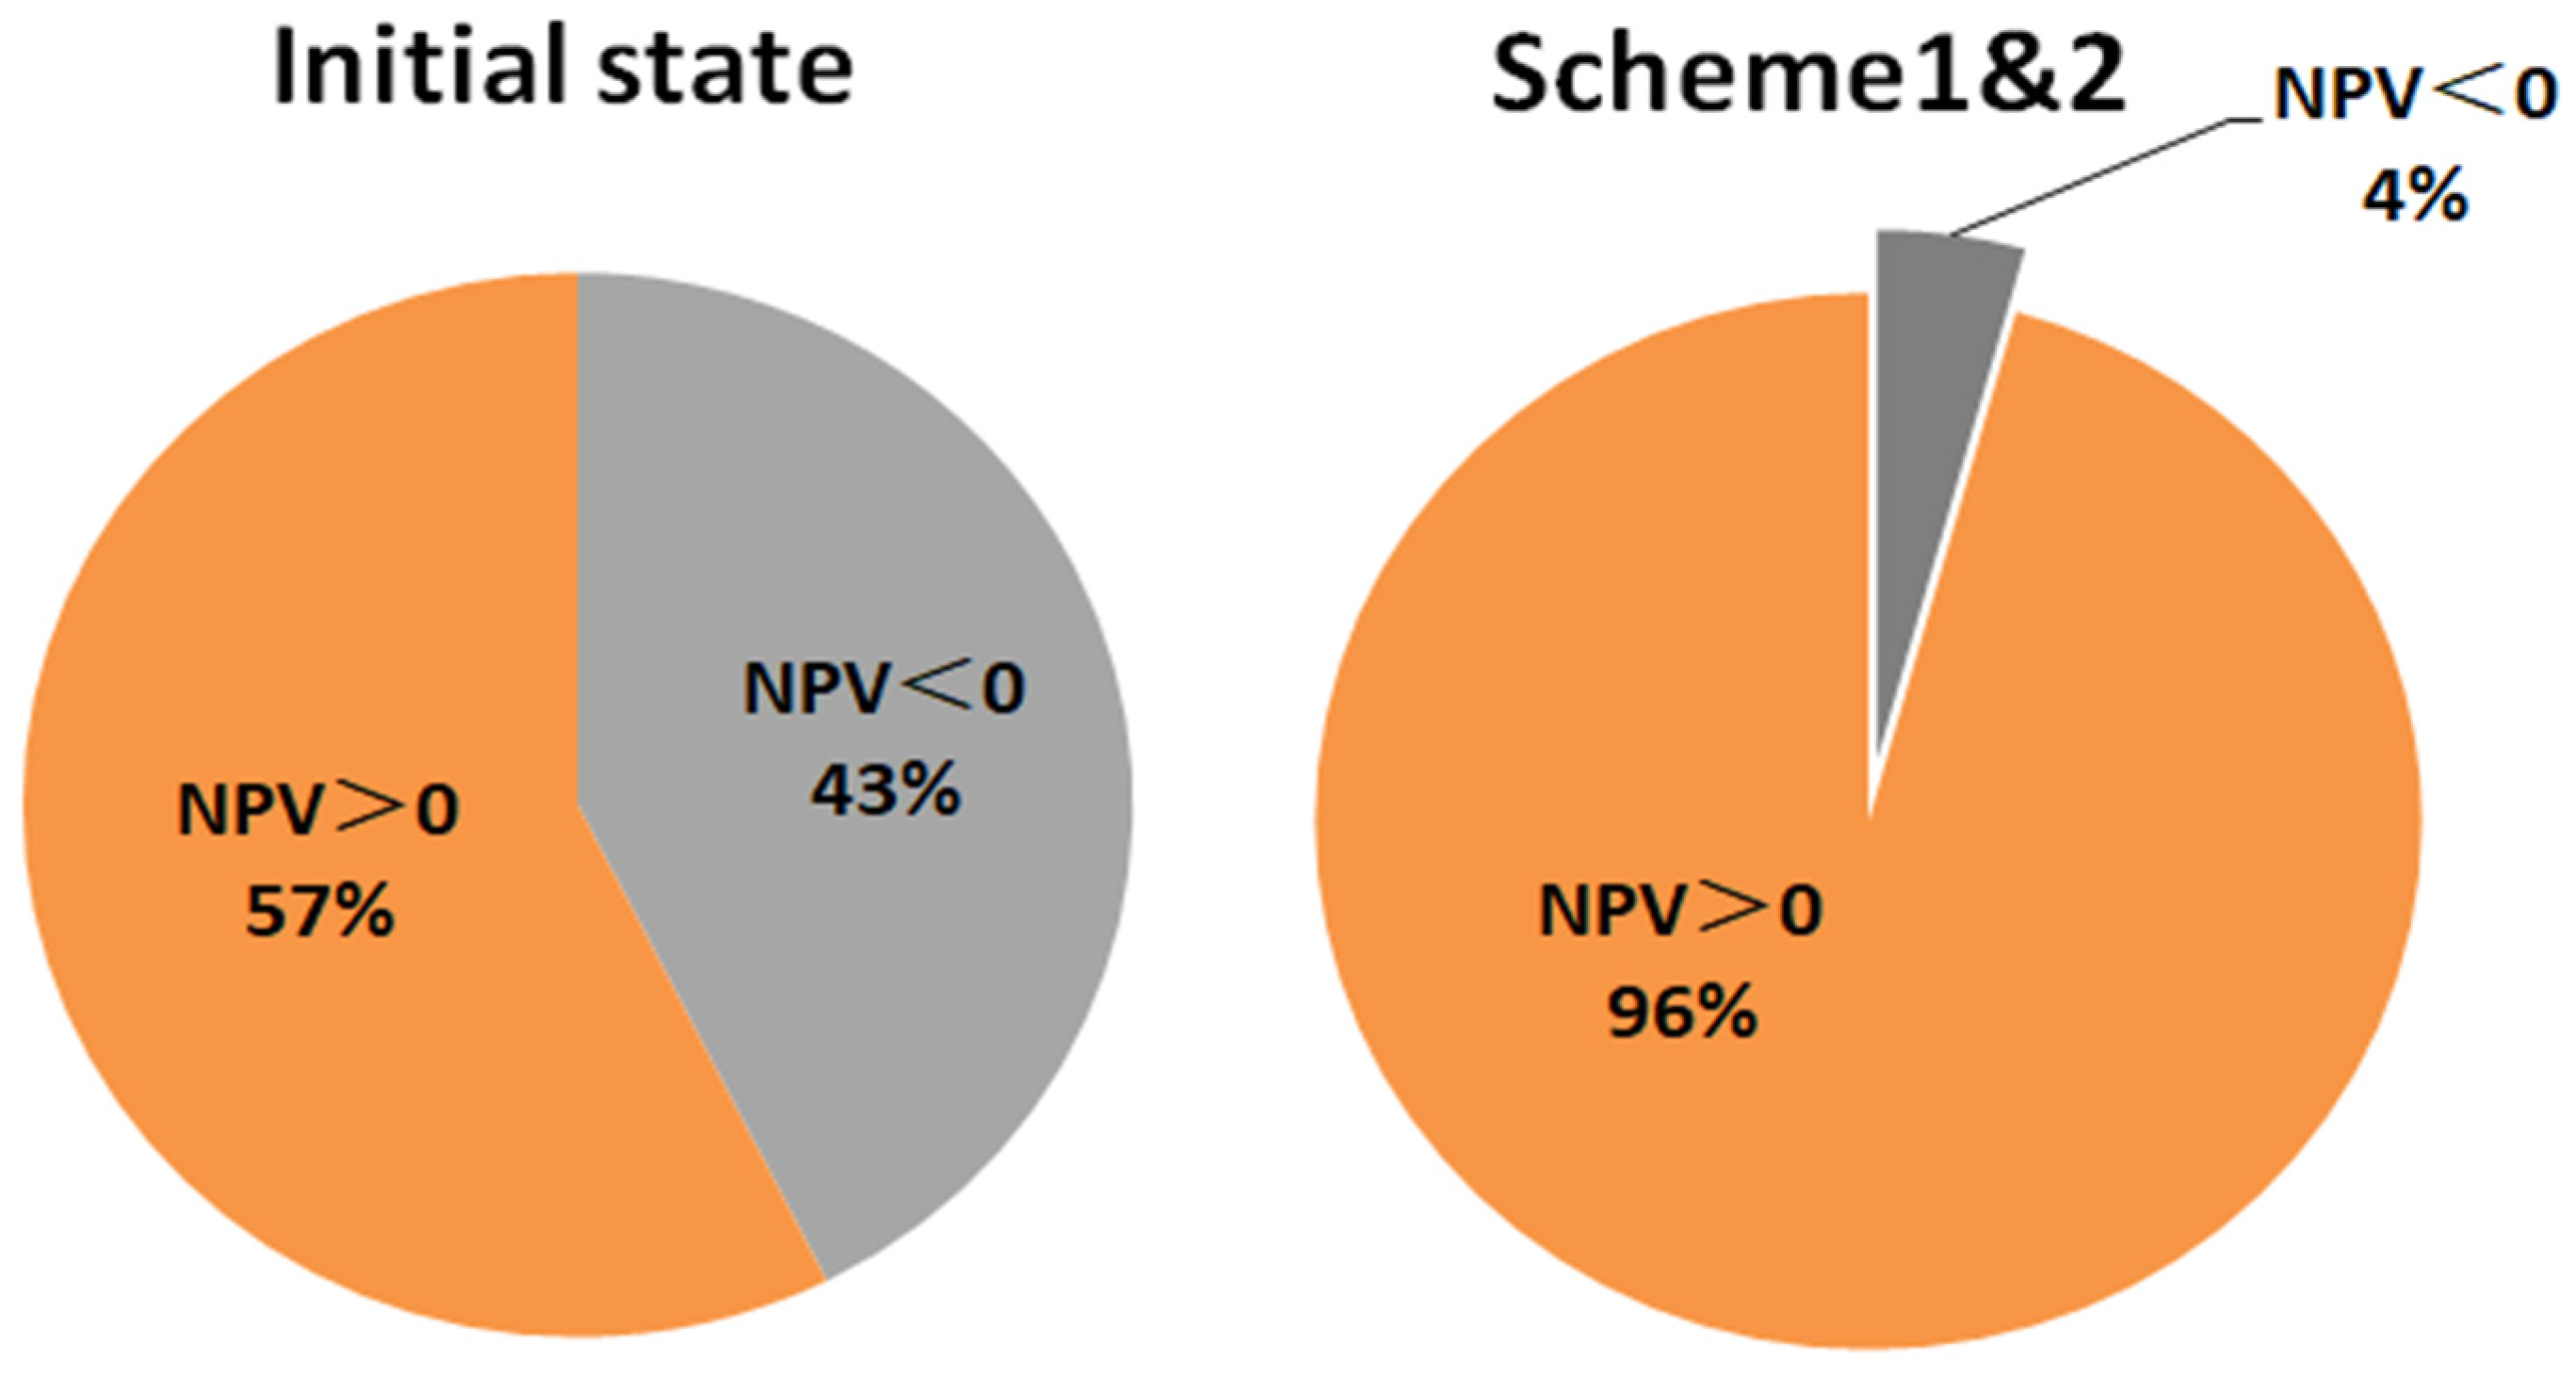
We conducted a Monte Carlo analysis of the NPV to assess the risks of using our PV + RO process for irrigation in apple orchards. Table 6 shows the assumptions for the Monte Carlo analysis. Considering the range of changes in various influencing factors, the discount rate was 5–30%, and the fluctuation range of electricity subsidies and apple selling price were both ±50%. Figure 12 shows that when a desalination device was used to irrigate the orchard, the profitability of the orchard was close to 96%. By contrast, the current state of profitability is only 57%. Comparing the two cases shows that the profitability of the apple orchard is greatly increased through the system, the investment risk caused by factors such as price fluctuations is reduced, and the feasibility of the system for increasing the income of the orchard is verified.

5. Conclusions

In Northwest China, there are many places with abundant solar energy resources but a shortage of freshwater resources. Cumulative agricultural water consumption throughout Xinjiang accounts for more than 90% of the annual total water. Due to local unreasonable land development and harsh climatic environments, large amounts of soil salinisation and land desertification have occurred, and groundwater resources have become increasingly scarce due to over-exploitation. Surplus land that can satisfy agricultural planting is also limited by the quality of irrigation water, which makes it difficult to improve the quality and yield of agricultural products such as apples. To meet the long-term and stable development of the local orchard industry, we re-used the wastewater in the drainage channel and improved the total amount and quality of agricultural irrigation water by introducing a combination of desalinated water equipment and photovoltaic systems. The main findings are as follows.
(1) China is the world’s largest apple exporter, and Aksu is one of the regions in China that exports high-quality apples. To reflect the economic value in this research, we selected an apple orchard in the southern part of the Aksu area for analysis. The apple orchard covered an area of 14.5 ha. The local apple production has been decreasing annually, possibly due to the excessive salinity of irrigation water, and we considered using desalinated water for agricultural irrigation to increase the yield and benefits of the orchard. Considering the abundant solar energy resources and underdeveloped power supply conditions, we introduced PV devices to assist in the power supply to ensure a long-term stable operation. We compared the output of the new schemes with the current status of the orchard. Using the current water source with a salinity of 4300 ppm, the output of the orchard was approximately 20.3 t/year. The test data proved that the salinity of wastewater in the drain can be reduced from 6500 to 2500 ppm through the RO device, and the output of the orchard will increase to 32.9 t/year if the drain water amount is sufficient. In addition, because the water resources discarded in the drainage canals are desalinated, the irrigation water in the original canals is saved and can be used for agricultural purposes. After determining the total amount of desalinated water required for irrigation, we designed a two-stage treatment method for NF and RO. This can reduce the desalination cost and retain some of the divalent ions for apple growth to mix with pure water to achieve irrigation salt. Additionally, it can provide a small amount of daily water to local residents. However, the cost of desalinated water is still higher than that of fresh water. Therefore, the applicable objects of this research were limited to crops with a high economic value in the local area, such as apples and red dates.
(2) The capital cost of the entire system was approximately USD 0.3 million (scheme 2). Under certain restrictive factors (electricity subsidies, discount rate, etc.), the NPV of scheme 1 was slightly higher than that of scheme 2. However, considering the uncertainty of the geographical environment of the promotion area in the future, we calculated and compared both schemes to provide a reference for the selection of schemes under different conditions. NPV is a representative parameter that reflects the revenue of a system. We conducted an economic analysis of the main influencing factors: discount rate, electricity subsidies, and apple selling price. When the discount rate is between 5% and 17.8%, the PV + RO combination system (scheme 2) is more effective, and when the discount rate is between 17.8% and 29%, scheme 1 has a higher return. When the discount rate is higher than 29%, a high depreciation rate accelerates the loss of the system, and maintaining the status quo is the best choice. Restricted by the installed capacity, electricity subsidies account for a relatively small proportion of the overall revenue and have a low impact on the NPV of the system. However, for some remote areas in Xinjiang, where power cannot be guaranteed, scheme 2 is a better solution. The apple selling price is the main factor in the fluctuation of the NPV of the orchard. Compared with the initial state, the sensitivity of the NPV dropped from 650% to 101%, which greatly reduced the income difference caused by the fluctuation of selling prices. Finally, we conducted a Monte Carlo analysis of the NPV, and the results showed that the loss risk of the orchard was reduced from 43% in the initial state to 4% by adding a desalination system, which demonstrated the reliability of the investment.
The desalination system used in this study ensured that there were sufficient water sources. For subsequent promotions in other areas, we can consider the diversion method of surface water combined with groundwater. To maintain the stability of the water diversion system, it is necessary to control the growth of influent microorganisms under the two conditions of light and water temperature to maintain sufficient water inflow. Owing to the high capital cost, the system has certain requirements regarding the area of the irrigated orchard and types of crops. In future research, under the premise of controlling the cost of other equipment, increasing the water production of the membrane system and improving the efficiency of the water supply will be our focus to increase the output of other crops with a relatively low economic value and promote the sustainable development of agriculture.

Author Contributions

Y.Y.: Conceptualization, Methodology, Validation, Formal analysis, Investigation, Data curation, Writing—original draft, Writing—review and editing. Z.S.: Resources, Supervision, Writing—review and editing. C.Z.: Writing—review and editing. All authors have read and agreed to the published version of the manuscript.

Funding

This research was funded by the Major Science and Technology Project of the Xinjiang Production and Construction Corps (2018AA003).

Data Availability Statement

Data are contained within the article.

Conflicts of Interest

The authors declare that they have no known competing financial interests or personal relationships that could have appeared to influence the work reported in this paper.

Nomenclature

TDSTotal dissolved solids (mg/L)
MSFMulti-stage flash evaporation
EDElectrodialysis
MDMembrane distillation
ROReverse osmosis
PVPhotovoltaic
NFNano filtration
Y Apple output (kg/ha)
x Irrigation water quantity (m3/ha)
ppmParts per million
NPVNet present value
TCTotal capital cost (USD)
UDCUnit desalination cost (USD/day)
CCRFCapital cost recovery factor (year−1)
DPDaily production (m3/day)
f Stability factor of operation
i Discount rate (%)
C A P C Capital cost (USD)
O P E C Operating cost (USD)
S E C Specific power consumption (kWh/m3)
E P Electricity price (USD)
ESElectricity subsidy (USD)

Subscripts

o i Other instruments
e l e Electrical
c & r Cleaning and replacement
o & m Operation and maintenance
i n r Inverter
l a Labour
y Year
P V Photovoltaic
R O Reverse osmosis

Appendix A

Table A1. Test of the drainage water sample.
ParametersValue
Chloride (mg/L)2999
Sulfate (mg/L)1076
Calcium (mg/L)448.9
Magnesium (mg/L)97.24
Ferric (mg/L)0
COD (mg/L)55.68
Hardness1520
Alkalinity (mg/L)171.4
Turbidity0.15
Conductivity (us/cm)9800
pH6.54
Table A2. Water quality test data.
Test SampleClSO42−Ca2+CODTurbidityConductivitypHAlkalinity
Unitmg/Lmg/Lmg/Lmg/LNTUms/cm mg/L
Drainage channel2750392.98412.82446.6514.0610.575.492.5925
Sand filtration inlet345088.47200.400106.800.2810.197.91102.6625
Sand filtration
outlet
UntestedUntestedUntestedUntested0.2510.187.81Untested
Pump outletUntestedUntestedUntestedUntestedUntested10.037.85Untested
NF inlet3475Untested208.416130.90.629.977.79107.0750
NF outlet2625Untested42.14537.621.107.106.9542.5425
NF concentrated4250384.75310.620219.70.2511.727.88160.1630
RO inlet3380UntestedUntestedUntested0.097.327.94Untested
RO outlet60UntestedUntestedUntestedUntested0.176.22Untested
RO concentrated5450UntestedUntestedUntestedUntested14.067.66Untested
Canal6650129.7356.7139.130.1313.788.3677.5775

Appendix B

The basic parameters of the membrane.
ParametersActive Area
ft2 (m2)
Outer CasingMaximum Operating PressureFeed Spacer MilpH Range
FilmTec™
NF245-390-FF
390 (36.2)Mesh wrap54.8 bar273–10
FilmTec™
RO-390-FF
390 (36.2)Mesh wrap54.8 bar272–10

References

  1. World Bank Group. Water in Agriculture. 2020. Available online: https://www.worldbank.org/en/topic/water-in-agriculture (accessed on 12 August 2020).
  2. Menkouchi Sahli, M.A.; Annouar, S.; Tahaikt, M.; Mountadar, T.; Soufiane, A. Fluoride removal for underground brackish water by adsorption on the natural chitosan and by electro dialysis. Desalination 2007, 212, 37–45. [Google Scholar] [CrossRef]
  3. Ali, M.B.S.; Mnif, A.; Hamrouni, B.; Dhahbi, M. Electrodialytic desalination of brackish water: Effect of process parameters and water characteristics. Ionics 2010, 16, 621–629. [Google Scholar]
  4. Mogheir, Y.; Foul, A.A.; Abuhabib, A.A.; Mohammad, M.A. Assessment of large scale brackish water desalination plants in the Gaza Strip. Desalination 2013, 314, 96–100. [Google Scholar] [CrossRef]
  5. Zhao, S.; Zou, L.; Mulcahy, D. Brackish water desalination by a hybrid forward osmosis–Nano filtration system using divalent draw solute. Desalination 2012, 284, 175–181. [Google Scholar] [CrossRef]
  6. Lopez, A.M.; Williams, M.; Paiva, M.; Demydov, D.; Fairey, J.L. Potential of electrodialytic techniques in brackish desalination and recovery of industrial process water for reuse. Desalination 2017, 409, 108–114. [Google Scholar] [CrossRef]
  7. Rafique, H.M.; Abbas, I.; Sohl, M.A.; Shehzadi, R. Appraisal of drinking water quality of tehsil Jampur, Pakistan. Desalination Water Treat. 2013, 52, 4618–4641. [Google Scholar] [CrossRef]
  8. Xu, X.; He, Q.; Ma, G.; Wang, H.; Nirmalakhandan, N. Selective separation of mono- and di-valent cations in electrodialysis during brackish water desalination: Bench and pilot-scale studies. Desalination 2018, 428, 146–160. [Google Scholar] [CrossRef]
  9. Oren, S.; Birnhack, L.; Lehmann, O.; Lahav, O. A different approach for brackish water desalination, comprising acidification of the feed-water and CO2(aq) reuse for alkalinity, Ca2+ and Mg2+ supply in the post treatment stage. Sep. Purif. Technol. 2012, 89, 252–260. [Google Scholar] [CrossRef]
  10. Sarai Atab, M.; Smallbone, A.J.; Roskilly, A.P. An operational and economic study of a reverse osmosis desalination system for potable water and land irrigation. Desalination 2016, 397, 174–184. [Google Scholar] [CrossRef]
  11. Wang, K.; Abdalla, A.A.; Hilal, H. Mechanical properties of water desalination and wastewater treatment membranes. Desalination 2017, 401, 190–205. [Google Scholar]
  12. Das, R.; Ali, M.E.; Hamid, S.B.A.; Ramakrishna, S.; Chowdhury, Z.Z. Carbon nanotube membranes for water purification: A bright future in water desalination. Desalination 2014, 336, 97–109. [Google Scholar] [CrossRef]
  13. Birnhack, L.; Shlesinger, N.; Lahav, O. A cost effective method for improving the quality of inland desalinated brackish water destined for agricultural irrigation. Desalination 2010, 262, 152–160. [Google Scholar] [CrossRef]
  14. Fritzmann, C.; Löwenberg, J.; Wintgens, T.; Melin, T. State-of-the-art of reverse osmosis desalination. Desalination 2007, 216, 1–76. [Google Scholar] [CrossRef]
  15. Gökçek, M.; Gökçek, Ö.B. Technical and economic evaluation of freshwater production from a wind-powered small-scale seawater reverse osmosis system (WP-SWRO). Desalination 2016, 381, 47–57. [Google Scholar] [CrossRef]
  16. Ahmad, G.E.; Schmid, J. Feasibility study of brackish water desalination in the Egyptian deserts and rural regions using PV systems. Energy Convers. Manag. 2002, 43, 2641–2649. [Google Scholar] [CrossRef]
  17. Ghaffour, N.; Bundschuh, J.; Mahmoudi, H.; Goosen, M.F. Renewable energy-driven desalination technologies: A comprehensive review on challenges and potential applications of integrated systems. Desalination 2015, 356, 94–114. [Google Scholar] [CrossRef]
  18. Richards, B.S.; Schafer, A.I. Design considerations for a solar-powered desalination system for remote communities in Australia. Desalination 2002, 144, 193–199. [Google Scholar] [CrossRef]
  19. Abdelkareem, M.A.; El Haj Assad, M.; Sayed, E.T.; Soudan, B. Recent progress in the use of renewable energy sources to power water desalination plants. Desalination 2018, 435, 97–113. [Google Scholar] [CrossRef]
  20. Parsa, S.M.; Norouzpour, F.; Shoeibi, S.; Shahsavar, A.; Aberoumand, S.; Said, Z.; Karimi, N. A comprehensive study to find the optimal fraction of nanoparticle coated at the interface of solar desalination absorbers: 5E and GHGs analysis in different seasons. Sol. Energy Mater. Sol. Cells 2023, 256, 112308. [Google Scholar] [CrossRef]
  21. Masoud, S.P. Mega-scale desalination efficacy (Reverse Osmosis, Electrodialysis, Membrane Distillation, MED, MSF) during COVID-19: Evidence from salinity, pretreatment methods, temperature of operation. J. Hazard. Mater. Adv. 2023, 9, 100217. [Google Scholar]
  22. Li, X.; Jin, M.; Yuan, J. Salt evaluation of drip irrigation in cotton field under brackish water film. J. Hydraul. Eng. 2014, 9, 1091–1098. [Google Scholar]
  23. Zhao, M.; Li, Y.H.; Li, F.D. Analysis of the spatial variability of soil moisture and salinity in Ebinur Lake wetlands, Xinjiang. J. Lake Sci. 2016, 28, 1328–1337. [Google Scholar]
  24. Ma, Z.M.; Luan, F.J.; Jia, R.L.; Zhou, J.L. Remote sensing interpretation and analysis of land desertification and salinization in Xinjiang Beitun area. Ground Water 2017, 3, 140–141. [Google Scholar]
  25. Hu, H.; Tian, F.; Zhang, Z. The leaching and multi-year dynamics of soil salinity in farmland under mulch drip irrigation in arid areas during non-growth period. J. Hydraul. Eng. 2015, 46, 1037–1046. [Google Scholar]
  26. Zhou, H.; Wang, S.; Yao, X. Study on the characteristics of directional migration and distribution of soil water and salt and the salt discharge effect of drip irrigation under mulch. J. Hydraul. Eng. 2013, 44, 1380–1388. [Google Scholar]
  27. Chen, L.J.; Feng, Q.; Li, F.R.; Li, C.S. Simulation of soil water and salt transfer under mulched furrow irrigation with saline water. Geoderma 2015, 241–242, 87–96. [Google Scholar] [CrossRef]
  28. Wang, Z.; Jin, M.; Simunek, J.; van Genuchten, M.T. Evaluation of mulched drip irrigation for cotton in arid Northwest China. Irrig. Sci. 2014, 32, 15–27. [Google Scholar] [CrossRef]
  29. Wang, Z.M.; Su, J.; Zhu, G.Y.; Han, J.F.; Wang, Y. Characteristics and accumulation mechanism of quasi-layered Ordovocian carbonate reservoirs in the Tazhong area, Tarim Basin. Energy Explor. Exploit. 2013, 31, 545–567. [Google Scholar] [CrossRef]
  30. Zhang, S.C.; Huang, H.P.; Su, J.; Zhu, G.Y.; Wang, X.M. Geochemistry of Paleozoic marine oils from the Tarim Basin, NW China. Part 4: Paleobiodegradation and oil charge mixing. Org. Geochem. 2014, 67, 41–57. [Google Scholar] [CrossRef]
  31. Zhao, W.Z.; Shen, A.J.; Pan, W.Q. A research on carbonate karst reservoirs classification and its implication on hydrocarbon exploration: Cases studies from Tarim Basin. Acta Petrol. Sin. 2013, 29, 3213–3222. [Google Scholar]
  32. Fang, S.B.; Tu, W.R. Saline alkali water desalination project in Southern Xinjiang of China: A review of desalination planning, desalination schemes and economic analysis. Renew. Sustain. Energy Rev. 2019, 113, 109268. [Google Scholar] [CrossRef]
  33. Fang, C.Y.; Wang, L.; Zhang, Y.; Wang, A.T. Two new species of brackish water Macrostomum (Platyhelminthes, Macrostomida) from southern China. Zootaxa 2016, 4170, 298–310. [Google Scholar] [CrossRef]
  34. Ruiz, G.A.; Ruiz, S.E. 80,000 h operational experience and performance analysis of a brackish water reverse osmosis desalination plant, Assessment of membrane replacement cost. Desalination 2015, 375, 81–88. [Google Scholar] [CrossRef]
  35. Zarzo, D.; Campos, E.; Terrero, P. Spanish experience in desalination for agriculture. Desalination Water Treat. 2013, 51, 53–66. [Google Scholar] [CrossRef]
  36. Bennett, A. Developments in desalination and water reuse. Filtr. Sep. 2015, 52, 28–33. [Google Scholar] [CrossRef]
  37. Al-Amshawee, S. Electrodialysis desalination for water and wastewater: A review. Chem. Eng. J. 2020, 380, 122231. [Google Scholar] [CrossRef]
  38. Wang, L.; Zheng, H.F.; Zhao, Y.S. Solar-driven natural vacuum desalination system with inner condenser. Appl. Therm. Eng. 2021, 196, 117320. [Google Scholar] [CrossRef]
  39. Namboodiri, V.; Rajagopalan, N. Comprehensive Water Quality and Purification; Elsevier: Amsterdam, The Netherlands, 2014. [Google Scholar]
  40. Pendergast, M.M.; Hoek, E.M.V. A review of water treatment membrane nanotechnologies. Energy Env. Sci. 2011, 4, 1946–1971. [Google Scholar] [CrossRef]
  41. International Desalination Association. IDA Desalination Yearbook, 2010–2019. Available online: https://idadesal.org/ (accessed on 1 July 2024).
  42. Shahzad, M.W.; Burhan, M.; Ang, L.; Ng, K.C. Energy-water-environment nexus underpinning future desalination sustainability. Desalination 2017, 413, 52–64. [Google Scholar] [CrossRef]
  43. Shatat, M.; Worall, M.; Riffat, S. Opportunities for solar water desalination worldwide: Review. Sustain. Cities Soc. 2013, 9, 67–80. [Google Scholar] [CrossRef]
  44. Cao, H. The Effect of Irrigation System on the Growth, Yield and Quality of Drip Irrigation Apples with Short Stocks in Southern Xinjiang. Master’s Thesis, Tarim University, Alar, China, 2021. [Google Scholar]
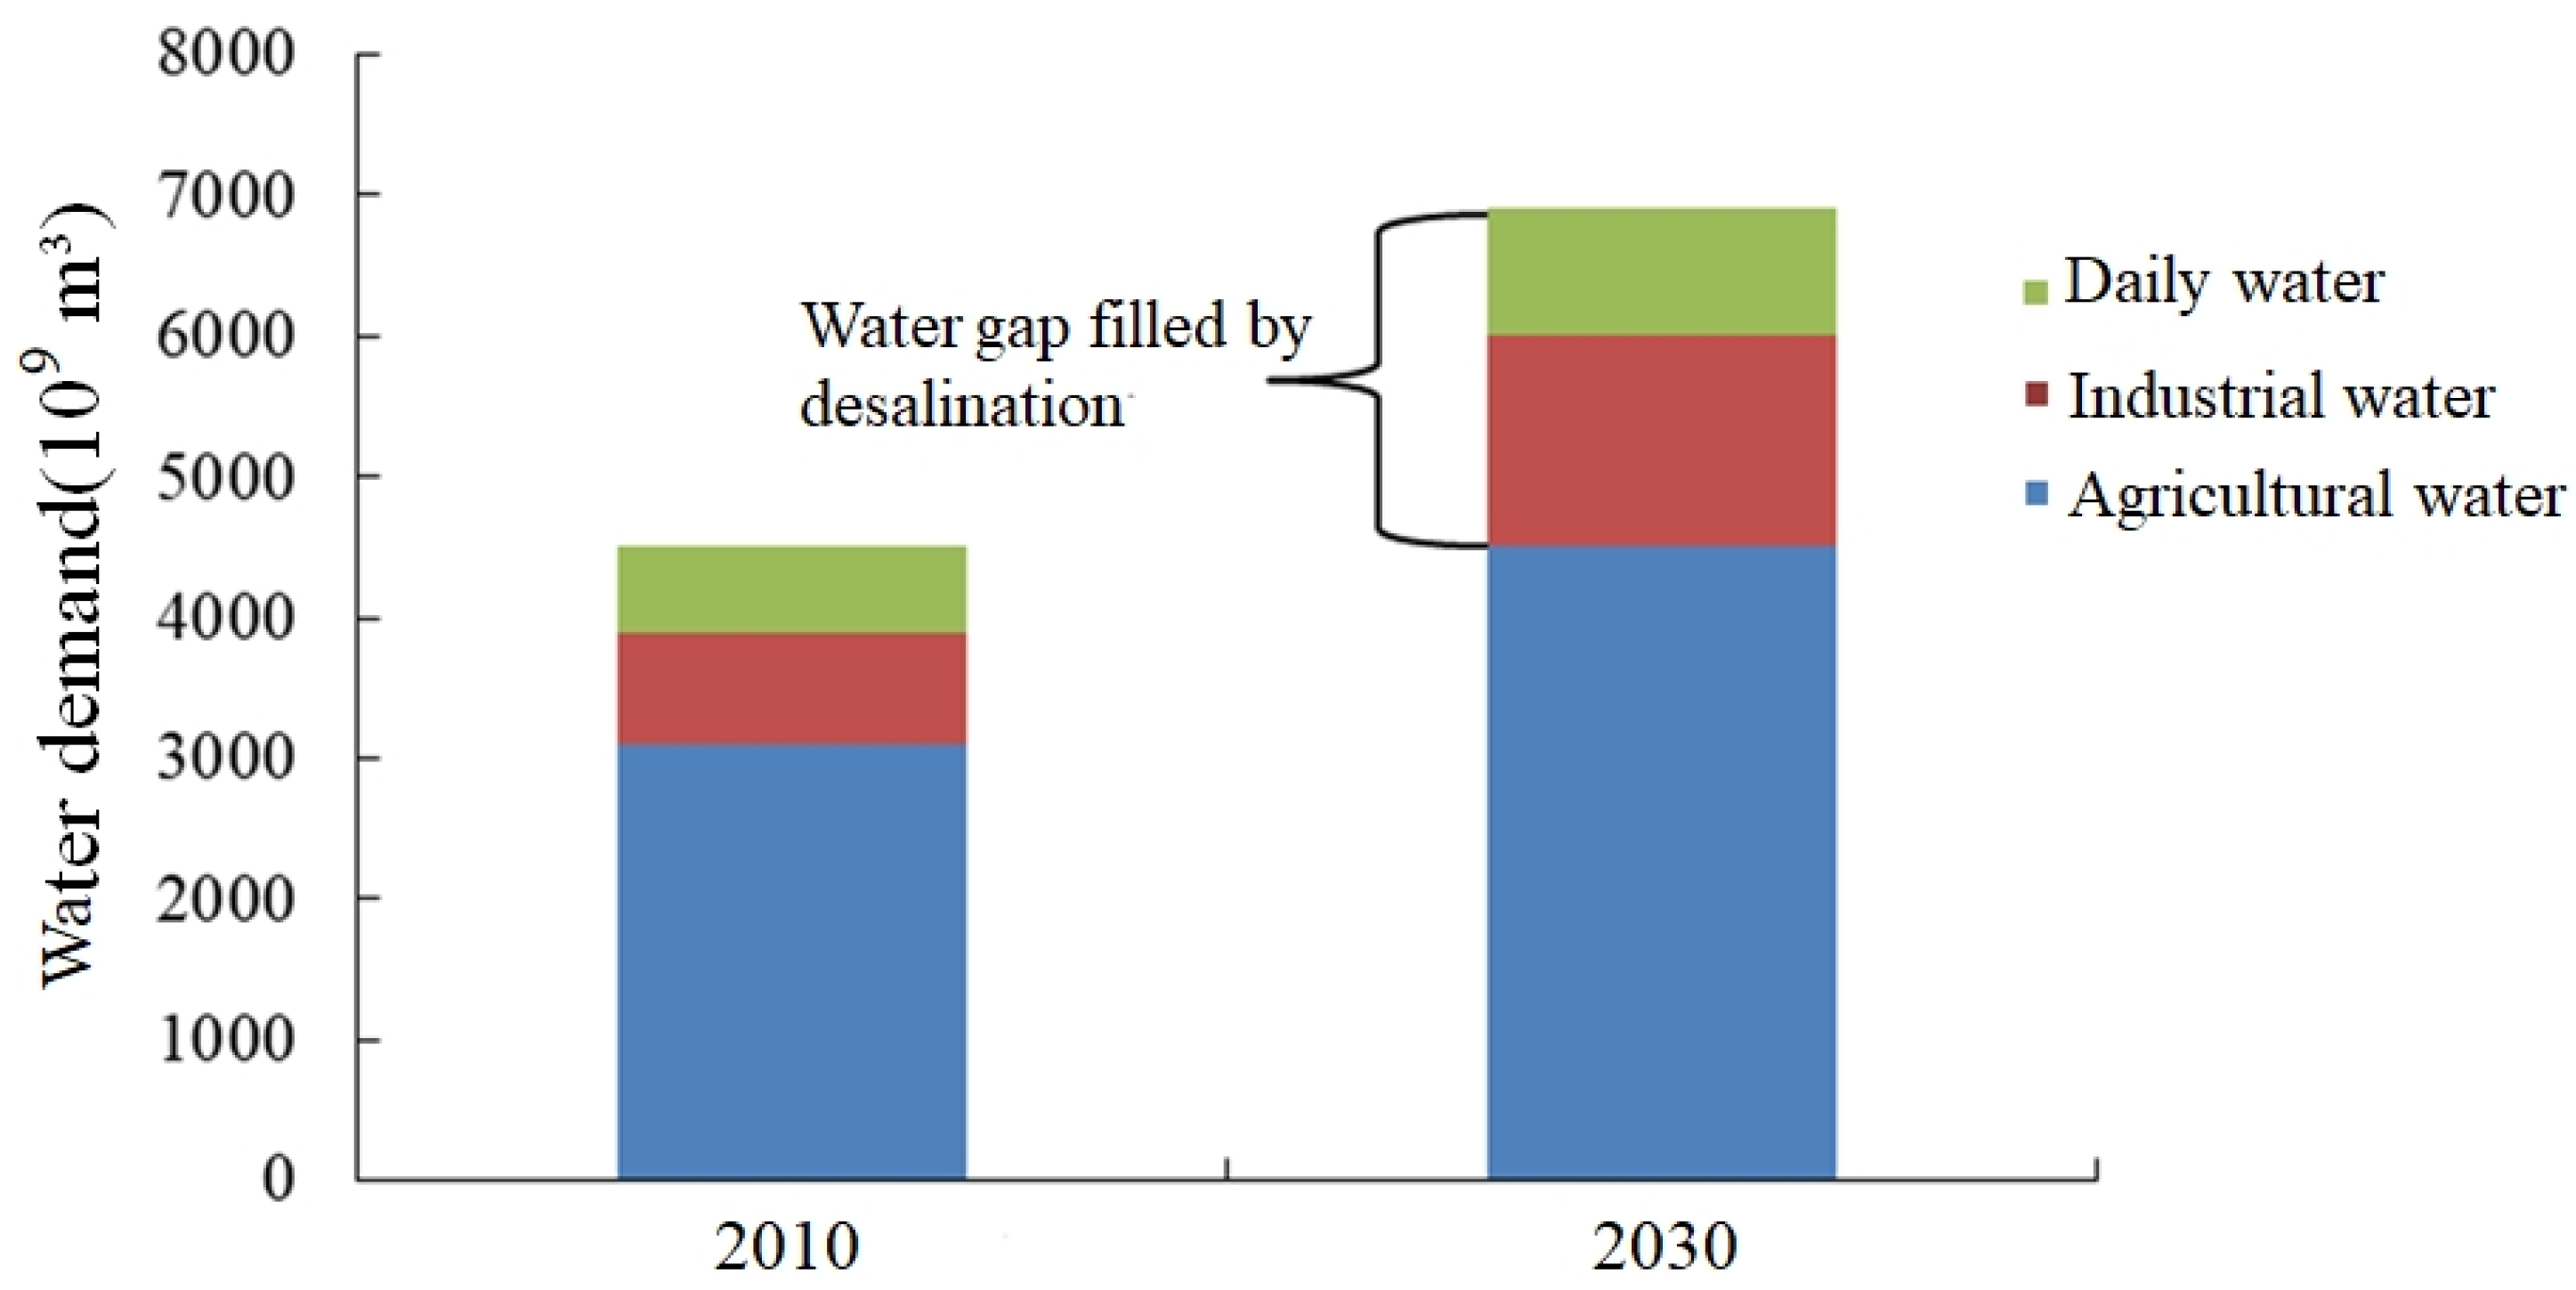
Figure 1. Forecast of global water supply and demand.
Water 16 02306 g001
Figure 2. Annual rainfall in Xinjiang [32].
Water 16 02306 g002
Figure 3. Distribution of worldwide apple production.
Water 16 02306 g003
Figure 4. PV + RO system schematic diagram.
Water 16 02306 g004
Figure 5. Schematic diagram of the desalination system operation.
Water 16 02306 g005
Figure 6. Ratios of capital and operating costs. (a) Ratio of capital costs; (b) ratio of operating costs.
Water 16 02306 g006
Figure 7. Annual net income for each scheme.
Water 16 02306 g007
Figure 8. Change in the NPV with the discount rate under different schemes.
Water 16 02306 g008
Figure 9. Change in the NPV with the discount rate under different electricity subsidies.
Water 16 02306 g009
Figure 10. Change in the NPV with apple selling price. (a) NPV varies with changes in the selling price of apples. (b) Sensitivity of NPV to the selling price of apples.
Water 16 02306 g010
Figure 11. Sensitivity of the NPV to various parameters.
Water 16 02306 g011
Figure 12. Profitability ratio of the orchard profit.
Water 16 02306 g012
Table 1. Distribution of brackish water in the world [4,5,6,7,8,9,10,11,12].
CountrySiteTDS (mg/L)Type of Water
AfricaMorocco2208Ground
AfricaTunisia5424Surface
AustraliaMawson Lake3970Surface
ChinaKashgar River5817Surface
ChinaLongdong2506Ground
EgyptSinai2000Ground
Arabian PeninsulaGaza Strip2359Surface
PakistanChampu4213Surface
IsraelCarmel Coast3890Surface
IranIraq5471Surface
United StatesPerris2780Well
United StatesEl Paso2736Ground
Table 2. Parameters of the desalination system.
ParametersValue
Inlet flow of total system (m3/day)440
Inlet flow of NF device (m3/day)420
Permeation flow of NF device (m3/day)335
Concentration flow of NF device (m3/day)85
Permeation flow of RO device (m3/day)289
Concentration flow of RO device (m3/day)46
Total irrigation flow (m3/day)37
Recovery rate of NF device (%)79%
Recovery rate of RO device (%)86%
Total recovery (%)85%
Influent salinity (ppm)6500
Influent temperature (°C)25
Membrane element typeStage 1: FilmTec™ NF245-390-FF
Stage 2: FilmTec™ RO-390-FF
Number of pressure vessels in Stage 13
Number of elements per each pressure vessels in
Stage 1
4
Number of pressure vessels in Stage 24
Number of elements per each pressure vessels in
Stage 2
4
Total number of elements28
Total active area (m2)1014
Total average flux (L/m2·h)13.7
NF membrane flux (L/m2·h)23
Permeate flow salinity of NF device (ppm)3909
Concentrate flow salinity of NF device (ppm)7618
RO membrane flux (L/m2·h)17
Permeate flow salinity of RO device (ppm)85
Concentrate flow salinity of RO device (ppm)7030
Booster pump efficiency (%)80
Feed pressure (bar)22.6
Outlet pressure (bar)20.6
System power (kW)30.8
Specific energy consumption (kWh/m3)2
Table 3. Parameters of the photovoltaic system.
ParametersValue
Photovoltaic panel modelEagle 72P 320–340 W
Number of panels128
Module area (m2)210
Module size (mm)1956 × 992 × 40
Maximum power (wp)340
PV module efficiency (%)17%
PV module lifecycle (years)25
Nominal battery operating temperature (NOCT) (°C)45 ± 2
PV module output power deviation0~3%
Total installed capacity (kWac)80
Inverter modelSDP-40
Inverter power (kWac)40
Inverter efficiency (%)96
Number of inverters2
Inverter lifecycle (years)10
Energy loss of PV and inverter (%)12
Annual output of PV modules (kWh)122,700
Table 4. Assumptions for the economic analysis.
ParametersValue
Desalination device availability (%)95
Plant lifecycle (years)20
Discount rate (%)17.8
Apple selling price (USD/kg)3.5
Orchard specific operating cost (USD/year/ha)1000
Annual escalation rate for incomes (%)5
Capital cost recovery factor (year−1)0.18
Specific total capital cost of the solar panels (USD/kWp)219
Exchange rate (USD/RMB)6.4
Electricity price (USD/kWh)0.04
Electricity subsidy (USD/kWh)0.06
Table 5. Capital and operating costs and incomes of each scheme.
Scheme 1Scheme 2
Capital cost (USD)
Capital cost of the RO system234,375234,375
Capital cost of the PV systemN/A46,875
Land cost468815,625
Total capital cost239,063296,875
Operating cost (USD)
Electricity cost10,51210,512
Membrane cleaning and replacement cost11,20011,200
Operation and maintenance cost of the PV systemN/A469
Operation and maintenance cost of the RO system35163516
Labour cost47009400
Total operating cost29,92834,628
Total annual cost72,95988,065
Unit desalination cost (USD/m3)0.60.75
Income from selling apples in 1st year (USD)118,494118,494
PV subsidy income (USD)N/A7362
Total income in 1st year (USD)118,494125,856
Table 6. Assumptions for the Monte Carlo analysis.
ParameterMax/MinCurrent AmountDistribution
Inflation rate15%/5%6.7%Uniform
Apple selling price+50%/−50%3.5 $/kgUniform
Discount rate29%/5%17.8%Triangular
Electricity subsidies+50%/−50%0.06 $/kWhTriangular
Disclaimer/Publisher’s Note: The statements, opinions and data contained in all publications are solely those of the individual author(s) and contributor(s) and not of MDPI and/or the editor(s). MDPI and/or the editor(s) disclaim responsibility for any injury to people or property resulting from any ideas, methods, instructions or products referred to in the content.