Article

Sewage Vertical Infiltration Introduced Polygenic Multipollutants into Groundwater

1
School of Water Resources and Environment, China University of Geosciences (Beijing), Beijing 100083, China
2
College of Water Sciences, Beijing Normal University, Beijing 100875, China
3
Department of Ecology and Environment of Heilongjiang Province, Harbin 150090, China
4
China Institute of Geo-Environmental Monitoring, Beijing 100081, China
*
Authors to whom correspondence should be addressed.
Water 2024, 16(16), 2305; https://doi.org/10.3390/w16162305
Submission received: 18 July 2024 / Revised: 14 August 2024 / Accepted: 14 August 2024 / Published: 16 August 2024
(This article belongs to the Special Issue China Water Forum 2024)

Abstract

:
With the increasing environmental impacts of human activities, the problem of polygenic multipollutants in groundwater has attracted the attention of researchers. Identifying the hydrobiogeochemical characteristics of the surface sewage that replenishes groundwater is crucial to addressing this problem. The input of polygenic multipollutants into groundwater leads to not only the mechanical superposition of pollutants but also the formation of secondary pollutant types. The evolution of polygenic multipollutants is influenced by aquifer characteristics, carbon sources, microbial abundance, etc. Therefore, this study took a sewage leakage point in Northwest China as the research object, carried out a controlled laboratory experiment on the impact of sewage discharge on groundwater, and, combined with long-term field monitoring results, determined the main hydrobiogeochemical processes of polygenic multipollutants and their secondary pollutants. The results showed that the redox environment and the gradient change in pH were identified as the most critical controlling factors. In oxidative groundwater during the early stage of vertical infiltration, sewage carries a substantial amount of NH4+, which is oxidized to form the secondary pollutant NO3. As O2 is consumed, the reduction intensifies, and secondary pollutants NO3, Mn (IV), and Fe(III) minerals are successively reduced. Compared with the natural conditions of rainwater vertical infiltration, the reaction rates and intensities of various reactions significantly increase during sewage vertical infiltration. However, there is a notable difference in the groundwater pH between sewage and rainwater vertical infiltration. In O2 and secondary pollutant NO3 reduction, a large amount of CO2 is rapidly generated. Excessive CO2 dissolves to produce a substantial amount of H+, promoting the acidic dissolution of Mn (II) minerals and generation of Mn2+. Sewage provides a higher carbon load, enhancing Mn (II) acidic dissolution and stimulating the activity of dissimilatory nitrate reduction to ammonium, which exhibits a higher contribution to NO3 reduction. This results in a portion of NO3 converted from NH4+ being reduced back to NH4+ and retained in the groundwater, reducing the denitrification’s capacity to remove secondary NO3. This has important implications for pollution management and groundwater remediation, particularly monitored natural attenuation.

1. Introduction

With the increase in human activities, the issue of groundwater composite pollution caused by pollutants from various sources during the vertical replenishment of surface sewage into aquifers has garnered more attention [1,2]. In this paper, pollutants from different sources (natural and anthropogenic sources) and components (natural and anthropogenic components) are called polygenic multipollutants. The input of polygenic multipollutants leads to a direct overlay of pollutant components in the groundwater system. Interactions occur among pollutants from different sources, between the aquifer and groundwater, and between the aquifer and pollutants, generating new soluble components and, thus, forming secondary pollutants [3,4]. Groundwater pollution in many regions worldwide has been characterized by polygenic sources [5,6] by primarily focusing on natural sources, namely, Fe, Mn [4], and anthropogenic sources (i.e., NH4+ and NO3) [7,8]. The interactions among groundwater, polygenic multipollutants, and aquifer media are very complex and are regulated by factors such as lithology, recharge, environmental conditions, and microbial activity [9]. Identifying the hydrobiogeochemical characteristics of the surface sewage that replenishes groundwater is crucial to addressing this problem.
In the process of localized concentrated vertical infiltration of polygenic multipollutants, the presence of sewage carrying abundant organic carbon, organic nitrogen, and inorganic nitrogen leads to complex hydrogeochemical reactions [10,11]. Water–rock interactions, adsorption processes, and biogeochemical processes primarily govern these reactions. The control factors include the permeability of the aquifer media, the content of humic substances, redox conditions, and acidity [9]. The permeability of aquifer media can influence the retention time of groundwater, affecting the storage capacity of pollutant components in the aquifer media. Prolonged filtration processes result in significant cation exchange adsorption [12,13]. Humic substances in aquifer media can provide a substantial carbon source. During the process of sewage vertical recharge aquifers, the input of organic carbon can influence the diversity and activity of micro-organisms, triggering biogeochemical processes in carbon cycling, such as the degradation of organic matter and nitrogen transformation [14]. Additionally, nitrogen compounds, such as amino acids, may be present in humic substances, participating in nitrogen biogeochemical processes. Micro-organisms can utilize these nitrogen compounds in reactions such as nitrification, denitrification, and dissimilatory nitrate reduction to ammonium (DNRA) [15,16], influencing the morphological transformation of nitrogen [17].
Under natural conditions, with the increase in dissolved oxygen (DO) content in the aquifer medium under oxidation conditions, nitration plays a leading role, and NH4+ is oxidized to NO3, accompanied by the decomposition of organic matter [5,18]. As oxygen is consumed, the system gradually shifts to a reducing environment, and the prominence of denitrification increases, reducing NO3 to produce N2 and NH4+ [19]. The acidity (pH) of the aquifer media is a crucial factor controlling the strength of water–rock interactions Under acidic conditions, water–rock interactions intensify, increasing the concentration of inorganic ions in groundwater. These conditions may also induce the acidic dissolution of metal minerals such as Fe and Mn, increasing their concentrations in groundwater [17,19]. In addition, under natural conditions, along the vertical infiltration direction of water, REDOX conditions, pH, and carbon load form a gradient. Under the action of micro-organisms, carbon sources provide electrons, and O2, NO3, Mn(IV), and Fe(III) [14] are successively reduced to form a sequential REDOX zone. However, the introduction of wastewater containing large amounts of COD and NH4+ changes the sequential REDOX process. The initial oxidation of NH4+ generates NO3, which leads to the increase of NO3 concentration and promotes denitrification. The large amount of H+ produced in this process can change the pH value of the aquifer medium [20,21]. Prolonged nitration can shift the reaction zone of Mn(IV) and Fe(III) backward [22,23].
Hydrochemical tracing and laboratory simulation inversion are the most commonly used methods for identifying polygenic multipollutants [21,24]. Cao, X. et al. demonstrated through leaching experiments that Flood irrigation increases the release of phosphorus from aquifer sediments into groundwater [25], and Zhai, Y. et al. confirmed through leaching experiments that anthropogenic organic pollutants in groundwater increase the release of Fe and Mn from aquifer sediments [18]. In the field, hydrochemical tracing is used as a basis, and specific experiments are conducted indoors to simulate inversion based on polygenic multipollutants [19]. This approach identifies the main geochemical processes and their impact intensity, providing a scientific basis for the management and remediation of groundwater. In a specific location in a desert in Northwest China with a concentrated leakage of multiple pollutants, research, based on long-term monitoring, was conducted and revealed interactions between trivalent nitrogen and manganese in groundwater. Sewage discharge significantly affected the types and concentrations of solute components in groundwater. The oxidation of exogenous organic nitrogen triggering the reductive dissolution of manganese was identified as the main mechanism for the increase in Mn2+ in groundwater. Additionally, under conditions of DO > 2 mg/L, chemolithoautotrophic denitrification and nitrate heterotrophic reduction to ammonium were identified as the main mechanisms for NO3 attenuation [10].
To further explore the vertical leakage impact of polygenic multipollutants in the desert on groundwater, this study conducted indoor simulation experiments to (1) simulate the impact of sewage discharge on groundwater through controlled laboratory experiments, (2) supplement and validate previous field observation results based on conclusions drawn from experiments, and (3) analyze the influencing mechanisms from physical and chemical perspectives. The research results provide insights into local groundwater management and remediation planning strategies.

2. Materials and Methods

2.1. Study Area

The study area is located in Northwest China (Figure S1). The topography of the study area slopes from the southwest to the northeast, with slopes ranging from 5 to 9‰ and consisting of relatively flat terrain. The climate of the study area is a temperate continental arid climate, with an average annual precipitation of 160 mm, average annual evaporation of 2000 mm, and 2800 h of sunshine annually. Groundwater types include unconfined aquifers in the south and confined aquifers in the north. The groundwater flow direction is from southeast to northwest, and the main aquifer lithology consists of fine sand, silty fine sand, coarse sand, and sandy gravel from the Middle–Upper Pleistocene. The groundwater depth is about 15 m. Groundwater replenishment around the contamination site is mainly from lateral runoff from the southeast to the northwest. The hydraulic gradient is 3‰, moving from the contaminated site to the downstream northern zone. The permeability coefficient of the aquifer is between 6.44 and 13.0 m/d. Groundwater recharge primarily occurs through surface water infiltration, and fractured water from mountain bedrock serves as lateral replenishment. Groundwater discharge is mainly through lateral outflow, with minimal and dispersed artificial extraction and low water consumption.

2.2. Pollution Incident and Field Monitoring

Based on the field investigation, it was found that from 28 May 2014 to 6 March 2015, 209,800 cubic meters of sewage was discharged through a pipeline, resulting in pollution at three sites of varying sizes (designated as #1, #2, and #3 in Figure S1). The discharge volumes for sites #1, #2, and #3 were 74,700, 129,000, and 6100 cubic meters, respectively [10]. The investigation revealed that the main pollutants in the sewage discharged at the three contaminated sites were biodegradable organic nitrogen (represented by CODMn) and ammonia nitrogen (measured as NH4+-N), with concentrations ranging from 1956 to 2935 mg/L and 625 to 638 mg/L, respectively [10]. The Mn concentration in the sewage was below the detection limit. Long-term monitoring from 15 June 2015 to 1 June 2021 indicated that the discharge of high COD and ammonia nitrogen sewage severely affected the concentrations of hydrogeochemical components in the groundwater at the three polluted sites, as well as the types of hydrogeochemical components present (Figure 1). Specifically, the COD, NH4+, and NO2 levels in the groundwater at the three sites were significantly higher than the background values, while the concentrations of NO3 and DO were lower. Mn, which was undetectable in the background groundwater, reached a maximum concentration of 1.64 mg/L in the groundwater at the three polluted sites.

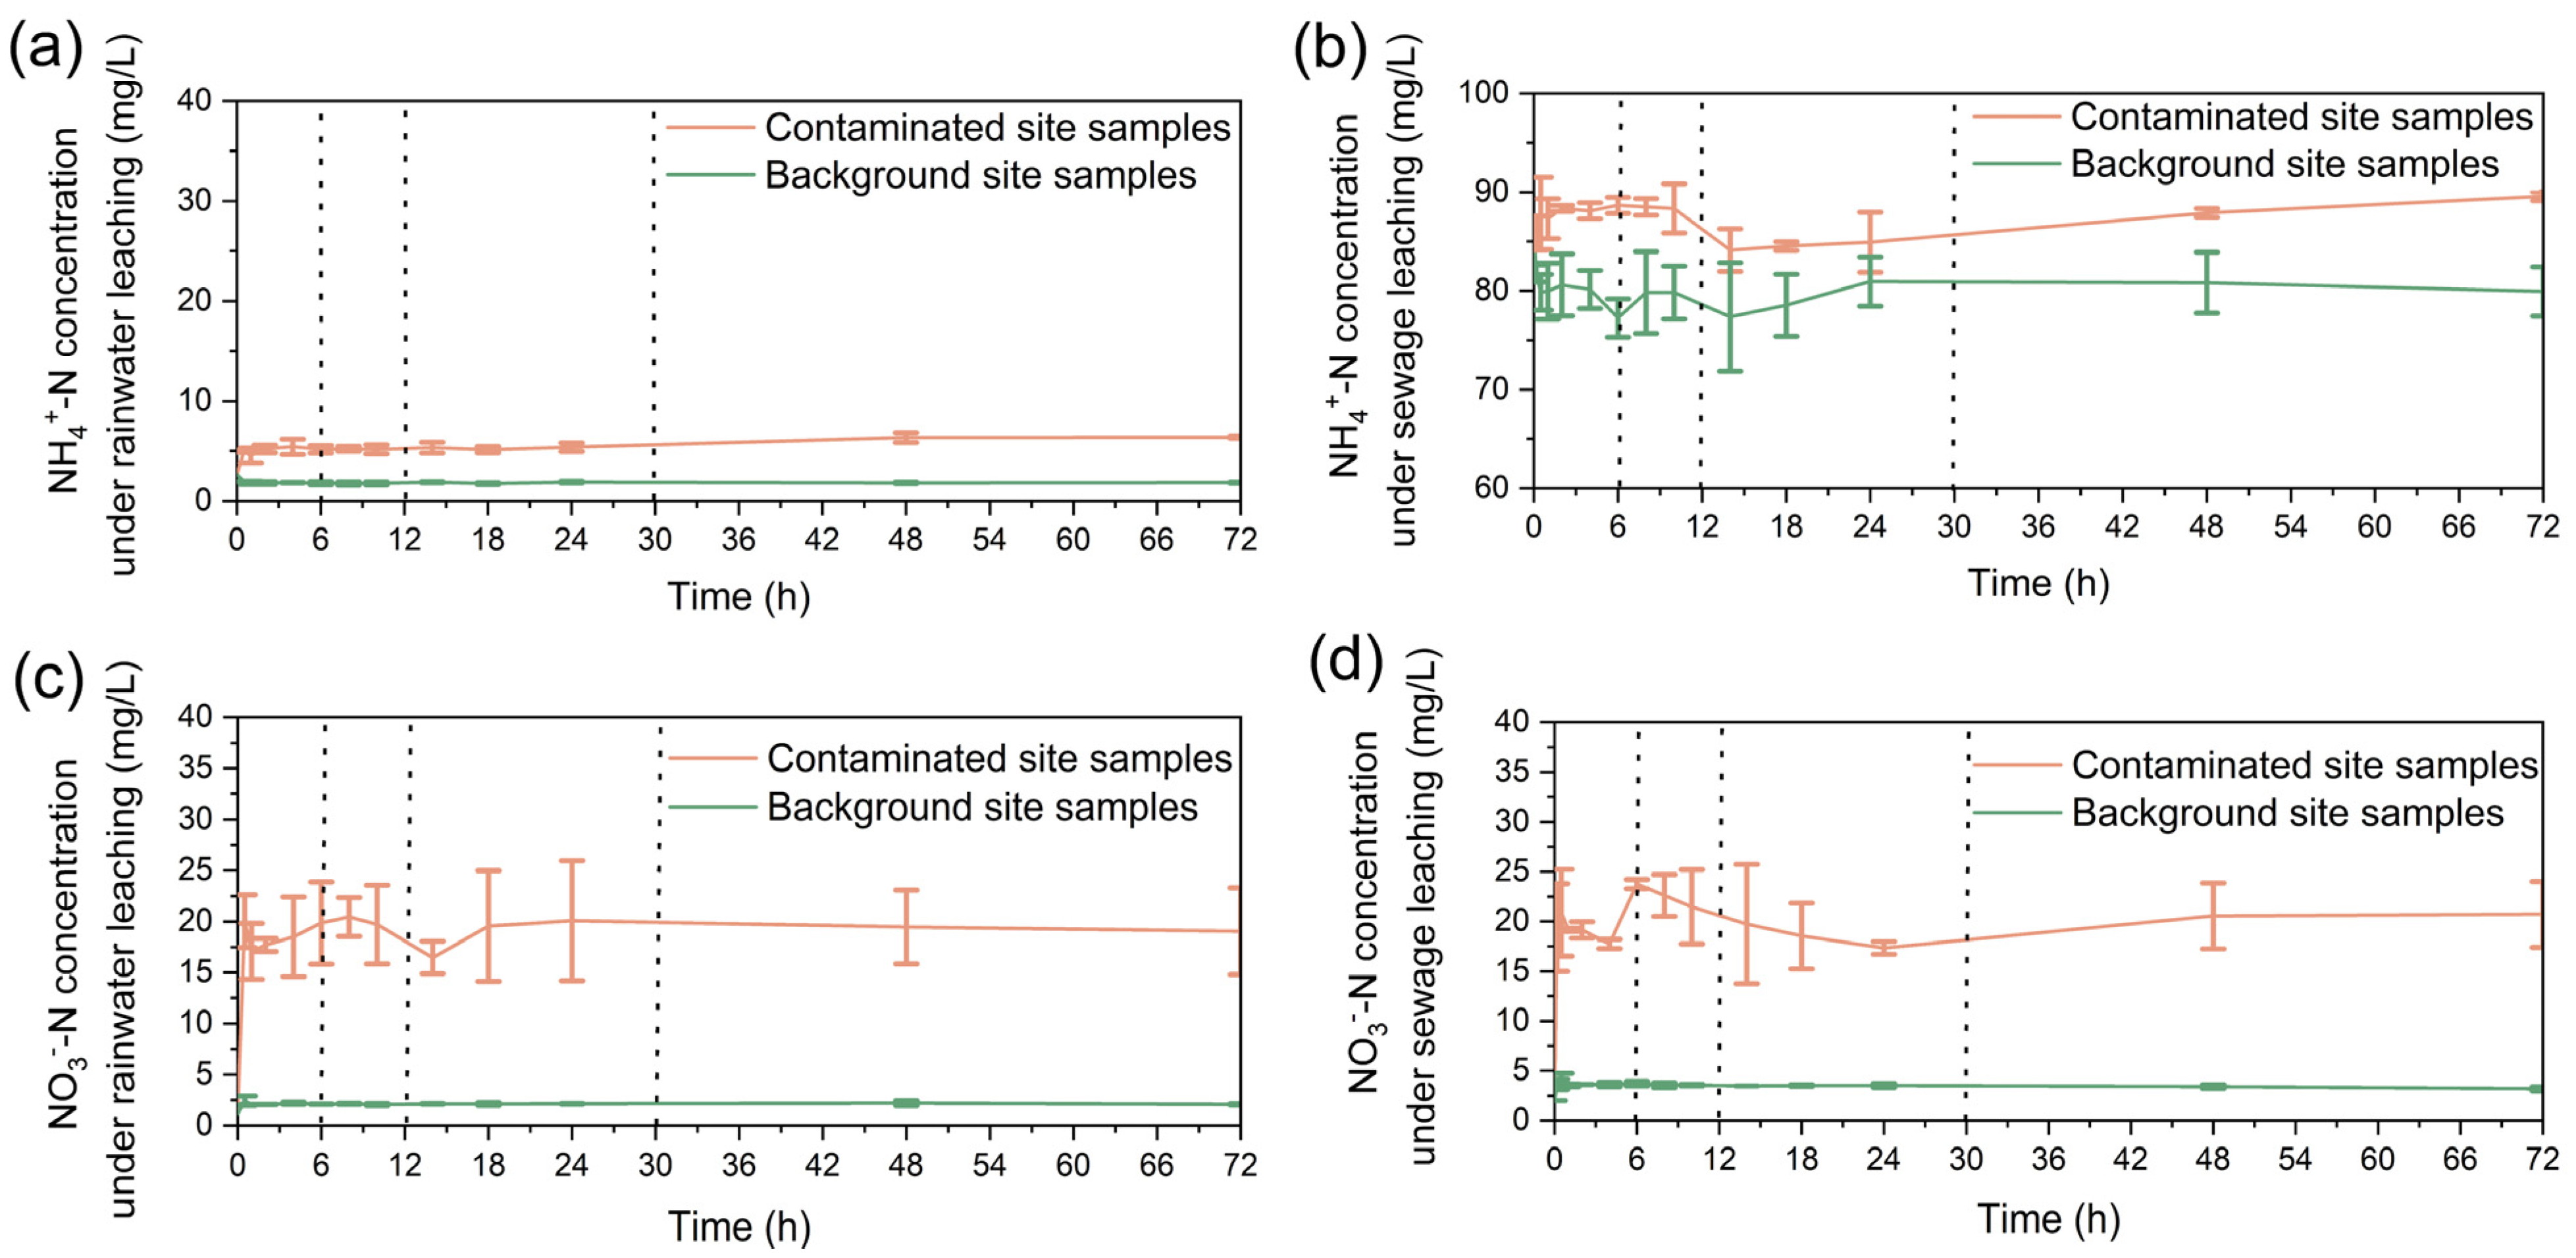
2.3. Laboratory Experiment

2.3.1. Sample Collection and Determination

To further investigate the impact of vertically infiltrating pollutants on groundwater and provide additional insights into the observed field phenomena, laboratory-controlled experiments were conducted to simulate the effects of sewage vertical infiltration on groundwater [24,25]. The soil sample collection and preservation for this experiment strictly followed the China’s quality standards (GB/T 36197-2018) [26]. The soil samples, categorized as spatially mixed samples, were collected from the polluted sites (#1, #2, #3 in Figure S1) and uncontaminated background sites (#BMW in Figure S1). The sampling depth is 8–10 m in the unsaturated zone and 18–20 m in the saturated zone. For comparative analysis, two sets of saturated aquifer samples were collected from the polluted sites, and two sets were collected from the uncontaminated background sites, resulting in a total of four sample groups. After collection, the samples were sealed in pre-prepared plastic bags and stored under low-temperature refrigeration conditions before being transported to the laboratory for analysis [5,27].
To improve the understanding of the mineral composition of the saturated aquifer samples and facilitate the analysis of potential biogeochemical processes during sewage leaching, the collected soil samples were air-dried and ground to pass through a 200-mesh sieve [22]. The sieved soil samples were sealed in plastic bags for further use. Using the required procedures, the laboratory pre-treated the samples and determined the metal element composition (Table S1) and mineral components (Figure S2). The elemental content in the samples was determined using inductively coupled plasma atomic emission spectrometry (ICP-AES). Mineral phase analysis was conducted using X-ray diffraction [13,28].
To avoid interference from other chemical components, the water samples used in this experiment were untreated source water samples collected in the study area [10]. For comparative purposes, two types of source water were used in this experiment: sewage from the sewage treatment system of the sewage discharge plant in the study area and local rainwater, with the rainwater samples collected and mixed during months of highest precipitation (Jun–Sep). All water samples were sealed on-site and immediately placed in an insulated box with ice, transported to the laboratory within 1 h, and stored in a refrigerator at 4 °C until testing [24].
To facilitate the comparative analysis of concentration changes in various components during the experiment, the initial concentrations of each chemical component in the experimental water (sewage and rainwater) were measured before the experiment (Table S2) [29]. To accurately and comprehensively characterize the local pollution situation, the selection of detection indicators in the experiment was based on the ‘Groundwater Quality Standards (GB/T14848-2017) [30] in China, the WHO quality standard [31] and the current status of groundwater quality in the study area, and other considerations [29]. The overall selection principle covered conventional indicators, macro-soluble components, and “bottleneck” indicators affecting groundwater quality levels, anticipating and emphasizing potentially harmful chemical components. The selected detection indicators included K+, Na+, Ca2+, Mg2+, SO42−, Cl, NH4+-N, NO3-N, NO2-N, COD, pH, Al, As, Fe, Mn, P, Zn, and 10 other indicators. The detection of COD, NH4+-N, NO3-N, NO2-N, pH, Fe, and Mn was using the recommended methods in the “Groundwater Quality Standards” (Table S3). Inorganic ion indicators such as K+, Na+, Ca2+, and Mg2+ were tested using ion chromatography, and Al, As, and P were determined using inductively coupled plasma atomic emission spectrometry [30].

2.3.2. Experimental Procedure

Cao, X. et al. demonstrated through leaching experiments that flood irrigation increases the release of phosphorus from aquifer sediments into groundwater [25], and Zhai, Y. et al. confirmed through leaching experiments that anthropogenic organic pollutants in groundwater increase the release of Fe and Mn from aquifer sediments [18]. Therefore, to determine the impact of polygenic multipollutants inputs on the concentration changes in various chemical components in groundwater, leaching experiments were conducted to simulate this process. The leaching experiment was performed in the laboratory by using a conical flask shaking experiment setup (Figure S3). Under dark conditions, with temperature controlled between 10 and 15 °C, sewage samples (or rainwater samples) and groundwater samples were added to a 250 mL conical flask at a water-to-soil ratio of 10:1 [27]. The conical flask was shaken and transferred to a centrifuge, where it was centrifuged at a speed of 4000 rpm for 10 min. After centrifugation, the filtrate was obtained by filtering through a 0.45 μm water-based filter membrane to remove impurities; this filtrate was used for water chemical testing [18]. All glassware used in the experiment was first acid-treated, rinsed with pure water, and air-dried. To achieve the research objectives, four combinations of experiments were conducted. The control experiment combinations and control conditions are shown in Table S4. In each group, 13 conical flasks were used for testing the groundwater samples, equivalent to 13 sampling times, with sampling times at 10 and 30 min and 1, 2, 4, 6, 8, 10, 14, 18, 24, 48, and 72 h. To ensure data quality, parallel sampling was conducted at each sampling point.
To identify the changes in concentration of each component during the experiment, we monitored the concentrations of various components in the leachate at specific times during the experiment [24]. Immediately after sampling, the experimental effluent samples were subjected to water chemical testing. Because of the physicochemical changes that might occur in the leaching experiment, the detection indicators and methods were consistent with the 17 detection indicators in the original water [31]. All analysis procedures fulfilled the quality requirements, with a test conducted for every 26 samples. The error of the indicative standard sample was less than 5%, and the qualification rate was 100%.

3. Results

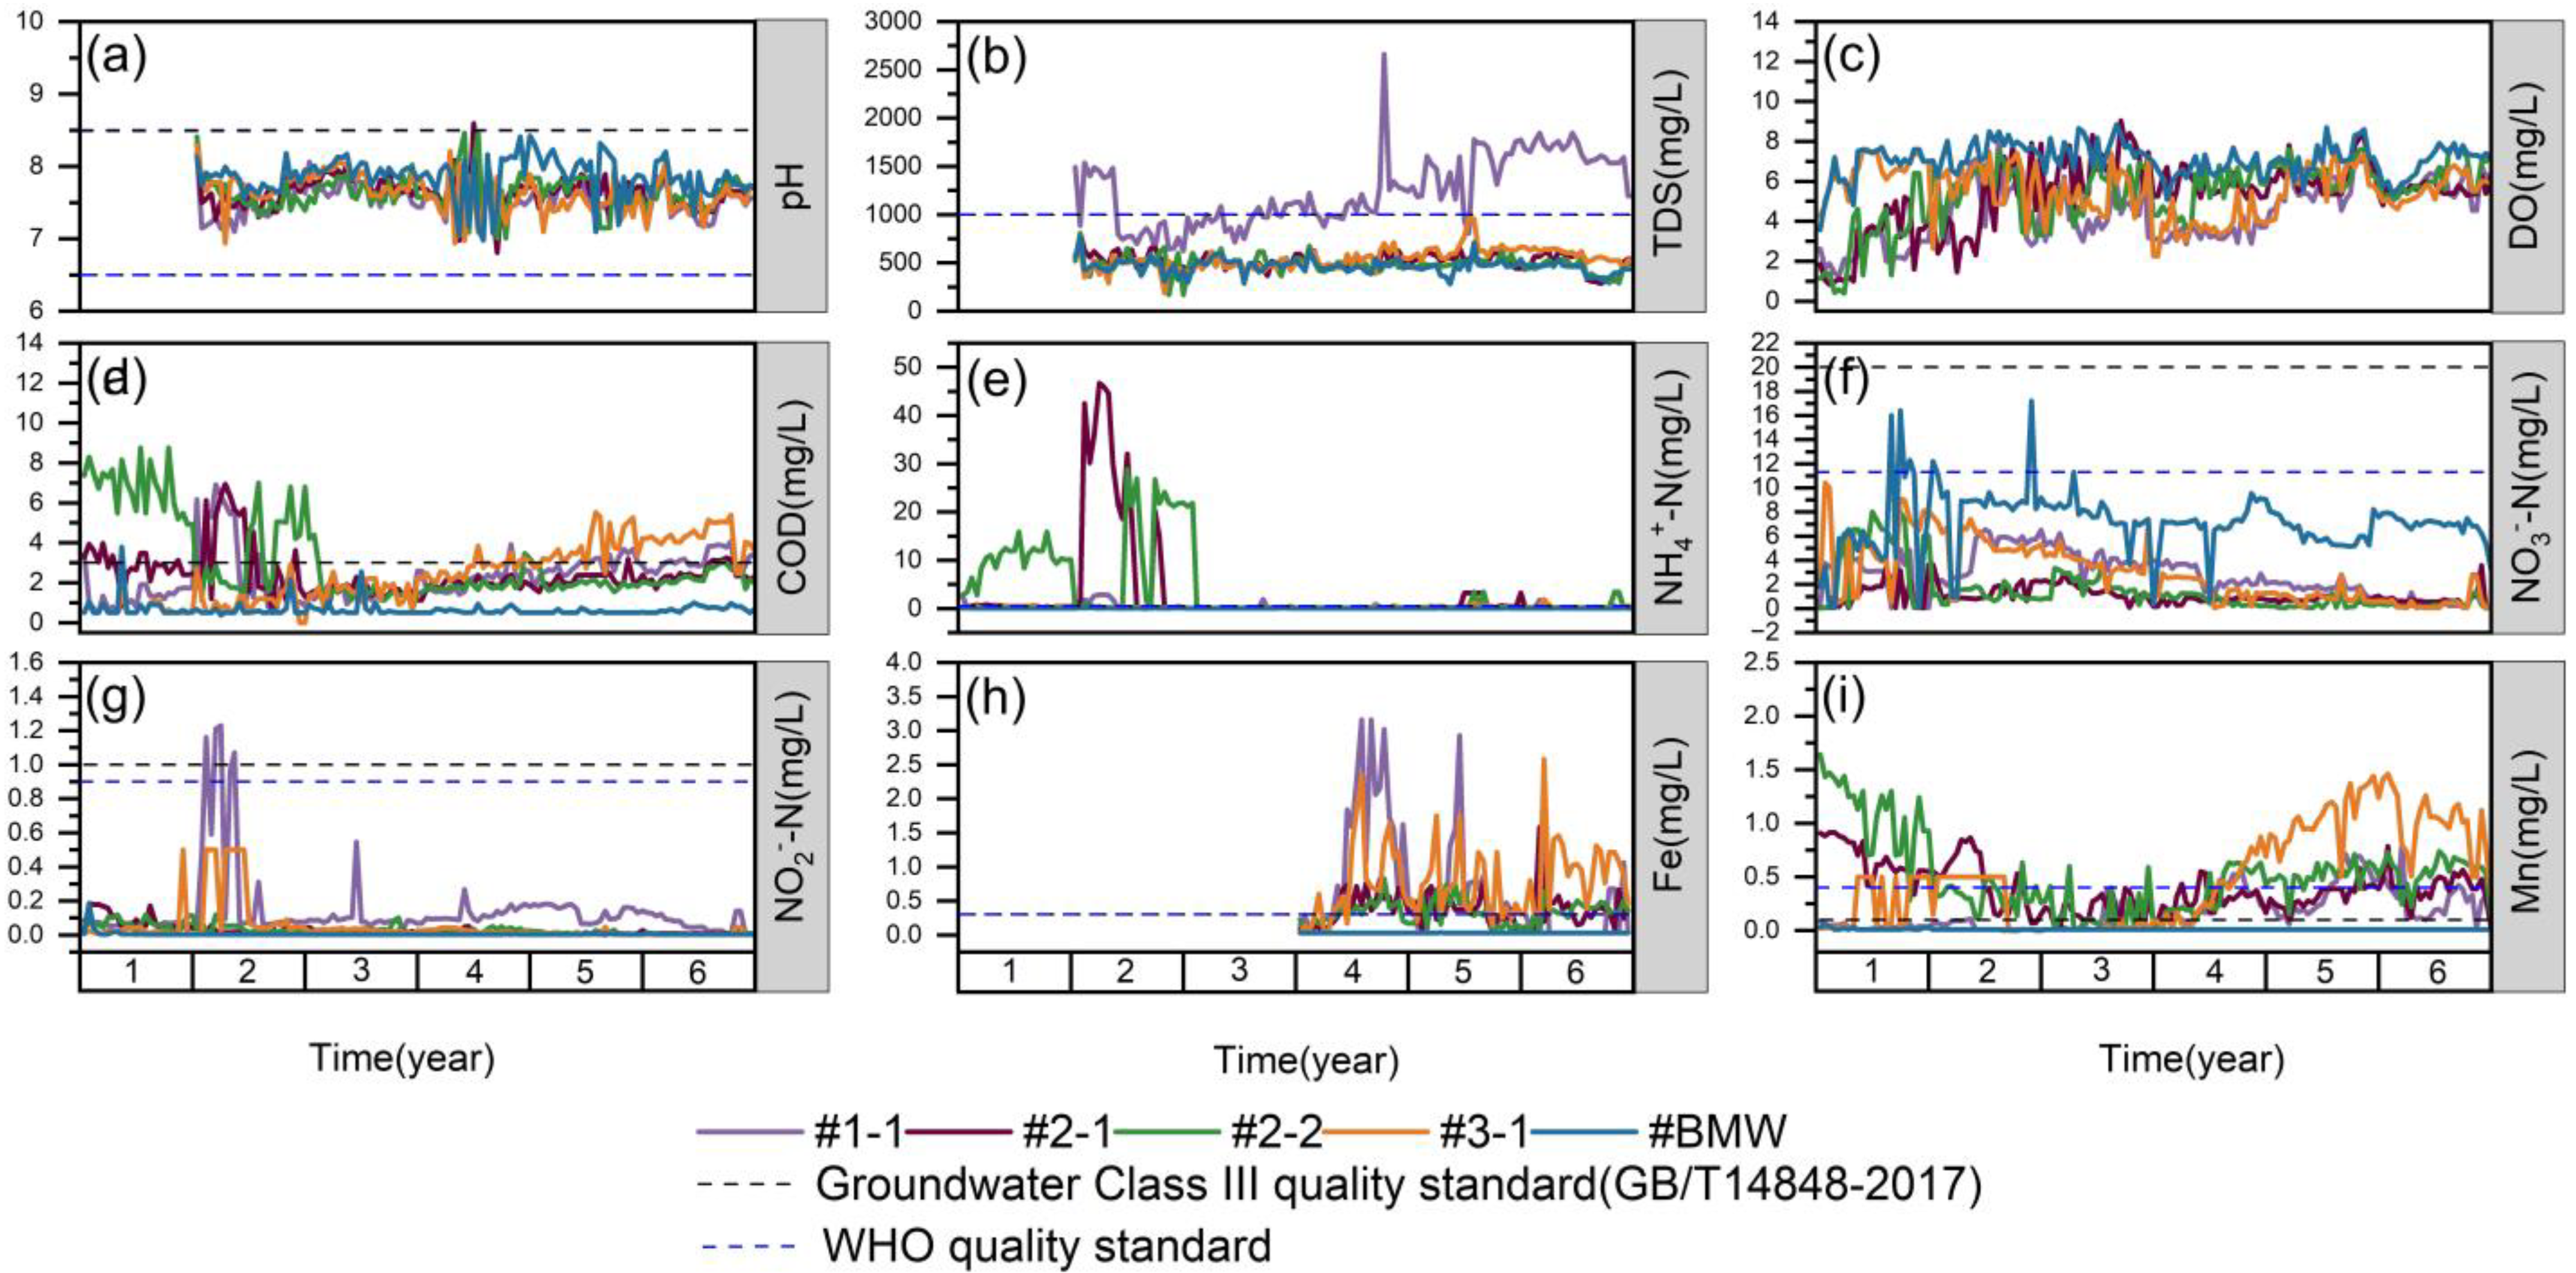
3.1. Variations in the Concentrations of Nitrogen

The initial concentration of NH4+ in rainwater was 2.64 mg/L (Table S2). Under the leaching action of rainwater, the concentration of NH4+ in the leachate from the contaminated site samples increased. The rate of increase was initially rapid but plateaued after reaching a certain concentration, indicating a saturated leaching state, and the NH4+ concentration in the leachate reached 6.37 ± 0.11 mg/L by the end of leaching. In contrast, the NH4+ concentration in the leachate from the background site samples remained stable throughout the leaching process, showing no significant changes (Figure 2a). The initial NH4+ concentration in the wastewater was 86.2 mg/L (Table S2), and the concentration in the leachate from the contaminated site samples exhibited a trend of initially increasing, then decreasing, and increasing again. Throughout the leaching period, the concentration of the leachate was mostly slightly higher than the initial concentration, reaching 89.58 ± 0.44 mg/L at the end of leaching. The concentration of NH4+ in the leachate from the background soil layers showed a fluctuating downward trend. It decreased rapidly in the early stages of leaching, continued to fluctuate until it stabilized, and the overall concentration of NH4+ in the leachate was lower than the initial concentration, concluding at 79.9 ± 2.50 mg/L at the end of leaching (Figure 2b).
The initial concentration of NO3 in rainwater was 1.15 mg/L (Table S2). Leaching by rainwater significantly increased the concentration of NO3 in the leachate from contaminated site samples, with a substantial rise in the early phase of leaching. As time progressed, the concentration fluctuated within a certain range before eventually stabilizing. In contrast, the increase in NO3 concentration in the leachate from the background site samples was minimal, maintaining a stable range between 2 and 2.5 mg/L (Figure 2c). The initial concentration of NO3 in wastewater was 2.01 mg/L (Table S2). During the leaching period, the concentration of NO3 in the leachate from contaminated site samples rose significantly, whereas the leaching effect in the background site samples was not pronounced. The concentration of NO3 in the leachate from the contaminated soil layers fluctuated and overall increased, reaching 20.71 ± 3.31 mg/L by the end of leaching. In the leachate from the background soil layers, the concentration of NO3 initially rose slightly and then remained stable, concluding at 3.20 ± 0.19 mg/L at the end of leaching (Figure 2d).

3.2. Variations in the Concentrations of pH/Ca/Mg

The pH of the rainwater was 7.2 (Table S2). When leaching through the contaminated site samples, the pH initially fluctuated significantly before gradually rising to a stable equilibrium of 7.82 ± 0.13. The pH trend during leaching at the background site samples was similar to that of the contaminated site samples, but the overall pH was higher, stabilizing at 7.93 ± 0.11 (Figure 3a). The pH of the wastewater was 6.8 (Table S2), showing a similar pattern during leaching through the contaminated site samples: an initial significant fluctuation followed by a gradual rise to a stable equilibrium of 7.53 ± 0.07. The pH trend during leaching at the background site samples paralleled that of the contaminated site samples, albeit slightly higher, stabilizing at 7.75 ± 0.06 (Figure 3b).
The initial concentration of Ca2+ in rainwater was 2.98 mg/L (Table S2). During leaching through the wastewater medium, there was a significant initial increase followed by a slow rise, reaching a steady equilibrium concentration of 55.33 ± 1.87 mg/L. In the background medium, the initial increase was significant, followed by fluctuating rises, and after 24 h, a slow upward trend led to a steady equilibrium of 38.16 ± 13.27 mg/L (Figure 3c). The initial Ca2+ concentration in wastewater was 33.25 mg/L (Table S2). Vigorous agitation resulted in substantial leaching of Ca2+ from the soil; during leaching through the contaminated medium, the concentration significantly increased within the first 30 min, slightly decreased thereafter, and then rose again to reach a stable equilibrium at 178.52 ± 3.23 mg/L. During leaching through the background medium, the concentration significantly increased in the first 30 min, fluctuated downward, rose again, and then slowly declined over 48 h, settling at 158.25 ± 2.71 mg/L at the end of leaching (Figure 3d).
The initial concentration of Mg2+ was 0.33 mg/L in rainwater (Table S2). As leaching progressed, the concentration of Mg2+ in the leachate from both contaminated and background site samples continuously increased. At the end of the experiment, the concentrations of Mg2+ in the leachate from the contaminated and background site samples were 5.00 ± 0.80 mg/L and 10.02 ± 1.32 mg/L, respectively (Figure 3e). The initial Mg2+ concentration in wastewater was 24.63 mg/L (Table S2). During the reaction, the concentration of Mg2+ precipitated at the background site samples was higher than at the contaminated site samples. During leaching through the contaminated site samples, there was an initial rise followed by a decrease, then a slow rise after 12 h to reach equilibrium at 27.04 ± 0.05 mg/L. During leaching through the background site samples, the concentration first rose then fell within the first 6 h, fluctuated between 6 and 12 h, then slowly rose and stabilized after 48 h at an equilibrium of 37.80 ± 1.74 mg/L (Figure 3f).

3.3. Variations in the Concentrations of Mn/Fe

In rainwater, both Fe and Mn were below the detection limit (Table S2). During the leaching period, occasional detections of Mn and Fe were observed in the leachate from the background soil layers, but the concentrations were very low, with Mn reaching a maximum concentration of 0.007 ± 0.001 mg/L and Fe peaking at 0.0076 ± 0.003 mg/L. In the leachate from the contaminated soil layers, the concentration of Fe was also low, with a maximum of 0.005 ± 0.002 mg/L. The concentration of Mn was slightly higher than in the leachate from the background site samples and slowly increased over the duration of the leaching process, reaching a concentration of 0.13 ± 0.01 mg/L by the end of leaching (Figure 4).
Mn and Fe concentrations in wastewater were very low, only slightly above their respective detection limits (Table S2). Observations during the leaching period showed a clear increase in the concentrations of Mn and Fe in the leachate (Figure 4). The concentration of Mn in the leachate displayed a rapid increase followed by a fluctuating decrease, ultimately reaching a steady state. The concentration of Mn in the leachate was consistently higher than that from rainwater leaching, with a more noticeable increase compared to Fe. The equilibrium concentrations of Mn in the leachate from the contaminated site samples and background site samples were 0.66 ± 0.06 mg/L and 0.22 ± 0.02 mg/L, respectively. The concentration of Fe in the leachate continued to fluctuate and increase, with the Fe concentration in leachates from all soil layers under wastewater leaching being higher than those from rainwater leaching. The equilibrium concentrations of Fe in the leachate from the contaminated site samples and background site samples were 0.016 ± 0.01 mg/L and 0.07 ± 0.003 mg/L, respectively (Figure 4).

4. Discussion

4.1. Enrichment of the Secondary NO3 in Oxidation Zone

During the vertical filtration of surface sewage into aquifers, the initial oxidative source water gradually transitions to a reducing state, forming distinct oxidative and reductive zones [9]. The reduction intensity of O2 and NO3 directly governs the spatial variations between the oxidative and reductive zones. In the natural vertical filtration process of rainwater, the NO3 content in source water and groundwater is low, with NH4+ in strongly reducing groundwater being the primary inorganic nitrogen form [32]. In the case of sewage with a tendency toward oxidation, the substantial presence of NH4+ is attributed to its elevated concentration. Within the oxidative-reductive gradient formed during vertical infiltration, under conditions of oxygen richness and high microbial abundance [33], NH4+ undergoes nitrification to produce NO3, as described by Equation (1).
2NH4+ +5O2 − 2NO3 + 4H2O
NH4+ exhibits strong adsorption characteristics, with a sandstone adsorption capacity (Kd) ranging from 3 to 8 L/kg, reaching adsorption equilibrium within 4–8 h [34,35]. It undergoes significant adsorption during the vertical filtration process. In this experiment, the experimental medium had undergone prolonged percolation filtration (Figure 2b). The concentrations of NH4+ in the original water of rain and sewage were 2.639 mg/L and 86.203 mg/L, respectively. Within the 4 h adsorption equilibrium period identified by Chen et al. (2023) [33] the leachate NH4+ peak concentrations in the rainwater filtration background medium experimental group and the sewage filtration polluted medium experimental group were (1.97 ± 0.01 mg/L) and (85.86 ± 2.16 mg/L), respectively. These values closely resembled the corresponding original water concentrations, indicating that the experimental medium, under the prolonged influence of rainwater and sewage filtration, had reached thermodynamic adsorption equilibrium for NH4+, rendering the NH4+ adsorption effect negligible.
The concentrations of NO3 in the original water of rain and sewage were 1.148 mg/L and 2.014 mg/L, respectively (Figure 2c,d). Between 30 and 72 h, the variations in NO3 concentrations were minimal, stabilizing at 20.56 ± 3.31 mg/L and 84.51 ± 2.15 mg/L, respectively. At this point, in the background medium experimental group, the NO3 concentrations were significantly lower than those in the polluted medium experimental group (Figure 2), suggesting the presence of active nitrogen biogeochemical processes [19]. In the polluted medium experimental group during sewage filtration NH4+ content decreased by 5.40 ± 2.16 mg/L within 6 h, and NO3 concentration steadily increased by 4.79 ± 1.46 mg/L (Figure 2b). During this initial period of filtration, the environment was oxidative, characterized by abundant COD and O2 levels, promoting nitrification. However, a consistent trend was observed in the rainwater filtration polluted medium experimental group (Figure 2a,c). The rainwater source water was characterized by no microbial populations, carbon sources, and NH4+, the variation range of NH4+ and NO3 in rainwater filtration experiments were lower than those observed in sewage filtration experiments, showing that sewage infiltration increased the intensity of nitrification in groundwater compared with rainwater infiltration. Chen et al. (2023) [33] mentioned that nitrification is a first-order kinetic reaction, and its rate is controlled by the concentration of the reactant NH4+. The experiments demonstrate that, within the initial 6 h of the sewage filtration, a portion of the high concentration of NH4+ rapidly transforms into a considerable amount of secondary pollutant NO3.

4.2. Acid Environment Controlled by Rapid Reduction

During rainwater filtration, rapid reduction of O2 and NO3 coupled with the swift production of CO2 from organic carbon results in an excess of CO2 dissolved in water. Abedi Koupai et al. (2020) [36] and Chen et al. (2023) [33] inferred that this result promotes the movement of carbonic acid balance in water, producing a certain amount of H+ and altering groundwater acidity. The impact of this acidity changes on the dissolution equilibrium of carbonate minerals, as shown in Equations (2) and (3), is limited [37,38]. However, there is a substantial presence of O2, secondary pollutant NO3, and carbon source COD in the process of vertical filtration of surface sewage. A study by Zhai et al. (2021) [18] on centralized sewage treatment has demonstrated that the rapid reduction in a large amount of NO3 promptly produces H+, significantly altering the acidity of the groundwater environment.
Calcite dissolution: CaCO3(s) + H+ − Ca2+ + HCO3
Dolomite dissolution: CaMg(CO3)2 + 2H+ − Ca2+ + Mg2+ + 2HCO3
The generation and consumption of H+ occur simultaneously during filtration, which makes the direct correlation of pH to nitrate reduction less apparent. However, changes in the concentrations of Ca2+ and Mg2+ can serve as indicators of acid-driven processes [19,39]. In the polluted medium experimental group during sewage filtration, as shown in Figure 3b, the pH value increased from the initial 6.88 ± 0.03 to 6.91 ± 0.01 within 6 h. From 6 to 72 h, the pH gradually decreased and stabilized at the initial level. The concentrations of Ca2+ and Mg2+, 33.253 mg/L and 24.63 mg/L in the original water, increased to 185.92 ± 3.59 mg/L and 27.26 ± 0.12 mg/L within 6 h and gradually decreased to the initial level from 6 to 72 h, respectively. The rapid changes in Ca2+ and Mg2+ concentrations indicate the high activity of H+. Within 6–12 h after sewage filtration, the reduction of O2 and secondary pollutant NO3 generates a large amount of H+, promoting the dissolution of calcite and dolomite, resulting in increased Ca2+ and Mg2+. In the subsequent 6–12 h, the intensity of redox reactions decreased; the consumption of H+ exceeded the generation; excess Ca2+ and Mg2+ shifted the balance to the left; and the Ca2+ and Mg2+ concentrations and pH returned to the initial state. This acidification, induced by the reduction of NO3 and CO2 production, affects the nitrate reduction process. The presence of excess H+ accelerates the denitrification and DNRA processes, influencing the pathways and rates of nitrogen transformation. Specifically, the acidic conditions promote heterotrophic denitrification, where NO3 is reduced to N2, and also facilitate DNRA, where NO3 is reduced to NH4+. Therefore, the pH changes are indirectly linked to enhanced nitrate reduction, with acidic conditions promoting both the conversion of NO3 to N2 and NH4+. This process obviously influence the acid environment during sewage vertical filtration, compared to that of the rainwater vertical filtration.

4.3. Response of Mn Mineral Release to Acid Condition

The release of Mn2+ and Fe2+ in groundwater primarily occurs because of the reductive dissolution of Mn(IV)/Fe(III) minerals and the acidic dissolution of Mn(II) minerals in the medium [40]. In the background medium during rainwater vertical infiltration, the release of Mn and Fe is dominated by reductive dissolution, as represented in Equations (4) and (5) [41,42]. However, sewage vertical filtration in an environment with significant production of H+ from the rapid reduction in secondary NO3 promotes the dissolution of MnCO3 minerals.
Mn(IV) reduction: MnO2 + CH2O + 4H+ − 2Mn2+ + CO2 + 3H2O
Fe(III) reduction: Fe(OH)3 + CH2O + 8H+ − 4Fe2+ + CO2 + 11H2O
Mn(II) acid dissolution: MnCO3(s) + H+ − Mn2+ + HCO3
The intensity of Mn(IV) and Fe(III) reduction differs between rainwater and sewage filtration. The initial concentrations of Mn2+ and Fe2+ in rainwater and sewage source water are below 0.001 mg/L (Table S2). After reaching stability in rainwater filtration, Mn2+ concentrations in the leachate of the background and polluted medium experimental groups are 0.077 ± 0.01 mg/L and 0.436 ± 0.001 mg/L, respectively (Figure 4a,b), the Fe2+ concentrations are 0.003 ± 0.00 mg/L and 0.003 ± 0.001 mg/L, respectively (Figure 4c,d). In sewage filtration, after reaching stability, the Mn2+ concentrations in the leachate of the background and polluted medium are 0.22 ± 0.06 mg/L and 0.65 ± 0.02 mg/L, respectively (Figure 4a,b), and the Fe2+ concentrations are 0.006 ± 0.01 mg/L and 0.0016 ± 0.002 mg/L, respectively (Figure 4c,d), both lower than that of the rainwater filtration process. As a result of the absence of a carbon source in rainwater filtration process, only a small amount of Mn2+ and Fe2+ is generated. The sewage carries a significant amount of COD, promoting the reduction in Mn/Fe minerals.
In sewage vertical infiltration, in the background and polluted mediums, the activity of Mn(II) mineral acid dissolution is strong. As shown in Figure 4b, Mn2+ concentrations exhibit two peaks in both experimental groups at 0–6 h and 6–30 h. The first peak of Mn2+ is affected by pH, per the correlation heat map of water quality parameters in the pollution monitoring wells in Figure 5. There is a significant negative correlation between pH and Mn [20]. The pH dominance map of Mn is consistent, with Mn mainly distributed when pH < 8.0 (Figure 6). The rapid reduction in secondary NO3, generating H+, promotes the acidic dissolution of MnCO3 minerals [27,29]. In the 6–30 h period (Figure 4b), the second peak of Mn2+ occurs as the reduction intensity of NO3 gradually decreases. Reductive dissolution of Mn(IV) occurs, and with the increasing reductive capacity, Fe2+ peaks between 12 and 30 h (Figure 4d), indicating the reduction in Fe(III) [5].

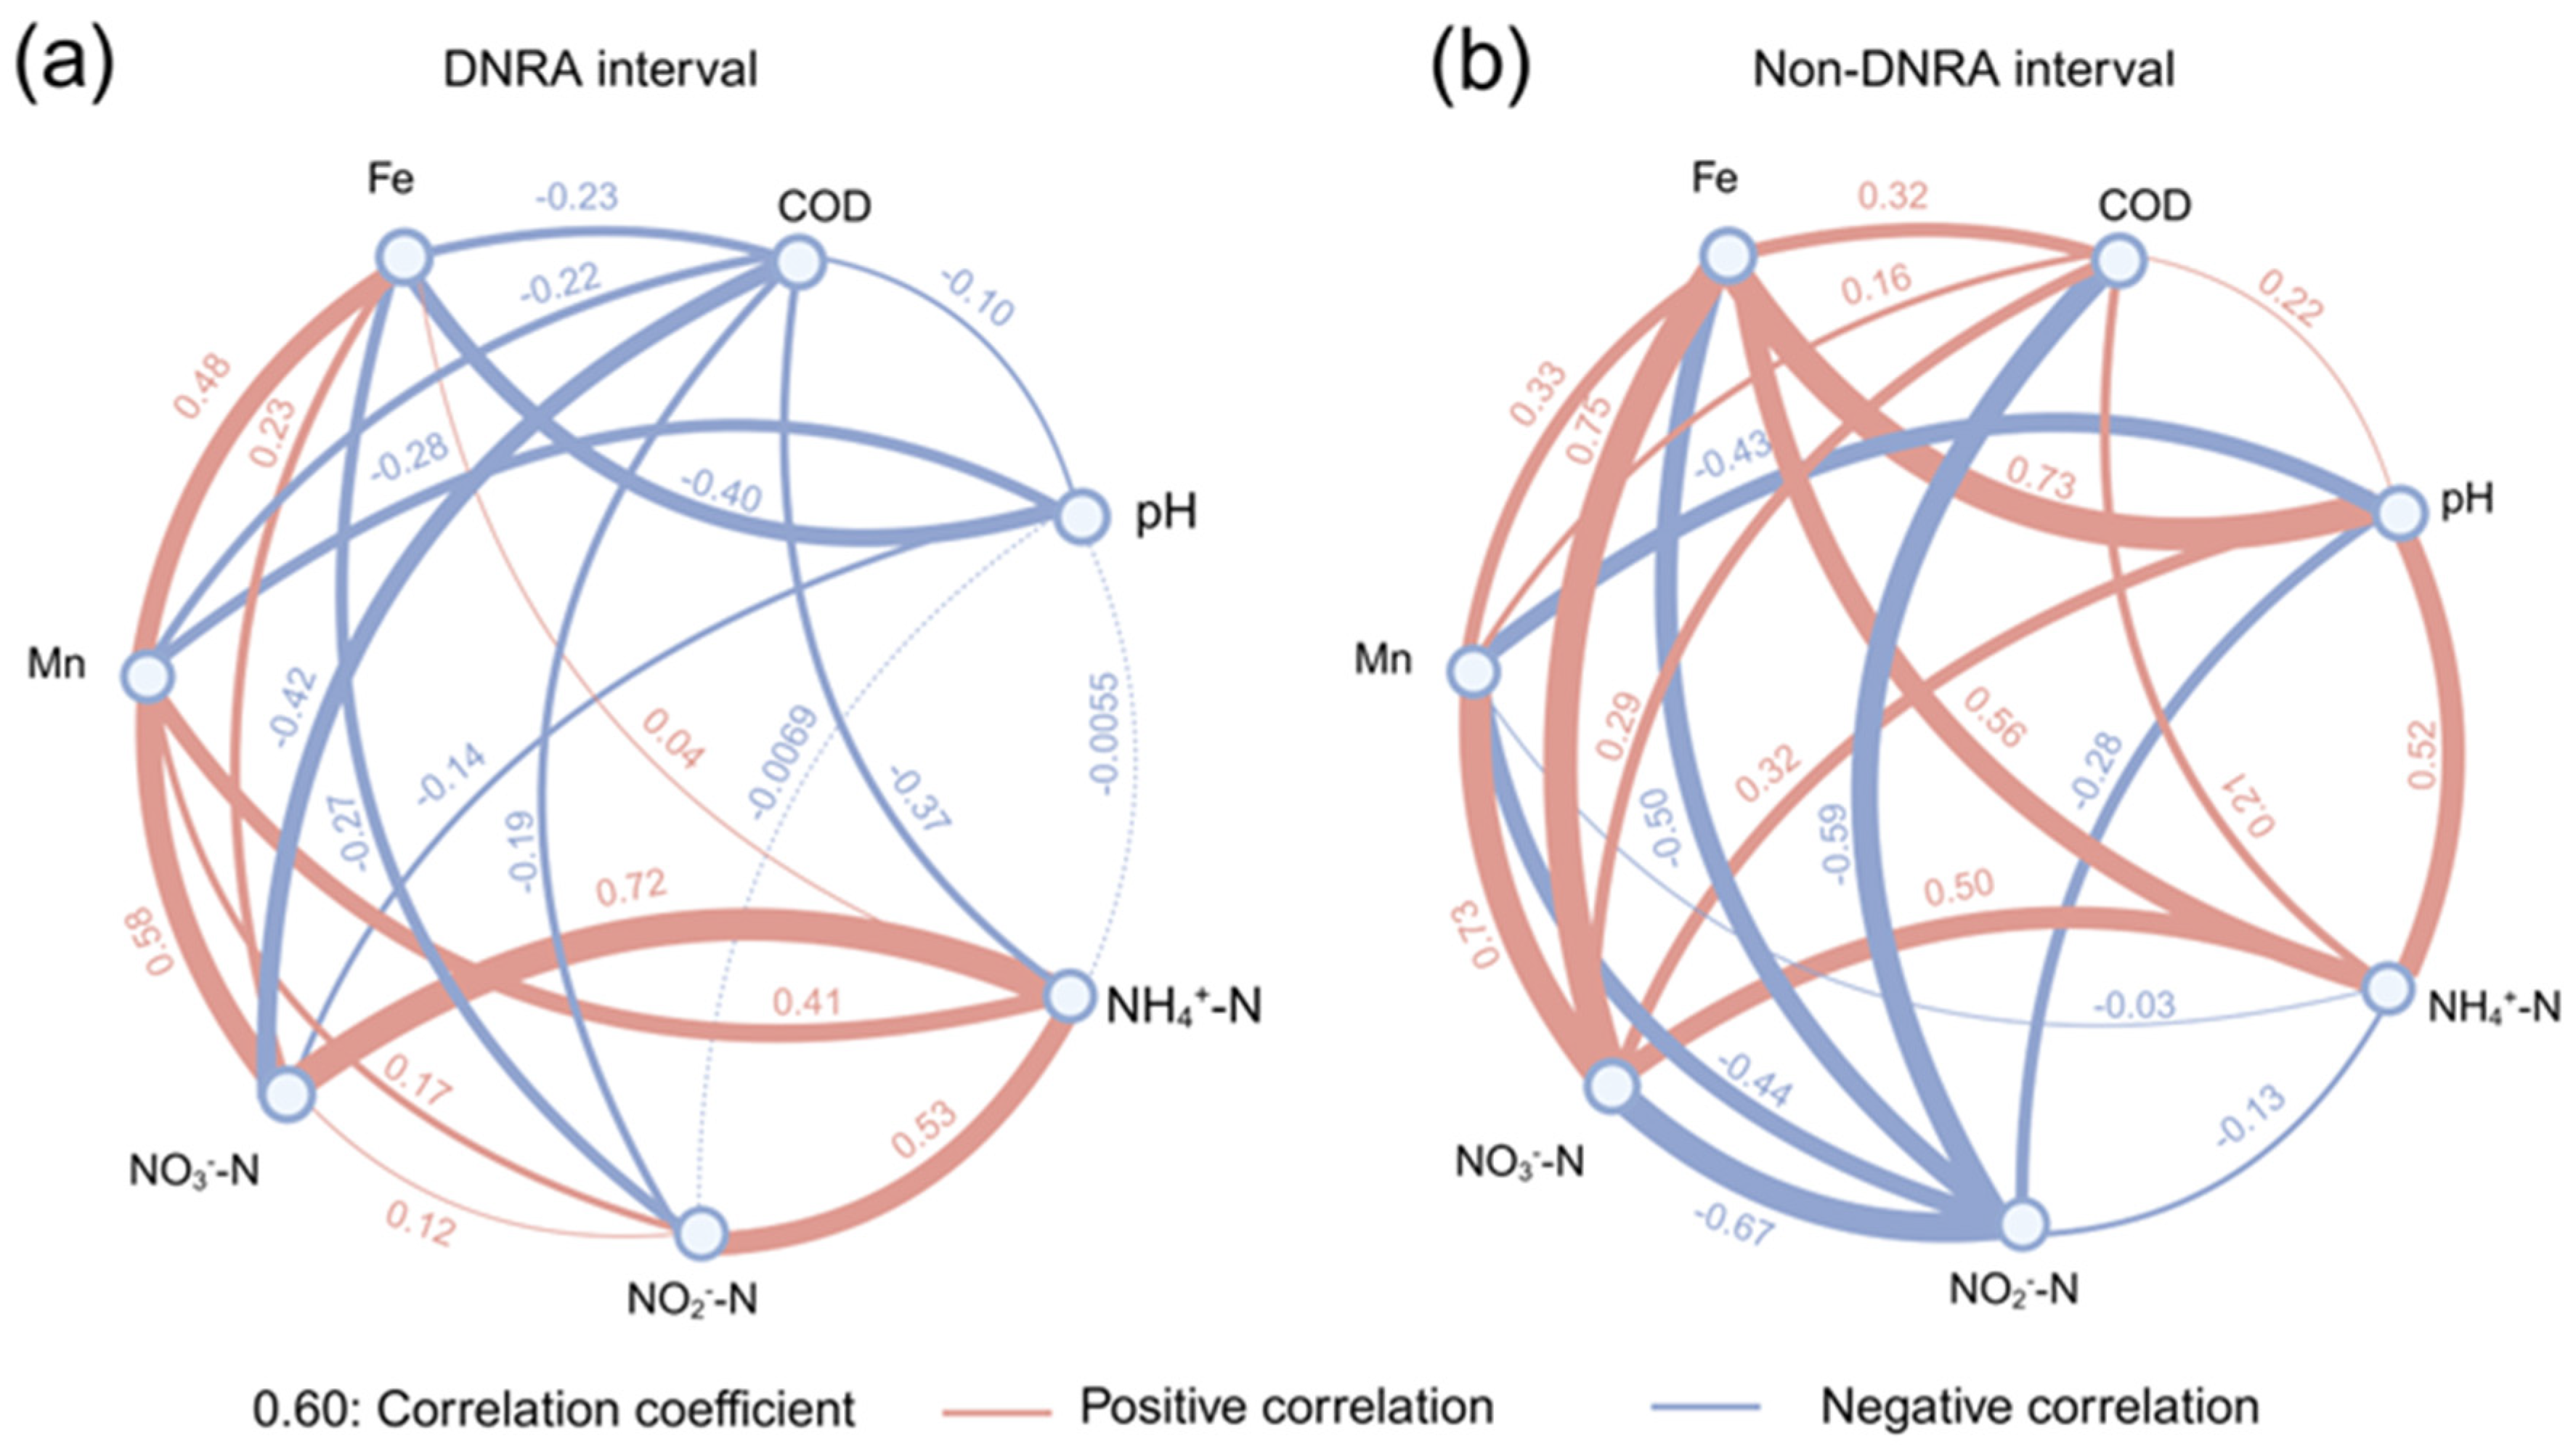
4.4. Active DNRA in High Carbon Load and Mn2+ Condition

Under natural conditions, denitrification is the primary process responsible for NO3 reduction (Equation (7)), resulting in the removal of N2 from groundwater [18,43]. However, in a strongly reducing environment [19], under conditions of high carbon load [35,44], and elevated concentrations of Mn2+/Fe2+/HS ions [14], the reduction of NO3 is more likely to favor DNRA (Equations (8) and (9)) than denitrification. The active DNRA process generates substantial NH4+, retaining nitrogen in groundwater [28,45]. Although DNRA is rare under natural conditions, it is observed in studies by Li et al. (2023) [46], Dippong et al. (2018) [47], Du et al. (2020) [48], and Abiriga et al. (2021) [6]. It is related to sewage treatment plants and is likely to occur during the continuous vertical filtration of sewage.
Denitrification: 4NO3 + 5CH2O + 4H+ ⟶ 5CO2(g) + 2N2(g) + 7H2O
Heterotrophic DNRA: NO3 + 2CH2O + 2H+ ⟶ 2CO2(g) + NH4+ + H2O
Autotrophic DNRA: NO3 + 3Mn2 + +3H2O ⟶ 3MnO2 + NH4+ + 2H+
The complex carbon load, high H+, and high Mn2+ environment resulting from vertical filtration enhance the activity of DNRA. In the polluted medium’s experimental group for sewage infiltration, within the 6–30 h interval, NH4+ content increases from 84.11 ± 2.16 to 87.90 ± 0.44 mg/L, and NO3 content decreases from 23.75 ± 0.46 to 17.34 ± 0.63 mg/L (Figure 2b,d). The increase in NH4+ (4.51%) is smaller than the decrease in NO3 (22.0%), indicating that denitrification is the primary process for nitrate removal, as a significant portion of NO3 undergoes denitrification, being reduced to N2 and escaping into the air. Although DNRA also contributes to the reduction process, converting a portion of NO3 back to NH4+ and retaining it in the groundwater, the data suggests that denitrification plays a more dominant role in nitrate attenuation during sewage infiltration due to the presence of higher COD and microbial activity levels that favor denitrification kinetics. However, during rainwater filtration, the changes in NH4+ and NO3 concentrations are significantly smaller than in the sewage filtration experiment (Figure 2a,b), and there is no upward trend in NH4+ within the 6–30 h interval, indicating the absence of DNRA. Moreover, NH4+ shows a positive correlation with NO2 during the DNRA interval (Figure 5a) than that of the non-DNRA interval (Figure 5b), where the active NO2 is an important symbol of DNRA [33,49]. As denitrification follows first-order kinetics, influenced by reactant concentrations, and DNRA follows zero-order kinetics and is not affected by reactant concentrations [15,16,44], the sewage vertical infiltration enhances the strength of denitrification, increasing the contribution of DNRA to NO3 reduction.
The Gibbs free energy of aerobic respiration and denitrification is −125.1 and −118.8 KJ/eq, respectively, higher than the energy of DNRA and Mn(IV) reduction (−84.8 and −81.8 KJ/eq, respectively) and far exceeding the energy of Fe(III) (−28.9 KJ/eq) [50,51]. In the process of vertical filtration under natural conditions, heterotrophic DNRA with carbon as the electron donor is not active. At the same time, NO3 in the oxidizing environment and Mn2+ in the reducing environment have difficult coexisting in a unified environment, so autotrophic DNRA is not easy to occur [19,33]. However, in high COD sewage vertical filtration, a high carbon load environment is formed [28], which can act as an electron donor [52,53]. During the DNRA interval, NH4+ shows a negative correlation with pH and COD, whereas they show a positive correlation during the non-DNRA interval, showing the impact of H+ and COD on the activity of DNRA (Figure 5). In summary, in the high NH4+ and COD sewage vertical filtration, a large amount of secondary NO3 is generated. The rapid reduction in secondary NO3 produces substantial CO2, increasing H+ levels and causing the acidic dissolution of MnCO3. This process releases Mn2+, which then acts as an electron donor for further reduction of NO3. The high carbon load and high Mn2+ condition create a favorable condition for DNRA to produce NH4+.

4.5. Novelty, Future Work and Practical Implication

In conclusion, this study unveils several novel insights into the hydrobiogeochemical processes affecting groundwater quality under the influence of polygenic multipollutants. Firstly, it highlights how sewage infiltration introduces substances such as NH4+ and COD, which significantly threaten groundwater integrity by facilitating the formation of secondary pollutants like NO3, Mn2+, and Fe2+. Furthermore, the study delineates the interconnected biochemical chain reactions initiated by sewage infiltration—nitrification, denitrification, and dissimilatory nitrate reduction to ammonium (DNRA)—which notably convert part of the secondary NO3 back into NH4+ in groundwater, differing significantly from natural rainwater infiltration processes. This research also establishes that sewage infiltration intensifies sequential redox reactions, which not only shift the redox potential but also create the acidic conditions necessary for the dissolution of Mn(II). These findings not only contribute new knowledge to our understanding of groundwater pollution dynamics but also have practical implications for the development of more effective groundwater management and remediation strategies. This experiment has demonstrated the existence of the DNRA process, in which carbon sources and Mn2+ can be electron donors for DNRA. The ratio of their contributions deserves further exploration and is a promising topic for future research. Such studies can aid groundwater management by identifying key hydrobiogeochemical processes that influence the dynamics of polygenic multipollutants, allowing for targeted remediation strategies. By understanding the interactions between polygenic multipollutants and aquifer conditions, water management authorities can develop more effective policies and practices to mitigate pollution impacts. Additionally, this research can inform the design of natural attenuation and engineered remediation solutions to enhance groundwater quality and protect water resources [54,55].

5. Conclusions

The biogeochemical processes associated with the vertical infiltration of polygenic multipollutants are crucial for understanding the migration and transformation of pollutants, and they hold significant importance for safeguarding groundwater safety and ecological environment protection. Based on field pollution conditions, field media samples were collected, and laboratory experiments were conducted to identify the main biogeochemical processes of polygenic multipollutants and their secondary pollutants. The results indicated that during the early stage of sewage vertical infiltration in oxidative groundwater, the sewage, carrying a large number of NH4+, was oxidized to generate the secondary pollutant NO3. As O2 was consumed, transforming the groundwater environment into a reducing environment, the secondary pollutants NO3, Mn(IV), and Fe(III) minerals were sequentially reduced, producing N2, NH4+, Fe2+, and Mn2+. Different from rainwater vertical infiltration conditions, sewage vertical infiltration provided many reactive components, leading to a significant increase in the reaction rates and intensities of various reactions during sewage vertical infiltration. In the sewage vertical infiltration process, the high-intensity reactions involving O2 and secondary pollutant NO3 reduction rapidly generated a large amount of CO2. Excess CO2 dissolved to produce a large amount of H+, facilitating the acidic dissolution of Mn(II) minerals, leading to the generation of Mn2+. In the studied spatial range, the groundwater had a suitable energy level for DNRA. The environment characterized by high carbon load and high Mn2+ promoted DNRA, which had a higher contribution than denitrification to NO3 reduction. Although a portion of the NO3 produced from the conversion of NH4+ in the source pollutants was removed through denitrification, DNRA resulted in the re-reduction of NO3 to NH4+, leading to its retention in groundwater. These findings provide valuable insights for planning strategies for local groundwater management and remediation.

Supplementary Materials

The following supporting information can be downloaded at https://www.mdpi.com/article/10.3390/w16162305/s1. Table S1: Physical and chemical properties of the aquifer sediments used for the experiment. Each value represented as mean ± SD, samples size (n = 4), * p < 0.05. Table S2: Initial concentration of each index in raw water. Table S3: Methods for determining the physicochemical properties of the sediment and the detection limits. Table S4: Control experimental group and control conditions. Figure S1: Overview map of the study area, including three polluted sites (#1, #2, #3) and four monitoring wells (#1-1, #2-1, #2-2, #3-1): modifications of those reported by Zhai et al. (2022). Figure S2: Percentage diagram of mineral content in sediments. Figure S3: Schematic diagram of the leaching experiment.

Author Contributions

Conceptualization, Y.Z.; methodology, Y.D. and Y.H.; software, Y.D.; validation, Y.D.; writing—original draft preparation, Y.D. and Y.H.; writing—review and editing, X.H., Y.C. and Y.Z.; supervision, Y.C. and Y.Z.; project administration, Y.Z.; funding acquisition, Y.Z. All authors have read and agreed to the published version of the manuscript.

Funding

This work was supported by the National Natural Science Foundation of China (Nos. 42077170 and 42377052).

Data Availability Statement

Data are contained within the article.

Conflicts of Interest

The authors declare no conflicts of interest.

References

  1. Kabir, M.M.; Akter, S.; Ahmed, F.T.; Mohinuzzaman, M.; Didar-ul-Alam, M.; Mostofa, K.M.G.; Islam, A.R.M.T.; Niloy, N.M. Salinity-induced fluorescent dissolved organic matter influence co-contamination, quality and risk to human health of tube well water, southeast coastal Bangladesh. Chemosphere 2021, 275, 130053. [Google Scholar] [CrossRef] [PubMed]
  2. Osafo, N.O.-A.; Jan, J.; Porcal, P.; Borovec, J. Contrasting catchment soil pH and Fe concentrations influence DOM distribution and nutrient dynamics in freshwater systems. Sci. Total Environ. 2023, 858, 159988. [Google Scholar] [CrossRef]
  3. Jang, C.-S.; Chen, J.-S.; Lin, Y.-B.; Liu, C.-W. Characterizing hydrochemical properties of springs in Taiwan based on their geological origins. Environ. Monit. Assess. 2012, 184, 63–75. [Google Scholar] [CrossRef]
  4. Yang, F.; Yue, S.; Wu, X.; Zhang, C.; Li, D.; Zhu, R. Effects of flood inundation on biogeochemical processes in groundwater during riverbank filtration. J. Hydrol. 2023, 617, 129101. [Google Scholar] [CrossRef]
  5. Ahmad, H.A.; Ahmad, S.; Gao, L.; Wang, Z.; El-Baz, A.; Ni, S.-Q. Energy-efficient and carbon neutral anammox-based nitrogen removal by coupling with nitrate reduction pathways: A review. Sci. Total Environ. 2023, 889, 164213. [Google Scholar] [CrossRef] [PubMed]
  6. Abiriga, D.; Vestgarden, L.S.; Klempe, H. Long-term redox conditions in a landfill-leachate-contaminated groundwater. Sci. Total Environ. 2021, 755, 143725. [Google Scholar] [CrossRef] [PubMed]
  7. Abdullah, T.O.; Ali, S.S.; Al-Ansari, N.A.; Knutsson, S. Hydrogeochemical Evaluation of Groundwater and Its Suitability for Domestic Uses in Halabja Saidsadiq Basin, Iraq. Water 2019, 11, 690. [Google Scholar] [CrossRef]
  8. Wang, H.; Lu, K.; Shen, C.; Song, X.; Hu, B.; Liu, G. Human health risk assessment of groundwater nitrate at a two geomorphic units transition zone in northern China. J. Environ. Sci. 2021, 110, 38–47. [Google Scholar] [CrossRef]
  9. Li, X.; Huang, Y.; Liu, H.; Wu, C.; Bi, W.; Yuan, Y.; Liu, X. Simultaneous Fe(III) reduction and ammonia oxidation process in Anammox sludge. J. Environ. Sci. 2018, 64, 42–50. [Google Scholar] [CrossRef]
  10. Zhai, Y.; Han, Y.; Lu, H.; Du, Q.; Xia, X.; Teng, Y.; Zuo, R.; Wang, J. Interactions between anthropogenic pollutants (biodegradable organic nitrogen and ammonia) and the primary hydrogeochemical component Mn in groundwater: Evidence from three polluted sites. Sci. Total Environ. 2022, 808, 152162. [Google Scholar] [CrossRef]
  11. Zhao, M.; Jiang, Y.; Jia, Y.; Lian, X.; Feng, F.; Shang, C.; Zang, Y.; Xi, B. Anthropogenic perturbation enhances the release of geogenic Mn to groundwater: Evidence from hydrogeochemical characteristics. Sci. Total Environ. 2023, 891, 164450. [Google Scholar] [CrossRef]
  12. Kelley, C.J.; Keller, C.K.; Evans, R.D.; Orr, C.H.; Smith, J.L.; Harlow, B.A. Nitrate–nitrogen and oxygen isotope ratios for identification of nitrate sources and dominant nitrogen cycle processes in a tile-drained dryland agricultural field. Soil Biol. Biochem. 2013, 57, 731–738. [Google Scholar] [CrossRef]
  13. Xiu, W.; Yu, X.; Guo, H.; Yuan, W.; Ke, T.; Liu, G.; Tao, J.; Hou, W.; Dong, H. Facilitated arsenic immobilization by biogenic ferrihydrite-goethite biphasic Fe(III) minerals (Fh-Gt Bio-bi-minerals). Chemosphere 2019, 225, 755–764. [Google Scholar] [CrossRef]
  14. Lei, X.; Cui, G.; Sun, H.; Hou, S.; Deng, H.; Li, B.; Yang, Z.; Xu, Q.; Huo, X.; Cai, J. How do earthworms affect the pathway of sludge bio-stabilization via vermicomposting? Sci. Total Environ. 2024, 916, 170411. [Google Scholar] [CrossRef]
  15. Morrissy, J.G.; Currell, M.J.; Reichman, S.M.; Surapaneni, A.; Megharaj, M.; Crosbie, N.D.; Hirth, D.; Aquilina, S.; Rajendram, W.; Ball, A.S. Nitrogen contamination and bioremediation in groundwater and the environment: A review. Earth-Sci. Rev. 2021, 222, 103816. [Google Scholar] [CrossRef]
  16. Roșca, O.M.; Dippong, T.; Marian, M.; Mihali, C.; Mihalescu, L.; Hoaghia, M.; Jelea, M. Impact of anthropogenic activities on water quality parameters of glacial lakes from Rodnei mountains, Romania. Environ. Res. 2020, 182, 109136. [Google Scholar] [CrossRef] [PubMed]
  17. Chen, R.; Liu, H.; Zhang, P.; Zhao, L.; Ding, K.; Yuan, S. Attenuation of Fe(III)-reducing bacteria during table fluctuation of groundwater containing Fe2+. Sci. Total Environ. 2019, 694, 133660. [Google Scholar] [CrossRef] [PubMed]
  18. Zhai, Y.; Han, Y.; Xia, X.; Li, X.; Lu, H.; Teng, Y.; Wang, J. Anthropogenic Organic Pollutants in Groundwater Increase Releases of Fe and Mn from Aquifer Sediments: Impacts of Pollution Degree, Mineral Content, and pH. Water 2021, 13, 1920. [Google Scholar] [CrossRef]
  19. Su, X.; Zheng, Z.; Chen, Y.; Wan, Y.; Lyu, H.; Dong, W. Effects of carbon load on nitrate reduction during riverbank filtration: Field monitoring and batch experiment. Sci. Total Environ. 2022, 845, 157198. [Google Scholar] [CrossRef]
  20. Hou, Q.; Zhang, Q.; Huang, G.; Liu, C.; Zhang, Y. Elevated manganese concentrations in shallow groundwater of various aquifers in a rapidly urbanized delta, south China. Sci. Total Environ. 2020, 701, 134777. [Google Scholar] [CrossRef]
  21. Cao, X.; He, W.; Fan, M.; He, W.; Shi, Y.; An, T.; Chen, X.; Zhang, Z.; Liu, F.; Zhao, Y.; et al. Novel insights into source apportionment of dissolved organic matter in aquifer affected by anthropogenic groundwater recharge: Applicability of end-member mixing analysis based optical indices. Sci. Total Environ. 2023, 863, 160885. [Google Scholar] [CrossRef] [PubMed]
  22. Li, D.; Chang, F.; Zhang, Y.; Duan, L.; Liu, Q.; Li, H.; Hu, G.; Zhang, X.; Gao, Y.; Zhang, H. Arsenic migration at the sediment-water interface of anthropogenically polluted Lake Yangzong, Southwest China. Sci. Total Environ. 2023, 879, 163205. [Google Scholar] [CrossRef] [PubMed]
  23. Meng, L.; Shi, J.; Zheng, S.; Guo, X.; Wang, J.; Zhai, Y.; Teng, Y.; Zuo, R. Compartmentalization transformation of Fe2+, Mn2+ and NH4+ in groundwater: A comparative research containing experimental medium and functional genera profiling derived from experiment data. J. Water Process Eng. 2024, 58, 104794. [Google Scholar] [CrossRef]
  24. Duan, L.; Song, J.; Yin, M.; Yuan, H.; Li, X.; Zhang, Y.; Yin, X. Dynamics of arsenic and its interaction with Fe and S at the sediment-water interface of the seasonal hypoxic Changjiang Estuary. Sci. Total Environ. 2021, 769, 145269. [Google Scholar] [CrossRef] [PubMed]
  25. Cao, X.; Han, X.; Chen, Y.; Li, J.; Zhai, Y. Flood irrigation increases the release of phosphorus from aquifer sediments into groundwater. J. Contam. Hydrol. 2024, 261, 104297. [Google Scholar] [CrossRef] [PubMed]
  26. GB/T 36197-2018[S/OL]; Soil Quality – Guidance on Sampling Techniques. State Administration for Market Regulation, Standardization Administration of the People’s Republic of China. Standards Press of China: Beijing, China, 2018.
  27. Lu, C.; Xiu, W.; Guo, H.; Lian, G.; Yang, B.; Zhang, T.; Bi, E.; Shi, Z. Multi-Isotope Based Identification and Quantification of Oxygen Consuming Processes in Uranium Hosting Aquifers with CO2 + O2 In Situ Leaching. Water Resour. Res. 2023, 59, e2022WR033980. [Google Scholar] [CrossRef]
  28. Lu, C.; Xiu, W.; Yang, B.; Lian, G.; Zhang, T.; Bi, E.; Guo, H. Characteristics of Dissolved Organic Matter in Uranium Hosting Aquifers and Potential Molecular Transformation During Neutral In Situ Leaching. JGR Biogeosciences 2024, 129, e2023JG007851. [Google Scholar] [CrossRef]
  29. Lu, C.; Xiu, W.; Yang, B.; Zhang, H.; Lian, G.; Zhang, T.; Bi, E.; Guo, H. Natural Attenuation of Groundwater Uranium in Post-Neutral-Mining Sites Evidenced from Multiple Isotopes and Dissolved Organic Matter. Environ. Sci. Technol. 2024, 58, 12674–12684. [Google Scholar] [CrossRef] [PubMed]
  30. GB/T 14848-2017[S/OL]; Groundwater Quality Standard. General Administration of Quality Supervision, Inspection and Quarantine of the People’s Republic of China, Standardization Administration of China. Standards Press of China: Beijing, China, 2017.
  31. World Health Organization. Guidelines for Drinking-Water Quality. World Health Organ. 2011, 216, 303–304. [Google Scholar]
  32. Xia, Q.; He, J.; He, B.; Chu, Y.; Li, W.; Sun, J.; Wen, D. Effect and genesis of soil nitrogen loading and hydrogeological conditions on the distribution of shallow groundwater nitrogen pollution in the North China Plain. Water Res. 2023, 243, 120346. [Google Scholar] [CrossRef]
  33. Chen, Y.; Su, X.; Wan, Y.; Lyu, H.; Dong, W.; Shi, Y.; Zhang, Y. Quantifying the effect of the nitrogen biogeochemical processes on the distribution of ammonium in the riverbank filtration system. Environ. Res. 2023, 216, 114358. [Google Scholar] [CrossRef] [PubMed]
  34. Tang, M.; Du, R.; Cao, S.; Berry, M.; Peng, Y. Tracing and utilizing nitrogen loss in wastewater treatment: The trade-off between performance improvement, energy saving, and carbon footprint reduction. J. Environ. Manag. 2024, 349, 119525. [Google Scholar] [CrossRef] [PubMed]
  35. Jia, L.; Zhou, Q.; Li, Y.; Wu, W. Application of manganese oxides in wastewater treatment: Biogeochemical Mn cycling driven by bacteria. Chemosphere 2023, 336, 139219. [Google Scholar] [CrossRef] [PubMed]
  36. Abedi Koupai, J.; Fatahizadeh, M.; Mosaddeghi, M.R. Effect of pore water pH on mechanical properties of clay soil. Bull. Eng. Geol. Environ. 2020, 79, 1461–1469. [Google Scholar] [CrossRef]
  37. Zhang, L.-Z.; Xing, S.; Huang, F.-Y.; Xiu, W.; Rensing, C.; Zhao, Y.; Guo, H. Metabolic coupling of arsenic, carbon, nitrogen, and sulfur in high arsenic geothermal groundwater: Evidence from molecular mechanisms to community ecology. Water Res. 2024, 249, 120953. [Google Scholar] [CrossRef] [PubMed]
  38. Nortjé, G.P.; Laker, M.C. Factors That Determine the Sorption of Mineral Elements in Soils and Their Impact on Soil and Water Pollution. Minerals 2021, 11, 821. [Google Scholar] [CrossRef]
  39. McMahon, P.B.; Belitz, K.; Reddy, J.E.; Johnson, T.D. Elevated Manganese Concentrations in United States Groundwater, Role of Land Surface–Soil–Aquifer Connections. Environ. Sci. Technol. 2019, 53, 29–38. [Google Scholar] [CrossRef] [PubMed]
  40. Moore, O.C.; Xiu, W.; Guo, H.; Polya, D.A.; Van Dongen, B.E.; Lloyd, J.R. The role of electron donors in arsenic-release by redox-transformation of iron oxide minerals—A review. Chem. Geol. 2023, 619, 121322. [Google Scholar] [CrossRef]
  41. Cao, W.; Zhang, Z.; Fu, Y.; Zhao, L.; Ren, Y.; Nan, T.; Guo, H. Prediction of arsenic and fluoride in groundwater of the North China Plain using enhanced stacking ensemble learning. Water Res. 2024, 259, 121848. [Google Scholar] [CrossRef]
  42. Li, P.; Sabarathinam, C.; Elumalai, V. Groundwater pollution and its remediation for sustainable water management. Chemosphere 2023, 329, 138621. [Google Scholar] [CrossRef]
  43. Xu, F.; Li, P. Biogeochemical mechanisms of iron (Fe) and manganese (Mn) in groundwater and soil profiles in the Zhongning section of the Weining Plain (northwest China). Sci. Total Environ. 2024, 939, 173506. [Google Scholar] [CrossRef] [PubMed]
  44. Bai, J.; Yuan, Z.; Su, X. Spatiotemporal distribution patterns of iron, manganese, and arsenic within the river infiltration zone and the potential geochemical activity at key interfaces. Appl. Geochem. 2024, 172, 106123. [Google Scholar] [CrossRef]
  45. Rivett, M.O.; Buss, S.R.; Morgan, P.; Smith, J.W.N.; Bemment, C.D. Nitrate attenuation in groundwater: A review of biogeochemical controlling processes. Water Res. 2008, 42, 4215–4232. [Google Scholar] [CrossRef] [PubMed]
  46. Li, Q.; Wang, G.; Wang, H.; Shrestha, S.; Xue, B.; Sun, W.; Yu, J. Macrozoobenthos variations in shallow connected lakes under the influence of intense hydrologic pulse changes. J. Hydrol. 2020, 584, 124755. [Google Scholar] [CrossRef]
  47. Dippong, T.; Mihali, C.; Năsui, D.; Berinde, Z.; Butean, C. Assessment of Water Physicochemical Parameters in the Strîmtori-Firiza Reservoir in Northwest Romania. Water Environ. Res. 2018, 90, 220–233. [Google Scholar] [CrossRef] [PubMed]
  48. Du, Y.; Deng, Y.; Ma, T.; Xu, Y.; Tao, Y.; Huang, Y.; Liu, R.; Wang, Y. Enrichment of Geogenic Ammonium in Quaternary Alluvial–Lacustrine Aquifer Systems: Evidence from Carbon Isotopes and DOM Characteristics. Environ. Sci. Technol. 2020, 54, 6104–6114. [Google Scholar] [CrossRef] [PubMed]
  49. Hu, B.; Song, X.; Lu, Y.; Liang, S.; Liu, G. Fluoride enrichment mechanisms and related health risks of groundwater in the transition zone of geomorphic units, northern China. Environ. Res. 2022, 212, 113588. [Google Scholar] [CrossRef] [PubMed]
  50. Champ, D.R.; Gulens, J.; Jackson, R.E. Oxidation–reduction sequences in ground water flow systems. Can. J. Earth Sci. 1979, 16, 12–23. [Google Scholar] [CrossRef]
  51. Stumm, W.; Morgan, J.J. Aquatic Chemistry: Chemical Equilibria and Rates in Natural Waters, 3rd ed.; Environmental Science and Technology; John Wiley & Sons, Inc.: Hoboken, NJ, USA, 1996. [Google Scholar]
  52. Li, Y.; Liu, Y.; Feng, L.; Zhang, L. A review: Manganese-driven bioprocess for simultaneous removal of nitrogen and organic contaminants from polluted waters. Chemosphere 2023, 314, 137655. [Google Scholar] [CrossRef]
  53. Dong, H.; Zeng, Q.; Sheng, Y.; Chen, C.; Yu, G.; Kappler, A. Coupled iron cycling and organic matter transformation across redox interfaces. Nat. Rev. Earth Environ. 2023, 4, 659–673. [Google Scholar] [CrossRef]
  54. Hu, B.; Teng, Y.; Zhang, Y.; Zhu, C. Review: The projected hydrologic cycle under the scenario of 936 ppm CO2 in 2100. Hydrogeol. J. 2019, 27, 31–53. [Google Scholar] [CrossRef]
  55. Xin, J.; Liu, Y.; Chen, F.; Duan, Y.; Wei, G.; Zheng, X.; Li, M. The missing nitrogen pieces: A critical review on the distribution, transformation, and budget of nitrogen in the vadose zone-groundwater system. Water Res. 2019, 165, 114977. [Google Scholar] [CrossRef] [PubMed]
Figure 1. Temporal variations of groundwater monitoring indicators over six years for five wells. (a) pH; (b) TDS; (c) DO; (d) COD; (e) NH4+-N; (f) NO3-N; (g) NO2-N; (h) Fe; (i) Mn.
Water 16 02305 g001
Figure 2. Variations in nitrogen concentrations during the filtration of two types of source water in the contaminated and background environments. (a) Changes in NH4+ concentration during rainwater filtration. (b) Variations in NH4+ concentration during sewage filtration. (c) Alterations in NO3 concentration during rainwater filtration. (d) Changes in NO3 concentration during sewage filtration. Each value represented as mean ± SD, samples size (n = 4), * p < 0.05. The significance of the grades was calculated with the Kruskal–Wallis test.
Water 16 02305 g002
Figure 3. Changes in pH and inorganic ion concentrations during the filtration of two types of source water in the contaminated and background environments. Changes in (a) pH during rainwater filtration; (b) pH during sewage filtration; (c) Ca2+ concentration during rainwater filtration; (d) Ca2+ concentration during sewage filtration; (e) Mg2+ concentration during rainwater filtration; and (f) Mg2+ concentration during sewage filtration. Each value represented as mean ± SD, samples size (n = 4), * p < 0.05. The significance of the grades was calculated with the Kruskal–Wallis test.
Water 16 02305 g003
Figure 4. Changes in Mn2+ and Fe2+ concentrations during filtration of two types of source water in contaminated and background environments. Changes in (a) Mn2+ concentration during rainwater filtration, (b) Mn2+ concentration during sewage filtration, (c) Fe2+ concentration during rainwater filtration, and (d) Fe2+ concentration during sewage filtration. Each value represented as mean ± SD, samples size (n = 4), * p < 0.05. The significance of the grades was calculated with the Kruskal–Wallis test.
Water 16 02305 g004
Figure 5. Ion correlation network diagram of (a) DNRA interval and (b) non-DNRA interval.
Water 16 02305 g005
Figure 6. Correlation heat map of water quality parameters in four pollution monitoring wells, (a) #1-1, (b) #2-1, (c) #2-2 and (d) #3-1.
Water 16 02305 g006
Disclaimer/Publisher’s Note: The statements, opinions and data contained in all publications are solely those of the individual author(s) and contributor(s) and not of MDPI and/or the editor(s). MDPI and/or the editor(s) disclaim responsibility for any injury to people or property resulting from any ideas, methods, instructions or products referred to in the content.

