1. Introduction
It is well known that variations in suspended sediments can result in water color changes [
1,
2,
3]. Scientists have long aspired to reliably determine sediment concentration by measuring the water surface color. Achieving this capability would significantly transform monitoring and management practices across diverse aquatic environments, potentially reducing the need for labor-intensive and costly field sampling work. Such advancements could save costs in data collection, enhance real-time monitoring efficiency, and lead to more effective environmental management strategies.
Water quality testing often employs turbidity measurement standards, such as Nephelometric Turbidity Units (NTUs) [
4]. However, interpreting the resultant color variations is complicated due to the dynamic interaction between the inherent optical properties (IOPs)—including sediment particle size, composition, and concentration—and the apparent optical properties (AOPs) influenced by lighting conditions [
5,
6]. Moreover, there is a notable inconsistency in the reporting of turbidity data. This inconsistency may stem from the use of different accepted standards—such as USEPA Method 180.1 [
4], ISO 7027 [
7], and GLI Method 2 [
8]—which are not fully aligned. These standards generate a variety of measurement units, not based directly on the optical properties of light absorption and scattering by sediment suspensions but rather on the arbitrary definition of turbidity levels [
9]. To address these discrepancies, it is suggested that all turbidimeters be calibrated using precision optical attenuators, such as neutral density filters, and optical physics be used to define the turbidity level to ensure more accurate and consistent readings.
Despite technical challenges, water color-based sediment characteristic determination has been applied in remote sensing for years. Spectral water color data from satellites and airborne sensors have been used to estimate suspended sediment in coastal waters [
10,
11], river and deltas [
12,
13], estuaries [
14,
15], and reservoirs and lakes [
16,
17]. Research has employed various spectral data sources, including SeaWiFS [
10], MODIS [
12,
18], GOCI [
19], Hyperion (EO-1) [
15], MERIS [
20], Sentinel-2 [
13,
14], and Tiangong 2 Space Lab [
17]. These studies have demonstrated the potential of specific spectral bands, ranging from 400 nm to 1100 nm, to effectively model and predict total suspended solids (TSSs) and sediment concentrations. For example, the 665 nm band was found to be useful for estimating the TSSs in the Irish Sea [
11], while near-infrared (NIR) and combinations with green or blue bands provided effective models for river deltas in Canada [
12]. Laboratory data from experimental channels have also highlighted red and NIR bands in the 600–800 nm range for estimating sediment sizes varying from clay to fine sand [
6,
21].
However, several technical challenges prevent the advancement of this application, which typically relies on field sampling for ground truth data [
22,
23]. First, the accuracy of the studies spans a wide range of R-square scores. Part of the reason for this is that the ground-truth data from the field are costly to collect, so validation is usually limited to specific locations and field conditions, preventing scale-up from one location to another. Second, despite initial success in estimating concentration, particle size’s effect on color response has been studied less. It is still unclear how sensitive these remote sensing methods are to various sediment sizes in addition to particle concentration [
5,
6]. Further studies in controlled environments are required to fully examine the scaling and particle size issues.
A number of lab experiments have been performed to analyze the spectral signal of suspended sediments using a spectroradiometer [
24,
25,
26,
27,
28]. The typical design of these experiments is that sediments are suspended in a tank or container that has a black coating [
27] or paint [
24,
25,
26,
28], which is intended to minimize light reflection. The spectroradiometer is pointed straight down at the water surface, and a light source is provided from above the tank, typically a halogen bulb [
24,
25,
27,
28] or sunlight [
26]. These studies have found that a higher concentration of sediment results in a larger reflectance of the incoming light, and that reflectance is larger for smaller particle sizes.
Recent advancements in hyperspectral imaging technology have marked a significant leap forward in color sensing and analysis. It transcends the capabilities of conventional imaging by capturing a comprehensive, high-resolution spectrum for each image pixel, thereby unveiling subtle distinctions in material optical signatures [
29]. This technology, with its origins in remote sensing applications, has proven valuable in environmental studies, both terrestrial and aquatic [
30,
31]. Its deployment in laboratory experiments to scrutinize suspended sediments underscores the technology’s analytical potency [
6]. Hyperspectral imaging can provide spectral information for all pixels of an image, which can provide information on spatial variation, while a spectroradiometer only provides spectral information for one spot.
Machine learning has emerged as a powerful tool in the field of remote sensing, with its ability to process and analyze vast amounts of data efficiently and accurately. This has raised interest among researchers in leveraging machine learning to analyze sediment characteristics. Despite the potential of machine learning in remote sensing, hyperspectral data have been limited, especially when analyzing the existing history of water color changes. Typically, the number of bands in satellite or other remote sensing devices is restricted, which can limit the types and ranges of the data gathered. This is a significant challenge in the field, as the limited number of bands can constrain the applicability of remote sensing data in various research and practical applications. Given the data archives from existing satellites, such as Landsat and MODIS, are the existing bands in those satellites sufficient to inform sediment characteristics using water color? Which machine learning method is suitable for analyzing the data, especially with the limitations of ground data availability?
This paper endeavors to test the hypothesis that the color of water captured by hyperspectral and traditional optical remote sensing data can serve as a dependable indicator for sediment concentration and particle size. We examine the correlation between spectral signatures and sediment attributes through systematic lab experiments employing a hyperspectral camera. Our research aims to delineate the capabilities and constraints of hyperspectral imaging in sediment analysis. By doing so, we intend to refine our understanding of its use in environmental surveillance and aid in enhancing remote sensing methodologies.
2. Materials and Methods
Samples of sand were taken from a quarry in New Egypt, NJ (40.053° N, 74.462° W), and the following lab work was performed at the Rutgers University campus in Piscataway, NJ, USA. Bulk sand was passed through a 2.0 mm sieve (#10 size), and the remaining extra-large particles were discarded. Warm water was added to the remaining sediment and mixed to motivate the fine particles into suspension. This suspension of fine particles was decanted into a tray and placed in an oven. The remaining coarse particles were washed with detergent and warm water and stirred to remove the remaining attached fine particles. The washing water was discarded and refilled until it ran clear (indicating that most fine particles were removed), and these washed coarse particles were then placed in a separate tray and put in the oven.
The samples were left in the oven at 100 °C overnight to remove moisture. The coarse sediments were then placed into a sieve array and shaken for 15 min in a motorized sieve shaker. The sieved sediments were then labeled and stored. These washed sediments yielded little or no sediments passing through the 75 μm sieve. For the fine sediments recovered from decanting, the oven-drying process created plate-like pieces of mixed clay, silt, and sand that were pulverized by hand and then sieved. Only the particles passing through the 75 μm sieve were retained from the sieving of these sediments. The remaining sediments from this sample were discarded. All the sizes of the prepared sediment samples are listed in
Table 1. Note that the average diameter of the sediment was obtained as the average of the upper and lower bounds of the sieve sizes.
To further refine the smallest sediments, a portion of <75 µm of sediment was stirred with detergent in a 600 mL beaker and left to settle for one minute. The liquid was decanted and discarded, and the settled sediments were recovered. This process was repeated two more times to remove the finest material, and based on the Stokes settling velocity, the estimated particle size for this sample ranged from 30 to 75 µm.
The sieved sediments were weighed into sample cups using an Ohaus digital scale. A 600 mL beaker containing 500 mL of cool tap water was used for this experiment. The beaker was placed on a Fisher FS Rt Basic Stirrer 120, and a magnetic stirring bead was added. This setup was placed on a table with a black background, with white paper included in the image. These black and white backgrounds served as control data.
Sediment was added to the beaker, and the stirrer was turned on. Sediment was added in increments, and hyperspectral images were captured for each increment. After the maximum concentration was reached, the beaker was removed, emptied, and cleaned, and then the experiment began again with a different size. While care was taken to place the beaker in the same position, the exact placement could vary by several millimeters. Certain sizes and concentrations were imaged a second time on different days to examine repeatability. The images were taken with a Hyspex Baldur V-1024 N hyperspectral camera and Hyspex Ground software (v4.11.5.2), manufactured by Hyspex (a division of Norsk Elektro Optikk [NEO]) in Oslo, Norway. The camera captured 113 data channels from visible and near-infrared (VNIR) bands, spanning 400–1000 nm wavelengths. A lens with a 3 m focal length was used, and the camera was 3 m from the mixer and beaker. At a distance of 3 m, the pixel resolution was roughly 0.9 mm × 0.9 mm. Radiometric calibration was performed on the images using Hyspex Rad software (v2.5) to convert the raw data to spectral radiance (W/(m2·steradian)).
Overhead LED lighting was used in the experiment as well as a supplementary 40 W incandescent light bulb to provide IR signals in the 700–1000 nm range. Window curtains were lowered to minimize the impact of outdoor lighting. The placement of the camera and lighting sources is shown in
Figure 1.
To investigate which model and band combinations were suitable to determine sediment concentration and sizes, we employed five different machine learning-based regression methods available in the Python package Scikit to predict sediment concentration and sizes [
32]: Ridge Regression, a regularization technique, is used to prevent overfitting by reducing the model’s complexity and shrinking the coefficients of less important features towards zero. The K-Nearest Neighbors Regression (KNNs) method predicts the value of an observation by averaging the values of its ‘k’ nearest neighbors, thereby considering the influence of surrounding data points. Bayesian Regression offers not only a prediction but also a measure of uncertainty associated with the prediction, updating prior knowledge about parameters with the likelihood of the observed data. Decision Tree Regression employs a decision tree model to break down a dataset into smaller subsets, incrementally developing an associated decision tree that leads to a prediction. Lastly, Support Vector Machine Regression (SVM) seeks a line or hyperplane that maximizes the margin from the nearest points of all classes, using boundary points known as Support Vectors. These methods collectively enhance the accuracy and reliability of our sediment predictions.
3. Results
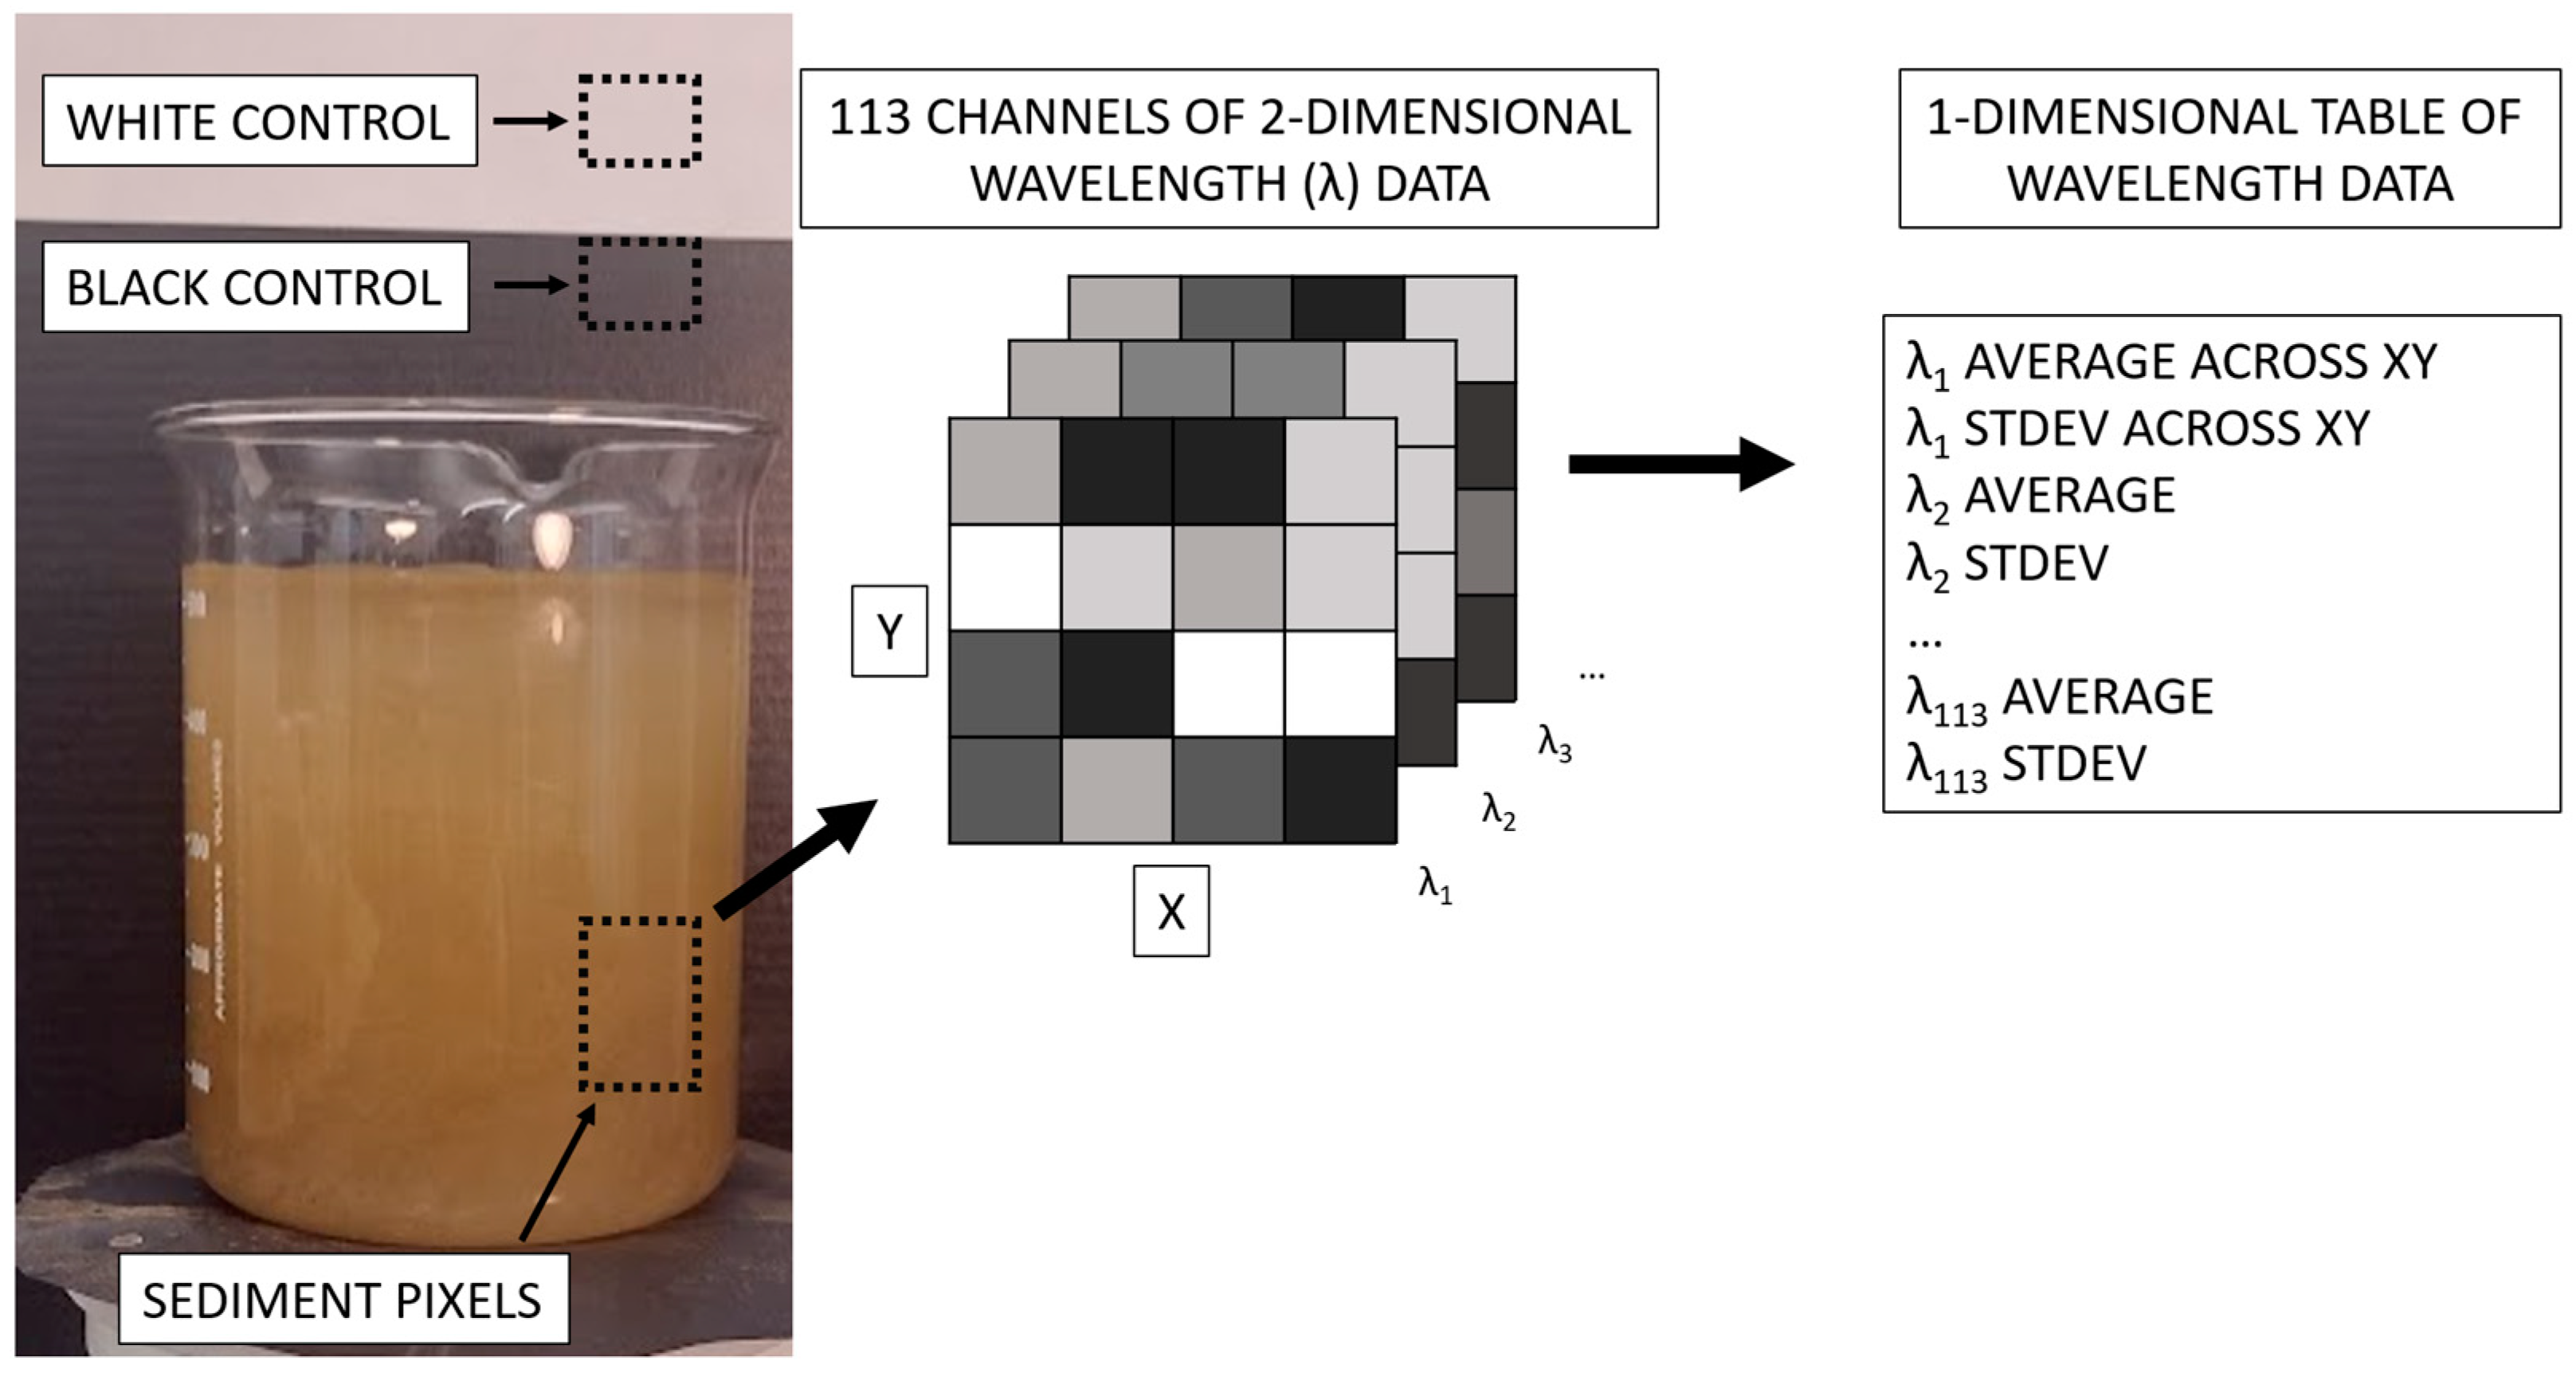
Three samples of pixels were taken from each image: 20 × 30 pixels of sediment data at the bottom of the beaker where the sediment was fully mixed and 15 × 20 pixels of control data from both the black and white image background. For both the sediment and control samples, the average and standard deviation were calculated across the horizontal and vertical dimensions, and these data were stored for each of the 113 data channels (113 × 30 × 20 data recorded per image). A sample image is shown below in
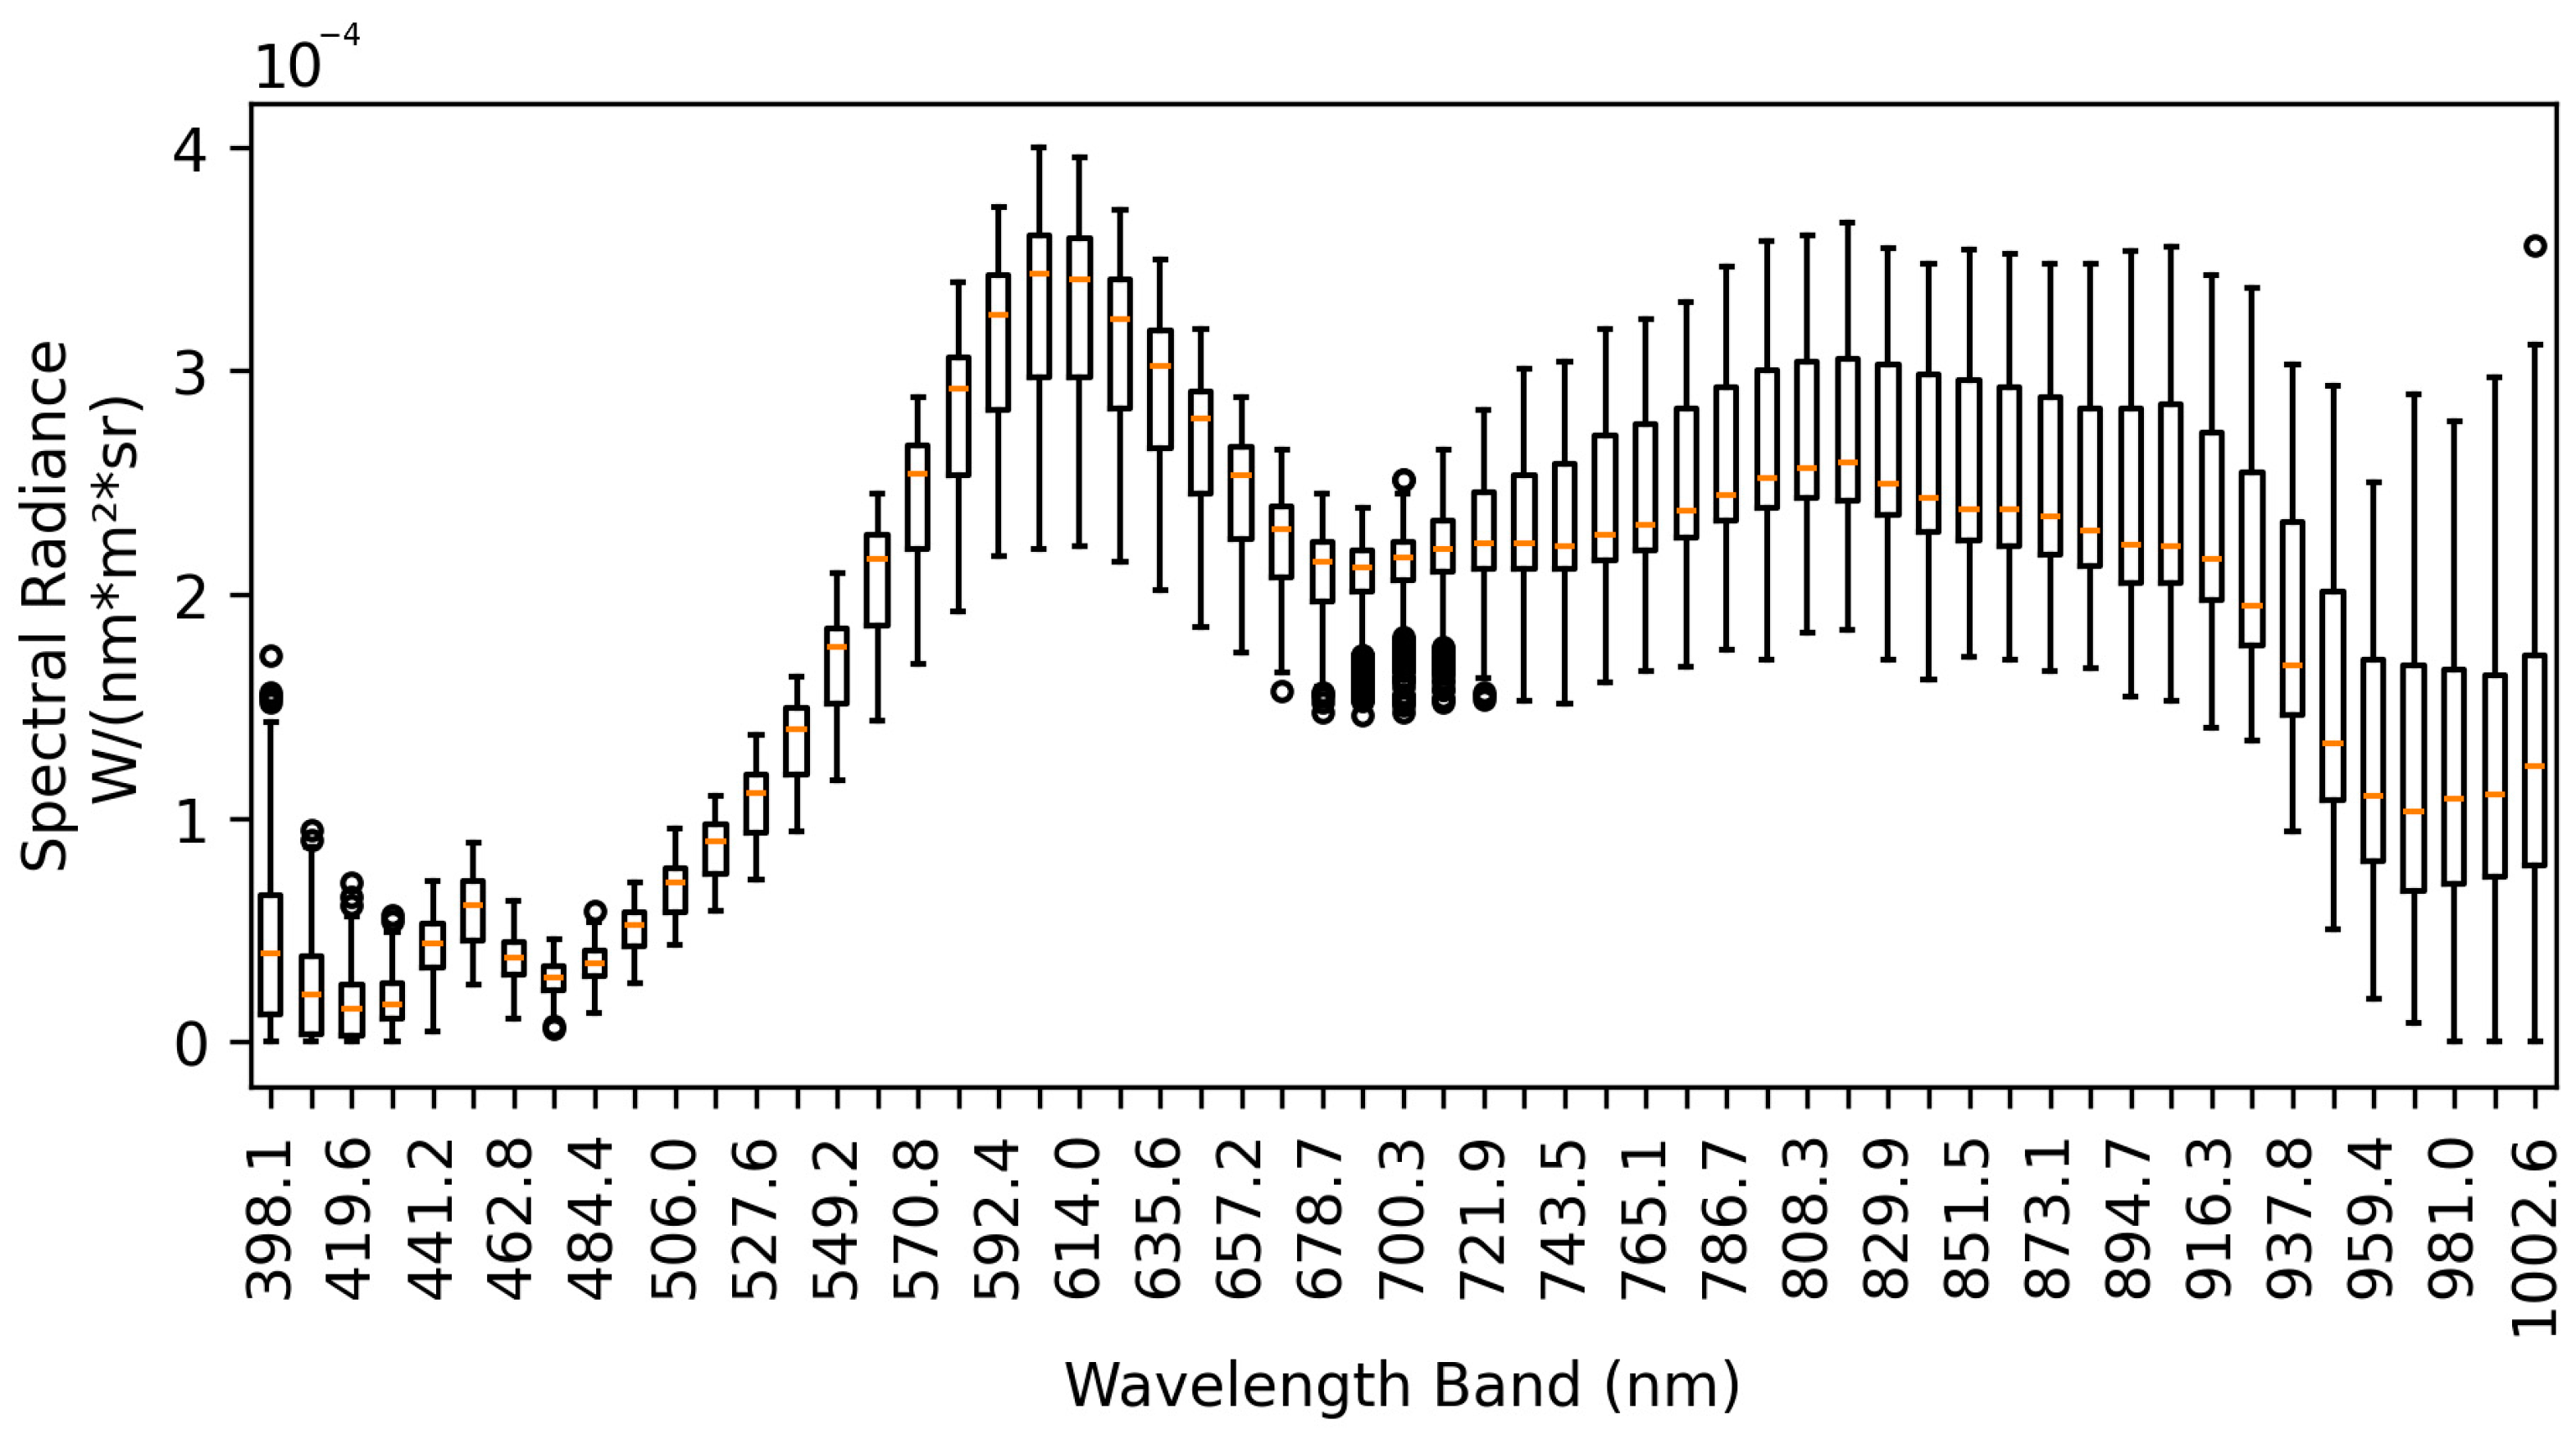
Figure 2 with the experiment and control data pixels outlined in boxes. From within the sediment data, boxplots of radiance values were created for each band, as shown in
Figure 3. The distribution of the boxplot data shows the importance of recording the standard deviation in addition to the average radiance value.
Figure 2 shows the location of the three image subsets. For 113 channels, the average and standard deviation across the pixels were recorded in a table (113 × 2 = 226 recorded values). This process was repeated for the sediment, white control, and black control data, resulting in 678 recorded values per image.
The analysis of the control data showed that the radiance of the background paper could vary by 1–2% for the bands between 430 and 1000 nm. Greater variation of up to 50% was observed in the bands between 400 and 430 nm; the signal from these bands was relatively weak.
Figure 3 shows the distribution of values for the sediment pixels of one example image; there is a larger spread of data for the wavelengths >700 nm.
Typical spectral curves are shown in
Figure 4a and
Figure 5a for two sediment sizes. For bands between 400 and 680 nm, the plots of average radiance show that when more sediment is added to the water, the reflected radiance increases by some amount before decreasing. The initial small concentrations increase the scattering of light, but after a threshold, the additional sediment makes the water darker and cloudier, and the signal becomes weaker.
For bands between 680 and 950 nm (roughly the near-infrared band), the average radiance increases when more sediment is added to the water, with no inflection point or decrease recorded within the tested concentrations. This is also shown in the sensitivity analysis later.
In addition to the average radiance, the standard deviation of the radiance for each wavelength band is also recorded in
Figure 4b and
Figure 5b. The ratio of the standard deviation over the average gives the relative standard deviation (RSD, also known as the coefficient of variation, CV), which is useful for understanding the variation in each band. The plots of the RSD values (
Figure 4c and
Figure 5c) show that the bands of 400–430 nm have large variations regardless of sediment size and concentration. Bands 430–680 nm (visible light) show little variation relative to the average values. Bands 680–1000 nm have higher variation at low concentrations, but the variation decreases as the sediment concentration increases. This trend can be explained by the sediment scattering light in the 680–1000 nm bands, and a higher concentration causes greater reflection, and the signal becomes stronger relative to the standard deviation and more homogeneous.
For each image, the average radiance signal from the white background is present in the background, so we can use this signal as a proxy for the incoming light that is shining on the beaker with the sediment and calculate the sediment radiance as a percentage of the incoming light. The results are shown in
Figure 6a,b and
Figure 7a,b for two different data collections on different days, and the trends described above are more apparent: from 400 to 430 nm, the percentage was extremely high because weak incident lighting was available; from 430 to 680 nm, the signal increased then decreased as concentration increased; and from 680 to 1000 nm, a higher concentration resulted in increased radiance.
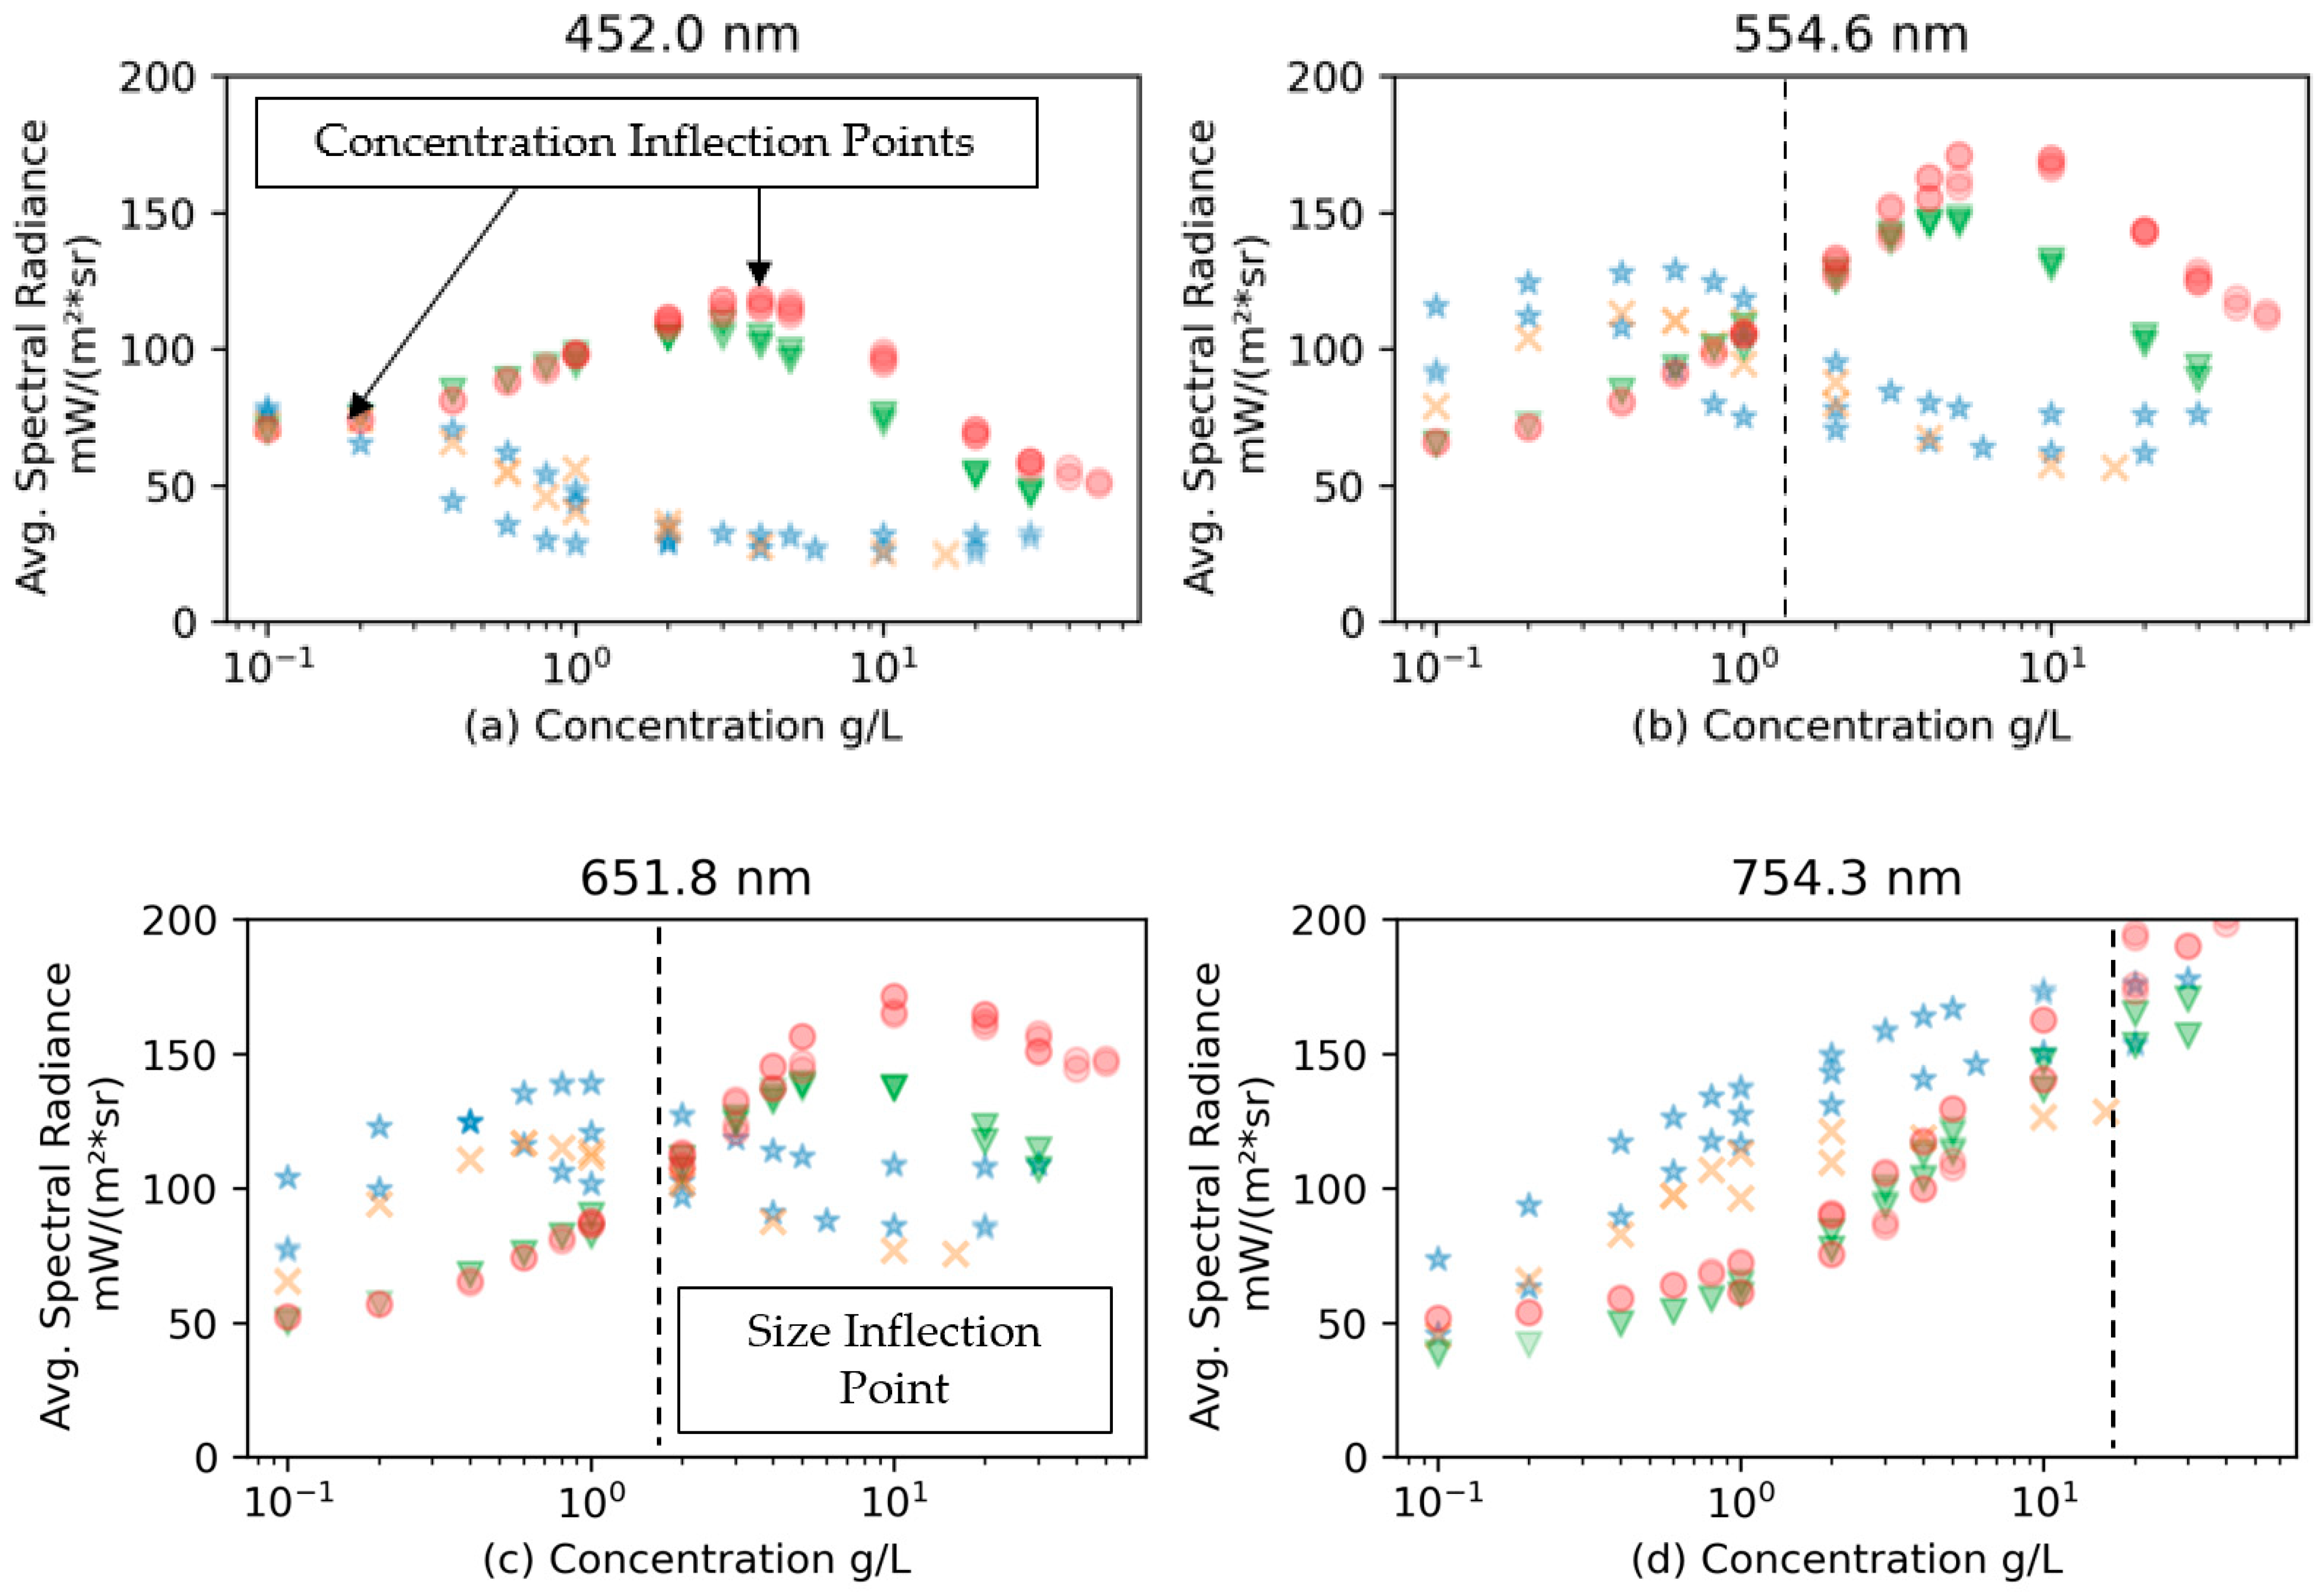
A series of representative bands are selected for analysis in
Figure 8. For the selected wavelength bands, the hyperspectral spectra show different behaviors depending on sediment sizes and concentration. Considering particle sizes, two regions can be identified depending on the correlation between radiance and particle sizes, which can be defined as positive and negative correlation regions. For a wavelength of 452 nm, only a positive correlation region is present, while with higher wavelengths, the negative correlation region extends from low concentrations to high concentrations. At the highest wavelength of 954 nm, only a negative correlation region is present. This observation can be used to design algorithms to determine particle sizes using water color.
In terms of the variation in concentration, the data can also be divided into positive and negative correlations, with the peaks marking the inflection points; i.e., the radiance increases and then decreases with the concentration. The smaller the particle size, the lower the concentration at which the peak appears. In addition, the peak shifts to higher concentrations at higher wavelengths. This provides a complicated pattern for the concentration dependence, and one who develops a remote sensing method to determine particle concentration should be careful about the water color, which may indicate different concentrations and thus must be limited to a range of concentrations for a monotonic relationship for reliable determination.
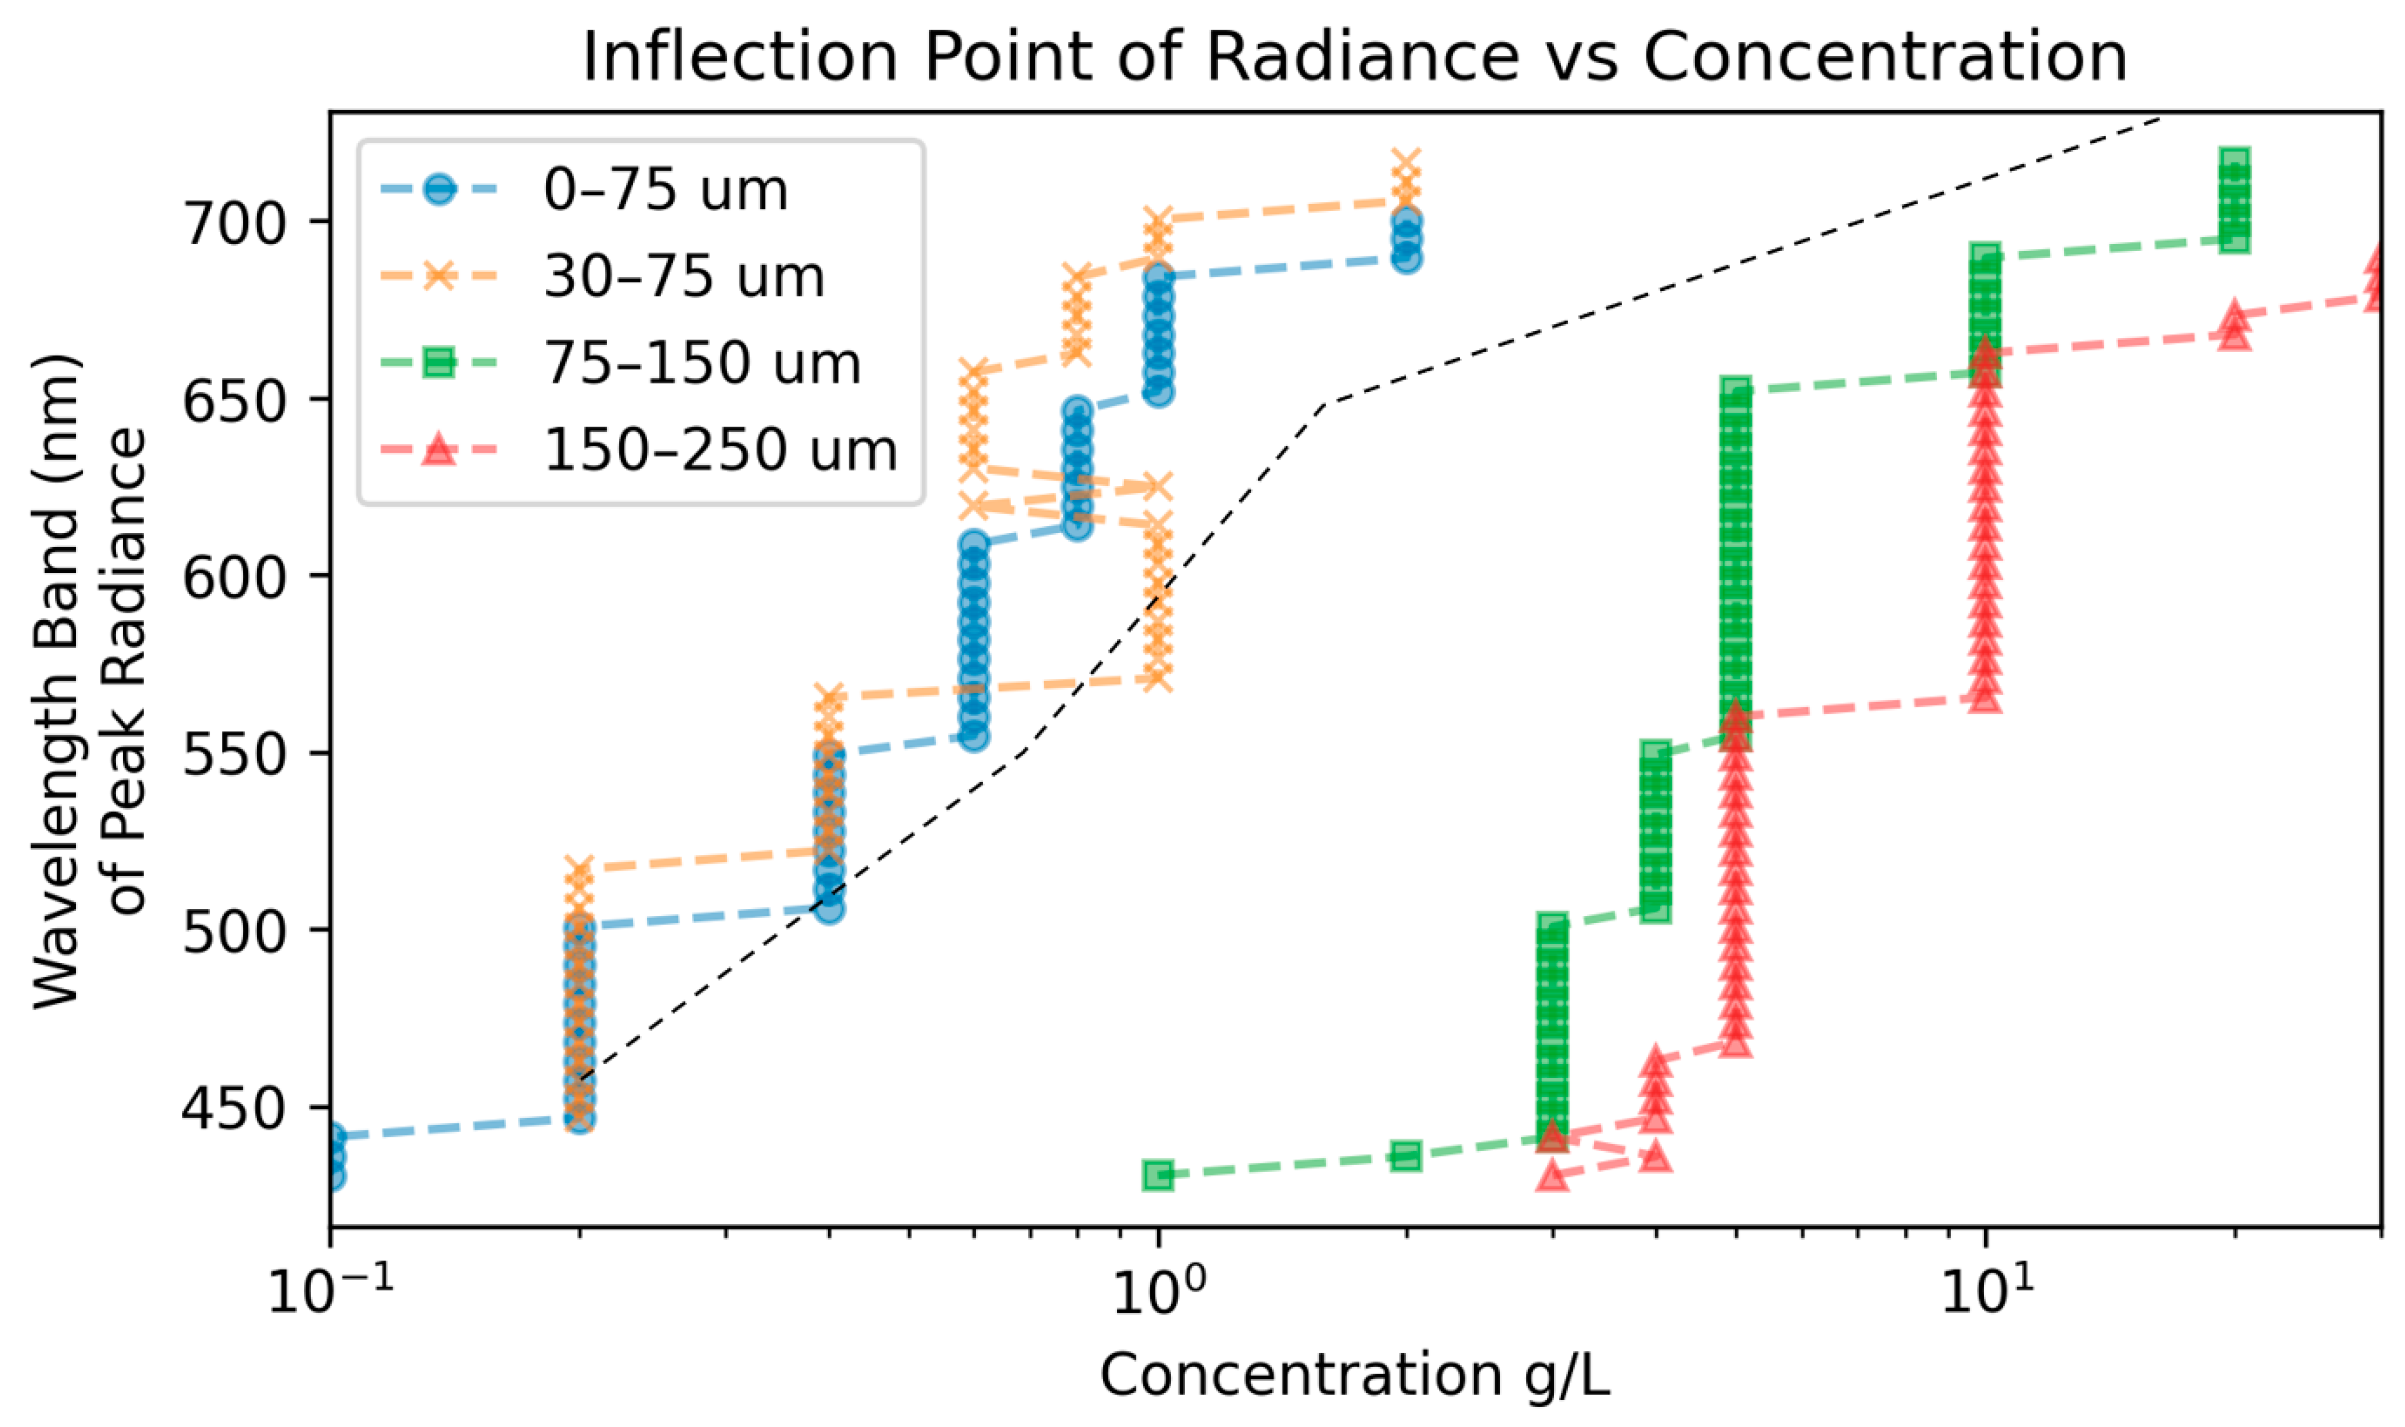
Figure 9 shows the inflection points or maximums for each wavelength and size. For the concentrations associated with each point, lower concentrations have a positive correlation with radiance. We note that the bands 400–430 nm have noise; ignoring these bands shows a general trend toward greater wavelength bands having higher inflection points for larger concentrations. As seen in
Figure 6, the larger wavelengths do not have inflection points within the range of concentrations that were tested. This is also true for smaller sizes at low wavelengths; no inflection points are shown in
Figure 9 for these cases. The inflection points for particle size correlation are also labeled in
Figure 9. The trend in the line is similar to the concentration correlation, but the region of correlation is opposite to the concentration; to the right of the line is a region of positive correlation and to the left of the line marks negative correlation.
To estimate the differences among varying particle sizes and concentrations, we define the hyperspectrum of each case as a vector, ranging from the lowest wavelength (400 nm) to the highest (1000 nm). The vector for the white background control serves as a reference, and the L2-norm for each case relative to this reference is calculated, i.e.,
where
is the spectrum vector, consisting of different values at each wavelength, and
is the reference spectrum vector of the white background. The data are shown in
Table 2. The results in
Table 2 indicate that higher concentrations generally correspond to a greater difference from the control, and this is more obvious for large particles than smaller ones. At low concentrations (<2 mg/L), the cases with a particle diameter of 75–150 mm are closest to the white control, whereas, at relatively high concentrations, the lowest difference shifts to a particle diameter of 30–75 mm.
By taking the gradient of the values in
Table 2 with respect to concentration, we determined the sensitivity of hyperspectral imaging to concentration variations in
Table 3. The table indicates that low concentrations generally result in higher sensitivity to concentration changes, and smaller particles exhibit greater sensitivity than larger particles.
Table 4 presents the gradient of the hyperspectral vectors with respect to particle sizes. In general, smaller particles exhibit more sensitivity to changes in particle size, while both low and high concentrations show higher sensitivity to particle size changes compared to moderate concentrations. This surprising result might be due to the fact that moderate concentrations have a flatter hyperspectrum, as shown in
Figure 8.
Table 5 lists the most sensitive band for each case. Typically, higher concentrations and smaller particles are more sensitive at higher wavelengths, with the most sensitive bands concentrated in the red and near-infrared (NIR) regions. It is also important to note that the extreme high and low ends of the spectrum are noisier, which means that the spectra for low concentrations and large particles exhibit some noise and do not follow the general trend.
Table 2,
Table 3,
Table 4 and
Table 5 have been colored to differentiate between the large and small values and highlight trends.
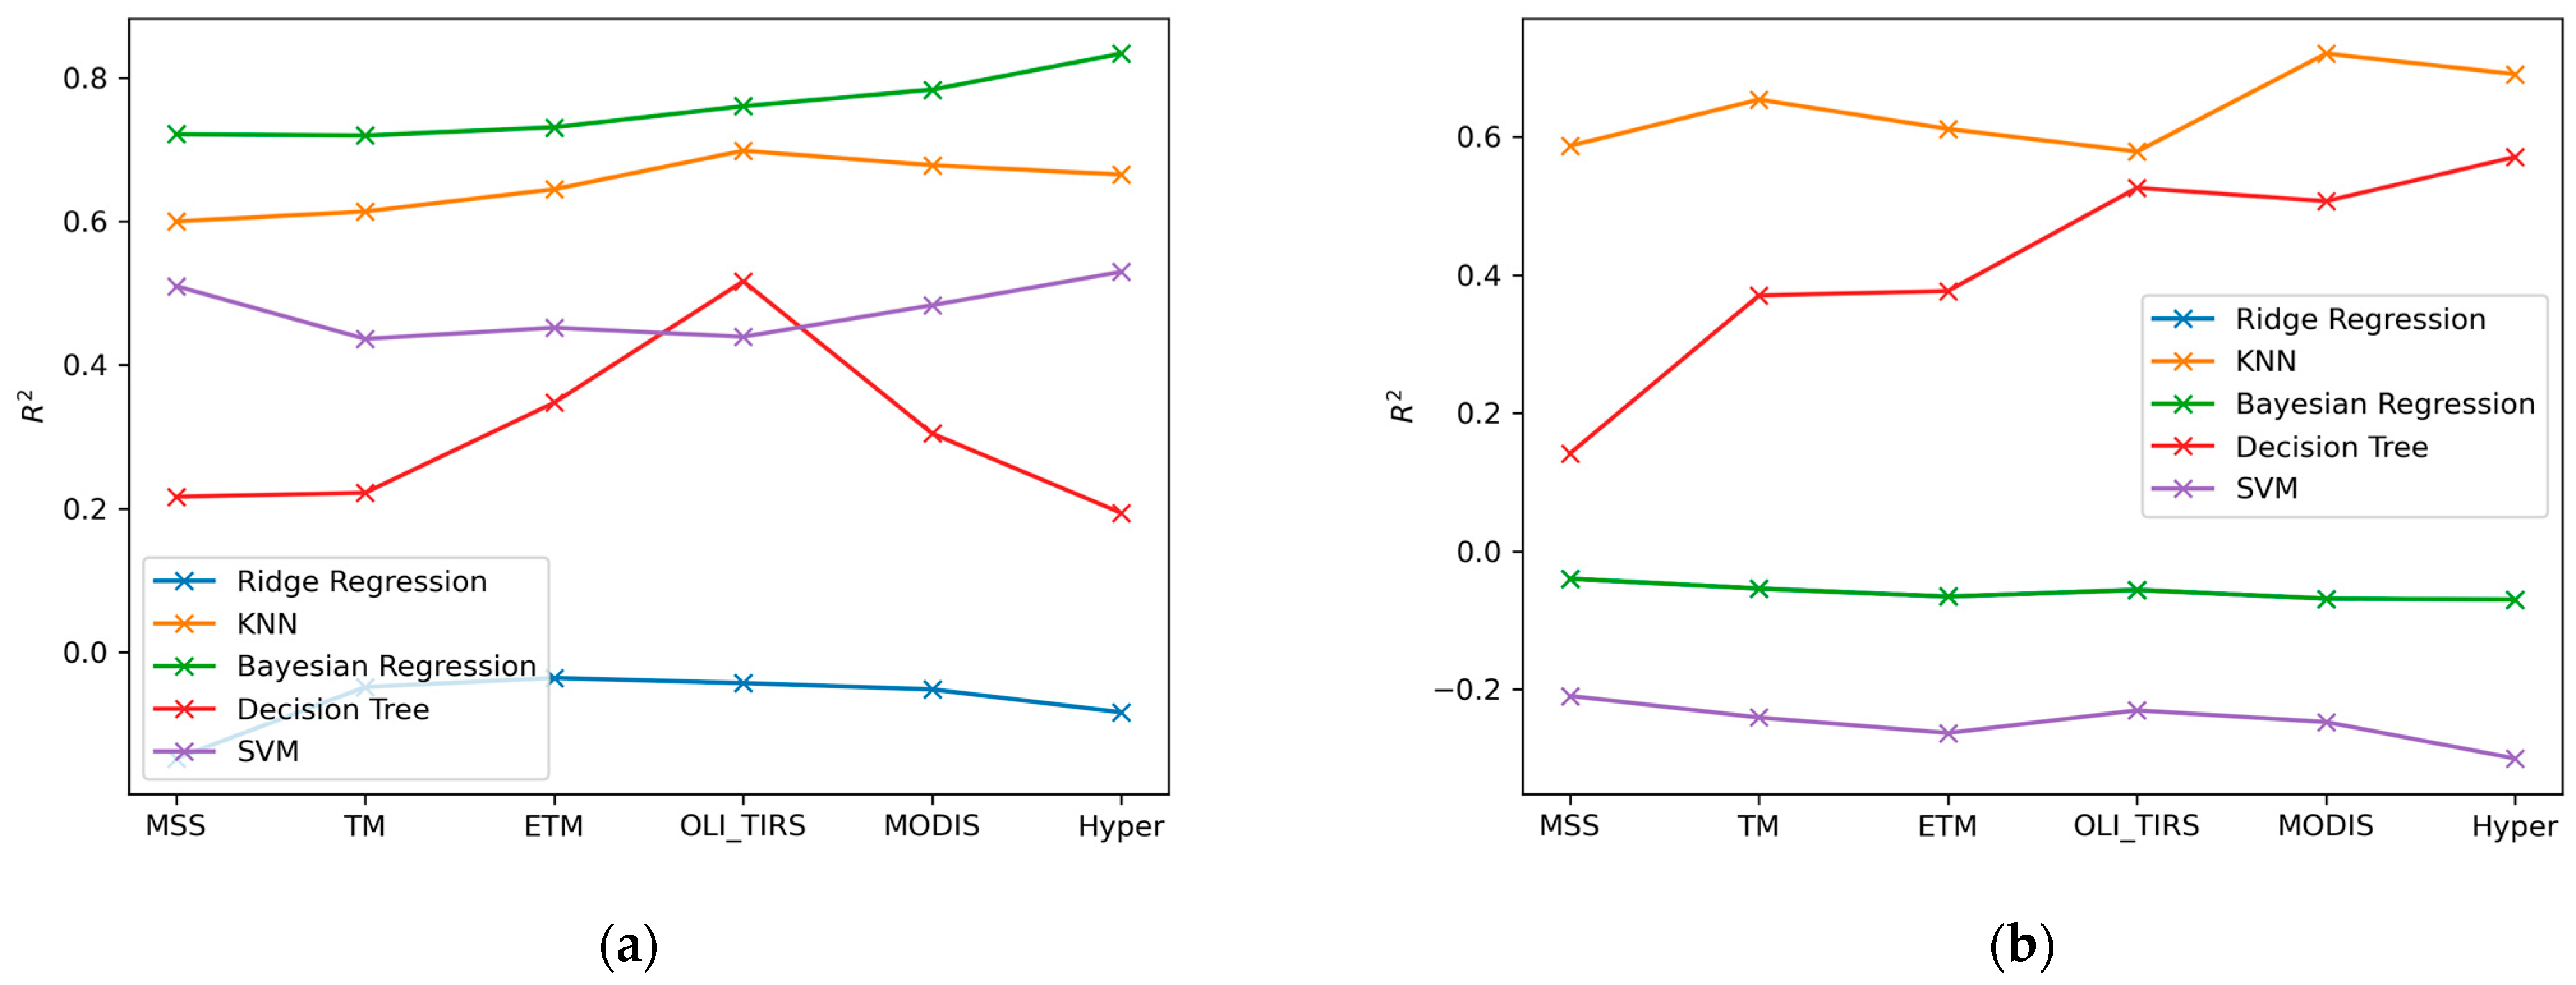
In response to the challenge of using existing satellite data for the water color-based remote sensing of suspended sediment, we conducted a study where we averaged the hyperspectral data to reproduce the bands of popular satellites. Our focus was on the MSS, TM, ETM, and OLI-TIRS of different generations of Landsat and the bands of MODIS. However, our hyperspectral data are limited to visual to near-infrared wavelengths, and we can only reproduce them within this range. For different combinations of bands, the wavelength range is listed in
Table 6. This approach allows us to maximize the use of available hyperspectral data, providing a more comprehensive picture of sediment characteristics across various wavelength bands. Specifically, four bands could be created for MSS, TM, and ETM devices; six bands could be obtained for the OLI-TIRS device; and 16 bands could be generated for MODIS.
Figure 10a provides a comparison of the performance of various machine learning models in predicting sediment concentration using different configurations of water color bands. Each line represents the R
2 score of a specific model, with a higher score indicating better performance. In general, as more bands become available, a machine learning model works better, except for decision tree regression. From the figure, it is clear that the Bayesian Regression model consistently performs well across all band configurations, indicating its robustness in handling different spectral features. The K-Nearest Neighbors Regression model, on the other hand, shows variable performance, excelling in some band configurations while falling short in others. The decision Tree Regression and SVM Regression models also display varying degrees of success across different band configurations. This figure underscores the importance of choosing the appropriate machine learning model and band configuration for the accurate prediction of sediment concentration, highlighting the complex interplay between these factors. A similar study was performed for the prediction of sediment particle size (
Figure 10b). The K-Nearest Neighbors Regression model stands out for its consistent performance across all band configurations, demonstrating its adaptability to diverse spectral features. The Decision Tree Regression shows significant improvement upon more accurate and more available bands. The Bayesian Ridge Regression became the same as Ridge Regression, as the prior did not impact the modeling process. SVM Regression models show the worst performance, probably due to the limitation of training data.
4. Discussion
Based on this analysis, the most effective bands for detecting variations in concentration and particle size are situated in the red and near-infrared (NIR) regions of the spectrum, which is consistent with an earlier study [
21]. Higher concentrations and smaller particles demonstrate increased sensitivity at these higher wavelengths. This information can be leveraged to design more targeted hyperspectral imaging systems or other remote sensing technology for suspended sediments. By focusing on these specific bands, one can enhance detection capabilities and accuracy for both concentration and particle size measurements. Emphasizing red and NIR bands could significantly improve precision in identifying finer distinctions in sediment characteristics, thereby optimizing data collection and analysis processes in future experiments.
The diagram of the inflection points is the first to reveal the complicated physics involved in the light scattering of a suspended sediment solution. It highlights the necessity to carefully design the remote sensing scheme to determine the concentration and particle sizes of suspended sediment. Specifically, our study showed that for the same radiance strength, there exist multiple concentrations or particle sizes. A linear or monotonic correlation is limited to application in this field. To design a more reliable determination scheme, researchers must consider radiance at different wavelengths and their trends to formulate the correct strategy for measurements.
Despite the promising results, there are inherent uncertainties in the data. A notable source of uncertainty arises from the noise present at the extreme high and low ends of the spectrum. This noise particularly affects the spectra of samples with low concentrations and large particles, leading to deviations from the expected trends. Such uncertainties need to be accounted for in the interpretation of hyperspectral data to ensure robustness in the conclusions drawn.
In addition, the experimental setup difference may lead to a discrepancy in the research results compared to other studies using spectroradiometers [
24,
25,
26,
27,
28]. The only possible direct comparison with
Figure 8 is [
6], which showed that radiance increases with concentration when using a hyperspectral camera. While our results generally agree with these trends, we found an inflection point in the bands of 400–750 nm, beyond which adding more sediment causes the radiance to decrease. This difference may be attributed to our different experimental design, in which the images were taken from one side of the water column rather than from above. The inflection point represents the fact that incoming light from above the beaker is attenuated.
The experimental setup is not without its limitations. For instance, the use of a single white background control may not adequately account for variations in background interference in different real-world scenarios. Additionally, the particle sizes and concentrations studied are limited in range, potentially overlooking important variations outside this range. The experimental environment should ideally mimic the field conditions of a satellite or drone collecting images of deep water more closely to provide more generalizable results. Other limitations include potential inconsistencies in particle distribution and the stability of the hyperspectral imaging device itself.
The data analysis process is innovative due to the use of a spectrum vector, but it also has its share of uncertainties. The method of calculating the L2-norm and gradients is sensitive to variations in the initial conditions and noise. The assumptions made during the data normalization and preprocessing stages could introduce biases that might affect the final results. Moreover, the linear approach to gradient calculation might oversimplify the complex interactions between particle size, concentration, and hyperspectral response. A more robust statistical analysis or machine learning technique may be employed to improve the reliability of the findings.
To build upon this study, future research should consider field studies to validate the laboratory findings under real-world conditions. Different types of sediments with a broader range of particle sizes and concentrations should be investigated to enhance the generalizability of the results. Improved experimental setups that mitigate the current limitations and incorporate advanced data processing techniques would also be beneficial. Additionally, exploring the effectiveness of hyperspectral imaging across various environmental settings and sediment types could provide deeper insights and contribute significantly to the fields of environmental monitoring and remote sensing. The ability to measure spatial variation with standard deviation may also provide additional insights in future research. A similar experimental setup could be used to simulate and measure light attenuation in a water column.
5. Conclusions
In this study, we investigated hyperspectral imaging’s response to varying particle sizes and concentrations in sediment samples. By defining hyperspectral vectors and calculating their L2-norm relative to a white background control, we were able to discern patterns and sensitivities among different particle sizes and concentrations. Our findings indicate that higher concentrations generally correspond to higher L2-norm values, and the sensitivity of hyperspectral imaging to concentration changes is most pronounced at lower concentrations and for smaller particles.
Furthermore, the analysis revealed that the red and near-infrared (NIR) bands are particularly effective in detecting variations in concentration and particle size, suggesting that future hyperspectral imaging systems should focus on these regions to achieve greater sensitivity and accuracy. We also identified noise at the extreme ends of the spectrum, which introduces some uncertainty into the data, particularly for low concentrations and large particles.
This study is probably the first to reveal the inflection points associated with a suspended sediment solution. First, the correlation of the radiance with concentration and particle size was found to be opposing for low and high levels of concentration. Second, the inflection points of the correlations have the same trend of increasing with higher wavelengths. Third, the sensitivity of the radiance is complicated: the radiance is more sensitive to concentration variance at low concentrations and more sensitive to particle size for smaller particles. Machine learning models are developed for averaged bands to examine whether existing satellite bands can support suspended sediment characteristics. The results show that the machine learning models can reach up to an R-score of 0.7 to 0.8, indicating that more sophisticated models or more training data are needed to develop a practice-level remote sensing scheme.
In conclusion, our results underscore the potential of hyperspectral imaging as a powerful tool for analyzing sediment characteristics, particularly when leveraging the higher sensitivity of the red and NIR bands. Future research should aim to validate these findings in real-world field studies and across a wider variety of sediment types. Additionally, refining experimental setups and data analysis techniques will be crucial in advancing the application of hyperspectral imaging in environmental monitoring and remote sensing.

