1. Introduction
Groundwater is a primary source of drinking water for almost two billion people worldwide [
1]. Moreover, it is critically important for energy, food security, human health, and ecosystems [
2]. Yet, depletion of groundwater reserves is a common phenomenon in both humid and semi-arid regions of the world. Although non-sustainable groundwater exploitation has been documented on both regional and global scales in the last decades [
3], specific spatiotemporal characteristics need to be further studied and quantified. The phenomenon of groundwater depletion occurs when extraction from an aquifer exceeds recharge within a hydrological year, with the extent of the depletion effects being also determined by the aquifer type. Several research challenges prevail, the most significant being the quantification of factors triggering groundwater depletion [
3,
4,
5]. Inevitably, depletion leads to increased pumping costs and the reduction of groundwater discharge to streams, springs, and wetlands, affecting ecosystems [
6]. Additionally, lowered water tables induce groundwater flow, which can lead to salinization by seawater intrusion in coastal aquifers [
7]. Eventually, groundwater depletion can even lead to dry wells.
The main cause of groundwater depletion is excessive extraction for irrigation, especially in cases where an aquifer is only replenished gradually, while climate change and variability could potentially exacerbate the phenomenon in some regions [
8,
9]. Global food production has increased dramatically since 1970 due to advances in well-drilling equipment and electrical pumping [
10], and numerous wells have been operated in a largely unregulated manner, often replacing surface-water resources. Over-irrigation may lead to crop evapotranspiration levels above those of aquifer inflow [
11]. Accordingly, in some areas, groundwater levels have declined at rates even exceeding 1 m per year [
12]. On the other hand, climate-related changes might also influence recharge rates and aggravate groundwater depletion [
13] as recharge rates are influenced by the distribution and seasonality of snow coverage [
14] as well as drought events [
15]. Projecting the effects of climate change on groundwater is a challenging task with uncertainties in all stages of the processing chain [
16]. So far, the impact of climate change on aquifer depletion has only moderately been compared with non-climatic drivers [
17]. Such a comparison, although complex, can potentially divulge unknown aspects of groundwater depletion. Having a monitoring network of groundwater depth in an aquifer in conjunction with the geometrical and hydraulic parameters allows researchers to calculate the reserves and the depletion of the aquifer.
Effective strategies to mitigate groundwater depletion can be built on effective groundwater modeling, incorporating land use, climate, and water management scenarios [
18]. Nonetheless, groundwater modeling requires detailed hydrogeological and hydrological knowledge of a studied system to develop a robust conceptual model and increase reliability [
19]. Managed aquifer recharge (MAR) using treated wastewater or surface water could offer aquifer replenishment and reverse its depletion [
20]; however, it is a complex and high-cost option, and groundwater simulation models should evaluate it fully before its large-scale in situ application [
21]. Managed aquifer recharge also faces certain limitations regarding location, timing, available water, and its distance from the area to be recharged [
22].
Dams can store surface water in periods of abundant precipitation, protect lowlands from flooding, and provide supplies during periods with increased water demands. Recent studies have shown that groundwater depletion may be offset if more surface water is stored in reservoirs behind dams [
23]. Additionally, these dams can be transformed into mini-scale hydropower facilities—multi-scope dams—and produce clean energy. For instance, in Greece, small hydroelectricity applications have very good techno-economic performance and, therefore, a promising future [
24].
Due to its importance, the phenomenon of groundwater depletion needs to be further studied, adopting cutting-edge methods and integrated approaches. In Greece, the first attempt to study groundwater depletion dates back to 2013, and this was updated in 2018 through the development of the Water Resources Management Plans of Water Districts. These plans are limited to qualitative descriptions regarding only groundwater quantity and quality; however, they do provide unequivocal evidence that in certain regions of Greece, groundwater is being depleted [
25]. For instance, since 1980, the decline in groundwater level recorded in the coastal area of the Eastern Thermaikos Gulf has reached a rate of over 1 m per year and has caused salinization of the local aquifer up to 5 km inland. Similar problems have also been recorded in other Mediterranean countries [
4]. Particularly in coastal areas, the mismanagement of groundwater systems can lead to the drying-up of rivers and the deterioration of groundwater quality.
According to global practices, model-based strategies are an efficient tool to mitigate groundwater depletion [
26]. Mathematical models require that several parameters be measured and quantified before being introduced into the model. Vertical distribution and seasonality of snow coverage, drought events, and rainfall and temperature variations are some of the climatic parameters that influence groundwater depletion. Additionally, the aquifer type and hydraulic data, land use, population density, and availability of surface water for artificial groundwater recharge all constitute important aspects in the study of groundwater depletion. The critical step of every simulation process is model validation and verification.
The present study aims to multi-model groundwater depletion in representative aquifers of Greece and determine those parameters that have exacerbated this phenomenon. Moreover, various model-based strategies were simulated scenarios to inverse groundwater depletion. Field measurements in four pilot sites were used to validate the model parameters. The core of these scenarios was the use of small recharge dams, while their transformation to mini-scale hydropower facilities will provide clean energy production, reduce CO2 emissions, and lead to an economically feasible and eco-friendly strategy to combat groundwater depletion. Following energy production, the dam water is proposed to be used for managed aquifer recharge applications. The innovation of this article is the interdisciplinary approach applied to study the factors influencing groundwater depletion, map depletion zones, and simulate scenarios to reverse the phenomenon.
2. Study Areas
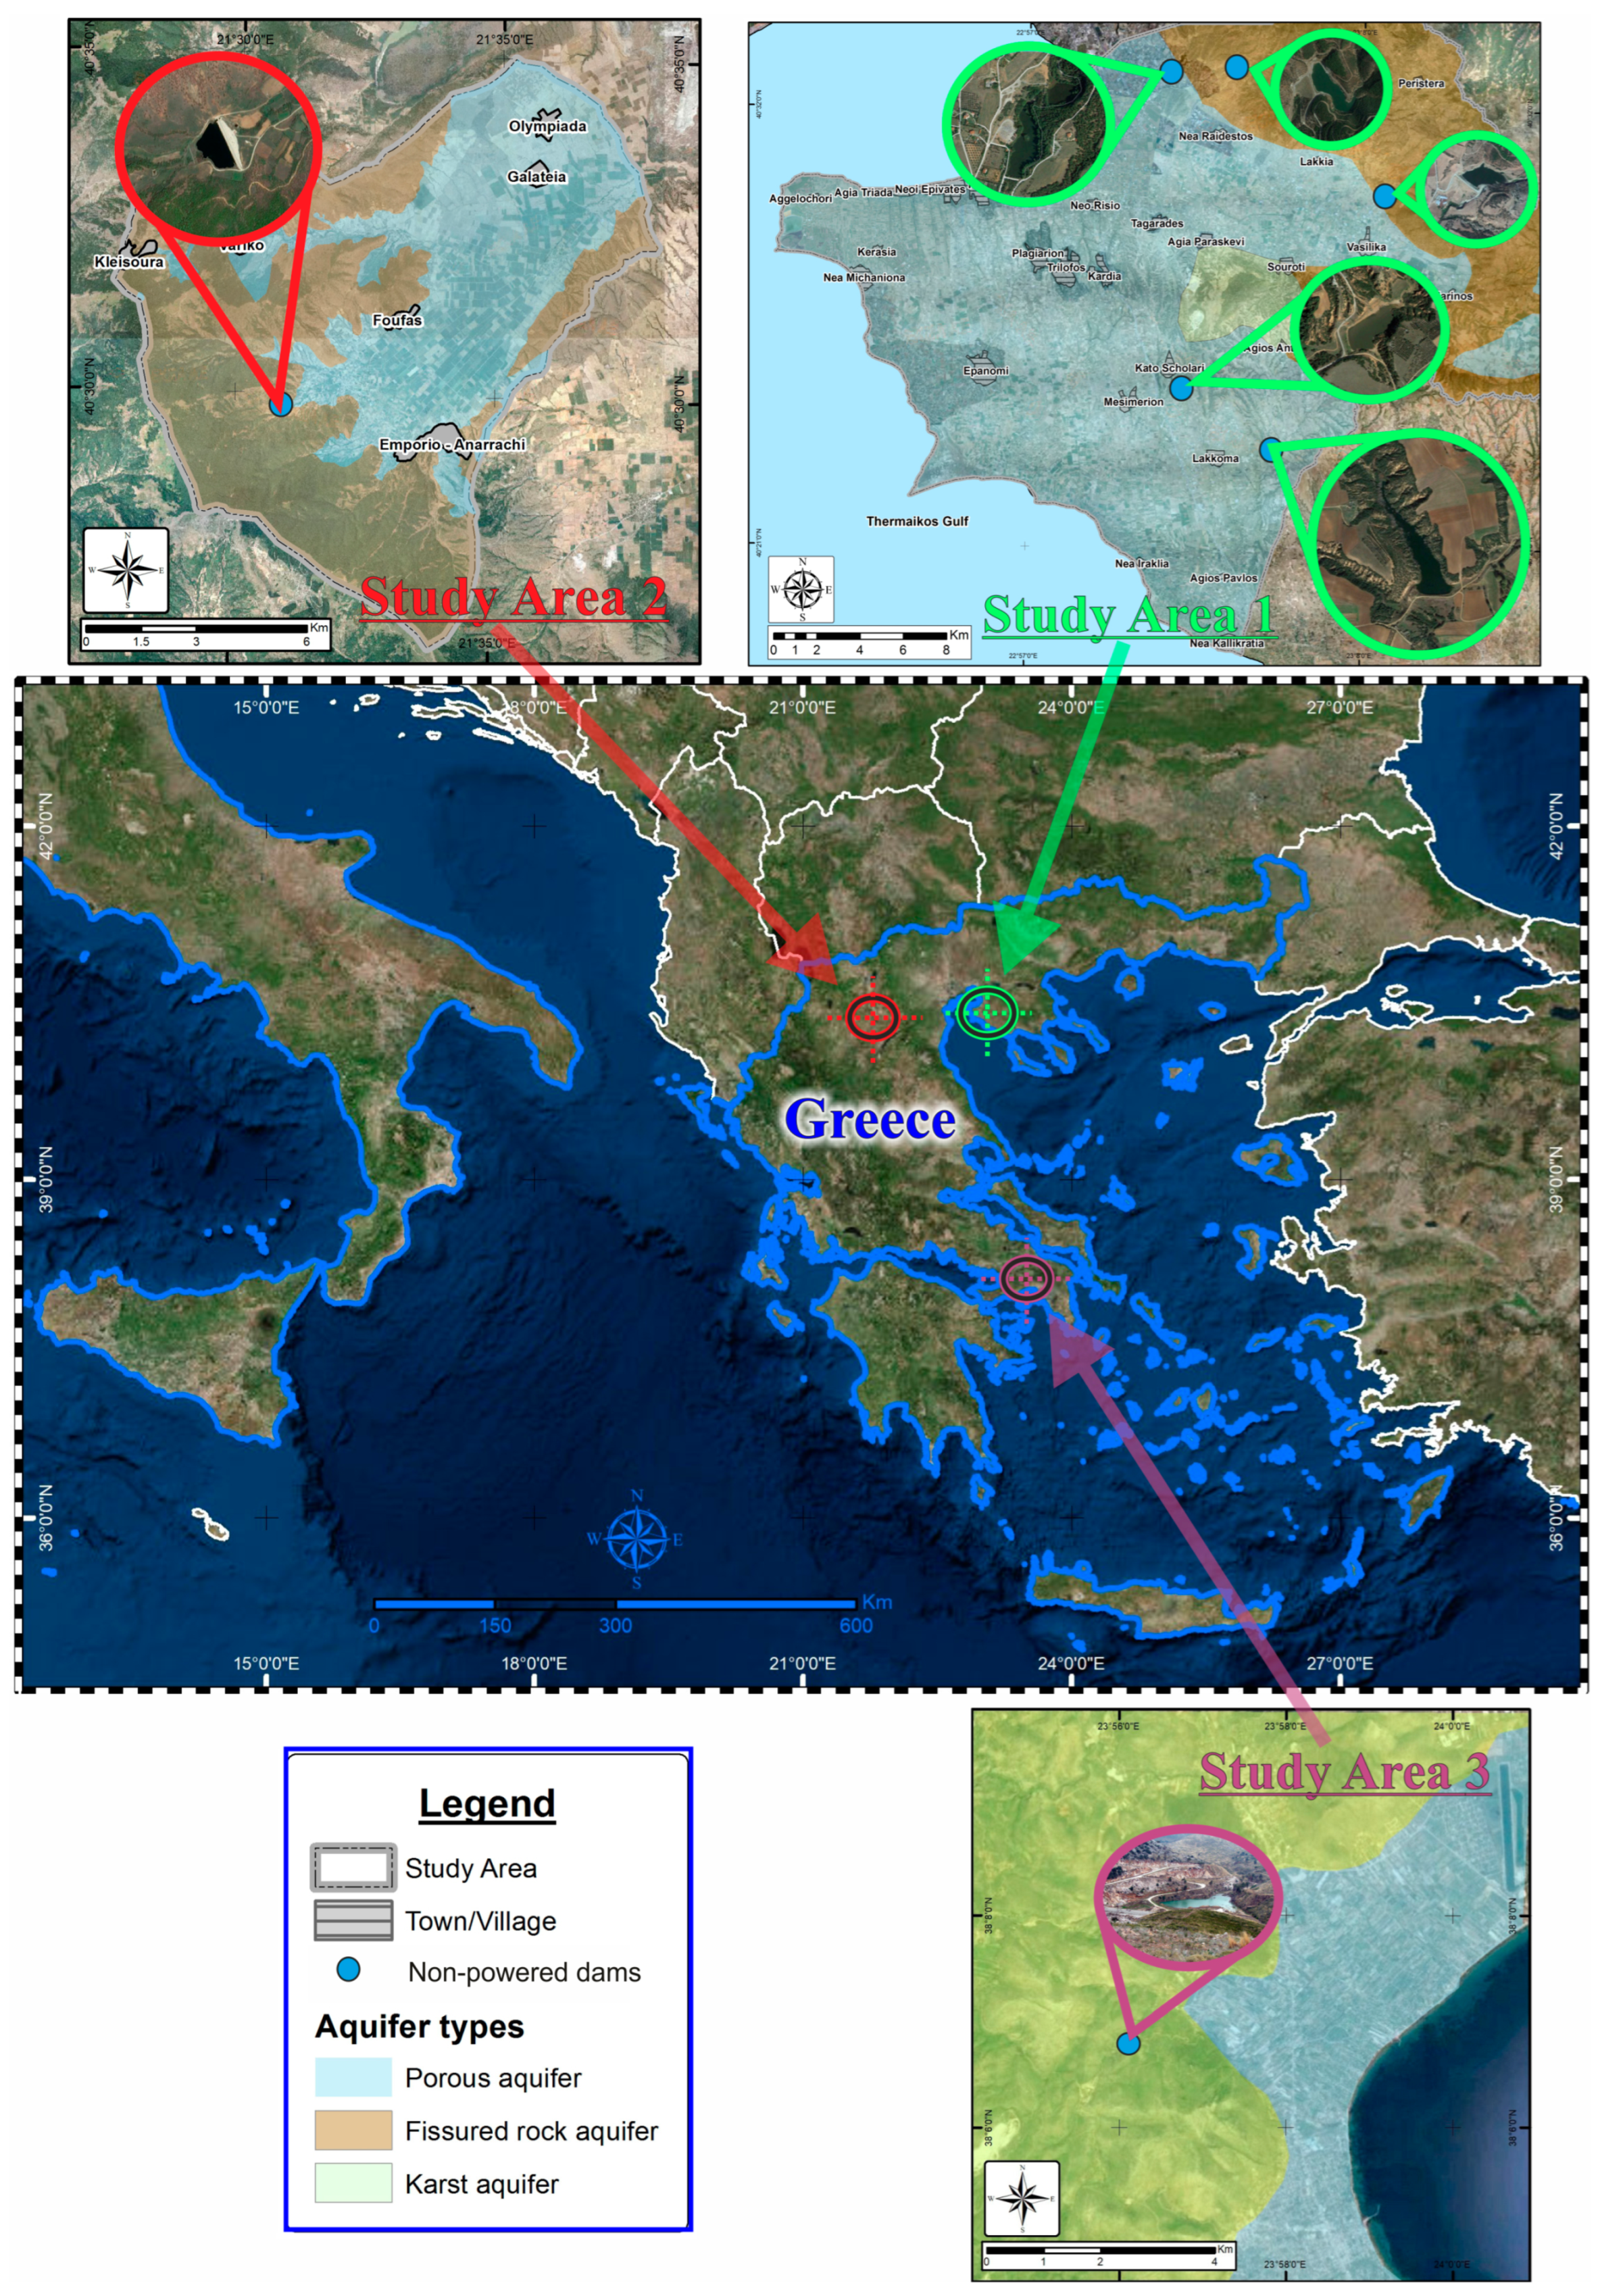
Three representative areas with different hydrogeological, climatological, and socio-economic characteristics and required data availability have been selected to accomplish the goals of this article (
Figure 1). The characteristics of each area are briefly described below:
Study area 1: Study area 1 is the coastal area of the eastern part of the Thermaikos Gulf located in northern Greece. Here, the mean annual rainfall is 451 mm, and the mean annual temperature is 15.1 °C. The lowest yearly rainfall is 250 mm, while the highest recorded was 750 mm. The lowest mean yearly temperature was 14 °C, while the highest recorded was 16.5 °C. Groundwater is the wider area’s main source of drinking water and agricultural, livestock, and industrial water demands are also met with groundwater. Porous-medium aquifers occur in sedimentary deposits, metamorphic and igneous rocks contain localized fractured-rock aquifers, whereas karst aquifers are found in areas underlain with limestones. The quality of groundwater is influenced by seawater intrusion that occurs in the coastal area of the study site, while geothermal fluids occur in the center of the site. The site contains five small dams which were built in the past to protect populated areas and farmlands from flooding.
Study area 2: The second area is the Mouriki basin located north of the city of Kozani in northern Greece. The mean annual precipitation in this area is 636.5 mm and the mean annual temperature is 11.2 °C. The main aquifer system is developed in alluvial formations with a mean thickness of 70 m. Significant fractured rock aquifers occur locally in areas underlain by crystalline basement rocks. Agricultural and livestock activities are mainly located in the lowlands, whereas mixed forest constitutes the land cover of the mountainous part of the study area. Nitrate pollution has been recorded here due to intensive agricultural activities [
27]. The area has one small dam which was also built for flood mitigation and agriculture.
Study area 3: Study area 3 is the basin of Marathonas located in central Greece near Athens. It has a mean annual rainfall of 380 mm and a mean annual temperature of 17.4 °C. A porous aquifer is located in the coastal section of the study area, whereas karstic aquifers are found in areas underlain by marble. In the sub-urban coastal zone, the groundwater is mainly used for irrigation and domestic use. The coastal aquifer is subjected to intense pumping due to the extensive local agricultural activities, with an extended irrigation period (for greenhouse crops) over most of the plain. As a result, groundwater depletion and seawater encroachment have occurred in the coastal aquifer, with the unconsolidated formation being more widely affected. One small dam was built in the study area to protect downstream areas from flooding but also in view of the Athens’ Marathon Route for the 2004 Olympic Games.
3. Methodology
The methodology of this study is based on the interdisciplinary approach of analyzing atmospheric parameters such as rainfall variation and intensity, snow variability, and drought. The next step was to model surface runoff with the Soil and Water Assessment Tool (SWAT) model using climatological data. Dam operation was simulated for hydropower generation and the output water—excluding environmental flow—was destined for managed aquifer recharge. The final step was the simulation of groundwater dynamics with Modflow code applying scenarios for the application of managed aquifer recharge using dam water for this purpose. A flow chart of the methodological approach is given in
Figure 2. It is worth mentioning that this study is part of a wider project named GRecoDAM and various data sets from this project have been presented analytically in previous publications [
28,
29,
30,
31]. Firstly, the optimal codes to simulate the interactions between groundwater and surface water were determined as Modflow-NWT and ArcSwat as these constitute the dominant approaches in the existing literature. Snowfall and its spatial distribution were also determined to: (a) supplement the modeling process, and (b) be correlated with groundwater depletion in the study areas [
31]. The ArcSWAT simulations obtained for the Eastern Thermaikos Gulf and Mouriki basin sites have been presented in previous research papers [
28,
30], while this study presents the simulation for the Marathonas basin. Hence, input was available for the dams and a code for hydropower optimization was developed as presented by Karakatsanis et al. [
29]. The current work presents the results of the dam simulations, as well as the groundwater simulations, mapping of depletion zones, and simulation of future conditions under the application of MAR. The optimal MAR method was determined to be injection wells which are located downstream of the dams. One critical question regarding the application of MAR is the quality of dam water used for recharging. This was studied by Kalaitzidou et al. [
32], who concluded that dam water is suitable for MAR application.
3.1. Geophysical Monitoring
The geophysical monitoring method of electrical resistivity tomography (ERT) in time-lapse mode was used in this study to determine the recharge regime in the eastern Thermaikos Gulf. The site was carefully chosen in the central part of the basin in order to study infiltration rates. A fixed line with 24 electrodes spaced 0.4 m apart was established and a combined protocol of dipole–dipole (195 data points) and multigradient arrays (442 data points) was measured at 4 h intervals using the 4-point light 10 W Lippmann resistivity meter. More than 4500 data sets (over 3 million measurements) were obtained between September 2021 and December 2023 and transferred to the base for processing. The ERT time-lapse system was supplemented by a probe to measure subsurface moisture and temperature at a depth of up to 1 m (10 measurements every 10 cm) and by a meteorological base station that recorded precipitation and air temperature data. The collected apparent resistivity data were routinely filtered for outliers. They were then inverted using a time-lapse inversion technique that produces smooth spatiotemporal resistivity models [
33]. The inverted models were corrected for temperature changes to avoid misinterpretation of the processes studied [
34]. Finally, the results of the geophysical monitoring were correlated with the moisture and precipitation data to determine the infiltration processes.
3.2. Estimation of Drought—SPEI Index
The Standardized Precipitation Evapotranspiration Index (SPEI) [
35] was applied to identify drought severity in the study areas. The SPEI drought index was chosen due to its limited input data requirements. Monthly values of precipitation and minimum and maximum values of temperature were used. The drought index was calculated for different aggregation periods (one, three, and six months) in the R programming code. The six-month time scale showed the optimum results, and the drought events were classified based on SPEI values (
Table S1). Forecast SPEI was calculated based on REMO2009 data with projections based on Representative Concentration Pathway 4.5 (RCP 4.5) for the period 2020–2040.
Meteorological data from the meteorological station of the Macedonia airport were collected to classify SPEI in the Eastern Thermaikos Gulf. For the Mouriki basin, meteorological data were collected from the Aristotelis meteorological station, while in the Marathonas basin, data from the Climate Forecast System Reanalysis (CFSR) model were used due to gaps in the existing datasets from nearby stations. The CFSR provides the best estimate of the state of coupled atmosphere-ocean-land surface-sea ice system domains in high resolution [
36].
3.3. ArcSwat Modelling
The Soil and Water Assessment Tool (SWAT) numerical model is a hydrological model created by the Agricultural Research Service, U.S. Department of Agriculture (USDA). The model aims to calculate the hydrological effects of land use changes and different soil types and slopes, as well as the climate of an area in terms of water quantity and quality, based on the creation of hydrologic response units (HRUs) [
37,
38].
For the Marathonas basin site, SWAT modeling was based on the same approach applied to the Mouriki and Thermaikos Gulf sites [
28]. DEM, soil, and land use data were used (
Figure S1) to create the basin’s HRUs. The Climate Forecast System Reanalysis (CFSR) model was used for the simulation’s climate data. The basin was divided into 93 sub-basins and a total of 500 HRUs. According to the FAO Digital Soil Map of the World (DSMW), the basin is characterized by chromic luvisols and calcaric regosols. The area is mainly agricultural, dominated by vegetable crops, and the upper part of the basin is covered by forests. The predicted future climate data were obtained from the Coordinated Regional Climate Downscaling Experiment (CORDEX), considering the Representative Concentration Pathway (RCP) 4.5 and the climate model REMO2009 [
39] for the period 2020–2040. The Hargreaves method was used to calculate potential evapotranspiration (PET) followed by a double calibration/validation (CV) procedure conducted using MODIS ET due to the complete lack of hydrometric data in the area. The data of the MOD16A2 Version 6 Total ET product was downloaded using the AppEARS interface and the MYD16A3GF model [
40]. The calibration parameters used were the same as those applied by Busico et al. [
28] for the Anthemountas and Mouriki basins due to the comparable hydroclimatic conditions. Calibration with average ET values from MODIS in a specific sub-basin showed an acceptable trend with an R
2 of 0.74, while validation resulted in another selected sub-basin with an R
2 of 0.71.
3.4. Dam Operation Modelling
The dam optimization code introduced by Karakatsanis et al. [
29] was used in this study to optimize the hydropower generation of the existing dams in the study areas. The geometrical characteristics were obtained from previous studies [
32]. The code adopts a metaheuristic optimization model, leveraging the harmony search algorithm, representing a strategic approach to maximizing energy production while navigating a plethora of operational constraints. Moreover, the optimization objectives of the model extend beyond energy maximization; they encompass the imperative of minimizing the drop in the water level of the underground aquifer. These dual objectives underscore a holistic approach aimed at balancing energy production with the preservation of groundwater resources.
3.5. Groundwater Modelling
The MODFLOW-NWT code [
41,
42] was used to simulate the groundwater flow of the porous aquifers in all four study sites with the open-source software ModelMuse [
43]. The code proved to be suitable for MAR application and has also been applied in coastal aquifers with reliable results [
42]. A groundwater flow model necessitates defining classic parameters such as aquifer depth, as well as length and width dimensions. Cell dimensions of 250 × 250 m were selected for the discretization package. The boundaries of the aquifer were delineated using the Generalized Boundary Condition (GBH), and model calibration was conducted using groundwater head from observation well data. For the modeling process, head measurements from 95 wells in the Eastern Thermaikos Gulf, 30 wells in the Mouriki basin, and 21 wells in the Marathonas basin were used. Data from the ArcSWAT simulation were utilized for the recharge package (RCH). The conceptual models are shown in
Figure S2, while
Table S2 shows all the details of the models. Specific storage, specific yield, and conductance were validated through a meticulous calibration process of the models, which involved comparing simulated groundwater heads with observed values from monitoring wells. Additionally, values from the literature and expert knowledge were utilized to validate and refine the parameter estimates. A sensitivity analysis was conducted for each parameter, wherein variations of ±20% from the derived values were tested to assess their impact on model outputs. This analysis indicated that the specific storage, specific yield, and conductance parameters are not highly sensitive within this range, suggesting that the calibrated values are robust and reliable for the purposes of the study. It is important to note that in the Soil and Water Assessment Tool (SWAT) simulation, which preceded the application of the MODFLOW model, data for river flow, evapotranspiration, and other hydrological parameters related to soil media have been already considered and assessed, representing the initial conditions for the subsequent groundwater flow modeling. While it is acknowledged that the use of a single layer and a single value of hydraulic conductivity may not fully capture the complexity of the hydrogeological units within the Anthemountas basin, especially considering the detailed site descriptions provided, the decision to adopt simpler models was made to balance computational efficiency with model accuracy. More complex models, while more representative, can pose significant computational challenges, particularly during optimization processes, especially when different software packages are combined. Thus, the selected modeling approach aimed to strike a balance between accuracy and computational feasibility, while ensuring that the models adequately represent the groundwater flow dynamics in the study areas.
The simulation periods were designed to capture distinct phases of groundwater management and resource utilization: (a) The initial period from 2010 to 2020 focuses on assessing the historical trend of aquifer depletion. Based on this data, the baseline of groundwater depth was established in order to understand groundwater dynamics over the past decade using field measurements. (b) Extending the analysis to the subsequent decade, from 2020 to 2030. This period enables the projection of future trends in aquifer depletion under existing management practices and anticipated changes in water demand and availability. (c) Introducing MAR application from the years 2030 to 2040 represents a proactive approach to replenishing groundwater resources using available dam infrastructure. This simulation period evaluates the efficacy of such interventions in mitigating depletion and enhancing groundwater sustainability. (d) Building upon the previous scenario, the inclusion of additional dam projects offers insights into the potential benefits of expanding water management infrastructure and its implications for groundwater replenishment.
Data from previous studies were used to validate the model. The final depletion maps were defined according to the simulation results in the GIS environment to quantify the phenomenon, and historical data were used as a reference point to determine groundwater depletion. The piezometric head was obtained from future modeling scenarios and transferred to GIS in order to be compared with the baseline groundwater head. Then, the depletion zones were mapped, and the coverage percentage was calculated.
4. Results
According to the SPEI index, seventeen drought periods lasting more than 15 months are recorded in the Eastern Thermaikos Gulf between 1958 and 2040 (
Figure 3). Two mild drought periods are observed from March 1961 to December 1962 (22 months) and November 2031 to April 2033 (18 months). Two mild-to-moderate drought periods are noted from May 1999–September 2000 (17 months) and May 2034–October 2036 (30 months). Six mild-to-severe drought periods are noted from June 1958–November 1960 (30 months), December 1976–August 1978 (21 months), November 1980–October 1982 (24 months), June 2003–September 2007 (51 months), October 2028–August 2031 (35 months), and December 2036–December 2040 (49 months). One moderate-to-extreme drought period is noted from July 1996 to March 1999 (33 months). Six mild-to-moderate drought periods are observed from July 1965–October 1966 (16 months), December 1982–February 1984 (15 months), June 1984–January 1986 (20 months), April 1988–May 1996 (98 months), December 2007–May 2014 (78 months), and May 2021–August 2028 (88 months). Twelve wet months are noted from June 2014–May 2015 and May 2033–April 2034, while one period of fourteen wet months is observed from March 2020 to April 2021. These months are characterized as moderate-to-extreme wet periods.
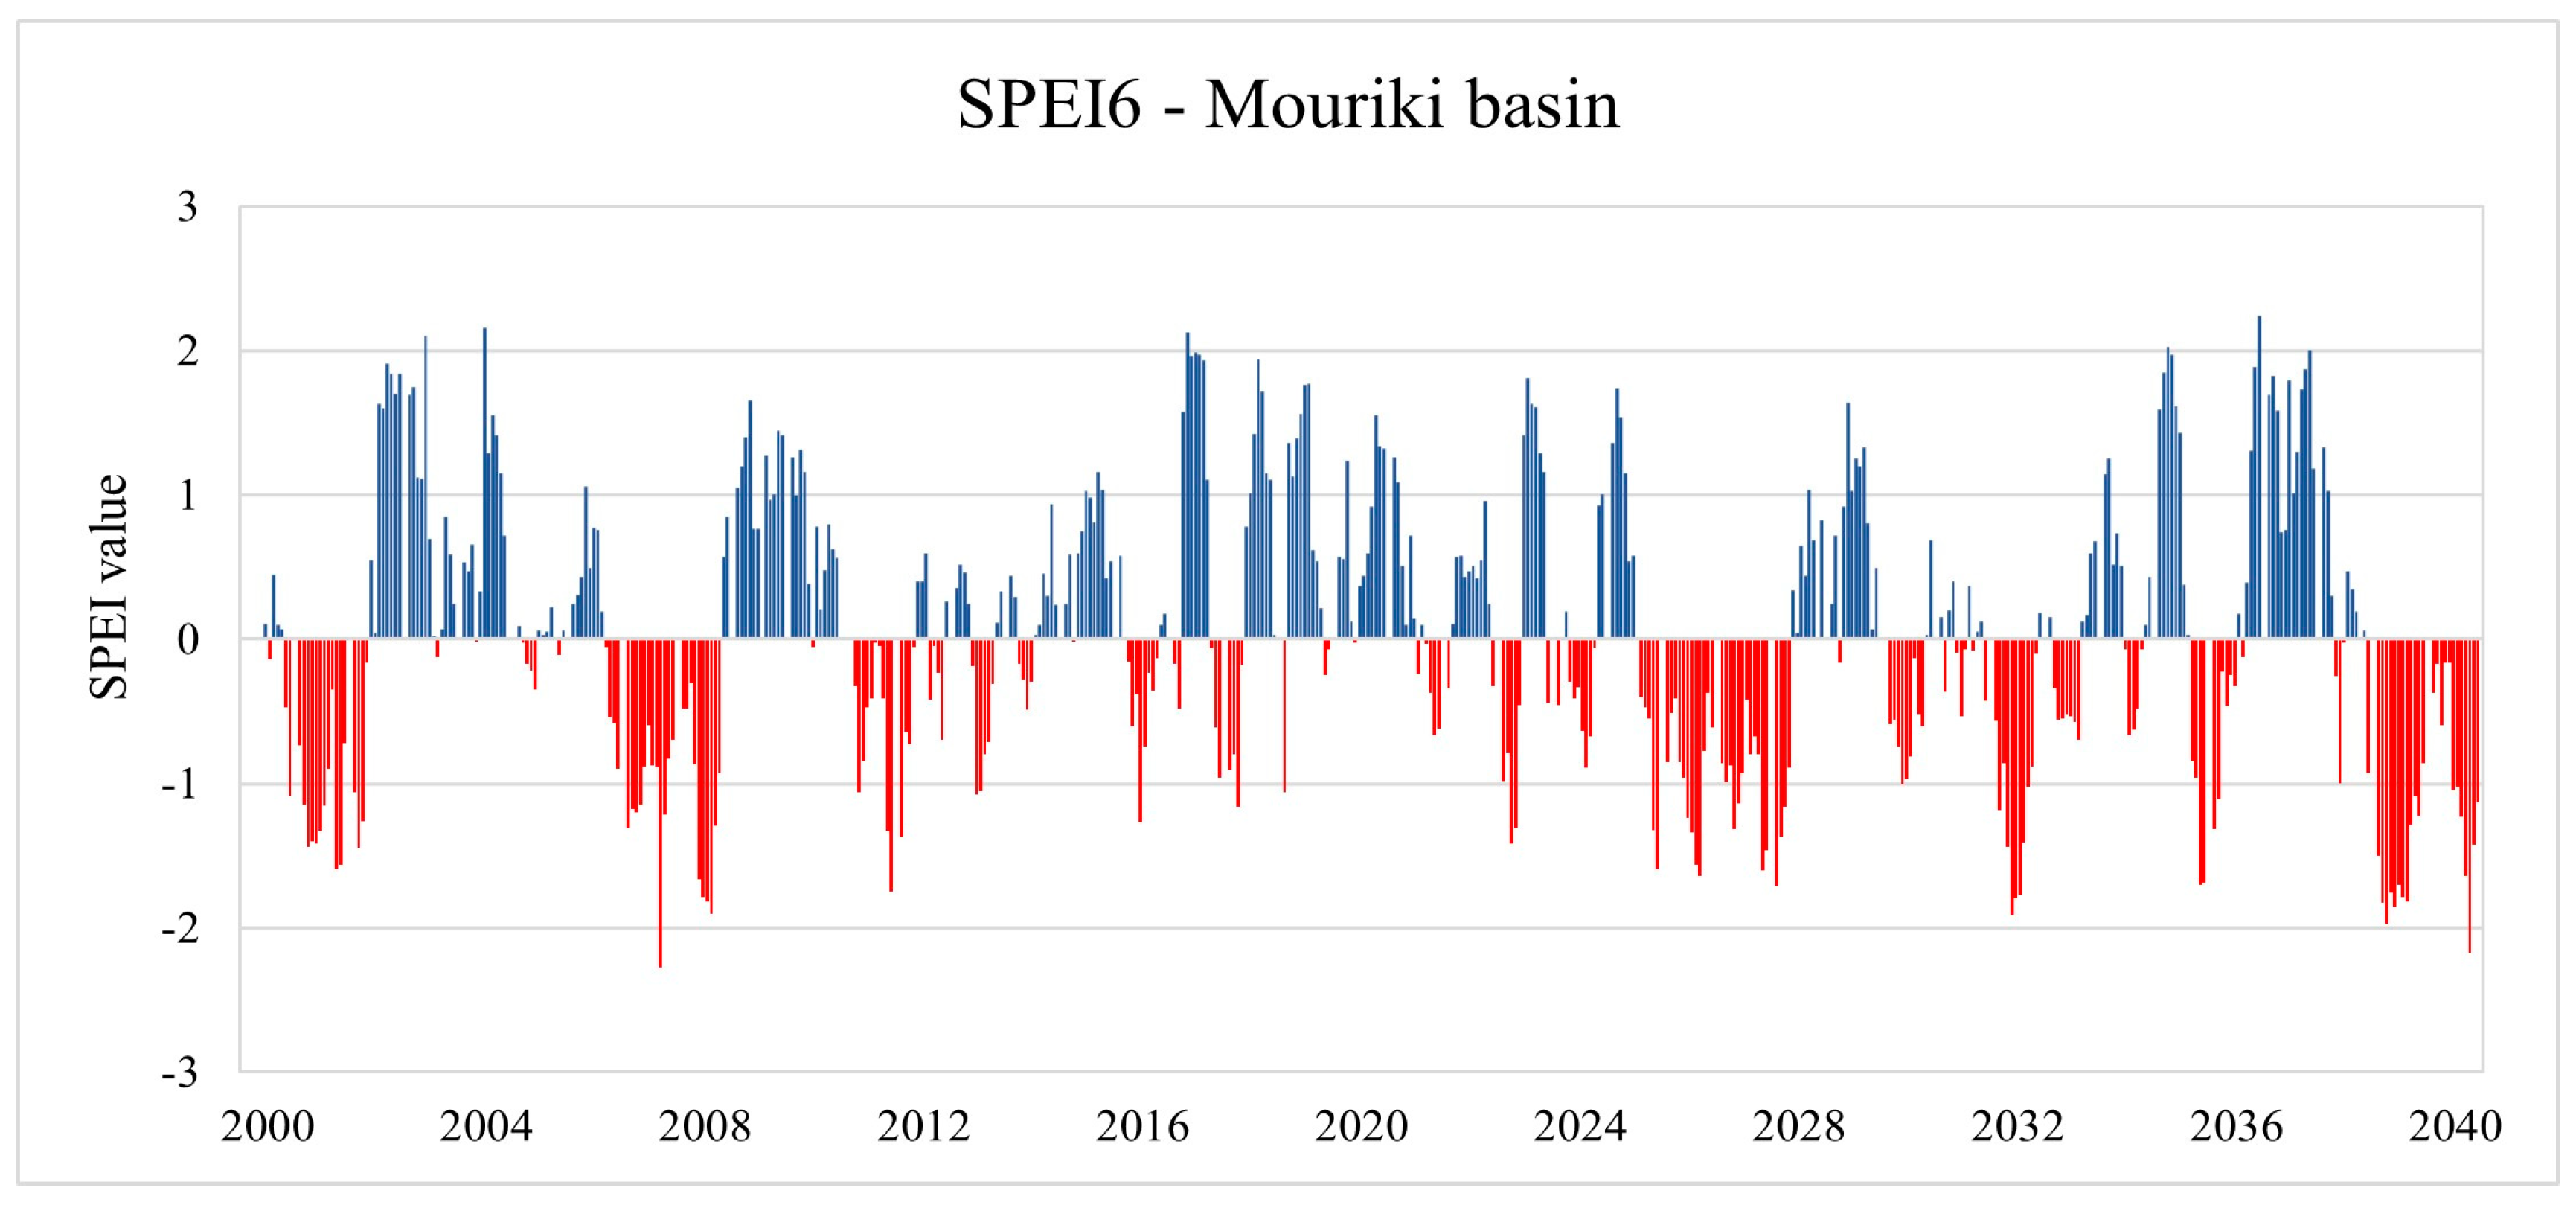
In the Mouriki basin, ten drought periods with a duration of more than 15 months occur (
Figure 4). One mild drought period is noted from November 2004–March 2006 (17 months). Two mild-to-moderate drought periods are observed from November 2015–February 2017 (16 months) and March 2021–May 2023 (27 months). Four mild-to-severe drought periods are noted from May 2011–May 2015 (61 months), May 2025–August 2028 (40 months), October 2029–December 2033 (51 months), and July 2035–September 2036 (15 months). Three mild-to-extreme drought periods are noted from June 2000–June 2002 (25 months), May 2006–December 2008 (32 months), and March 2038–December 2040 (34 months). One long wet period is noted from July 2002–May 2003 (11 months of moderately to extremely wet).
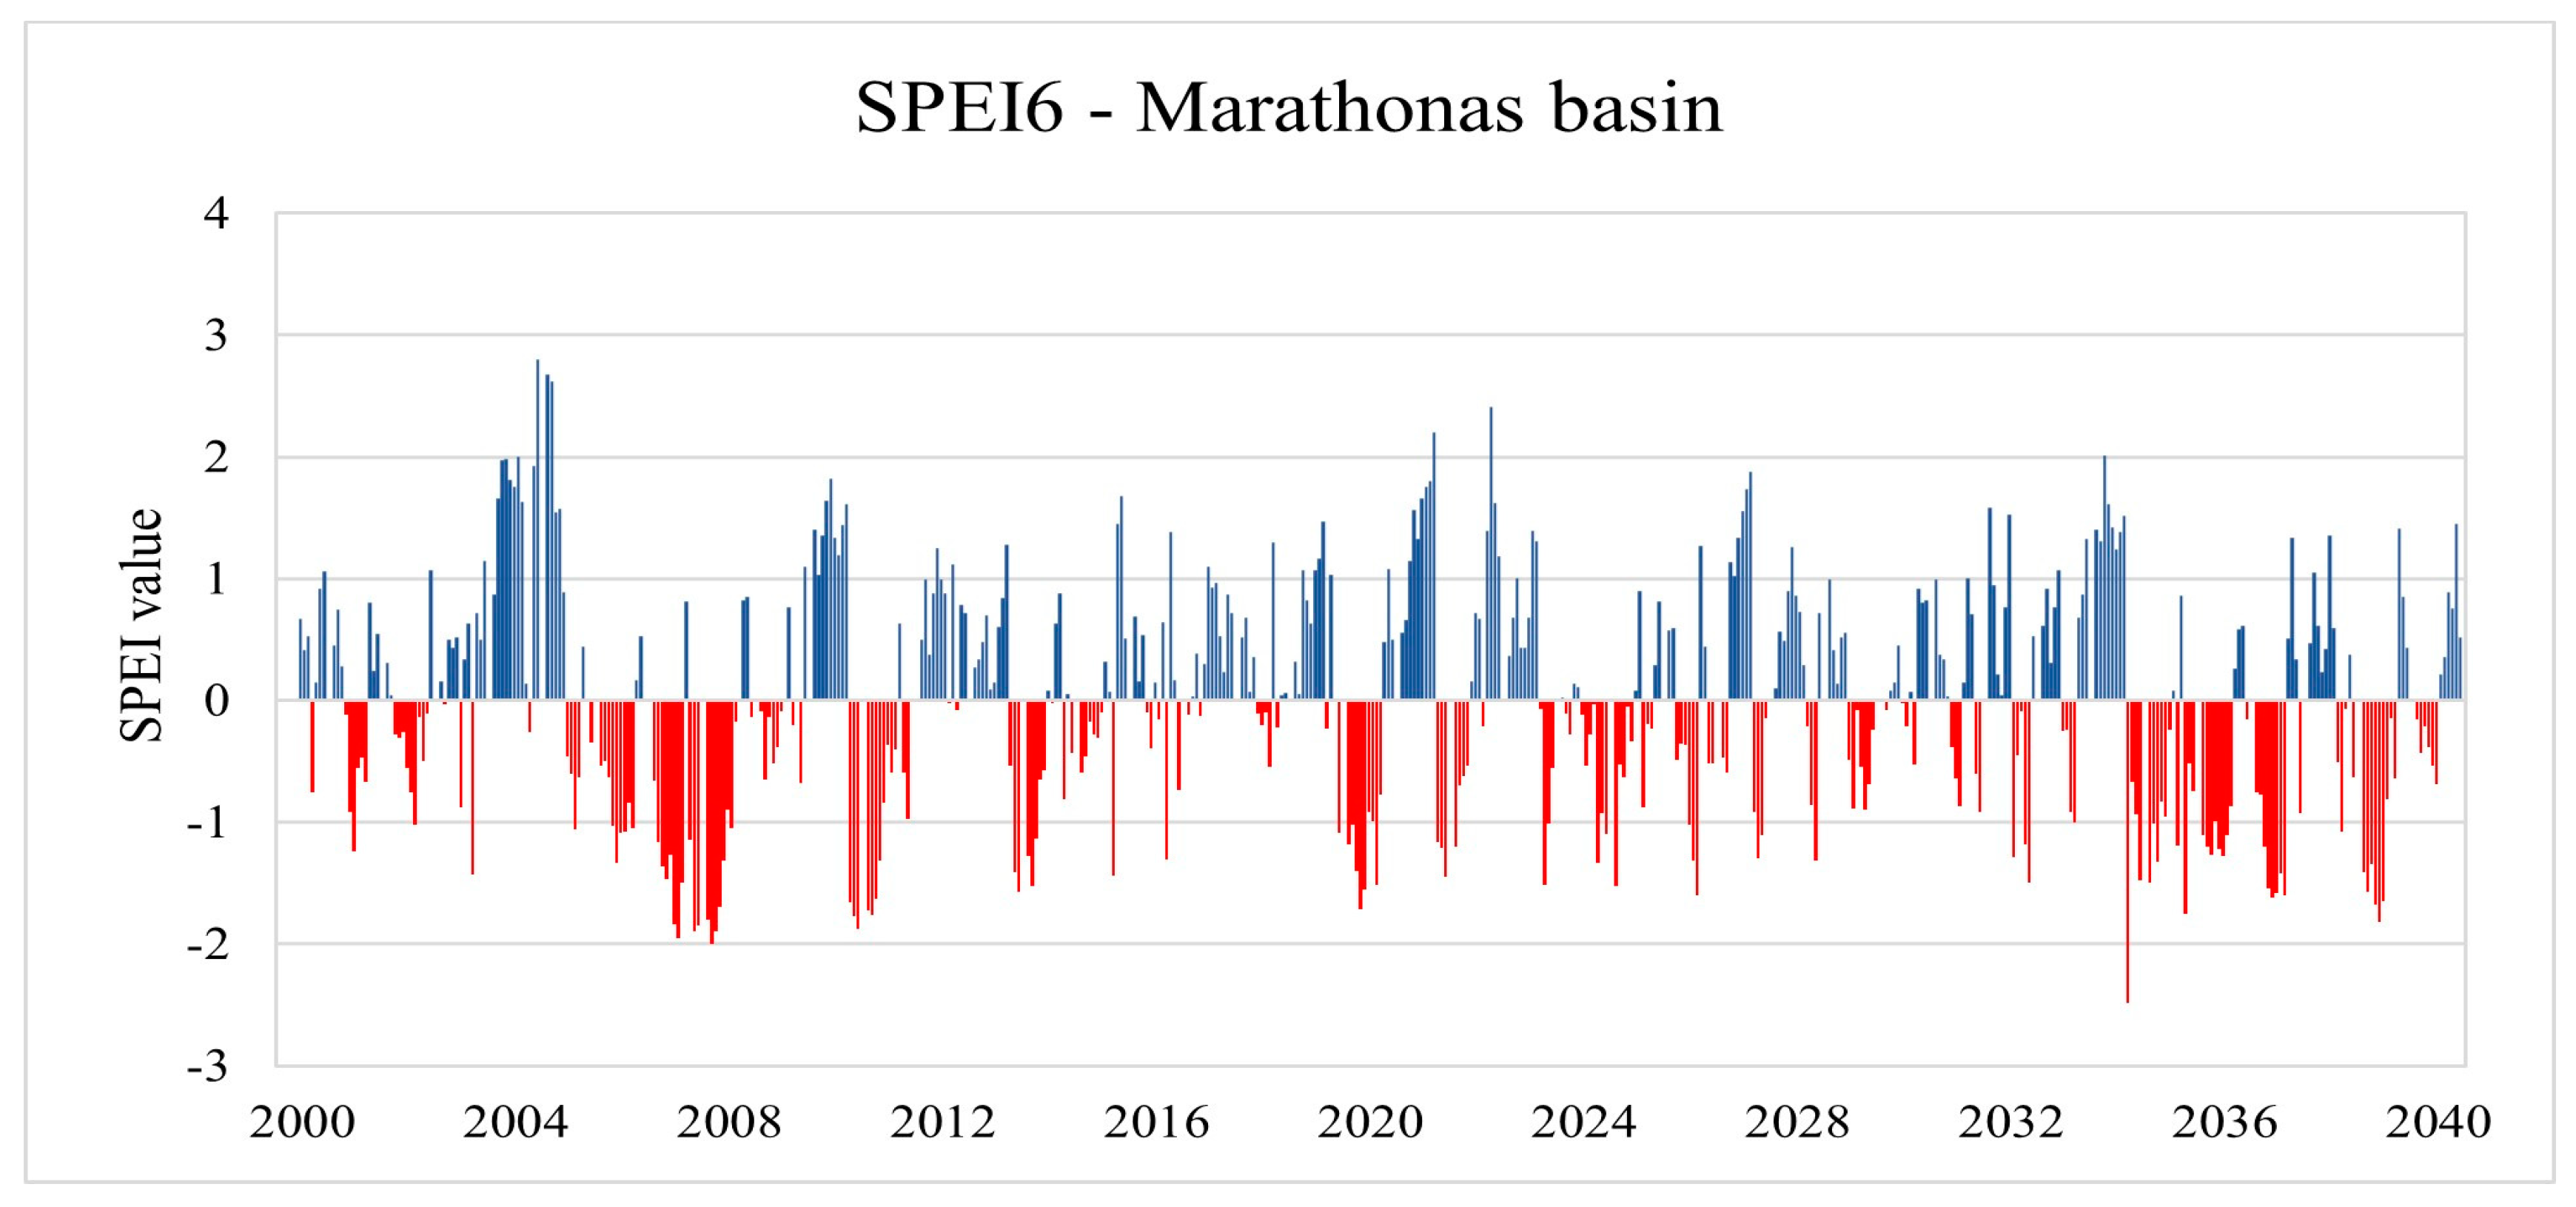
In the Marathonas basin, the longest period of drought is 55 months (
Figure 5). Two drought periods of mild-to-moderate drought are observed from January 2001–November 2002 (23 months) and June 2008–August 2031 (39 months). Two periods of mild-to-extreme drought are observed from May 2005–November 2009 (55 months) and September 2034–September 2037 (37 months). Four periods of mild-to-severe drought are noted from October 2010–April 2012 (18 months), October 2013–September 2015 (24 months), September 2023–August 2026 (36 months), and July 2038–September 2039 (15 months). No long-wet periods are observed in the Marathonas basin. From the above analysis, it is apparent that future projection is characterized by long periods of drought in all three sites studied.
The monitoring parameters of ERT median values in the upper vadose zone of the Eastern Thermaikos Gulf are shown in
Figure S3. These data were analyzed for all precipitation events and an example is shown in
Figure S4. The analysis showed that from June to October, recharge from precipitation is negligible or zero. Additionally, the recharge rates are variable, reaching up to 30 days per meter to penetrate from the upper vadose zone to deeper zones. These results are in accordance with the piezometric head of the monitoring wells.
The results of the ArcSWAT simulation in the Marathonas basin are shown in
Figure S5 in mm and m
3. The total average annual ET in the Marathonas basin accounted for 67% of the hydrological balance, while recharge and runoff account for 11% and 22%, respectively. The mean annual recharge for the 2000–2019 period was 12.8 × 10
6 m
3, while the average runoff value was calculated as 27.3 × 10
6 m
3 per year. The simulation for 2020–2040 under the RCP 4.5 scenario predicts significant differences in the average percentages of the runoff and recharge parameters.
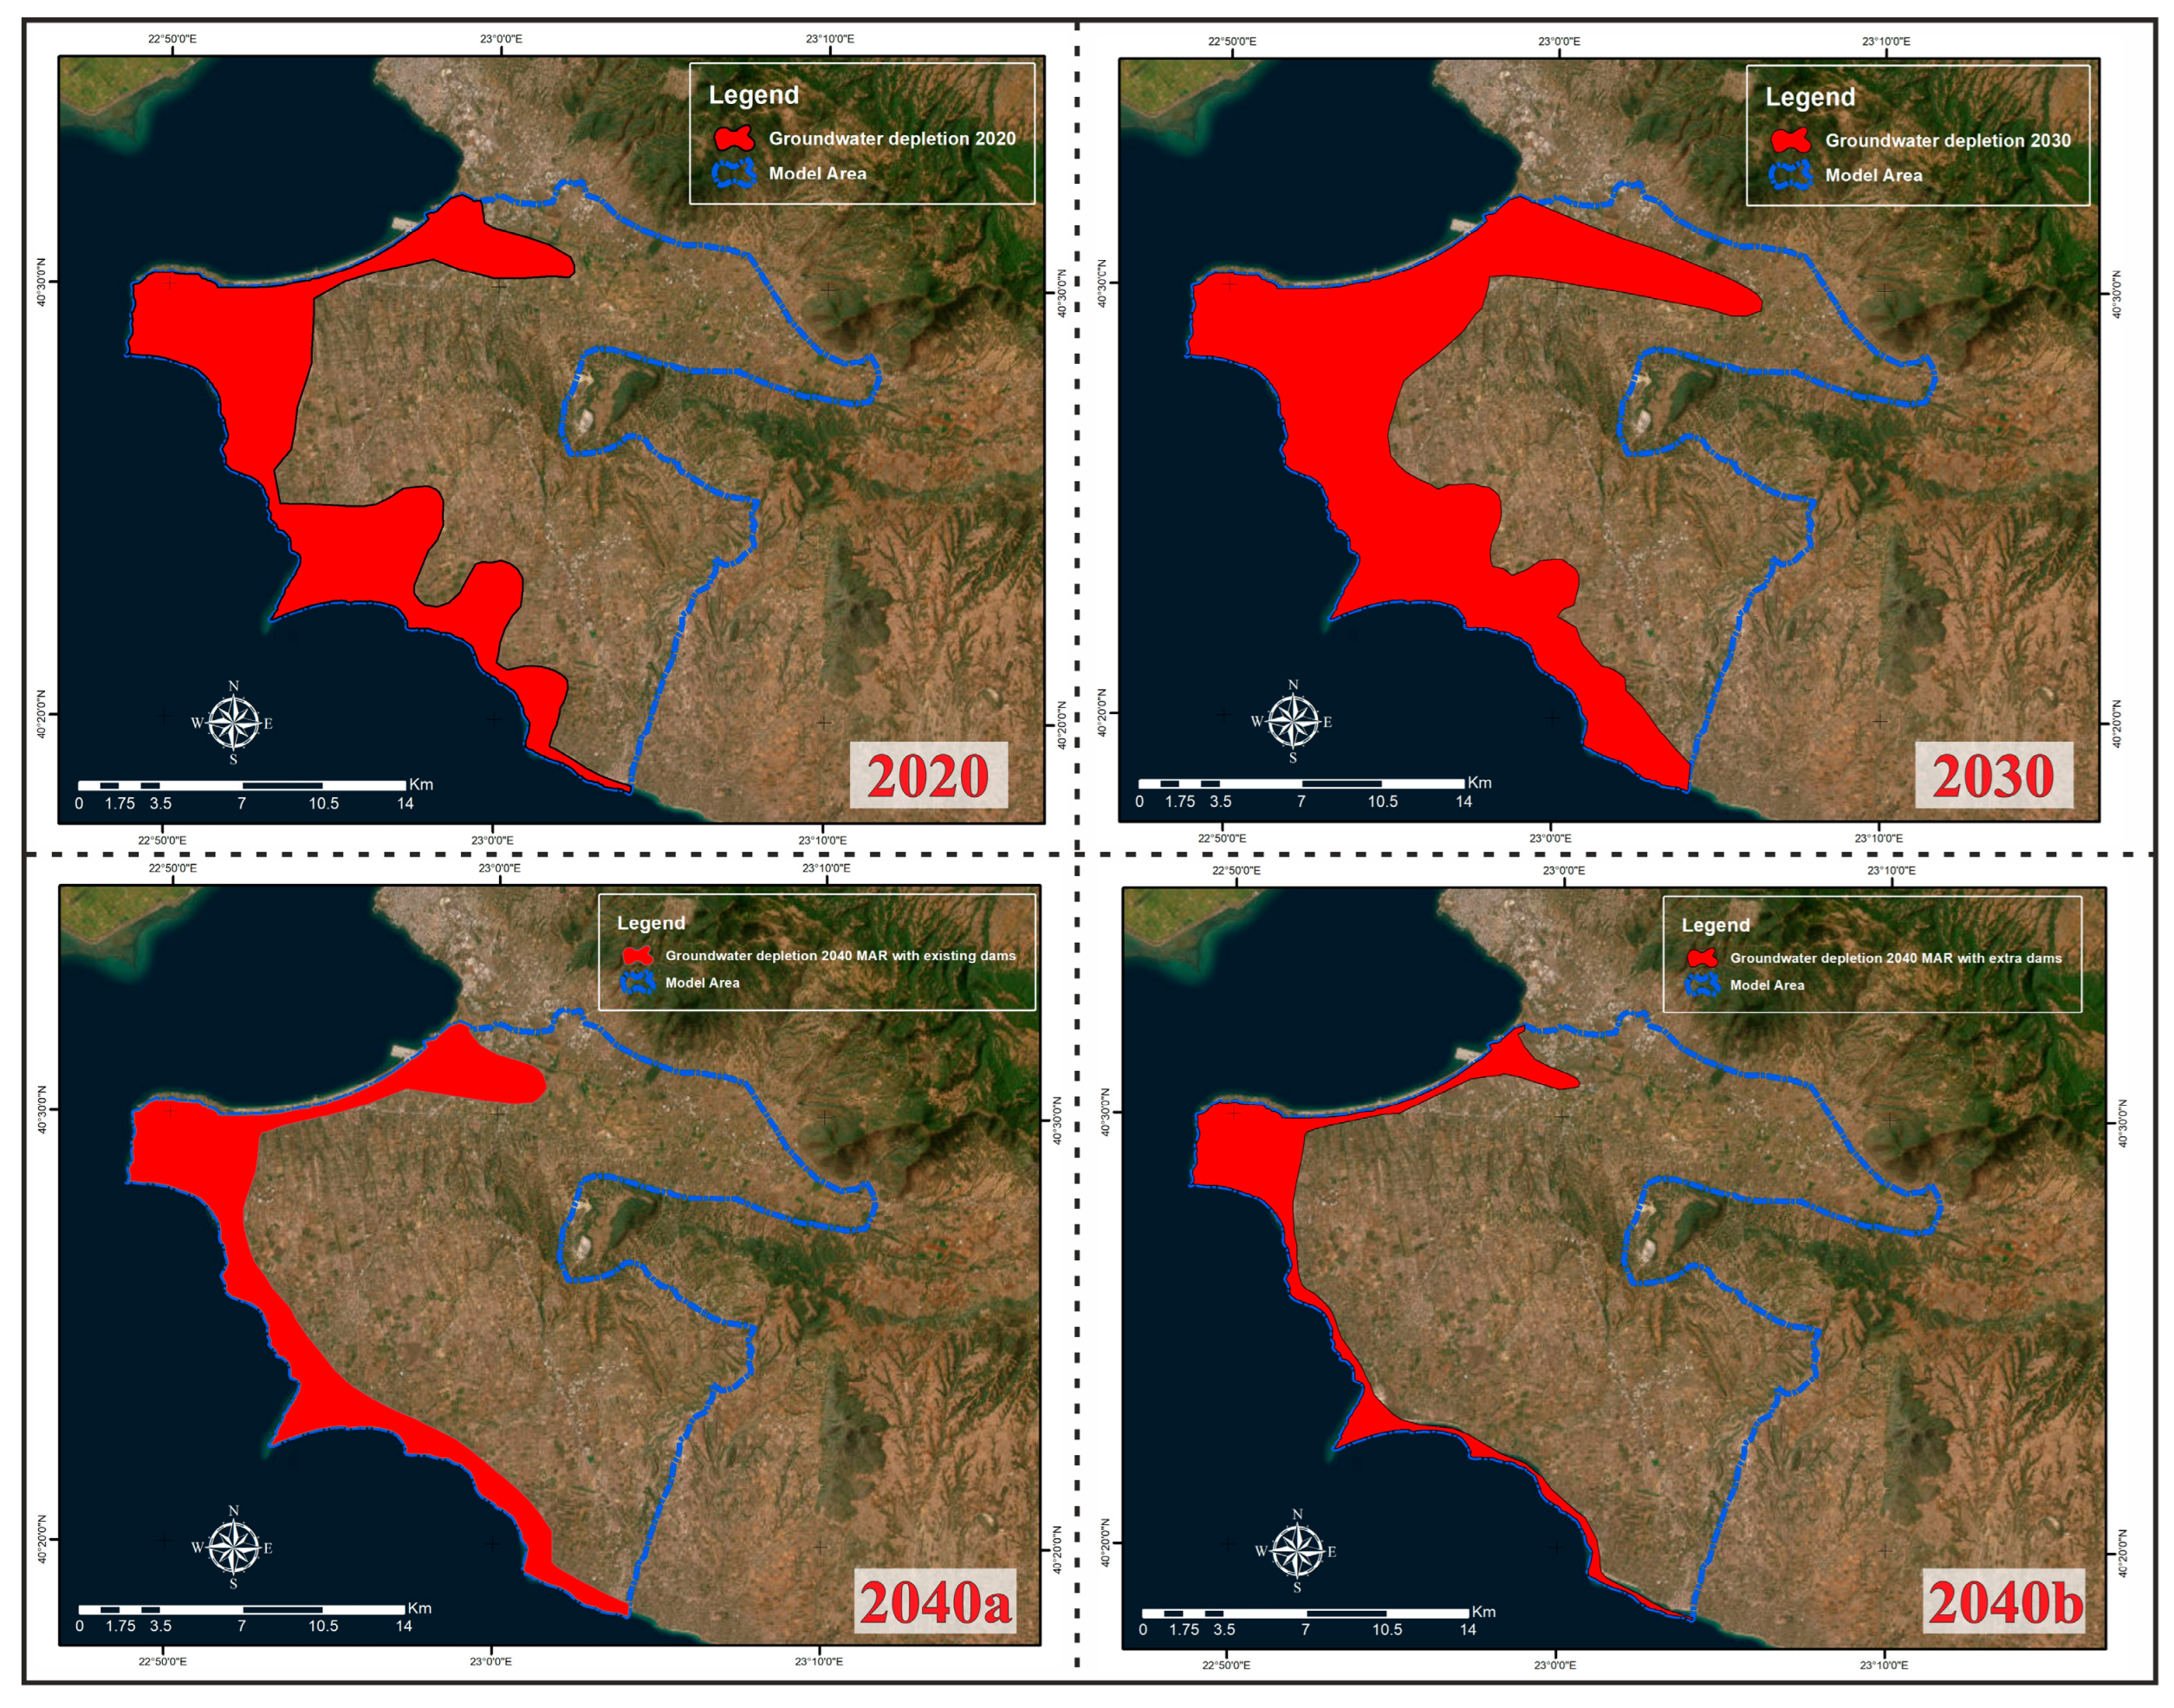
The groundwater simulation revealed that groundwater depletion occurs in the Eastern Thermaikos Gulf and the Marathonas and Mouriki basins.
In Eastern Thermaikos, the piezometric head for the year 2020 has negative values of up to −6 m near the coastline (
Figure S6), while groundwater decline will lead to a negative piezometric head of up to −13.6 m until the year 2030 (
Figure S7). Toward the mainland, the piezometric head reaches 62 m in 2020, while a drop to 55 m occurs in the simulation of 2030. During the year 2020, groundwater depletion extended to 27.7% of the porous aquifer (
Table 1); however, the simulation forecasts that the groundwater depletion zone will cover up to 42% of the aquifer by the year 2030 (
Table 1).
The scenario involving MAR applying water from the site’s existing small dams from 2030 to 2040 is depicted in the negative piezometric head which decreases to −0.84 m (
Figure S8), while the depletion zones decline to 18% (
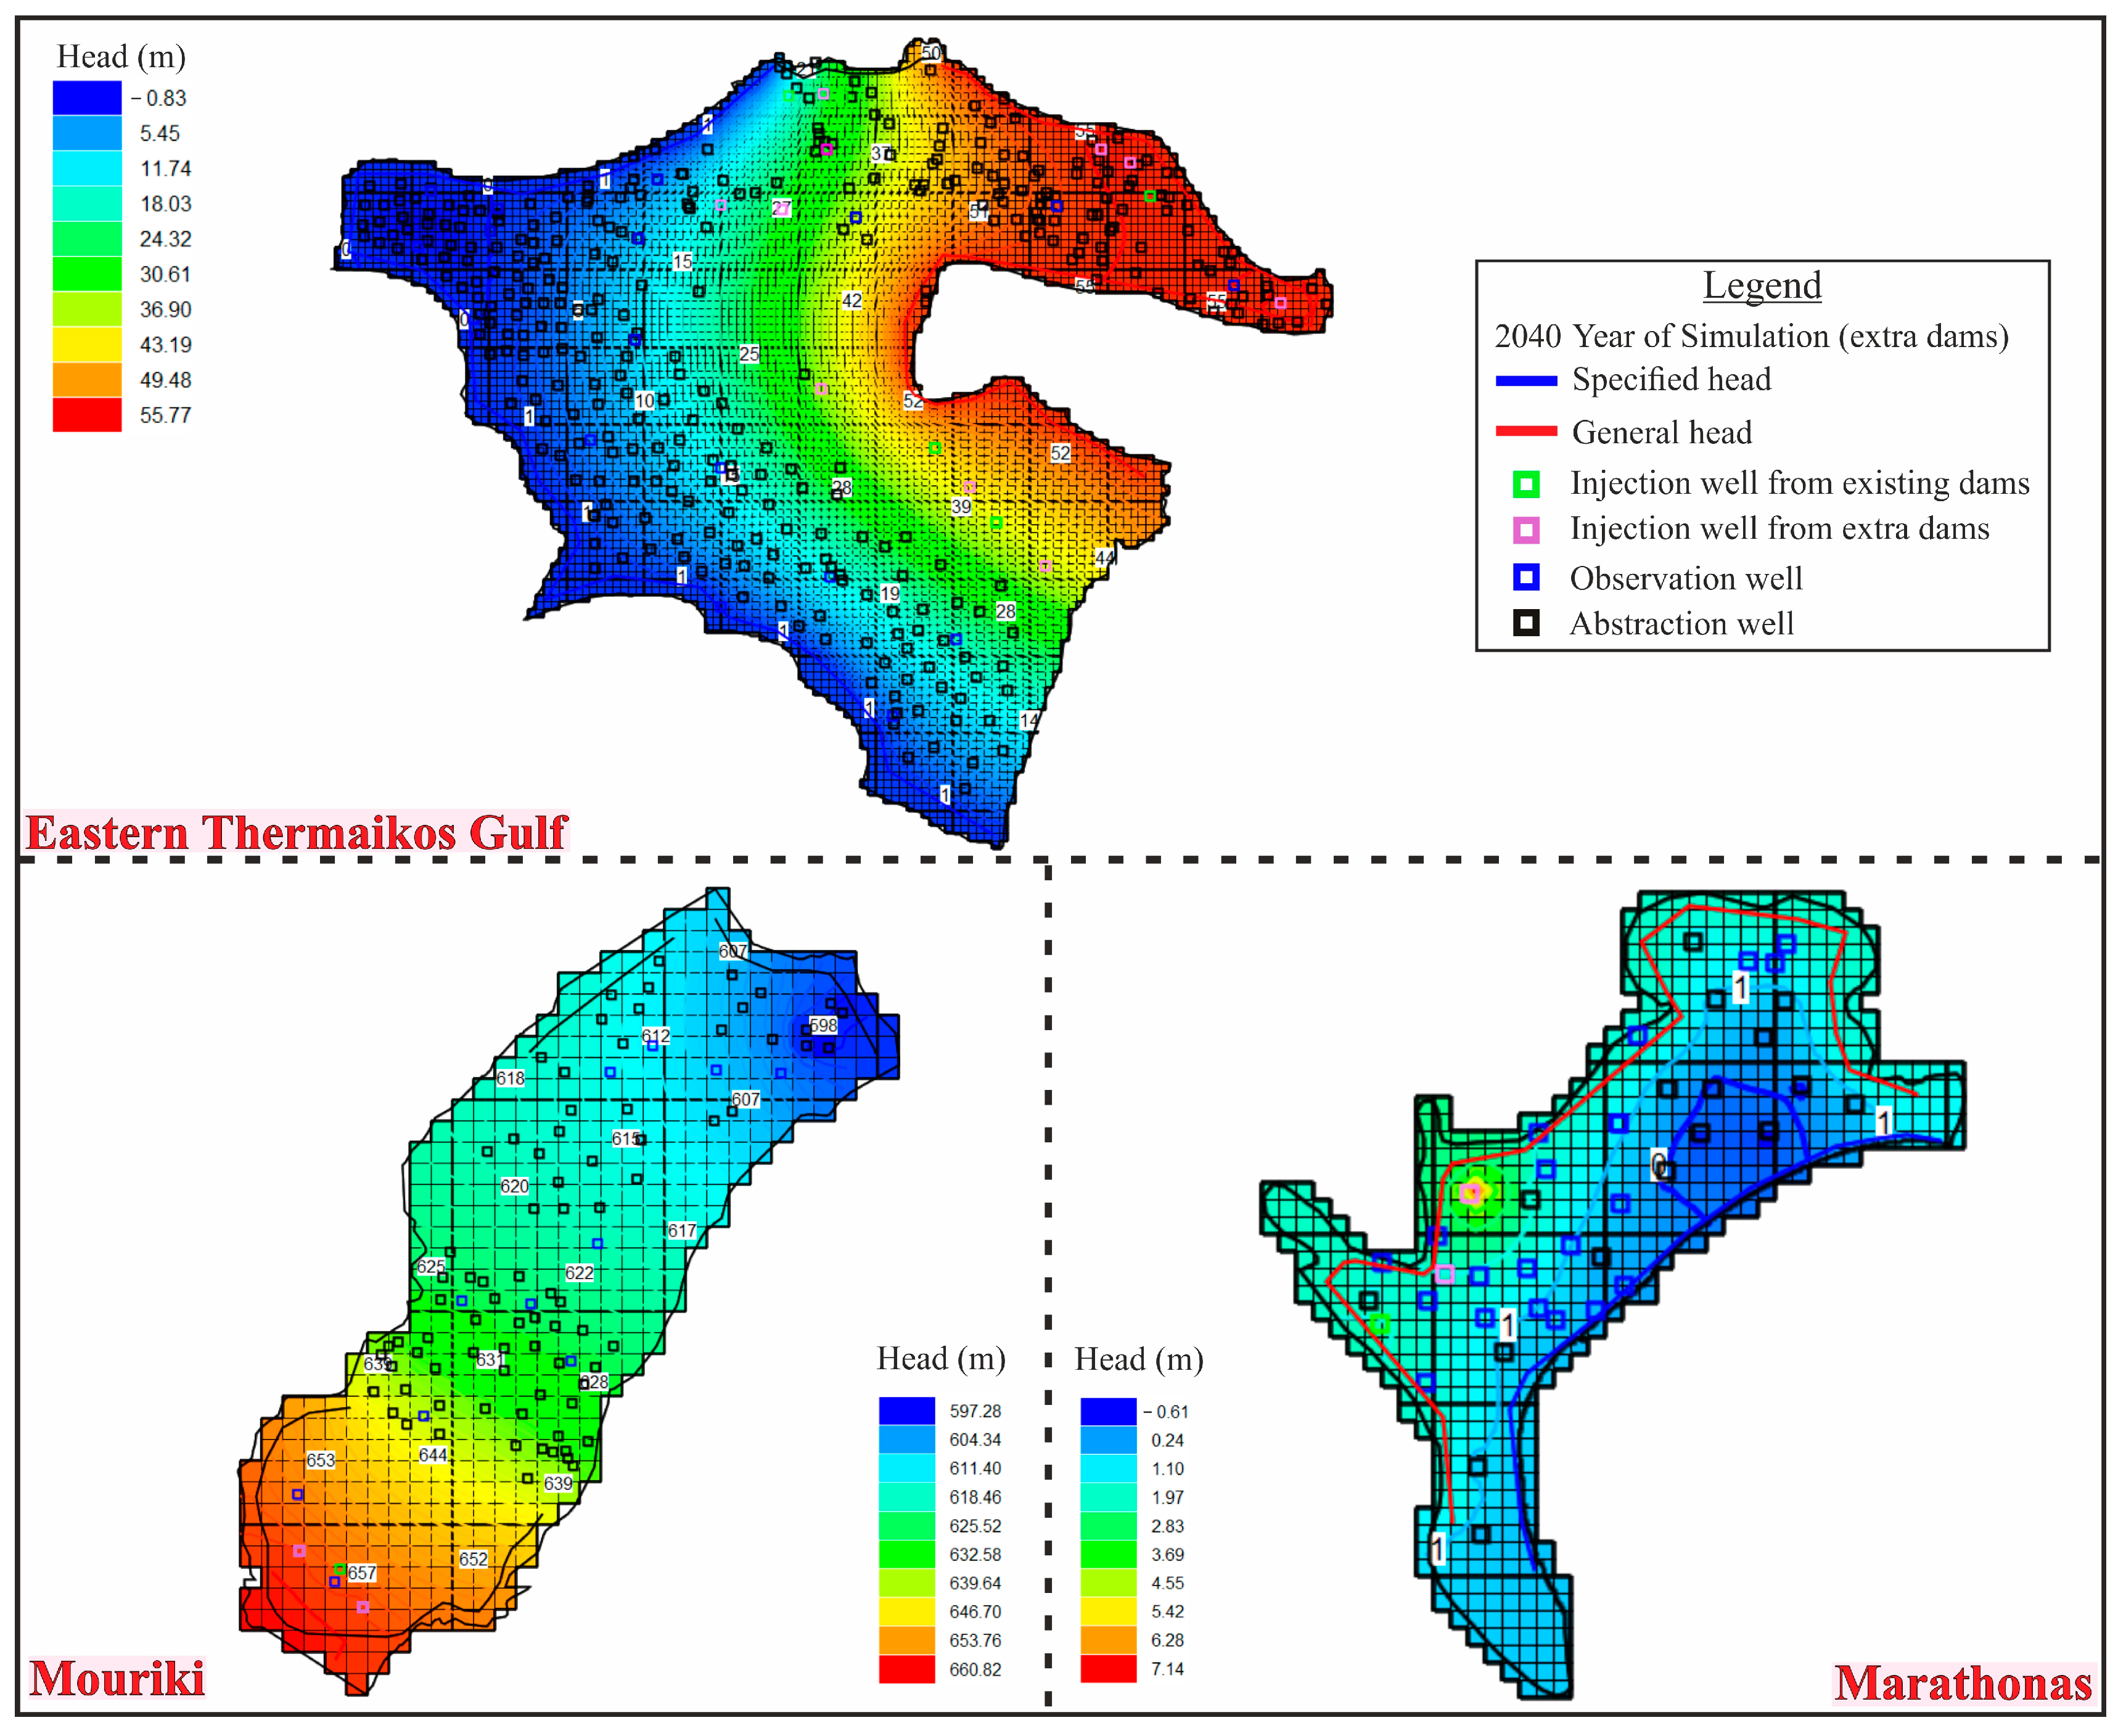
Table 1). The scenario involving the construction of extra small dams within the site (
Figure 6) and the application of MAR using a total of 14 dams will lead to a significant deterioration of groundwater depletion zones covering just 9.2% of the aquifer (
Table 1). The spatial distribution of the different scenarios of groundwater depletion zones is shown in
Figure 7, and the zones with negative piezometric heads are presented in
Figure S9. The extent of the negative piezometric zones is similar to the depletion zones (
Table 2).
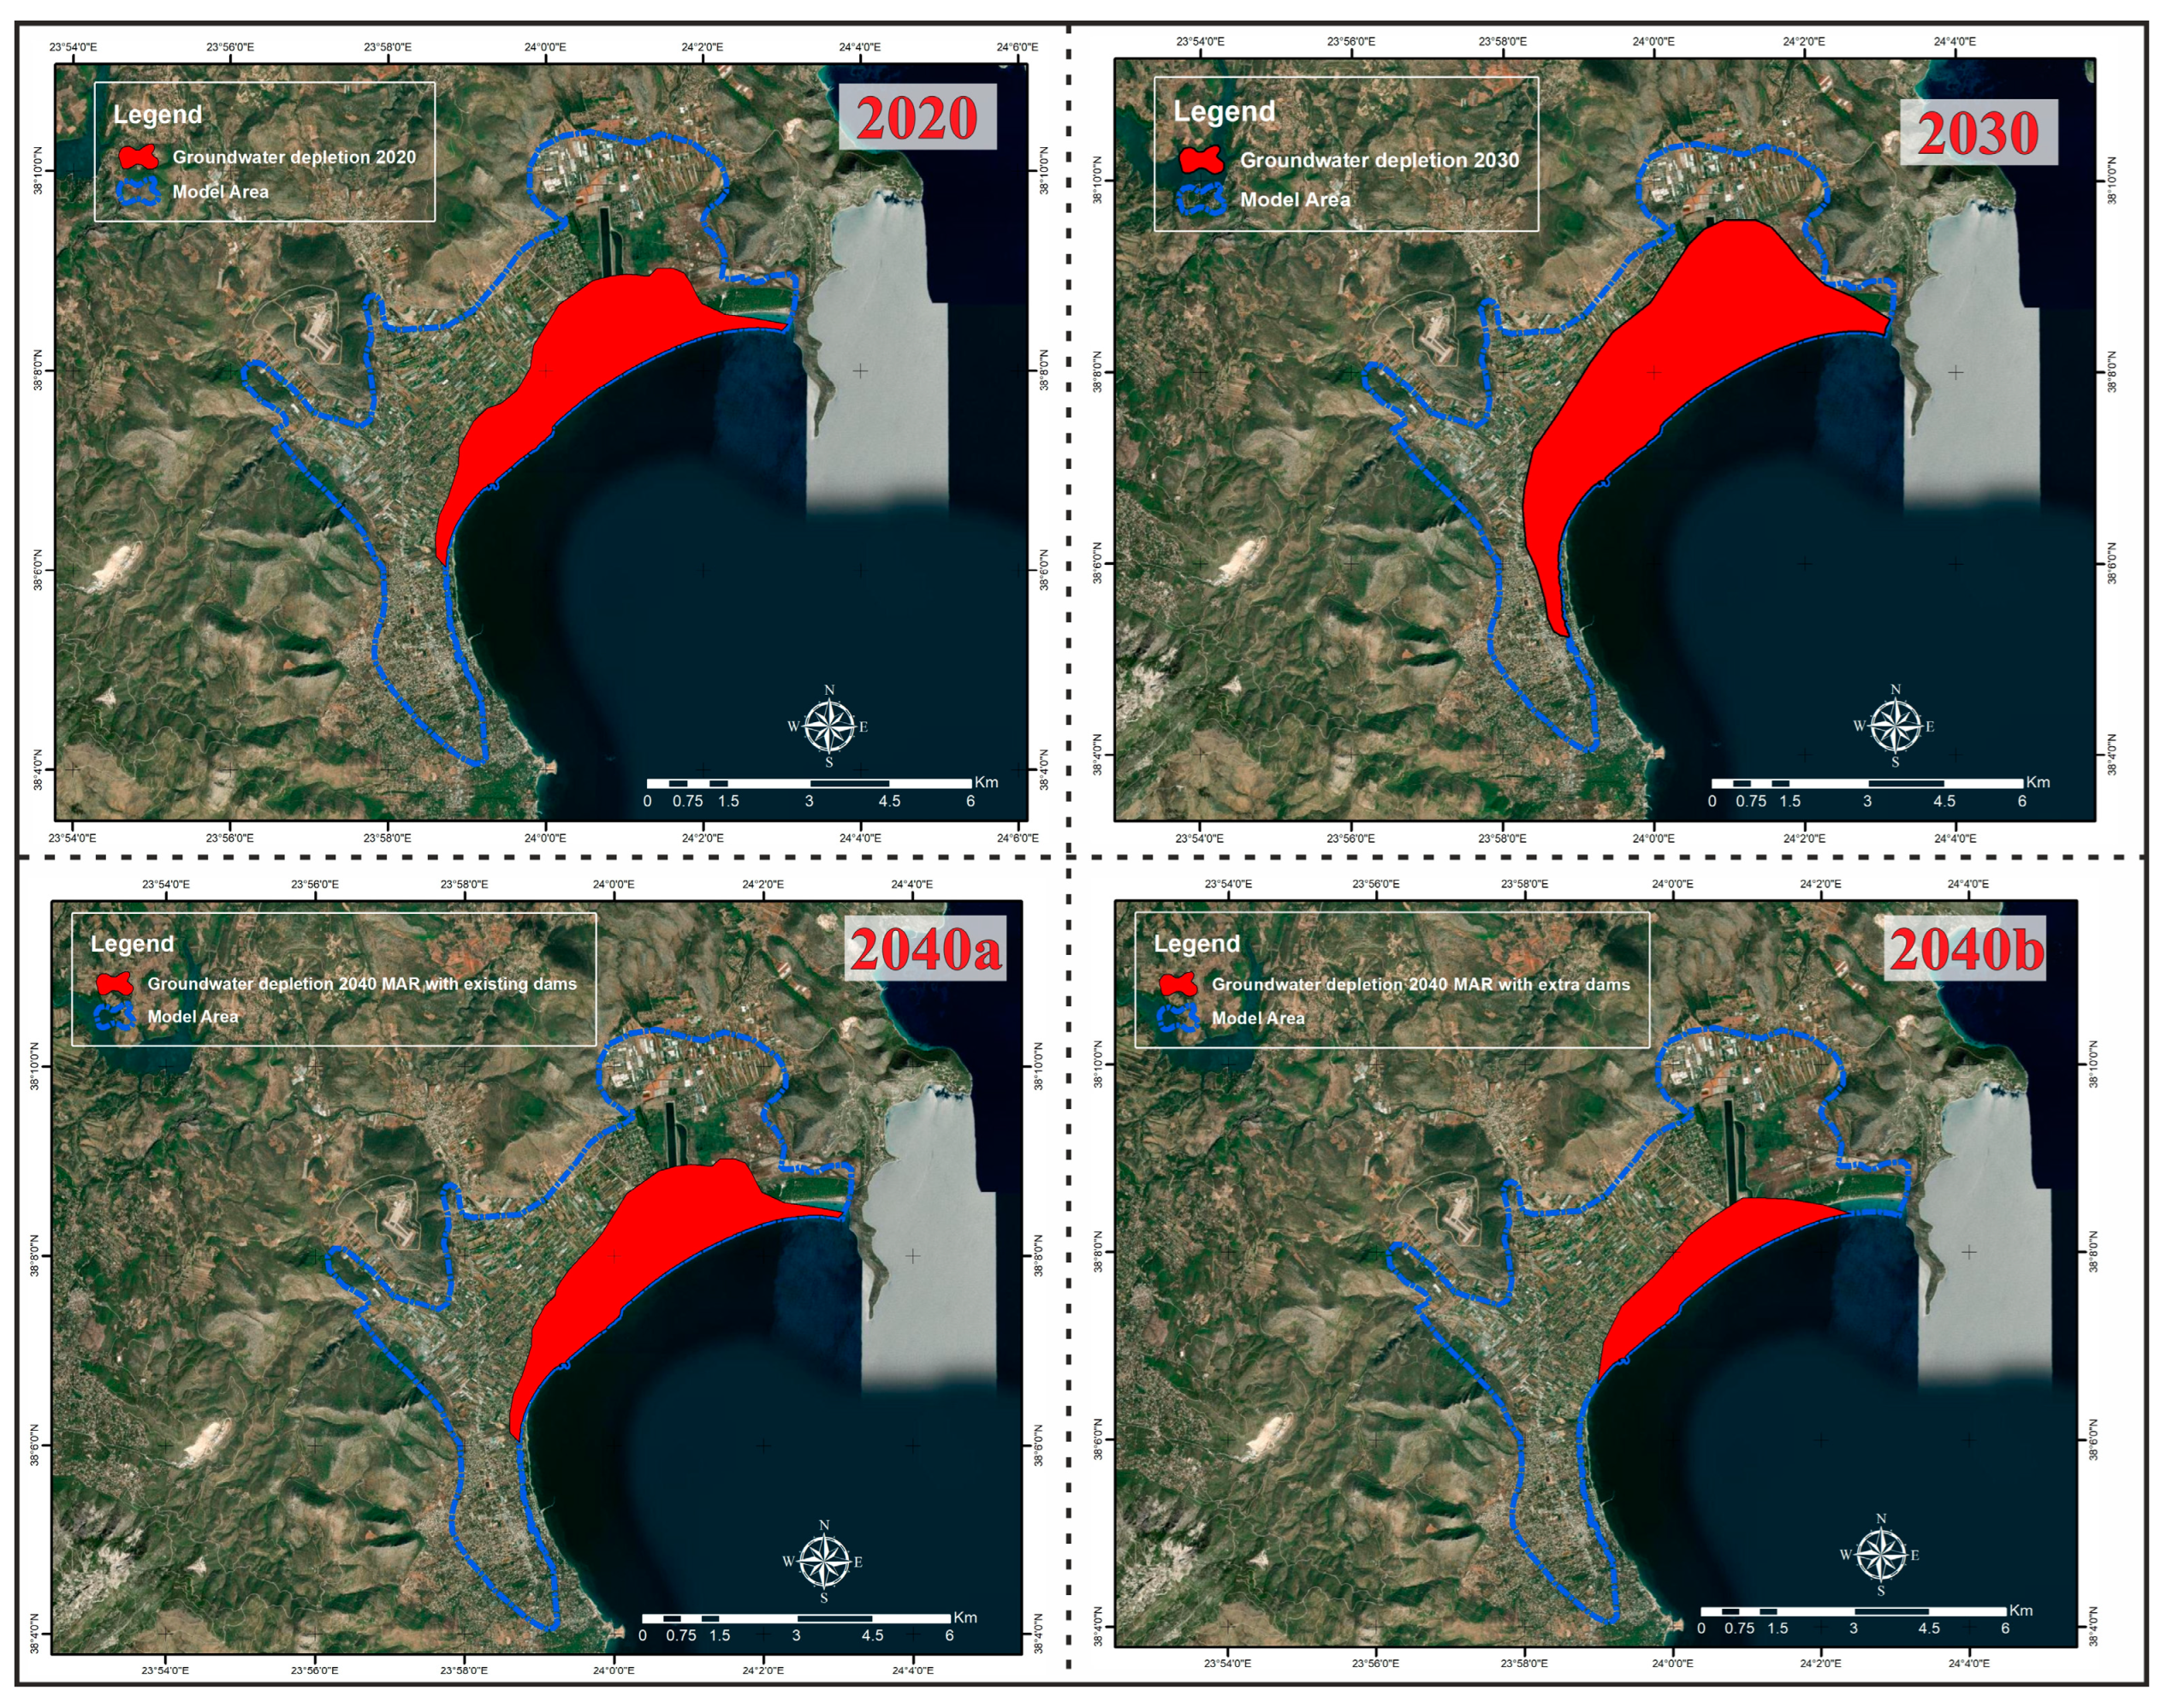
In the coastal aquifer of Marathonas, the piezometric head has negative values of up to −0.6 m near the coastline for the year 2020 (
Figure S6), while by the year 2030, groundwater decline will lead to negative piezometric head values of up to −0.7 m (
Figure S7). The change of the negative head is insufficient. Toward the mainland, the piezometric head reaches 2 m, while the maximum value is similar to that of the 2030 simulation. During the year 2020, groundwater depletion extended to 22.8% of the porous aquifer (
Table 1). The groundwater depletion zone is forecast to cover up to 43.7% of the aquifer by the year 2030 (
Table 1).
The scenario applying MAR using water obtained from the site’s existing small dams from 2030 to 2040 is depicted in the maximum piezometric head with an increase to 2.2 m (
Figure S8), while the depletion zones decline to 23.7% (
Table 1). The construction of additional small dams on the site (
Figure 6) and the application of MAR using three dams is predicted to lead to a significant reduction of the groundwater depletion zones covering 11.9% of the aquifer (
Table 1). The spatial distribution of the different scenarios of groundwater depletion zones is shown in
Figure 8, while the zones with a negative piezometric head are shown in
Figure S10. The extent of the negative piezometric zones is similar to the depletion zones (
Table 2).
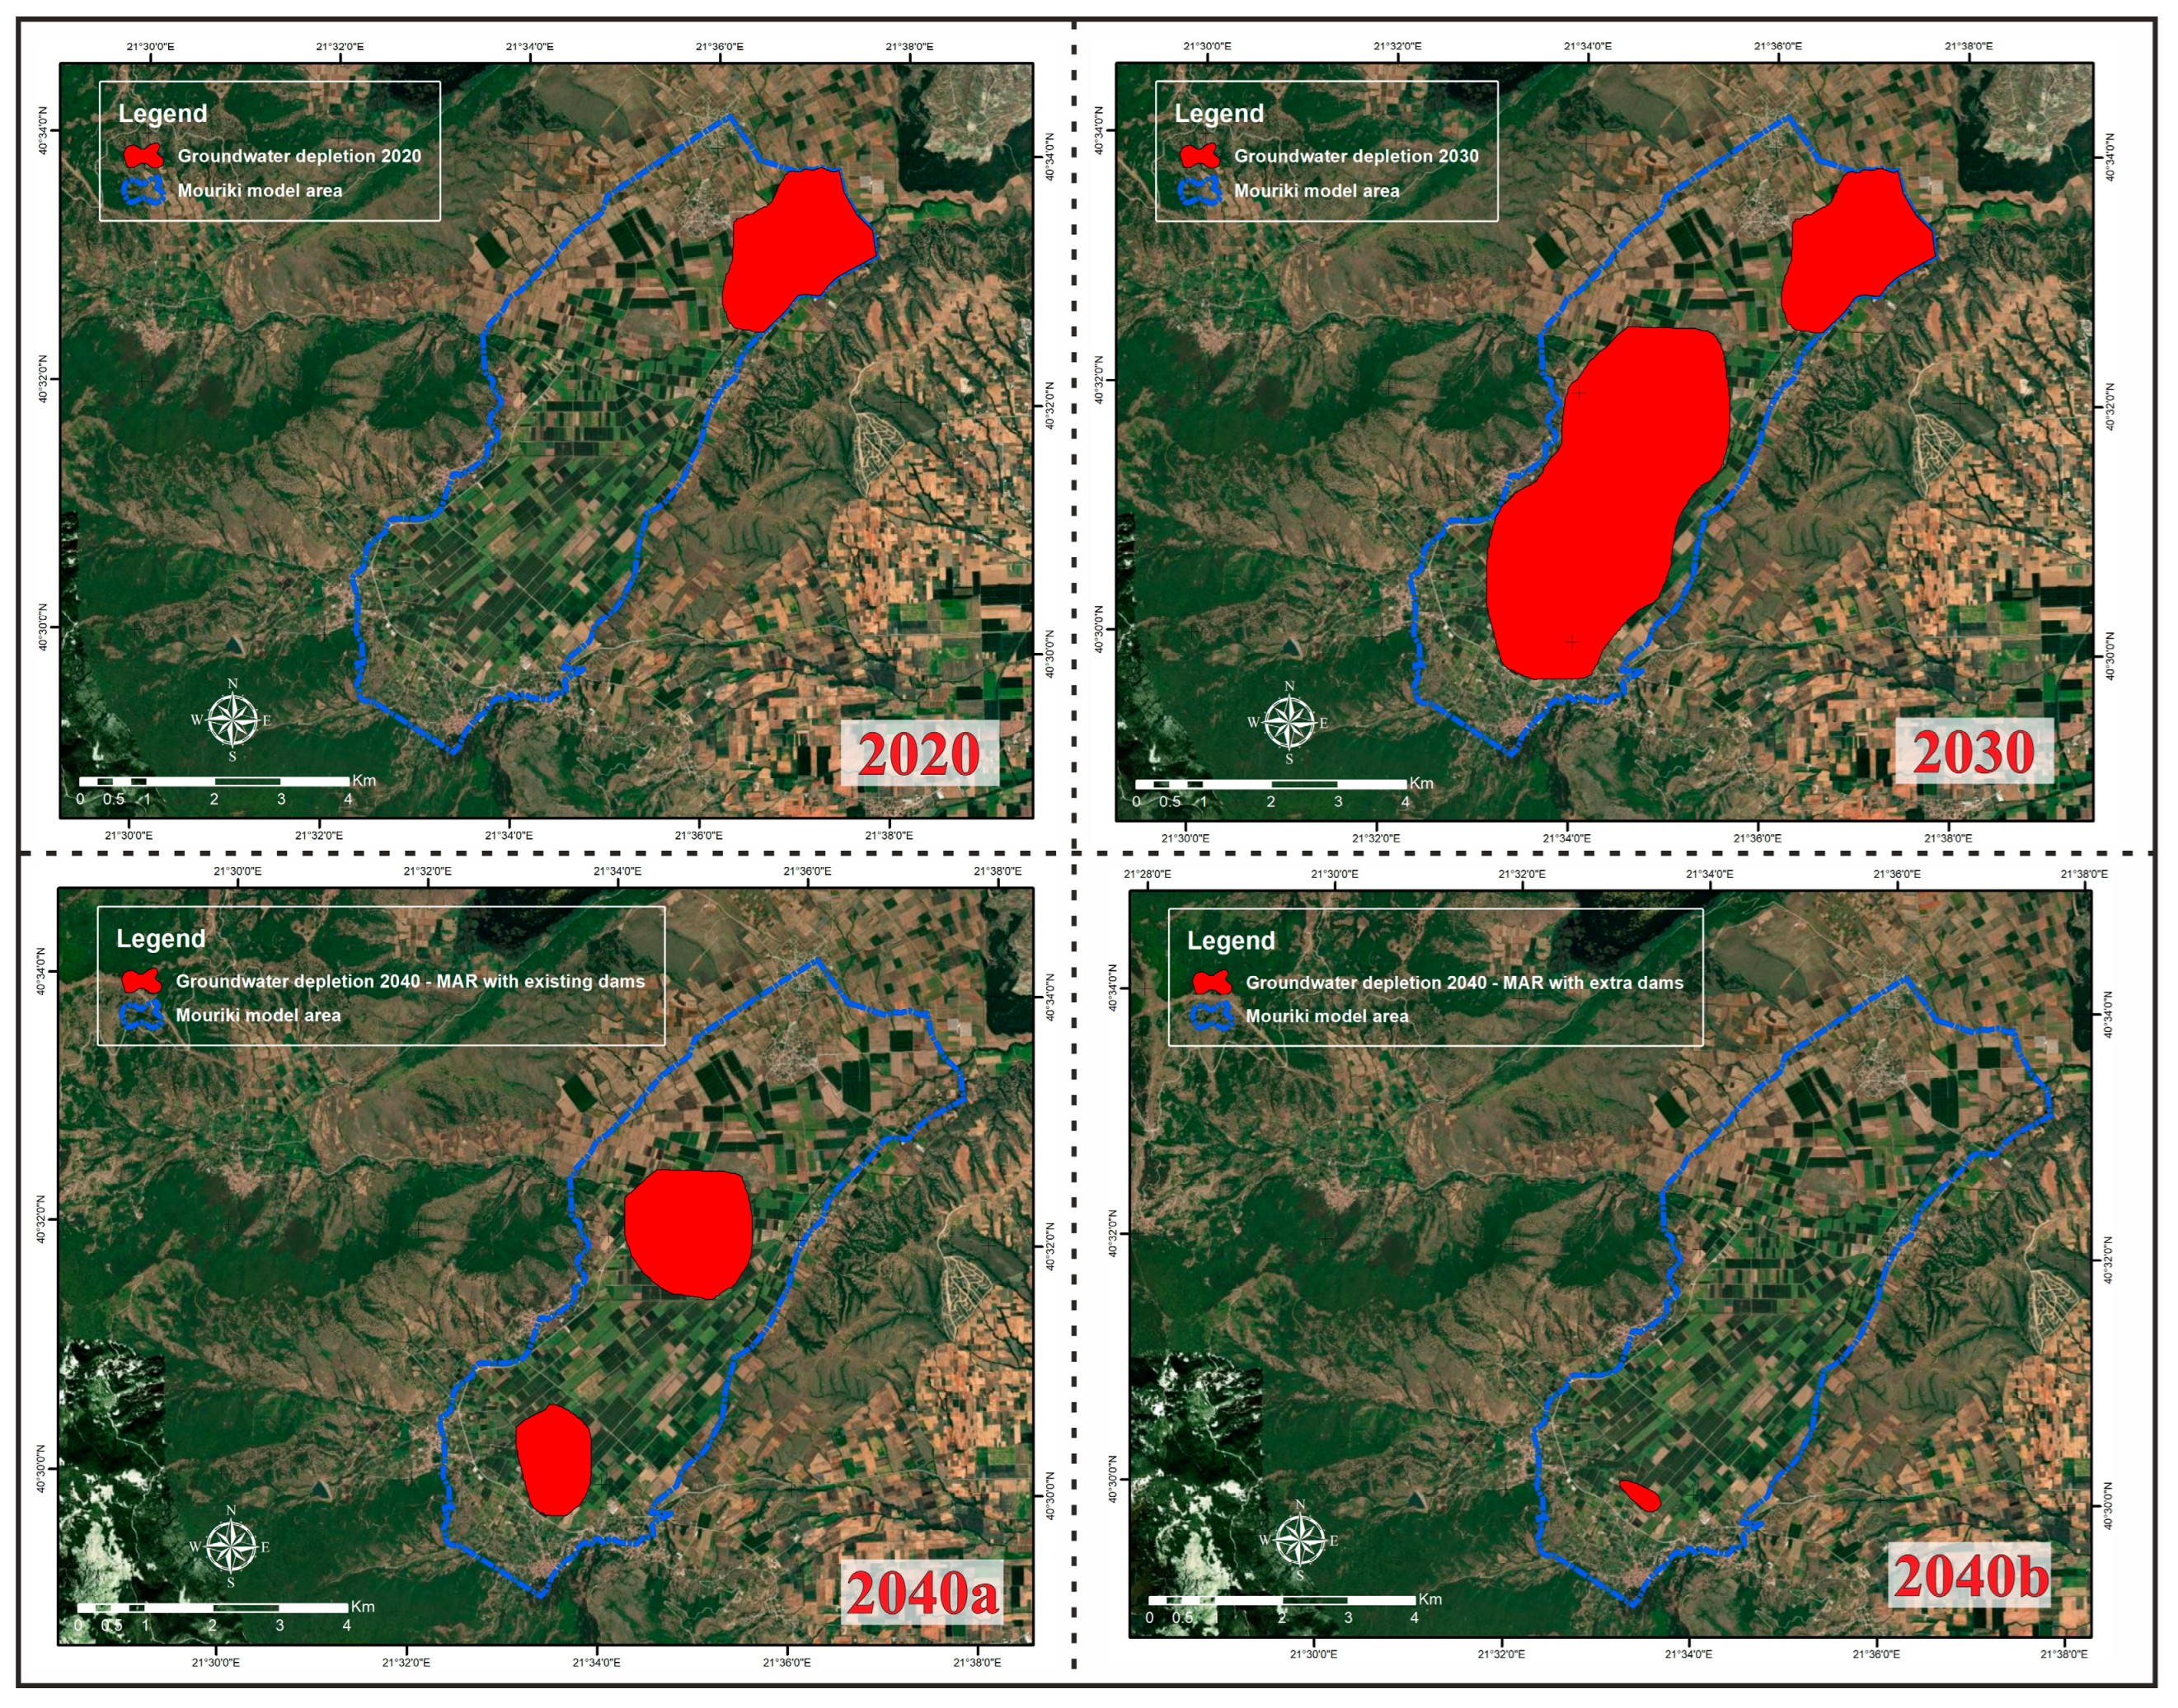
In the aquifer of the Mouriki basin, the piezometric head varies from 595 to 655 for the year 2020 (
Figure S6), while by the year 2030, groundwater will vary between 593.5 to 652.9 (
Figure S7). In the year 2020, groundwater depletion extends to 11% of the porous aquifer, while the depletion zone will increase to cover 49% of the aquifer by the year 2030 (
Table 1). The scenario with MAR using water obtained from the site’s existing small dam from 2030 to 2040 is forecast to result in an increase of the maximum piezometric head to 656 m (
Figure S8), while the depletion zones reduce to 14.6% (
Table 1). The scenario involving the construction of additional small dams (
Figure 6) and the application of MAR using water obtained from three dams is forecast to lead to a significant reduction in groundwater depletion zones that would cover just 0.49% of the aquifer (
Table 1). The spatial distribution of the different scenarios of groundwater depletion zones is shown in
Figure 9.
Beyond the benefits of groundwater replenishment, transforming the dams into small hydropower generation units could contribute to energy production. In the Eastern Thermaikos Gulf, the dams can generate 832.40 MWH/year, while in the Marathonas and Mouriki basins, the dams could generate 1683.19 and 132.36 MWH/year, respectively.
Figure S11 shows the mean annual hydropower dynamic of the dams studied, while the hydrodynamic power of all the dams is presented in
Figures S14–S20.
5. Discussion
In Mediterranean countries, groundwater is an almost ubiquitous source of fresh water and covers about 60% of water demand. Groundwater depletion constitutes a multidisciplinary phenomenon that is influenced by both climatic and non-climatic parameters. This study applied the tool of groundwater simulation, which has been proposed as a suitable approach for studying this phenomenon [
18]. The core of the idea was to transform small dams that serve only for flood protection into small hydropower units and follow the energy production to apply MAR to the depleted local aquifer. The use of small dams is strongly recommended due to the numerous drawbacks involved when using large dams for water supply replenishment [
44]. In the suggested concept, the environmental flow has been included. Unfortunately, in the studied sites, the existing dams do not allow even the environmental flow, while the water in the reservoirs vaporizes during the summer period. Obviously, the suggested methodology ensures a higher volume of recharge by applying MAR in comparison to the existing conditions.
The methodology was based on a future moderate climate scenario (RCP 4.5) in order to produce 20-year predictions. Additionally, on the basis of realism, it was assumed that the small dams could be transformed and ready for use in the year 2030. A second scenario was applied including more theoretical dams for future MAR application. The application of MAR and the construction of small dams are in accordance with the proposals of previous studies [
29,
45] as well as official management plans. Papageorgakis and Koumantakis [
46] first reported the necessity of protecting groundwater reserves in the Eastern Thermaikos Gulf in 1978. Unfortunately, groundwater monitoring by local authorities has been minimal and the last decade has seen water level measurements recorded for just two periods per year, while surface runoff monitoring has been overlooked completely. Obviously, the monitoring should be more intense, providing high-frequency hydrological data. Hence, the driving factor of groundwater depletion in the studied aquifers is mismanagement, including limited monitoring, overexploitation of groundwater, and absence of groundwater replenishment actions such as MAR application.
This study also highlights the impact of variable climates. Extended drought periods have already occurred and future projections in the Eastern Thermaikos Gulf forecast that such periods will last for up to 90 months [
47,
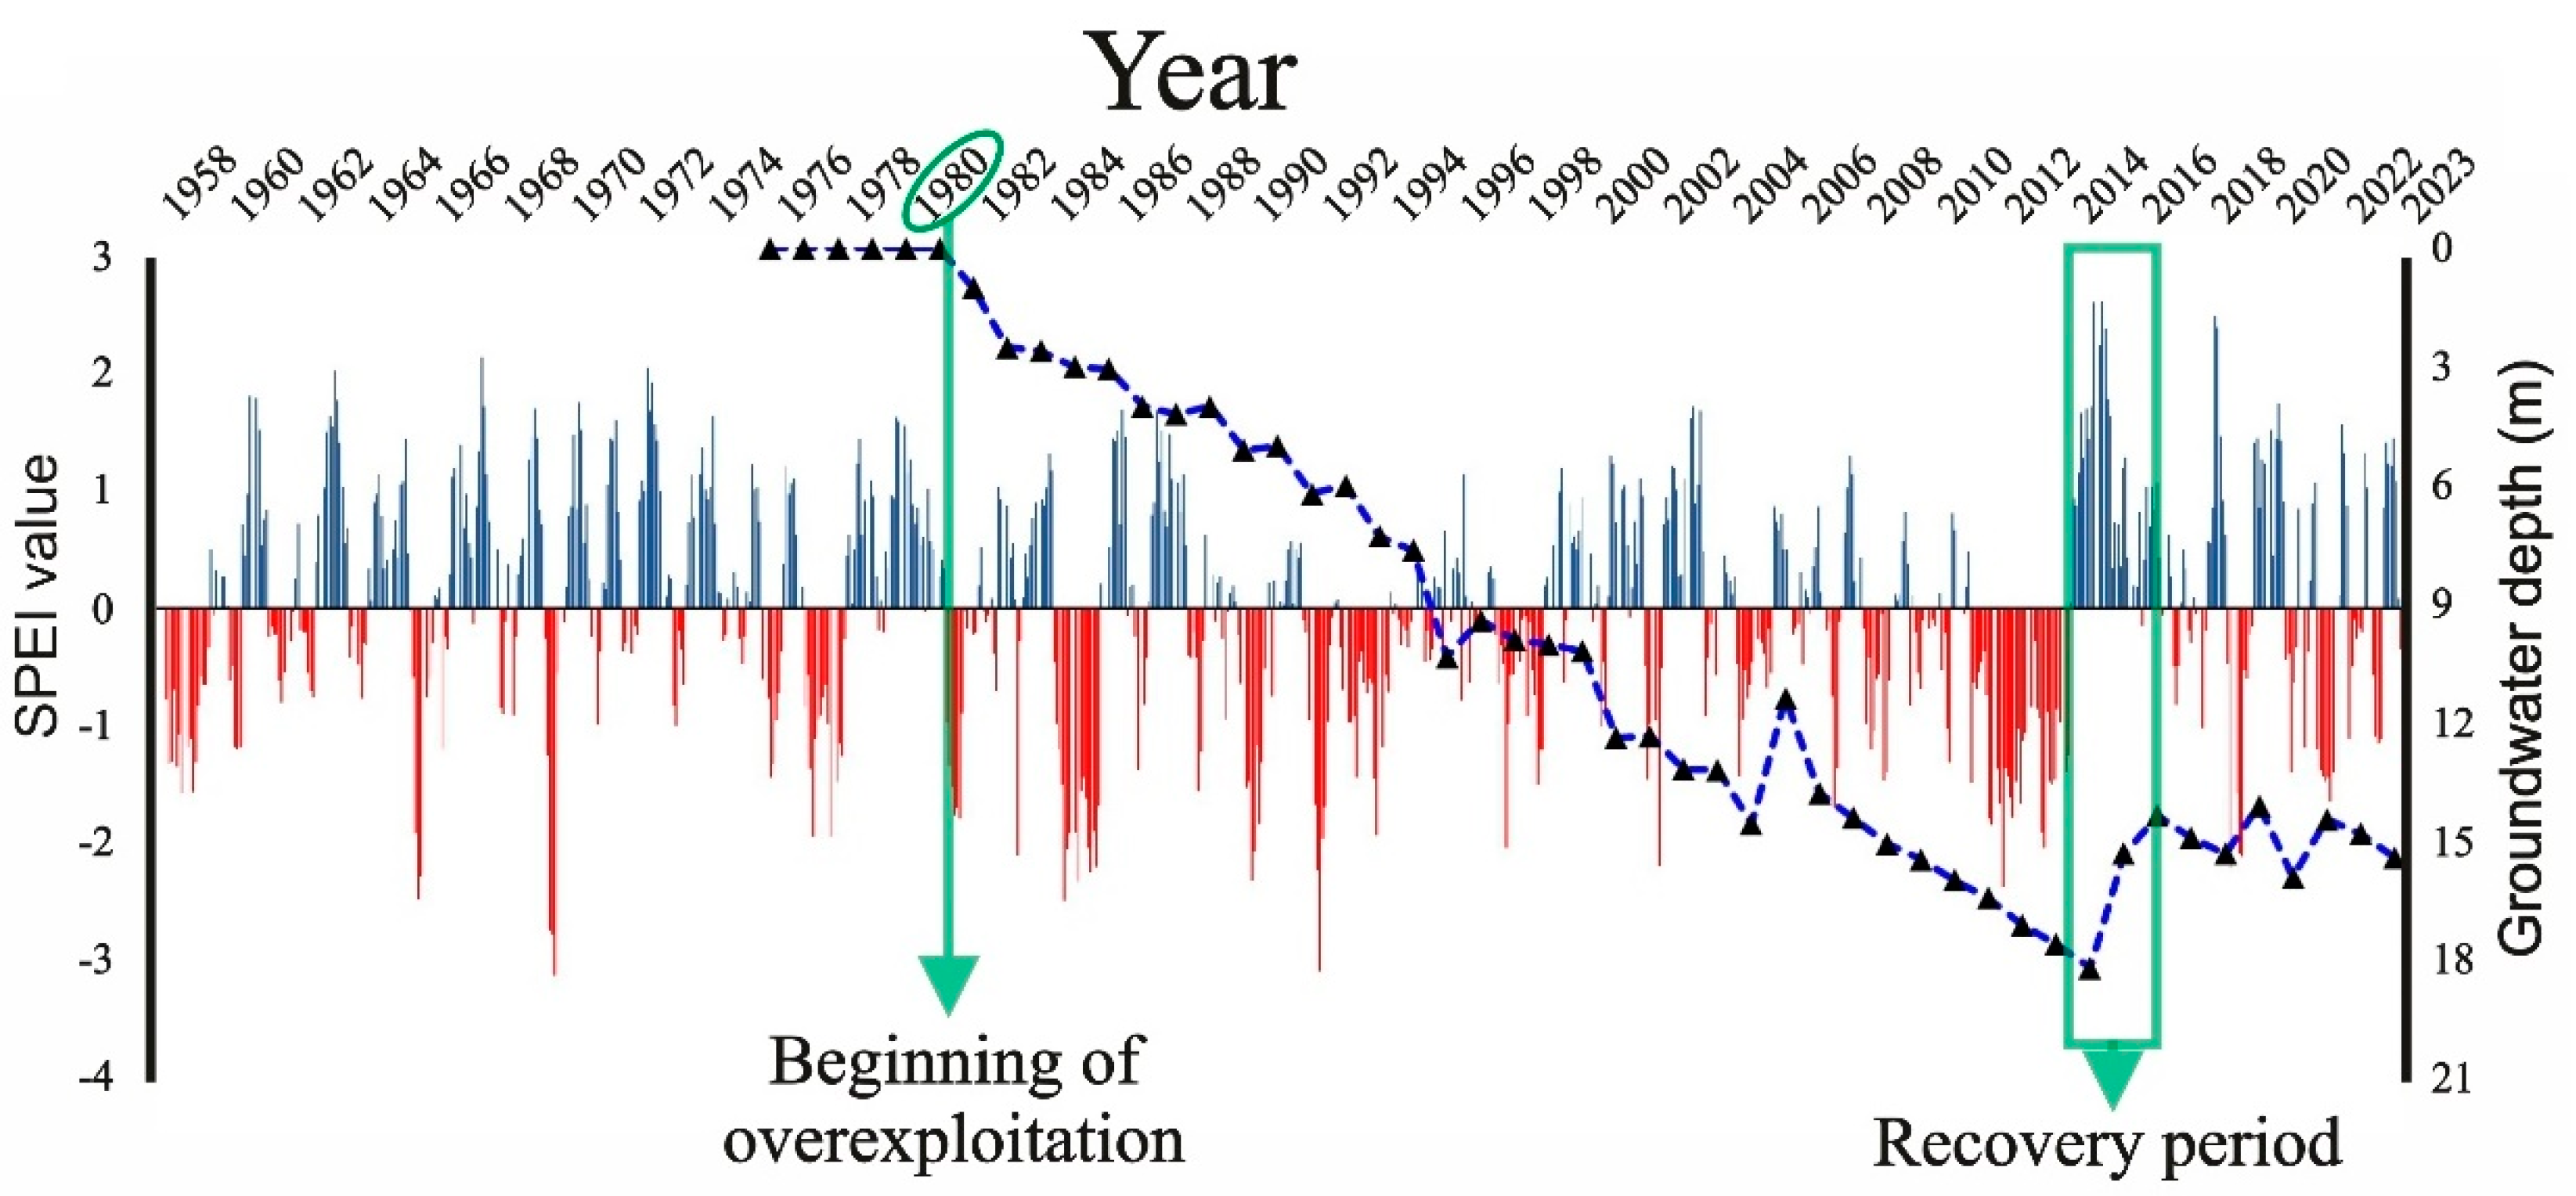
48]. Alternating long wet and drought periods also influence groundwater level variation, as depicted in
Figure 10. The groundwater level drawdown first started in 1980, mainly due to over-pumping, although a recovery period was observed from 2014–2015 due to a long-wet period. Climatic drivers recognizably influence groundwater depletion; however, a single long wet period cannot fully replenish the depleted aquifer to its original, natural, level (
Figure 10). The natural recharge amount in this period is lower than the total abstracted amounts. These findings are in accordance with Ashraf et al. [
49], who studied the impacts of drought on groundwater depletion in Iran. Additionally, precipitation events during the dry period of May to October do not favor the recharge of groundwater. This argument is supported by the results of the ERT analysis (ERT data from the vadose zone will be analytically presented in a future research paper). Therefore, the data support the argument for the utilization of small dams to store surface runoff and the use of MAR to limit evaporation from the dam reservoir.
Despite the significant findings of this study, several issues remain to be addressed in the future. For instance, in the Marathonas basin, the application of MAR in the margin of the aquifer may be moved to the center of the basin. The simulation in the Mouriki basin should be performed in monthly time steps rather than in wet/dry periods as in this study. Additionally, the depletion zones in the Mouriki basin cover a significant part of the aquifer; however, the aquifer is predicted to recover in just one decade. Lastly, for the Eastern Thermaikos Gulf, the aquifer should be simulated using hydro units. It is worth mentioning that modeling of groundwater requires high-frequency observation data for long periods.
Assessment of groundwater depletion is of great concern and hydrological models have been used to estimate groundwater depletion rates on a global scale [
50]. This study focused on local aquifers, illustrating that such approaches can help propose local solutions. Additionally, groundwater quality deterioration due to groundwater depletion has been reported in large aquifer systems [
51] and deterioration of water quality has also been verified in the studied aquifers by Ntona et al. [
52]. Within this study, it is shown that the use of dam water for MAR application can significantly reduce the phenomenon. Due to the different water capacities of dam reservoirs in this study, it is not possible to provide a counteraction to the lowering of the groundwater level per dam. Nevertheless, this issue can be addressed in future studies on other sites and the impact of each dam can be compared.
Based on the hydropower generation results for the existing reservoirs, the power potential of Mouriki corresponds to that of a small-scale hydropower unit, while for the other two sites, there is a discrete power potential indicative of medium-sized power plants [
53]. Mouriki has significant hydropower potential due to the site’s geological characteristics such as a high water table and a relatively small-sized reservoir. However, these factors limit the ability to exploit large amounts of energy from the dam. Despite this limitation, a small hydroelectric plant could still provide valuable electricity to local communities, helping to sustain their energy needs.
In contrast, the other two study areas exhibit favorable conditions for medium-sized hydropower projects, characterized by the presence of large water bodies and differences in elevations. While environmental assessment is an important consideration, the small size and versatility of these reservoirs minimize significant environmental disturbance [
54]. Considering local energy production and consumption, the generated electricity could be used to meet immediate needs. Furthermore, the development of hydroelectric power systems in these areas could stimulate economic growth and create employment opportunities, thereby promoting sustainable development [
55,
56], and the allocation of small dams can be optimized to achieve the maximum hydrodynamic potential [
57].
Groundwater depletion is a global issue and newer studies reveal the extent of the problem. Jasechko et al. [
5] studied groundwater depletion on a global scale and proposed various actions including the application of managed aquifer recharge on a global scale. Other factors that should be included in groundwater depletion forecasts are land use/land cover change and population growth [
58]. Unfortunately, unbalanced population growth and land cover change have previously led to opportunistic solutions to cover water demands including activities such as deeper well drilling [
59]. Extraction from deeper zones can also lead to sedimentary condensation of the upper layers and decrease an aquifer’s water capacity. Inevitably, the runoff coefficient increases and flood events can occur. This phenomenon, however, requires holistic research and we propose future research correlates groundwater depletion zones with flood events.
This study provides a spatial distribution of groundwater depletion in the present and forecasts the phenomenon’s future distribution. Additionally, this research highlights that specific hydrogeological conditions in the mountainous part of a study area can balance the overexploitation of groundwater in the lowlands. Nonetheless, groundwater reserves should be monitored closely and preventative actions should be taken to protect groundwater reserves. The suggested approach should be combined with water use reduction and agricultural adaptation in order to achieve sustainable and integrated water resource management. Additionally, market forces might be used in a positive way to contribute to water-saving practices. This aspect requires detailed discussion and analysis considering that all people and users must have access to water resources. The suggested methodology and modeling process are flexible and can be applied in other case studies; however, researchers should adjust the model to the specific characteristics of the aquifer and the corresponding dams.
6. Conclusions
Groundwater depletion is a global issue but is particularly prevalent in the Mediterranean. In this study, the phenomenon was studied in three sites in Greece and was found to be influenced by different climatological, hydrological, and socioeconomic factors depending on the site, even though they were within the same country. The main conclusions drawn from this study are:
Intense drought events can influence groundwater decline.
Rainfall events during the summer slightly contribute to groundwater recharge.
Small dams can store water from extreme summer rainfall events and increase groundwater reserves during the summer period by applying MAR.
Energy production and groundwater recharge volume can reach up to 1500 MWV/year and 5×10⁶ m3 per year, respectively, in the aquifers studied.
Groundwater depletion occurs at 27%, 22.8%, and 11% in the Eastern Thermaikos Gulf and the Marathonas and Mouriki basins, respectively. All depletion zones will increase until the year 2030 if pumping rates remain the same under the RCP 4.5 scenario. The transformation of dams into mini-scale hydropower facilities and the application of MAR will benefit clean energy production, reduce CO2 emissions, and lead to an economically feasible strategy against groundwater depletion.
To conclude, eco-friendly energy recharge dams can contribute to groundwater sustainability. However, detailed monitoring of all hydrological parameters and regular updates of the simulation process are essential for the integrated management of water resources in Mediterranean environments.




_S._Voudouris.png)

