1. Introduction
The capital city of the southern Indian state of Karnataka, Bengaluru, like many cities in fast-developing countries, is experiencing consequential water shortages due to rapid population increase. The city does not have a perennial source of water, and relies predominantly on the distant Cauvery river, water supplied through private water tankers, and wells to meet its drinking water demand. Urban areas receive drinking water from Cauvery through centralized piped water supply systems, while the rural Bengaluru depends on expensive water tankers and borewells [
1]. Bengaluru city was bifurcated into two districts in 1986 for convenient administrative governance: Bengaluru Urban District, and Bengaluru Rural District. The Bengaluru Rural borders the Urban District on its north, east, and north-west, and is divided into four taluks (sub-districts) and has 1052 villages.
Bengaluru city experiences severe water scarcity intermittently because of its semi-arid location in the Deccan Plateau. It is the largest metropolitan city in Karnataka, the second most drought-prone state in India, after Rajasthan. The ever-growing water consumption demands and the ever-depleting water resources have created an alarming situation warranting immediate action. Unfortunately, Bengaluru does not have a consistent water supply source. Cauvery river and groundwater form two significant sources of potable water for the city. However, both have been excessively exploited over the years, and hence the city has experienced a gradual depletion in water availability due to lowering levels in the Cauvery and pollution and a lowering in the groundwater table [
2].
Furthermore, the constant depletion of groundwater has been a concerning issue for all the stakeholders involved. According to a State Government report, low drinking water quality and lack of safe drinking water in adequate quantity led to 10% of total disease incidence in Karnataka. In addition to a lack of safe drinking water, improper sanitation facilities have contributed to the disease incidence. Microbial pollution and poor sanitation are leading causes of drinking-water contamination, and water acts as a passive carrier for infecting pathogens, causing a wide spread of water-borne diseases. A variety of decentralised systems are available to combat these water issues, ranging from physical removal and thermal methods to chemical treatments. Disinfection is a traditional process used for removing contaminants, and it is among the significant drinking-water treatments, but the selection of the method of disinfection is limited due to the probable formation of Disinfection By-Products (DBPs) [
3]. Decentralised systems have the advantages of being low cost, easy to use, and low maintenance. Although there are some low-cost systems available, their use is restricted by the time-consuming daily maintenance and operation required to operate and maintain them effectively [
4].
Over the last few decades, poor governance and drastic changes in the land-use pattern have also been significant contributors to Bengaluru’s water crisis. Unchecked conversion of lakes and green areas into built-up areas has created an ecological imbalance that needs immediate attention and action from the relevant authorities [
5]. Once famed as a city of 1000 lakes, the area under the built environment has increased from around 8% in 1973 to around 94% in 2020, leading to a dramatic disruption in the water-related ecological processes [
5].
In this paper, the water situation in Bengaluru is studied, with a focus on the rural district. Available water resources are studied, and the potentials of water savings are discussed. The possibilities of rainwater harvesting to meet Bengaluru’s water demands are also analysed, along with innovative decentralized drinking-water systems in rural areas. The impact of community water kiosks, also popularly known as water ATMs, on the availability of safe drinking water in sub-urban India is studied closely. The possibility of a robust framework coupled with all stakeholders’ involvement to solve the water woes in rural Bengaluru is also discussed. Finally, a simple flow chart for determining an optimal decentralized drinking-water system is presented as a ready-reckoner for decision-makers to choose amongst various decentralized drinking-water systems available in Bengaluru Rural.
Ground and surface water are the two primary sources of drinking water in both districts of Bengaluru. However, more than 80% of drinking water demand is fulfilled by groundwater [
6]. The availability of groundwater depends on many factors, including extraction, recharge rate, rainfall, and geological conditions. Over-dependence on groundwater supply has led to excessive extraction in the Bengaluru districts, thus creating a massive gap between the extracted and recharged groundwater and resulting in depletion. Furthermore, the quality of groundwater has also deteriorated over time, and only around 30% of it is deemed to be potable [
5].
In this regard, a brief overview of the current water situation in Bengaluru Rural is presented as follows. Potable water is in high demand in all four taluks of Bengaluru’s rural district. Research conducted in 2015 by the Government of Karnataka (2016) [
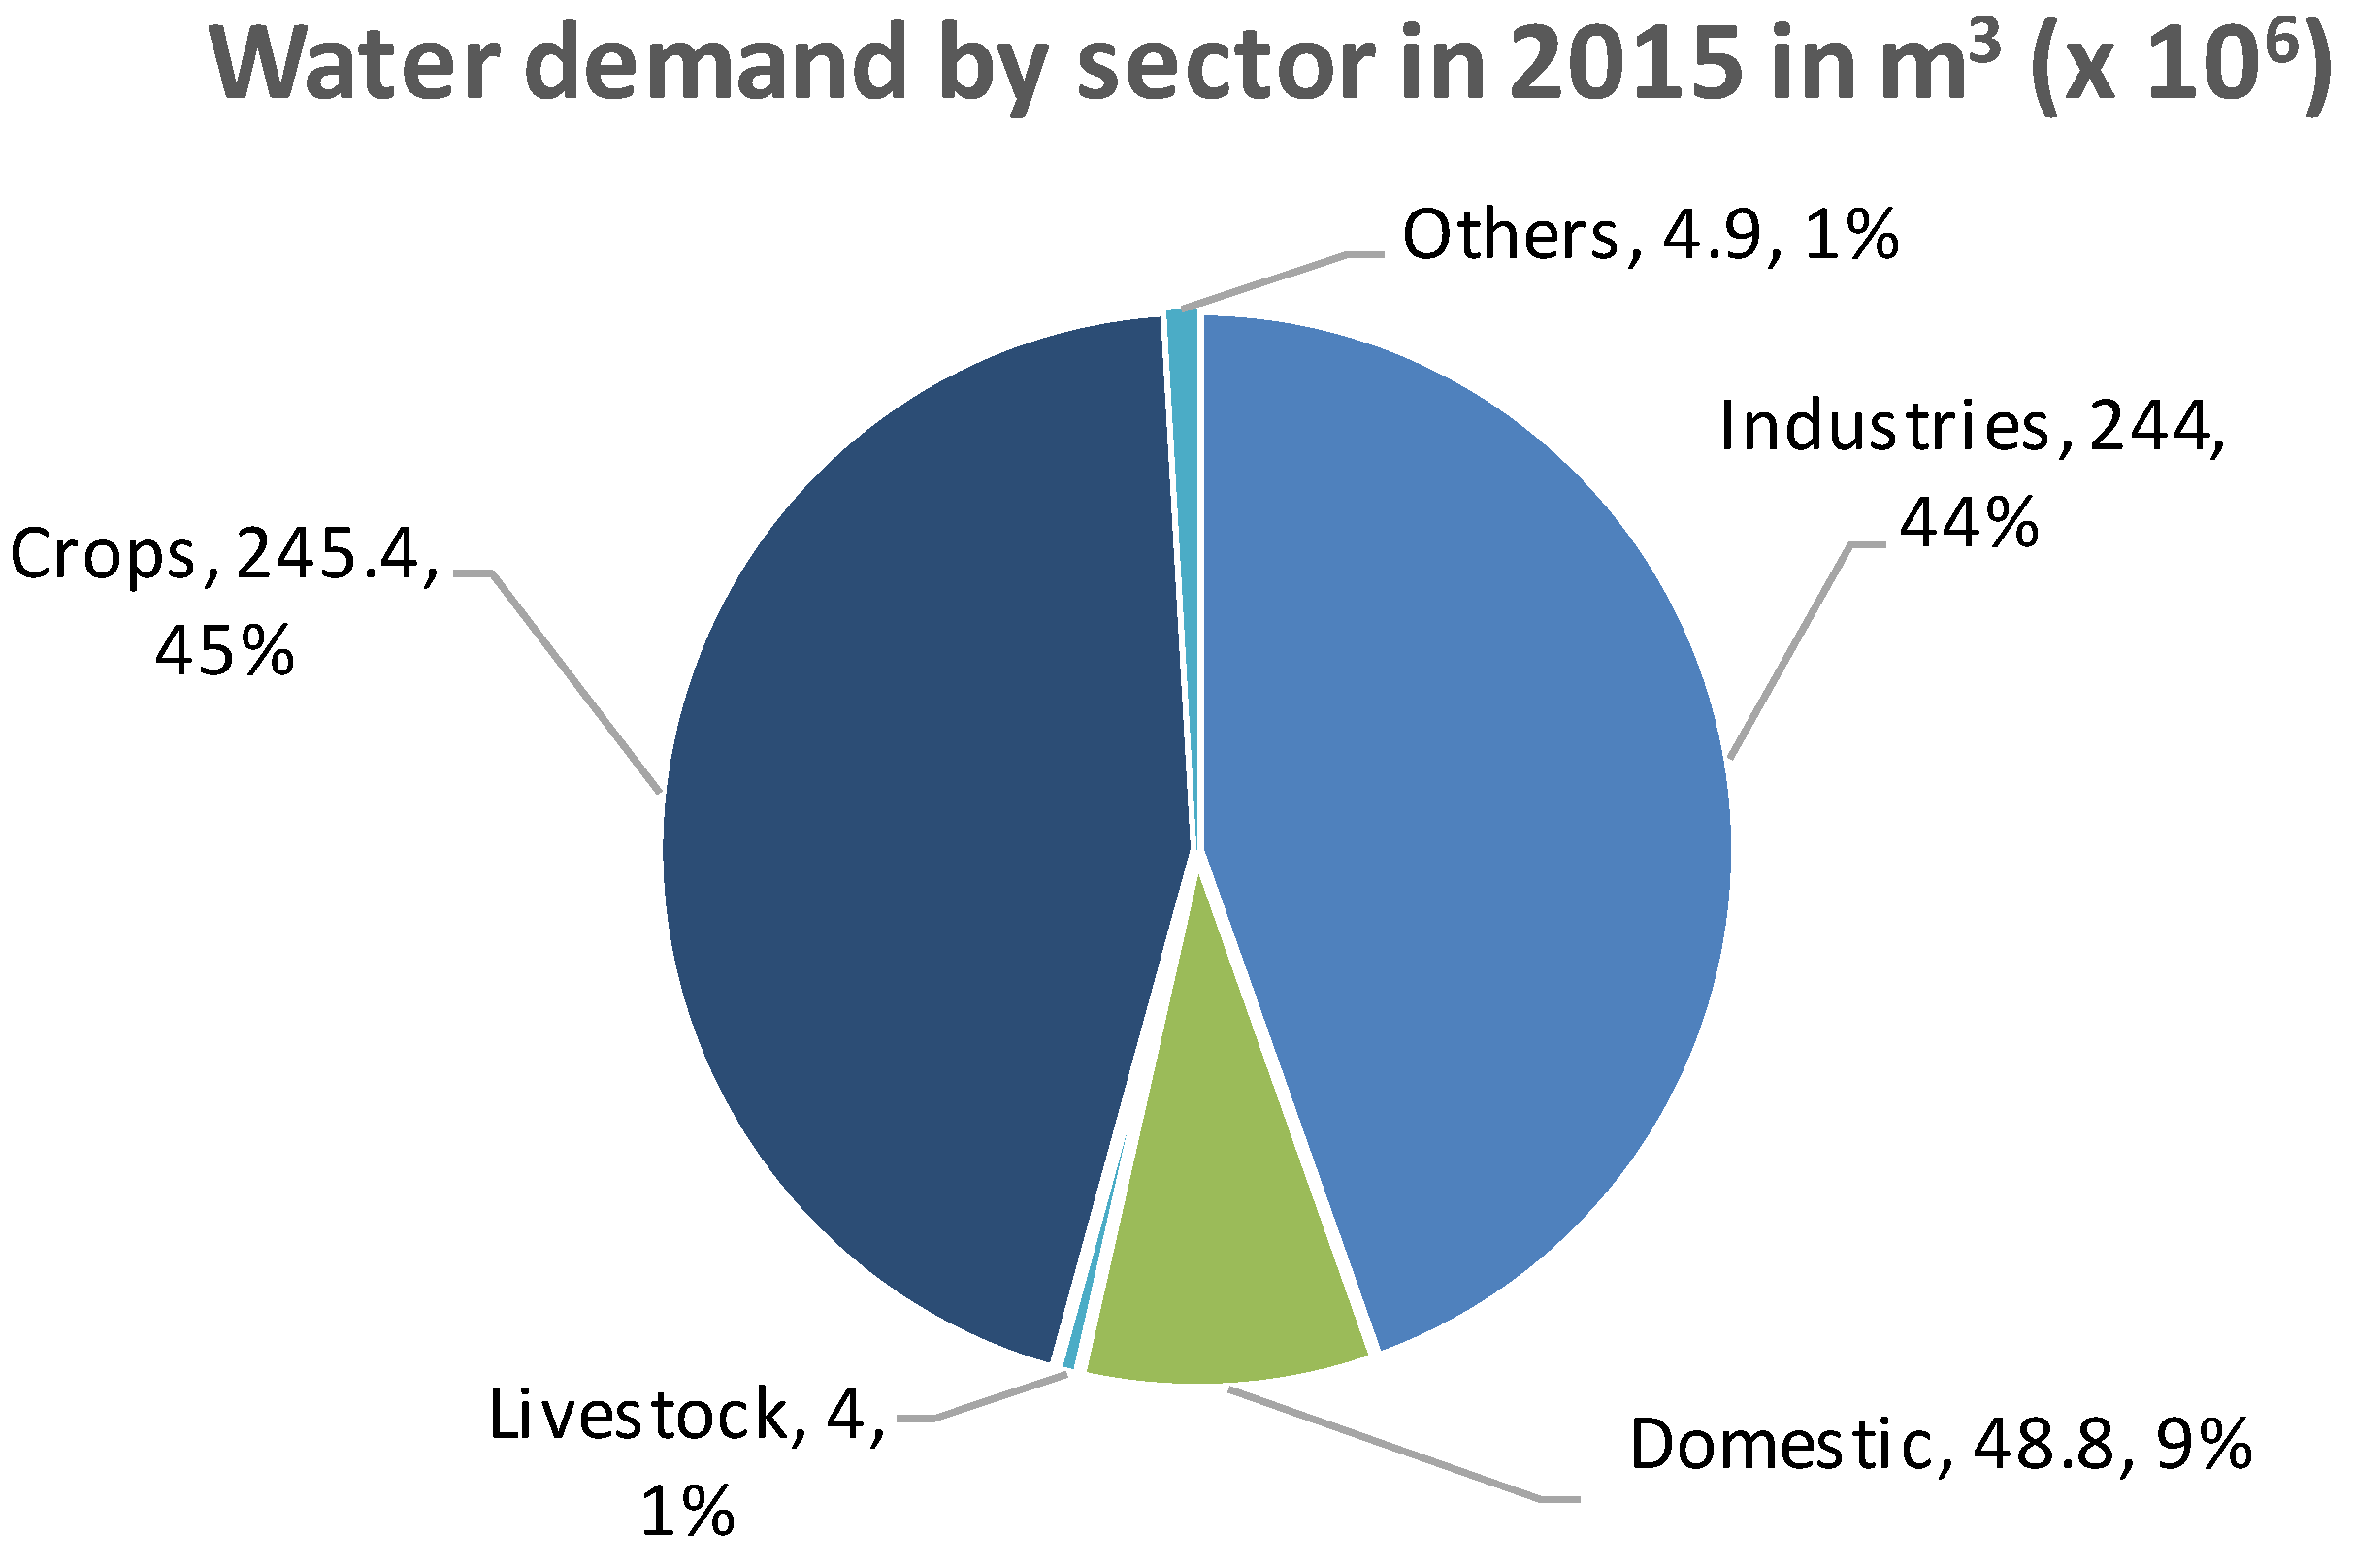
7] showed that the water demand in Devanahalli was 0.1192 billion cubic meters (BCM), Doddaballapur was 0.1332 BCM, Nelmangala was 0.1307 BCM, and Hosakote was 0.1641 BCM. The study further investigated the total water demand in 2015 based on the different sectors, as shown in
Figure 1. It was estimated that almost equal amounts of overall available water were used for industries and agriculture, 44% and 45%, respectively, while the water demand for domestic use was 9% and roughly 2% for livestock and other uses. This amounted to 547.17 million cubic metre for total water demand in the district [
7].
Another study conducted in 2015 [
7] on the total available water in Bengaluru rural district, in collaboration with the Central Ground Water Board (CGWB), estimated the total available water from groundwater and surface water sources to be 0.3026 billion cubic meters (BCM). Available groundwater was estimated to be 0.1939 BCM, which accounted for 64.1% of the total available water, and surface water was estimated to be 0.1087 BCM, which accounted for 35.9% of the total available water. However, the total available water of 0.3026 BCM was less than the total water demand of 0.54717 BCM, resulting in a water shortage of 0.244 BCM, which was fulfilled mainly by the transport of water over long distances. The projected total water demand and available water during the year 2020 were estimated to be 0.6381 and 0.3026, respectively, resulting in a water shortage of 0.33548 BCM [
7]. This lack of parity between the availability and demand points to the need to save and harvest water to decrease the demand on the one hand, and increase the availability on the other hand. This principle forms the basic premise of the decision support system for water security (DSS-WS) proposed in this paper.
Surface and groundwater are the primary sources of drinking water in the Bangalore Metropolitan Region (BMR). Rainwater is also an additional potential source of water that can be tapped into. Due to the Bengaluru rural district’s bi-modal pattern of rainfall distribution, rainwater harvesting has great potential due to it being concentrated in shorter periods of time. Despite foreseeing an impending water crisis in the near future, measures to improve rainwater collection by the government have thus far been inadequate. This has the potential to worsen the current problems of piped water shortages and furthering groundwater depletion. The current drinking-water problems demand an immediate adjustment to laws and regulations governing existing and planned infrastructure, integrating rainwater harvesting by incentivising it or making it mandatory in certain cases, in order to limit groundwater exploitation and the reliance on piped water [
8]. Rainwater can be used for a variety of purposes, if not directly for human consumption, and can indirectly contribute to the improved availability of drinking water in the region.
The domestic requirements for drinking water are assessed by taking the human population into account. In rural areas, human drinking water requirements are roughly 150 litres per capita per day (LPCD), while in urban areas it is estimated to be 200 LPCD. Compared to rural households, the drinking water supply is substantially better in urban areas, where residents have access to tap water. However, in many rural locations, the insecure status of the drinking water supply is amplified by poor water quality. In India, about 22% of households lack access to clean and safe drinking water from a tap, tube well, and hand pump sources [
9]. As a result, in rural regions, it becomes the responsibility of women and children to walk long distances to obtain water from wells and streams for daily requirements [
10].
Although the government has started different schemes and wide-reaching programs to provide drinking water to all households, the demand and supply factors define the amount of water available for the masses. The supply factors include available water quality, the nature of water establishments and institutions, the sustainability of water resources such as rainfall, surface and groundwater availability, and the maintenance and operation of drinking water supply projects. Further deteriorating the problem from the demand side include population pressure, inappropriate discharge of water by industries, poor land use, inefficient drinking-water pricing mechanisms, and the flow of pesticides and fertilisers into water bodies [
9].
Water scarcity, especially during the summer season, results in the reduction and irregularity in per capita drinking water availability. Exacerbating the situation is the contamination that occurs in the distribution systems due to pipe rustiness and leaky pipes that result from a reduced water supply. This leads to more environmental and health-related problems in the district. For instance, in Karnataka, drinking-water supply schemes in the rural areas witness a decrease of 50% to 75% in the water supply compared to the intended water supply in the summer months [
5,
7]. Reduced availability of surface water, particularly during the summer, is another contributing factor to an insufficient drinking water supply. Harvesting rainwater has been overlooked due to a general lack of concern for its conservation, resulting in rainwater wastage by means of runoff and evaporation [
9]. In absence of harvesting mechanisms, rainwater, in turn, becomes a bane for badly managed agriculture land by aiding soil erosion, resulting in loss of crops and fertile soil, further affecting negatively the overall water carrying capacity of the land through a domino effect.
Rainwater harvesting can prevent runoff by virtue of rainwater being collected and stored in tanks, cisterns, natural reservoirs, and other natural and artificial storage facilities. The rainwater thus harvested can then either be utilized to directly recharge groundwater or stored for future use. Rainwater harvesting techniques are generally categorised as land-based or roof-based. Rooftop harvesting involves collecting rainwater from a building’s roof and storing it in a tank or artificial storage unit. Rooftop harvesting is less expensive than harvesting methods that require additional extensive construction, and provides high-quality rainwater that can be used for domestic use if properly installed, and the issue of contamination is taken care of during the planning. Harvesting rainwater through land-based techniques involves collection through catchment areas from man-made surfaces such as small reservoirs with earthen bunds or embankments. Then, it is stored and can be used for recharging aquifers [
11,
12,
13].
The widespread threat of the environmental conditions in Bengaluru Rural such as soil erosion, desert encroachment, an deforestation occurring at varying rates poses an impediment to sustainable water resource management [
7]. One form of land degradation is soil erosion, a phenomenon that occurs on all soil types, contributing a considerable amount of soil loss each year in the district. Agricultural systems without proper soil and water management strategies, land use change resulting in clearance of vegetation, and poorly maintained forest cover are major causes of soil erosion. The consequences of soil loss in the district have been reflected in the reducing crop production capacity, lowering surface water quantity and quality, and deteriorating drainage and water distribution systems [
7].
Water-saving practices, in any domain of demand, aid in preserving water in a community, and open up availability in the other domains (
Figure 2). Many studies have analysed the water-saving potential in the industrial and agricultural sectors, and recommended measures to achieve these savings [
14,
15,
16,
17,
18,
19]. Bauer et al. (2020) reported an increase in the water-reuse factor from 25% and 30% in industrial and residential areas, respectively, to 95% due to integrated management of different streams of wastewater [
15]. Siderius et al. (2021) reported up to 20% savings in the agriculture sector, with the use of conservatory irrigation measures being financially feasible without any adverse effect on farmers income in the Indus-Ganga basin in India [
14]. Zhang and Guo (2016) report that agriculture and industry accounted for 65.8% and 6.2% of the total water consumption, respectively, with the water use efficiency in agriculture a mere 58% [
18]. These numbers give us an idea about the potential and need for water savings in the agricultural sector, given that it is overwhelmingly the major consumer of water resources and that the use efficiency is just over 50%. In this regard, they reported a 10% potential savings in agricultural water consumption under the existing farming regime in the Fendong District of Fenhe Region in Shanxi Province, China [
18]. However, when the water-conserving practices are integrated with other ecosystem-benefiting measures and soil-health measures, farmers’ income was reported to increase [
20].
There are different water-saving farm practices that can contribute to reducing water consumption in agriculture to a large extent, and this includes choosing a suitable irrigation system, agricultural water reuse, and applying System of Crop Intensification (SCI) [
21]. In certain cases, this could also enable the farmers to cultivate in different seasons rather than in one particular season when water availability is high due to rainfall, resulting in higher harvest outputs and higher revenue. This would further enhance food security, boost agricultural output, and improve the economy. The method of irrigation carried out is an important factor to manage water resources in order to minimize wastage, especially in regions that encounter frequent water scarcity like Bengaluru rural. It is crucial to select an irrigation method that enhances the soil to retain water longer. There are several irrigation methods, like surface irrigation, sprinkler irrigation, and drip irrigation. Drip irrigation is suitable for regions facing water scarcity, as it helps to control and manage water while averting the high evaporation rate of water during the irrigation process [
22,
23].
Wastewater from agriculture can be reused, depending upon the particular wastewater stream and the subsequent treatment steps, and this is beneficial because a substantial amount of water is used for agricultural activities such as aquaculture and livestock. Agricultural reuse is usually part of wastewater recycling schemes, and this poses several advantages because it helps to conserve fresh water and prevent pollution of water bodies [
24]. Wastewater from animal farming, such as fisheries, can be treated and reused. Furthermore, water required for agricultural purposes can be optimally utilized to conserve the available water. It is important to note that despite capturing water through rainwater harvesting or water reuse schemes, water obtained needs to be managed and sustained for long-term use. Applying System of Crop Intensification (SCI) like System of Rice Intensification (SRI), System of Wheat Intensification (SWI), and Sustainable Sugarcane Initiative (SSI) as farm practices requires less water, with reported savings of up to 50% [
21,
25].
The SCI practices enhance crop productivity and build crop resilience. Crops like rice, wheat, sugarcane, millet, maize, vegetables, and fruit crops have been cultivated using SCI, yielding good results [
21]. Sugarcane, wheat, millet, sorghum, rice, and several other crops suitable for SCI are widely grown in Bengaluru rural [
26,
27]. This makes it more practicable to promote SCI in Bengaluru rural. The SCI practices are an alternative to the conventional method of cultivation, which requires a larger amount of water. Adoption of these water-saving farm practices will enable farmers to produce crops all year, irrespective of the season [
28].
In this context, this paper aims at illustrating the concept of a decision support system (DSS) tool that, following the Whole-of-Resource approach (WORA), facilitates the selection of the optimum water treatment and distribution systems from the available ones based on the user’s scoring of the different selected criteria. The illustrative proof of concept DSS also provides recommendations on the optimal rainwater harvesting system and water-saving agricultural practices based on the agro-ecological parameters input by the user. This paper does not present a definitive tool that is ready to be used, but rather provides a primer that can be further developed to be made ready to use in different contexts.
2. Methodology
Decision Support Systems (DSS) have been proposed for use in different sectors to improve informed decision making, allocate resources equitably and sustainably, and to optimize intended results. These include sectors ranging from industrial production systems and energy consumption to agricultural planning and water resource use [
29,
30,
31,
32,
33,
34]. In this regard, one of the approaches relevant to the context-specific selection of water treatment and distribution systems is the multi-criteria decision analysis (MCDA) approach [
35,
36]. The MCDA is particularly relevant for complex systems where decision-making is dependent on a range of factor and relationships, involving trade-offs and complementarities [
37,
38]. For example, the environment sector involves the consideration of different factors and interdependencies for informed and holistic decision-making, which can be streamlined with MCDA [
39,
40,
41]. In this regard, different studies have put forth DSS tools for application in different areas of water resource management, including groundwater protection, surface water conservation, water loss avoidance, water treatment, and water distribution [
42,
43,
44].
Aydin et al. (2015) proposed a DSS to evaluate different water distribution systems that recommends scenario-specific solutions based on the evaluation. The key deciding aspects considered in this regard were reliability, resilience, and (tolerance of) vulnerability [
45]. Abaid Ullah et al. (2020) developed a DSS to assist engineers and policymakers to select the optimum wastewater treatment technologies. This DSS takes multiple technical, social, economic, regulatory, governmental, and environmental factors into consideration [
46]. Gheibi et al. (2022) devised a DSS to devise the optimum water decontamination process through a scenario analysis of different decontaminant concentrations, similar to the one developed by Lamrini et al. [
47,
48]. Furthermore, Mutikanga et al. (2011) proposed a decision support tool based on MCDA to devise a process to choose the best suited water loss reduction option, mirroring the tool devised by Calizaya et al. (2010) for integrated water resource management [
36,
49]. More recently, Marttunen et al. (2021) coupled MCDA with the concept of ecosystem services to propose a holistic approach to water management, taking different trade-offs and scenarios into consideration [
50]. The DSS tools and approaches proposed so far have focused on a single aspect of water management viz cost efficiency, scenario analysis, framework comparisons, and process optimization [
45,
46,
47,
48,
50]. This study proposes a DSS process based on the application of MCDA to provide guidance in the selection of the most fitting water treatment and distribution systems for different contexts, taking into account the criteria of affordability, environmental impact, the ease of operation, performance, service and repair needs, involvement of the public, and technological level.
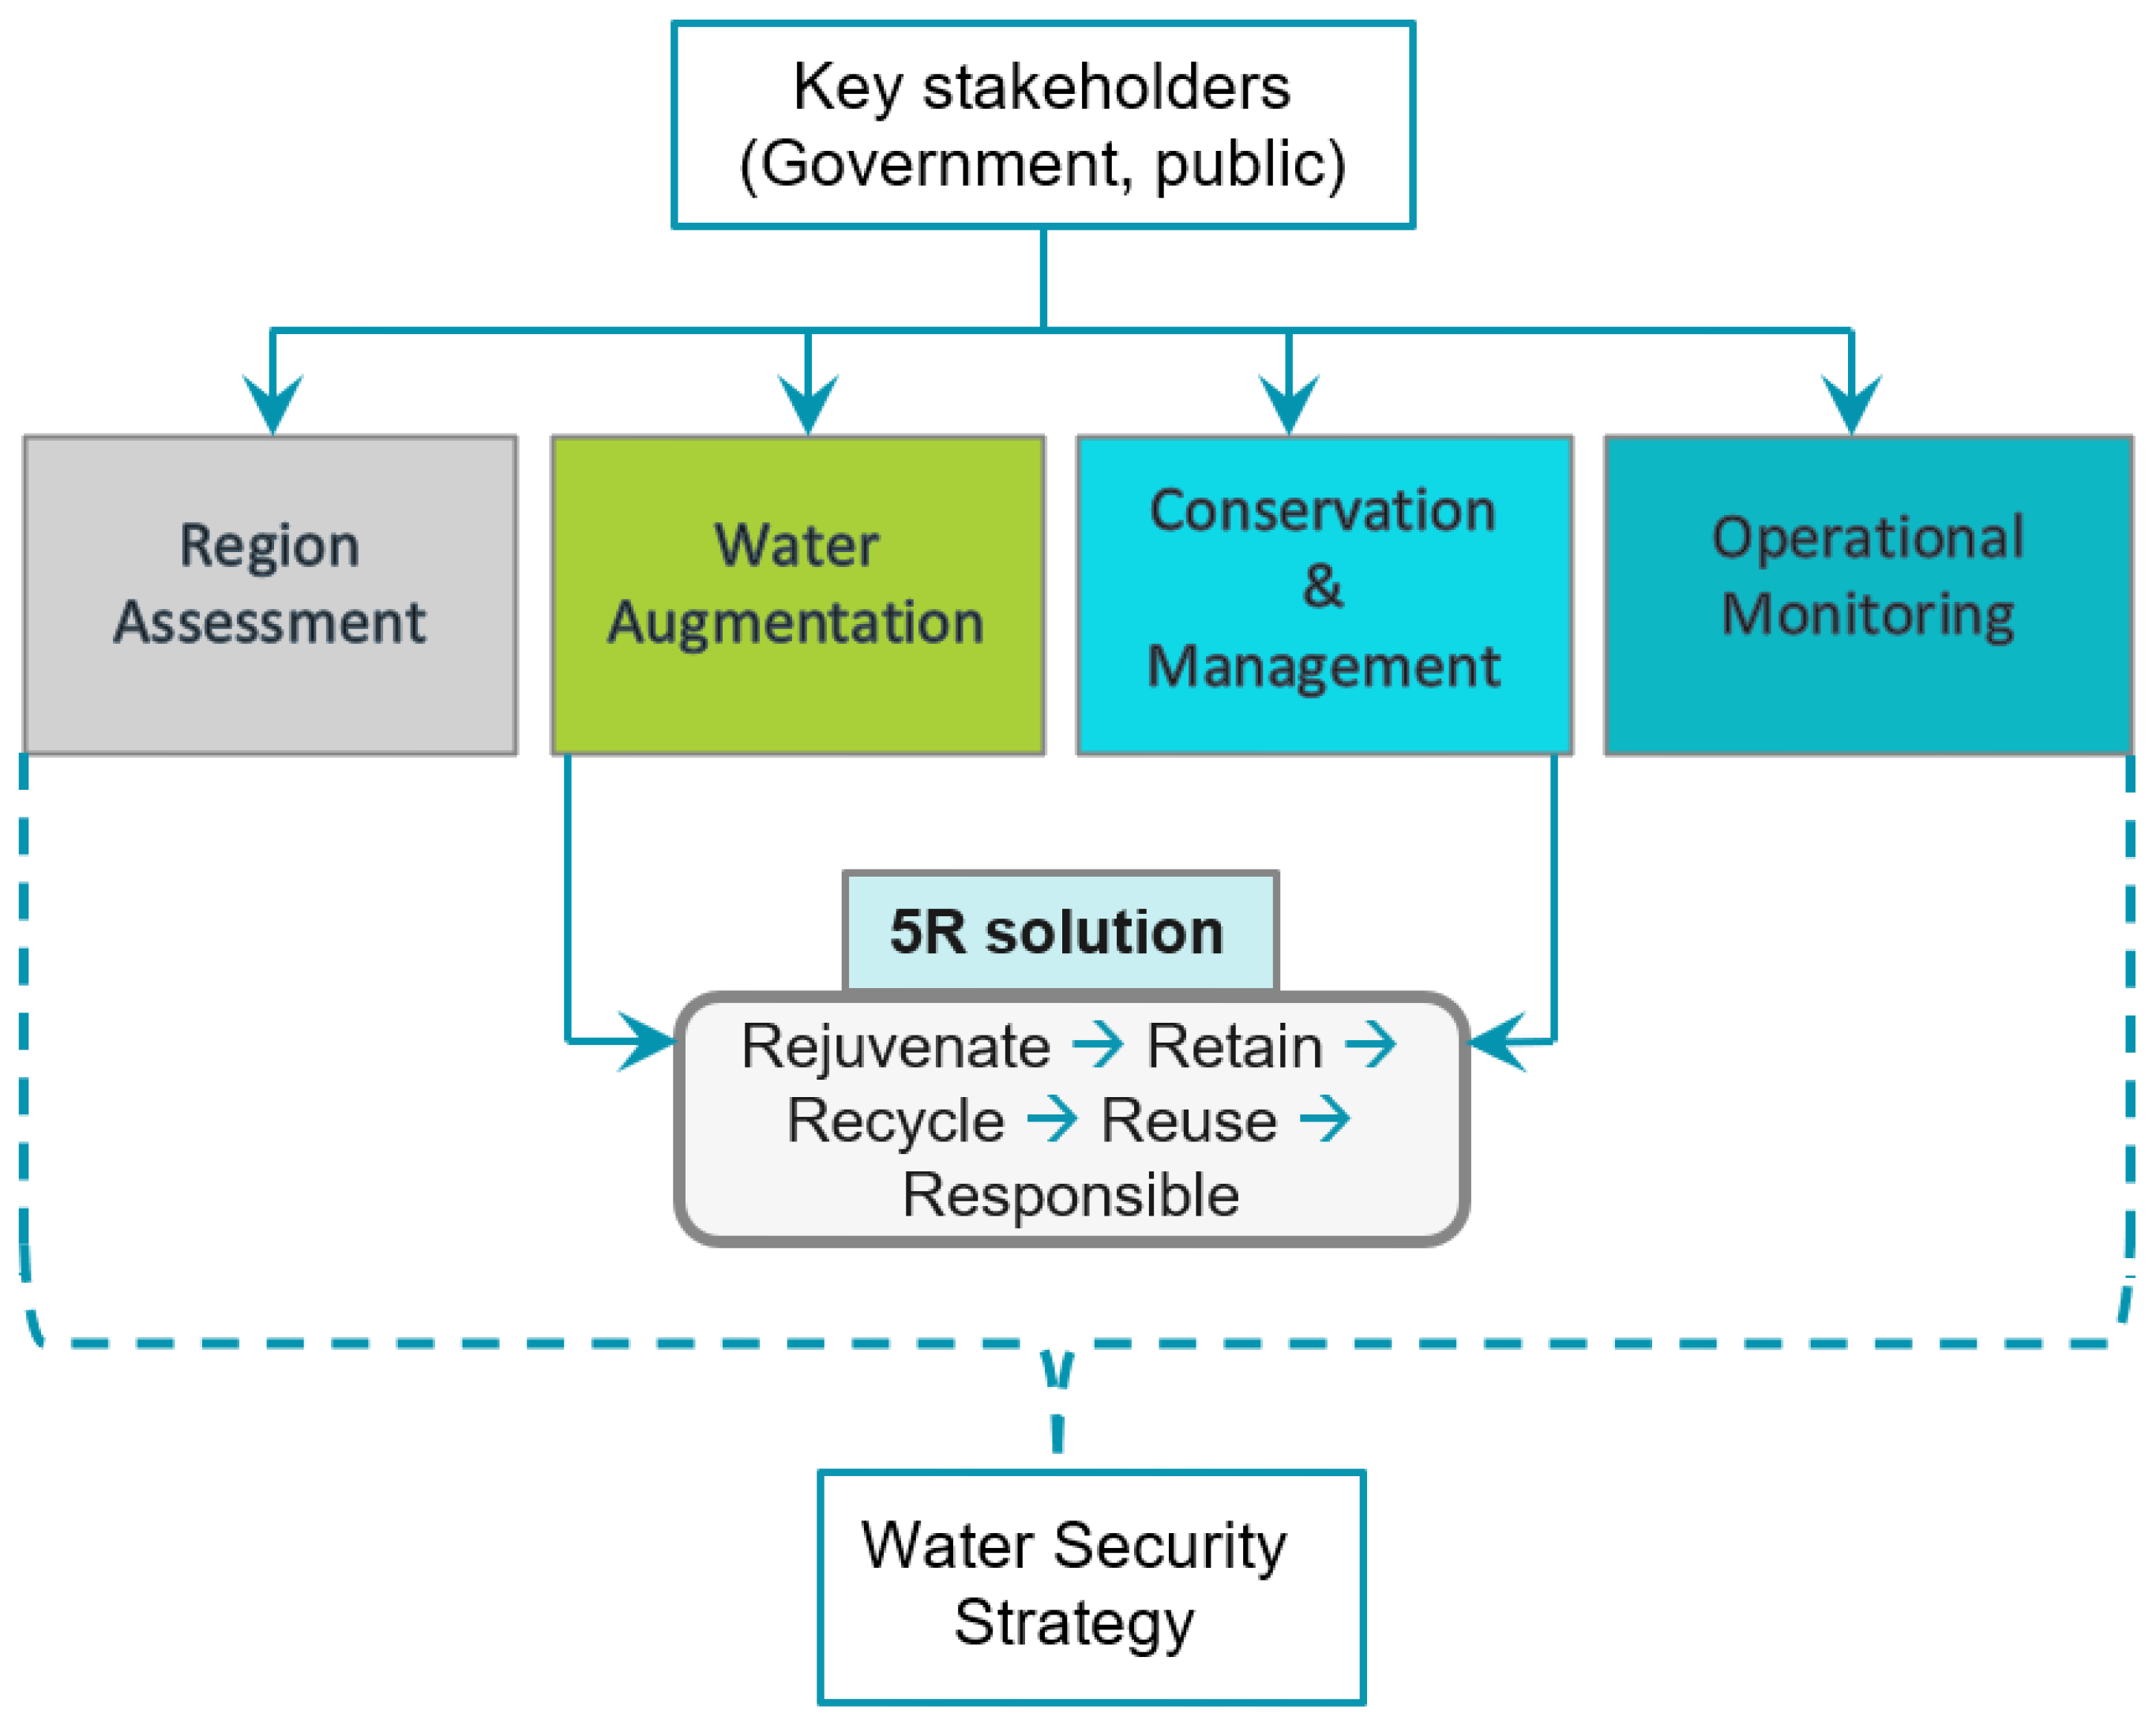
Different domains of water use and replenishment are intricately linked to each other. Any amount of savings in one domain can lead to an increased availability for the other domains. Hence it is important to mention that a systems approach to improving the drinking-water availability involves more than just a design of water treatment and distribution systems. We call such a systems’ approach the Whole-of-Resource Approach (WORA), which is the whole-of-government approach (WOGA) applied to resource governance, in this case, water management and, by extension, water governance. This approach proposes a cross-sectoral analysis of water use to present an overall picture of the potential of water savings. Such a holistic approach mandates solutions that provide recommendations to water-conserving strategies in different sectors, for example, in agriculture as well as rainwater harvesting methodologies. Based on these principles and taking into account the different seasonal, geographical, and demographic factors, a comprehensive Decision Support System takes into account all possible sources and sinks of the water resources, i.e., all possible processes that lead to either a positive or a negative change in the whole water resource. Hence the different recommendations that the DSS can provide fall mainly under the 5R solution: Rejuvenate, Retain, Recycle, Reuse, and Responsible use proposed by Ramachandra et al. (2016) as illustrated in
Figure 3 [
5].
In this regard, ‘Rejuvenate’ would cover the potential recharging of the groundwater table through appropriate rainwater harvesting systems, while ‘Retain’ would mean conserving available water resources by reducing excessive use, adopting water saving practices, and by reducing pollution. ‘Recycle’ and ‘Reuse’ cover the different ways water used in one sector can be used in other sectors with or without further treatments or by rerouting appropriately treated wastewater into the surface water. Lastly, ‘Responsible use’ covers the general concept of avoiding excessive use of the water resources across all sectors by leveraging all the other Rs.
Based on numerous performance criteria, some specific systems and technologies have been designed and evaluated for application in the household. In addition to performance criteria of treatment technologies to enhance water quality, to offer ease of use, and to reduce system costs, other performance criteria that are considered include environmental sustainability and dissemination potential, which involves the availability of qualified workers who can repair and routine maintenance requirements. Surface water, groundwater, rainwater, and other sources of water used for drinking and other domestic uses can be purified using several treatments technologies such as filtration, chlorination, and ultra-violet (UV) radiation. Although there are many treatment systems, including innovative technologies, systems that are readily available and which are most suitable for Bengaluru rural considering the location, environmental conditions, cost, and other factors are important factors to note. These available treatment systems can be used to treat water for potable uses in a community (small-scale systems) or a single household (point-of-use systems) [
1]. Various water treatment systems are further discussed based on their performance criteria.
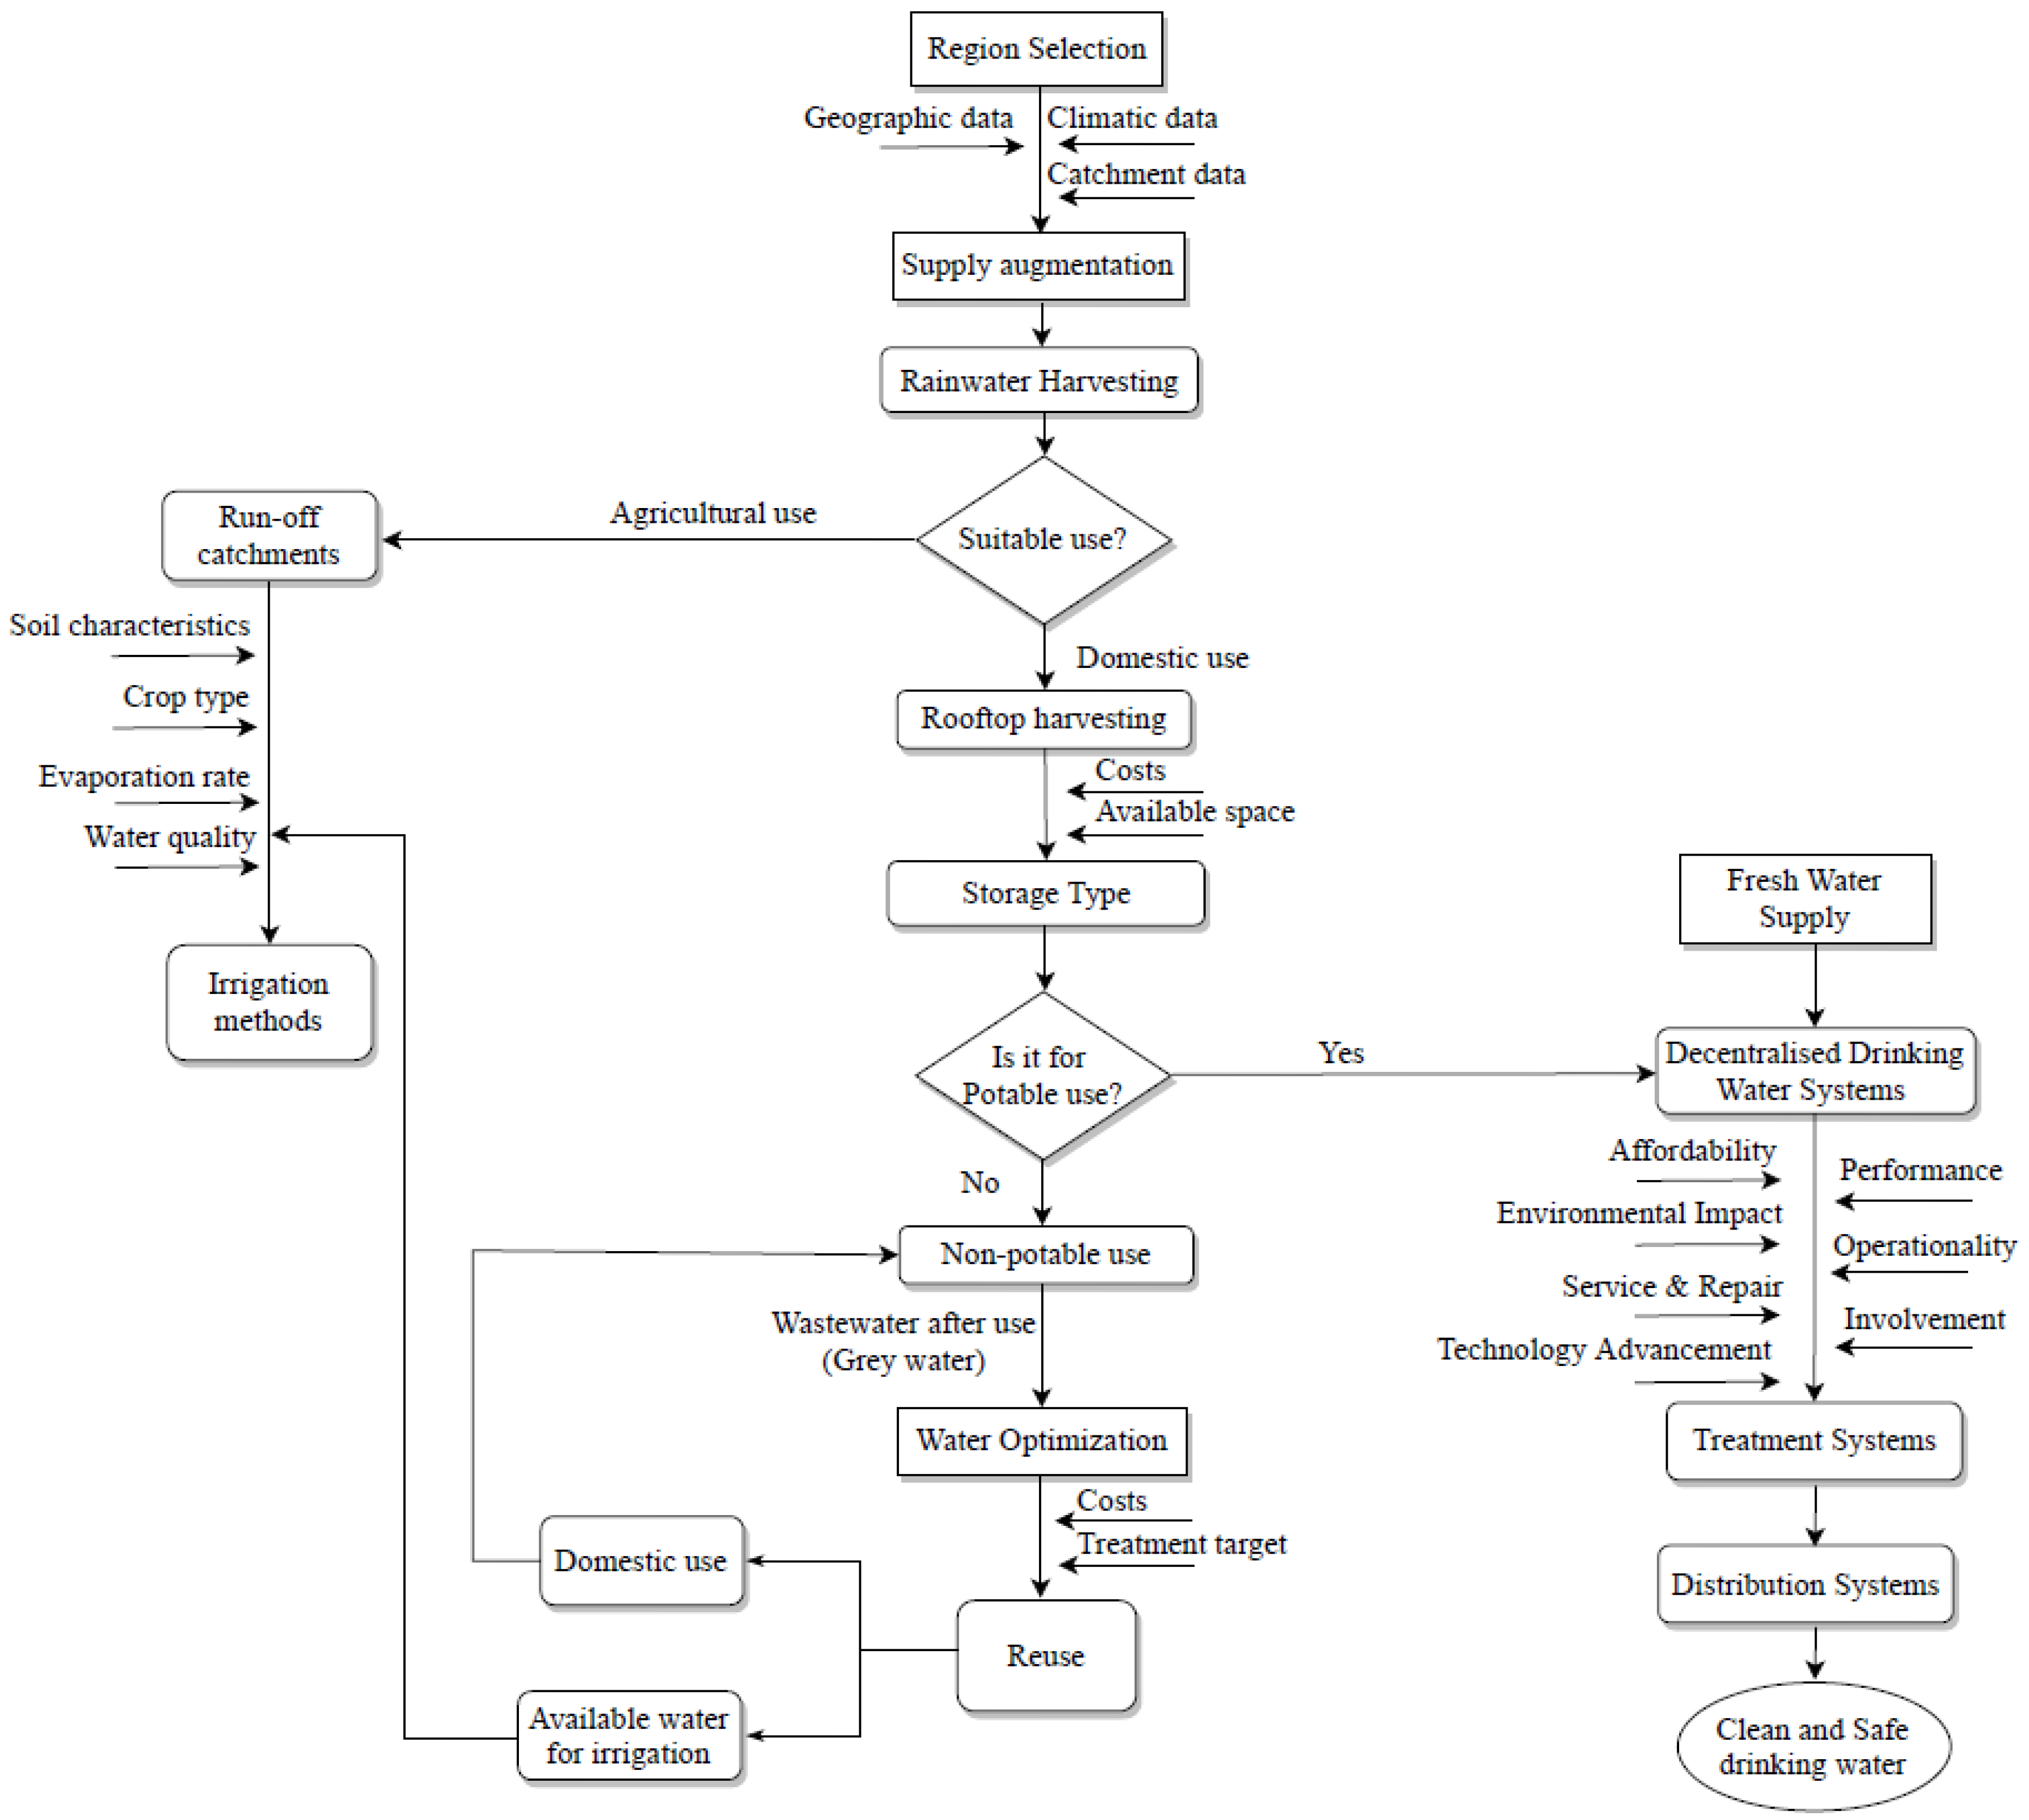
Figure 4 illustrates the general architecture of the decision tree that forms the basis of the DSS proposed in this paper. The user needs to provide some necessary inputs which include geographic, climatic, and agro-ecological data, based on which the system can provide recommendations regarding water savings in agriculture and rainwater harvesting. Furthermore, the user must input their preferability by giving scores to the different criteria (seven criteria in the current case) based on which the system proposes the best suited treatment and distribution system for the water supply.
3. Results
The decision support system tool, its three key components, which include the input data, user interface, and the model, are presented in this section in detail. Arguably, some of the information in this section could also be discussed under the previous Section, Methodology. However, our idea is to present the different steps involved in the process of the decision support system itself as the result of this study. The Results Section, hence, is aimed to be an easy-to-follow process guide for practitioners and governance institutions to replicate these in their own local specific contexts, following the Whole-of-Resource Approach (WORA).
The user interactive web-based tool was designed using HTML, CSS, and JavaScript. The system was designed to allow users to input their region information, and this inputted detail generates data that are read by the model to produce an output. Incorporating multiple criteria decision analyses (MCDA), the model uses a weighted scoring model of statistical analysis to produce an output formulated from the DSS framework [
51,
52].
MCDA is used for the development of the decision model in selecting the most suitable treatment and distribution system. This involves a four-step process, namely, outlining the alternatives, which are the treatment and distribution system options, defining the criteria, assigning scores to each system, and finally calculating the weighted score. In step 1, the treatment and distribution systems to be considered for implementation in Bengaluru rural are first outlined. The treatment systems for the model include SODIS (Solar water disinfection), biosand filters, coagulation, filtration, chlorination, activated carbon filter, MF (Micro filtration), NF (Nano filtration), and RO (Reverse osmosis). The distribution systems include bottled water, water tankers, community kiosks, and piped water distribution. Additionally, a set of seven key criteria that have a significant impact on each treatment and distribution system are defined, which include affordability, environment impact, operationality, performance, service and repair, level of involvement, and technology advancement (
Table 1). These criteria are economic-, social-, technical-, and environmental-related selections.
In step 2, the criteria are clearly defined. The treatment and distribution systems are assessed using similar criteria. Affordability indicates the cost level, both investment and operational costs of the systems. Environmental impact indicates the ability of systems to conserve natural resources and protect ecosystems that preserve the environment and human health. Operationality indicates the ease at which the systems can be used, whether it is non-labour-intensive or an automatic system. It shows whether a treatment system is labour-intensive and time-consuming, as well as requiring skilled workers for operation. Performance indicates the efficiency of systems to provide high water quality. Service & Repair indicates the frequency at which the systems are repaired and how challenging it is to maintain the various components, especially in the case of the distribution systems. Involvement indicates the ability of a system to provide water for large users such as a community or region, and the ability to cover both rural and urban areas in the case of distribution systems. Technology advancement indicates the level of development the systems have reached at the given time. This could be a state-of-the-art or traditional technology.
In step 3, scores are assigned to each system based on a literature review of the performance of the different systems against the set criteria. The effectiveness of a weighted scoring model is demonstrated by the fact that no two criteria are mostly equal in importance. The preference for a particular criterion defers amongst users. As a result, each criterion must be given a precise weight value in the form of a percentage. To compute the percentage scores assigned to each criterion, the model allows the user to make their own selections based on which criteria are valued more. Criteria selection is rated on a scale of 1 to 10, and is set by moving the range bar to prioritize criteria according to the user’s preference, as can be seen in the following figures. Then, the model reads the inputted value and converts it to weighted percentages based on the user’s priority. Weight (X) is the percentage value used to describe the degree of importance of each specific criterion in relation to the user input. The weight value is assigned to each criterion on the basis that the criteria weights sum up to 100%.
For the model to successfully suggest suitable systems at any given condition, the right scores have to be assigned to the different treatment and distribution systems. The systems are compared against each other based on affordability, environmental impact, operationality, performance, service and repair, involvement, and technology advancement.
Furthermore, the different options/systems were assigned degrees of satisfaction, with the scores ranging from 1 to 5, with “1” indicating no satisfaction and “5” representing full satisfaction. Based on the summarized comparison from the literature, each treatment and distribution system are assigned scores according to the degree of satisfaction to the seven criteria as shown in
Table 2 and
Table 3. Scores (Y) in
Table 2 and
Table 3 are the numeric value assigned to each treatment and distribution system for satisfying each given criterion.
In step 4, the weighted score is calculated, and this is achieved at the backend of the model, not visible to the end-users. The weights are assigned by the user to the seven different criteria, depending on the priority of the user or their community, for example, whether the community wants to give more weight (on a scale of 1–10) to affordability or to environmental impact. A weighted score is then calculated as the weight of each criterion multiplied by the score of each treatment and distribution system in relation to the criteria. This is calculated according to the following formula [
2].
A relative weighted score is the sum of the weighted scores of each treatment and distribution system divided by the number of set criteria. This gives the average of the weighted scores of each treatment and distribution system. The relative weighted score is calculated according to the following formula [
2].
Assuming that each treatment and distribution system is represented by “P”, using the formula of the relative weighted score, the relative weighted score P of a particular treatment or distribution system is computed as shown in the equation below [
2]:
where
Xa–
Xg: represent the weights of the different criteria tabulated in
Table 2 and
Table 3, and
Ya–
Yg represent the scores of treatment or distribution system in relation to the respective criteria. Furthermore, the total scores are computed for plotting the graphs and charts to easily compare each treatment and distribution system based on the selected criteria. This is computed according to the following formula [
2]:
This first working version of the DSS framework is aimed to be an initial illustrative proof of concept as a primer for the detailed context-specific development of a decision support system to be used by local administrators or engineers associated with the drinking water supply departments. Based on a set of region-specific inputs provided by the user, the DSS provides a set of recommendations covering the aspects of water conservation, water treatment, and water distribution. The inputs to be provided by the user appear as shown in the following figures, which give an overview of how the navigation in the DSS model works. While the seven criteria (a–g in
Table 2 and
Table 3) are expected to be constant across different contexts, the further development of the DSS and its validation in specific contexts shall take into consideration local needs and requirements, and the different available options for the treatment and distribution options shall be adapted accordingly.
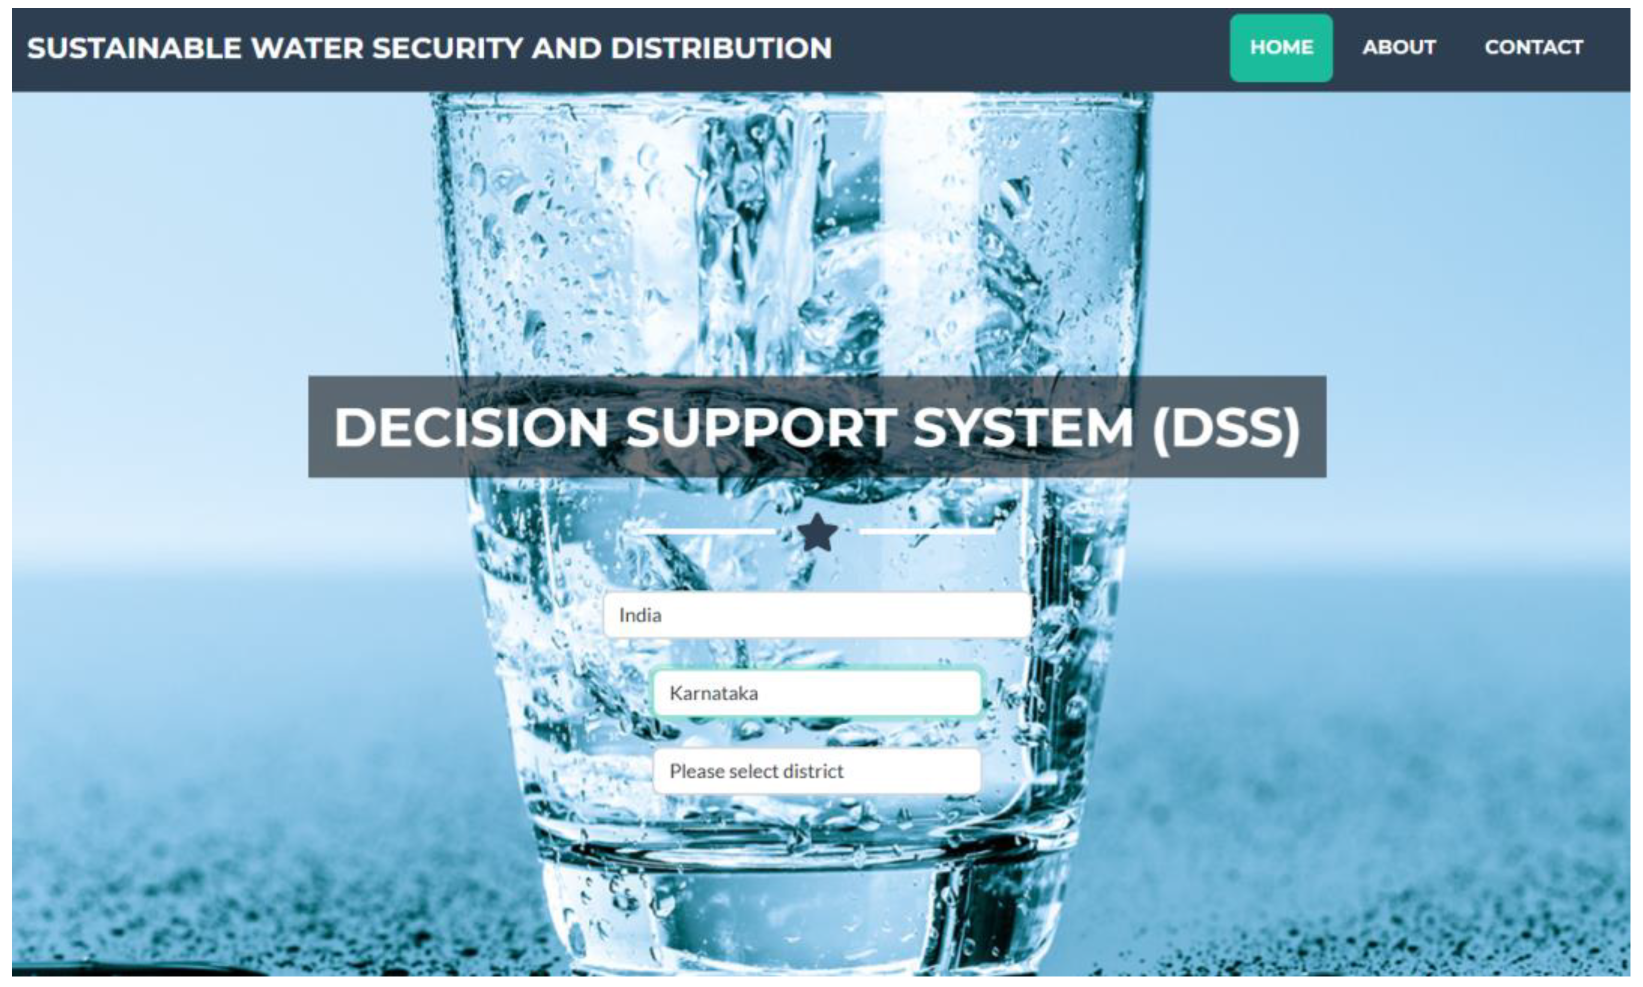
The user selects the country, state, and the district on the starting page (
Figure 5). Once the complete details are put in, the program leads to the next page (
Figure 6), which provides some background data about the selected region. Upon clicking the ‘Next’ button, the screen shown in
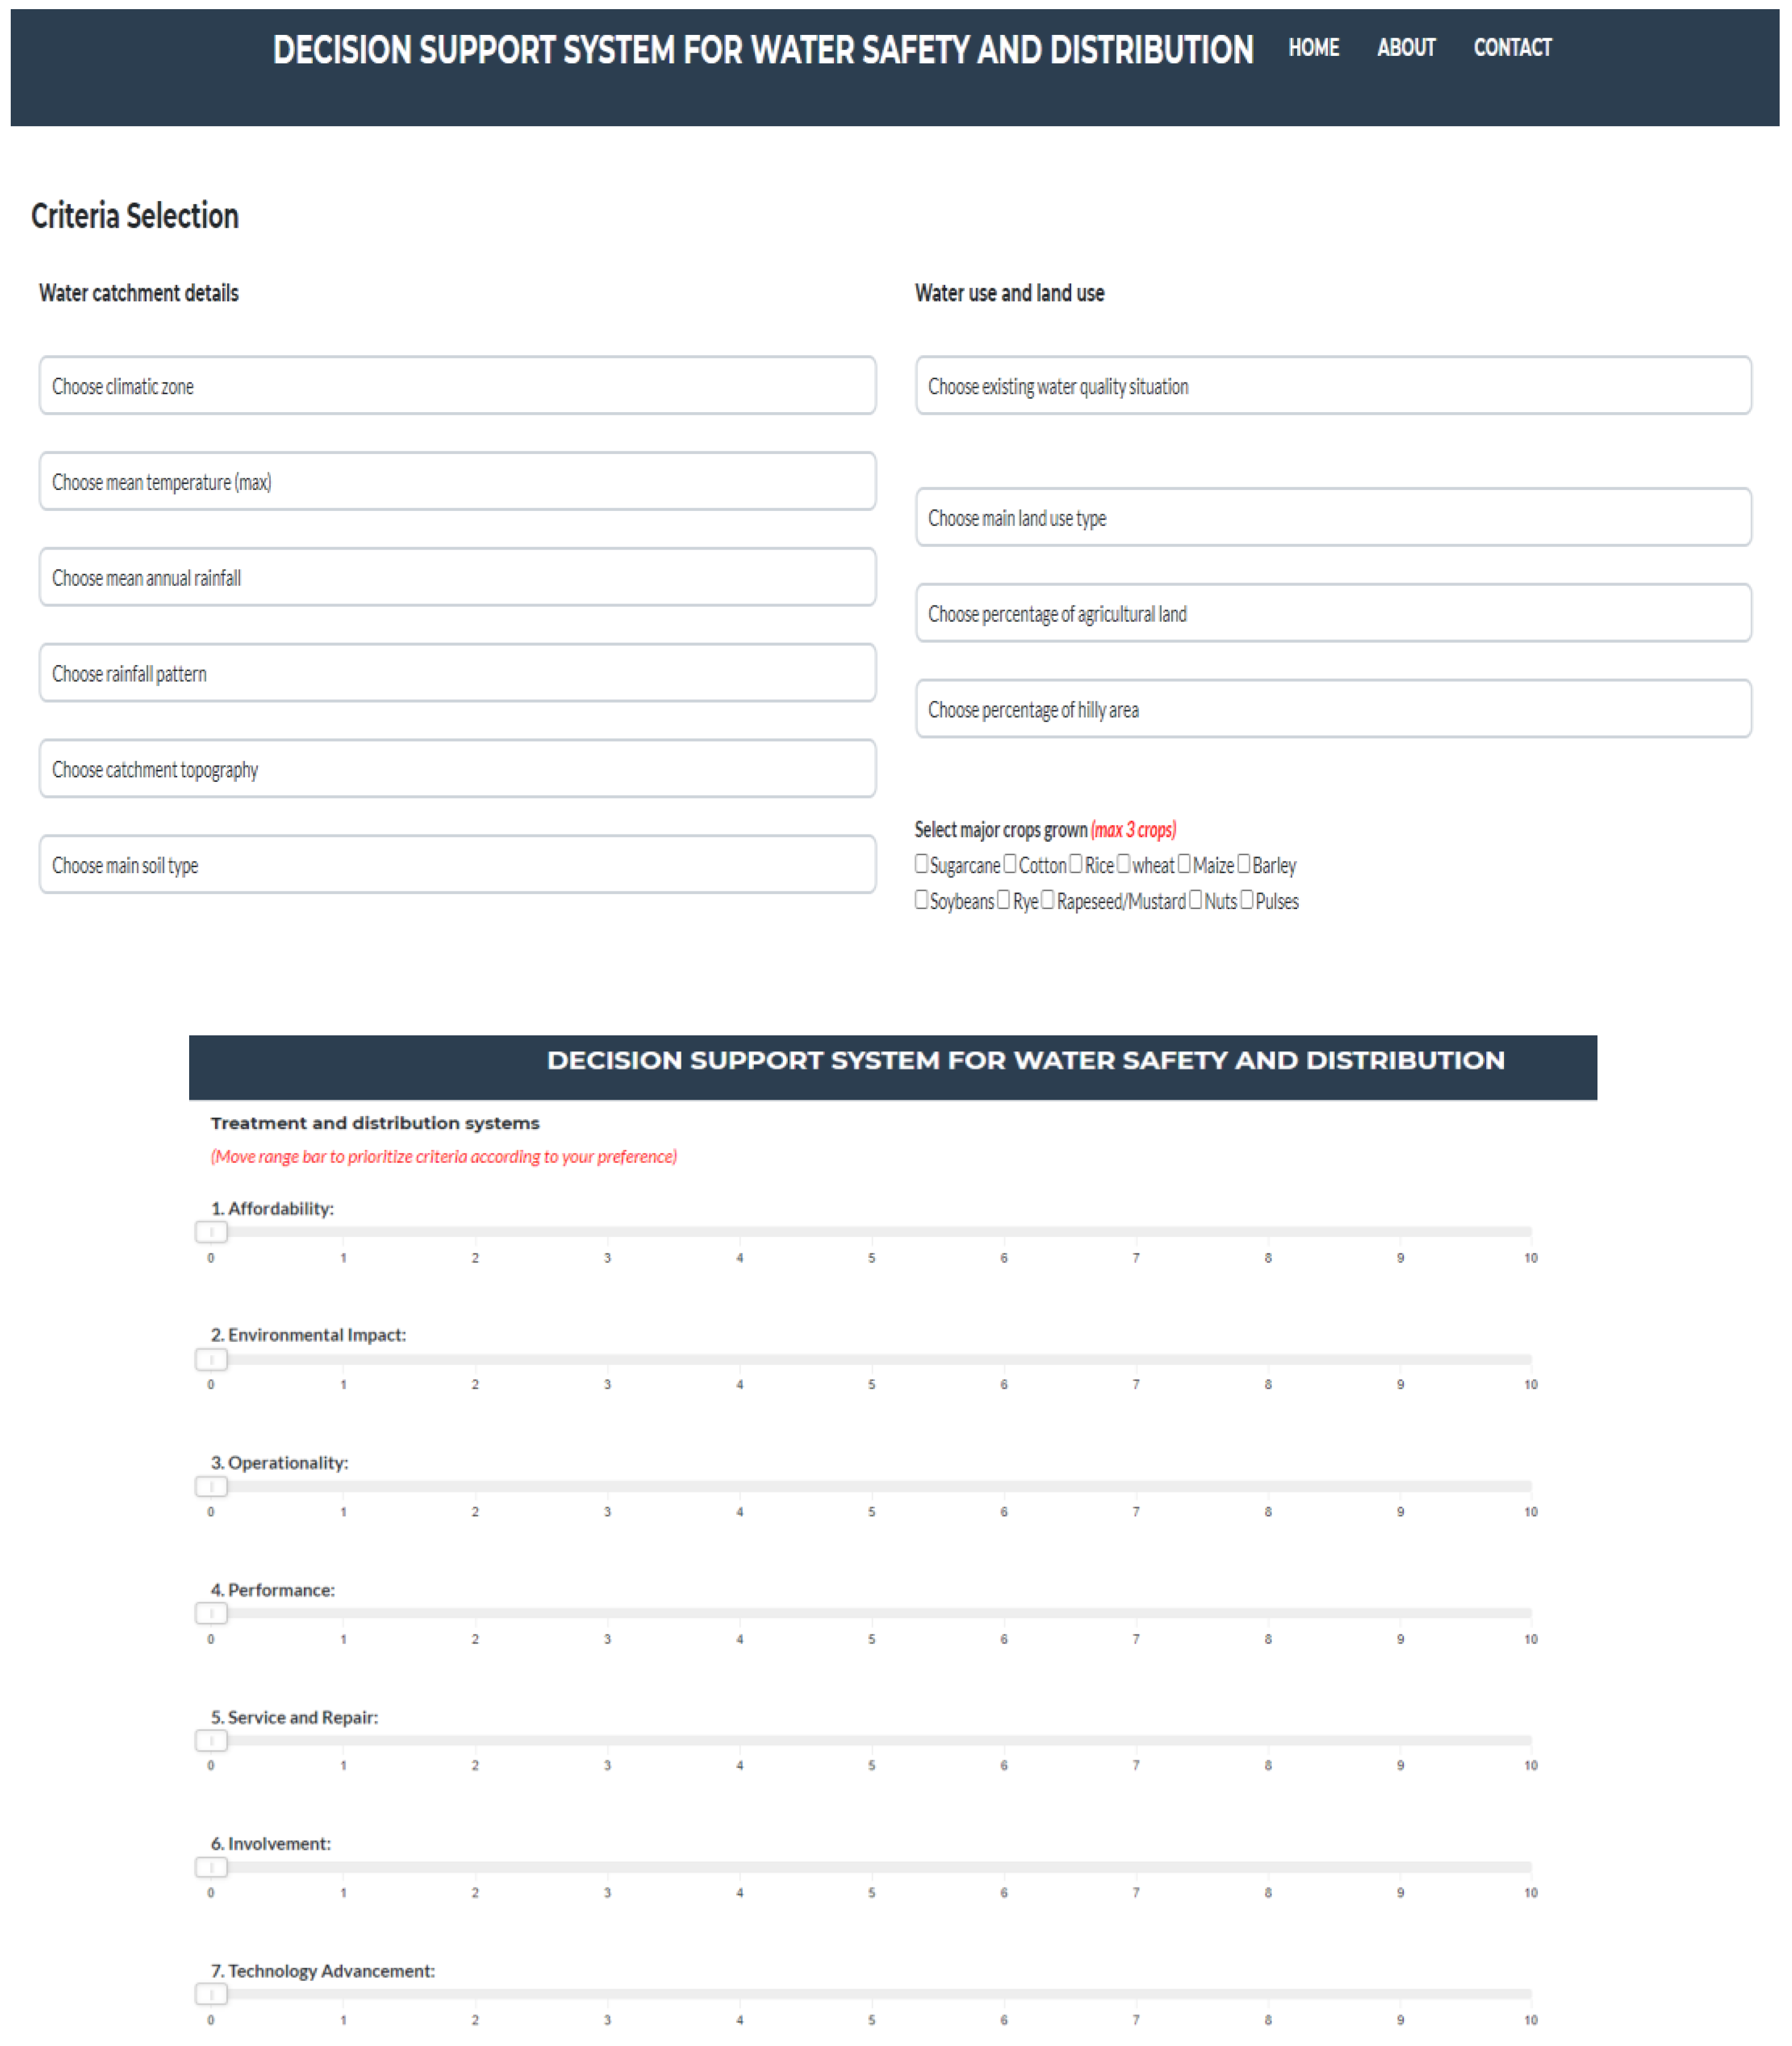
Figure 7 appears. This is the stage where the user inputs are provided (
Figure 7).
The top part of the DSS illustration above (
Figure 7) focuses on the inputs needed for decision support recommendations for improving water availability through savings in agriculture, rainwater harvesting, and groundwater recharge. The inputs in the bottom part of the DSS illustration (
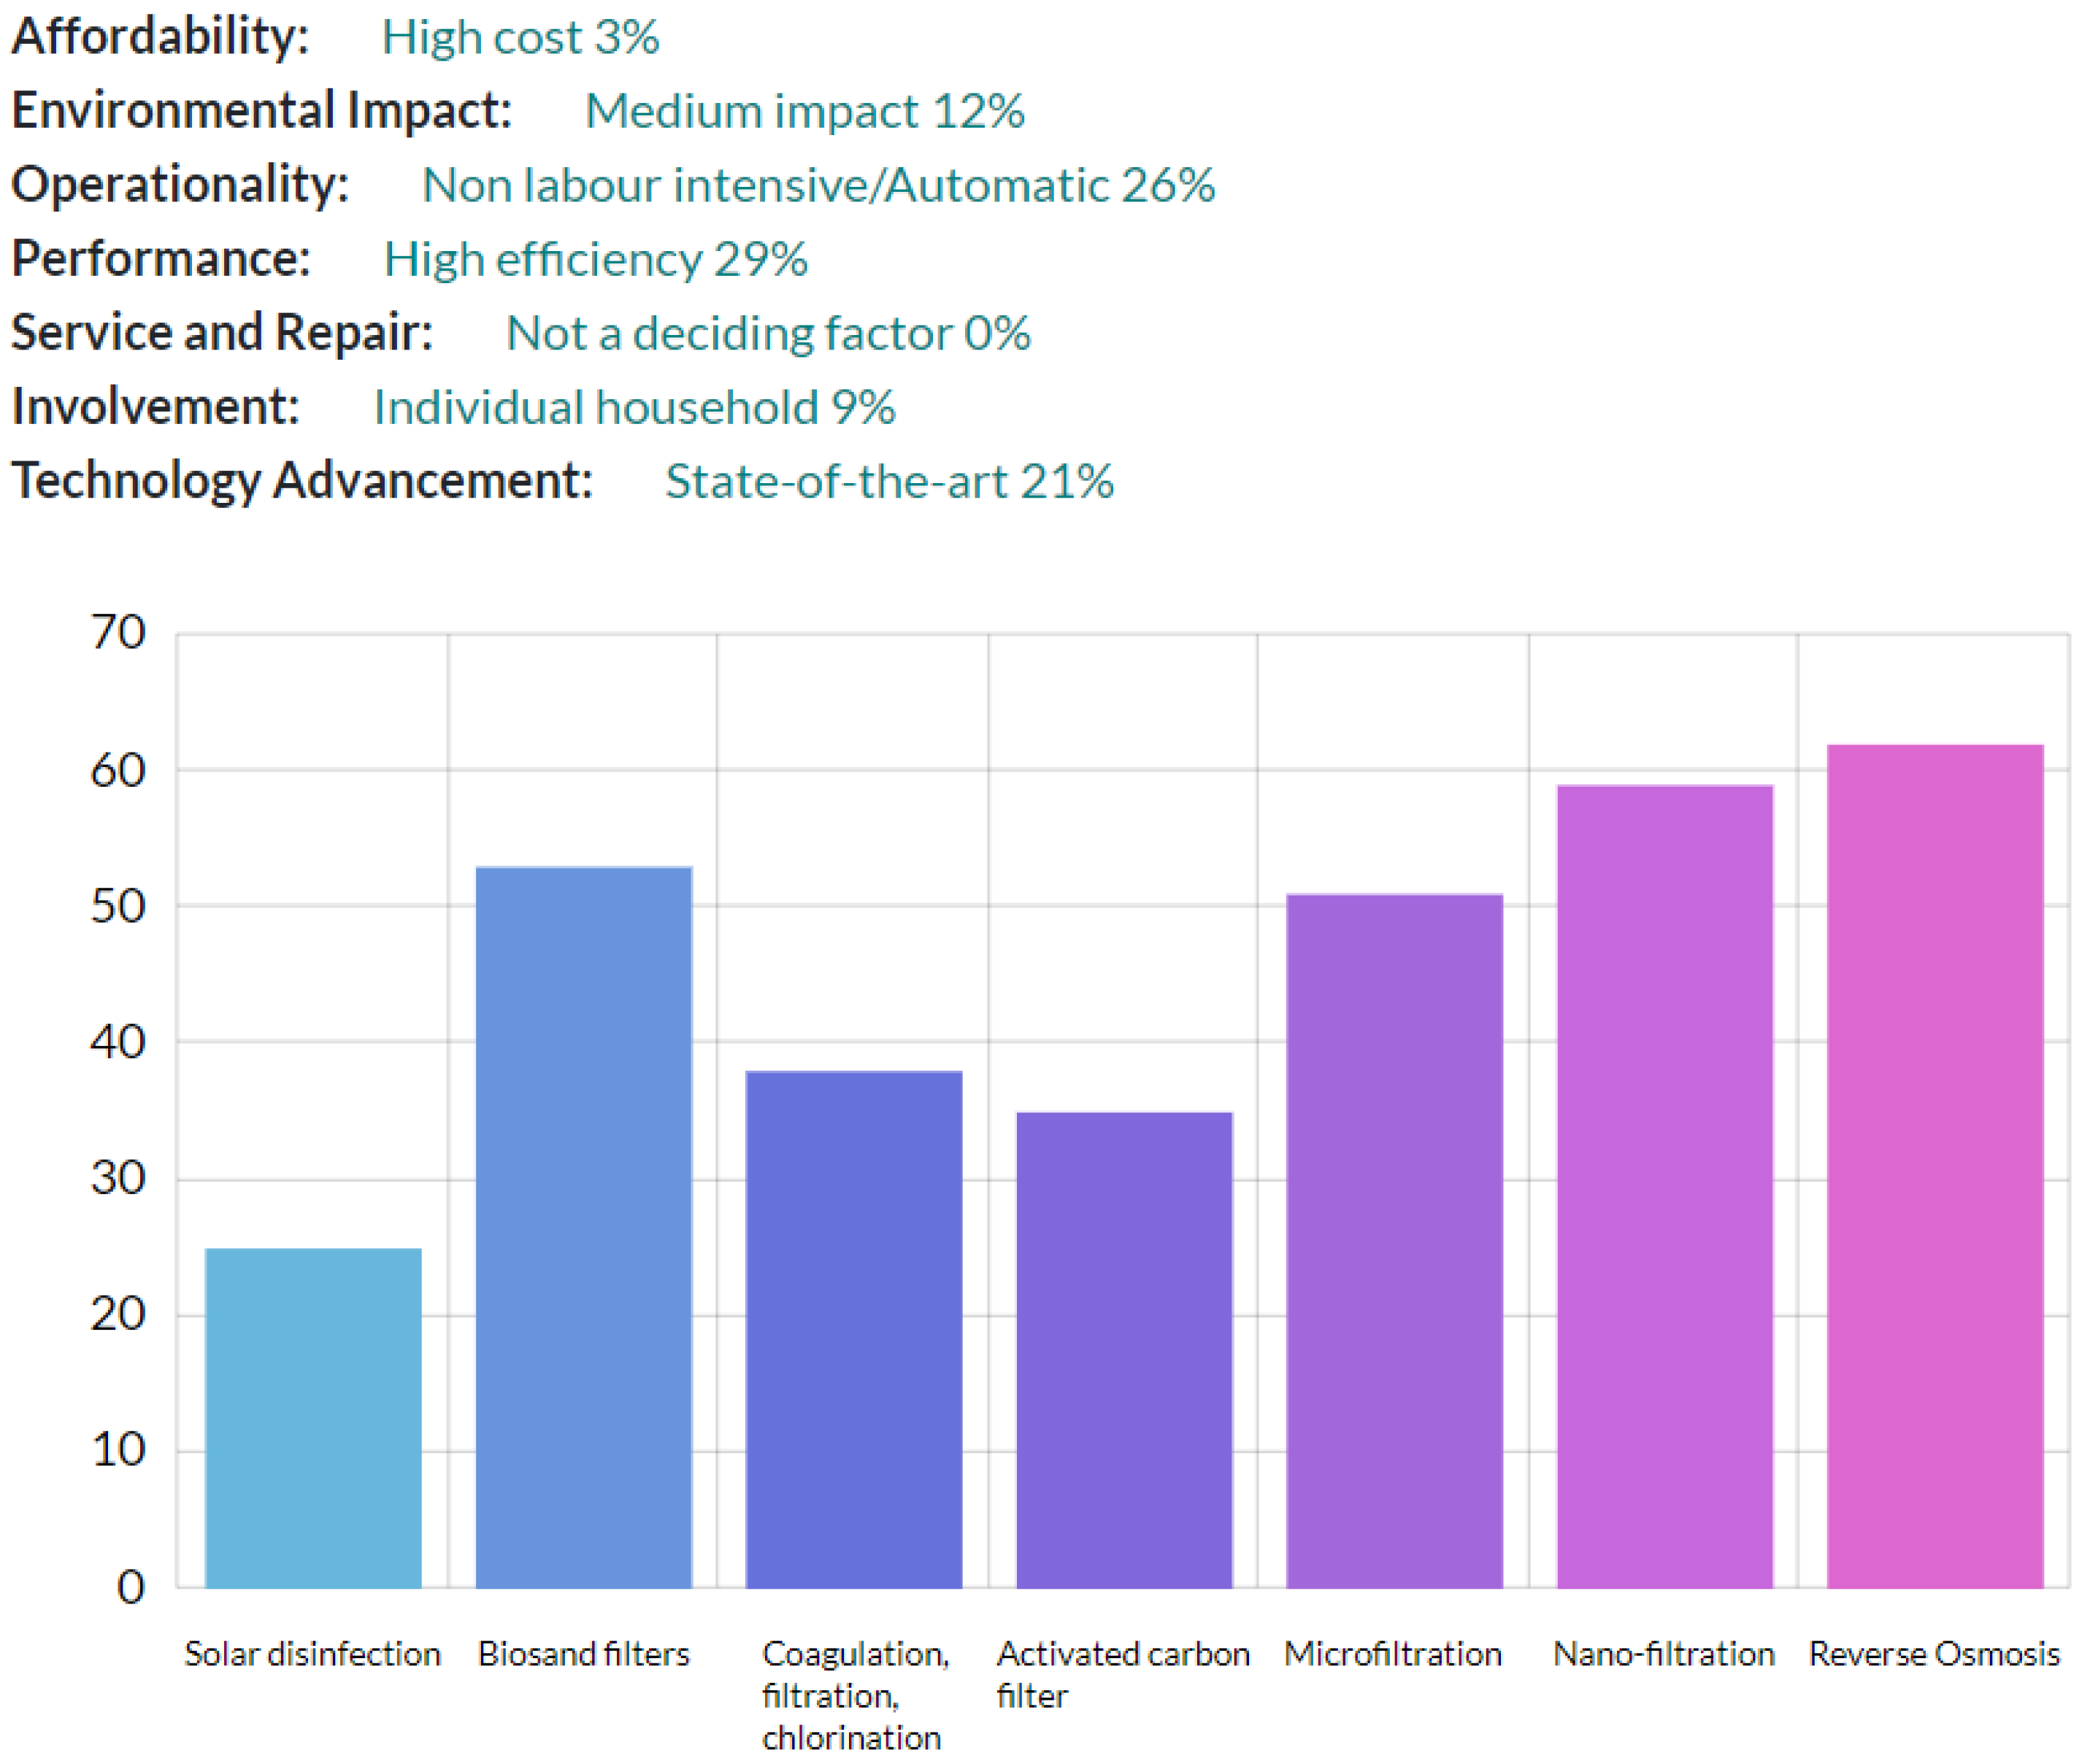
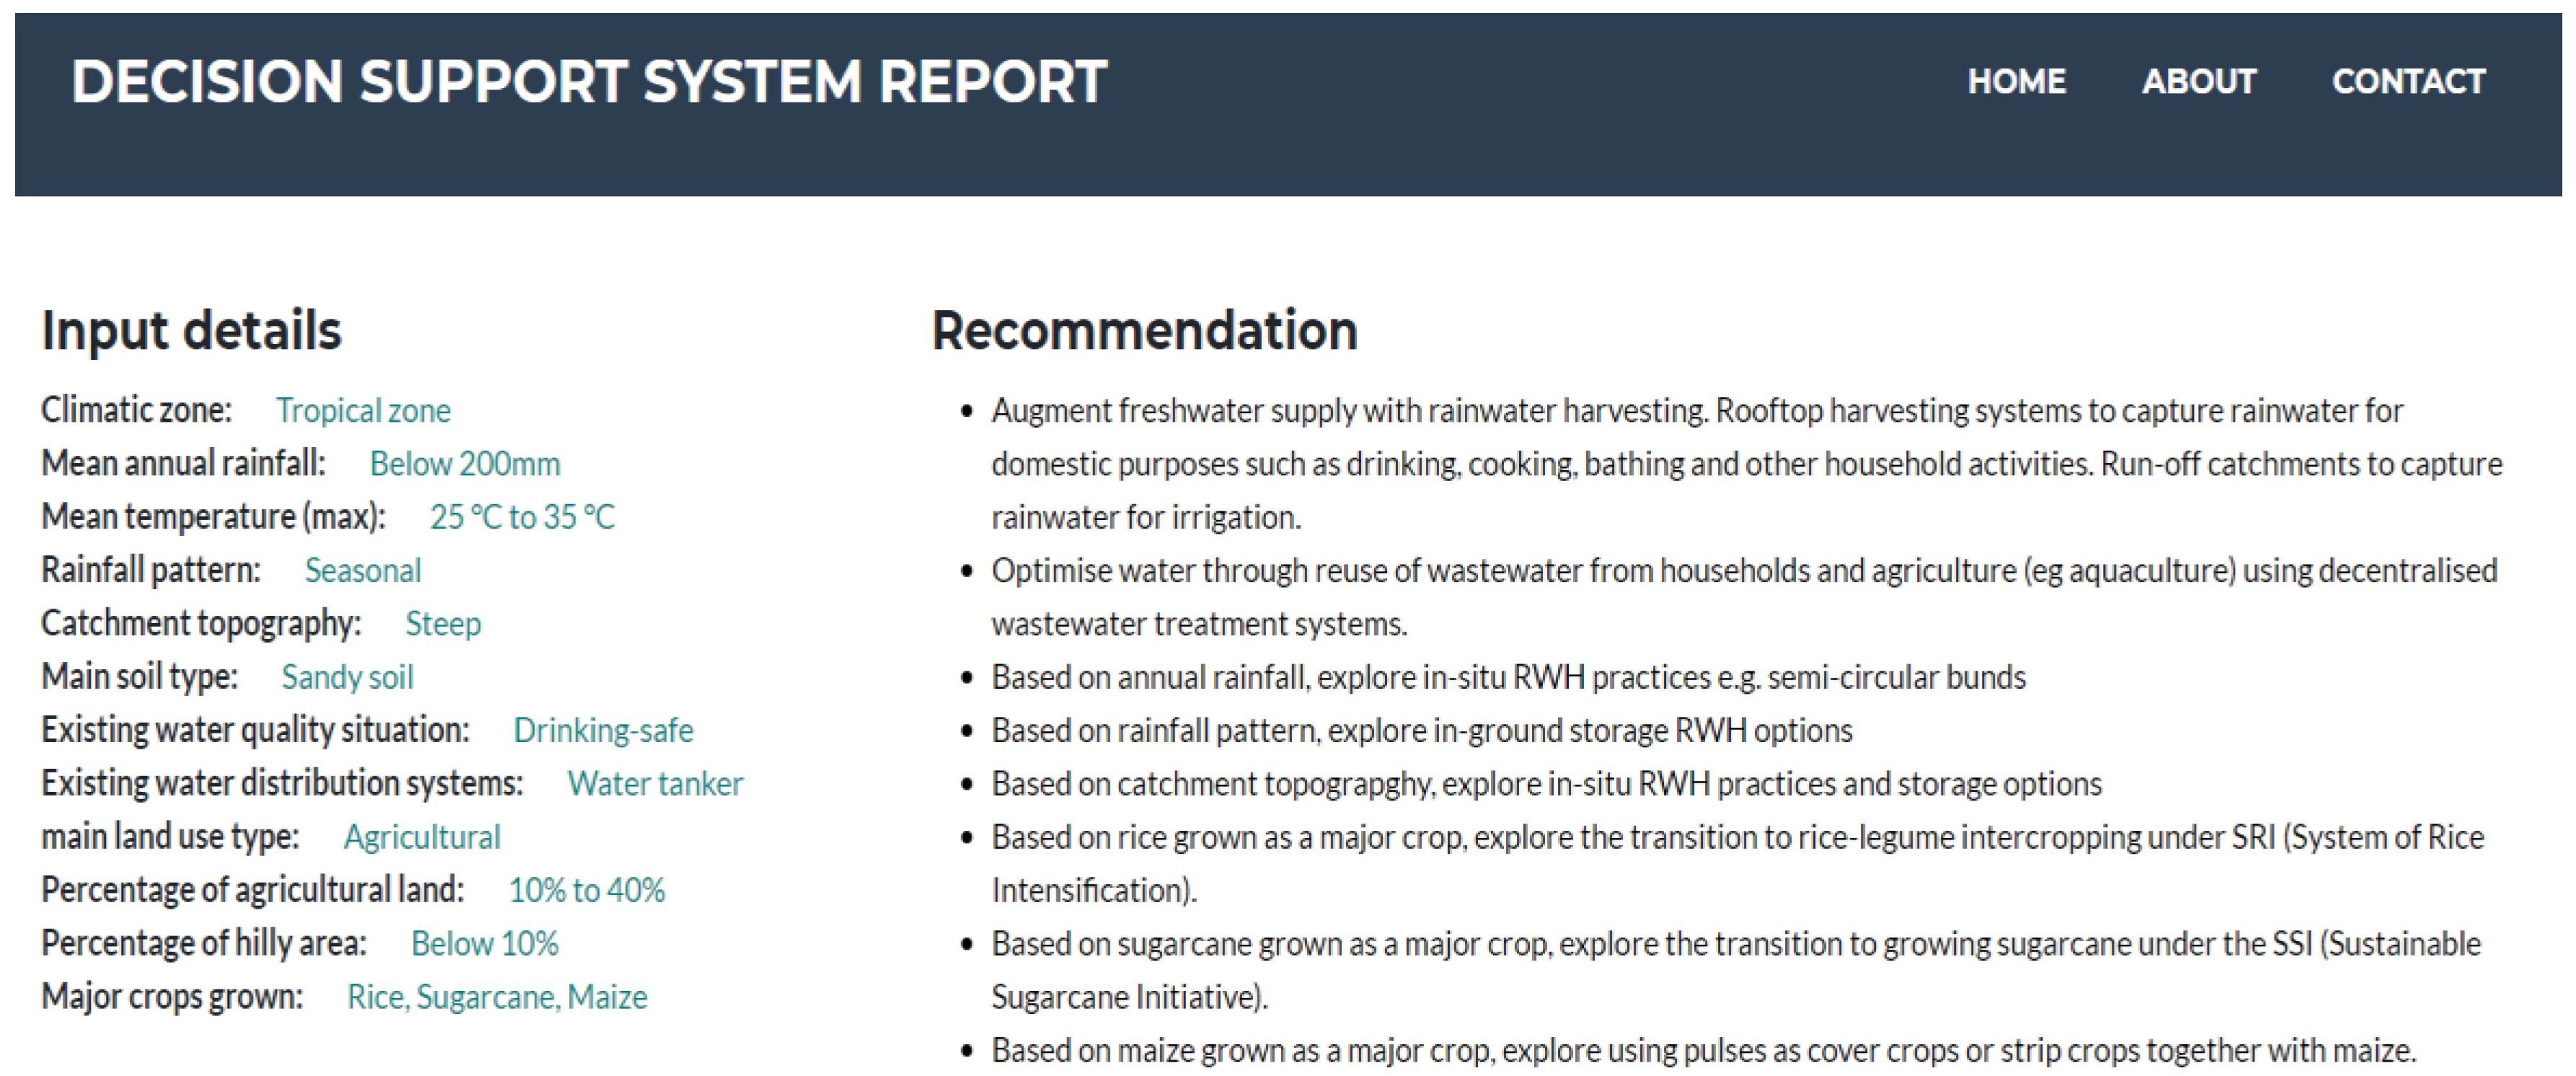
Figure 7) are the scores given by the user to the different criteria based on which decision support recommendations for the drinking water treatment and distribution system are provided. These two parts of the DSS illustrated above are integrated into a comprehensive DSS recommendation, which looks like that which is shown in
Figure 8,
Figure 9 and
Figure 10.
