Abstract
When there is vegetation on the beach or main channel bed, it will have a significant impact on the river channel. This study was based on physical model experiments to investigate the flow conditions of the Jinhu section of the Huaihe River estuary, revealing the influence of reed vegetation on water flow resistance. A new comprehensive roughness formula was proposed, and the predictive effectiveness of the formula was verified. The theoretical results indicate that under the condition of vegetation not being submerged, the comprehensive roughness is directly proportional to the square root of vegetation density in areas with vegetation coverage, the square root of water surface vegetation coverage, and the 2/3 power of the hydraulic radius. The bottom slope does not affect it. Under the condition of vegetation inundation, the comprehensive roughness is smaller than that under the condition of no inundation. The experimental prediction results of the influence of reeds on roughness indicate that the measured roughness values and theoretical roughness calculation values are in good agreement. Under the same operating conditions, the roughness gradually decreases with an increase in flow rate. Under the full-reed working condition, the calculated roughness value and the measured roughness value have the same trend of change, both decreasing with the increase in flow rate. The experimental prediction results of the influence of reeds on the relationship between water level and flow rate show that the roughness value of 0 increases with the increase in reed grass surface coverage rate Ki, and an increase in Ki can lead to an increase in comprehensive roughness.
1. Introduction
The Huai River waterway in China is an important water conservancy facility that guarantees the lives, property, and economic development of the people in the lower reaches of the Huai River. With the annual expansion of the reed growth area in Hongze Lake in the lower reaches of the Huai River, the flood discharge capacity of the river channel cannot meet the original design standards, the flood discharge speed is hindered, and the flood duration is extended. To fully utilize the flood discharge function of the river channel, it is necessary to comprehensively manage the flood discharge obstacles inside the river channel.
The water flow in vegetated rivers is a special and complex water flow problem. When water flows through plants, it consumes a large amount of momentum and energy, and the resistance generated by plants is the main resistance [1,2]. Moreover, there are numerous types of vegetation in the river channel, including planting methods, density, shape, degree of submergence, water-facing area of individual plants, and stiffness (flexibility) of vegetation. The degree of change in water flow structure varies depending on the type of vegetation. Due to the complexity of water flow problems in channels with vegetation [3,4,5], experts and scholars mainly focus on experimental research, investigation and analysis, and numerical simulation of water flow in channels with vegetation.
Huang et al. [6] took the Pearl River Delta network river as the prototype. A generalized model was carried out, and it was found that planting trees on the beach of the narrow beach compound channel has little impact on the upstream water level and does not affect the channel storage and detention function of the beach.
Chen et al. [7] analyzed in detail the slow flow and wave attenuation characteristics of artificial aquatic plants. It is suggested that to improve the slow flow effect, artificial water plants should be arranged as multi-row grass grasslands. Zhong et al. [8] conducted experimental research on the distribution of average flow velocity in rivers containing plants, and the results showed that most of the vertical distribution of average flow velocity did not follow a logarithmic relationship. Moreover, for the Myriophyllum bed, the frictional flow velocity and plant canopy roughness Reynolds number would increase with the increase in flow rate, while the roughness length would decrease with the increase in flow rate. When the flow rate is constant, they all increase along the flow direction. Hua et al. [9] conducted an experimental study on the influence of flexible vegetation on water flow in a rectangular water tank. The study found that the flow velocity before entering the vegetation area follows a logarithmic distribution. When passing through the vegetation area, the flow velocity undergoes significant changes, and in some areas, the flow velocity may exhibit retention or reflux phenomena. The shear effect of water flow near the boundary is significant. The resistance and slope of river vegetation to water flow are independent. Luo et al. [10] focused on double-layer vegetation flow, which is the foundation of multi-layer vegetation flow, and identified the distribution of velocity and Reynolds stress in double-layer vegetation flow. Based on this, they optimized the analytical solution of velocity and stress distribution in double-layer vegetation flow and proposed a research approach for the analytical solution of multi-layer vegetation flow.
Experts and scholars have conducted extensive theoretical and experimental research on the resistance coefficient of water flow. Ree [11] and Chow et al. [12] have been conducting research on the resistance coefficient in the presence of plants since the 1950s, and most of them use the Manning roughness coefficient to characterize water flow resistance. Erduran et al. [13] used cantilever theory to calculate the deflection height of vegetation, making the above method more convenient to use. The maximum values of turbulence intensity and Reynolds stress are approximately at the maximum deflection height of the vegetation. The velocity distribution formula above the submerged vegetation is determined using experimental data, and the stress calculation formula is defined based on the vegetation deflection height. Lee et al. [14] derived the expression for total bed resistance using two-dimensional steady-state laminar and free surface hydrodynamic equations, including bed resistance and vegetation resistance. The relationship between the dimensionless resistance coefficient and the Reynolds number is analyzed using water tank experiments and field observation data. Baruah et al. [15] proposed a new entropy-based vertical velocity distribution model by linking the two-dimensional shallow water model (SWM) with Shanon’s entropy theory, based on the randomness in velocity profiles under different inundation levels and vegetation densities, expressed explicitly by channel entropy parameters. Pritam et al. [16] analyzed the three-dimensional flow characteristics such as velocity distribution, turbulence intensity, turbulent kinetic energy, and Reynolds shear stress in vegetation and undisturbed areas and compared them with the longitudinal and transverse lengths of vegetation areas. The presence of vegetation reduces the flow velocity profile, Reynolds shear stress, and turbulence intensity, which means that vegetation can be an effective tool for reducing flow resistance. Ahmadi et al. [17] used numerical methods to study the effects of inundation conditions, vegetation arrangement, and vegetation density on water flow velocity. The steady-state flow inside plant channels was reproduced using a CFD model. Using the Standard Volume of Fluid (VOF) method to track the evolution of free surfaces. It can effectively reproduce the water flow velocity in free areas and vegetation-covered areas. Naveed A et al. [18] found that the circular patch configuration of vertically stratified vegetation, especially the linear patch arrangement, can cause significant flow resistance, leading to a decrease in maximum velocity, while experiencing reduced turbulence in the shaded area behind the patch. The sheltered areas exposed behind vegetation patches indicate a positive flow response to the deposition of aquatic ecosystems and sediments. Aristotelis M et al. [19] studied the influence of vegetation element geometry on velocity distribution within and above the canopy and found that the velocity distribution above the canopy follows a logarithmic rule. Kai Y et al. [20] extended a nonstatic (phase-solved) depth integral wave model (XBeach nonhydro static) and an efficient and robust subgrid canopy flow model to consider the important characteristics of submerged canopy flow, which determine canopy resistance and wave dissipation. This model has good capture ability for the control flow dynamics of both rigid and flexible vegetation canopies. Yu B et al. [21] used the Lattice-Boltzmann method to simulate the hydrodynamics of flexible vegetation channels. It was found that vegetation types and average flow velocity have a significant impact on pollutant interception efficiency. WeiJie et al. [22] derived a quantitative relationship between the power-law exponent and the Darcy-Weissbach friction coefficient of the free surface layer for flexible vegetation flow. Revealed the flow velocity distribution characteristics under the influence of flexible vegetation and the resistance characteristics of the vegetation riverbed. White et al. [23] found that higher-density vegetation and greater flow can increase the heterogeneity of bed terrain. These findings indicate that vegetation and natural hydrological conditions, including floodplain water flow, can enhance the complexity of river habitats. Aydogdu et al. [24] used representative rigid vegetation to observe the impact of vegetation patches naturally located in rivers and riverbeds on water flow characteristics under laboratory conditions. Li et al. [25] found that the increase in vegetation diameter, height, and density significantly altered the lateral distribution of longitudinal flow velocity. The difference in water surface slope between the beach and the main channel increases with the increase in vegetation diameter, height, and density. Jie et al. [26] calculated, analyzed, and discussed water surface slope, flow velocity, head loss, vegetation drag force, and hydraulic slope. The horizontal, vertical, and total vegetation density within the vegetation area were defined, and the relationship between these physical parameters and water surface slope was studied. The head loss and hydraulic slope of vegetation areas were also calculated, compared, and analyzed. The water surface slope and flow velocity, head loss, and hydraulic slope in vegetation areas are closely related to the arrangement, density, and plant diameter of vegetation. Asif M et al. [27] simulated the flow characteristics in asymmetric vegetation composite channels. They found that the presence of vegetation patches along the floodplain caused water flow resistance, causing areas with higher flow velocity to move towards the main channel and the outer wall of the floodplain. Chen et al. [28] conducted hydrodynamic experiments on submerged rigid vegetation with different densities under the combined action of waves, currents, and wave currents. Azarisamani et al. [29] used a physical model of meandering rivers with sloping banks to evaluate the impact of rigid vegetation on the velocity distribution and bed erosion at the toe and bank slopes of meandering rivers. Vegetation density and planting methods have a significant impact on the velocity distribution and bed topography at each section. It is recommended to use vegetation to stabilize the riverbed and riverbank, which is a green and economically effective alternative to hard engineering methods. Wang et al. [30] investigated the effects of the density, stem diameter, and rigidity of reeds on flow regime, water velocity, and water level. The experimental results indicate that the reed belt along the riverbank has, to some extent, affected the flood discharge of the river, leading to an increase in the upstream water level. Meng et al. [31] used multiple sets of synchronous water tank test methods to describe the flow patterns influenced by the emergence of rigid vegetation and submerged flexible vegetation. The velocity of a certain point under different experimental conditions is measured using an acoustic Doppler velocimeter (ADV). James et al. [32], Lama et al. [33] and Hui et al. [34] conducted a large number of physical model experiments to evaluate the impact of river vegetation, such as reeds, on water flow resistance and hydraulic characteristics.
The growth and distribution of natural river plants have been random, but in previous studies, the arrangement of plants has been regular. Therefore, it can be seen that this requires a reasonable generalization of plants and the selection of appropriate physical models. However, there are few achievements through case studies and further research is needed. This article conducts physical model experiments and analysis on the flow conditions of the Jinhu section of the Huai River estuary in China, with a focus on revealing the influence of reeds on water flow resistance.
Experimental physical models offer an intuitive understanding of fluid dynamics in vegetated areas, revealing interactions between fluids and vegetation. This enables quicker comprehension of complex phenomena and clearer visualization of physical landscapes. Moreover, these models offer high controllability in a laboratory setting, allowing precise manipulation of variables such as vegetation type, density, arrangement, and fluid characteristics. This controllability facilitates systematic investigations into the impact of various factors on vegetation flow resistance, revealing underlying relationships. Lastly, they provide quantitative data support, measuring parameters like flow velocity, pressure, and temperature. These measurements quantitatively assess vegetation flow resistance patterns, validating and enhancing theoretical models while offering reliable data for practical applications.
Based on the principle of force balance, the expression formulas for the overall water flow resistance of flexible vegetation in non-submerged and submerged states under non-uniform flow conditions are derived. At the same time, a physical model of an open channel containing flexible plants was established, and the flow velocity and water level under different flow conditions (i.e., different flow rates) were measured to explore the resistance characteristics of vegetation to water flow, such as the Manning roughness coefficient and the equivalent Manning roughness variation law. Through in-depth analysis of various data, the resistance characteristics of flexible vegetation channels with and without inundation on open channel water flow were studied.
2. Physical Model Setup
The Jinhu section of the Huai River estuary has a total length of 57.8 km and a river width ranging from 0.06 km to 3.0 km. Taking into account various factors, a distorted model with different scales in the horizontal (vertical, horizontal) and vertical directions is adopted. In addition, due to the low sediment content of the water flow in this project and the small changes in the riverbed, a fixed bed water flow model is adopted.
Therefore, considering all factors, a fixed-bed distorted river model is adopted for the model. In order to simulate the process of flood flow, the model must satisfy the conditions of gravity similarity and resistance similarity.
Here, is the horizontal scale of the model, is the vertical scale of the model, and e is the distortion rate; are the flow velocity, flow rate, and roughness ratio of the model. Table 1 provides a summary of model similarity conditions and main scales.

Table 1.
Summary of model similarity conditions and main scales.
2.1. Selection of Scale
This model adopts a horizontal scale = 1500, a vertical scale = 50, and a deformation rate of e = 30 based on the experimental site area, model water depth, etc. Then the flow ratio scale: = = λlλh3/2 = 1500 × 503/2 = 530,330.
The roughness ratio of the abnormal model varies with the hydraulic radius ratio of each river section. For wide and shallow river sections, λR can be set to nb, and the roughness ratio is: = = = 0.35043. It should be noted that in model design, whether it is the calculated roughness or the roughness determined by preliminary experiments, the roughness of the model cannot be completely similar to the prototype because it does not take into account the influence of sand bars, shoals, bends, and other forms in the model. Therefore, a roughness correction is necessary. Using the prototype water surface profile data for experimental verification, adjust the model roughness until the water surface matches. This is the fundamental method for determining model roughness.
2.2. Abnormal Rate Analysis
Generally speaking, the larger the aspect ratio of the prototype river, the greater the allowable deformation rate of the model. The width-to-depth ratio of the research section in this experiment is about 600 > 6~10, and a distorted model can be used for the experiment. According to the “Hydraulic Model Test” guidelines of the Nanjing Institute of Water Resources [35], the model distortion rate is roughly e = (B/h)p ÷ (6~0) = 100~60. This model has a distortion rate of 30.
2.3. Model Reynolds Number
Here, the Reynolds number of the model is calculated based on the experimental study of a small flow rate of 6000 m3/s, so that the flow type can also be similar when the flow rate is high. So the model traffic Qm = Qp/λQ = 6000/530,330 = 0.011314 m3/s. When calculating the prototype width of the cross-section of 3000 m and the flow rate of 6000 m3/s, the water depth is about 2.5 m, and the corresponding model has a cross-sectional area of Am = 2 × 0.05 = 0.1 m2.
The flow velocity at the cross-section of the model is vm = Qm/Am = 0.011314/0.1 = 0.11314 m/s. The hydraulic radius of the model flow section is Rm = Am/Xm = 0.1/(2 + 0.05 × 2) = 0.04762.
The viscosity coefficient υ of the model water flow can be obtained from the data. When the water temperature is 20 °C, υ = 0.0101 × 10⁻⁴ m2/s. The Reynolds number of the model water flow is:
According to the “Hydraulic (Conventional) Model Test Regulations” [36], the water flow reaches turbulence, that is, the degree of water flow turbulence has met the requirements.
The guideline for “Hydraulic (Conventional) Model Test Regulations” [36] specifies that the boundary Reynolds numbers for laminar and turbulent flow are approximately 2500–5000. The model water flow reaches turbulence; that is, the degree of turbulence in the water flow meets the requirements.
2.4. Model Manufacturing and Installation
Model layout considers factors like size, scale, stable water inflow system, outflow level control, total inflow/outflow control, and flow measurement. Three methods stabilize the water inlet: a pressure box, six branch pipes for offset energy dissipation, and a stable flow orifice plate. Added are a 3 × 1.5 × 1.0 m inlet tank, Sanhe gate diversion wall simulation, and extended water pipe wiring. The outlet tank has a three-way stacked water level box. A wide, shallow polyethylene board groove below the model solves leakage from temperature expansion joints. Green grass and trees are decorated as model reeds. Rectangular plastic mesh fixes the model reed roots. A circulating water supply system provides constant water flow. Flow measurement uses electromagnetic and ultrasonic flow meters for verification. Here, the measured flow rate value is selected as the ten average values of two instruments.
Prototype reeds, flexible plants that bend under hydrodynamic forces, were studied to simulate natural reeds’ impact on river hydraulics. Drawing from past research, green grass trees were chosen as model reeds, considering their resistance and deformation similarity to natural reeds. The average prototype reed is 1 m, while the model reed stands at 2 cm tall with a 2 mm stem diameter. The roots of the model reeds were secured using rectangular plastic mesh during the experiment.
3. Experimental Establishment
3.1. Distribution of Water Level Control Points and Experimental Conditions
The water level control points are distributed on both sides of the river, and the water level during the flood season is greatly affected by reed grass. This experiment selects the water level of Miaogou at the entrance of Gaoyou Lake in the Huai River inflow channel, corresponding to the four characteristic flow rates used in the experiment. Table 2 shows a summary of the relationship between the characteristic flow rate and the water level of the experimental temple ditch.

Table 2.
Summary of the relationship between characteristic flow rate and water level in the experimental temple ditch.
This experiment adopts the method of controlling the flow rate and downstream water level to measure the water level flow relationship under three working conditions: no reed grass on the beach, the current status of reed grass on the beach, and full reed grass on the beach in the Huaihe River inflow channel. The water level flow relationship is obtained through four characteristic flow rates (flow rate under the three river gates) of 6000 m3/s, 8000 m3/s, 10,000 m3/s, and 12,000 m3/s. Analyze the impact of different reed densities on water flow resistance based on changes in water levels along the way. In the experiment, according to the different growth states of reed vegetation during the flood season, it is divided into: (1) no reed conditions on the beach; (2) current working conditions of reed and grass on the beach; (3) there are no reeds in the upstream and the current working conditions in the downstream; (4) there are no reeds downstream and the current operating conditions upstream; and (5) full reed working conditions on the beach.
3.2. Experiment Scheme
In terms of the testing sequence of the working conditions, we adopt the first working condition of no reed grass on the beach, then the current working condition of reed grass on the beach, and finally the working condition of full reed grass on the beach. The water level at the entrance of Gaoyou Lake (Miaogou), corresponding to the four characteristic flows, is determined based on design data and historical measured water level and flow data.
The simulation of roughness in the experiment is the key to the entire experiment. Under the condition of no reed grass on the beach, roughen the model to form a river beach without reed grass. Measure the water level at each measuring point under four characteristic flow rates to obtain the water level flow relationship under this condition. The current working condition of reed grass on the beach is to select the water level at a flow rate of 6400 m3/s as the main parameter for controlling roughness. Plant simulated reed grass at the corresponding positions on the model, and adjust the reed grass density and the roughness of the river and beach multiple times to ensure that the water level at each measuring point reaches the model value corresponding to the actual prototype measurement value. On this basis, measure the water level at each measuring point under four characteristic flow rates and obtain the water level flow rate relationship under this operating condition. The working condition of all reed grass on the beach is based on the current working condition of reed grass on the beach. Simulated reed grass is planted in all areas where no reed grass is planted on the beach, and the water level at each measuring point under four characteristic flow rates is measured to obtain the water level-flow relationship under this working condition.
4. Theoretical Analysis of Resistance Characteristics of Reed Rivers
Previous studies have generalized traffic into small traffic, medium traffic, and large traffic [37,38,39,40]. Small flow refers to the depth of water being less than the height of vegetation, which is in a non-submerged state. Medium flow, which means that the water depth and vegetation height are similar, and the water flows over the vegetation canopy. Large flow, where the depth of water exceeds the height of vegetation. Due to the complexity of factors affecting resistance in the case of medium flow, especially the impact of vegetation lodging on water flow resistance, quantitative research is not yet possible. This study only takes small and large flow cases as examples to theoretically explore the quantitative impact of vegetation on water flow resistance.
4.1. Analysis of Water Flow Resistance in the State of Vegetation Not Submerged
Taking the water body of the plant section as the isolation body, establish the coordinates as shown in Figure 1, and for the plant section with a length of L as shown in the figure, calculate the balance equation of the force along the water flow direction. Assuming that under constant uniform flow conditions, the balance equation of the force is:
where is the component of gravity acting on the water body in the X direction, ; is the vegetation resistance on the water flow; is the shear force; . where is the density of water; g is the gravitational acceleration; A is the cross-sectional area of the water flow; L is the length of the isolation body taken; i is the bottom slope of the channel; is the shear stress at the channel boundary; is the wet circumference.
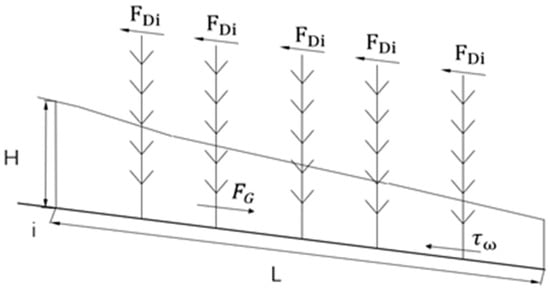
Figure 1.
Force analysis of the isolation body in the state of vegetation not submerged.
The average boundary shear stress is obtained from the basic equation of uniform flow:
where is the hydraulic radius, and is the bottom slope.
Applying Manning’s equation .
Substituting into Equation (5) yields
where is the roughness on the channel boundary.
Substituting into Equation (4), then
is the force acting on each plant.
Resistance of individual vegetation to water flow: .
The vegetation resistance covering the entire isolation body is:
Substitute Equations (6) and (8) into Equation (7), assuming that the average flow velocity in front of each vegetation is , obtain:
Using Manning’s equation to represent, then
where n represents the total roughness coefficient (including the influence of vegetation and boundaries). The two equations are combined to solve n and find the relationship between n and , obtain:
Due to the uneven distribution of vegetation in natural river channels, it is often localized in clusters, as shown in Figure 2.
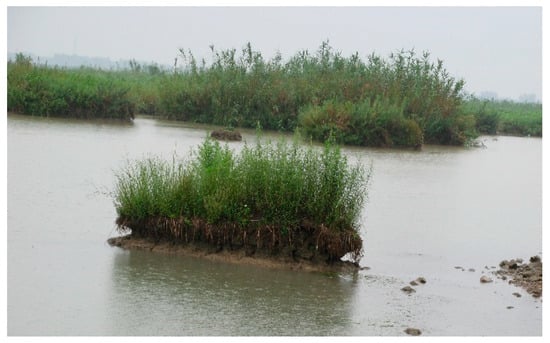
Figure 2.
The distribution of reeds in clusters in natural river channels.
Therefore, the unit vegetation density is: , This equation represents the vegetation area per unit length of the area covered by vegetation, which is a quantitative representation of vegetation density. Therefore, it is defined as vegetation density. The vegetation is not submerged, as shown in Figure 3.
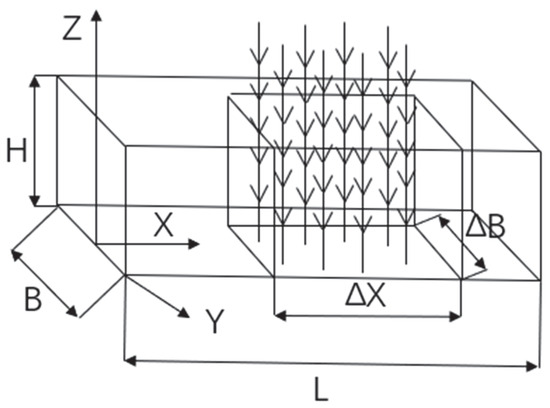
Figure 3.
Schematic diagram of the state of being submerged.
Where i is the frontal area of the i-th vegetation along the direction of water flow, that is, the water blocking area; B is the width of the river; H is the water depth.
Water surface vegetation coverage: .
Where is the overhead area of the isolation body covered by reeds in the water body; vi is the average flow velocity near the i-th vegetation.
And the vegetation coverage on the water surface:
Therefore, .
So Equation (10) can be changed to
Equation (11) represents that the total roughness n is composed of vegetation density in areas with vegetation coverage , water surface vegetation coverage K, hydraulic radius R, and wall roughness .
For the above equations, we will discuss them in the following situations:
If is to be achieved, then or can be achieved. When the vegetation coverage rate K and vegetation density on the water surface are both zero, the actual meaning is that there is no vegetation coverage.
If , and ,
From the above equation, it can be concluded that the total roughness n is directly proportional to the square root of vegetation density in areas with vegetation coverage , the square root of water surface vegetation coverage , and the 2/3 power of hydraulic radius . The bottom slope does not affect it.
4.2. Analysis of Water Flow Resistance in Vegetation Inundation State
Taking the water body of the plant dam section as the isolation body, establish the coordinates as shown in Figure 4. As the vegetation is submerged, the water depth is much higher than that of the vegetation. We will divide the selected water body into two parts and analyze them separately. is the area above vegetation, and II is the area with vegetation height, as shown in Figure 5 and Figure 6.
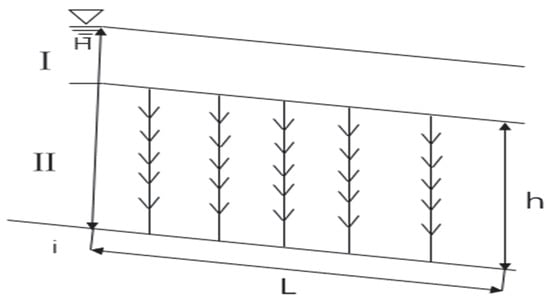
Figure 4.
Force analysis of isolation body in vegetation submerged state.
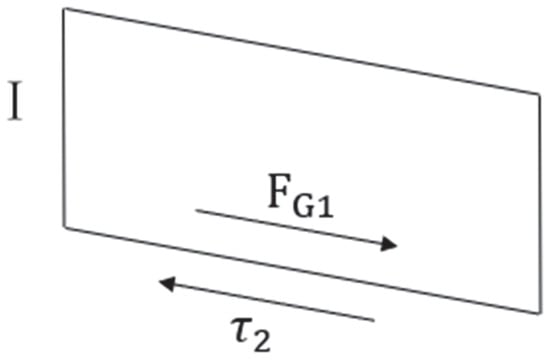
Figure 5.
Areas above vegetation.
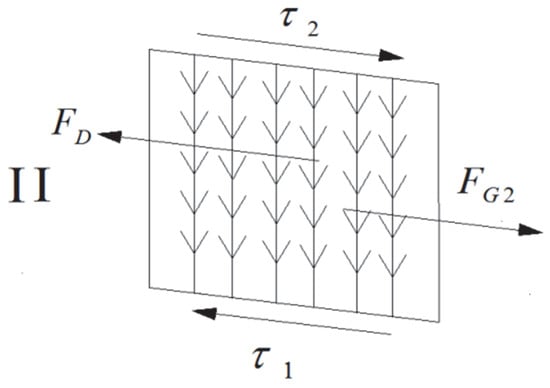
Figure 6.
Vegetation height area.
Assuming that the plant dam section with a length of L, as shown in the figure, is under constant and uniform flow conditions, according to the principle of force balance, a dynamic equation is formulated along the direction of water flow. Perform force analysis on the two parts of the water body separately, as shown in Figure 5 and Figure 6.
Above the vegetation layer, gravity is balanced with the shear stress present at the junction of the vegetation layer and water flow. Namely
where B is the channel width, is the water depth above the vegetation height, and is the slope.
Take the vegetation height area as the isolation body, and the water flows through the vegetation. The vegetation receives resistance from the water flow, gravity from the water in this area, shear stress from the top layer of the vegetation layer, and shear stress from the bottom of the riverbed. Among
The resistance of vegetation to water flow .
Where is the resistance coefficient of vegetation. Equation (15) can be changed into:
Using Manning’s equation to represent , then
In the equation, n represents the total roughness coefficient (including the influence of vegetation and boundaries). The two equations are combined to solve n and find the relationship between n and . The obtained equation is as follows:
From Equation (15), it can be concluded that the total roughness n is directly proportional to the square root of vegetation density in the vegetated area, the square root of water surface vegetation coverage, and the 2/3 power of hydraulic radius. The bottom slope does not affect it. There is no difference in coefficient between flooded and non-flooded vegetation.
5. Experimental Results and Formula Validation
5.1. Prediction Study on the Effect of Reed on Roughness
Determine the water surface profile and reed area under four flow conditions based on the elevation displayed on the relevant data plan, including no reed conditions, reed status, and full reed conditions. Among them, is the top view area of the water covered by reeds, is the coverage area of the river water, and . Due to the different expression forms of roughness formulas derived from the vegetation not submerged state and the submerged state, both the current and full reed conditions are analyzed in two situations: the vegetation not submerged state and the submerged state. In each experiment, it was observed that when the flow rate was 6000 m3/s, 8000 m3/s, and 10,000 m3/s, the reed grass was unsubmerged, and when the flow rate was 12,000 m3/s, the reed grass was in a submerged state.
- (1)
- Vegetation not submerged state
The theoretical formula derived indicates that the roughness formula is .
The above equation indicates that the total roughness n is derived from the vegetation density , water surface vegetation coverage K, hydraulic radius R, and wall roughness in areas with vegetation coverage.
In practice, the vegetation on the water surface cannot be completely clear, therefore and .
From the above equation, it can be concluded that the total roughness n is directly proportional to the square root of vegetation density in areas with vegetation coverage, the square root of water surface vegetation coverage, and the 2/3 power of hydraulic radius. The bottom slope i h does not affected.
- (2)
- Vegetation inundation status
The roughness equation for vegetation inundation is as follows:
Compared with the formula for vegetation inundation, there is an additional coefficient , where h is the height of the reed and H is the water depth. In the case of vegetation inundation, this coefficient must be less than 1. This is also consistent with the conclusion that roughness decreases with increasing flow rate.
5.1.1. Current Working Conditions of Reed Grass
- (1)
- Unsubmerged state of reed grass
From Table 3, it can be concluded that under the current operating conditions of reed grass, which is not submerged, the calculated roughness decreases with the increase in flow rate. This pattern is consistent with the previous conclusion derived from experimental data, as shown in Figure 7.

Table 3.
Actual roughness measurement values and calculated roughness values in the nonsubmerged state under current working conditions.
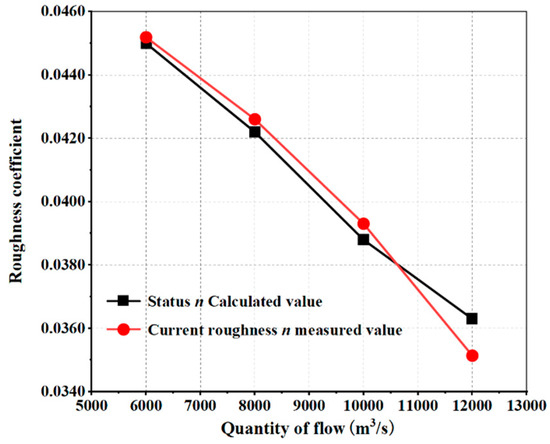
Figure 7.
Relationship between calculated and measured roughness values under current operating conditions.
- (2)
- Submerged state of reed grass
Calculate the roughness at a flow rate of 12,000 m3/s according to equation . Figure 7 shows the comparison values between the submerged and non submerged states of reed grass. Table 4 shows the easurement and calculation of roughness in submerged state under current operating conditions.

Table 4.
Measurement and calculation of roughness in submerged state under current operating conditions.
From Figure 7, the measured roughness values and calculated roughness values match well. Under the same operating conditions, the roughness decreases with an increase in flow rate. We can also see that as the flow rate increases, the difference between the measured and calculated roughness values gradually increases.
5.1.2. Full Reed Working Condition
- (1)
- Unsubmerged state of reed grass
From Table 5, it can be concluded that under the full reed condition and in the non-submerged state, the calculated roughness decreases with the increase in flow rate. This pattern is consistent with the conclusion previously derived from experimental data. The data is shown in Figure 8. From Figure 8, it can be seen that the measured roughness values and calculated roughness values match well. Under the same operating conditions, the roughness decreases with an increase in flow rate.

Table 5.
Measurement and calculation of roughness in the unsubmerged state of the full reed condition.
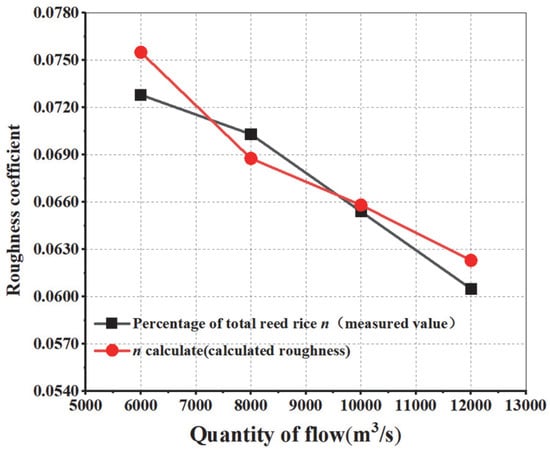
Figure 8.
Relationship between calculated and measured roughness values under full reed conditions.
- (2)
- Submerged state of reed grass
Calculate the roughness at a flow rate of 12,000 m3/s according to equation . The comparison values between the submerged and nonsubmerged states of reed grass are shown in Figure 8. Table 6 shows the measurement and calculation of roughness in submerged state under full reed conditions.

Table 6.
Measurement and calculation of roughness in submerged state under full reed conditions.
From the above figure, we can see that the calculated roughness values under current operating conditions have the same trend as the measured roughness values, both increasing and decreasing with the flow rate. And the larger the traffic, the greater the difference between the two. The good agreement between the two in this figure indicates that the formula has certain feasibility.
5.2. Prediction Study on the Influence of Reed on Water Level and Flow Relationship
5.2.1. The Relationship between Calculating Flow Rate and Calculating Water Depth
- (1)
- Current operating conditions (calculation results shown in Figure 9)
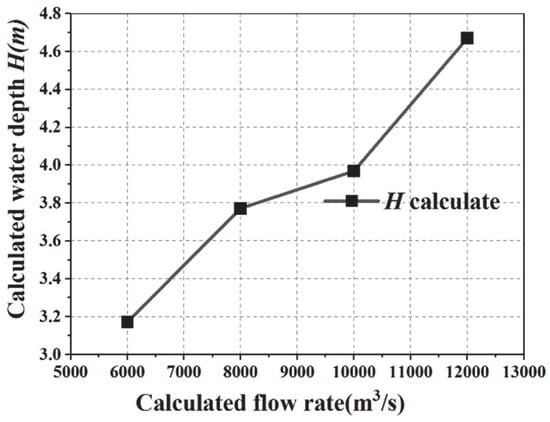 Figure 9. Relationship between calculated water depth and flow rate of reed grass under current operating conditions.
The conclusion drawn from Figure 9 is that the calculated water depth and flow rate under the current working condition of reed grass are directly proportional. Table 7. shows the calculation values of water depth and flow rate under current working conditions for reed grass.

Table 7.
Calculation values of water depth and flow rate under current working conditions for reed grass.
- (2)
- Full reed working condition (calculation results shown in Figure 10)
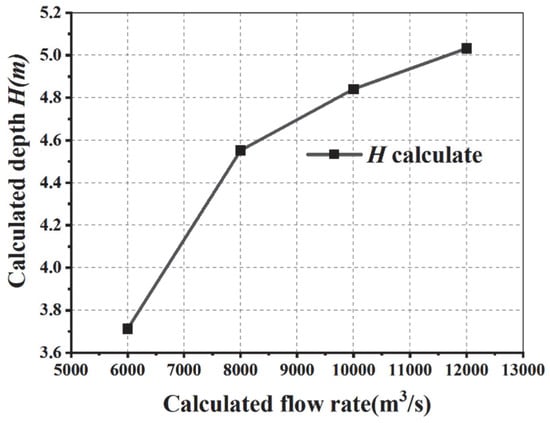 Figure 10. Relationship between calculated water depth and flow rate under reed working conditions.
Table 8 shows the water depth and flow calculation values under full reed conditions. According to Figure 10, the calculated water depth and flow rate under the full reed condition are directly proportional: they increase with the increase in flow rate calculation.

Table 8.
Water depth and flow calculation values under full reed conditions.
5.2.2. The Relationship between Roughness and Water Surface Coverage Ki
- (1)
- Current working conditions
From Table 9, we can conclude that under the current working conditions of reed grass, as the water surface coverage rate Ki of reed grass increases, the calculated roughness also increases. And an increase in Ki can lead to an increase in comprehensive roughness. The intuitive representation of the calculation results is shown in Figure 11. In the figure, the water surface coverage Ki of reed grass is directly proportional to the calculated roughness.

Table 9.
Calculation values of water surface coverage and roughness of reed grass under current working conditions.
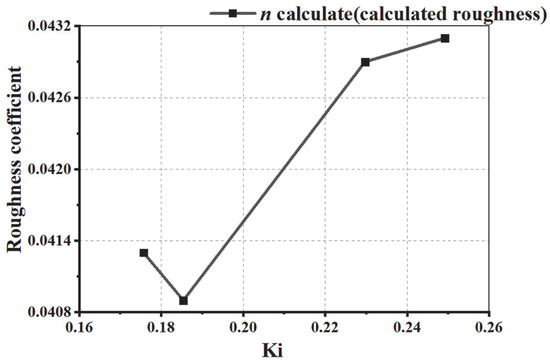
Figure 11.
Relationship between calculated values of water surface coverage and roughness of reed grass under current working conditions.
- (2)
- Full reed working condition
From Table 10, we can infer that under full reed conditions, as the water surface coverage Ki of reed grass increases, the calculated roughness also increases. And an increase in Ki can lead to an increase in comprehensive roughness. The visual representation of the calculation results is shown in Figure 12. In the figure, the water surface coverage Ki of reed grass is directly proportional to the calculated roughness. Consistent with the inference.

Table 10.
Calculated values of water surface coverage and roughness of reed grass under full reed conditions.
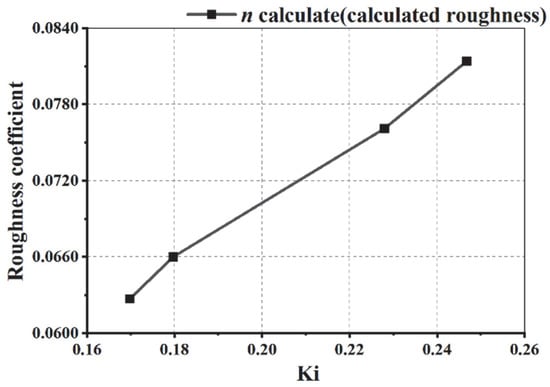
Figure 12.
Relationship between calculated values of water surface coverage and roughness of reed grass under full reed conditions.
6. Discussion
This paper has obtained many valuable data and conclusions through systematic experimental research and analysis of reed grass rivers, which has given us a further understanding of the water flow characteristics of reed grass rivers. However, further theoretical analysis and the use of more mathematical tools, as well as more physical model experiments and numerical simulations, are still needed. The specific details are as follows:
- (1)
- This experiment only conducted physical model experiments on open channels covered with reed grass without conducting numerical simulations. Due to the consideration of many external factors in the numerical simulation of open channels covered with reed grass, such as the growth rate and height of reed grass, as well as the deformation of river channels caused by river erosion and sedimentation. Resulting in certain difficulties in numerical simulation. In the future, further exploration can be conducted using numerical simulation of vegetation-covered river channels. The numerical simulation of water flow in rivers with vegetation is still in the exploratory stage and not mature enough. Further research is needed to generalize the simulation of rivers with vegetation cover.
- (2)
- The physical model experiment only uses four different working conditions under different reed densities, and can be studied in multiple ways in the future.
- (3)
- It is necessary to further study the impact of reed grass on river flow by combining edge disciplinary issues such as water quality treatment and animal ecology related to plant containing river hydrodynamics.
- (4)
- Due to the fact that reed grass is a flexible plant, its stiffness is difficult to simulate, and further exploration and exploration of details are needed in future experiments.
7. Conclusions
This study established a physical model of an open channel with flexible vegetation and studied the resistance characteristics of water flow in channels with submerged and non-submerged flexible vegetation. Explore the resistance characteristics of vegetation to water flow, such as the Manning roughness coefficient and the variation law of equivalent Manning roughness. Based on previous research results and the characteristics of roughness formulas, a new comprehensive roughness formula has been derived and verified through experiments.
- (1)
- The formula of comprehensive roughness theory indicates that under the condition of vegetation not being submerged, the comprehensive roughness is directly proportional to the square root of vegetation density in areas with vegetation coverage, the square root of water surface vegetation coverage, and the 2/3 power of the hydraulic radius. The bottom slope i does not affect it. Under the condition of vegetation inundation, the comprehensive roughness is smaller than that under the condition of non-inundation.
- (2)
- The measured and calculated roughness values match well, and under the same operating conditions, the roughness decreases with an increase in flow rate. In addition, as the flow rate increases, the difference between the measured roughness value and the calculated roughness value gradually increases. The trend of the calculated roughness value and the measured roughness value under the current and full reed conditions is the same, both increasing and decreasing with the flow rate, and the larger the flow rate, the greater the difference between the two.
- (3)
- As the water surface coverage Ki of reed grass increases, the calculated roughness also increases. Moreover, an increase in Ki can lead to an increase in overall roughness.
Author Contributions
Investigation, conceptualization, writing—original draft, J.Z.; funding acquisition, writing—review and editing, L.C.; data curation, writing—review and editing, B.Z.; methodology, M.Y. and S.J.; resources, D.M.; supervision, C.H. All authors have read and agreed to the published version of the manuscript.
Funding
This research was funded by the National Natural Science Foundation of China (grant no. 51779214), A Project Funded by the Priority Academic Program Development of Jiangsu Higher Education Institutions (PAPD).
Data Availability Statement
All data is available in this paper.
Acknowledgments
The authors thank the College of Hydraulic Science and Engineering, Yangzhou University. A huge thanks is due to the editor and reviewers for their valuable comments to improve the quality of this paper.
Conflicts of Interest
Author Deyin Miao was employed by the company: Yangzhou Architecture and Design Research Institute Co., Ltd, Yangzhou 214000, China. The remaining authors declare that the research was conducted in the absence of any commercial or financial relationships that could be construed as a potential conflict of interest.
References
- Vargas-Luna, A.; Duró, G.; Crosato, A.; Uijttewaal, W. Morphological adaptation of river channels to vegetation establishment: A laboratory study. J. Geophys. Res. Earth Surf. 2019, 124, 1981–1995. [Google Scholar] [CrossRef]
- Ielpi, A.; Lapôtre, M.G.A.; Gibling, M.R.; Boyce, C.K. The impact of vegetation on meandering rivers. Nat. Rev. Earth Environ. 2022, 3, 165–178. [Google Scholar] [CrossRef]
- Stoesser, T.; Wilson, C.A.M.E.; Bates, P.D.; Dittrich, A. Application of a 3D numerical model to a river with vegetated floodplains. J. Hydroinformatics 2003, 5, 99–112. [Google Scholar] [CrossRef]
- Yang, K.; Cao, S.; Knight, D.W. Flow patterns in compound channels with vegetated floodplains. J. Hydraul. Eng. 2007, 133, 148–159. [Google Scholar] [CrossRef]
- Iwasaki, T.; Shimizu, Y.; Kimura, I. Numerical simulation of bar and bank erosion in a vegetated floodplain: A case study in the Otofuke River. Adv. Water Resour. 2016, 93, 118–134. [Google Scholar] [CrossRef]
- Huang, B.S.; Lai, G.W.; Qiu, J.; Lin, S.Z. Hydraulics of compound channel with vegetated floodplains. J. Hydrodyn. Ser. B 2002, 14, 23–28. [Google Scholar]
- Chen, D.; Zhou, J. A study of the effect of artificial seaweeds on current slowing and wave absorbing. J. Hohai Univ. 1998, 26, 99–103. [Google Scholar]
- Zhong, S.; Qian, Y.; Zhao, C.; Leung, R.; Wang, H.; Yang, B.; Fan, J.; Yan, H.; Yang, X.-Q.; Liu, D. Urbanization-induced urban heat island and aerosol effects on climate extremes in the Yangtze River Delta region of China. Atmos. Chem. Phys. 2017, 17, 5439–5457. [Google Scholar] [CrossRef]
- Hua, Z.L.; Wu, D.; Kang, B.B.; Li, Q. Flow resistance and velocity structure in shallow lakes with flexible vegetation under surface shear action. J. Hydraul. Eng. 2013, 139, 612–620. [Google Scholar] [CrossRef]
- Luo, J.; Geng, C.; Hou, Y. Distribution and Analytical Solution of flow Velocity and Water Stress Based on Multi-layer Vegetation flow Experiment. China Rural. Water Hydropower 2022, 25–31+40. [Google Scholar]
- Ree, W.O. Retardation coefficients for row crops in diversion terraces. ASABE Eng. A Sustain. Future 1958, 1, 78–80. [Google Scholar]
- Sturm, T.W. Open Channel Hydraulics; McGraw-Hill: New York, NY, USA, 2001. [Google Scholar]
- Erduran, K.S.; Kutija, V. Quasi-three-dimensional numerical model for flow through flexible, rigid, submerged and non-submerged vegetation. J. Hydroinformatics 2003, 5, 189–202. [Google Scholar] [CrossRef]
- Lee, J.K.; Roig, L.C.; Jenter, H.L.; Visser, H.M. Drag coefficients for modeling flow through emergent vegetation in the Florida Everglades. Ecol. Eng. 2004, 22, 237–248. [Google Scholar] [CrossRef]
- Baruah, A.; Handique, A.; Sarma, A.K. A coupled approach to investigate the entropy parameter dynamics in open-channel flow with submerged flexible vegetation. Model. Earth Syst. Environ. 2021, 8, 3373–3384. [Google Scholar] [CrossRef]
- Pritam, K.; Anurag, S. Experimental investigation of 3D flow properties around emergent rigid vegetation. Ecohydrology 2022, 15, e2474. [Google Scholar]
- Dehrashid, F.A.; Heidari, M.; Rahimi, H.; Khoshkonesh, A.; Yuan, S.; Tang, X.; Lu, C. CFD modeling the flow dynamics in an open channel with double-layered vegetation. Model. Earth Syst. Environ. 2022, 9, 543–555. [Google Scholar] [CrossRef]
- Naveed, A.; Mustajab, A. Investigation of the flow structures through heterogeneous vegetation of varying patch configurations in an open channel. Environ. Fluid Mech. 2022, 22, 1333–1354. [Google Scholar]
- Aristotelis, M.; George, C. Velocity Distribution in Channels with Submerged Vegetation. Fluids 2022, 7, 290. [Google Scholar] [CrossRef]
- Yin, K.; Xu, S.; Gong, S.; Chen, J.; Wang, Y.; Li, M. Modeling wave attenuation by submerged flexible vegetation with XBeach phase-averaged model. Ocean. Eng. 2022, 257, 111646. [Google Scholar] [CrossRef]
- Bai, Y.; Zhao, Y.; Huang, L.; Shen, D.; Sun, G. Numerical simulation of velocity distribution and pollution retention in flexible submerged vegetated channel. J. Hydrol. 2023, 626, 130265. [Google Scholar] [CrossRef]
- Wang, W.J.; Zhao, Y.F.; Ren, S.; Liu, X.B.; Dong, F.; Li, J.J.; Fan, J.J.; Wu, W.Q. Analytical solutions of flow velocity profile based on the morphological response of flexible vegetation. J. Hydrol. 2023, 624, 129839. [Google Scholar] [CrossRef]
- White, D.C.; Morrison, R.R.; Nelson, P.A. Experimental Observations of Floodplain Vegetation, Bedforms, and Sediment Transport Interactions in a Meandering Channel. J. Geophys. Res. Earth Surf. 2023, 128, e2023JF007136. [Google Scholar] [CrossRef]
- Aydogdu, M. Analysis of the effect of rigid vegetation patches on the hydraulics of an open channel flow with Realizable k-ε and Reynolds stress turbulence models. Flow Meas. Instrum. 2023, 94, 102477. [Google Scholar] [CrossRef]
- Li, D.; Ren, J.; Ren, J.; Yan, C.; Jiang, B. The Influence of Riparian Vegetation on the Hydrodynamic Characteristics of Compound Channel. China Rural. Water Hydropower 2023. [Google Scholar] [CrossRef]
- Wu, Y.J.; Jing, H.F.; Li, C.G.; Song, Y.T. Flow characteristics in open channels with aquatic rigid vegetation. J. Hydrodyn. 2020, 32, 1100–1108. [Google Scholar] [CrossRef]
- Asif, M.; Ghani, U.; Pasha, A.G. Numerical Modelling of Flow Characteristics in an Asymmetric Trapezoidal Compound Channel with Vegetation Patches. KSCE J. Civ. Eng. 2020, 24, 3659–3673. [Google Scholar] [CrossRef]
- Chen, M.; Lou, S.; Liu, S.; Ma, G.; Liu, H.; Zhong, G.; Zhang, H. Velocity and turbulence affected by submerged rigid vegetation under waves, currents and combined wave–current flows. Coast. Eng. 2020, 159, 103727. [Google Scholar] [CrossRef]
- Azarisamani, A.; Keshavarzi, A.; Hamidifar, H.; Javan, M. Effect of Rigid Vegetation on Velocity Distribution and Bed Topography in a Meandering River with a Sloping Bank. Arab. J. Sci. Eng. 2020, 45, 8633–8653. [Google Scholar] [CrossRef]
- Wang, C.; Wang, P. Hydraulic resistance characteristics of riparian reed zone in river. J. Hydrol. Eng. 2007, 12, 267–272. [Google Scholar] [CrossRef]
- Meng, X.; Zhou, Y.; Sun, Z.; Ding, K.; Chong, L. Hydraulic characteristics of emerged rigid and submerged flexible vegetations in the riparian zone. Water 2021, 13, 1057. [Google Scholar] [CrossRef]
- James, C.S.; Birkhead, A.L.; Jordanova, A.A.; O’sullivan, J.J. Flow resistance of emergent vegetation. J. Hydraul. Res. 2004, 42, 390–398. [Google Scholar] [CrossRef]
- Lama GF, C.; Chirico, G.B. Effects of reed beds management on the hydrodynamic behaviour of vegetated open channels. In Proceedings of the 2020 IEEE International Workshop on Metrology for Agriculture and Forestry (MetroAgriFor), Trento, Italy, 4–6 November 2020; pp. 149–154. [Google Scholar]
- Hui, E.-Q.; Hu, X.-E.; Jiang, C.-B.; Ma, F.-K.; Zhu, Z.-D. A study of drag coefficient related with vegetation based on the flume experiment. J. Hydrodyn. Ser. B 2010, 22, 329–337. [Google Scholar] [CrossRef]
- Nanjing Water Conservancy Research Institute. Hydraulic Model Test, 2nd ed.; Water Resources and Electric Power Press: Nanjing, China, 1985. [Google Scholar]
- Ministry of Water Resources. Hydraulic (Conventional) Model Test Regulations; Standards Press of China: Beijing, China, 2012. [Google Scholar]
- Lu, H. Research on Hydraulic Characteristics in Flexible Vegetation Channel. Master’s Thesis, Hohai University, Nanjing, China, 2010. [Google Scholar]
- Stephan, U.; Gutknecht, D. Hydraulic resistance of submerged flexible vegetation. J. Hydrol. 2002, 269, 27–43. [Google Scholar] [CrossRef]
- Tang, X.; Rahimi, H.; Guan, Y.; Wang, Y. Hydraulic characteristics of open-channel flow with partially-placed double layer rigid vegetation. Environ. Fluid Mech. 2021, 21, 317–342. [Google Scholar] [CrossRef]
- Zhang, B.; Yang, A.; Cheng, L.; Jiao, W.; Chen, Y.; Zhao, H. Spatial-temporal evolution and pressure fluctuation characteristics of the combined submerged vortex in a closed pump sump. Phys. Fluids 2023, 35, 065140. [Google Scholar] [CrossRef]
Disclaimer/Publisher’s Note: The statements, opinions and data contained in all publications are solely those of the individual author(s) and contributor(s) and not of MDPI and/or the editor(s). MDPI and/or the editor(s) disclaim responsibility for any injury to people or property resulting from any ideas, methods, instructions or products referred to in the content. |
© 2024 by the authors. Licensee MDPI, Basel, Switzerland. This article is an open access article distributed under the terms and conditions of the Creative Commons Attribution (CC BY) license (https://creativecommons.org/licenses/by/4.0/).