Article

Study on the Annual Runoff Change and Its Relationship with Fractional Vegetation Cover and Climate Change in the Chinese Yellow River Basin

1
Yellow River Conservancy Commission Jinshan-Mongolian Border Area Soil and Water Conservation Supervision Bureau, Yulin 719000, China
2
College of Water Conservancy and Transportation, Zhengzhou University, Zhengzhou 450001, China
3
Guizhou Water & Power Survey-Design Institute Co., Ltd., Guiyang 550002, China
*
Author to whom correspondence should be addressed.
Water 2024, 16(11), 1537; https://doi.org/10.3390/w16111537
Submission received: 17 April 2024 / Revised: 16 May 2024 / Accepted: 18 May 2024 / Published: 27 May 2024
(This article belongs to the Section Water and Climate Change)

Abstract

:
In the context of global climate change and ecological restoration projects, significant changes have been observed in the fractional vegetation cover (FVC) in the Yellow River basin. The increased vegetation growth accelerates water consumption, exacerbating drought and water scarcity issues, thereby heightening regional water resource shortage risks. This study targets the Yellow River basin in China, employing a pixel-based model to convert NDVI into FVC datasets. We establish a pixel-wise mathematical model for annual runoff and environmental factors based on residual analysis and methods like multiple linear regression. Using climate model data from CMIP6 as independent variables, in conjunction with the statistical model, we elucidate the spatiotemporal characteristics of annual runoff in the Yellow River basin under future climate scenarios. Our results indicate that, under four different climate scenarios, the average annual runoff in the Yellow River basin is projected to increase. The increases are quantified as 0.008 mm/a, 0.065 mm/a, 0.25 mm/a, and 0.24 mm/a for SSP126, SSP245, SSP370, and SSP585 scenarios, respectively. From 2022 to 2040, the spatial distribution of the runoff change rates under the SSP245 and SSP370 scenarios show an increasing trend in upstream areas such as the Qinhe and Longmen regions, with rates ranging from 6.00 to 8.61 mm/a. During the period from 2041 to 2060, all four climate scenarios indicate minimal changes in the runoff depth in the northern part of the Yellow River basin. From 2061 to 2080, under the SSP126 and SSP245 scenarios, the spatial distribution of the runoff shows significant increases in the river source area and a decreasing trend in the middle reaches, with rates ranging from 4.52 to 11.39 mm/a. For the period from 2081 to 2100, the runoff change rates vary significantly under the four climate scenarios. These findings provide a detailed understanding of how future climate scenarios could impact water resource distribution in the Yellow River basin, offering critical insights for regional water management and policy making to mitigate potential water scarcity challenges.

1. Introduction

Runoff is a fundamental component of the hydrological cycle and a key element in the water balance [1]. Its patterns of variation closely reflect the natural geographical features of a region and hold significant importance for the sustainable development of flood control, irrigation, navigation, power generation, and other industries [2,3]. Various factors influence the spatial and temporal distributions of runoff, such as climate change, human activities, vegetation cover, and underlying surface conditions. Climate change and human activities are typically considered the primary factors affecting regional runoff. With the intensification of global warming, rising temperatures promote glacier melt and permafrost degradation, which can facilitate runoff formation, on the one hand, but also increase evapotranspiration, on the other hand, hindering runoff aggregation [4]. Additionally, changes in vegetation cover in recent years have had a more significant impact on runoff. As a crucial component of the basin’s underlying surface, changes in vegetation cover affect both runoff generation and aggregation, thereby influencing the basin’s runoff [5]. Lush vegetation can improve the basin’s climate conditions by altering precipitation patterns to promote runoff. However, as vegetation growth increases evapotranspiration and soil moisture consumption, it can also lead to reduced runoff [6,7]. Against the backdrop of economic and social development and a growing population, the pressing need to understand the impact of factors like vegetation changes on runoff in the basin, as well as to explore and forecast future runoff patterns, has become a vital area of research. This is of strategic significance for regional sustainable development and the equitable allocation of water resources.
The mechanisms driving runoff through vegetation and the response of vegetation changes to runoff have become focal points of research in recent years. Studies, such as that by Jiang and Liu (2023) [8], have shown that vegetation coverage in the Yellow River basin has increased in the last two decades. The natural runoff has more than doubled over this time, and the runoff coefficient has increased by more than 30%. However, the growth in the measured runoff has significantly weakened owing to continually high water consumption. Gao et al. (2024) [9] found that, compared with natural restoration, the benefits of annual runoff and sediment reduction by afforestation reached 60.4% and 75.1%, and the high-flow events (peak discharge: 0.1–27.1 m3/s) decreased by 78% in the Chinese Loess Plateau. According to Hunag et al. (2024) [10], the runoff decreased significantly at a rate of −0.175 mm∙a−1 during 1982–2019, and the precipitation and potential evapotranspiration showed significant increasing trends. The sensitivity of runoff changes to time-varying underlying surface parameters, precipitation, and potential evapotranspiration decreased sequentially. According to Cai et al. (2019) [11], former Soviet scholars suggested that for every 1% increase in forest vegetation cover, the annual runoff increased by 1.1 mm. Forested areas, characterized by high vegetation cover, decrease annual runoff because wetter forests have a stronger runoff evapotranspiration capacity. In 1909, the results of the American-led Wagon Wheel Gap experiment indicated that deforestation of 81 ha of scrub willow and coniferous forests would increase annual water yield by approximately 30 mm [12]. Wang et al. (2023) [13] summarized that the driving factor for runoff changes in the upper reach of the Yellow River basin is mainly precipitation, with a contribution rate of 39.31–54.70%. Moreover, the driving factors for runoff changes in the middle and lower reaches are mainly human activities, having a contribution rate of 63.70–84.37%.
From the research mentioned above, innovative studies have examined the runoff response mechanism induced by vegetation changes. However, research that quantitatively analyzes the relationship between vegetation and runoff or explicitly establishes mathematical models or relationships between vegetation and runoff is still relatively scarce [14,15,16]. Because of the complexity and spatial heterogeneity resulting from changes in underlying surfaces caused by vegetation changes, accurately reflecting the mechanisms by which vegetation cover affects basin runoff is challenging [17,18,19]. Therefore, it is crucial to establish a response mechanism model that considers multiple influencing factors, such as vegetation cover, and their impacts on runoff. Faced with issues like water scarcity, decreasing river runoff, and increasing conflicts in water resource supply and demand, changes in vegetation in the Yellow River basin are bound to exacerbate issues like changes in underlying surfaces and increased water consumption. Consequently, this may alter the hydrological cycle patterns in the Yellow River basin and, in turn, affect the spatiotemporal distribution of runoff, significantly impacting the sustainable utilization of water resources in the basin.
In order to overcome the problem that large-scale hydrological models require a large number of fine parameters, the future runoff of the Yellow River basin is predicted. In this study, a statistical forecasting method for runoff in the Yellow River basin based on a future climate model was built. Using statistical and remote sensing methods, including PCA-MLR combined with multiple regression models, vegetation cover data, and a range of runoff influencing factor data, such as meteorological and hydrological data, soil moisture, and soil temperature as independent variables, this model is based on validated remote sensing data of contemporary Yellow River basin runoff depth. The study also uses CMIP6 climate model data as input to forecast future runoff depth in the Yellow River basin.

2. Materials and Methods

2.1. Study Area

The Yellow River basin, located between 96° E to 119° E and 32° N to 42° N, spans a total length of 5464 km, making it the fifth-longest river in the world and the second-longest in China. The Yellow River basin traverses four distinct topographical units from west to east—Tibet Plateau, Inner Mongolia Plateau, Loess Plateau, and North China Plain—covering a vast area of 752,443 square kilometers. The region enjoys abundant sunshine, with annual sunshine hours ranging from 2000 to 3300 h, and most areas experience annual precipitation between 200 and 650 mm. Temperature exhibits significant variations throughout the year, with temperatures in the northern regions (above 37° N) ranging from 31 °C to 37 °C, and in the southern areas, temperatures typically falling between 21 °C and 31 °C. The Upper Yellow River, stretching from the river’s source to the Tangnaihai hydrological station, is considered the river’s source region. This upper section extends from the river’s source to Huankou Town in Togto County, Inner Mongolia Autonomous Region, with a total river length of 3471.6 km and a basin area of 428,000 square kilometers, representing 53.8% of the total Yellow River basin. This section has fewer tributaries and some siltation in the riverbed. The Middle Yellow River, known as the Taohuayu section, extends from Huankou Town to Zhengzhou City in Henan Province, covering a river length of 1206.4 km and a basin area of 344,000 square kilometers, accounting for 43.3% of the total Yellow River basin. This section features a drop in elevation of 890 m and an average gradient of 7.4‰. The Lower Yellow River, extending from Taohuayu to the river’s mouth, where it enters the sea, encompasses a basin area of 23,000 square kilometers, representing only 3% of the total basin area. For the purposes of this study, 14 sub-basins were selected from the upper, middle, and lower regions of the Yellow River basin, and some of these sub-basins were named after their upstream and downstream hydrological control stations (Figure 1).

2.2. Data Sources and Processing

(1)
Meteorological and Hydrological Data
The meteorological and hydrological data utilized in this study comprise the following: 1. Measured data from 93 meteorological stations within the Yellow River basin, spanning the period from 1951 to 2012. These datasets include daily precipitation and daily average temperature records. The data were acquired from the China Meteorological Science Data Sharing Service website (http://data.cma.cn/, accessed on 14 May 2023). To address missing data, linear interpolation, adjacent year data, and hydrological analog methods were employed. 2. Nationwide 38-year cumulative precipitation and mean temperature datasets covering the years 1982 to 2012, with a spatial resolution of 1 km. These datasets were sourced from the National Earth System Science Data Center of the National Science and Technology Infrastructure Platform (http://www.geodata.cn/, accessed on 11 June 2023). 3. A monthly runoff dataset with a spatial resolution of 0.08333° for China, spanning from 1960 to 2012. This dataset was obtained from the National Earth System Science Data Center (http://www.geodata.cn/, accessed on 21 June 2023). These comprehensive datasets provide a robust foundation for the analysis and modeling of meteorological and hydrological conditions within the Yellow River basin, facilitating insight into runoff patterns and their interactions with various environmental factors.
(2)
Soil Data
A monthly soil volumetric water content dataset with a spatial resolution of 0.08333° for China from 1960 to 2012 is available. This dataset, provided in the NetCDF format, is derived from the National Earth System Science Data Center (http://www.geodata.cn/, accessed on 10 May 2023). It is generated using the TRIPLEX-GHG model, driven by land surface basic information data and historical meteorological data. The driving data are publicly available and verified for accuracy. The model’s simulation results have also been validated in related academic or thesis publications. Additionally, a monthly soil temperature dataset with a spatial resolution of 0.08333° for China from 1960 to 2012 is accessible. This dataset, provided in the NetCDF format, is sourced from the National Earth System Science Data Center (http://www.geodata.cn/, accessed on 19 May 2022). Both datasets offer valuable insight into soil conditions over time, enhancing our understanding of land surface dynamics and their interactions with meteorological factors.
(3)
NDVI Data
The NDVI data utilized in this study are sourced from the GIMMS-NDVI3g-V1.0 dataset (https://ecocast.arc.nasa.gov/data/pub/gimms/3g.v1/, accessed on 18 July 2023). These data have a spatial resolution of 8 km and a temporal resolution of 15 days, covering the period from 1982 to 2015. To derive vegetation cover from NDVI, pixel-wise binary interpolation was employed, as described by Jian et al. (2023a). This method facilitates the conversion of NDVI values into vegetation cover, enabling the assessment of vegetation dynamics and their implications for the study area.
(4)
CMIP6 Climate Model Data
The future climate model simulation data utilized in this study for precipitation, temperature, vegetation cover, soil temperature, and soil moisture are derived from the research outcomes of our team. CMIP6 future precipitation data are based on downscaled results from the following three climate models: ACCESS-ESM1-5, CESM2-WACCM, and IPSL-CM6A-LR. Subsequent research utilizes a multimodel ensemble (MME) dataset based on these three models. CMIP6 future temperature data are based on downscaled results from the following three climate models: ACCESS-CM2, CESM2-WACCM, and NorESM2-LM. The subsequent research utilized a multimodel ensemble average (MME) dataset based on these three models. Moreover, CMIP6 future vegetation cover data are derived from the downscaled results from the GFDL-ESM4 model and are employed for subsequent research. CMIP6 future soil temperature data stem from downscaled results from the CESM2-FV2, CESM2-WACCM, and CESM2-WACCM-FV2 models. CMIP6 future soil moisture data are based on downscaled results from the CESM2-FV2, CESM2-WACCM-FV2, and MIROC6 models. These comprehensive datasets offer valuable insight into future climate scenarios and their potential impacts on the study area, enhancing our understanding of environmental dynamics and informing adaptation strategies.

2.3. Methodology

(1)
PCA-MLR Multiple Linear Regression Model
Principal component analysis (PCA) is a multivariate statistical method that, through dimensionality reduction techniques, transforms multiple variables into a few principal components. Assuming that a data matrix with n variables, X1, X2, …, Xn, and k samples can be represented as follows:
X = x 11 x 1 n       x k 1 x k n = X 1 , X 2 , X 3
where X i = x 1 i   x 2 i     x k i T and, through PCA analysis, obtain m new variables such that they satisfy the conditions a211 + a212 + … + a2in= 1 and Fi, Fj (ij; i, j = 1, 2, …, m) and ensure that Fi and Fj (ij; i, j = 1, 2, …, m) are uncorrelated pairwise, as follows:
F 1 = a 11 X 1 + a 12 X 2 + + a 1 n X n F 2 = a 21 X 1 + a 22 X 2 + + a 2 n X n F m = a m 1 X 1 + a m 2 X 2 + + a m n X n
where F1, F2, …, Fm are the first principal component, second principal component, …, mth principal component, respectively; aij represents the principal component coefficient.
The mathematical expression of the multiple linear regression (MLR) model after dimensionality reduction using PCA is as follows:
α 1 = β 0 + β 1 F 1 + β 2 F 2 + + β m F m = μ 0 + μ 1 X 1 + μ 2 X 2 + + μ m X m
where α1 represents the predicted runoff coefficient in the PCA-MLR model; β0 is the intercept term; β1, …, βm are the partial regression coefficients in the MLR; μ0 is the intercept term, and μ1, …, μm are the final regression coefficients for α1 with the variables X1, X2, …, Xm; and F1, F2, …, Fm are the independent variables, i.e., the first, second, …, mth principal components. Using the PCA (principal component analysis) method, it is possible to select the most significant variables from multiple variables, thus improving the accuracy of the linear regression simulation. Therefore, this study employed a combined PCA-MLR (multivariate linear regression) model and used Python 3.8.2 iterative code for pixel-wise computation on the Yellow River basin surface.
(2)
Establishing a runoff coefficient model based on PCA-MLR
According to the mechanism of runoff generation, a simple model is constructed to express the relationship of the runoff coefficient with influencing factors, which is as follows:
R/P = μ0 + μiXi
where R is the runoff depth (mm), P is the precipitation (mm), and Xi is each of the influencing factors, including FVC, precipitation (mm), air temperature (°C), soil water content (%), and soil temperature (°C), while μ0 and μi are the coefficients.
Because of the strong intercorrelations among the influencing factors of the runoff coefficient, establishing a direct relationship using a multivariate linear regression equation may result in data loss, leading to multicollinearity issues and the creation of spurious regressions. These issues are not conducive to accurately predicting the runoff coefficient in the Yellow River basin. Therefore, this study adopted a combined PCA-MLR (multivariate linear regression) model to enhance the prediction accuracy for the runoff coefficient in the Yellow River basin.
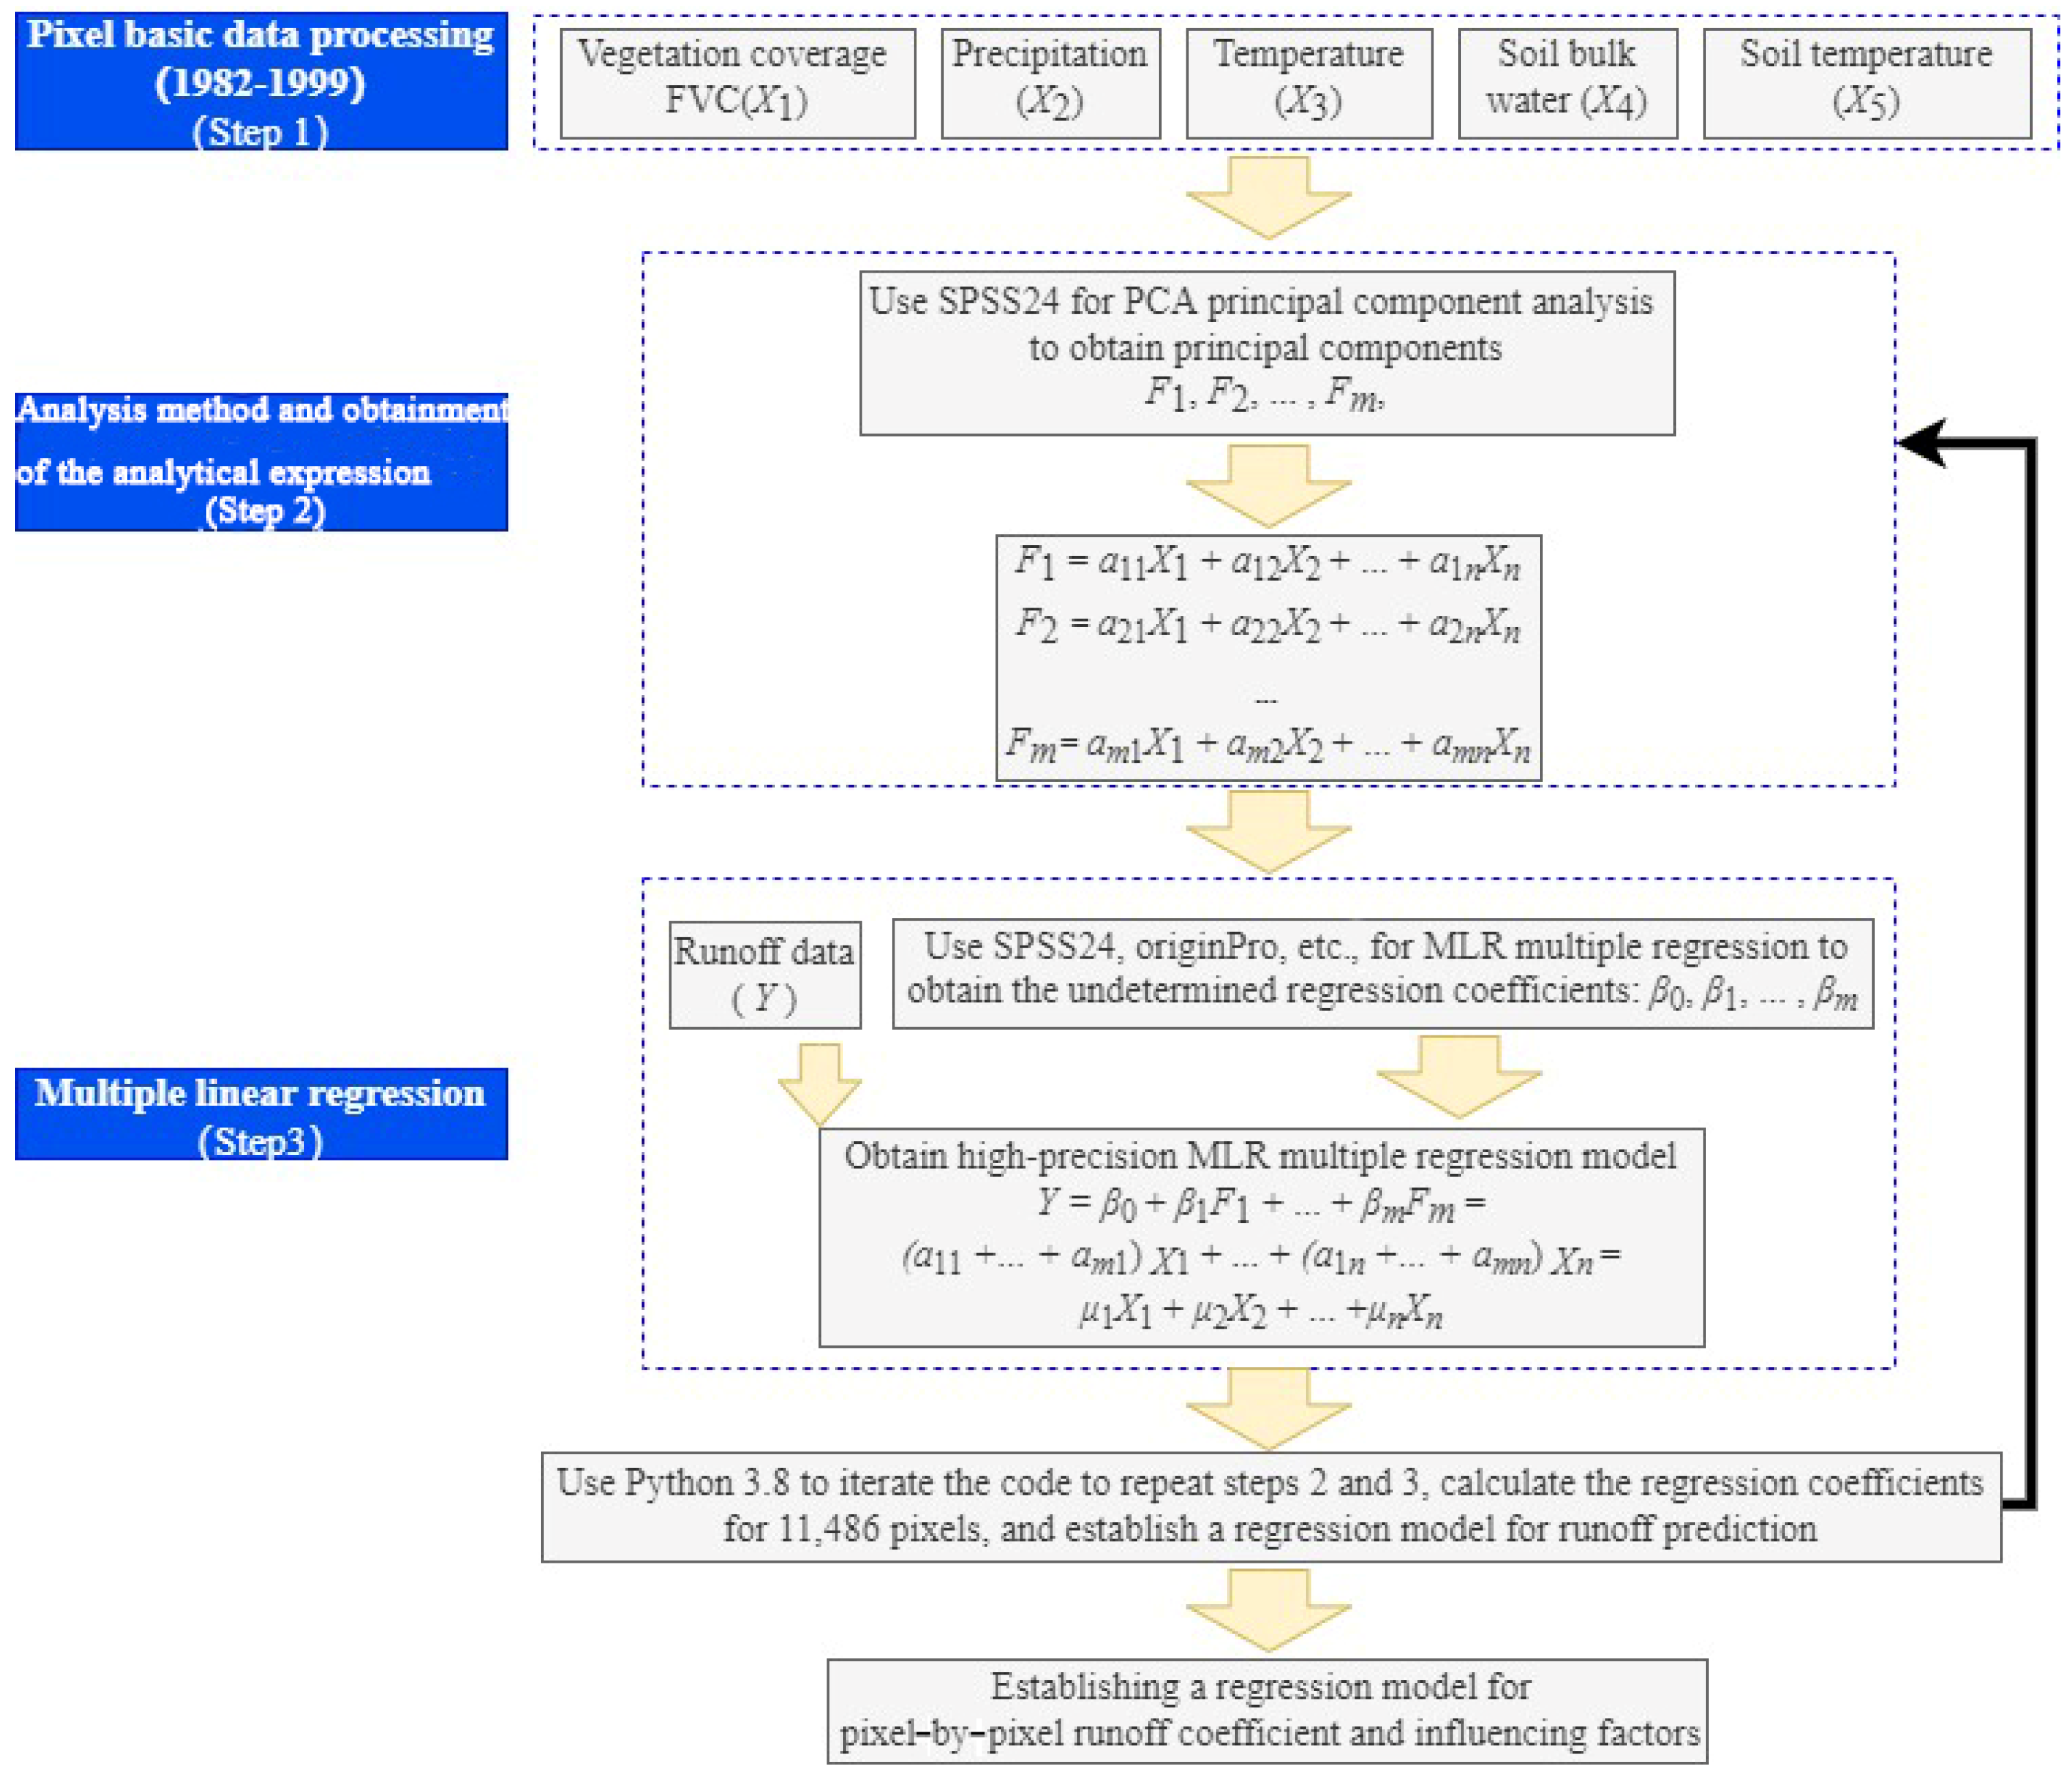
The specific approach is as follows: Firstly, principal component analysis (PCA) is utilized to reduce the dimensionality of the selected variables. This transformation process converts originally correlated variables into a few independent variables that capture the essential information. Subsequently, the principal components obtained through PCA, namely, F1, F2, …, Fm, are incorporated into linear regression with runoff data to estimate the coefficients β1, β2, β3, β4, and β5. Ultimately, the linear correlation coefficients μ1, μ2, …, μn are derived to establish a predictive regression model for runoff, with the specific calculation process outlined in Figure 2. Data from the period 1982–1999 were utilized for the model prediction, while data from the period 2000–2012 were employed for validation.

2.4. Data Analysis

To provide a more detailed description of the specific calculation process, this study selected an example pixel for the PCA-MLR model’s computation. The basic data information for this pixel is presented in Table S1, and its geographical location is illustrated in Figure S1. The basic data information for the pixel undergoes principal component analysis (PCA) for dimensionality reduction. Initially, the common factor variances are obtained, and the extraction values represent the extent to which each variable is expressed by the common factors. It is generally accepted that when the extraction value is greater than 0.7 this indicates that the variable is adequately represented by the common factors. In this case, all extraction values are greater than 0.85, confirming that the selected variables can be adequately represented by the common factors (Table 1).
Based on initial eigenvalues greater than 1, after extracting 3 factors, the cumulative contribution of the factors reaches 85.469%. This indicates that a relatively small amount of original information is lost, and the performance of the top three factors in the factor analysis is quite satisfactory, making them valuable for research. Therefore, for this pixel, three principal components are selected as the subjects of study. The component score coefficient matrix for each influencing factor is obtained. When the data for the five influencing factors are input, the following formulas are derived for the calculation of the three principal components:
F 1 = 0.014 X 1 0.116 X 2 + 0.486 X 3 + 0.127 X 4 + 0.482 X 5
F 2 = 0.018 X 1 + 0.585 X 2 + 0.051 X 3 + 0.687 X 4 0.017 X 5
F 3 = 0.940 X 1 0.222 X 2 0.008 X 3 + 0.205 X 4 0.023 X 5
By utilizing Equations (5)–(7), the calculation of the three principal components is performed, and the results are presented in Table 2.
For the pixel during the years 1982 to 1999, a multiple linear regression was conducted to fit the runoff coefficient as the dependent variable against F1, F2, and F3 as the independent variables. The resulting regression equation relating the dependent variable runoff coefficient to the principal components is as follows:
α = 0.0187 F 1 0.0137 F 2 0.043 F 3 + 0.361
By substituting Equations (5)–(7) into Equation (8), the final linear regression model equation for the pixel with the five major influencing factors is obtained as follows:
α = 0.0409 X 1 + 0.0006 X 2 + 0.0081 X 3 0.0158 X 4 + 0.0102 X 5 + 0.361
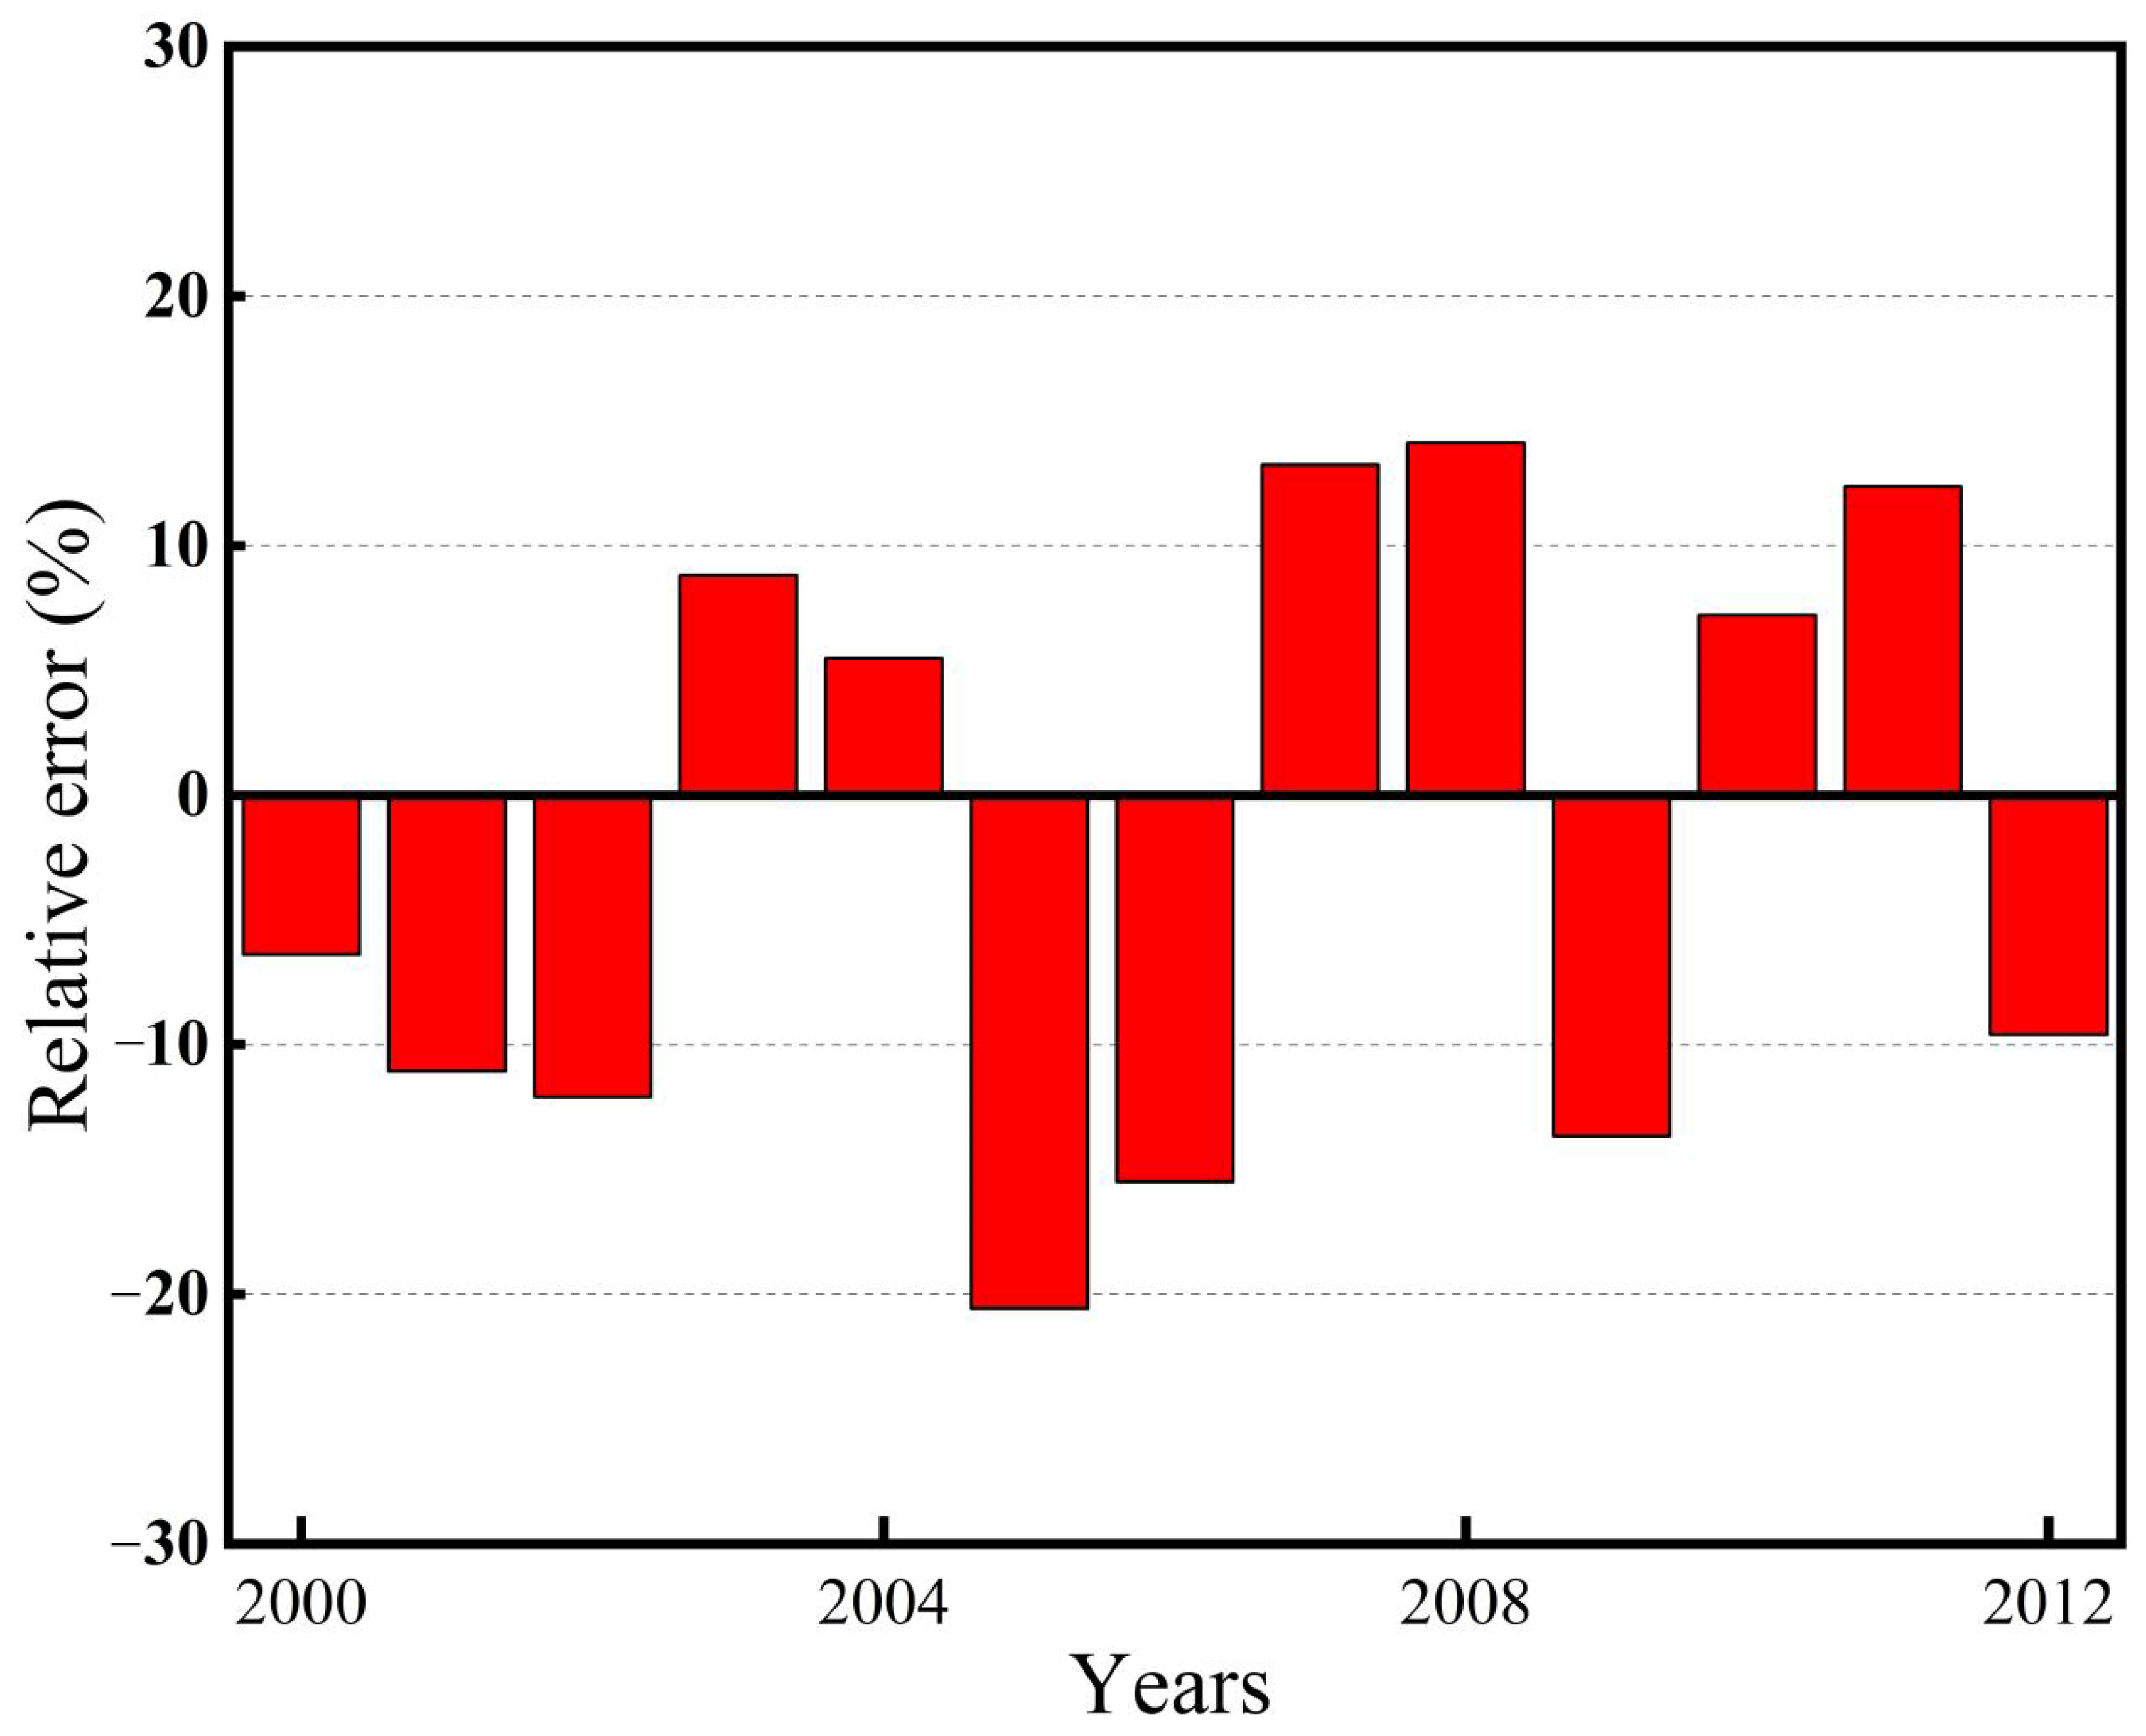
Using this model, the runoff coefficients for this pixel in the years 2000 to 2012 were calculated and then compared with the actual measured values to compute the relative error (Figure 3). The relative errors for all years are less than 30%, indicating that the model has a high level of accuracy and provides effective predictions for the runoff coefficients of this pixel.
Using Python 3.8.2 iterative code, steps two and three from Figure 2 were repeated, ultimately computing the spatial distribution and frequency of the regression parameters (including the regression constant μ0 and the regression coefficients μ1, μ2, μ3, μ4, and μ5) for the runoff coefficient’s influencing factors for all pixels in the Yellow River basin on the basis of the PCA-MLR model.

3. Results

3.1. Runoff Coefficient Model

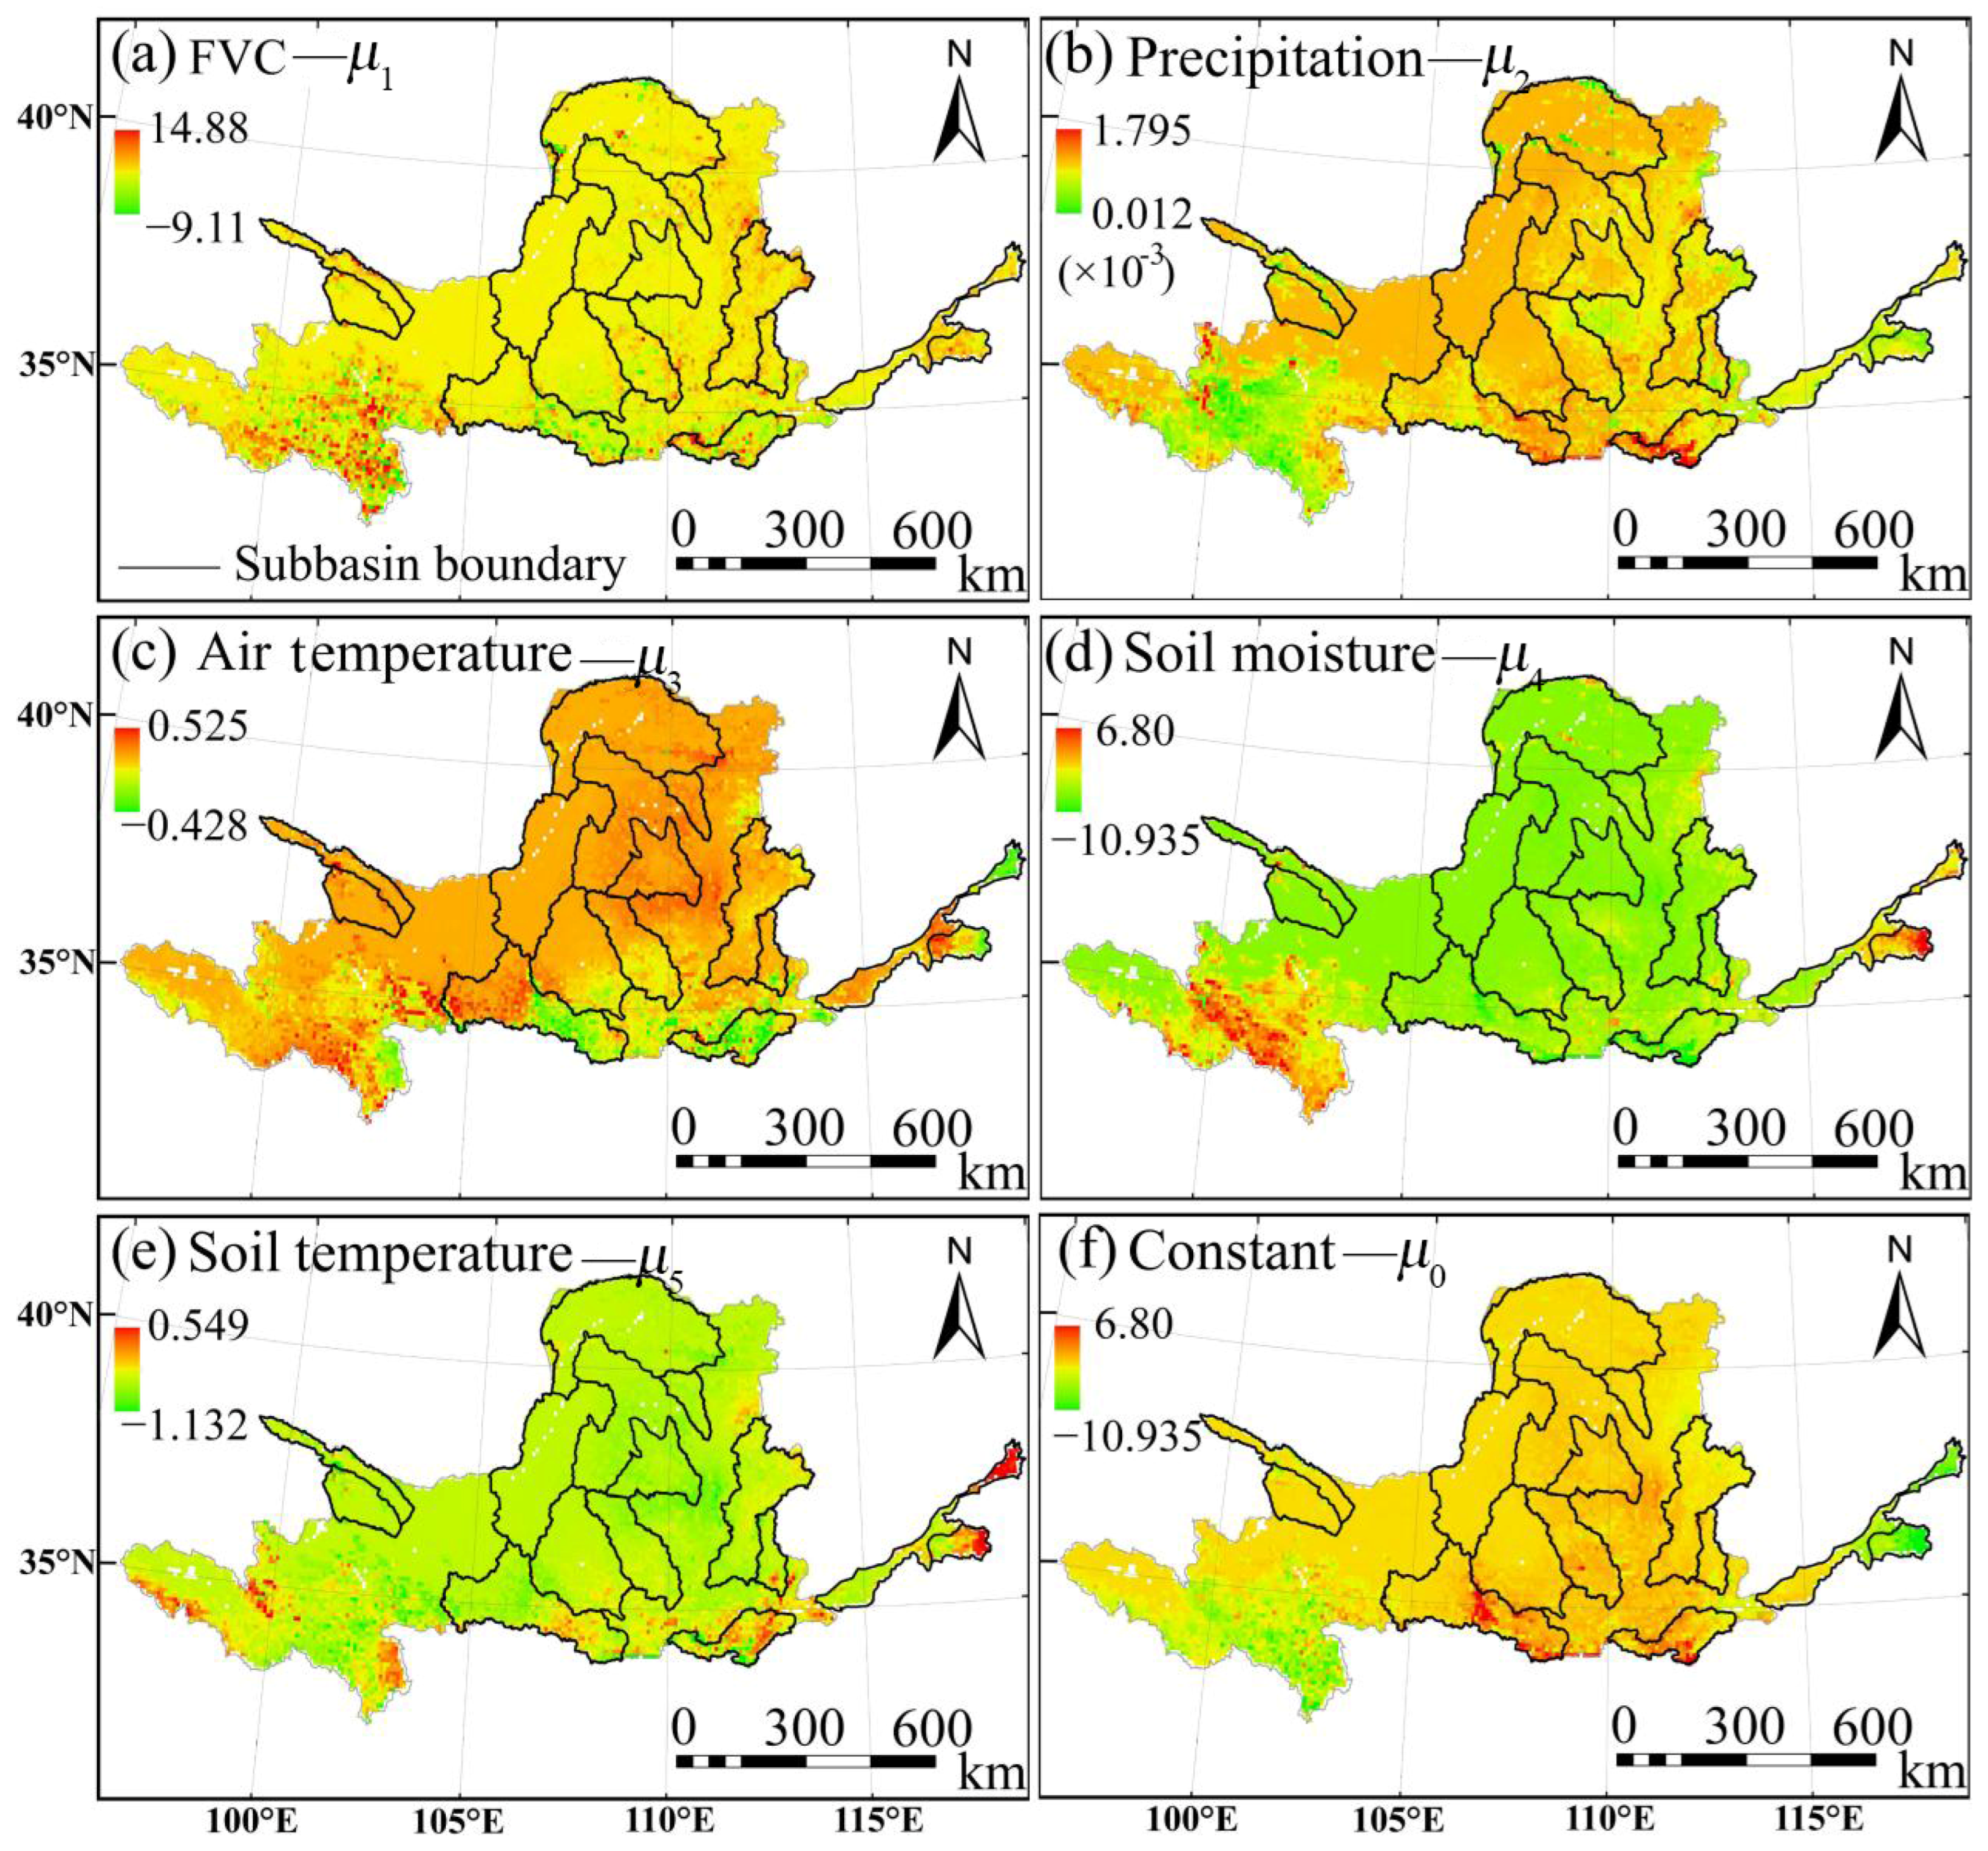
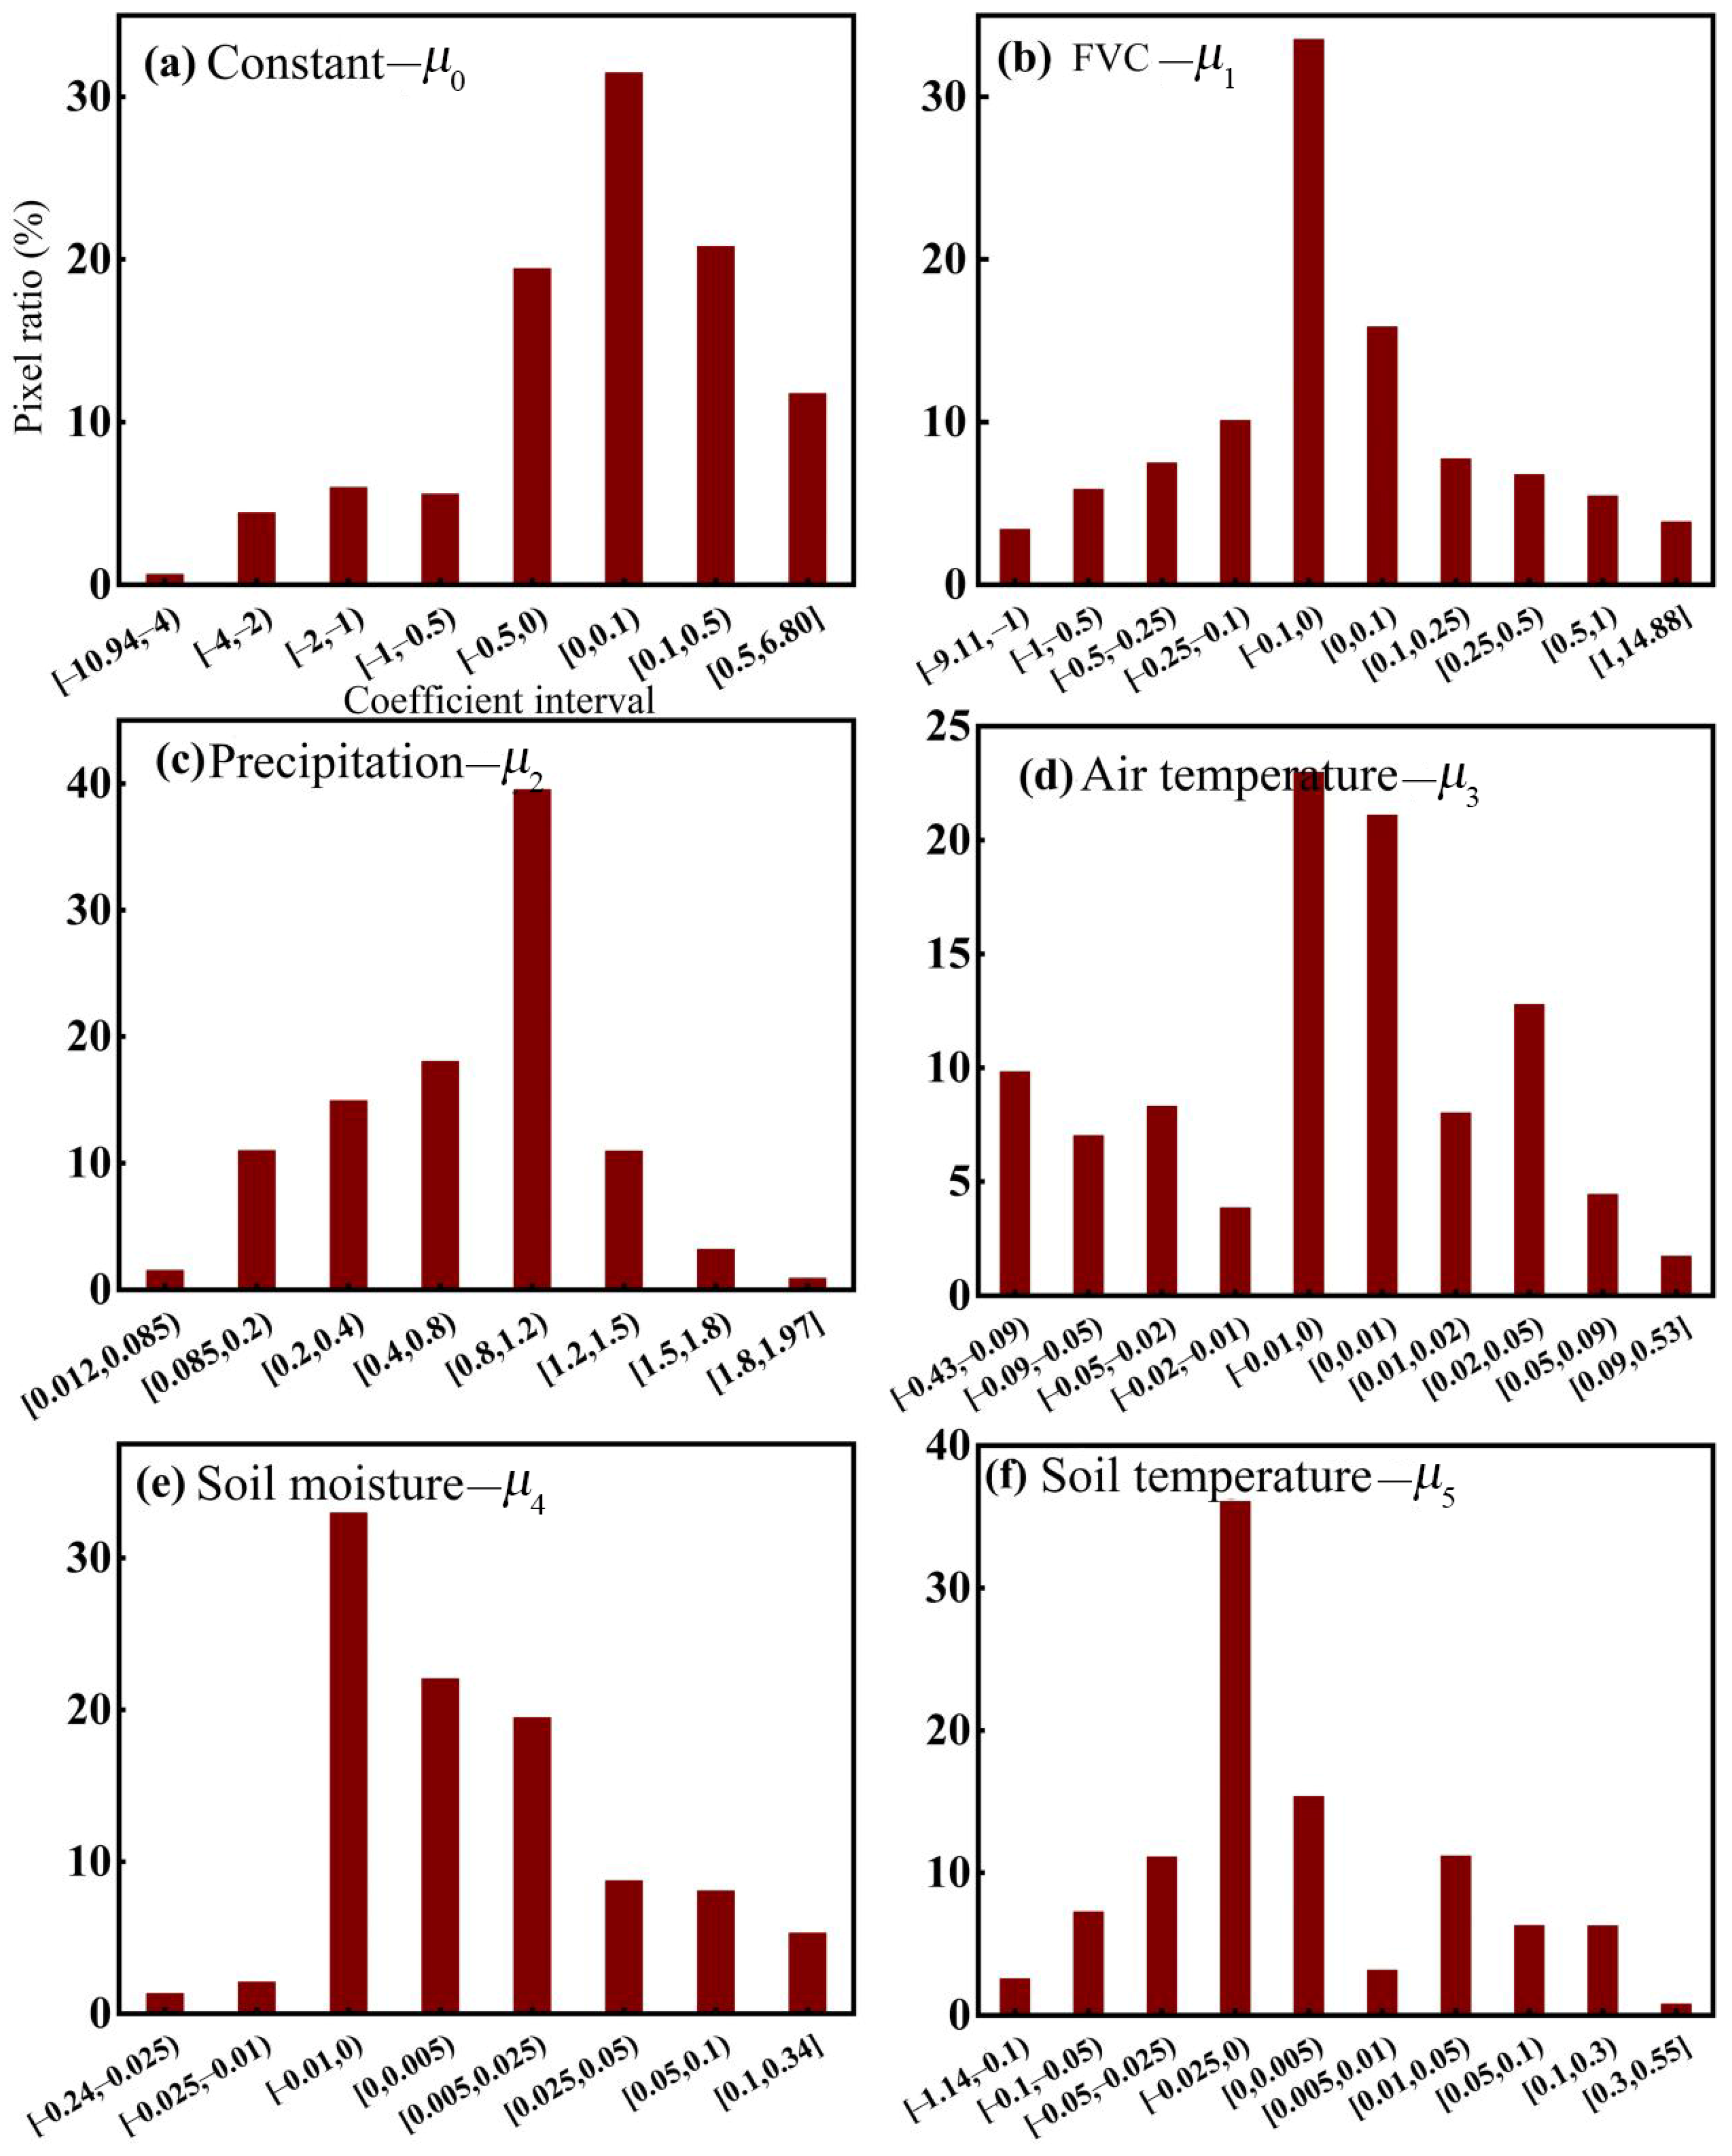
The regression coefficient μ1 for FVC tended to be close to 0 in the upper reaches of the Yellow River, including Datonghe and Shizuishan to Tou Daoguai basins, while it exhibits a more complex distribution in the Hekou region, Yiluo River, and Weihe and other basins, ranging between −9.11 and 14.88 (Figure 4a and Figure 5a). The precipitation coefficient μ2 ranged from 0.2 × 10⁻³ to 1.5 × 10⁻³ in most parts of the Yellow River basin (Figure 4b and Figure 5c). In the Shizuishan to Tou Daoguai and Yiluohe and Weihe basins, the coefficient is positive, indicating a positive influence of precipitation in these regions on runoff.
The Yellow River basin experiences significant diurnal and interannual temperature variations. The temperature coefficient μ3 falls between −0.43 and 0.53 (Figure 4c and Figure 5d). In most areas, μ3 is positive, primarily distributed in the upper and middle reaches of the Yellow River basin. However, it is negative in the southeastern part of the Weihe and Yiluohe basins and the downstream Yellow River basin. The soil water content coefficient μ4 ranges from −0.237 to 0.339, with most areas being negative. The exceptions are the Yellow River source area and downstream Daicunba area, which are mostly positive. Moreover, the soil temperature coefficient μ5 is predominantly negative, exceeding 50% (Figure 4e,f). Occasional positive values are observed in the Yellow River source area, Yiluohe, and downstream regions, indicating that soil temperature in these areas has a positive promoting effect on runoff, while negative values act as inhibitors. The constant term is negative in the Hekou region and downstream areas but mostly positive in other regions. The constant term might encompass factors like evapotranspiration and human activities (Figure 4f).
Regional analysis and zone-based statistical calculations were conducted on the runoff-related factor regression coefficients for the 14 sub-basins of the Yellow River, resulting in the average regression coefficients for these factors (Table 3). The R-squared values, which are all greater than 0.70, indicate that the computed equations have statistical significance and can be utilized for predicting the runoff coefficients of the basins.
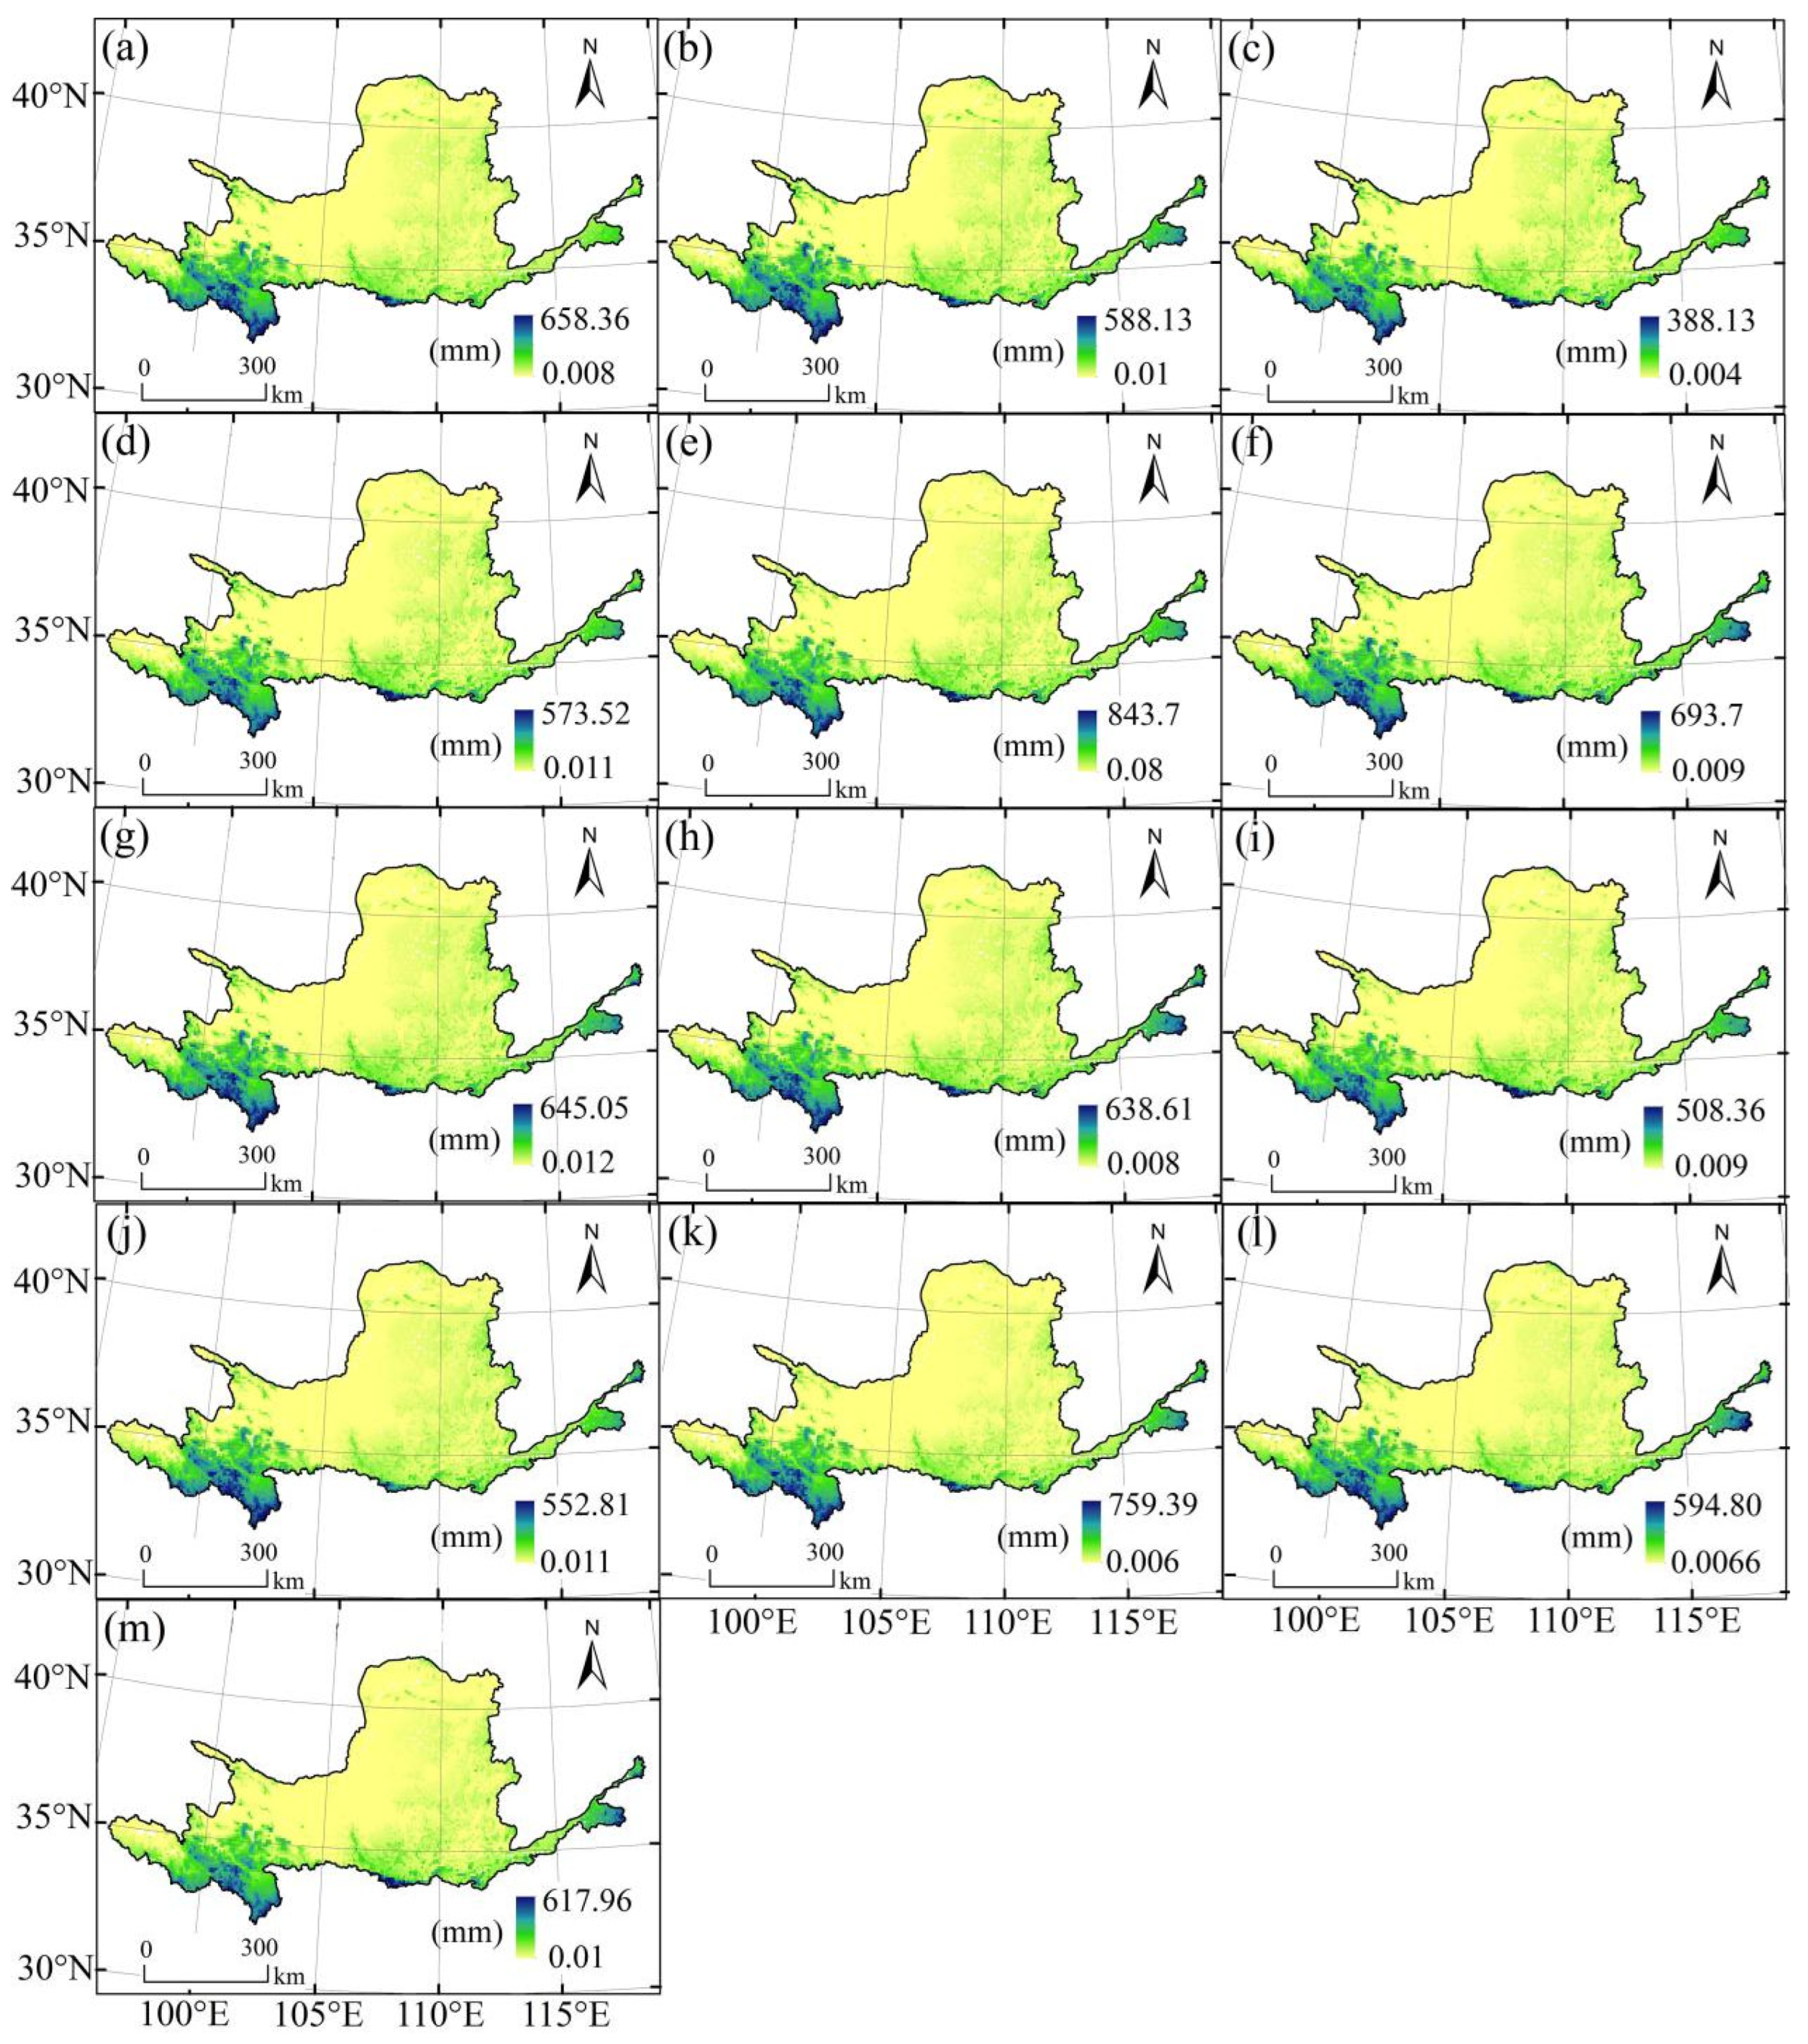
In the midstream of the Yellow River, the predicted runoff values are generally higher than the observed values. In contrast, the predictions for the source area and downstream of the Yellow River closely align with the observed values, and they are at the basin’s highest level. The predicted runoff depths in the northern Hetao Plain region closely resemble the observed values. Under observed conditions, there is noticeable variation in the runoff depth in the midstream of the basin, with a gradual decline since 2008, indicating a drying trend. Under the predicted conditions, the runoff in the midstream of the Yellow River also shows a decreasing trend starting in 2008, but the reduction is slightly less compared to the observed runoff values (Figure 6 and Figure S1).
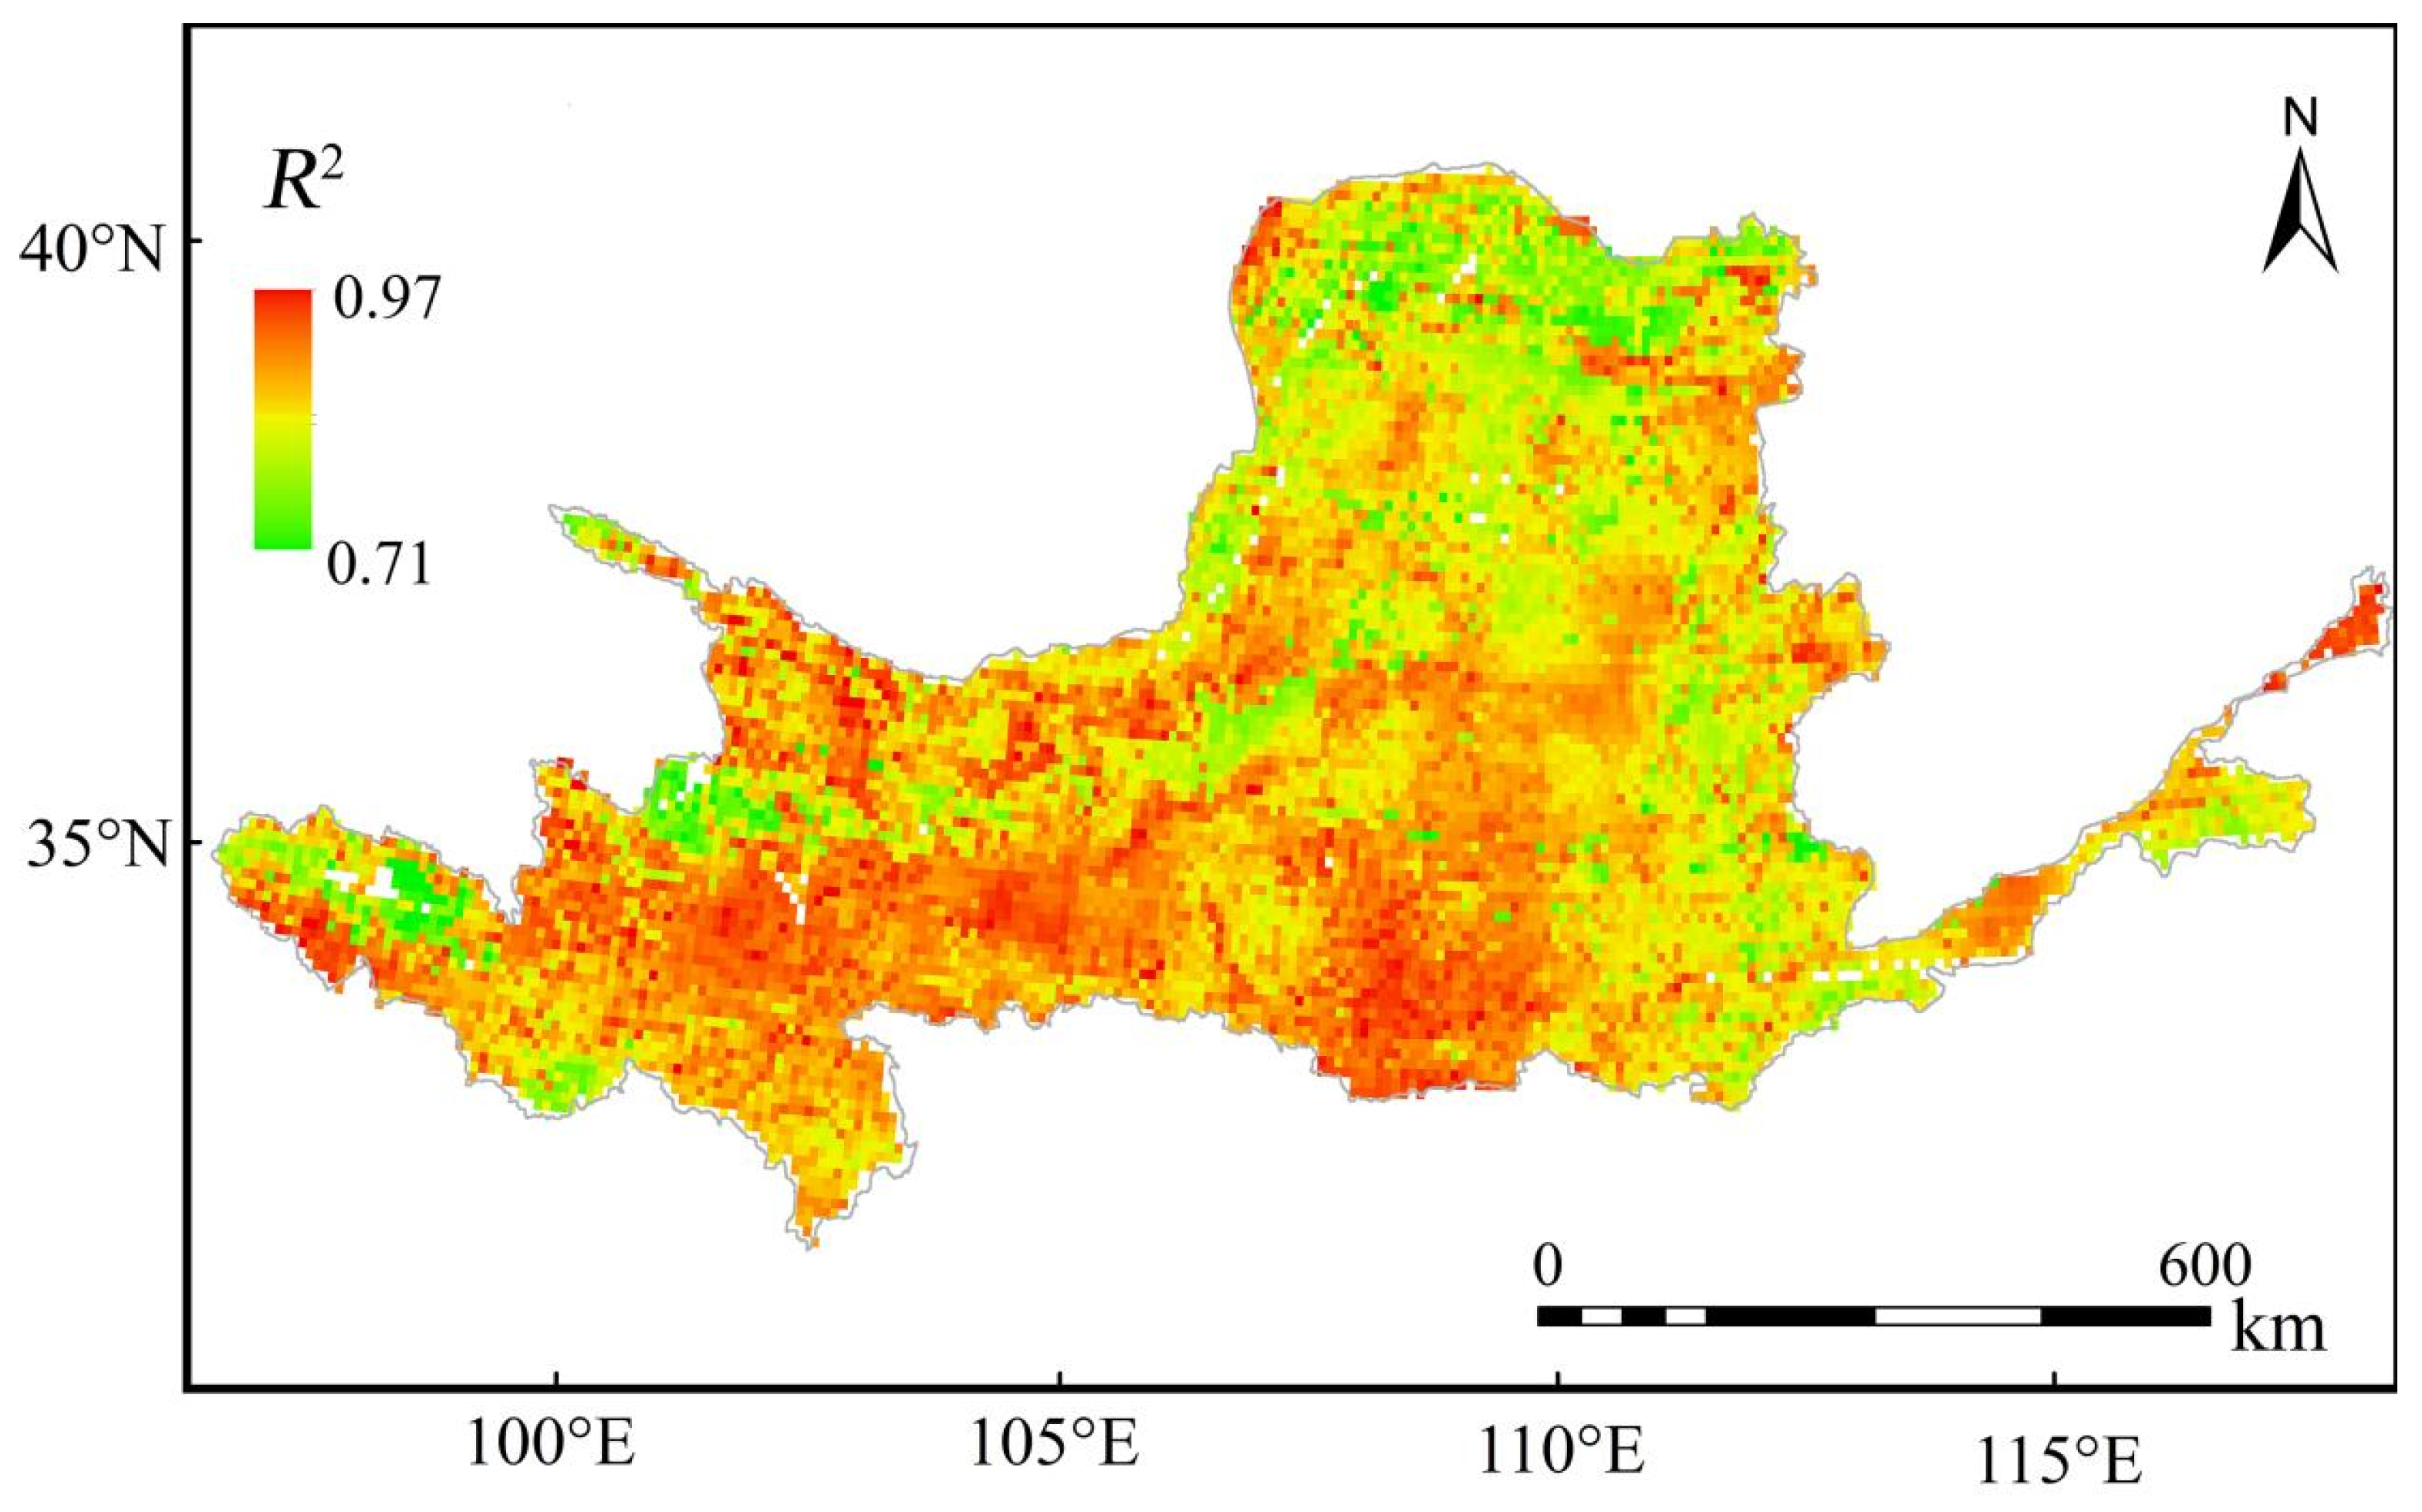
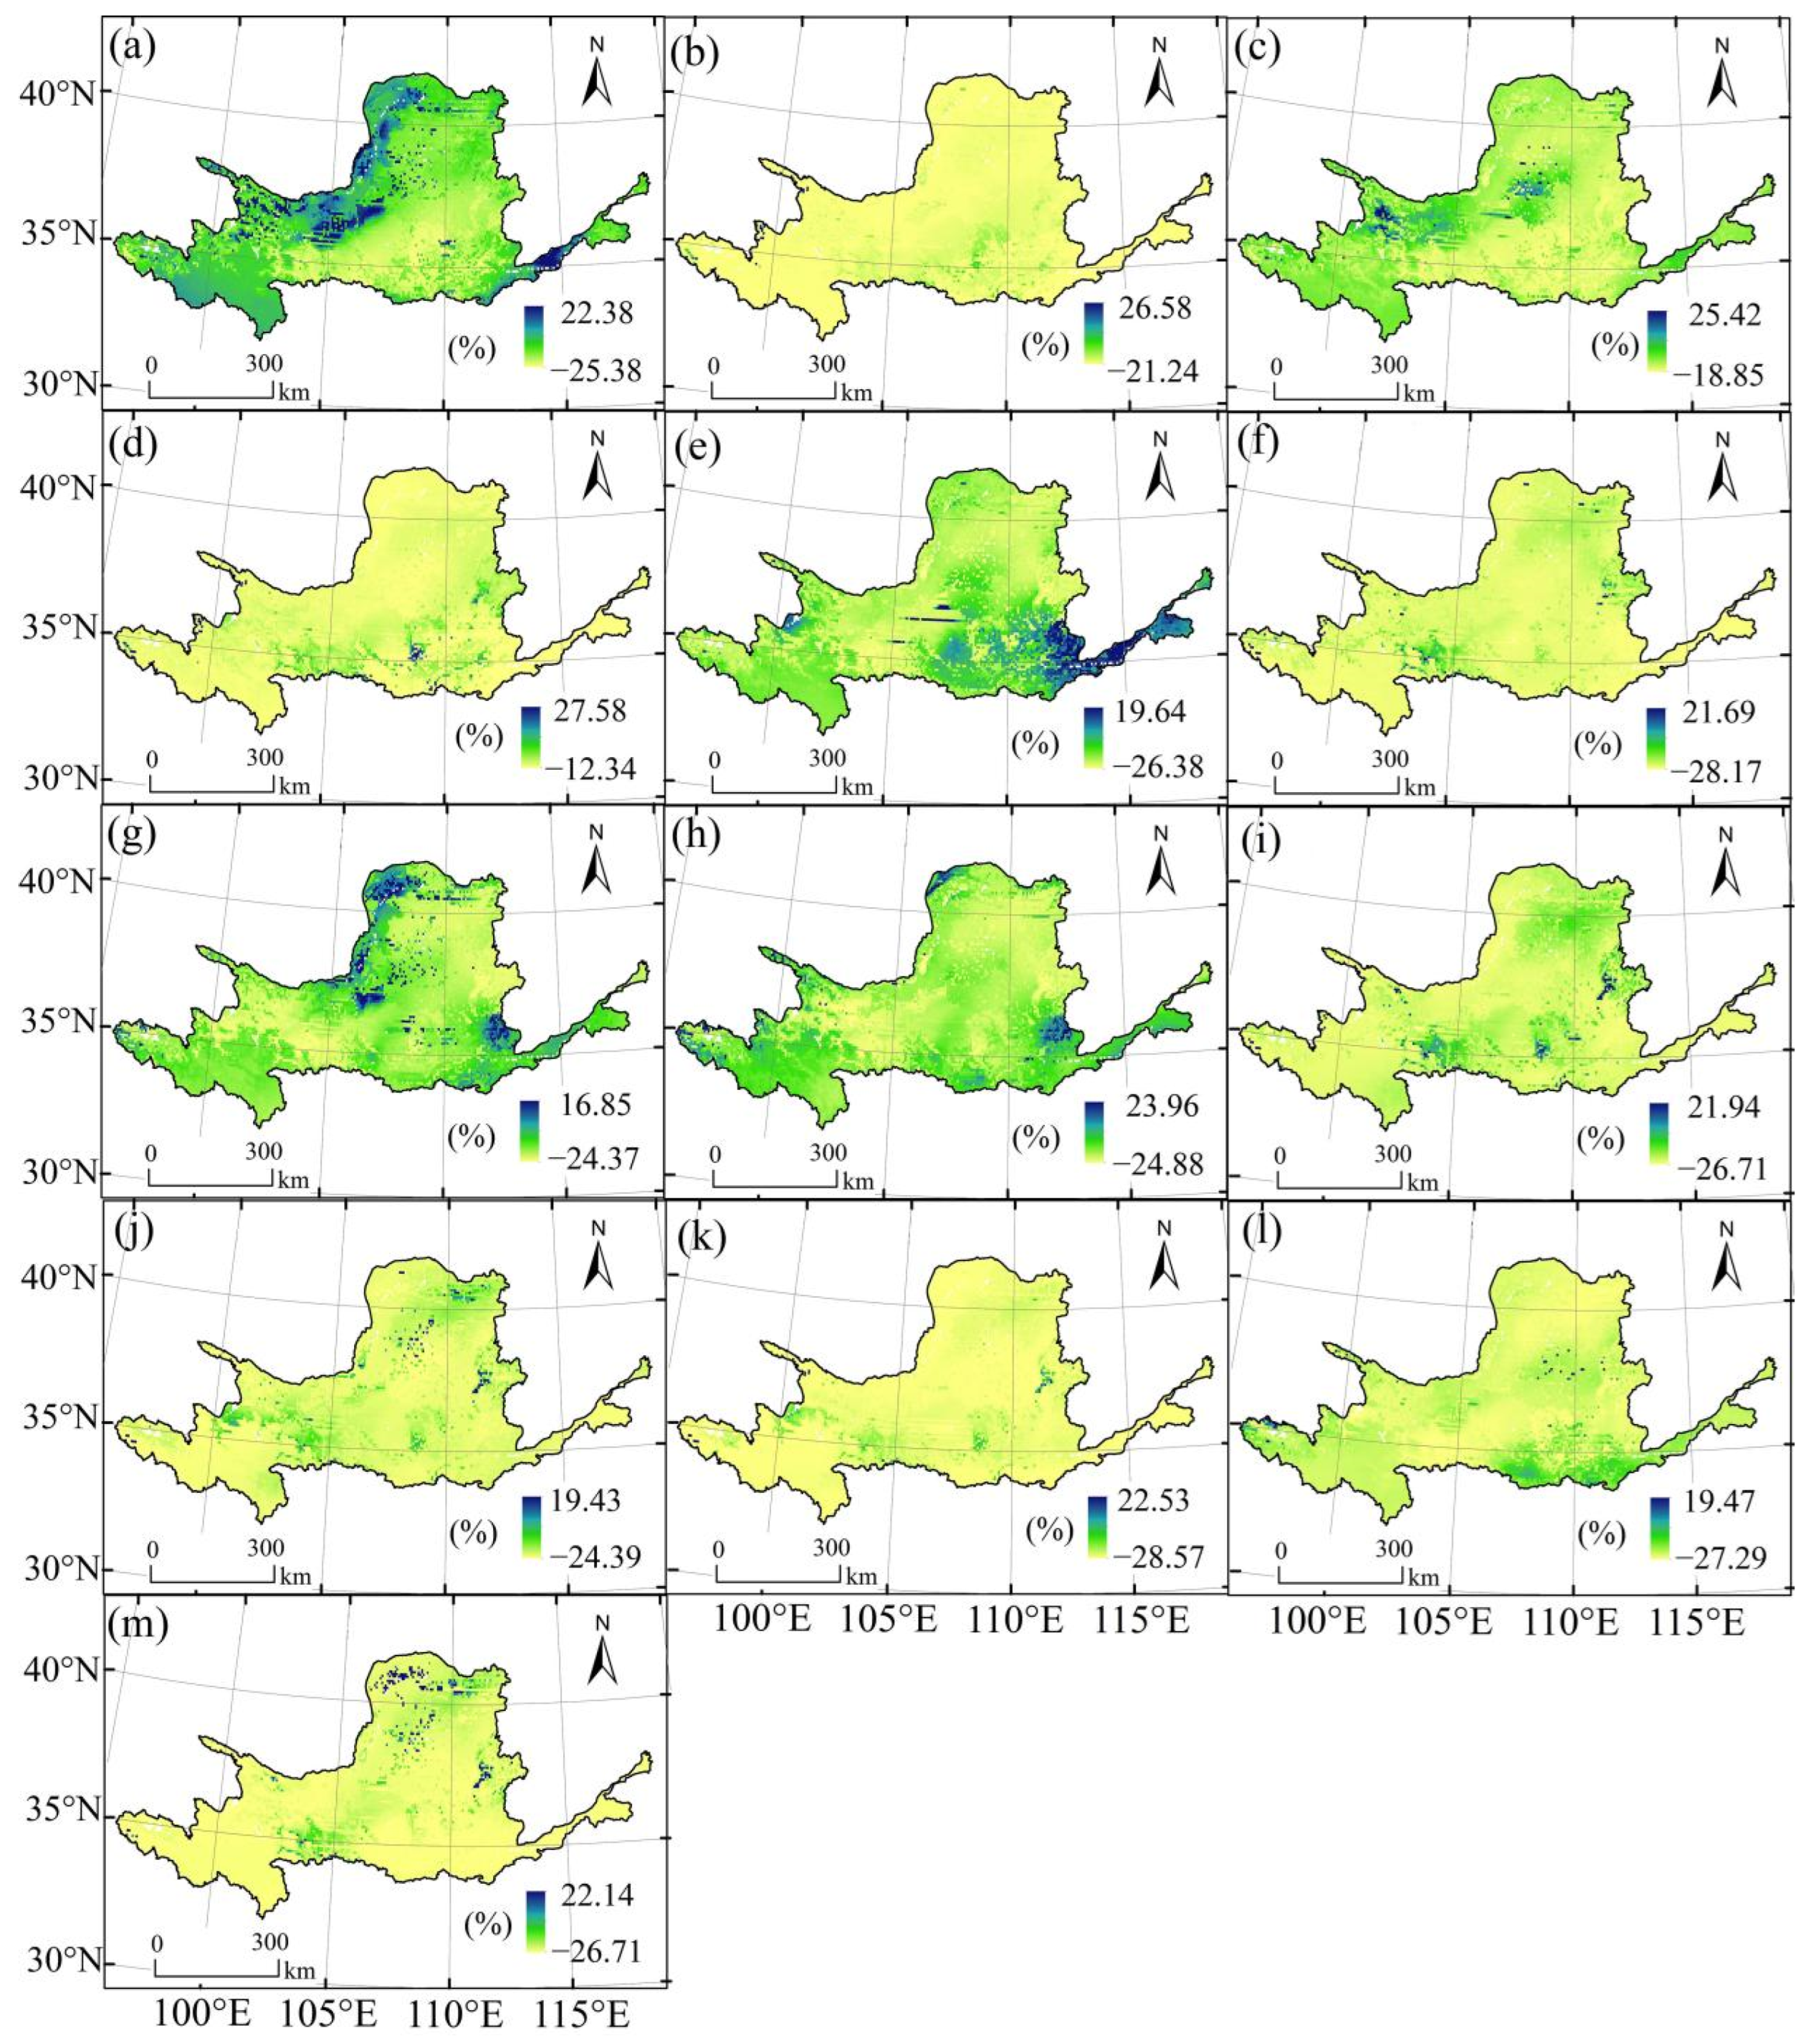
The majority of pixels have coefficients exceeding 0.7. In particular, the southern part of the basin exhibits more favorable prediction results, whereas regions in the north, such as the Hetao area, as well as certain upstream areas, demonstrate relatively poorer predictive performance (Figure 7). The relative errors for most years fall within the range of −30% to 30%. Among these, the year 2006 exhibits the smallest maximum error among all years at 16.85%. In contrast, 2010 shows the largest relative error at −28.57%. Moreover, most pixels have negative relative errors, indicating that, in most cases, the predicted runoff coefficient values are higher than the observed values (Figure 8).

3.2. Future Spatiotemporal Runoff Predictions under Climate Models

On the basis of the established runoff coefficient model and utilizing CMIP6 climate model data as input, the runoff depth in the Yellow River basin exhibits an upward trend across all four climate scenarios, namely, SSP126, SSP245, SSP370, and SSP585. The fitted slopes for these scenarios are all greater than 0, measuring 0.008 mm/a, 0.065 mm/a, 0.25 mm/a, and 0.24 mm/a, respectively. Among these scenarios, SSP370 and SSP585 demonstrate the fastest growth rate of runoff under the climate models. With the exception of the SSP126 scenario, in which the growth is less pronounced, the other three emission scenarios all indicate a significant upward trend in runoff depth. However, the magnitudes of the runoff changes remain considerable across all emission scenarios. The lowest value is observed for 2022 under the SSP370 climate scenario, at 42.5 mm, while the peak appears in 2091 under the same scenario, at 87.61 mm (Figure 9).
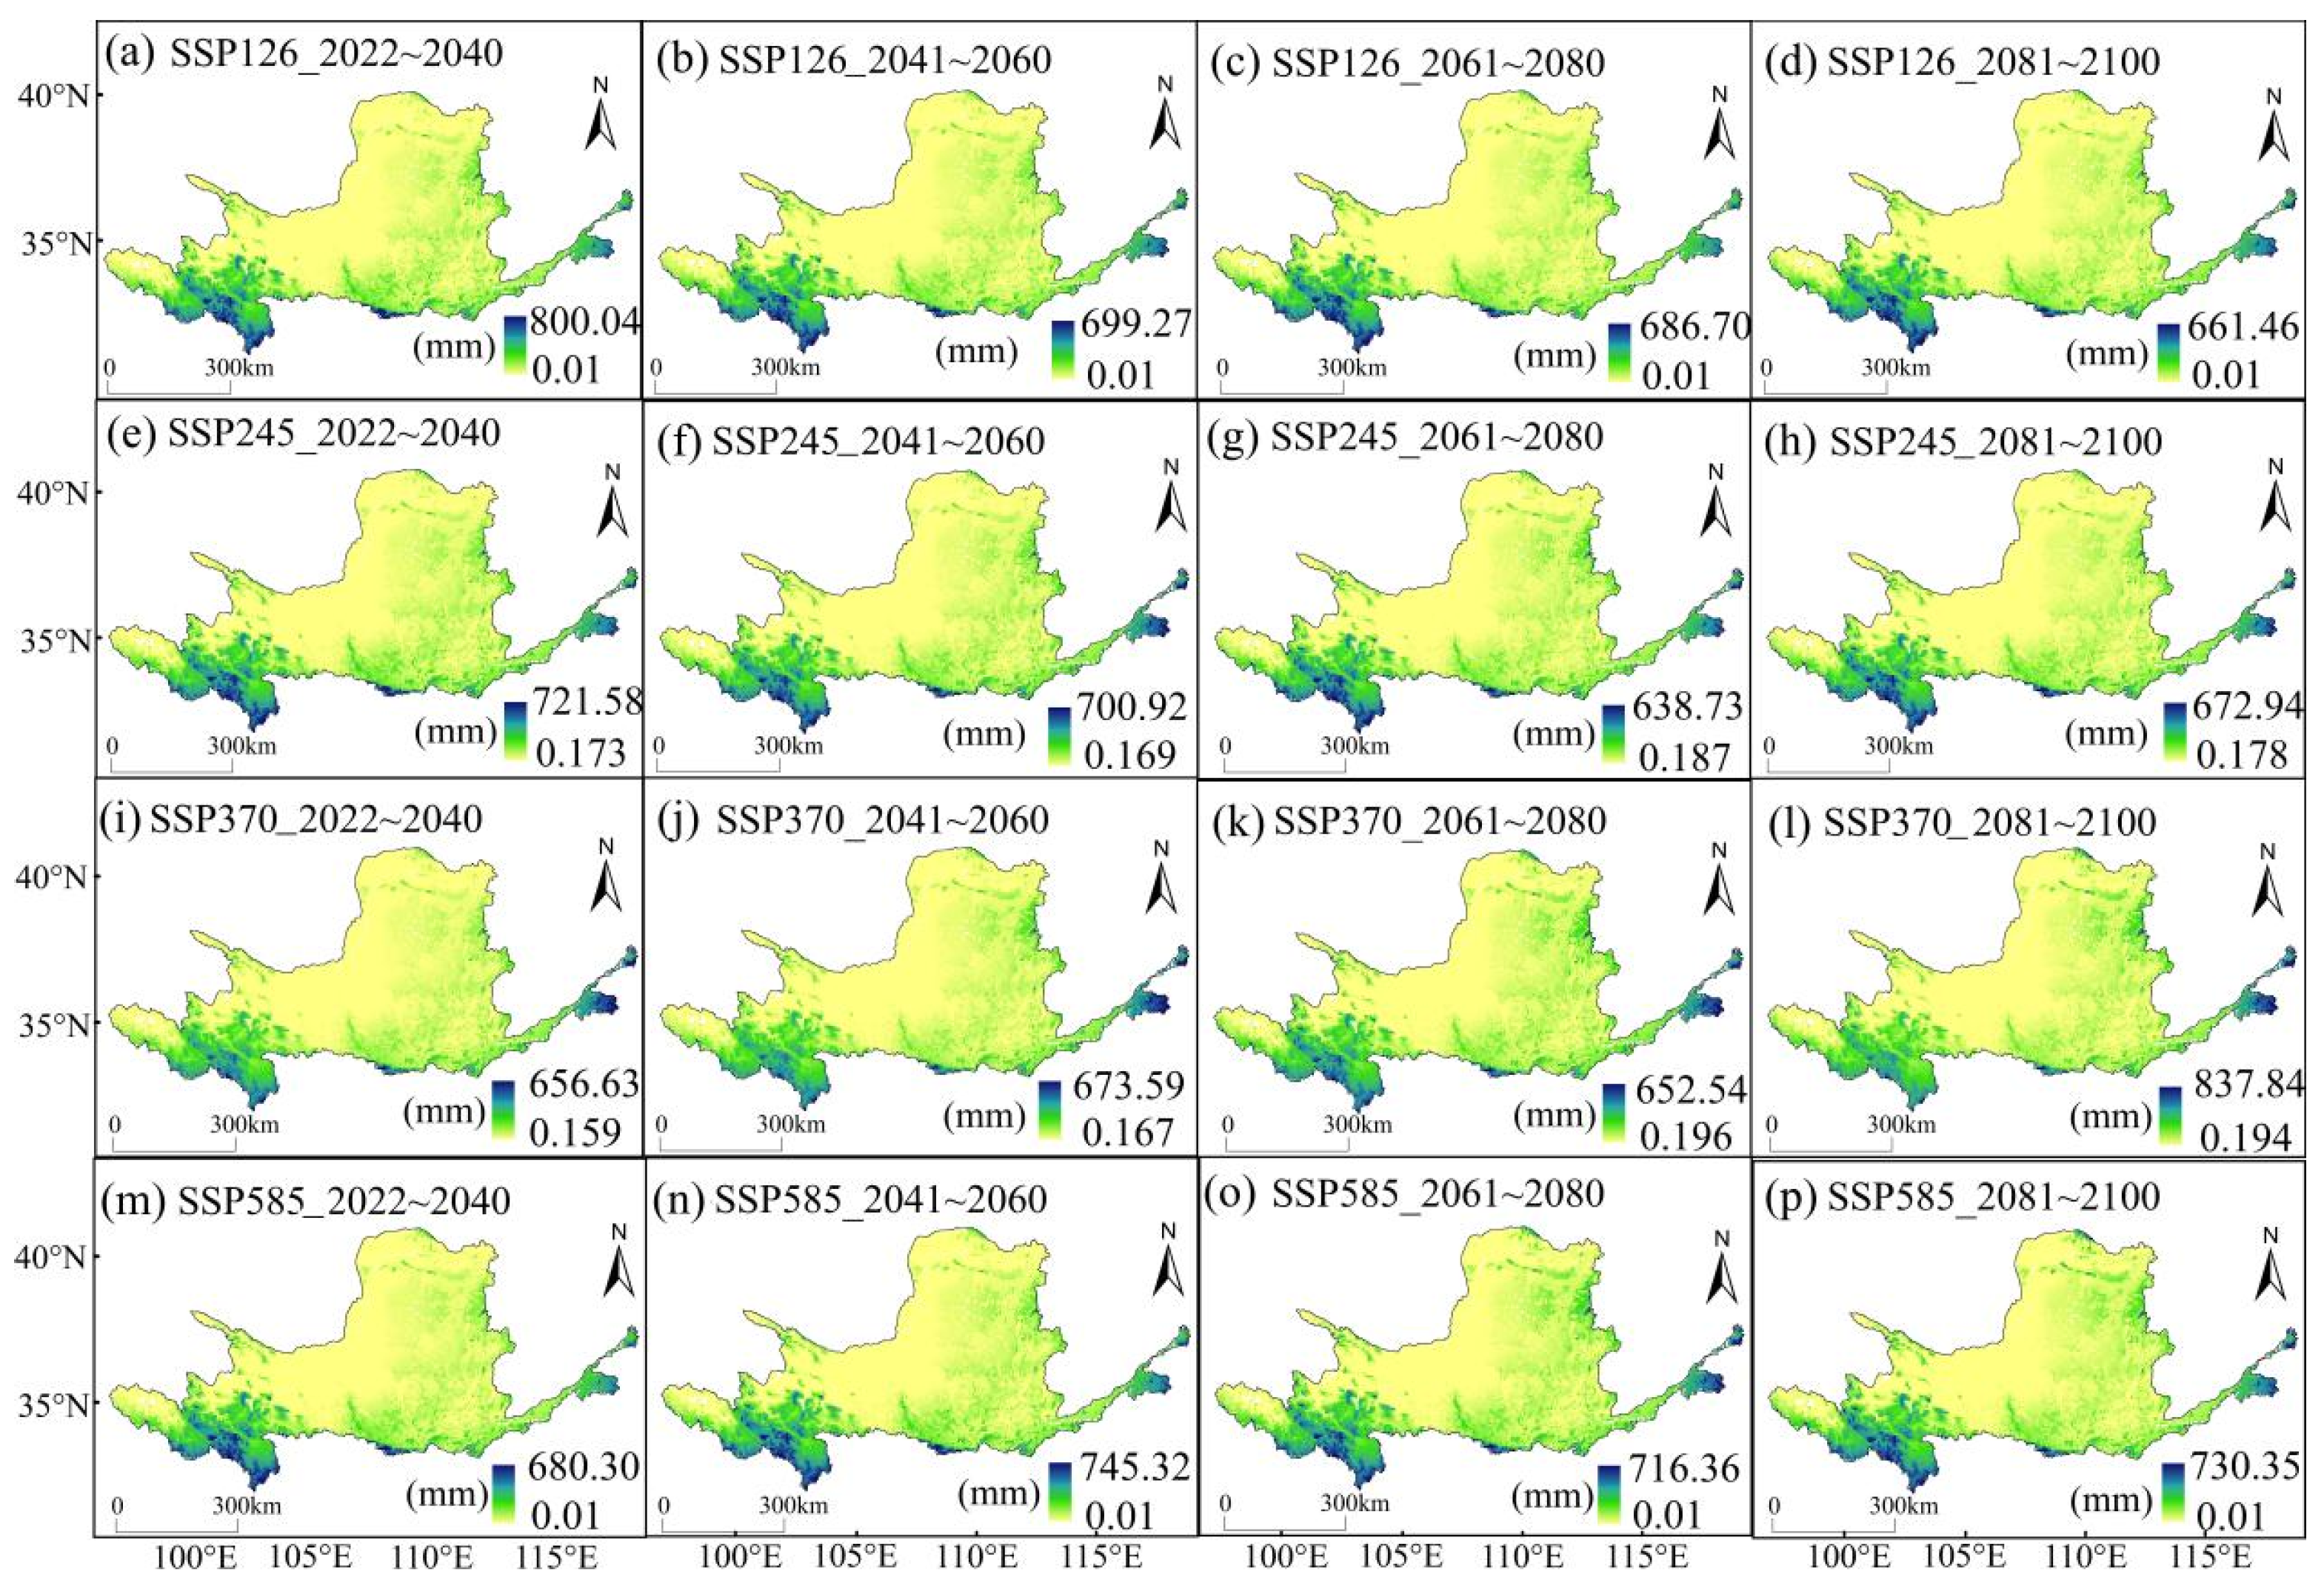
The predicted runoff depth patterns for the four climate scenarios exhibit a roughly similar distribution. The maximum runoff depth fluctuates between 661.46 and 837.84 mm (Figure 10e,l). The upper Hetao Plain and regions such as Xiaheyuan to Shizuishan and Shizuishan to Toudaoguai are comparatively arid, with almost zero runoff depth. In the SSP126 and SSP245 climate scenarios, the Yellow River source area has a higher runoff level, with areas exceeding 600 mm more extensive than in the SSP370 and SSP585 scenarios. However, in the SSP370 and SSP585 scenarios, the peak runoff depth is larger, and the distribution is more uniform. Downstream Weihe and the Yiluohe exhibit slightly higher runoff depths compared to other regions. Overall, the runoff prediction model is generally consistent with the historical runoff distribution in the Yellow River basin.
From 2022 to 2040, in the SSP126 and SSP245 climate scenarios, the runoff depth in the midstream of the Yellow River is higher than in the SSP370 and SSP585 scenarios, with the maximum value occurring in the SSP126 scenario at 800.04 mm (Figure 10a,e,i,m). This gap gradually narrows from 2041 to 2060 and 2061 to 2080. However, in the SSP370 and SSP585 scenarios, the runoff depth in the Yellow River source area remains lower than in the SSP126 and SSP245 scenarios. This may be attributed to the more intensive human activities and higher concentrations of carbon dioxide emissions in the SSP370 and SSP585 scenarios, resulting in significant changes in the upstream vegetation cover and underlying surfaces, subsequently affecting runoff depth (Figure 10b,f,j,n). From 2081 to 2100, the differences among the four climate scenarios are most pronounced in the Yellow River source area, with the lowest runoff depth in the SSP370 scenario.

3.3. Spatial Distribution of Runoff Change Rates under Future Climate Models

From 2022 to 2040, the spatial distributions of the runoff change rates for SSP245 and SSP370 are similar. In the Qinhe and Longmen areas, annual runoff shows an upward trend with rates ranging from 6.00 to 8.61 mm/a (Figure 11e,i). From 2041 to 2060, in all four climate scenarios, there is almost no change in the runoff depth in the northern part of the Yellow River basin. This is due to the water scarcity in the region, resulting in extreme arid conditions. Only under the SSP585 climate scenario, the annual runoff in the source area exhibits a significant upward trend (Figure 11b,f,j,n). From 2061 to 2080, the annual runoff change rates in the source area show a significant increase in the SSP126 and SSP245 climate scenarios, while the midstream runoff decreases, with rates ranging from 4.52 to 11.39 mm/a. In contrast, under the SSP370 and SSP585 climate scenarios, runoff depth decreases in the source area with a slope of −5.67 to −2.39 mm/a, while there is an increasing trend in the midstream with a slope of 16.04 to 21.43 mm/a (Figure 11c,g,k,o). From 2081 to 2100, the runoff change rates vary significantly among the four climate scenarios. Under the SSP126 climate scenario, rivers like Jinghe and Fenhe show an increasing trend in runoff, while in most parts of the Yellow River basin under the SSP245 climate scenario there is little to no significant change in the runoff depth, ranging from 0 to 0.26 mm/year. However, in the lower Yellow River area, runoff depth decreases, with a maximum rate of −9.65 mm/a. Under the SSP370 and SSP585 climate scenarios, annual runoff continues to increase in the source area, at rates greater than 0. There is a substantial difference in the midstream of the Yellow River basin. In the SSP370 climate scenario, the runoff depth decreases at a rate of −18.10 mm/a, while under the SSP585 climate scenario, the runoff depth in the midstream increases at a rate of 9.84 mm/a.

4. Discussions

4.1. Vegetation Coverage and Runoff

This study, based on the PCA-MLR model, reveals significant spatial heterogeneity in the regression coefficients of the runoff’s influencing factors at the pixel level in the Yellow River basin. Different regions in the Yellow River basin exhibit varying mechanisms by which runoff is influenced by changes in the vegetation coverage. These findings align with those of Yang et al. (2022) [20], who argue that the response of runoff to vegetation changes and the magnitude of vegetation coverage’s impact on basin water yield vary significantly across different hydroecological zones. Even within the same hydrological region, there are pronounced differences among the different experimental basins. For instance, in the upper reaches and source areas of the Yellow River, vegetation coverage coefficients can be both positive and negative. This variation is attributed to the rich diversity of vegetation types in the source area, including coniferous forests, broad-leaved forests, shrublands, and herbaceous plants, all of which have distinct effects on basin runoff. For example, a 10% change in the coniferous forest vegetation coverage can lead to an approximately 40 mm change in annual basin runoff. In contrast, broad-leaved forests and shrublands or herbaceous plants under the same conditions only result in changes of 25 mm and 10 mm, respectively [21]. These differences are a major reason for the substantial variability in vegetation coverage regression coefficients in the source area. In regions where vegetation coverage coefficients approach 0, these areas are typically more arid due to insufficient precipitation and higher temperatures. Vegetation water requirements are not met, limiting plant growth and resulting in even scarcer regional runoff. This aligns with the findings of Sun et al. (2011) [22], which emphasize the complexity of runoff generation and the varying impact factors affecting runoff depth in different regions of the Yellow River basin, characterized by substantial spatial heterogeneity. The Yellow River basin has shown a consistent trend of declining runoff over the years. Indiscriminate afforestation may exacerbate the tension in regional water resources. Therefore, this study suggests that afforestation projects like those carried out in the Yellow River basin should be tailored to specific regional conditions. For instance, in arid regions in the northwest, drought-resistant vegetation like grasslands and windbreak shrubs should be prioritized [23]. In areas with relatively abundant water resources in the south, converting high-altitude, steep-sloped farmlands into forests can enhance regional water retention and soil conservation capabilities, thereby positively influencing basin runoff levels [24].

4.2. Runoff Prediction under Future Climate Models

Previous studies have predominantly relied on basic data models for simulations. Yalcin (2023) [25] utilized GCMs data in conjunction with the distributed hydrological model SWAT (soil and water analysis tool) and reported that, under the Delta downscaling scenario, future runoff is expected to decrease, with a 12.79% increase by 2080. In contrast, this study suggests that from 2020 to 2040, except for SSP245, the Yellow River source area runoff exhibits a decreasing trend in SSP126, SSP370, and SSP585. While this is broadly consistent with the former study, the extent of the reduction differs. This variation may be attributed to the use of different models, as the previous study employed a distributed hydrological model, whereas this study used regression models. Furthermore, the application of different climate scenarios could also introduce variations. Zhou et al. (2023) [26] adopted the VIC (Variable Infiltration Capacity Model) to partition the Yellow River basin into grids and simulate large-scale hydrological processes. Their results closely matched the spatial distribution of actual runoff, with a mean relative error of −7.9% between calculated runoff and observed values, consistent with the conclusions of this study. Future runoff in the Yellow River basin displays an increasing trend from the northwest to the southeast. Nevertheless, the VIC model did not account for the influence of human activities on basin hydrology. In contrast, this study considered the spatial and temporal changes in runoff under various future climate scenarios and incorporated human activities into the analysis, making it more comprehensive and innovative in comparison. On the basis of the above research, traditional hydrological models have their limitations in forecasting runoff changes over a large area in the Yellow River basin. This study holds an advantage in simulating future runoff changes, and its findings are in line with those of distributed hydrological models [27,28,29,30,31]. The factors affecting runoff considered in this study are quite extensive, encompassing climate, vegetation, soil elements, and more. The developed regression model for the Yellow River basin’s runoff demonstrates good simulation performance, allowing for pixel-level simulations of runoff’s temporal and spatial changes using future climate models, combining precision with broad applicability.

4.3. Limitation

In the context of changing environment, this study studied vegetation change and runoff change in the Yellow River basin. Although certain accomplishments and conclusions have been achieved, there are still shortcomings in the study, and further research is needed in future work.
Large-scale studies based on remote sensing images and other spatial data are still limited by the low spatial and temporal resolution of data and the limited number of meteorological stations, which will inevitably lead to errors and affect the accuracy of the research. The consideration of the impact of human activities on the vegetation coverage of the watershed is biased toward general projects, such as returning farmland to forest and returning grazing land to grassland. However, the specific aspects of human activities, such as agricultural technological progress and urban expansion, are not considered in the classification, and further detailed studies are needed on vegetation coverage in the future.
There are uncertainties in the simulation of temperature, precipitation, soil temperature, soil moisture, and vegetation coverage in the downscaling treatment of CMIP6 climate model by delta, and there are still some gaps in time and space of many years and in the measured conditions. In follow-up work, the selection of the downscaling models, as well as parameter adjustment and deviation correction, needs to be considered and evaluated more comprehensively.

5. Conclusions

In this study, a PCA-MLR model was employed to establish a pixel-level runoff depth prediction model for the Yellow River basin. The primary influencing factors used in this model were runoff and vegetation coverage data from 1982 to 2012. The model’s accuracy was evaluated, and it was used to predict and analyze the trends in runoff depth in the Yellow River basin under future climates by incorporating a downscaled CMIP6 climate model data, which underwent precision processing. Under different climate scenarios, the Yellow River basin’s runoff generally exhibited an increasing trend into the future. The northwestern and midstream areas of the Yellow River basin are expected to remain relatively dry and water scarce, with lower runoff levels. In the SSP370 scenario, the source area’s runoff shows a more pronounced decrease, while under the SSP585 climate scenario, the source area experiences the most significant increase in runoff depth. It is important to note that there are uncertainties associated with the downscaling of CMIP6 climate models, and discrepancies in simulated data for variables such as temperature, precipitation, soil temperature, soil moisture, and vegetation coverage when compared to observed data. These uncertainties, both in time and space, persist for several years. In future work, the selection of downscaling models, parameter adjustments, bias corrections, and other factors should be more comprehensively considered and evaluated to enhance the overall accuracy of the climate model downscaled data.

Supplementary Materials

The following supporting information can be downloaded at: https://www.mdpi.com/article/10.3390/w16111537/s1, Figure S1: Specific location of the pixel; Table S1: Basic information about the pixel.

Author Contributions

S.J. and X.L. are the main instructors of this study. L.X. is the main author of this study, responsible for data processing, paper writing and drawing. H.M. help with raw data and processing methods. All authors have read and agreed to the published version of the manuscript.

Funding

This research was funded by the National Key Research Priorities Program of China (2023YFC3209303-04) (Shengqi Jian); Qian Kehe Zhicheng [2023] Yiban 206 (Jian Shengqi).

Data Availability Statement

All data and materials used in this manuscript are freely available and comply with field standards. The data presented in this study are available upon request from the corresponding author.

Conflicts of Interest

Author Li Xinan was employed by the company Guizhou Water & Power Survey-Design Institute Co., Ltd. The remaining authors declare that the research was conducted in the absence of any commercial or financial relationships that could be construed as a potential conflict of interest.

References

  1. Hu, Y.; Zhou, Y.; Wang, Y.; Lu, F.; Xiao, W.; Hou, B.; Yu, Y.; Liu, J.; Xue, W. Impacts of Precipitation Type Variations on Runoff Changes in the Source Regions of the Yangtze and Yellow River Basins in the Past 40 Years. Water 2022, 14, 4115. [Google Scholar] [CrossRef]
  2. Chen, L.; Yang, M.; Liu, X.; Lu, X. Attribution and Sensitivity Analysis of Runoff Variation in the Yellow River Basin under Climate Change. Sustainability 2022, 14, 14981. [Google Scholar] [CrossRef]
  3. Zhuang, X.; Fan, Y.; Li, Y.; Wu, C. Evaluation climate change impacts on Water Resources over the Upper Reach of the Yellow River Basin. Water Resour. Manag. 2023, 37, 2875–2889. [Google Scholar] [CrossRef]
  4. Wang, S.; Fu, B.J.; Piao, S.L.; Lü, Y.H.; Ciais, P.; Feng, X.M.; Wang, Y.F. Reduced sediment transport in the Yellow River due to anthropogenic changes. Nat. Geosci. 2016, 9, 38–41. [Google Scholar] [CrossRef]
  5. Li, C.; Zhang, Y.; Shen, Y.; Yu, Q. Decadal water storage decrease driven by vegetation changes in the Yellow River Basin. Sci. Bull. 2020, 65, 1859–1861. [Google Scholar] [CrossRef] [PubMed]
  6. Liu, J.; Luo, M.; Liu, T.; Bao, A.M.; Feng, X.W.; Chen, X. Local Climate Change and the Impacts on Hydrological Processes in an Arid Alpine Catchment in Karakoram. Water 2017, 9, 344. [Google Scholar] [CrossRef]
  7. Zhao, A.; Zhang, A.; Liu, J.; Feng, L.; Zhao, Y. Assessing the effects of drought and “Grain for Green” Program on vegetation dynamics in China’s Loess Plateau from 2000 to 2014. Catena 2019, 175, 446–455. [Google Scholar] [CrossRef]
  8. Jiang, L.; Liu, Y. Response of Runoff-Sediment System to Vegetation Variation in the Yellow River Basin in the Last 20 Years. Land 2023, 12, 428. [Google Scholar] [CrossRef]
  9. Guo, X.; Du, M.; Gao, P.; Tian, P.; Zhao, G.; Mu, X.; Geng, R. Response of runoff-sediment processes to vegetation restoration patterns under different rainfall regimes on the Loess Plateau. Catena 2024, 234, 107647. [Google Scholar] [CrossRef]
  10. Huang, T.; Liu, Y.; Wu, Z.; Xiao, P.; Wang, J.; Sun, P. Quantitative analysis of runoff alteration based on the Budyko model with time-varying underlying surface parameters for the Wuding River Basin, Loess Plateau. Ecol. Indic. 2024, 158, 111377. [Google Scholar] [CrossRef]
  11. Liu, C.; Melack, J.; Tian, Y.; Huang, H.; Jiang, J.; Fu, X.; Zhang, Z. Detecting Land Degradation in Eastern China Grasslands with Time Series Segmentation and Residual Trend analysis (TSS-RESTREND) and GIMMS NDVI3g Data. Remote Sens. 2019, 11, 1014. [Google Scholar] [CrossRef]
  12. Muhury, N.; Apan, A.A.; Marasani, T.N.; Ayele, G.T. Modelling Floodplain Vegetation Response to Groundwater Variability Using the ArcSWAT Hydrological Model, MODIS NDVI Data, and Machine Learning. Land 2022, 11, 2154. [Google Scholar] [CrossRef]
  13. Wang, B.; Wang, H.; Jiao, X.; Huang, L.; Chen, H.; Guo, W. Runoff change in the Yellow River Basin of China from 1960 to 2020 and its driving factors. J. Arid Land 2023, 16, 168–194. [Google Scholar] [CrossRef]
  14. Li, L.; Peng, Q.; Wang, M.; Cao, Y.; Gu, X.; Cai, H. Quantitative analysis of vegetation drought propagation process and uncertainty in the Yellow River Basin. Agric. Water Manag. 2024, 295, 108775. [Google Scholar] [CrossRef]
  15. Wang, K.; Zhou, J.; Tan, M.L.; Lu, P.; Xue, Z.; Liu, M.; Wang, X. Impacts of vegetation restoration on soil erosion in the Yellow River Basin, China. Catena 2024, 234, 107547. [Google Scholar] [CrossRef]
  16. Bai, Y.; Zhu, Y.; Liu, Y.; Wang, S. Vegetation Greening and Its Response to a Warmer and Wetter Climate in the Yellow River Basin from 2000 to 2020. Remote Sens. 2024, 16, 790. [Google Scholar] [CrossRef]
  17. Bai, T.; Wang, X.S.; Han, P.F. Controls of groundwater-dependent vegetation coverage in the yellow river basin, china: Insights from interpretable machine learning. J. Hydrol. 2024, 631, 130747. [Google Scholar] [CrossRef]
  18. Jian, S.; Pei, Y.; Zhu, T.; Yu, X. Spatiotemporal change and attribution analysis of future runoff on the Yellow River basin of China. J. Hydrol. Reg. Stud. 2023, 49, 101494. [Google Scholar] [CrossRef]
  19. Jian, S.; Shi, S.; Cui, J.; Zhu, T.; Hu, C. Study on fractional vegetation cover dynamic in the Yellow River Basin, China from 1901 to 2100. Front. For. Glob. Change 2023, 6, 1157285. [Google Scholar] [CrossRef]
  20. Yang, L.; Zhao, G.; Tian, P.; Mu, X.; Tian, X.; Feng, J.; Bai, Y. Runoff changes in the major river basins of China and their responses to potential driving forces. J. Hydrol. 2022, 607, 127536. [Google Scholar] [CrossRef]
  21. Guo, B.; Wei, C.; Yu, Y.; Liu, Y.; Li, J.; Meng, C.; Cai, Y. The dominant influencing factors of desertification changes in the source region of Yellow River: Climate change or human activity? Sci. Total Environ. 2022, 813, 152512. [Google Scholar] [CrossRef]
  22. Sun, Z.; Chang, N.-B.; Opp, C.; Hennig, T. Evaluation of ecological restoration through vegetation patterns in the lower Tarim River, China with MODIS NDVI data. Ecol. Inform. 2011, 6, 156–163. [Google Scholar] [CrossRef]
  23. Fu, B.; Burgher, I. Riparian vegetation NDVI dynamics and its relationship with climate, surface water and groundwater. J. Arid Environ. 2015, 113, 59–68. [Google Scholar] [CrossRef]
  24. Yang, J.; Wang, T.; Yang, D.; Yang, Y. Insights into runoff changes in the source region of Yellow River under frozen ground degradation. J. Hydrol. 2023, 617, 128892. [Google Scholar] [CrossRef]
  25. Yalcin, E. Quantifying climate change impacts on hydropower production under CMIP6 multi-model ensemble projections using SWAT model. Hydrol. Sci. J. 2023, 68, 1915–1936. [Google Scholar] [CrossRef]
  26. Zhou, J.; Lu, H.; Yang, K.; Jiang, R.; Yang, Y.; Wang, W.; Zhang, X. Projection of China’s future runoff based on the CMIP6 mid-high warming scenarios. Sci. China Earth Sci. 2023, 66, 528–546. [Google Scholar] [CrossRef]
  27. Li, L.; Hao, Z.-C.; Wang, J.H.; Wang, Z.H.; Yu, Z.B. Impact of future climate change on runoff in the head region of the Yellow River. J. Hydrol. Eng. 2008, 13, 347–354. [Google Scholar] [CrossRef]
  28. Li, L.; Shen, H.; Dai, S.; Xiao, J.; Shi, X. Response of runoff to climate change and its future tendency in the source region of Yellow River. J. Geogr. Sci. 2012, 22, 431–440. [Google Scholar] [CrossRef]
  29. Ji, G.; Lai, Z.; Xia, H.; Liu, H.; Wang, Z. Future runoff variation and flood disaster prediction of the yellow river basin based on CA-Markov and SWAT. Land 2021, 10, 421. [Google Scholar] [CrossRef]
  30. Jing, L.; Zhi, L.; Zhe, L. Analysis of spatiotemporal variations in land use on the Loess Plateau of China during 1986~2010. Environ. Earth Sci. 2016, 75, 25–32. [Google Scholar]
  31. Xie, M.; Ren, Z.; Li, Z.; Zhang, X.; Ma, X.; Li, P.; Shen, Z. Evolution of the precipitation–stream runoff relationship in different precipitation scenarios in the Yellow River Basin. Urban Clim. 2023, 51, 101609. [Google Scholar] [CrossRef]
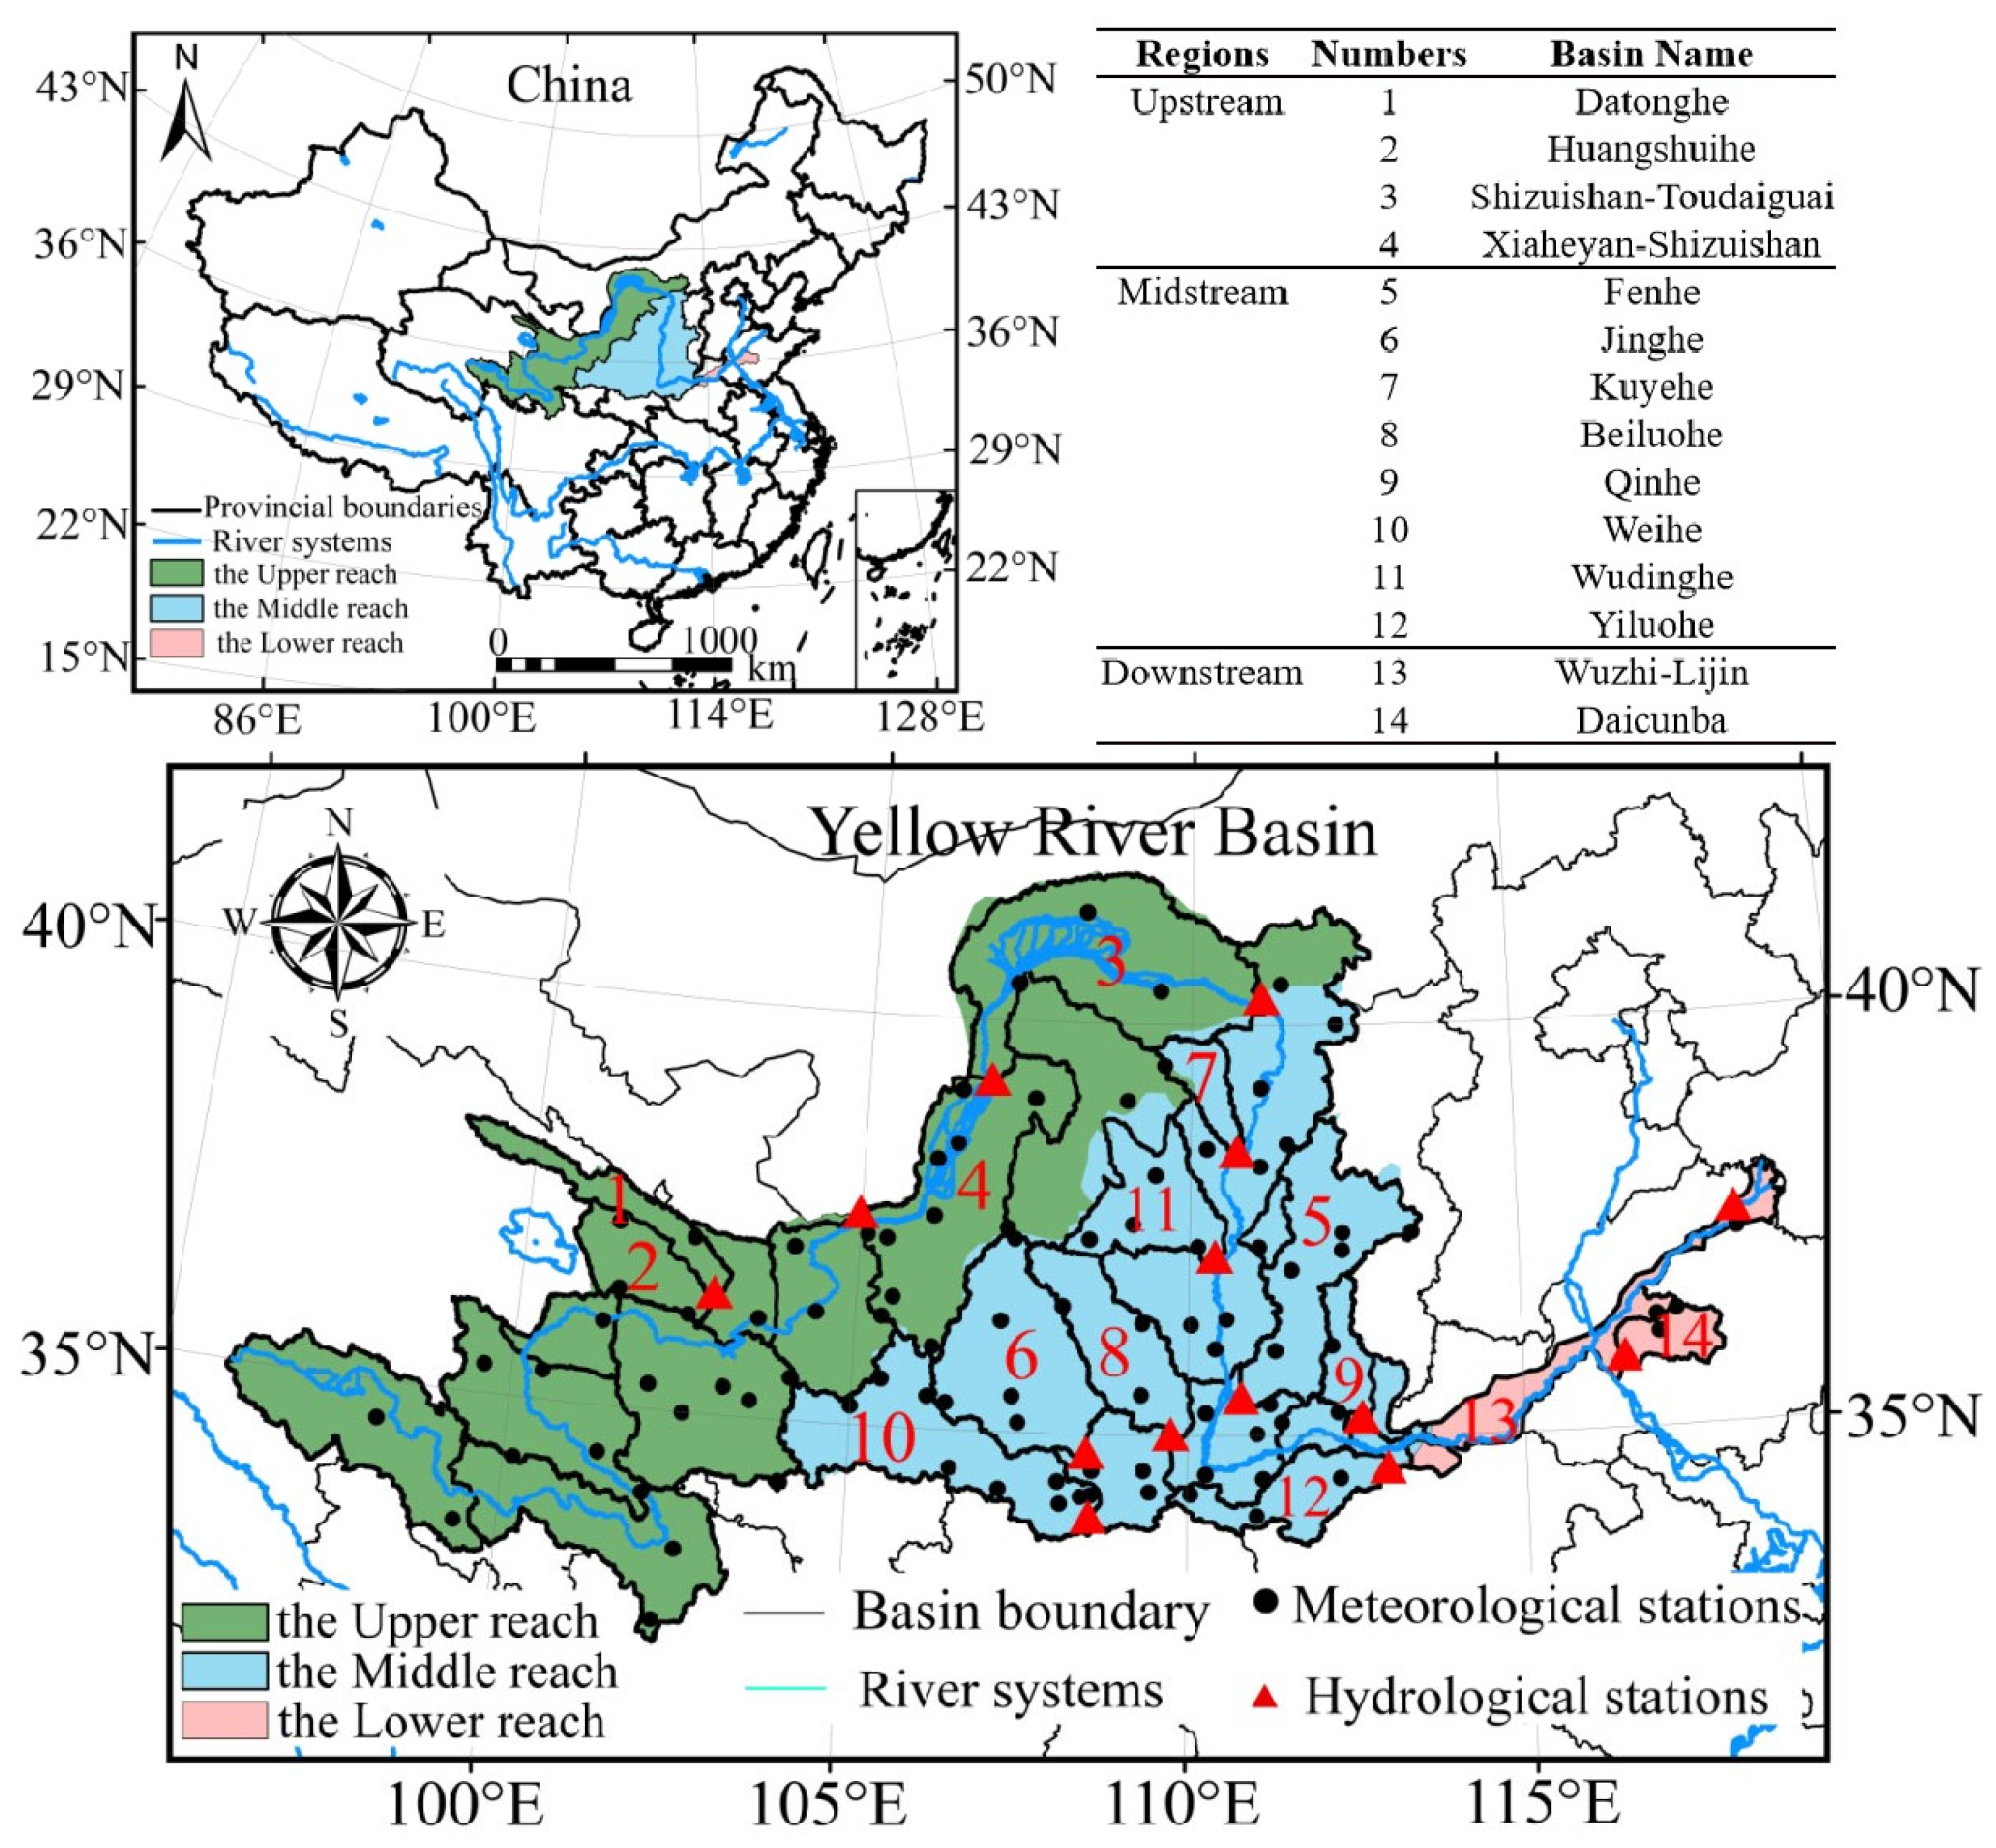
Figure 1. Study area.
Water 16 01537 g001
Figure 2. Schematic diagram of the basic steps for PCA-MLR model calculation. PCA (principle component analysis).
Water 16 01537 g002
Figure 3. The relative error distribution of the measured and predicted pixel runoff coefficient.
Water 16 01537 g003
Figure 4. Surface pixel correlation coefficient based on the PCA~MLR model: (a) partial regression coefficient μ1 of the independent variable FVC obtained through PCA-MLR model calculation; (b) partial regression coefficient μ2 of the independent variable precipitation; (c) partial regression coefficient μ3 of the independent variable temperature; (d) partial regression coefficient μ4 of the independent variable soil volumetric moisture content; (e) partial regression coefficient μ5 of the independent variable soil temperature; (f) constant term μ0.
Water 16 01537 g004
Figure 5. Frequency distribution of each partial regression coefficient: (a) constant term, μ0; (b) FVC coefficient, μ1; (c) precipitation coefficient, μ2; (d) temperature coefficient, μ3; (e) soil water content coefficient, μ4; (f) soil temperature coefficient, μ5, with interval distribution and the ratio of the number of pixels occupied.
Water 16 01537 g005
Figure 6. The predicted runoff depth distribution pattern in the Yellow River basin from 2000 to 2012 based on the PCA-MLR combined model. (am) indicates 2000–2012, respectively.
Water 16 01537 g006
Figure 7. Correlation test of the pixel-by-pixel regression model.
Water 16 01537 g007
Figure 8. Illustrates the spatial distribution of relative errors in simulated runoff coefficients. (am) indicates 2000–2012, respectively.
Water 16 01537 g008
Figure 9. Temporal variation trends of the runoff depths under the four future climate emission scenarios in the Yellow River basin.
Water 16 01537 g009
Figure 10. Spatial patterns of the runoff depths at different time periods under the four discharge scenarios in the Yellow River basin.
Water 16 01537 g010
Figure 11. Spatial pattern of the runoff depth change rate at different time periods in the Yellow River basin under four discharge scenarios.
Water 16 01537 g011
Table 1. The variance of the common factors.
FactorsInitialExtract
FVC (X1)10.939
Precipitation (X2)10.875
Air temperature (X3)10.954
Soil moisture (X4)10.851
Soil temperature (X5)10.955
Table 2. Results of the calculation of the three principal components for the years 1982 to 1999.
YearsF1F2F3YearsF1F2F3
1982−19.40141.78−48.991991−11.52103.52−34.52
1983−23.66161.63−56.701992−34.10217.55−77.60
1984−32.56203.58−71.951993−12.18103.80−34.52
1985−14.49113.17−37.951994−19.63147.06−50.61
1986−18.66134.99−46.651995−22.19158.52−54.73
1987−19.02141.69−49.011996−15.57107.98−40.85
1988−12.39105.79−35.031997−12.44111.98−37.59
1989−26.06177.04−62.441998−10.83108.07−36.13
1990−20.50150.41−51.971999−16.80136.72−47.28
Table 3. Sub-basins runoff coefficient calculation formula.
Sub-BasinsFormulaR2 and P
Datongheα = 0.142X1 + 0.22X2 + 0.022X3 + 0.013X4 − 0.036X5 − 0.272R2 = 0.88, P < 0.01
Huangshuiheα = 0.075X1 + 0.265X2 + 0.022X3 + 0.017X4 − 0.031X5 − 0.33R2 = 0.82, P < 0.01
Shizuishan–Toudaoguaiα = −0.094X1 + 0.132X2 + 0.006X3 + 0.004X4 − 0.005X5 − 0.01R2 = 0.73, P < 0.01
Xiaheyan–Shizuishanα = −0.035X1 + 0.034X2 + 0.005X3−0.002X4 − 0.008X5 + 0.073R2 = 0.72, P < 0.01
Fenheα = 0.289X1 + 0.205X2 − 0.009X3 + 0.005X4 − 0.006X5 + 0.011R2 = 0.83, P < 0.01
Jingheα = −0.196X1 + 0.025X2 − 0.044X3 + 0.0003X4 + 0.005X5 + 0.56R2 = 0.85, P < 0.01
Kuyeheα = 0.062X1 + 0.15X2 + 0.019X3 + 0.001X4 − 0.015X5 − 0.013R2 = 0.88, P < 0.01
Beiluoheα = −0.007X1 + 0.177X2 − 0.02X3 + 0.01X4 − 0.008X5 + 0.287R2 = 0.81, P < 0.01
Qinheα = 0.146X1 + 0.225X2 − 0.019X3 + 0.006X4 − 0.005X5 − 0.20R2 = 0.74, P < 0.05
Weiheα = −0.147X1 + 0.07X2 − 0.076X3 + 0.004X4 + 0.016X5 + 0.69R2 = 0.77, P < 0.05
Wudingheα = −0.093X1 + 0.201X2 + 0.035X3−0.002X4 − 0.047X5 − 0.387R2 = 0.82, P < 0.01
Yiluoheα = 0.201X1 + 0.172X2 − 0.083X3−0.01X4 + 0.005X5 + 0.797R2 = 0.79, P < 0.01
Wuzhi–Lijinα = 0.16X1 + 0.55X2 − 0.037X3 + 0.07X4 + 0.095X5 − 1.84R2 = 0.80, P < 0.01
Daicubaα = 0.217X1 + 0.739X2 − 0.033X3 + 0.127X4 + 0.15X5 − 3.537R2 = 0.83, P < 0.01
Disclaimer/Publisher’s Note: The statements, opinions and data contained in all publications are solely those of the individual author(s) and contributor(s) and not of MDPI and/or the editor(s). MDPI and/or the editor(s) disclaim responsibility for any injury to people or property resulting from any ideas, methods, instructions or products referred to in the content.