Article

Study on the Characteristics and Evolution Laws of Seepage Damage in Red Mud Tailings Dams

1
College of Civil Engineering, Taiyuan University of Technology, Taiyuan 030024, China
2
State Key Laboratory of Geomechanics and Geotechnical Engineering, Institute of Rock and Soil Mechanics, Chinese Academy of Sciences, Wuhan 430071, China
3
College of Construction Engineering, Jilin University, Jilin 130021, China
*
Authors to whom correspondence should be addressed.
Water 2024, 16(11), 1487; https://doi.org/10.3390/w16111487
Submission received: 29 March 2024 / Revised: 9 May 2024 / Accepted: 16 May 2024 / Published: 23 May 2024
(This article belongs to the Special Issue Research Advances in Hydraulic Structure and Geotechnical Engineering)

Abstract

:
Seepage damage is a significant factor leading to red mud tailings dam failures. Laboratory tests on seepage damage were conducted to investigate the damage characteristics and distribution laws of red mud tailings dams, including soil pressure, infiltration line, pore water pressure, dam displacement, and crack evolution. The findings revealed the seepage damage mechanisms of red mud slopes, offering insights for the safe operation and seepage damage prevention of red mud tailings dams. The results showed that the higher the water level is in the red mud tailings dam, the higher position the infiltration line is when it reaches the slope face. At the highest infiltration line point of the slope surface, the increase of pore water pressure is the highest and the change of horizontal soil pressure is the highest. Consequently, increased pore water pressure leads to decreased effective stress and shear strength, increasing the susceptibility to damage. Cracks resulting from seepage damage predominantly form below the infiltration line; the higher the infiltration lines is on the slope surface, the higher the position of the main crack formations is. The displacement of the dam body primarily occurs due to the continuous expansion of major cracks; the higher the infiltration lines are on the slope surface, the larger the displacement of the dam body is.

1. Introduction

Red mud is an industrial solid waste discharged during the extraction of alumina in the aluminum industry, and approximately 0.8 to 1.5 tons of red mud is discharged for every ton of alumina production [1]. Red mud is strongly alkaline and easily pollutes the surrounding groundwater. With increasing environmental requirements, the comprehensive utilization of red mud has become a hotspot in many scholars’ research, including the extraction of valuable metals (such as iron, aluminum, titanium, rare earths, etc.) from red mud, the production of building materials since red mud contains high levels of calcium, silica, and other minerals, the preparation of environmentally friendly materials based on good adsorption properties, etc. [2,3,4]. Although there have been many studies on red mud utilization, few technologies can be used to realize the industrial application of red mud because of its strong alkalinity [5,6]. A large amount of red mud must be landfilled in natural gullies to form red mud tailings ponds due to the lack of effective methods for the large-scale comprehensive utilization of red mud [7]. With the continuous production of alumina, the number of red mud tailings ponds continue to increase. Red mud tailings ponds are a potentially hazardous source of man-made mudslides with high potential energy, and there is a risk of dam failure, which can easily cause irreversible damage to the surrounding environment [8,9].
Seepage damage is one of the main causes of red mud or other tailings pond failure [10,11], and has become a challenge in the field of tailings pond safety [12]. Seepage damage is mainly manifested as infiltration deformation, tailings material property changes, permeability enhancement, cohesion and effective stress reduction, and shear strength weakening, causing pipe surges when the seepage develops to a certain degree [13]. Currently, the laboratory modeling studies of tailings ponds mainly focus on the dam failure of flood overtopping, including the change rule of the infiltration line before dam failure, dam failure characteristics, prediction of the impact range after dam failure, the flow velocity characteristics of the dam failure sand, and the spread law of water waves in the mudslides, etc. [14,15,16,17,18,19]. Although a lot of research results have been achieved in the experimental study of flood overtopping dam failure in tailings ponds, there is insufficient research on macroscopic and multiscale experiments of seepage damage in tailings ponds. In terms of numerical simulation, many scholars use numerical simulation software to quantitatively analyze the seepage law and characteristics of tailings ponds based on existing theories [20,21,22,23]. However, numerical models have too many idealized assumptions, and the analysis results are often doubtful.
Currently, red mud tailings ponds are mainly dominated by dry stockpiles [24,25], and dry red mud stockpiles are also faced with the possibility of seepage damage and flood overtopping damage. However, there are few studies focusing on the failure of red mud dry stockpiled tailings ponds. The red mud tailings pond always has a large area; the whole water content continuously increases under the action of cyclic rainfall for many years, and the long-term infiltration will raise the water level line in the tailings pond [26]. Red mud is a type of fine-grained tailing, with large specific surface area, large pore ratio, poor permeability, and rapid reduction of strength after encountering water [27,28,29]. The infiltration line of red mud tailings ponds is relatively higher compared with that of coarse-grained tailings ponds, which is prone to causing a large head pressure on the slope of tailings dams, and is highly susceptible to infiltration damage. There have been many developments about the seepage problems of tailings dams; however, notable distinctions exist between red mud tailings dams and other tailings dams, with research rarely being undertaken in the seepage failure mechanisms of red mud tailings dams. Therefore, it is of great significance to investigate the seepage damage characteristics and evolution laws of red mud tailing dams.
The failure characteristics and distribution patterns of the red mud dam body, including soil pressure, infiltration lines, pore water pressure, dam displacement, and crack evolution were investigated based on a model test. The seepage failure mechanisms of red mud slopes are revealed, and the failure patterns and laws are summarized, which offers guidelines for the protection and management of red mud tailings dam slopes.

2. Materials and Method

2.1. Materials

The red mud used in the test was taken from a red mud tailings pond, and the red mud was Bayer red mud. The main chemical composition and physical property indexes of red mud are shown in Table 1 and Table 2, respectively. The Na2O content in red mud is high, which is the main reason for the alkalinity of red mud, and the pH value of red mud leaching solution is generally above 12. Red mud in the landfill comprises chalky soil; the pore ratio is more than 1, with a high plastic limit and liquid limit, poor permeability, and strong alkalinity.

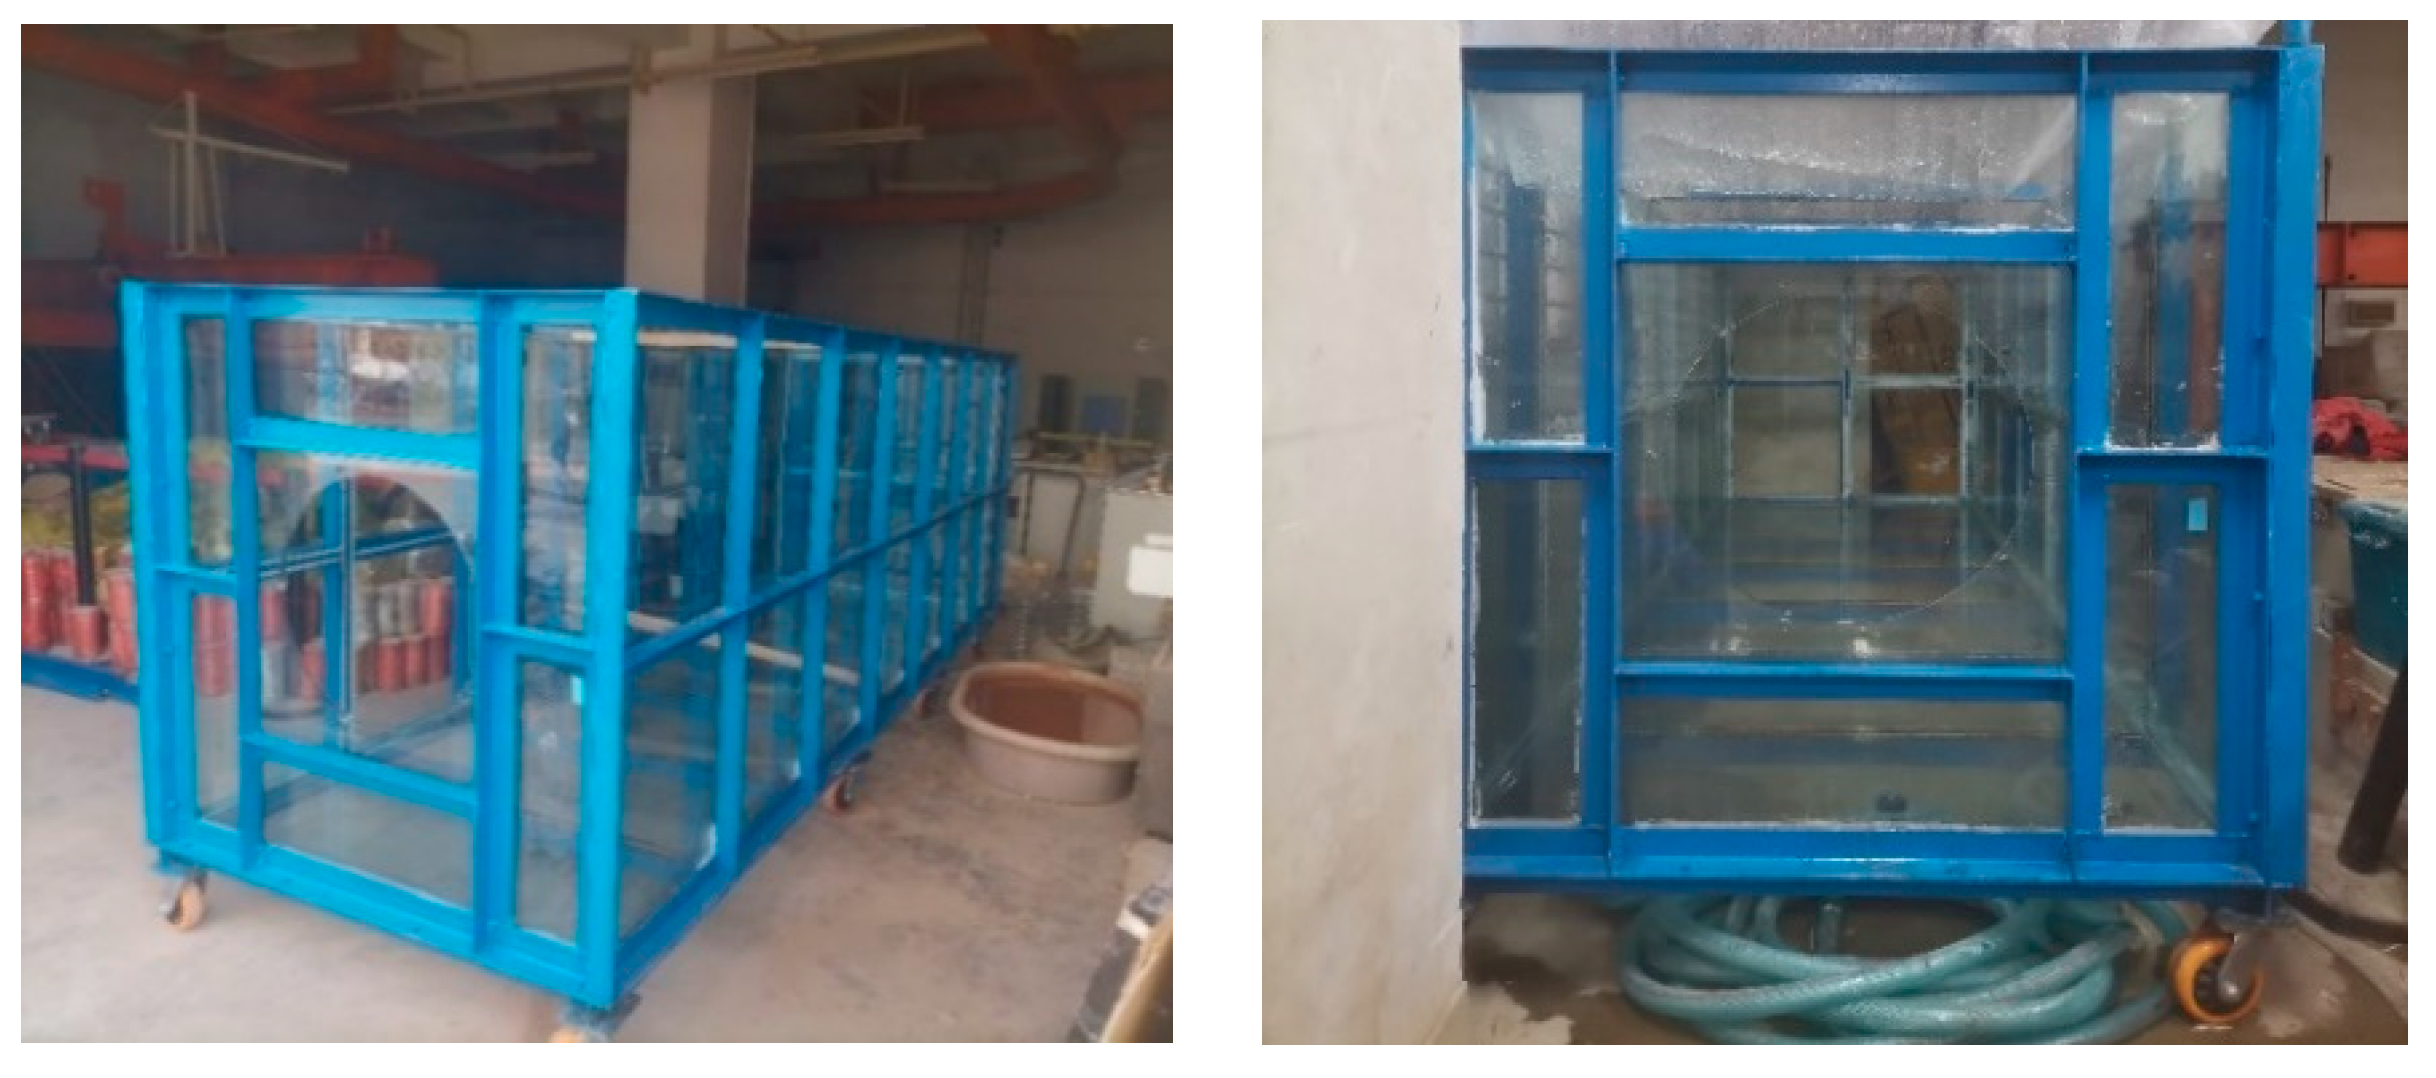
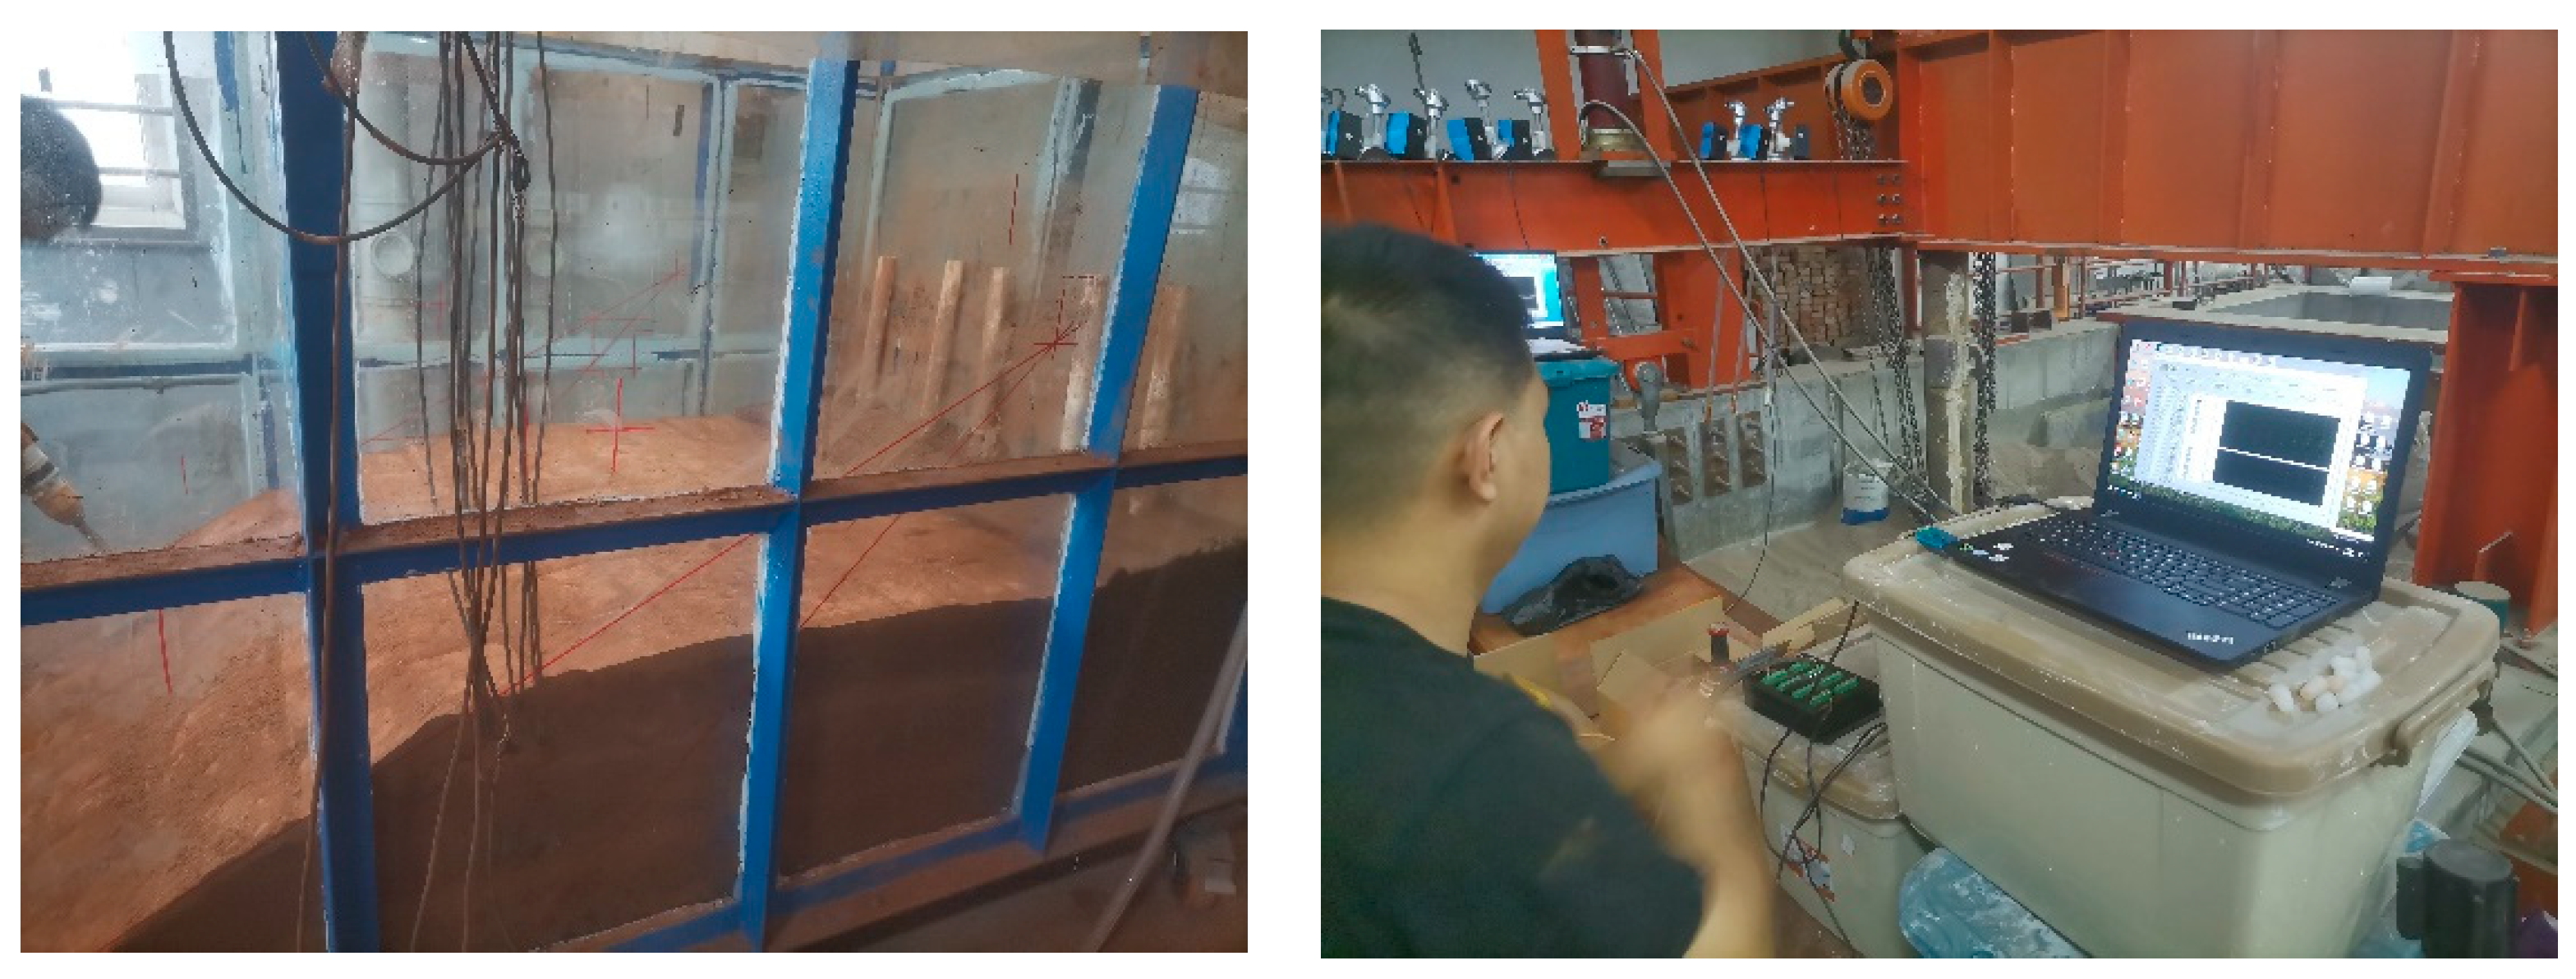
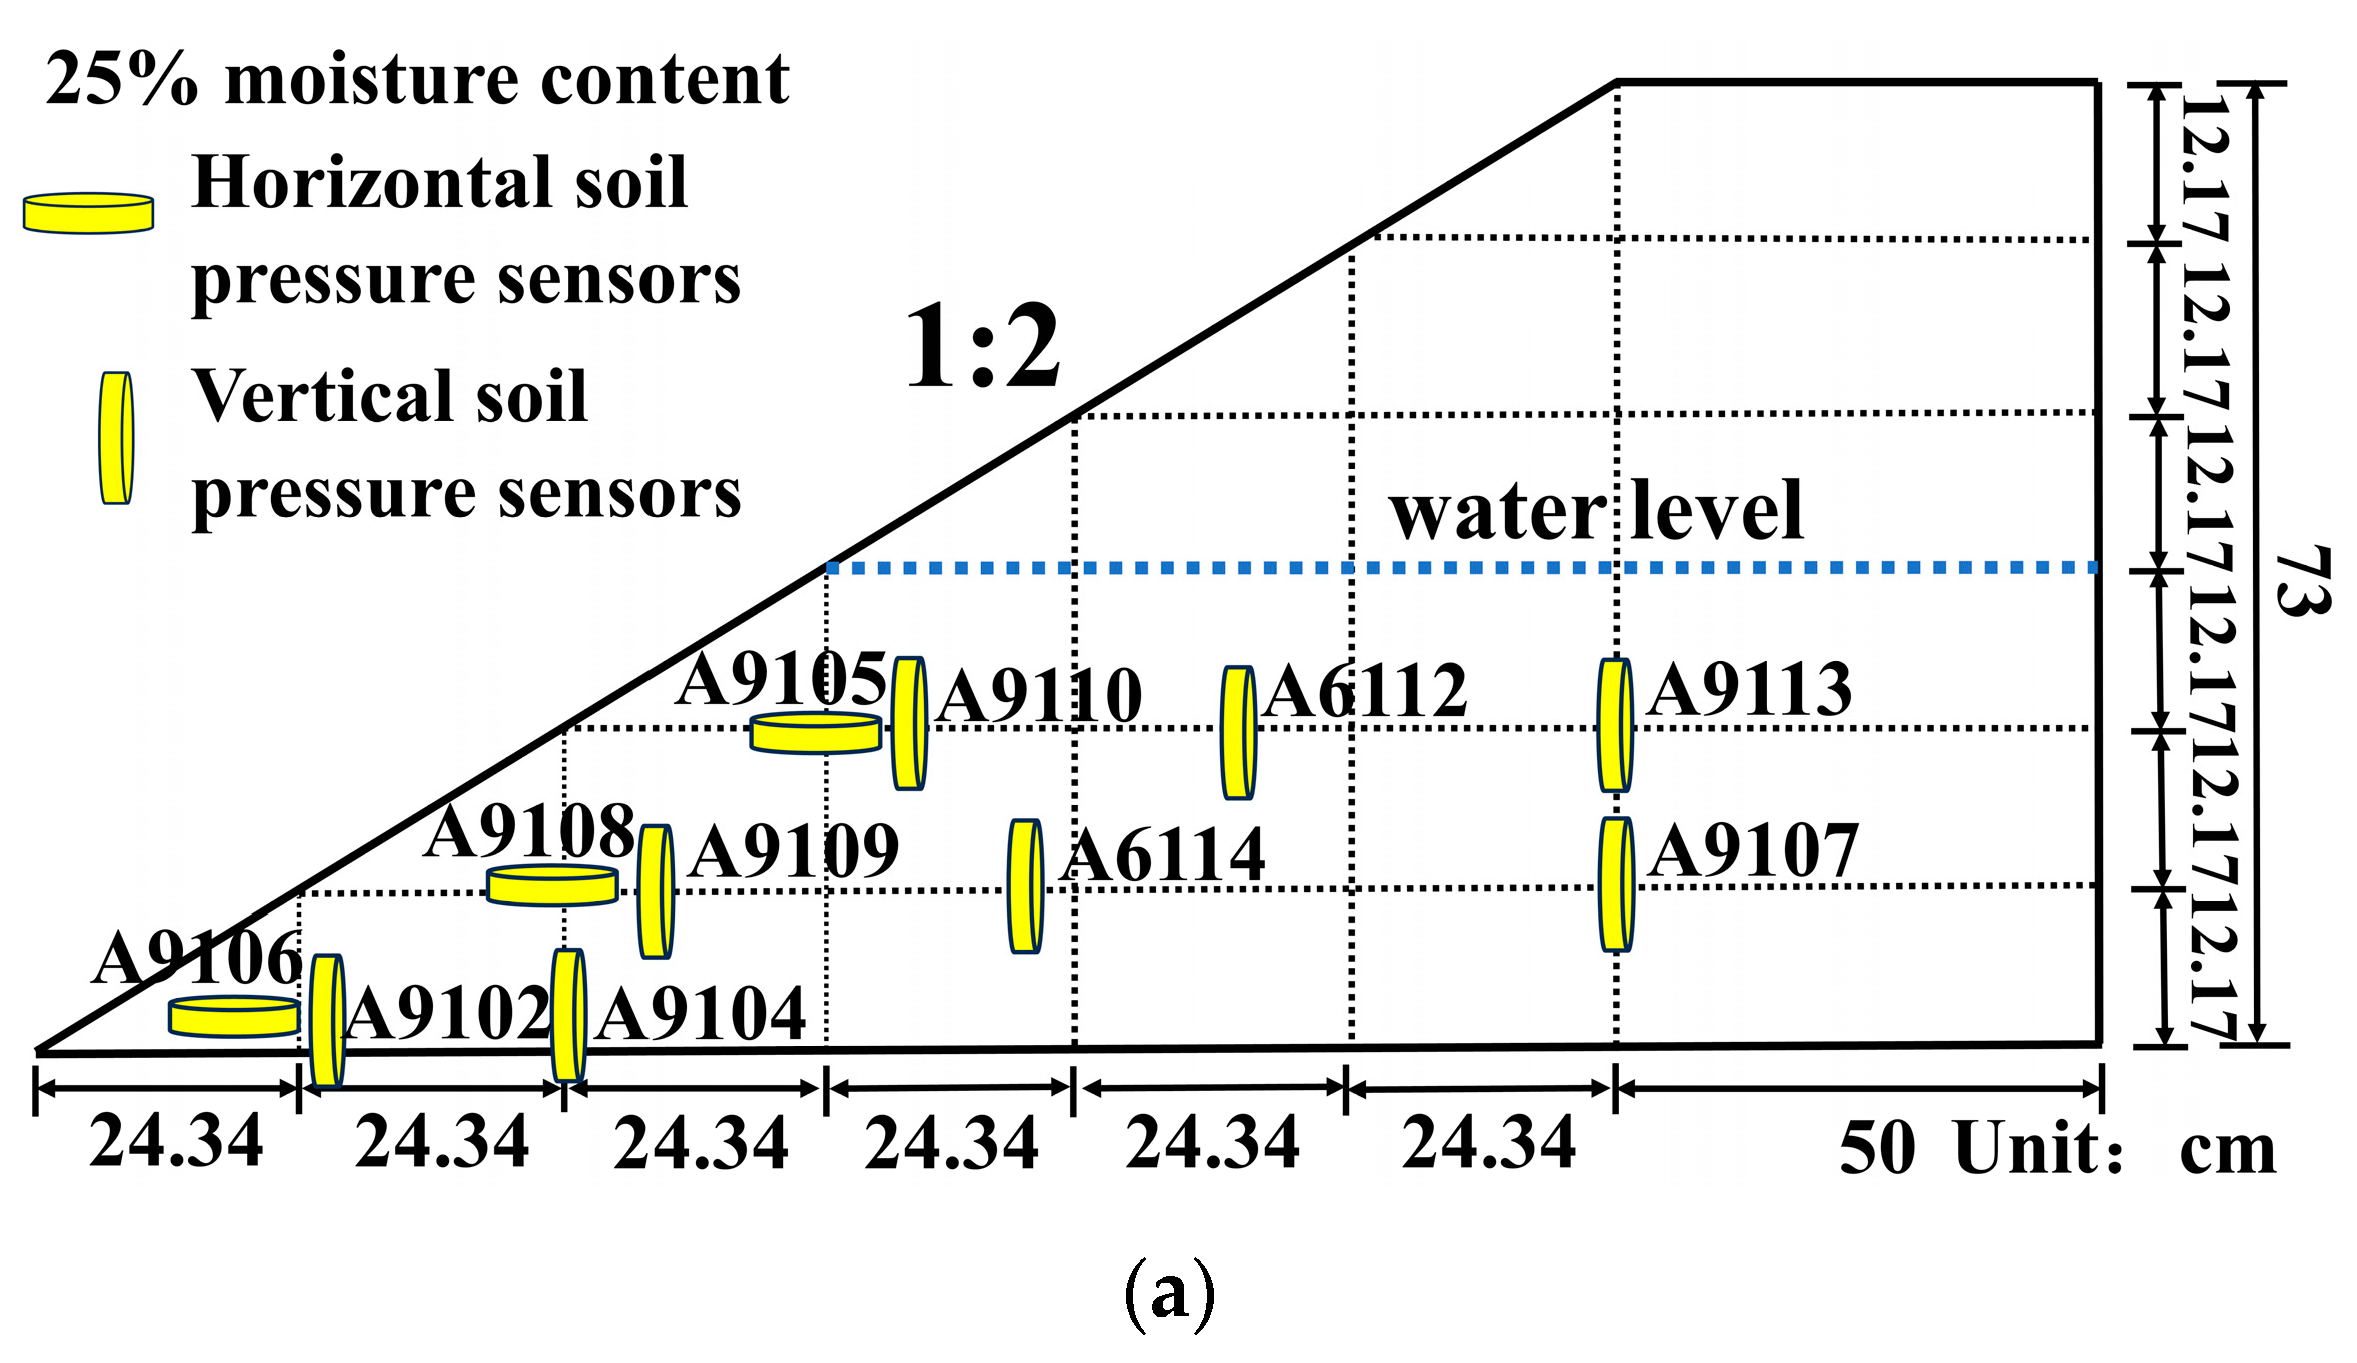
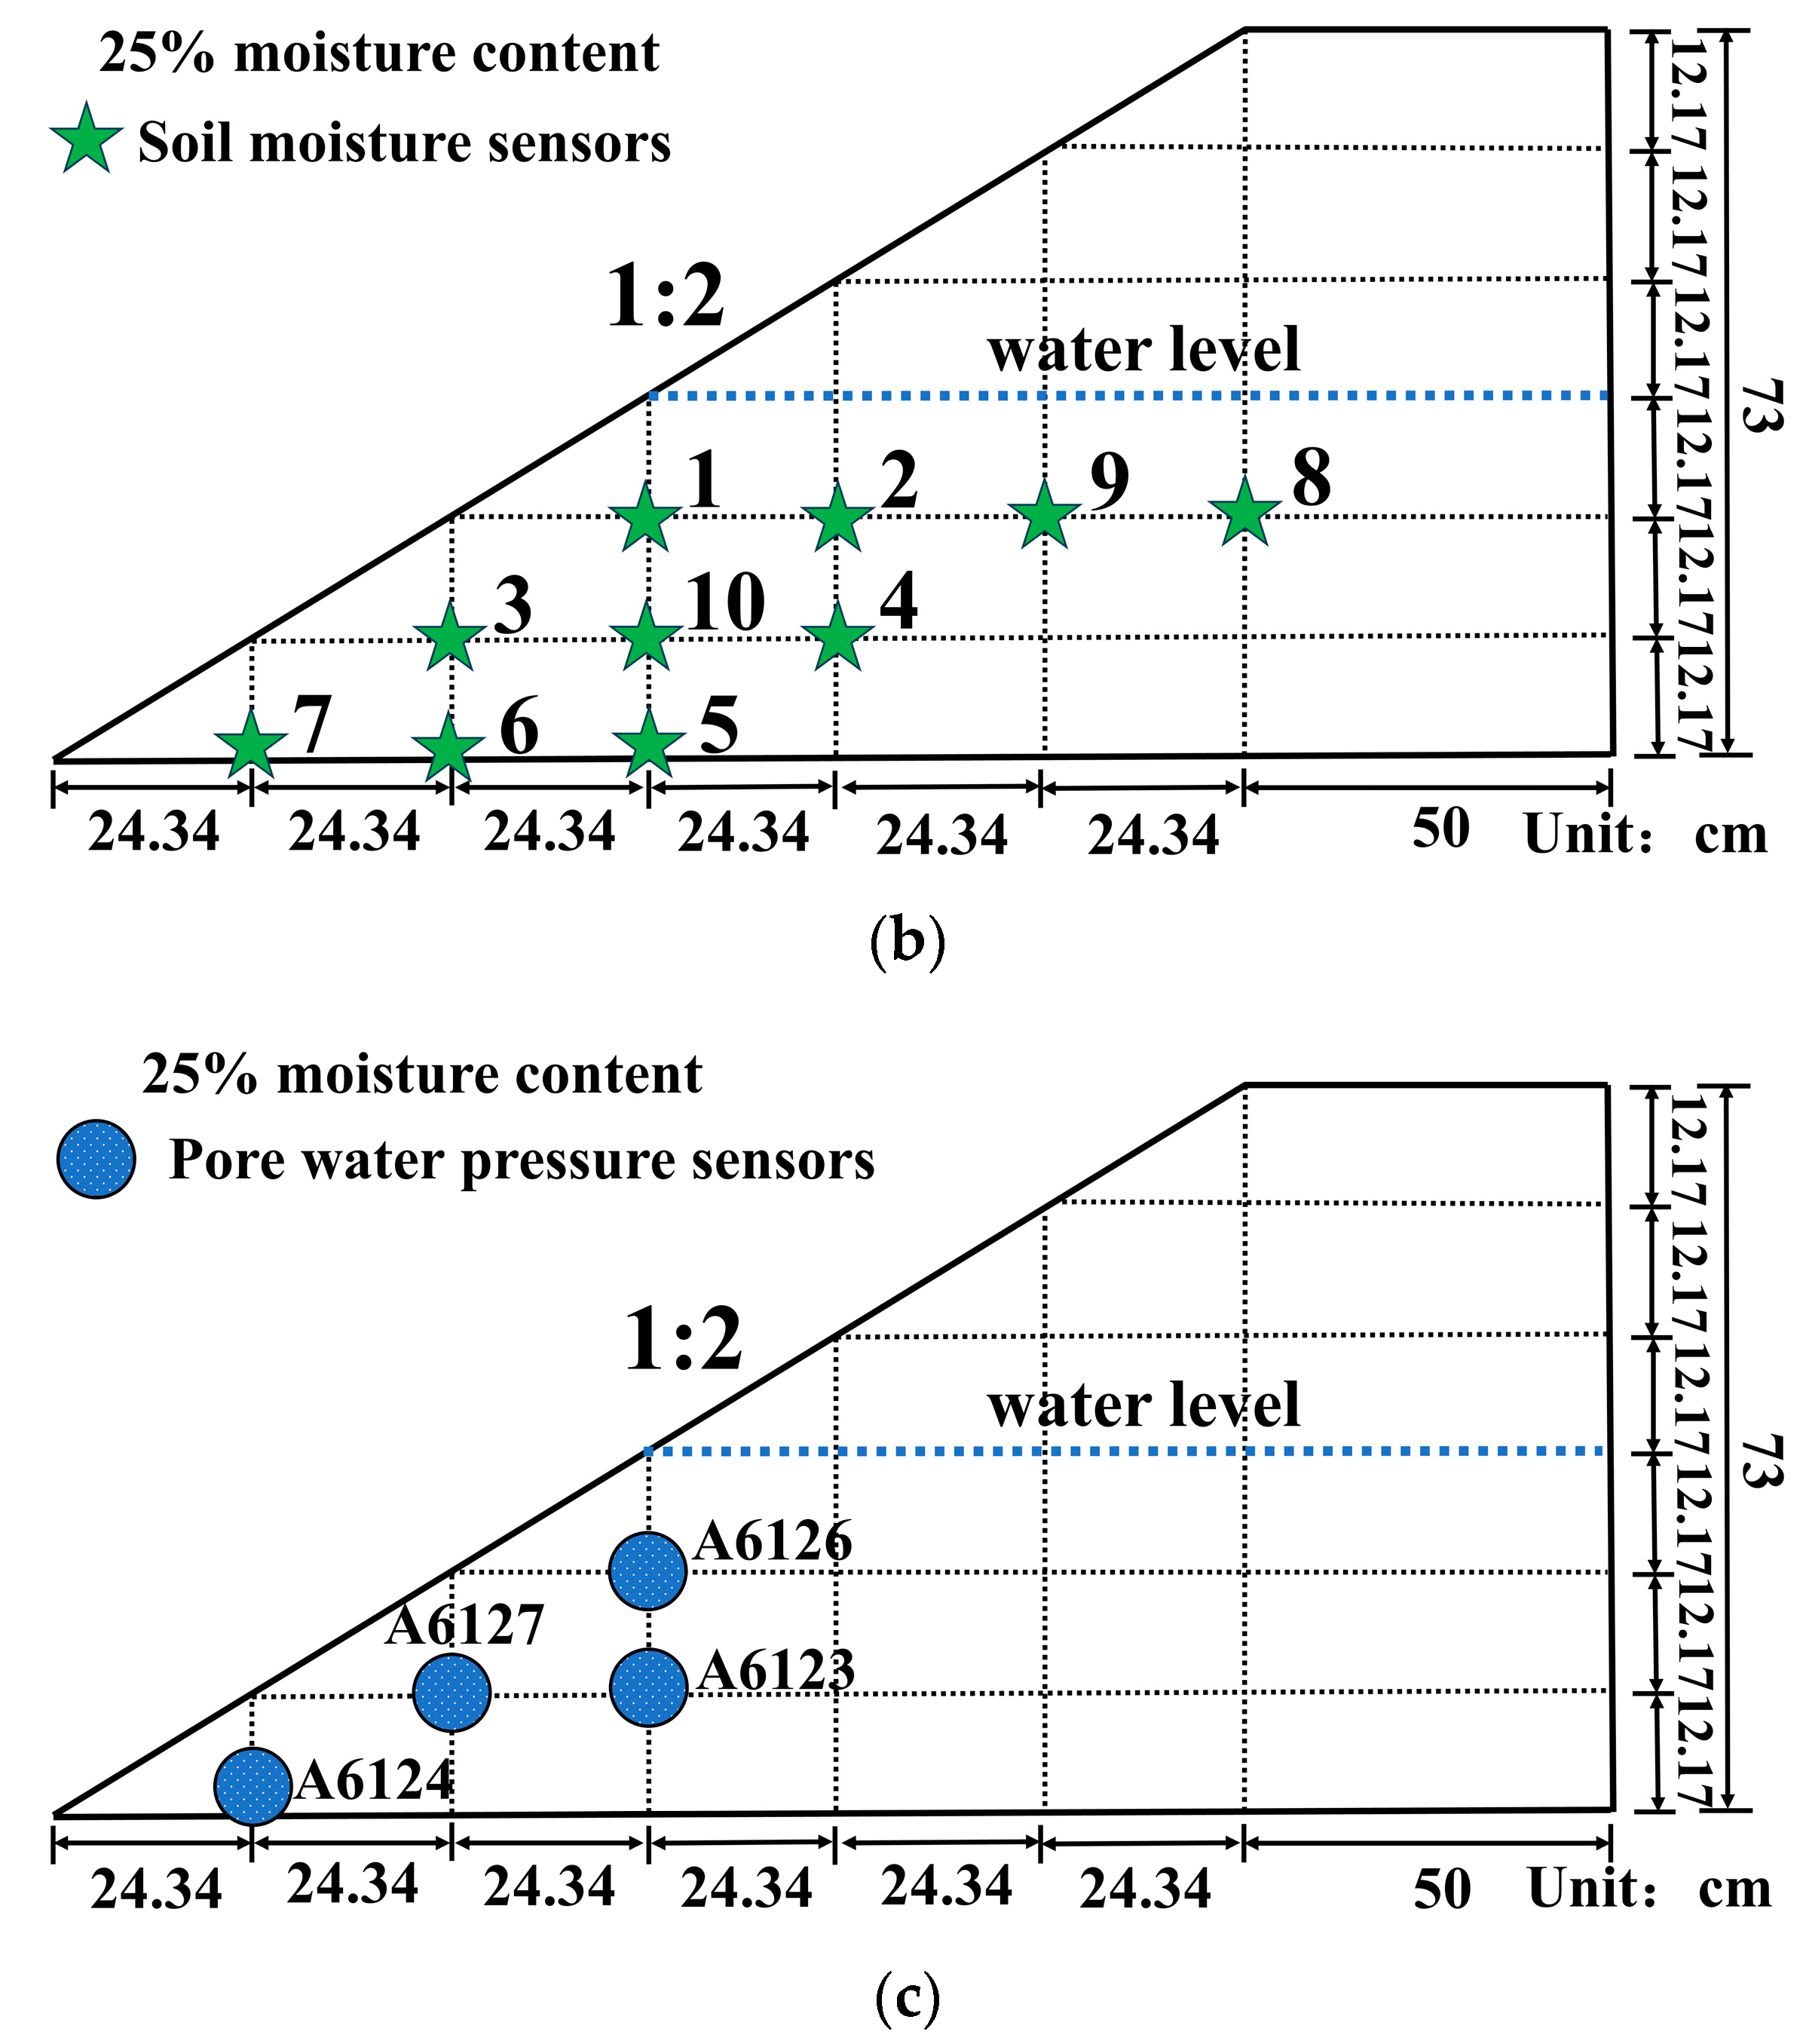
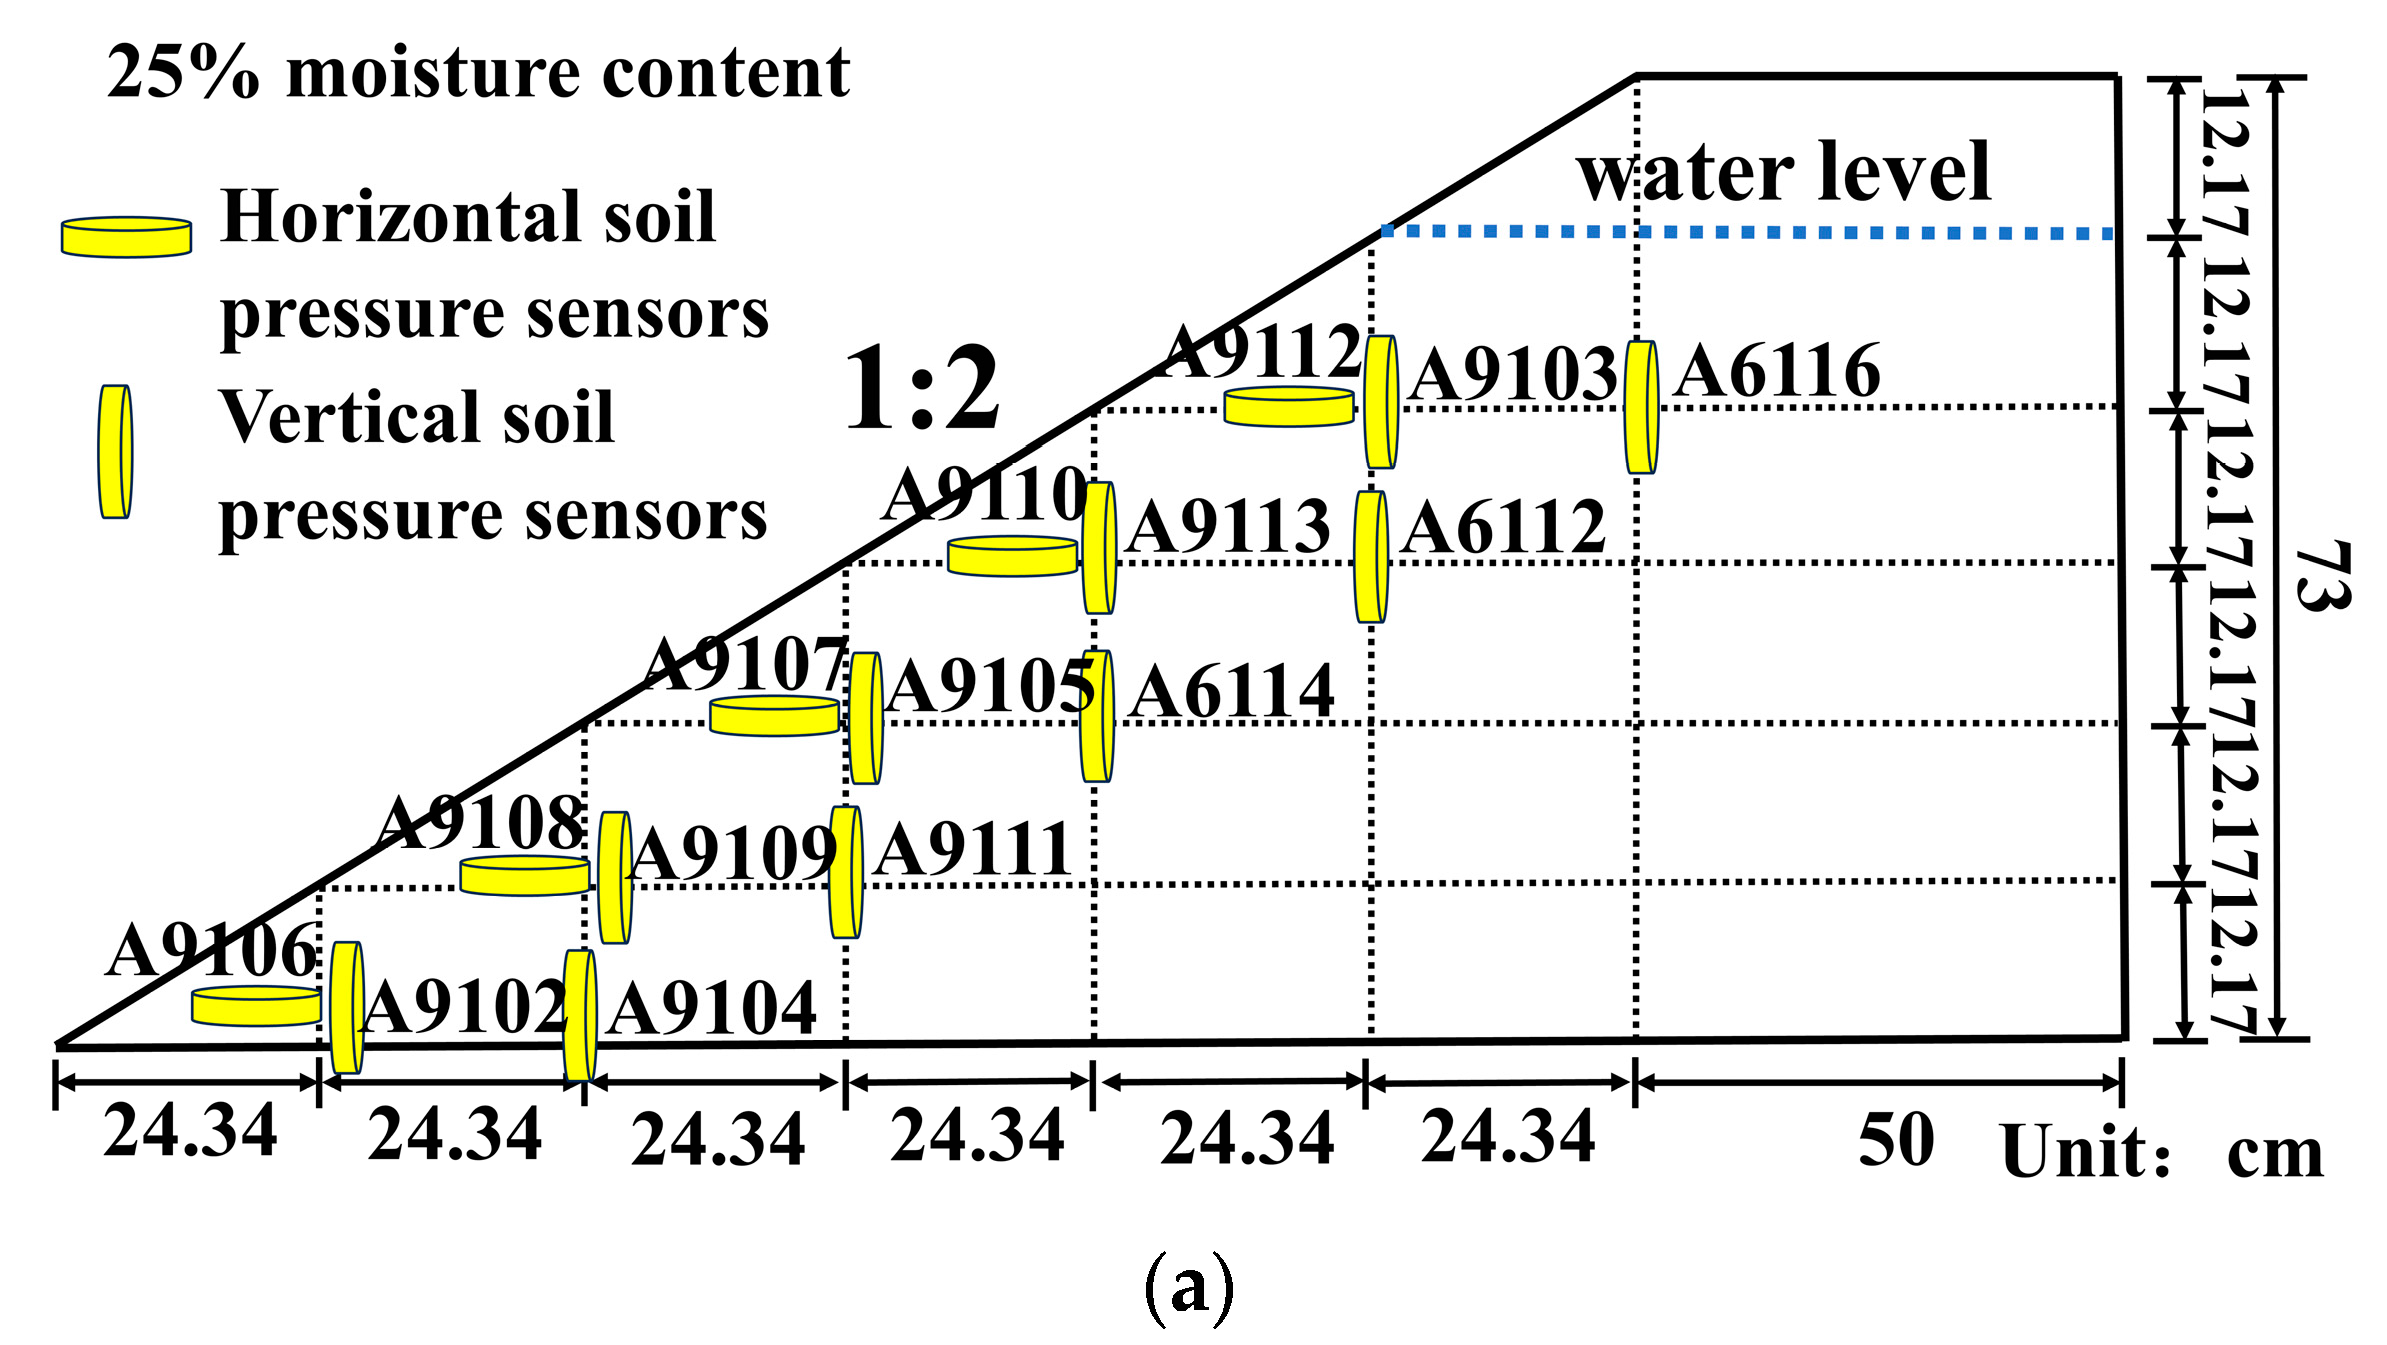
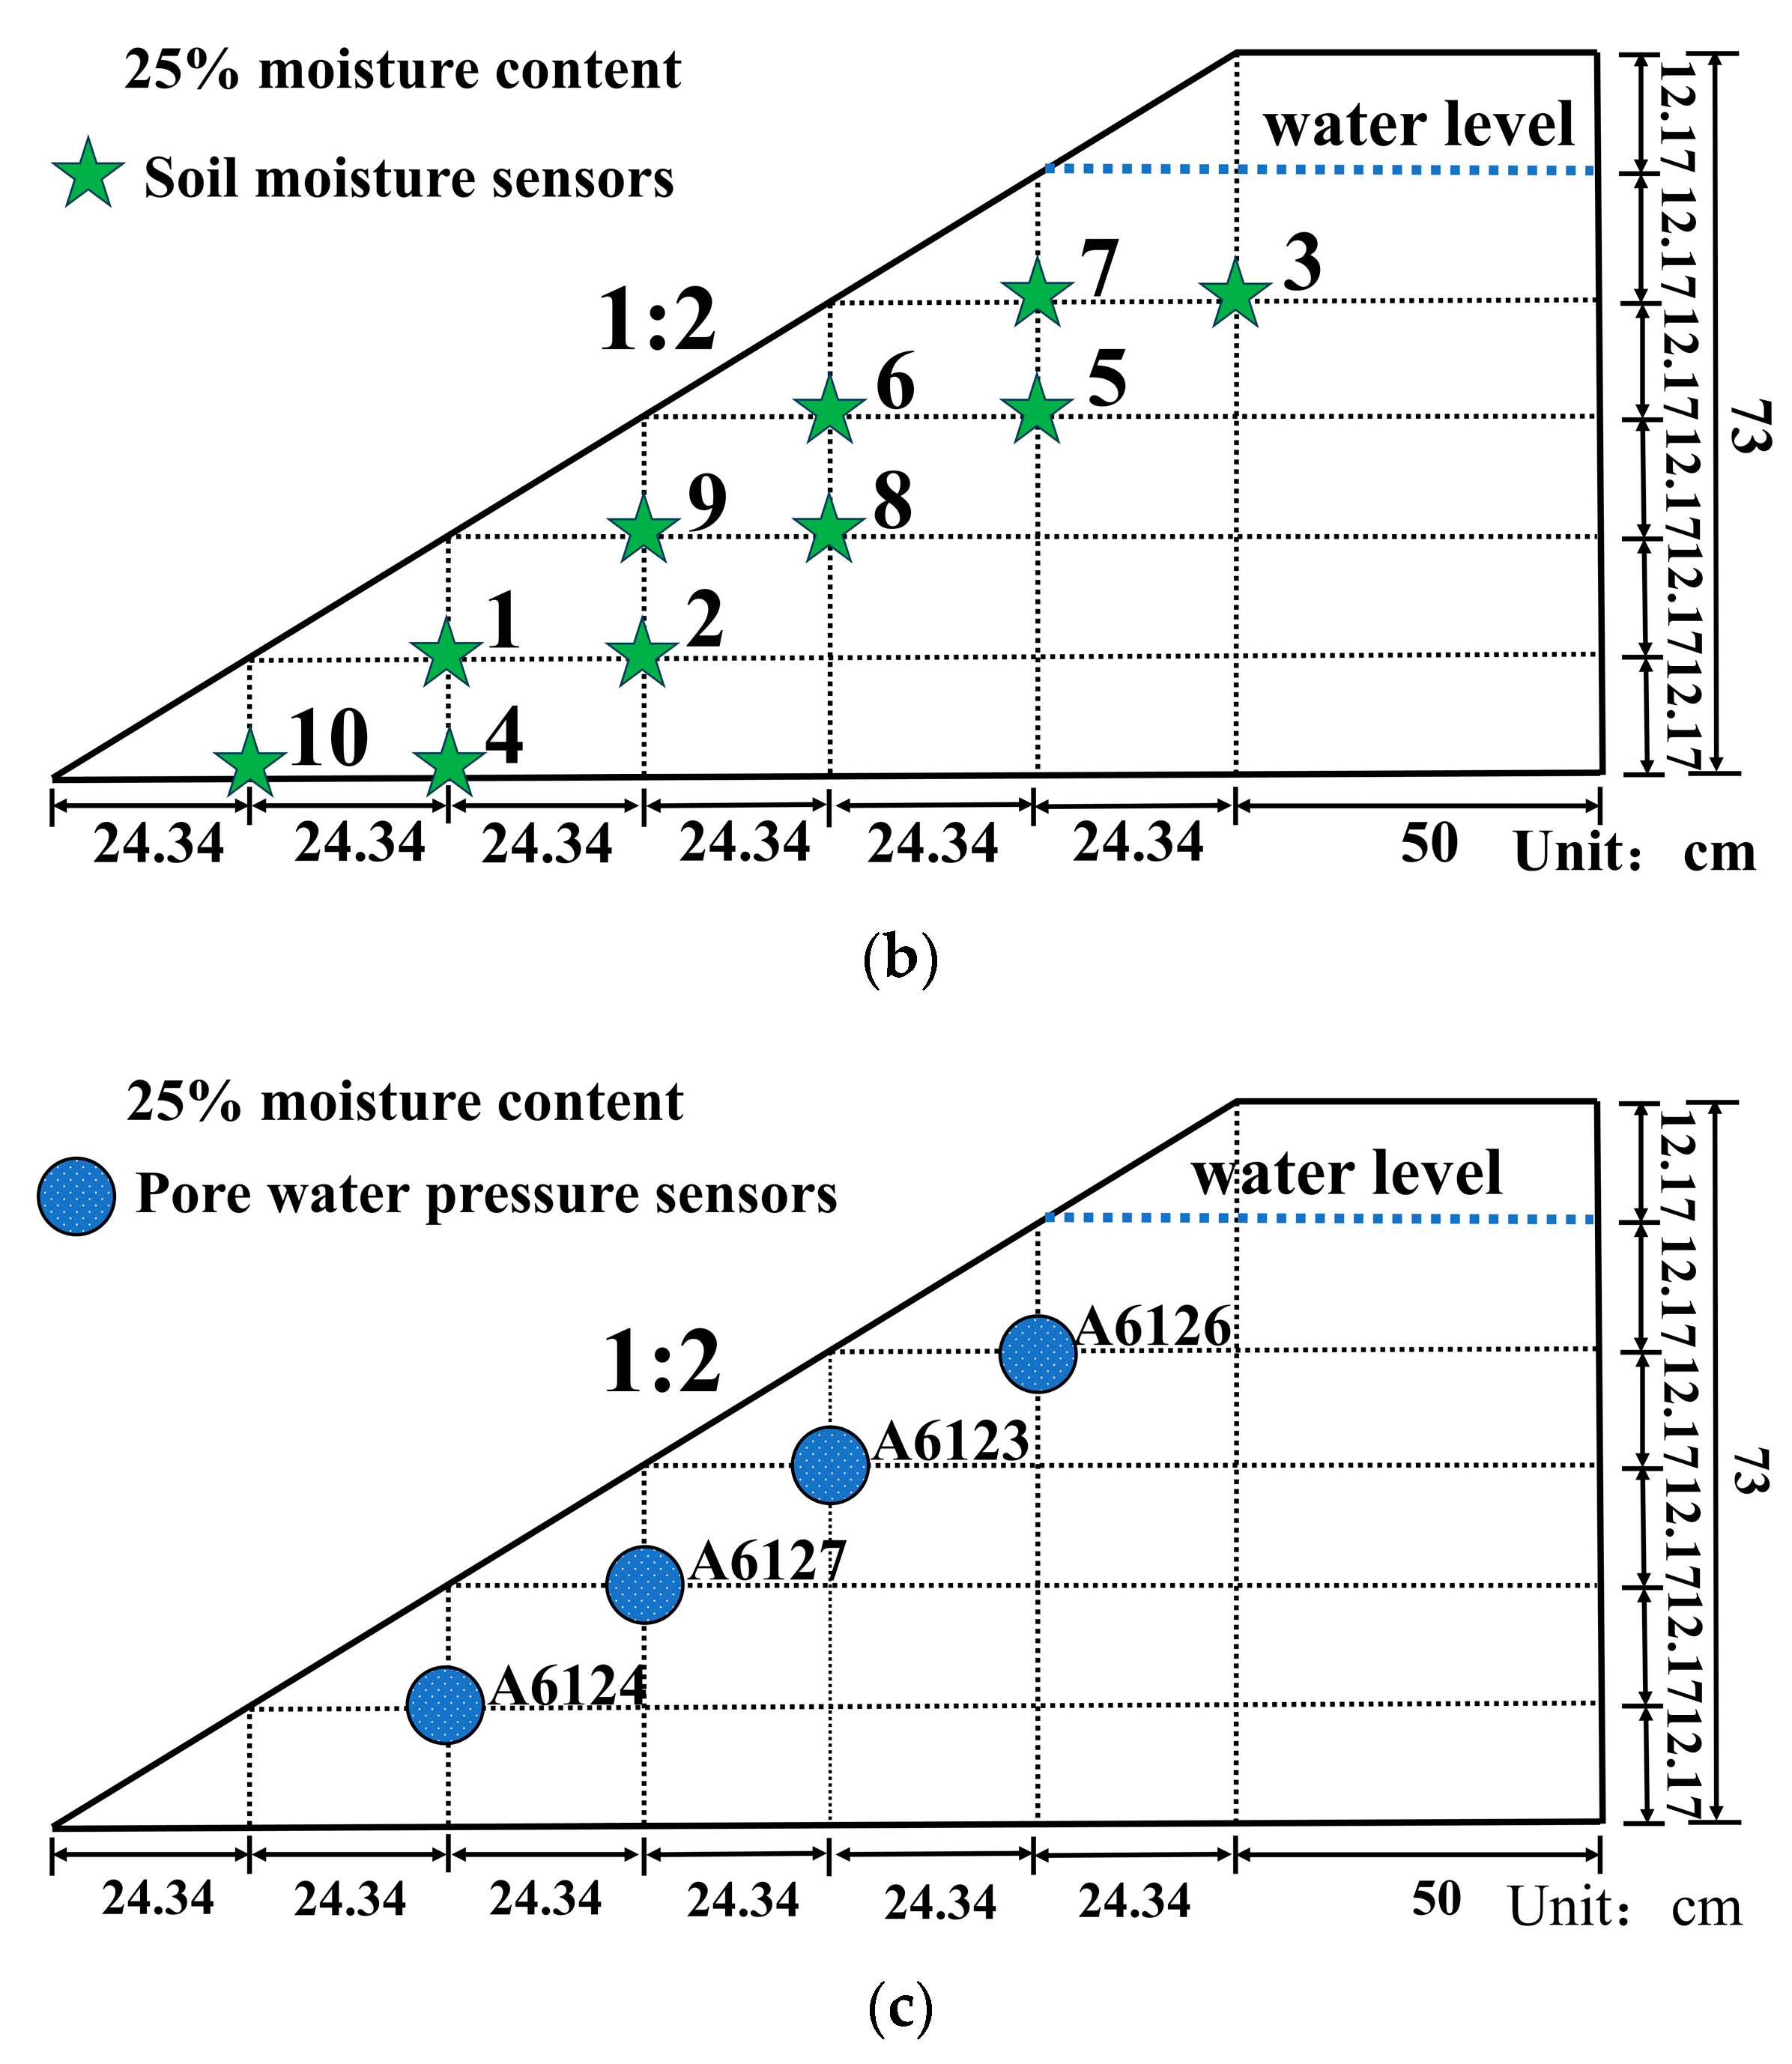
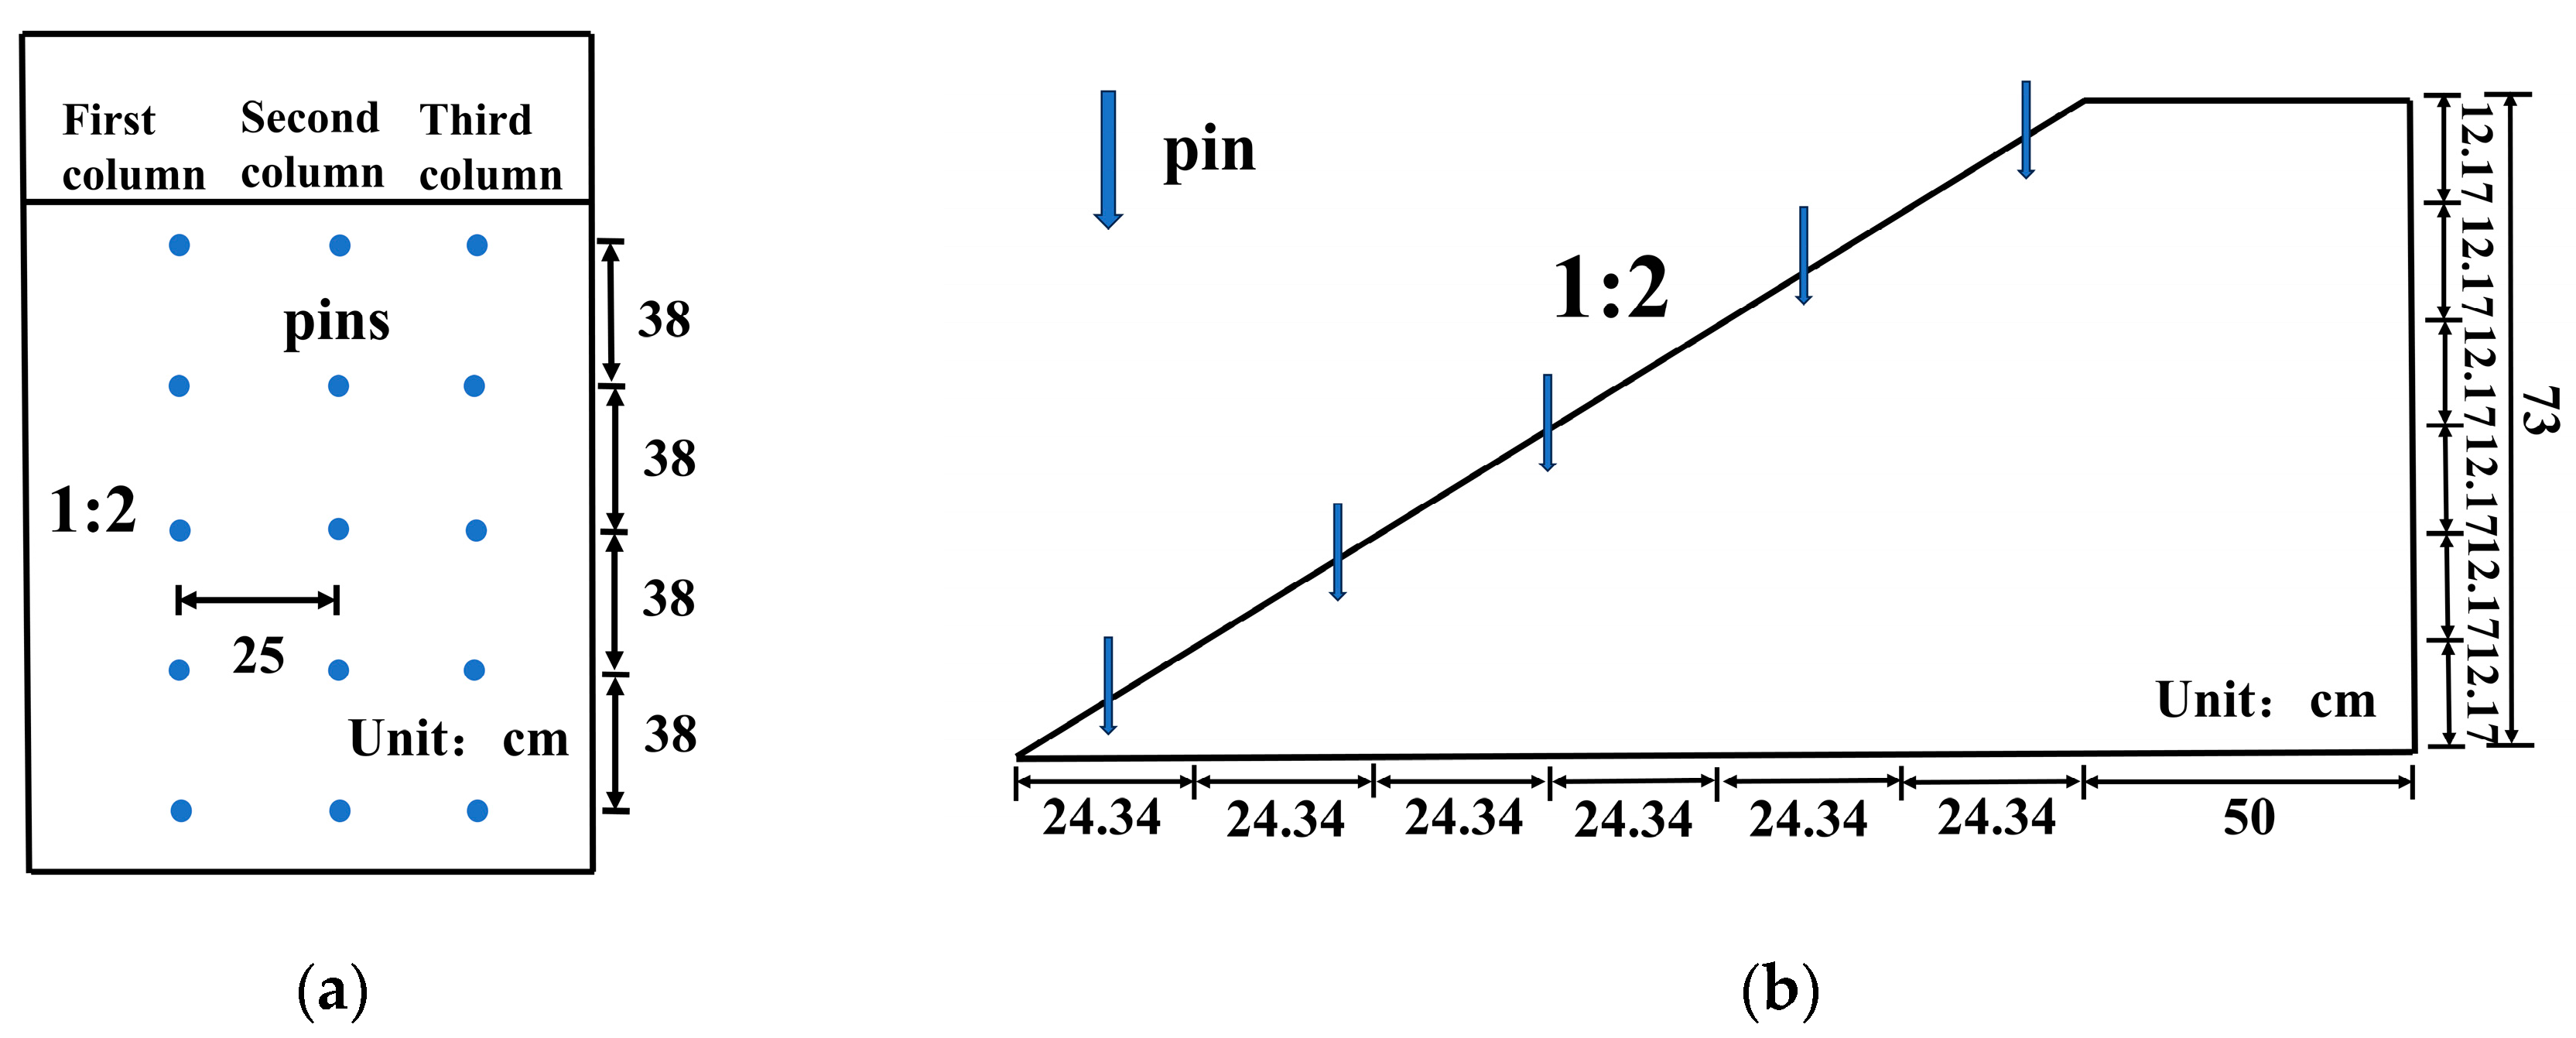
2.2. Laboratory Test Tank

The dimensions of the model tank were as follows: 3.5 m in length, 1.2 m in width, and 1.2 m in height. To facilitate observation, the model tank was constructed with 5 panes of tempered glass on its four sides and bottom, as illustrated in Figure 1.

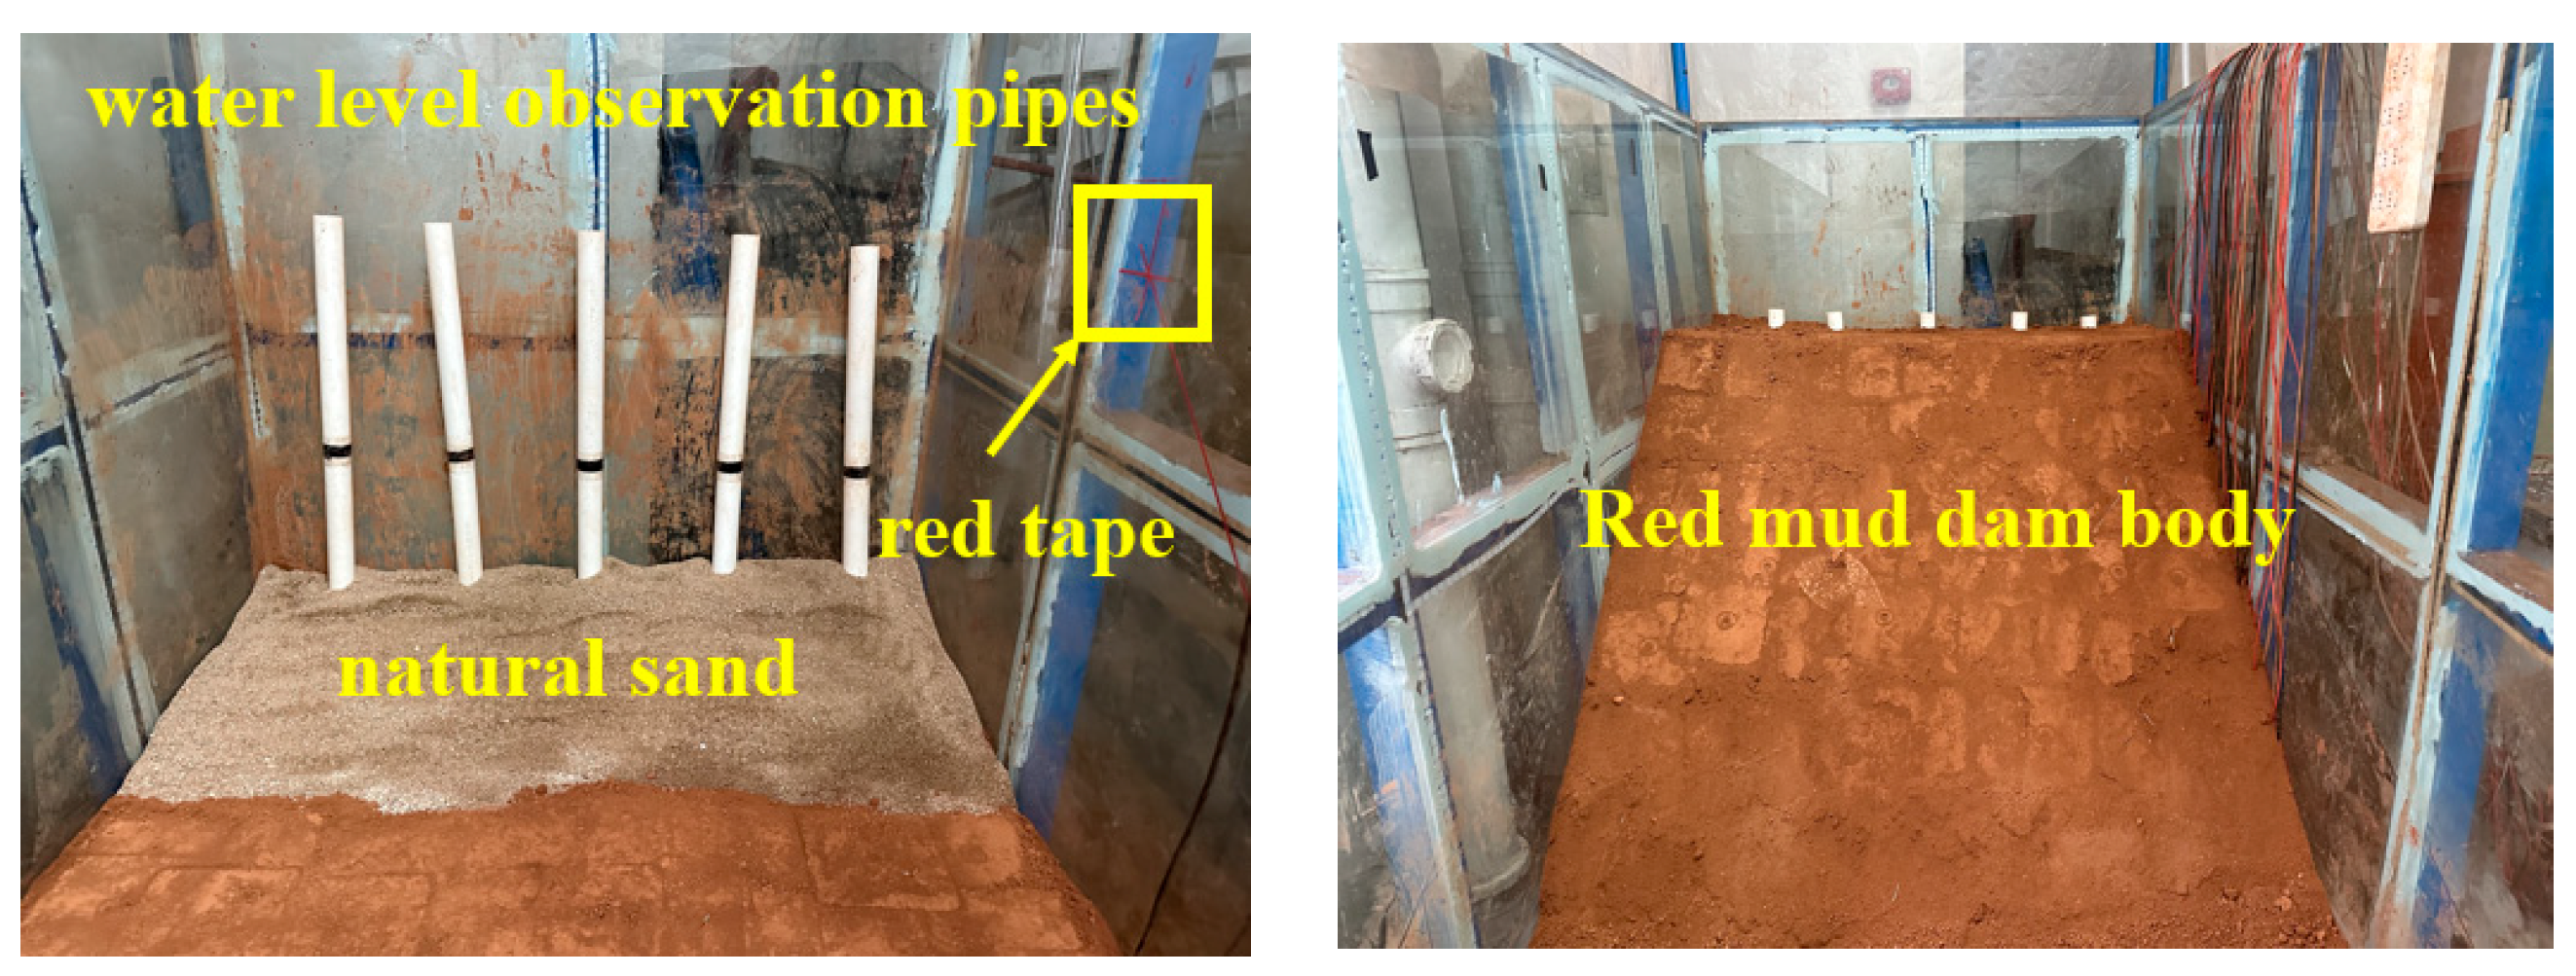
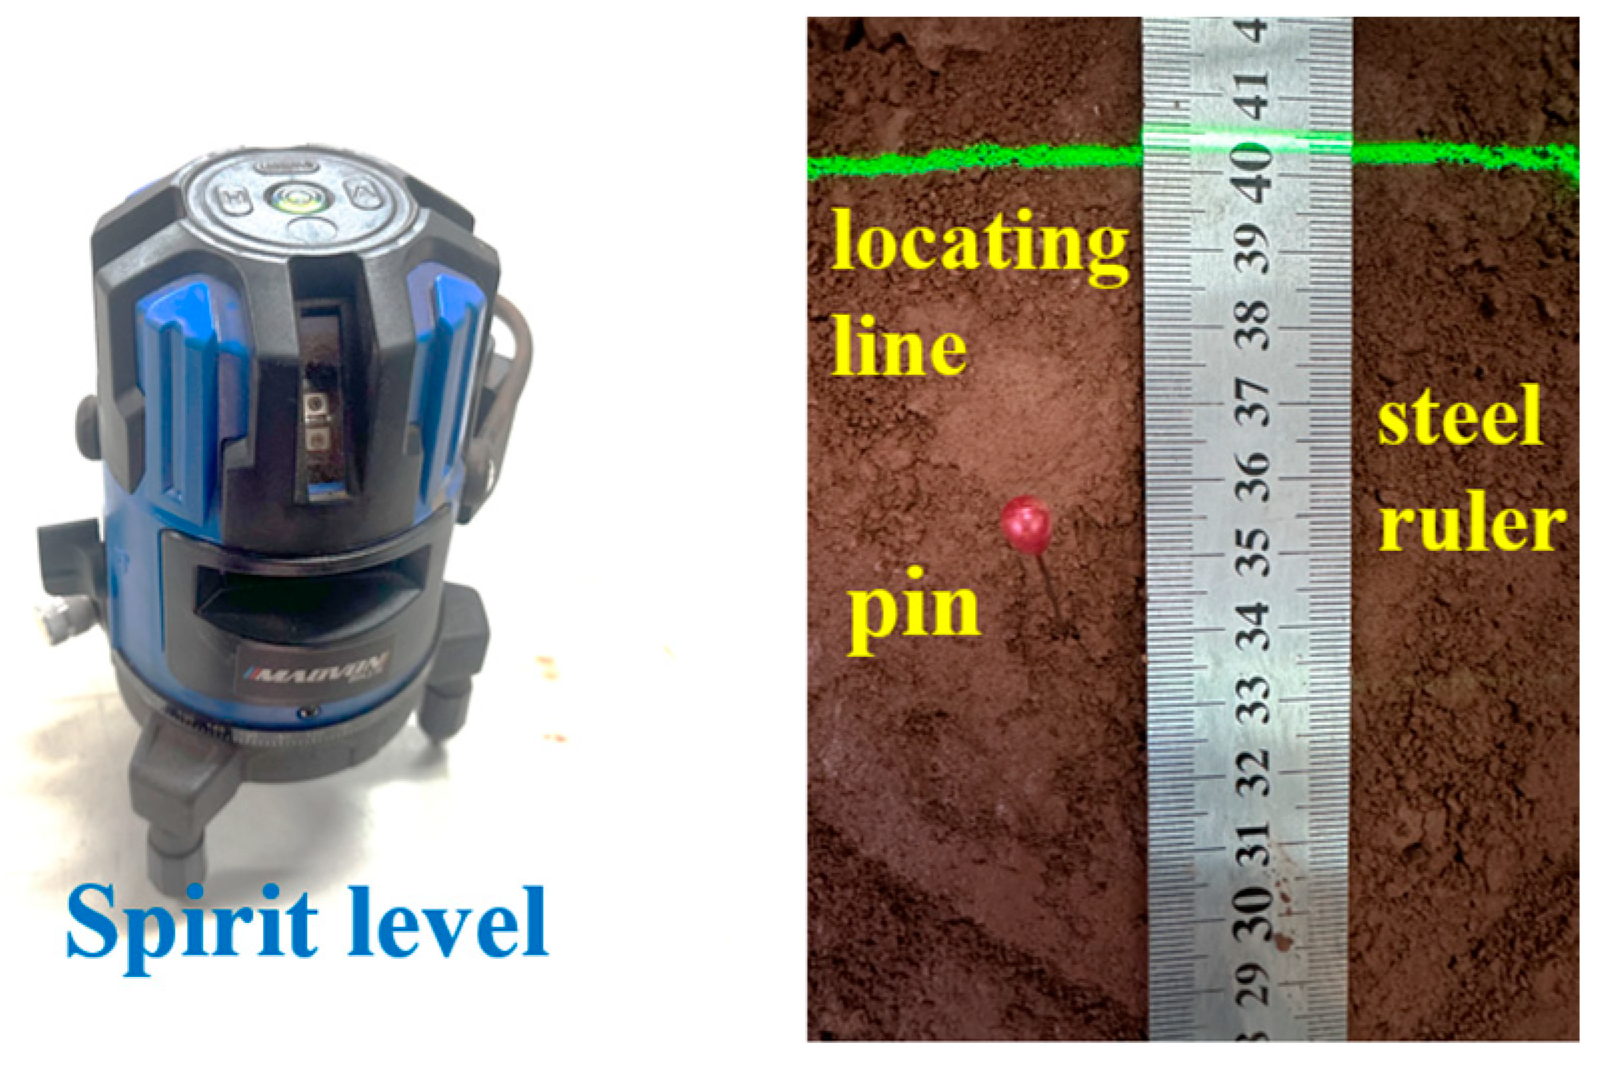
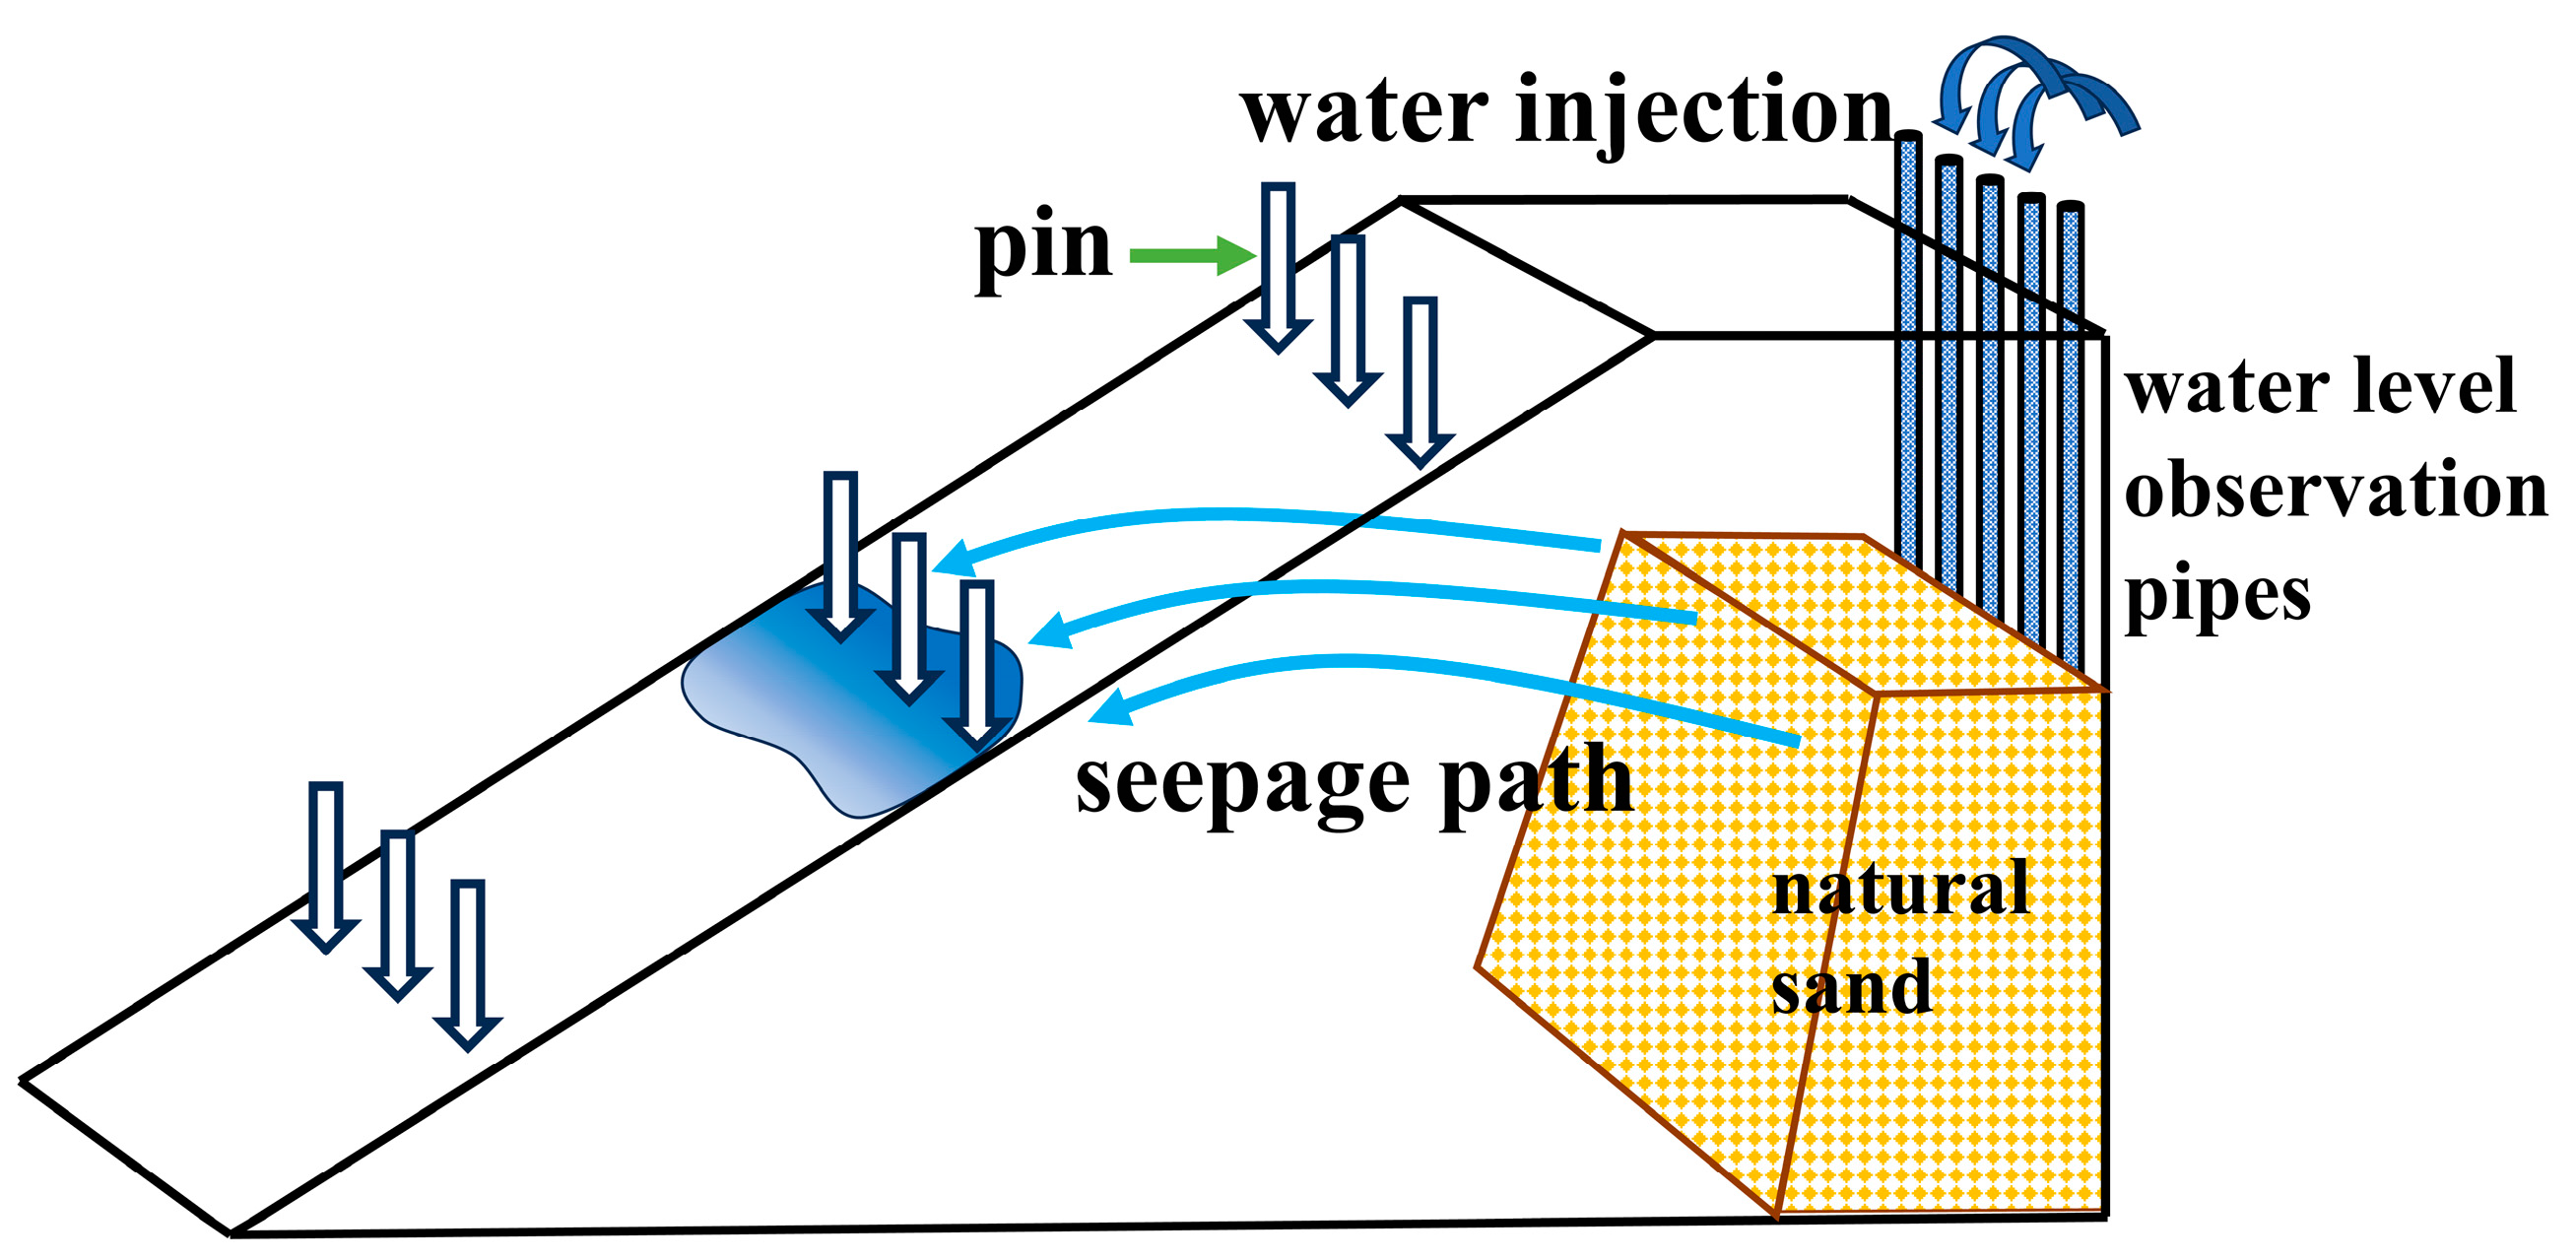
2.3. Water Level Control and Monitoring System

The water level control system comprised natural sand to realize rapid changes in water level, and five water level observation pipes were submerged at the base of the natural sand. During the water injection procedure, the infiltration line was monitored from the tempered glass side, and the water injection speed was regulated according to the water level in the observation pipe, as illustrated in Figure 2. The monitoring system included a pin, locating line, level, steel ruler, etc., as shown in Figure 3.
Three pins were placed at the top, middle, and bottom of the red mud slope in alignment with the experimental specifications. Benchmark points were established on either side of the slope model with the aid of red tape, guiding the precise placement of the pins using a level. These pins were located uniformly along a horizontal axis. When the water level rises and seepage-induced failure appears on the slope’s surface, the pins will experience displacement in conjunction with the slope. Slope displacement can be determined by measurement of the pins’ deviation distance, as shown in Figure 4.

2.4. Red Mud Filling Process in the Laboratory

Red mud was discharged by automobile transportation, belt transportation, and dry stockpiling. After the red mud was dewatered and solid–liquid separated, the water content was 34%; then, it was pushed flat by a bulldozer and dried to a certain degree for testing. When the red mud water content was dried to about 25%, red mud was compacted while spreading. Combined with the site landfill construction process, the red mud filling program in the model tank was designed as follows:
First, a layer of petroleum jelly was applied to the inner wall of the tempered glass of the model tank before filling the red mud. Then, the red mud was configured to the desired water content for filling, and evenly compacted to 12.17 cm with the tamper, with the filling height of each layer at 15–20 cm and compaction greater than 0.95. Sensors were placed after compaction. In order to control compaction and red mud water content, 5 test points were selected to test the compaction density and water content after each layer of filling completion. According to this method, red mud was filled in turn up to 73 cm.
The most dangerous (#2) red mud dam in the dump was selected for the model test; the maximum stacking height of the (#2) red mud dam was 146 m. After scaling down according to a 1:200 scale, the maximum stacking height in the test was 0.73 m. The bottom width of the downstream dam ditch was about 1.2 m, and the slope ratio was set as 1:2 according to the test requirements. The dry beach length was taken as 0.5 m, and the bottom length of the dam body was converted according to the slope ratio. The model similarity is shown in Table 3.
The compaction test was conducted using a small 990 W electric tamper, with a body weight of about 6 kg and tamping plate size of 150 × 150 mm. The red mud tamping and data monitoring process is shown in Figure 5.

2.5. Test Program

The red mud water content was 25% at a dry density of 1.28 g/cm3 according to the laboratory test. Two water level heights (36.51 cm and 60.85 cm) were set for seepage damage, with the slope ratio set as 1:2. To ensure the accuracy of the data, a set of parallel tests were conducted for the test under every water level, with only a set of results taken for analysis. The test parameters are shown in Table 4:
The preset water level height in condition T1 was 36.51 cm, and the sensors were located below the water level, which were used to monitor the evolution patterns of soil pressure, volumetric water content, and pore water pressure during the low water level change. Among them, the soil pressure boxes were arranged as shown in Figure 6a, the soil moisture sensors were arranged as shown in Figure 6b, and the pore water pressure sensors were arranged as shown in Figure 6c.
The preset water level height in working condition T2 was 60.85 cm, and the sensors were buried below the water level, which were used to monitor the evolution patterns of soil pressure, volumetric water content, and pore water pressure during the high water level change. Among them, the soil pressure box was arranged as shown in Figure 7a, the soil moisture sensor was arranged as shown in Figure 7b, and the pore water pressure sensor was arranged as shown in Figure 7c.

3. Results and Discussion

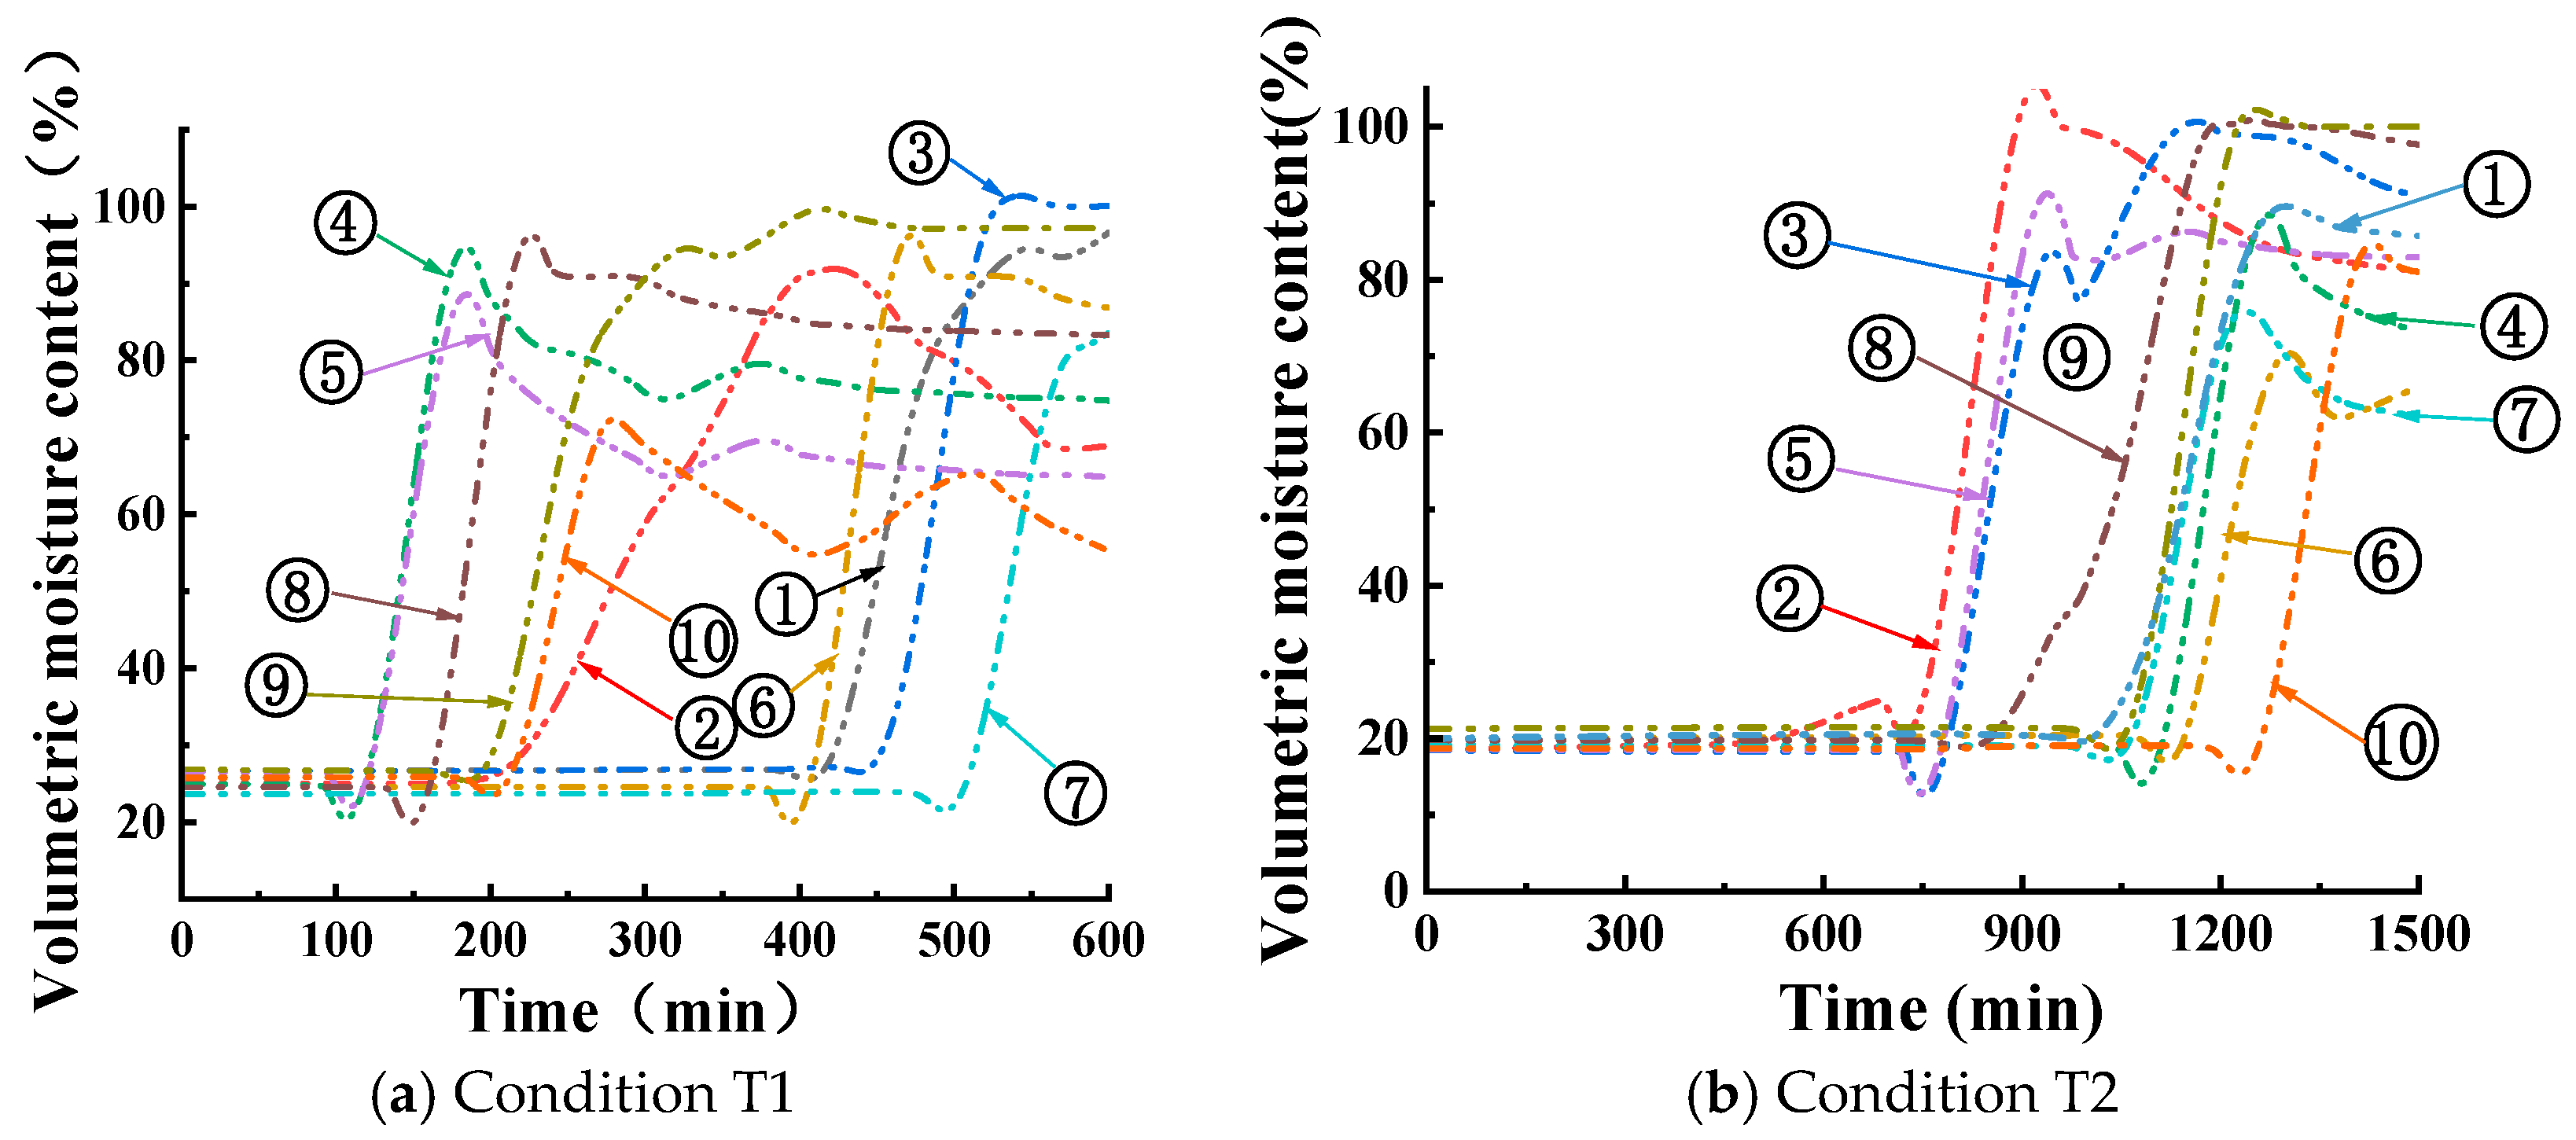
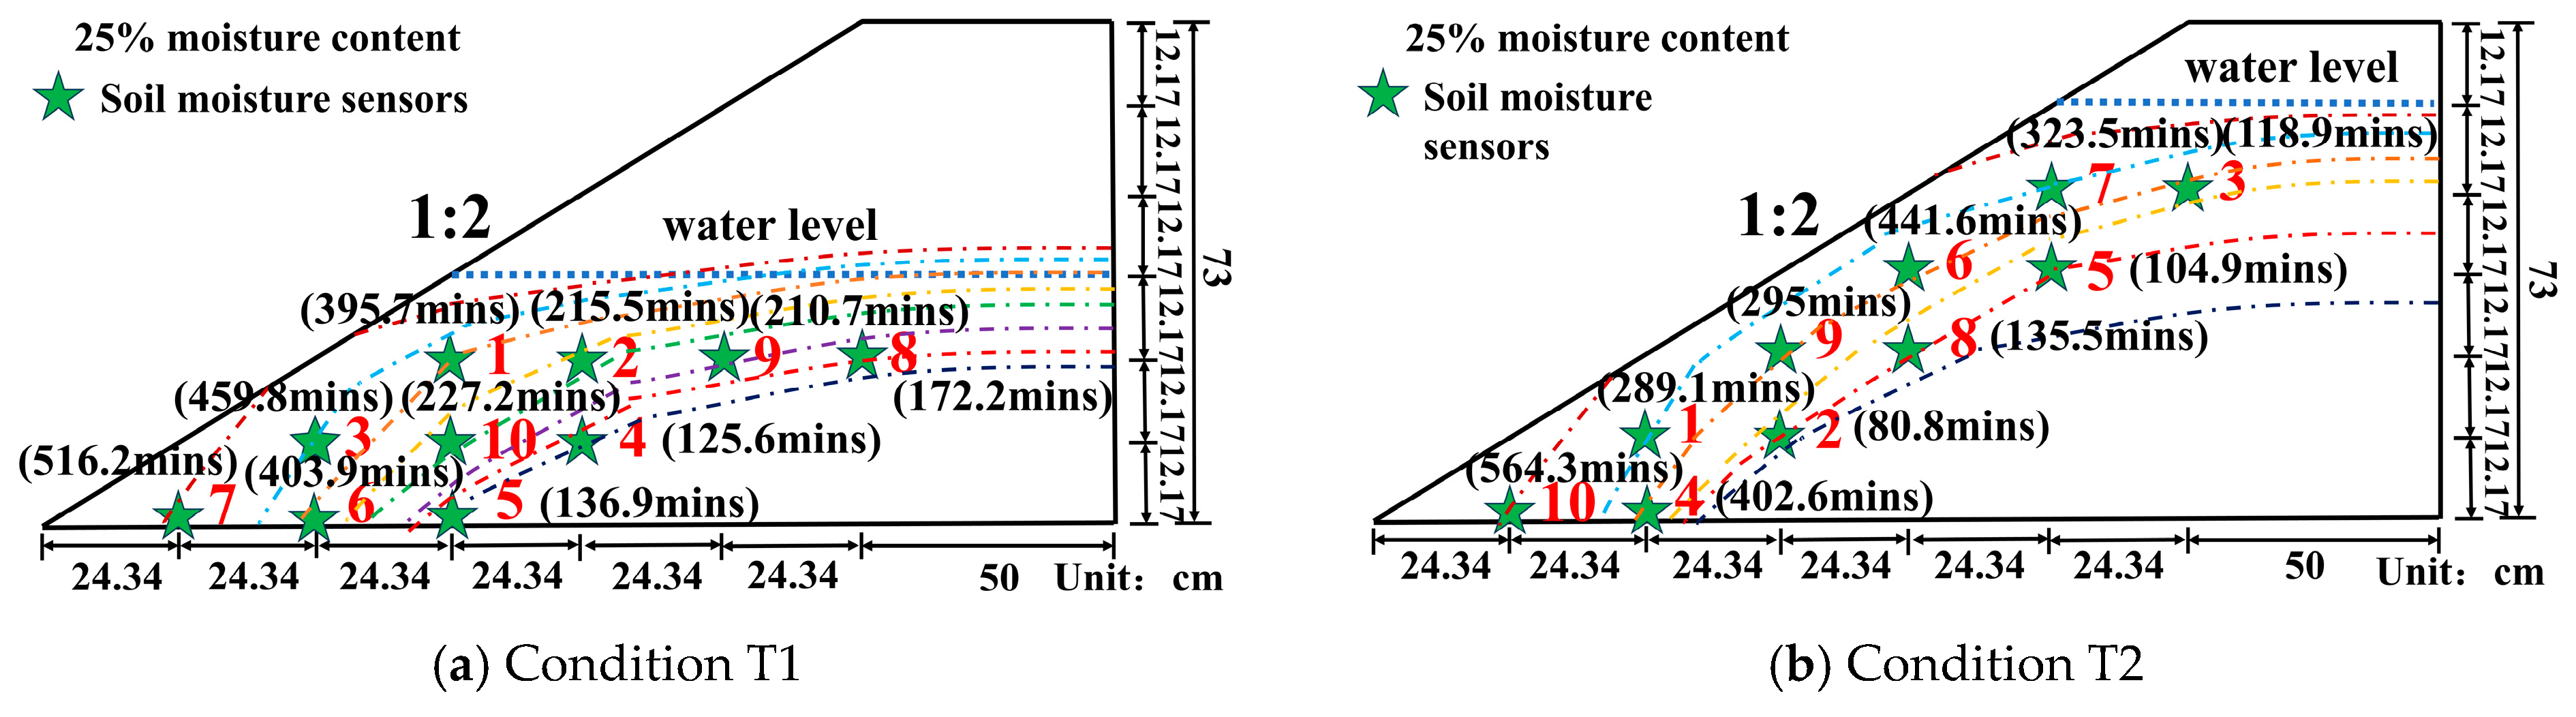
3.1. Evolution Law of Infiltration Line in Red Mud Dams with Seepage Damage at Different Water Levels

Distribution of moisture content in condition T1 is shown in Figure 8a. The water content inflection points of soil moisture content at each monitoring point in condition T1 were 4, 5, 8, 9, 2, 10, 6, 1, 3, and 7 in sequence. When the water level reached a height of 36.51 cm, the infiltration line first reached the slope surface near the middle and slightly lower, and finally reached the slope foot. The distribution of moisture content in condition T2 is shown in Figure 8b. The inflection points of soil moisture content at each monitoring point in condition T2 were 2, 5, 3, 8, 1, 9, 7, 4, 6, and 10 in sequence. When the water level line was 60.85 cm, the infiltration line first reached the slope surface near the middle and slightly above the slope surface, and finally reached the slope foot.
The soil moisture sensor arrangements in conditions T1 and T2 were different; the water level was lower in condition T1, meaning the sensors could not only observe the infiltration line reaching the slope position, but also could observe the infiltration line evolution law inside the red mud dam body. The water level was higher in condition T2; due to the limited number of sensors, the sensors were mainly set for observing the successive time order of the infiltration line reaching the slope surface.
Combined with the sequence and arrival time of infiltration lines to each monitoring point under conditions T1 and T2, the evolution laws of infiltration lines are plotted in Figure 9. Figure 9a shows the evolution law of the infiltration line as the water level gradually increased from 0 to 36.51 cm for condition T1, and Figure 9b shows the evolution law of the infiltration line as the water level gradually rose from 0 to 60.85 cm for condition T2. It can be seen from Figure 9 that the higher the water level is, the higher slope surface position the infiltration line reaches, increasing the risk of landslides and potential damage. Given that red mud is a type of fine-grained tailing with poor permeability, the infiltration line was higher compared to the coarse-grained tailings reservoir; there is consequently a higher likelihood of seepage damage on the dam slope. Therefore, strict control over the water level height in red mud dams is imperative.

3.2. Distribution Law of Soil Pressure in Red Mud Dams with Seepage Failure at Different Water Levels

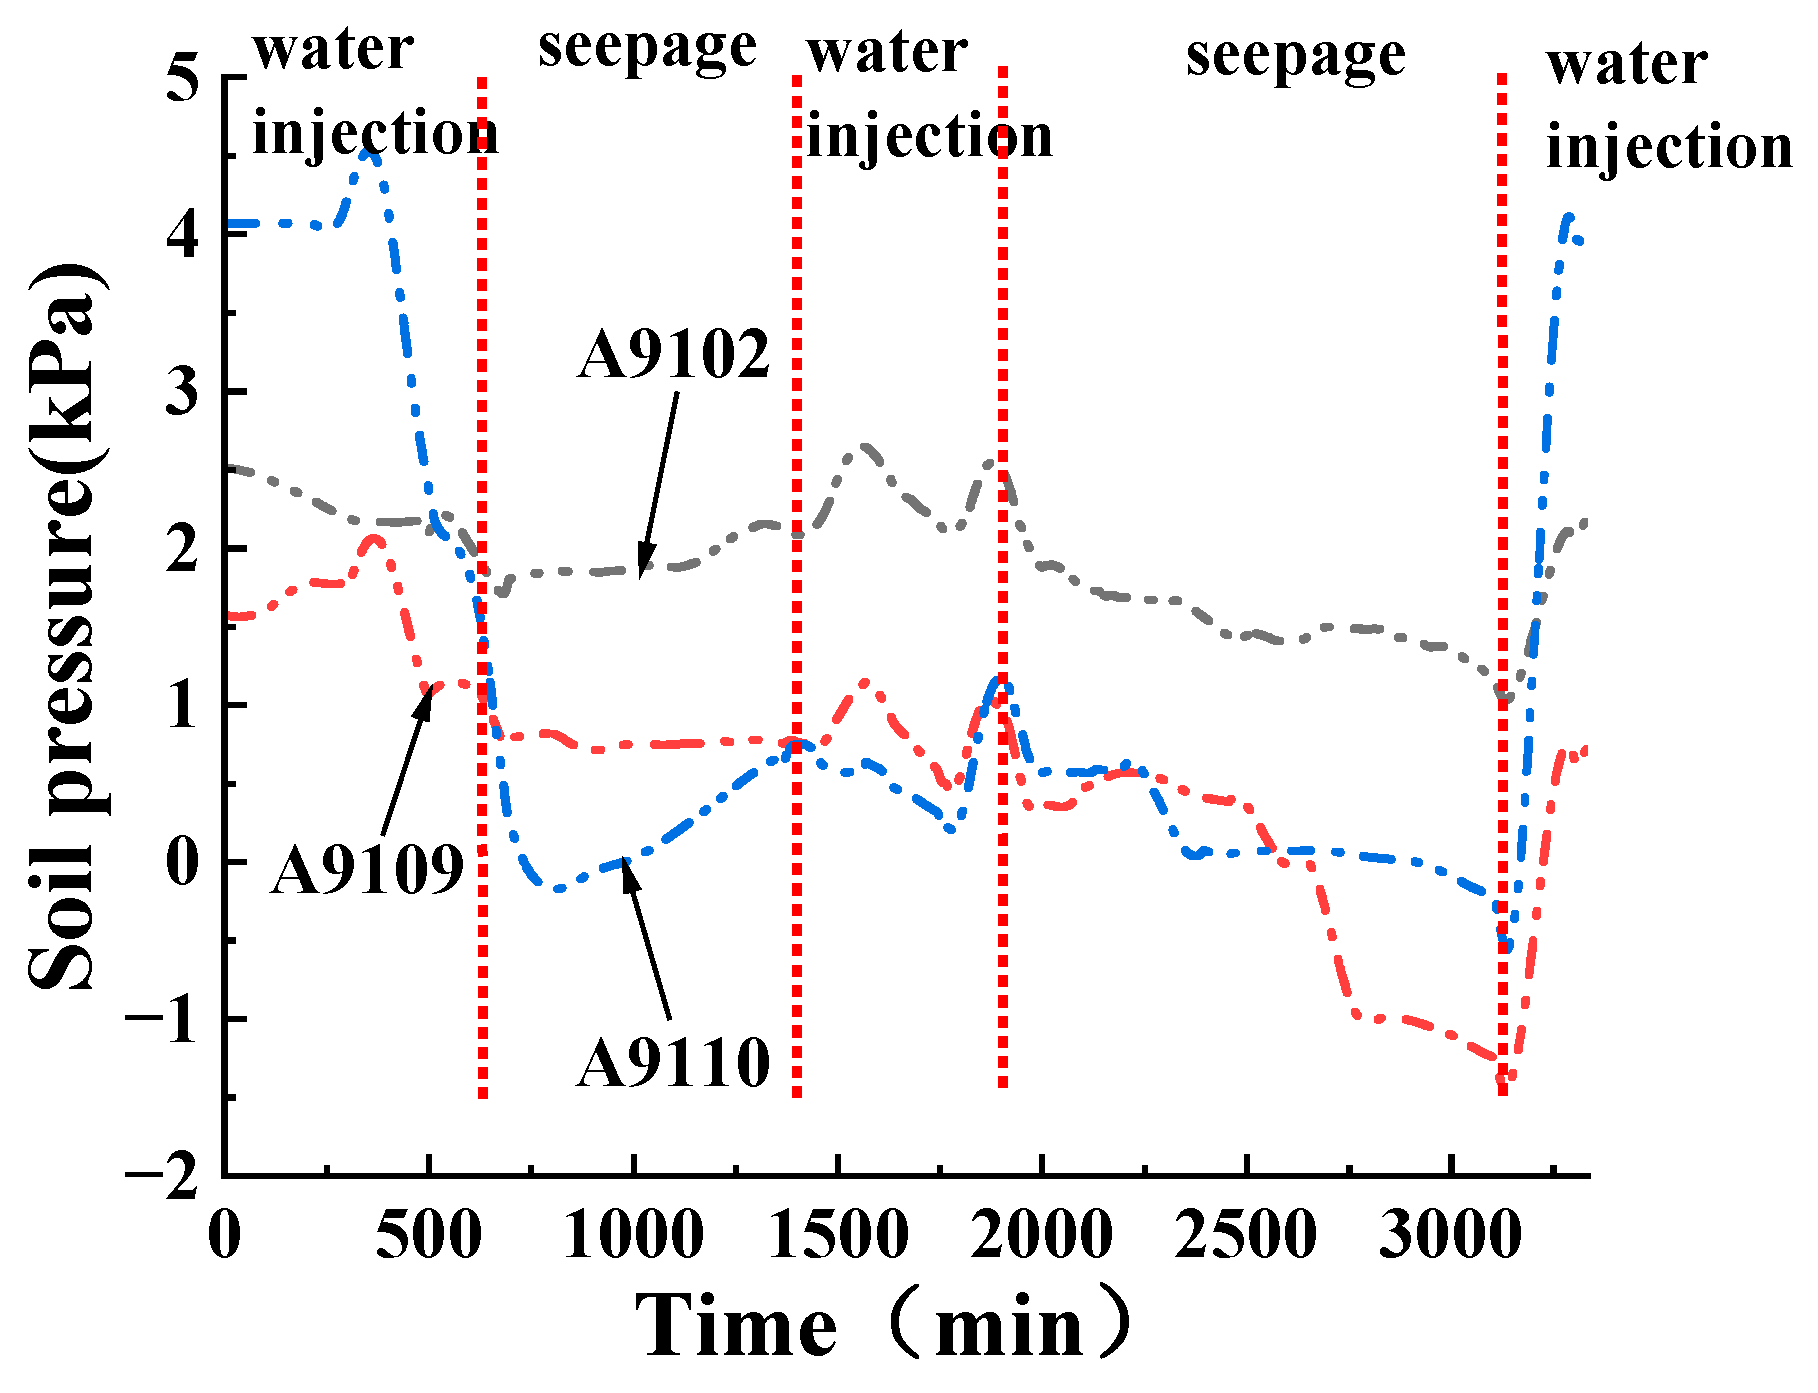
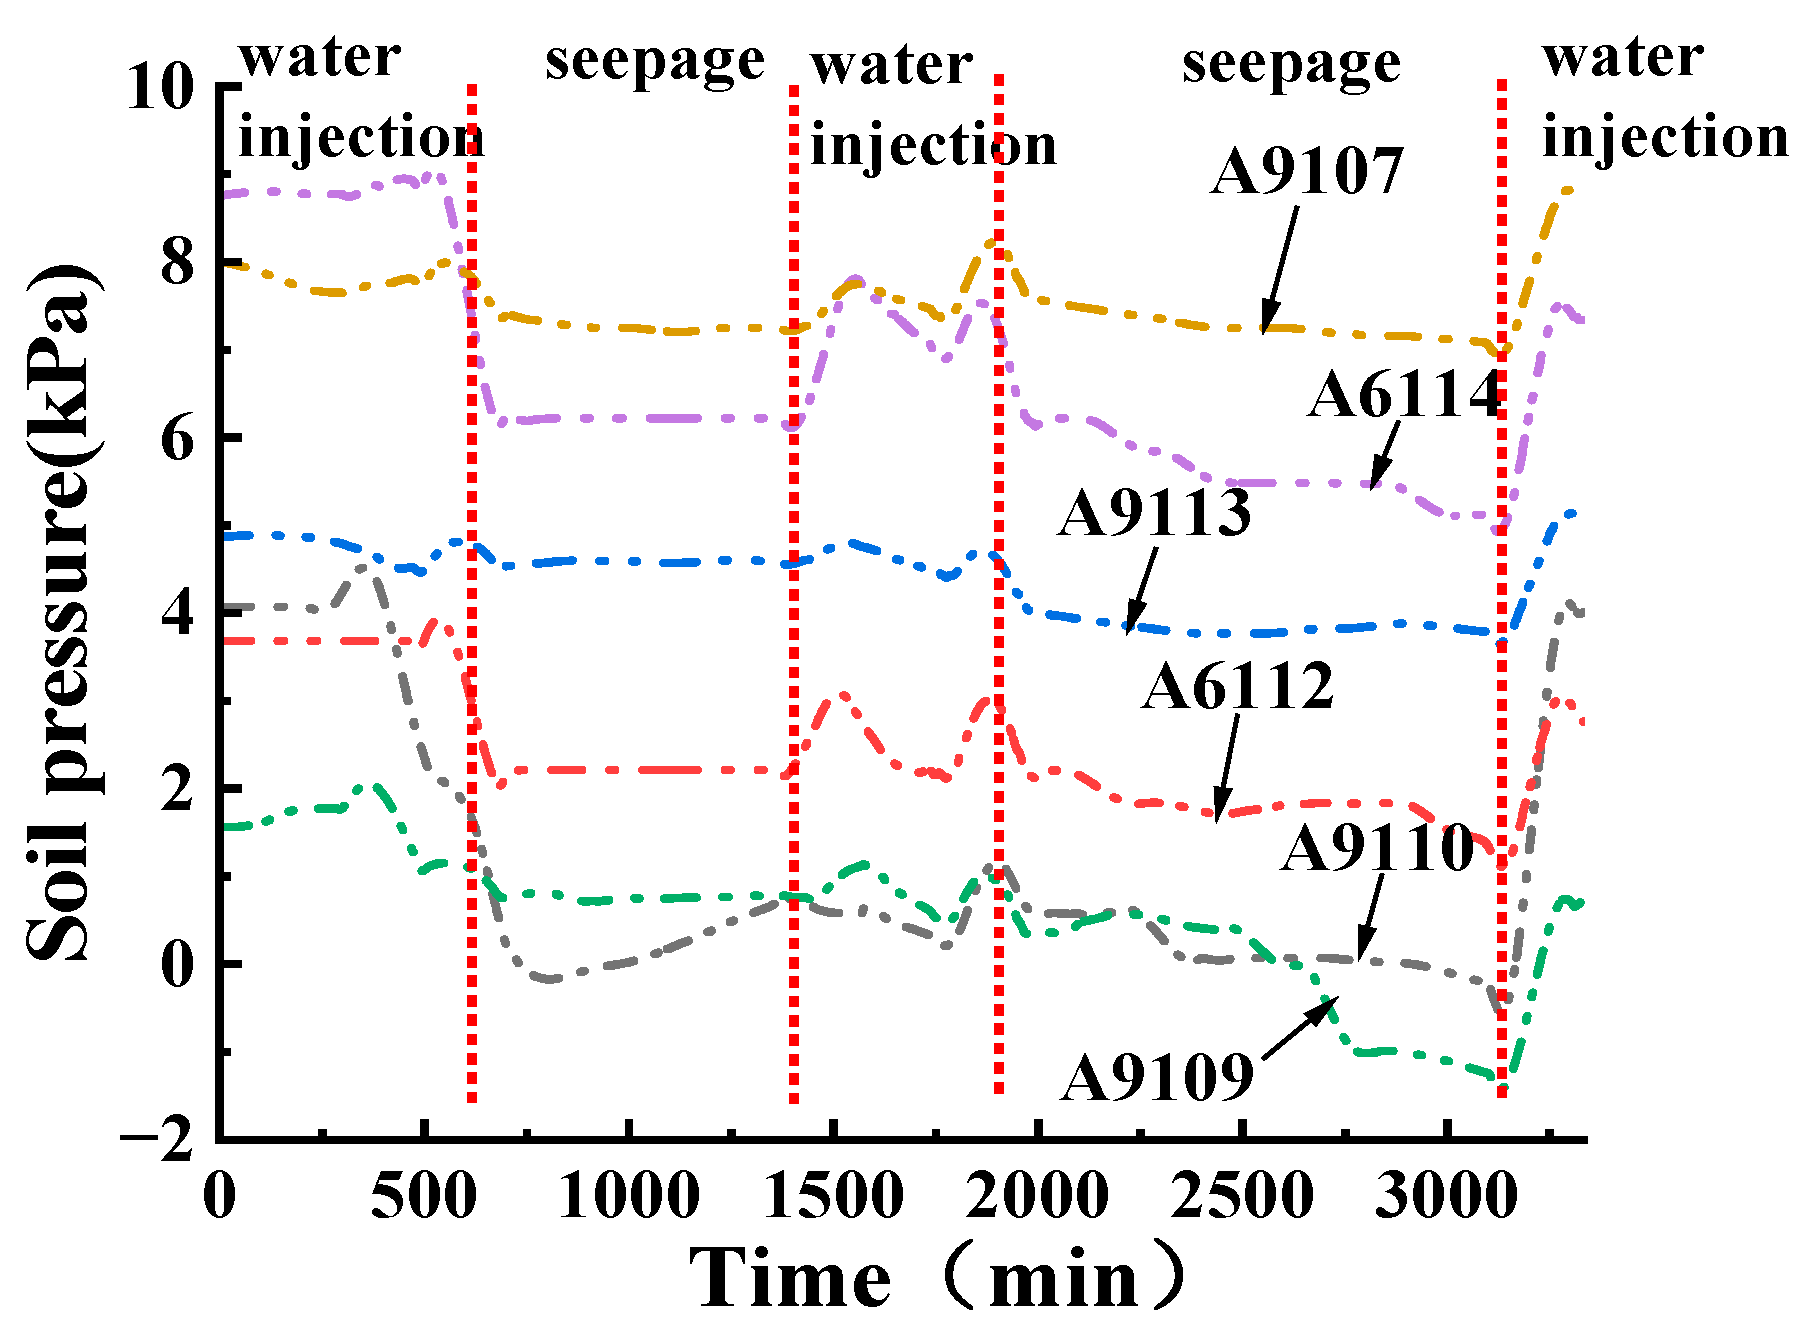
3.2.1. The Variation Law of the Vertical Soil Pressure near the Slope Surface in Condition T1 with Time

The distribution of vertical soil pressure near the slope surface in condition T1 is depicted in Figure 10. It is evident that before water level changes, the highest vertical soil pressure appears at monitoring point A9105 near the slope toe, followed by monitoring point A9108, while the lowest vertical soil pressure appears at monitoring point A9106 of the slope toe.
After the water level changes, water injection was conducted between 0–598 min; the vertical soil pressure at monitoring points A9108, A9106, and A9105 all show obvious decrease trends after basic stabilization (or increase). Combined with the distribution of volumetric moisture content in Figure 8a, during the water injection period, the infiltration line gradually extends to the slope surface, the pore water gradually increases at the monitoring points near the slope surface, and the vertical soil pressure decreases due to the buoyancy of the soil pressure box. Between 598 min and 1401 min, water injection was stopped and smooth seepage dominates inside the dam. The vertical soil pressure at monitoring points A9108 and A9105 show very small changes, and there is a significant rise of vertical soil pressure at monitoring point A9106. This is because the pore water at the slope foot seeps into the slope surface, reducing the volumetric moisture content at the slope foot. Consequently, the buoyancy of the soil pressure box at monitoring point A9106 decreases, and the vertical soil pressure reading increases. Between 1401 min and 1910 min, water injection was conducted again, with vertical soil pressures at monitoring points A9108, A9106, and A9105 showing a rapid decreasing trend, with decreasing values of 21.15%, 62.16%, and 60.7%, respectively—relatively high decreasing values at monitoring points A9105 and A9106. Between 1910 min and 3145 min, the water injection was stopped again; this period is the seepage stage, where the vertical soil pressures at monitoring points A9105, A9106, and A9108 all show increasing trends, which is due to the fact that the pore water keeps seeping out of the slope surface, the pore water pressure decreases, and the buoyancy of soil pressure box decreases. Between 3145 min and 3333 min, the water injection was conducted again, with the vertical soil pressures at monitoring points A9108, A9106, and A9105 showing rapid decreasing trends, with decreasing values of 40.32%, 43.56%, and 87.04%. The vertical soil pressure at monitoring point A9105 decreases the most, indicating that the pore water pressure at monitoring point A9105 is the largest.

3.2.2. The Variation Law of the Horizontal Soil Pressure near the Slope Surface in Condition T1 with Time

The distribution of horizontal soil pressure near the slope surface in condition T1 is shown in Figure 11. It can be seen that the horizontal soil pressure at the monitoring point A9110 is the largest, followed by the monitoring point A9102 at the slope foot, and the horizontal soil pressure at the monitoring point A9109 near the foot of the slope is the smallest.
After the water level change, water injection was conducted between 0 and 598 min; the horizontal soil pressures at monitoring points A9110, A9102, and A9109 all show basic stabilization (or increase) trends, followed by significant decreases. The water injection was stopped between 598 min and 1401 min; the dam body is in the seepage stage, and the horizontal soil pressures at monitoring points A9110, A9102, and A9109 show basic stability or slight increases. This phenomenon can be attributed to the continuous outflow of the pore water near the slope surface keeping to the slope surface even after the cessation of water injection, leading to a reduction of buoyancy force on the soil pressure box and gradual rise of horizontal soil pressures at the monitoring points. Between 1401 min and 1910 min, water injection was conducted again, and the horizontal soil pressures at monitoring points A9110, A9102, and A9109 show the fluctuating trends of increase–decrease–increase–decrease, which is because the pore water decreases at the previous stable seepage stage, the pore water increases again after water injection, resulting in a self-weight increase of red mud. The buoyancy on the soil pressure box appears with the increase of pore water; the water injection is still ongoing when the pore is full of water, the pore water cannot be discharged quickly, and then the horizontal soil pressure increases again due to the pore water. Between 1910 min and 3145 min, water injection was stopped again, and the horizontal soil pressures at monitoring points A9102, A9109, and A9110 show decreasing trends in this seepage stage, which is because the these three monitoring points are near the slope surface, and the pore water near the slope surface flows out continuously; the horizontal soil pressures then decrease due to the weakening effect of the pore water. Between 3145 min and 3333 min, water injection was conducted again; horizontal soil pressures at monitoring points A9102, A9109, and A9110 all show rapid increase trends due to the pore water effect. Compared with the unchanged period water level, at the end of the second seepage, the horizontal soil pressure at monitoring point A9110 decreases the most. Compared with the end of the second seepage, at the end of the third water injection, the horizontal soil pressures at monitoring points A9102, A9109, and A9110 increase by 107.2%, 211.1%, and 450.7%. The increased value of horizontal soil pressure at monitoring point A9110 is the highest.
From the transmission of horizontal thrust under condition T1 in Figure 12, it can be seen that the first row of monitoring points from the inside of the red mud dam to the slope surface are monitoring points A9113, A6112, and A9110, respectively. The second row of monitoring points are monitoring points A9107, A6114, and A9109, respectively. Before the water level changes, the greatest horizontal soil pressures are at monitoring point A9110 in the first row and at monitoring point A6114 in second row, respectively.
After the water level change, the horizontal soil pressures at the monitoring points of the first row have similar trends. During the water injection stage between 0 and 598 min, the horizontal soil pressures at three monitoring points increase due to the self-weight increase of red mud. As the water injection continues, the horizontal soil pressure decreases due to the buoyancy effect of the soil pressure box. At the end of water injection, the horizontal soil pressures at the monitoring points of the first row follow the descending order of A9113, A6112, and A9110. During the reinjection stage between 1401 min and 1910 min, the horizontal soil pressures at three monitoring points show similar fluctuations due to pore water changes. At the end of the injection, the horizontal soil pressures at monitoring points follow the descending order of A9113, A6112, and A9110. Between 1910 min and 3145 min, water injection was stopped again; the horizontal soil pressures at three monitoring points show decreasing trends at this seepage stage. Between 3145 min and 3333 min, water injection was conducted again; the horizontal soil pressures at three monitoring points rapidly increase. Among them, the horizontal soil pressure at monitoring point A9110 increases the most.
After the water level change, the change trends of horizontal soil pressures at monitoring points of the second row are similar to those of the first row. At the end of the first water injection, the horizontal soil pressures at monitoring points in descending order is A9107, A6114, and A9109. During the seepage stage, the horizontal soil pressures at three monitoring points remain stable. When water injection is conducted again, the horizontal soil pressures at three monitoring points show similar fluctuations due to pore water changes. At the end of the injection, the descending order of horizontal soil pressures at monitoring points is A9107, A6114, and A9109. At seepage stage when water injection is stopped again, the horizontal soil pressures at three monitoring points show decreasing trends. During the third water injection stage, the horizontal soil pressures at three monitoring points increase rapidly; the highest increase appears at monitoring point A6114.

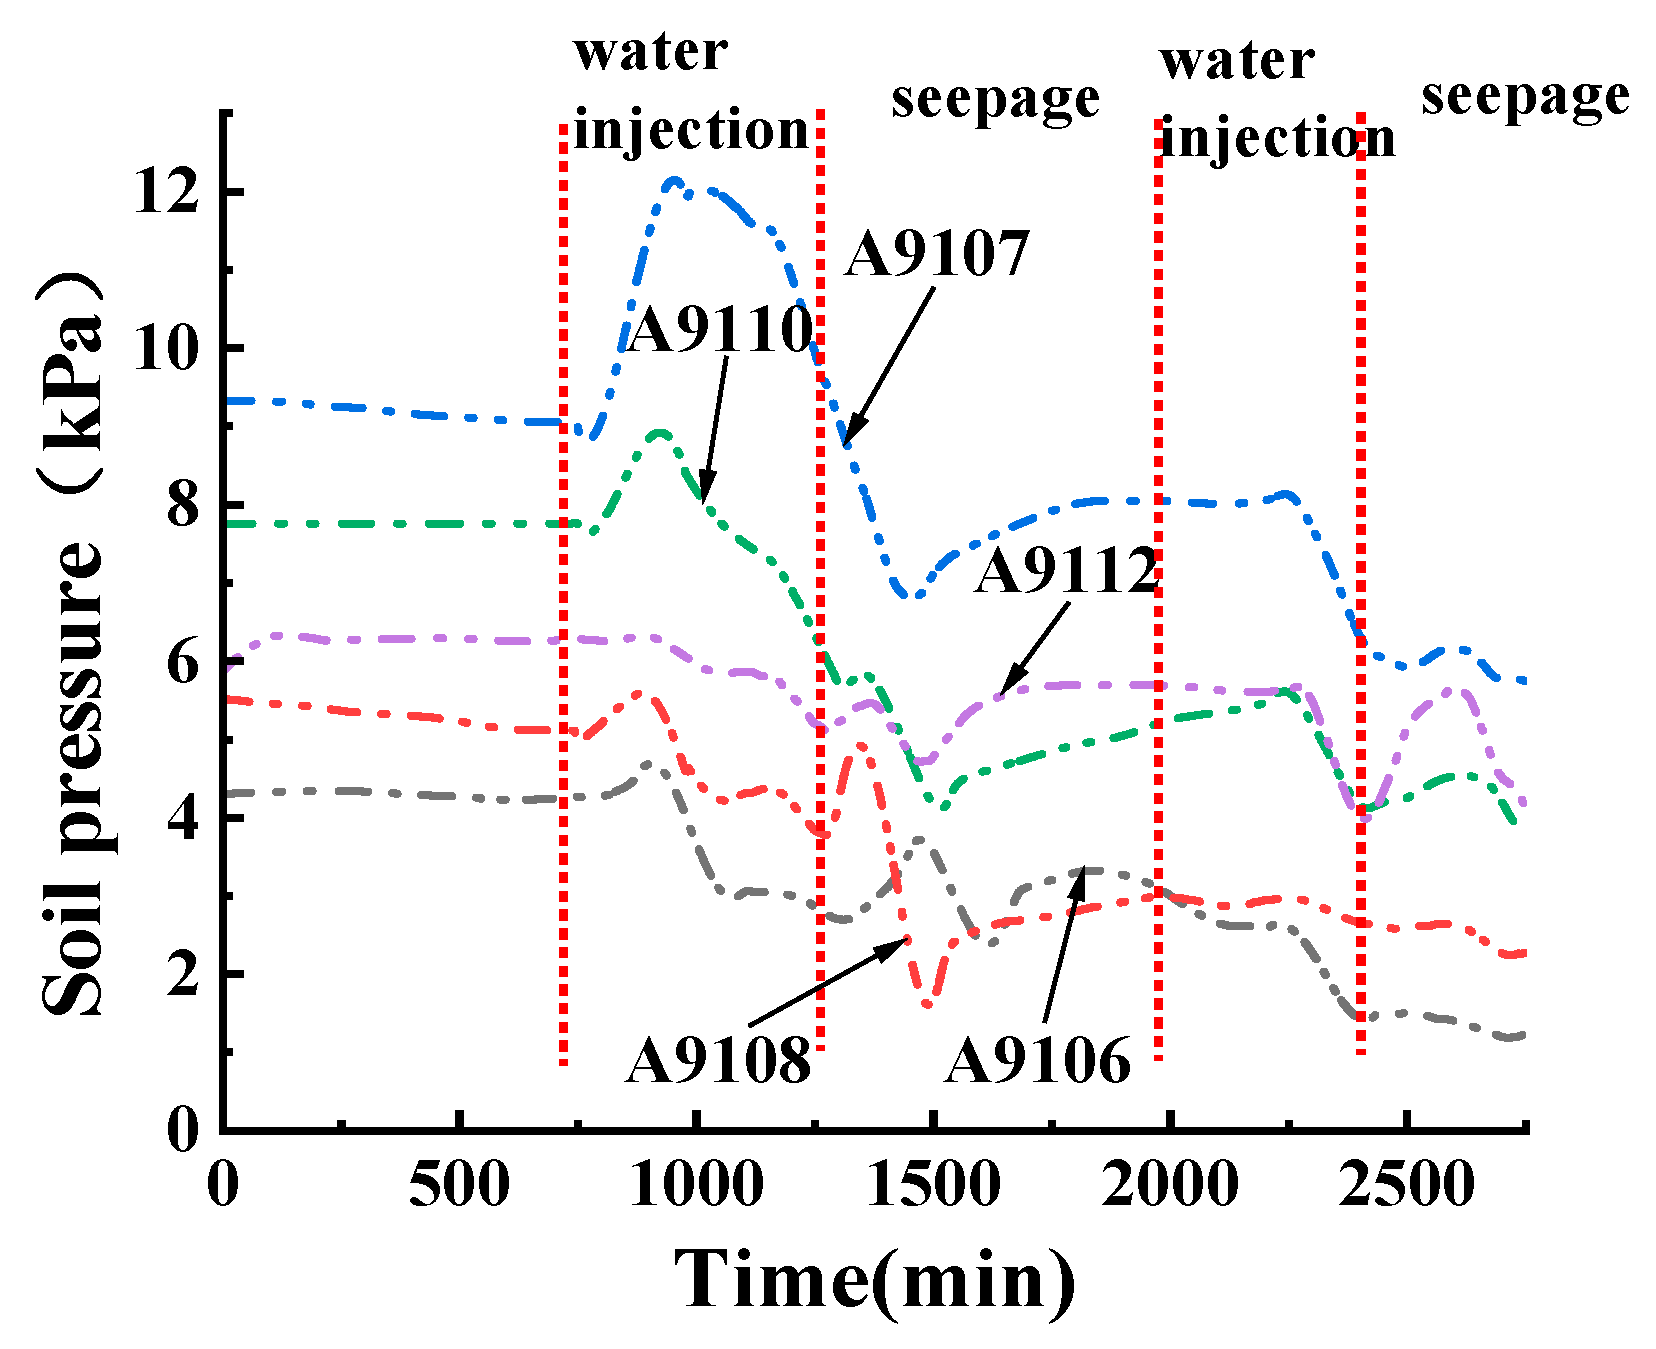
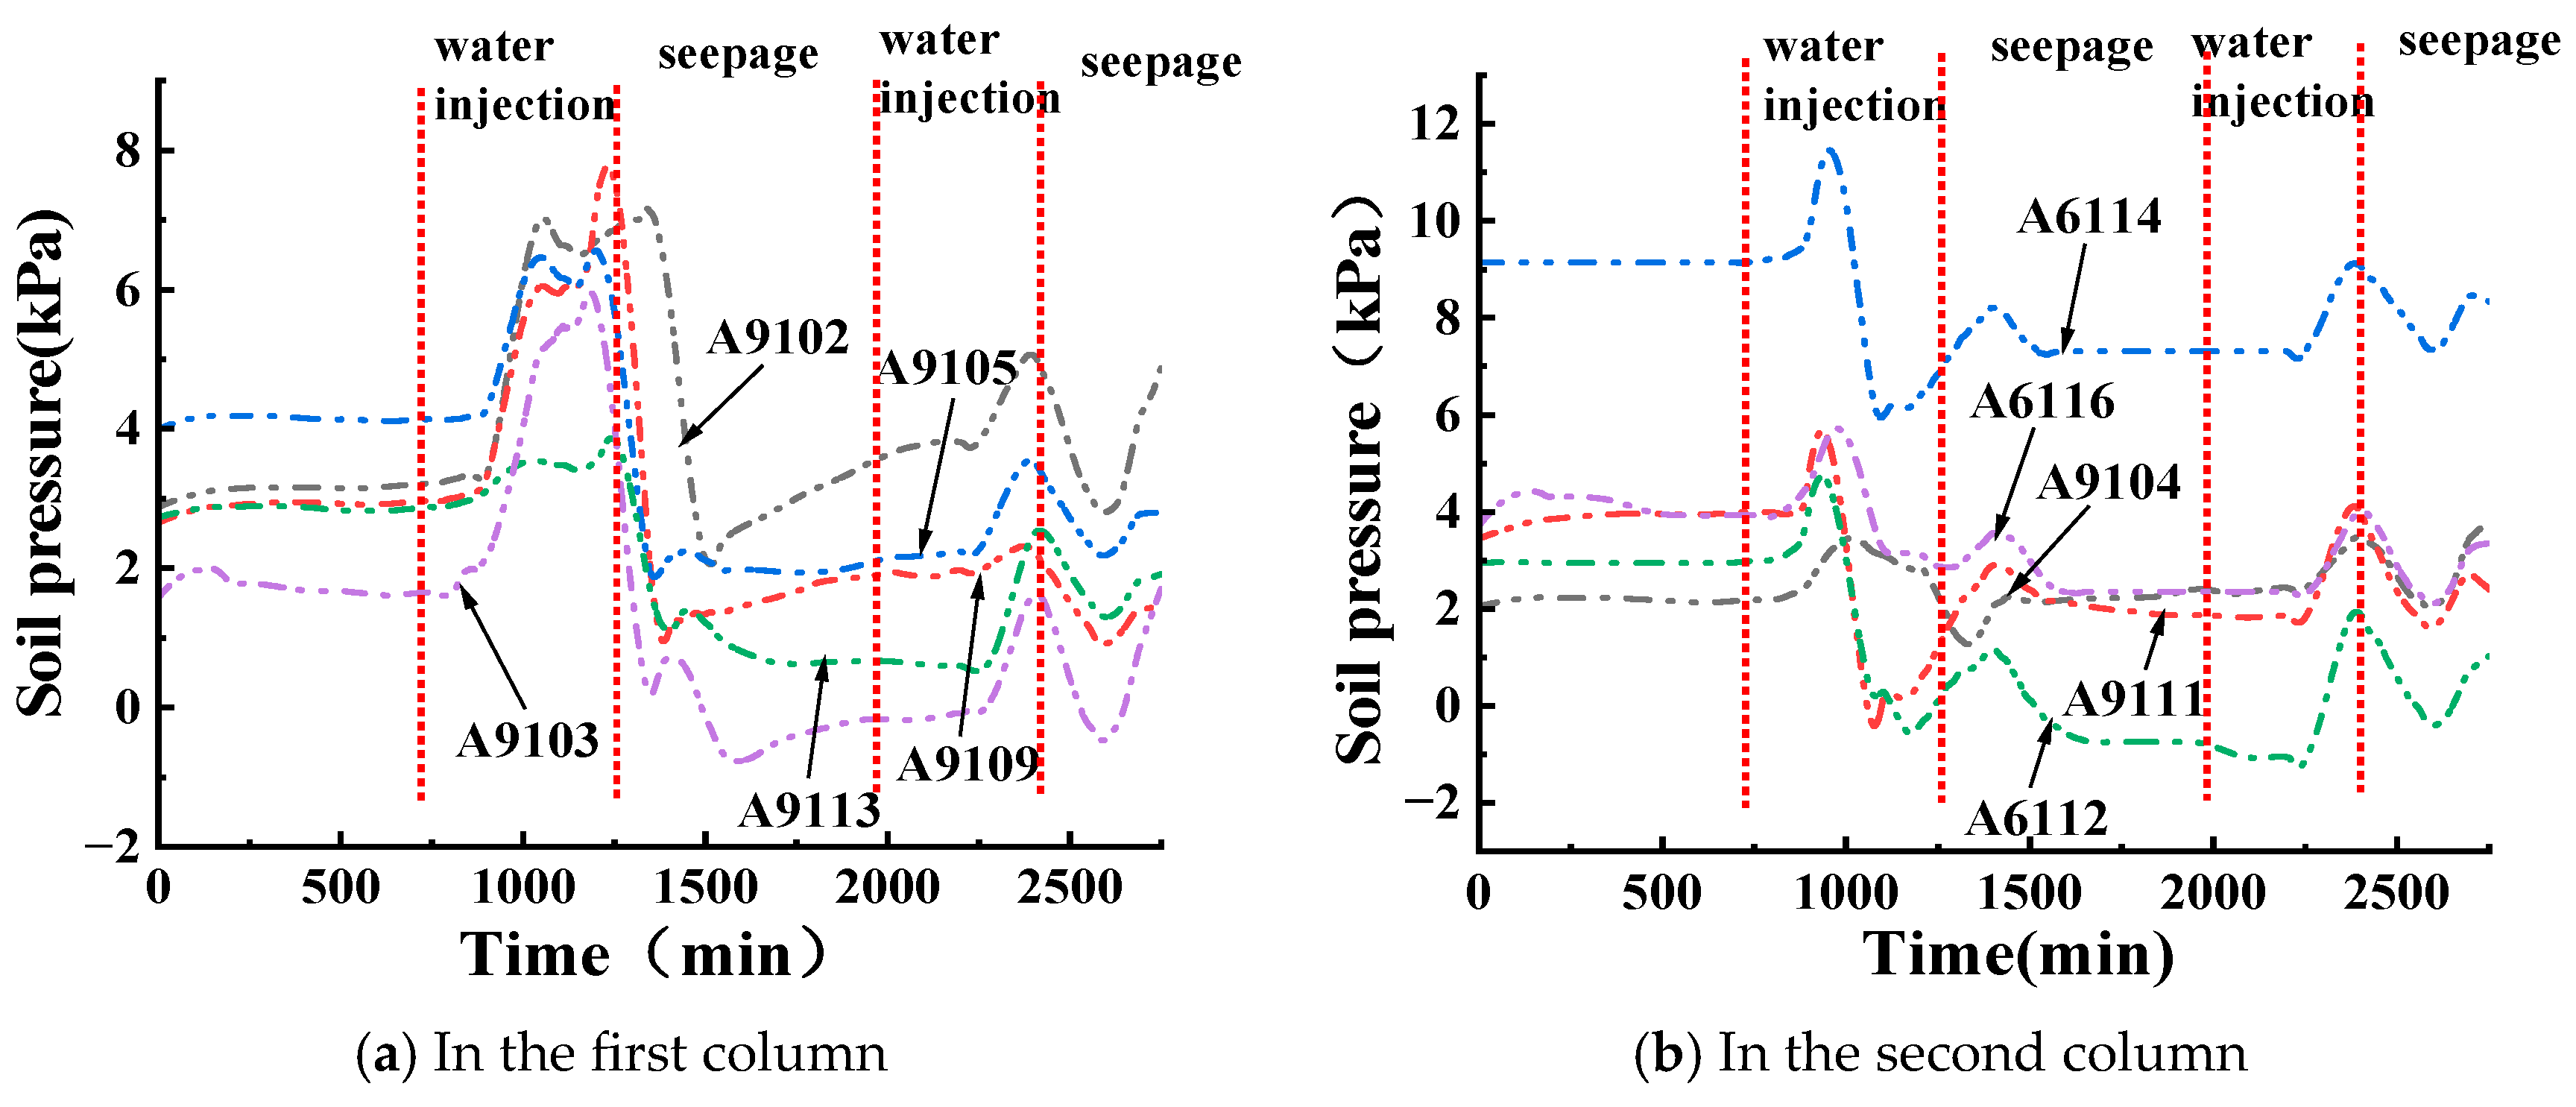
3.2.3. The Variation Law of the Vertical Soil Pressure near the Slope Surface in Condition T2 with Time

The distribution of vertical soil pressures near the slope in condition T2 is displayed in Figure 13. Before the water level change, the vertical soil pressure at monitoring point A9107 is the highest, follow by A9110, and the vertical soil pressure at monitoring point A9106 at the foot of the slope is the lowest.
After the water level change, water injection was conducted between 730 min and 1260 min, and the vertical soil pressures at monitoring points A9112, A9110, A9107, A9108, and A9106 show increasing–decreasing change trends. At the end of the first water injection, the vertical soil pressures at monitoring points A9107, A9106, A9108, A9110, and A9112 increase by 7.4%, 34.19%, 25.68%, 20.08%, and 17.63%, respectively, compared with the pressures before water injection. Between 1260 min and 1993 min, the water injection was stopped; the vertical soil pressures at the monitoring points show increasing–decreasing–increasing change trends at this seepage stage. Between 1993 min and 2382 min, water injection was conducted again, and all the vertical soil pressures at the monitoring points show basic stability–decrease changes. At the end of the second water injection, compared to the pressures before the water level change, the descending order of vertical soil pressures at the monitoring points changes is A9107, A9112, A9110, A9108, and A9106. At the end of the second water injection, the vertical soil pressures at monitoring points A9107, A9106, A9108, A9110, and A9112 decrease by 34.4%, 64.89%, 49.48%, 45.59%, and 22.13% respectively. Among them, the most significant decreases in vertical soil pressure are observed at monitoring points near the slope foot. Between 2382 min and 2666 min, water injection was stopped, entering the seepage stage again.

3.2.4. The Variation Law of the Horizontal Soil Pressure near the Slope Surface in Condition T2 with Time

The distribution of horizontal soil pressures in the first column of condition T2 is illustrated in Figure 14a. Before the water level change, the horizontal soil pressure at monitoring point A9105 is the highest, follow by A9102 located at the foot of the slope, and the horizontal soil pressure at monitoring point A9103 is the lowest.
After the water level change, water injection was conducted between 730 min to 1260 min, and horizontal soil pressures at monitoring points A9103, A9113, A9105, and A9109 show trends of first increasing and then decreasing. During water injection, the horizontal soil pressure at monitoring point A9102, located at the slope foot, shows an increasing trend. Between 1260 min and 1993 min, water injection was stopped; the horizontal soil pressures at monitoring points in the first column show trends of first decreasing and then increasing during this seepage stage. At the end of seepage, the descending order of horizontal soil pressures at monitoring points near the slope surface is A9102, A9105, A9109, A9113, and A9103. Compared with the pressures before the water level change, the horizontal soil pressures at monitoring points A9102, A9105, A9109, A9113, and A9103 increase by 12.4%, 48.34%, 34.54%, 76.76%, and 100% respectively. Between 1993 min and 2382 min, water injection was conducted again; all five horizontal soil pressures at monitoring points show increasing trends. This is because saturated red mud cannot drain immediately, thus increasing the horizontal soil pressures. At the end of water injection, the descending order of the horizontal soil pressures at monitoring points is A9102, A9105, A9113, A9109, and A9103. Compared with pressures at the end of seepage, the horizontal soil pressures at monitoring points A9102, A9105, A9113, A9109, and A9103 increase by 39.63%, 65.37%, 246.14%, 18.72%, and 166.53%. The horizontal soil pressure at monitoring point A9113 increases the most.
The distribution of horizontal soil pressures in the second column of condition T2 is illustrated in Figure 14b. Before the water level change, the magnitude of horizontal soil pressures is in the order of monitoring points A6114, A9111, A6116, A6112, and A9104.
After the water level change, the trends of horizontal soil pressures in the second column are similar to the trends in the first column. At the end of the first seepage, the descending order of horizontal soil pressures at monitoring points is A6114, A9104, A6116, A9111, and A6112. Compared to the pressures before the water level change, the horizontal soil pressures at monitoring points A6114, A9104, A6116, A9111, and A6112 decrease by 20%, 9.76%, 40.05%, 53.31%, and 100%. The horizontal soil pressure at monitoring point A6112 shows the most decrease. At the end of the second water injection, the descending order of horizontal soil pressures changes again; that is, A6114, A6116, A9104, A9111, and A6112. Compared with pressures at the end of seepage, the horizontal soil pressures at monitoring points A6114, A9104, A6116, A9111, and A6112 increase by 24.7%, 43.74%, 65.92%, 120.12% and 192.39% respectively. The horizontal soil pressure at monitoring point A6112 increases the most.
The transfer of horizontal thrust in the second column of condition T2 is divided into five groups from high to low, namely: A6116 and A9103, A6112 and A9113, A6114 and A9105, A9111 and A9109, and A9104 and A9102. At 1993 min, the first seepage ends, and the horizontal soil pressures at A6116 and A9103, A6112 and A9113, A6114 and A9105, A9111 and A9109, and A9104 and A9102 decrease by 40.05% and 100%, 100% and 76.76%, 20% and 48.34%, 53.31% and 34.54%, and 9.76% and 12.4%, respectively. The decrease in horizontal soil pressure to some extent reflects an increase in pore water content. From the horizontal soil pressures under high water level effect in condition T2, it can be seen that the horizontal soil pressures of A6116 and A9103, as well as A6112 and A9113, located close to the water level line, show a significant decrease. At the slope foot, there are increases in horizontal soil pressures at A9104 and A9102, indicating that the red mud at slope foot has a lower water content compared to other locations. After the second water injection, the horizontal soil pressures at A6116 and A9103, A6112 and A9113, A6114 and A9105, A9111 and A9109, and A9104 and A9102 increase by 65.92% and 166.53%, 192.39% and 246.14%, 24.7% and 65.37%, 120.12% and 18.72%, and 43.74% and 39.63%, respectively. During the second water injection, the increase in horizontal soil pressure is mainly due to the increase in pore water pressure. From the horizontal soil pressures under high water level effect in condition T2, it can be seen that the horizontal soil pressures at A6116 and A9103, as well as A6112 and A9113, increase the most.
From the variation of soil pressures over time under water level changes in conditions T1 and T2, it can be seen that when the slope ratio is 1:2, for low water levels, the vertical soil pressure near the slope foot decreases the most, and the horizontal soil pressure near the water level line increases the most. For high water levels, the vertical soil pressure at the slope foot and near the slope foot decreases the most, while the horizontal soil pressure near the water level line increases the most. From the distribution pattern of horizontal soil pressures under water level changes, it can be seen that the amplitude of horizontal soil pressure change is the largest near the water level line. The greater the change in horizontal soil pressure is, the higher the pore water pressure is. The increase in pore water pressure leads to a decrease in effective stress, resulting in a decrease in shear strength and an increased likelihood of damage.

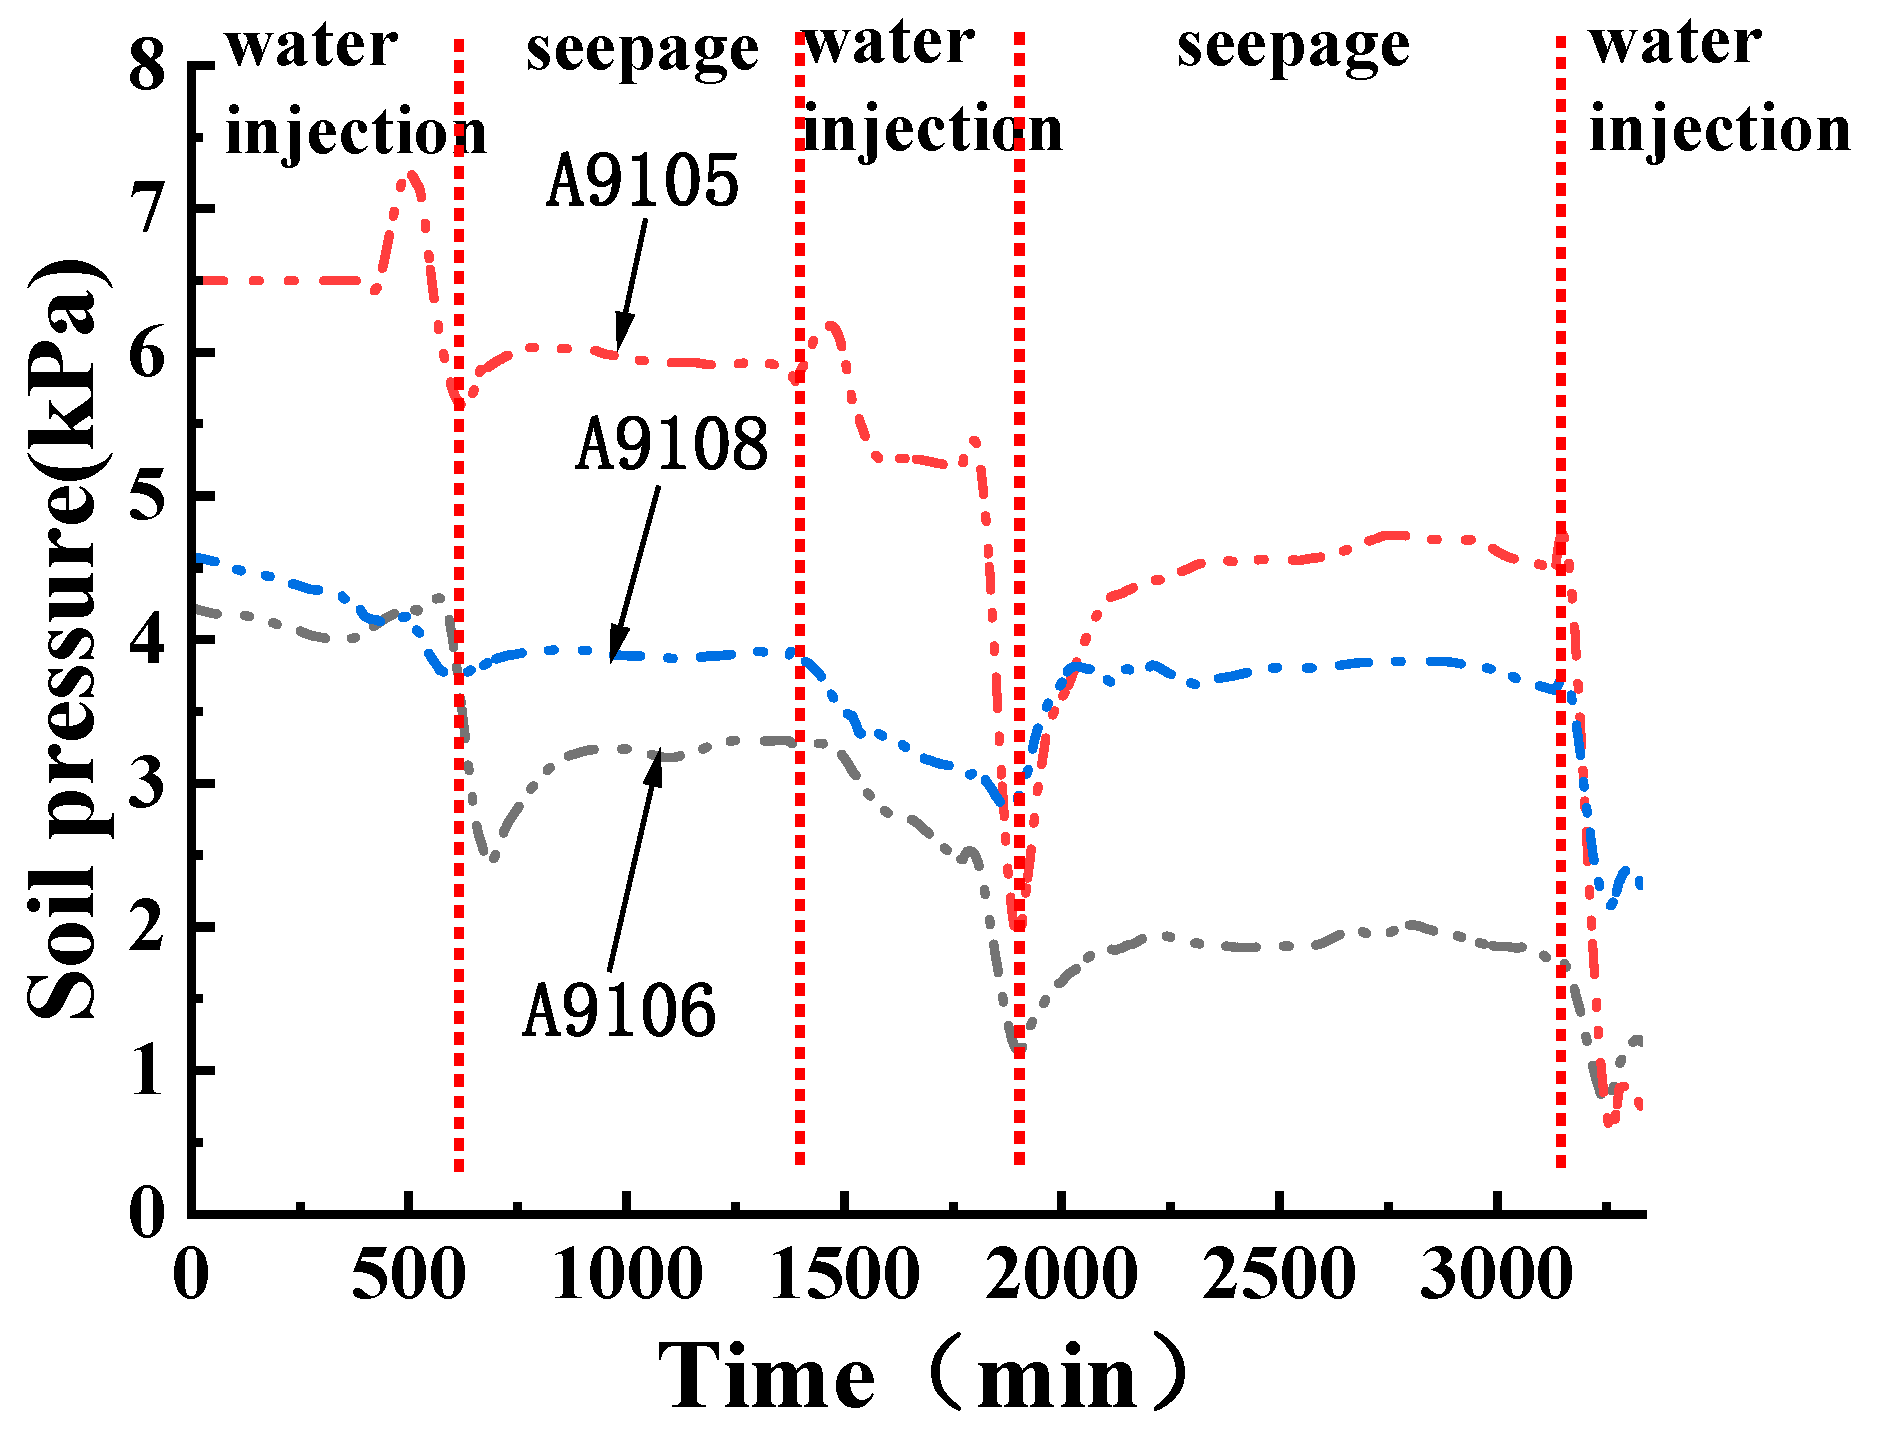
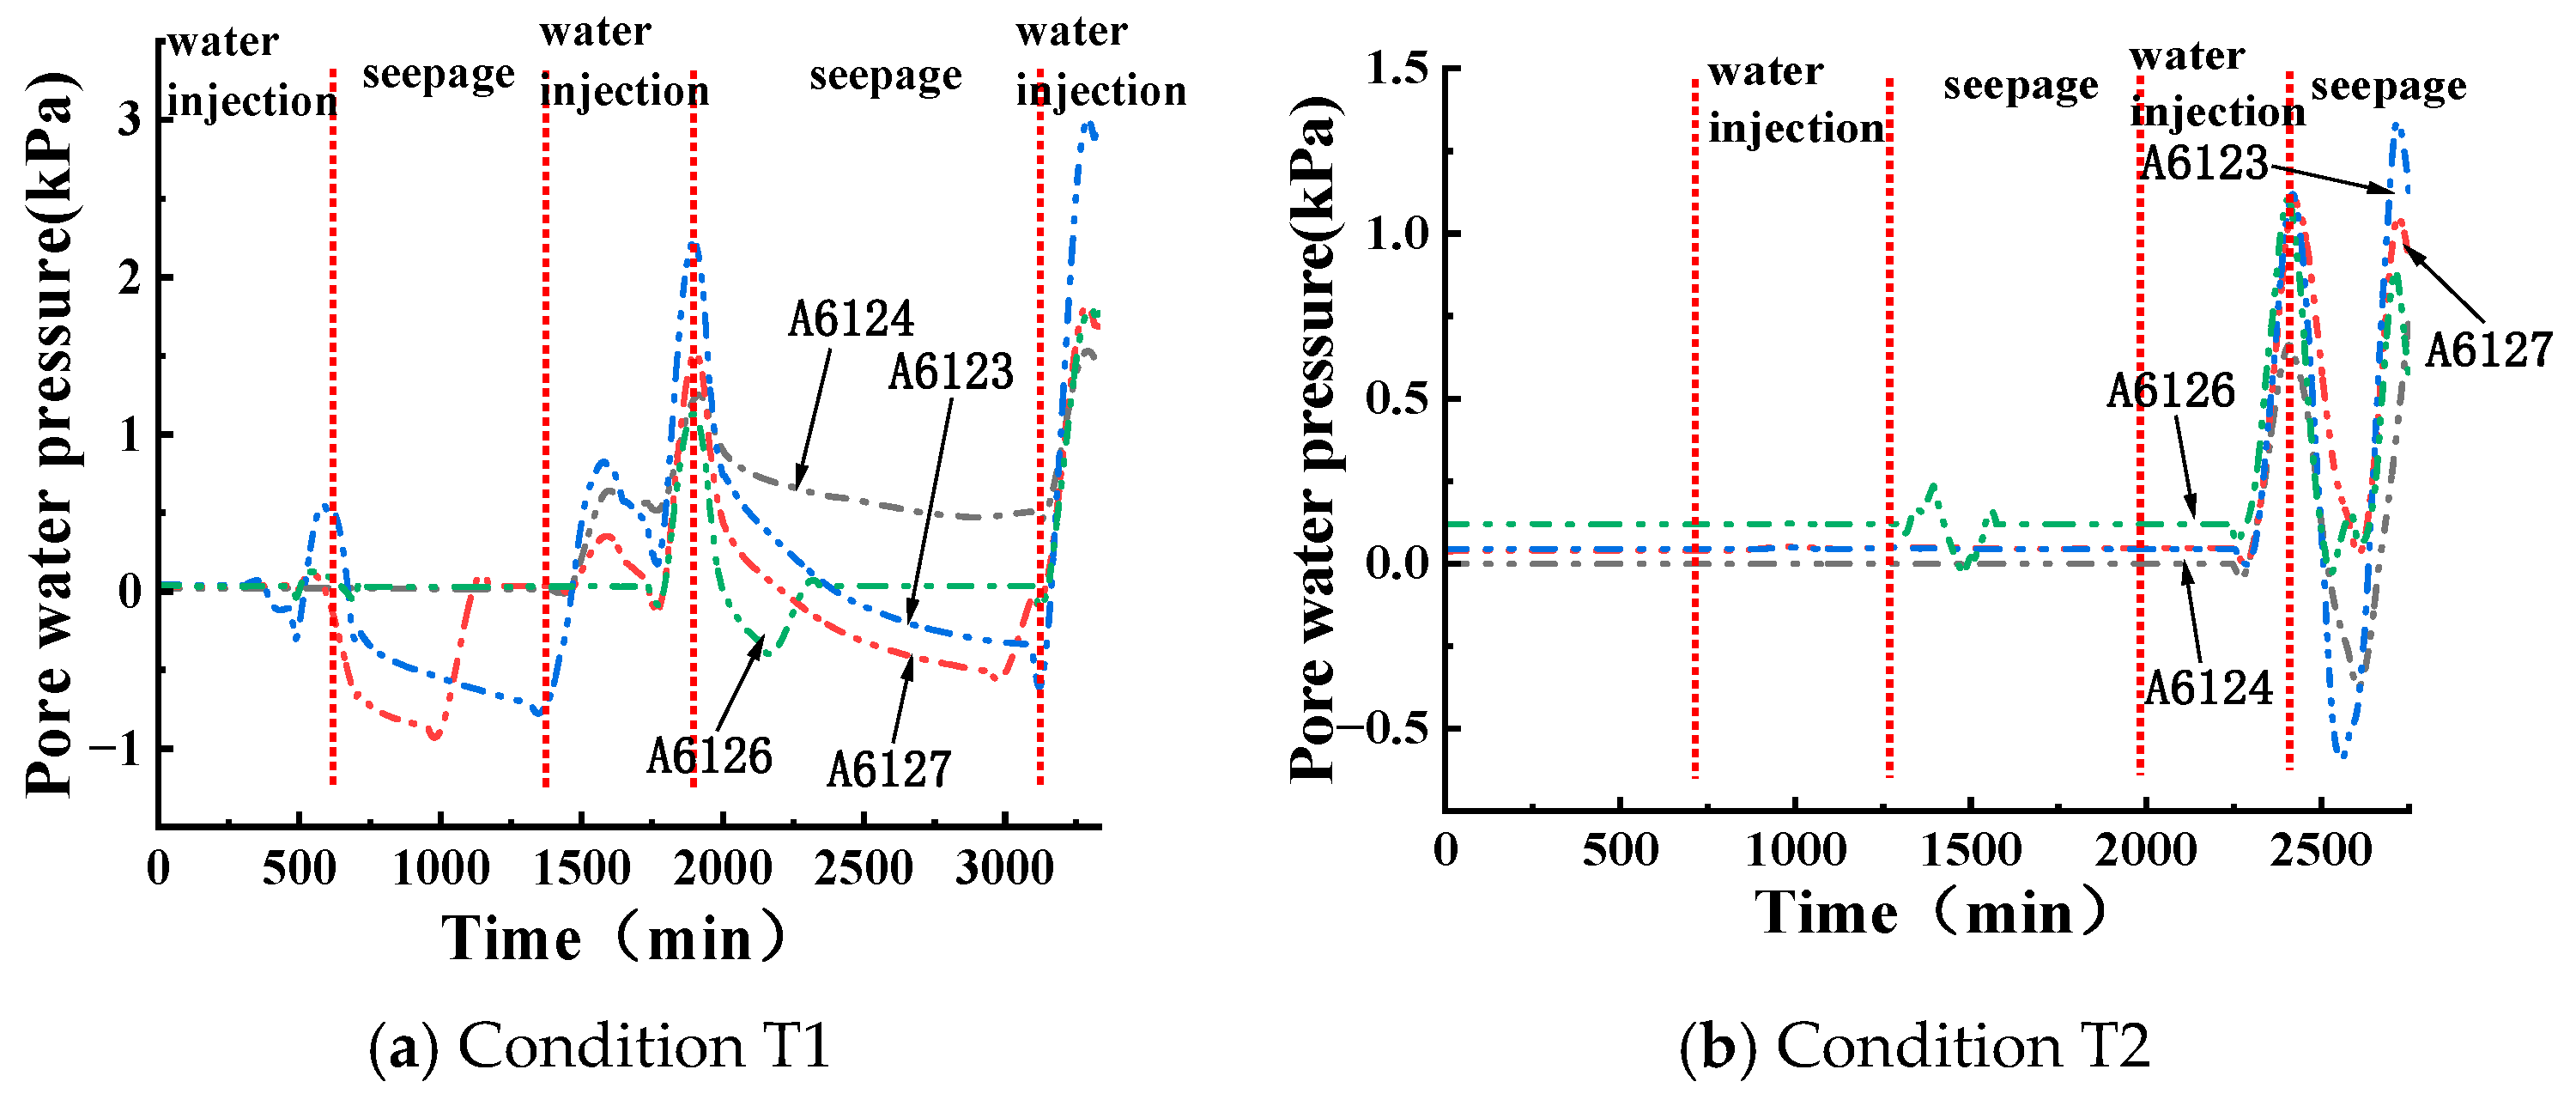
3.3. Pore Water Pressure Change Rule under Water Level Change

From Figure 11 and Figure 15a, it can be seen that the change trend of horizontal soil pressure in condition T1 is consistent with the change trend of pore water pressure in condition T1. At the end of the third water injection, the pore water pressures at monitoring points A6123, A6124, A6126, and A6127 all increased compared to the pressures at the end of the second seepage. Notably, the highest pore water pressure is recorded at monitoring point A6126 near the slope surface, and the most significant increase is observed at monitoring point A6123. Based on the distribution of horizontal soil pressures near the slope surface in condition T1 in Figure 11, it can be seen that monitoring point A6126 corresponds to monitoring point A9110, with the highest increase in horizontal soil pressure. Monitoring point A6124 corresponds to monitoring point A9102, with the lowest increase in pore water pressure at the foot of the slope and the lowest increase in horizontal soil pressure.
From Figure 14a and Figure 15b, it can be seen that the change trend of horizontal soil pressure in condition T2 is consistent with the change trend of pore water pressure in condition T2. As displayed in Figure 15b, at the end of the second water injection in condition T2, the pore water pressures at monitoring points A6124, A6127, A6123, and A6126 increase by 0.5761 kPa, 0.786 kPa, 0.8435 kPa, and 0.9752 Pa, respectively, compared with the pressures at end of the first seepage. Based on the distribution of horizontal soil pressures in the first column of condition T2 in Figure 14a, it can be seen that monitoring points A6126 and A6123 correspond to monitoring points A9103 and A9113, respectively. The horizontal soil pressures at monitoring points A9103 and A9113 increase the most, while the horizontal soil pressure at monitoring point A9109 increases the least.
From the change trends of pore water pressures under conditions T1 and T2, it can be seen that the pore water pressure increases most near the water level line. Combined with the change rule of soil pressure with time under the water level change in conditions T1 and T2, it is evident that the horizontal soil pressure near the water level line increases the most. The change of pore water pressure directly affects the soil pressure value; a higher pore water pressure reduces effective stress between red mud particles, weakens shear strength, and compromises dam body stability.

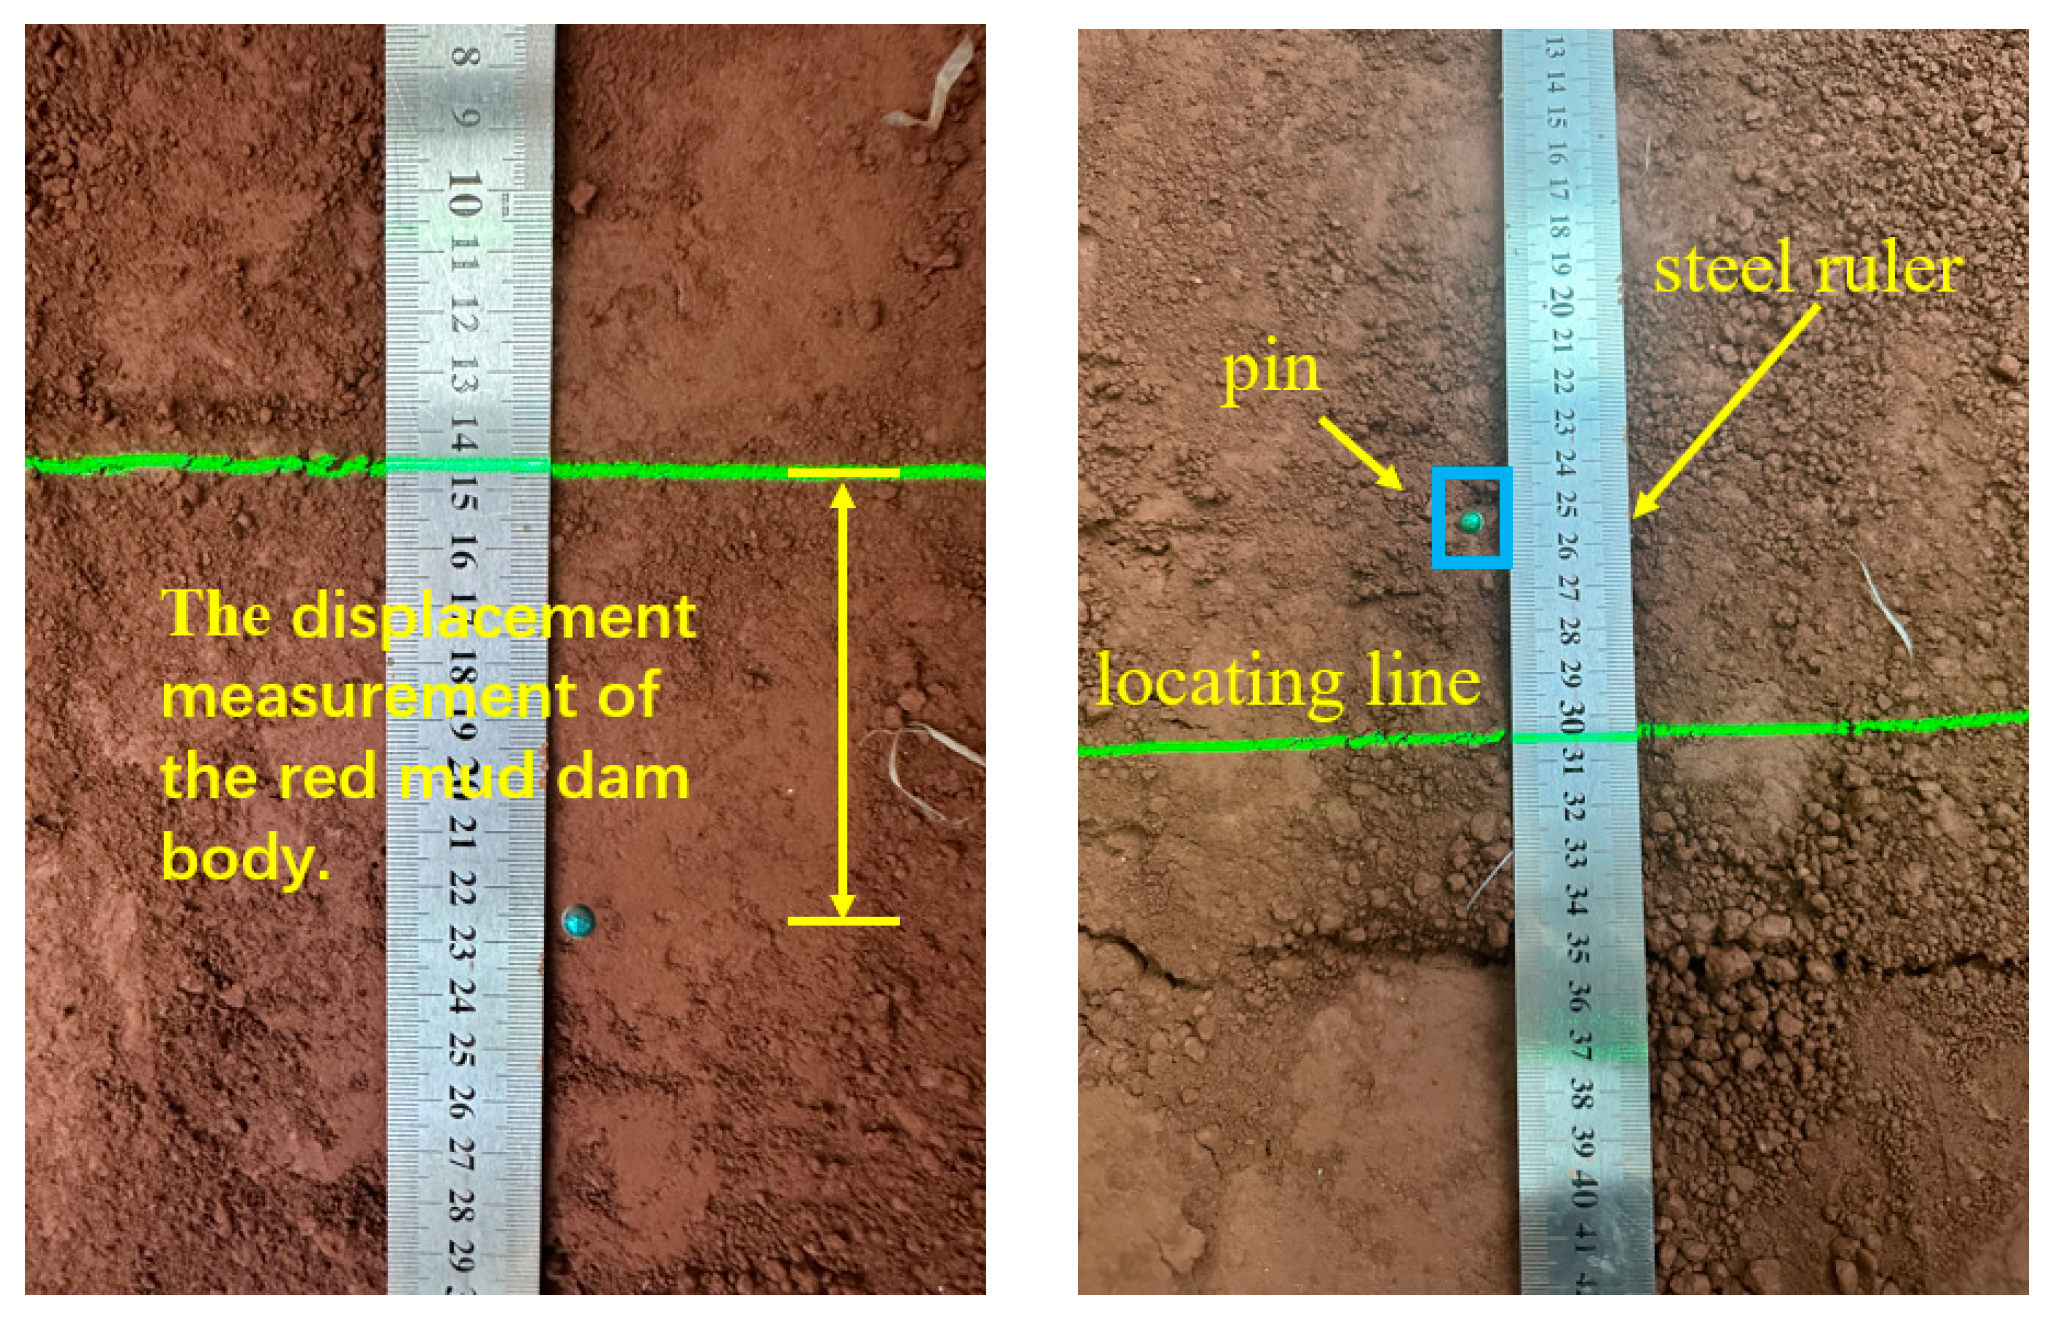
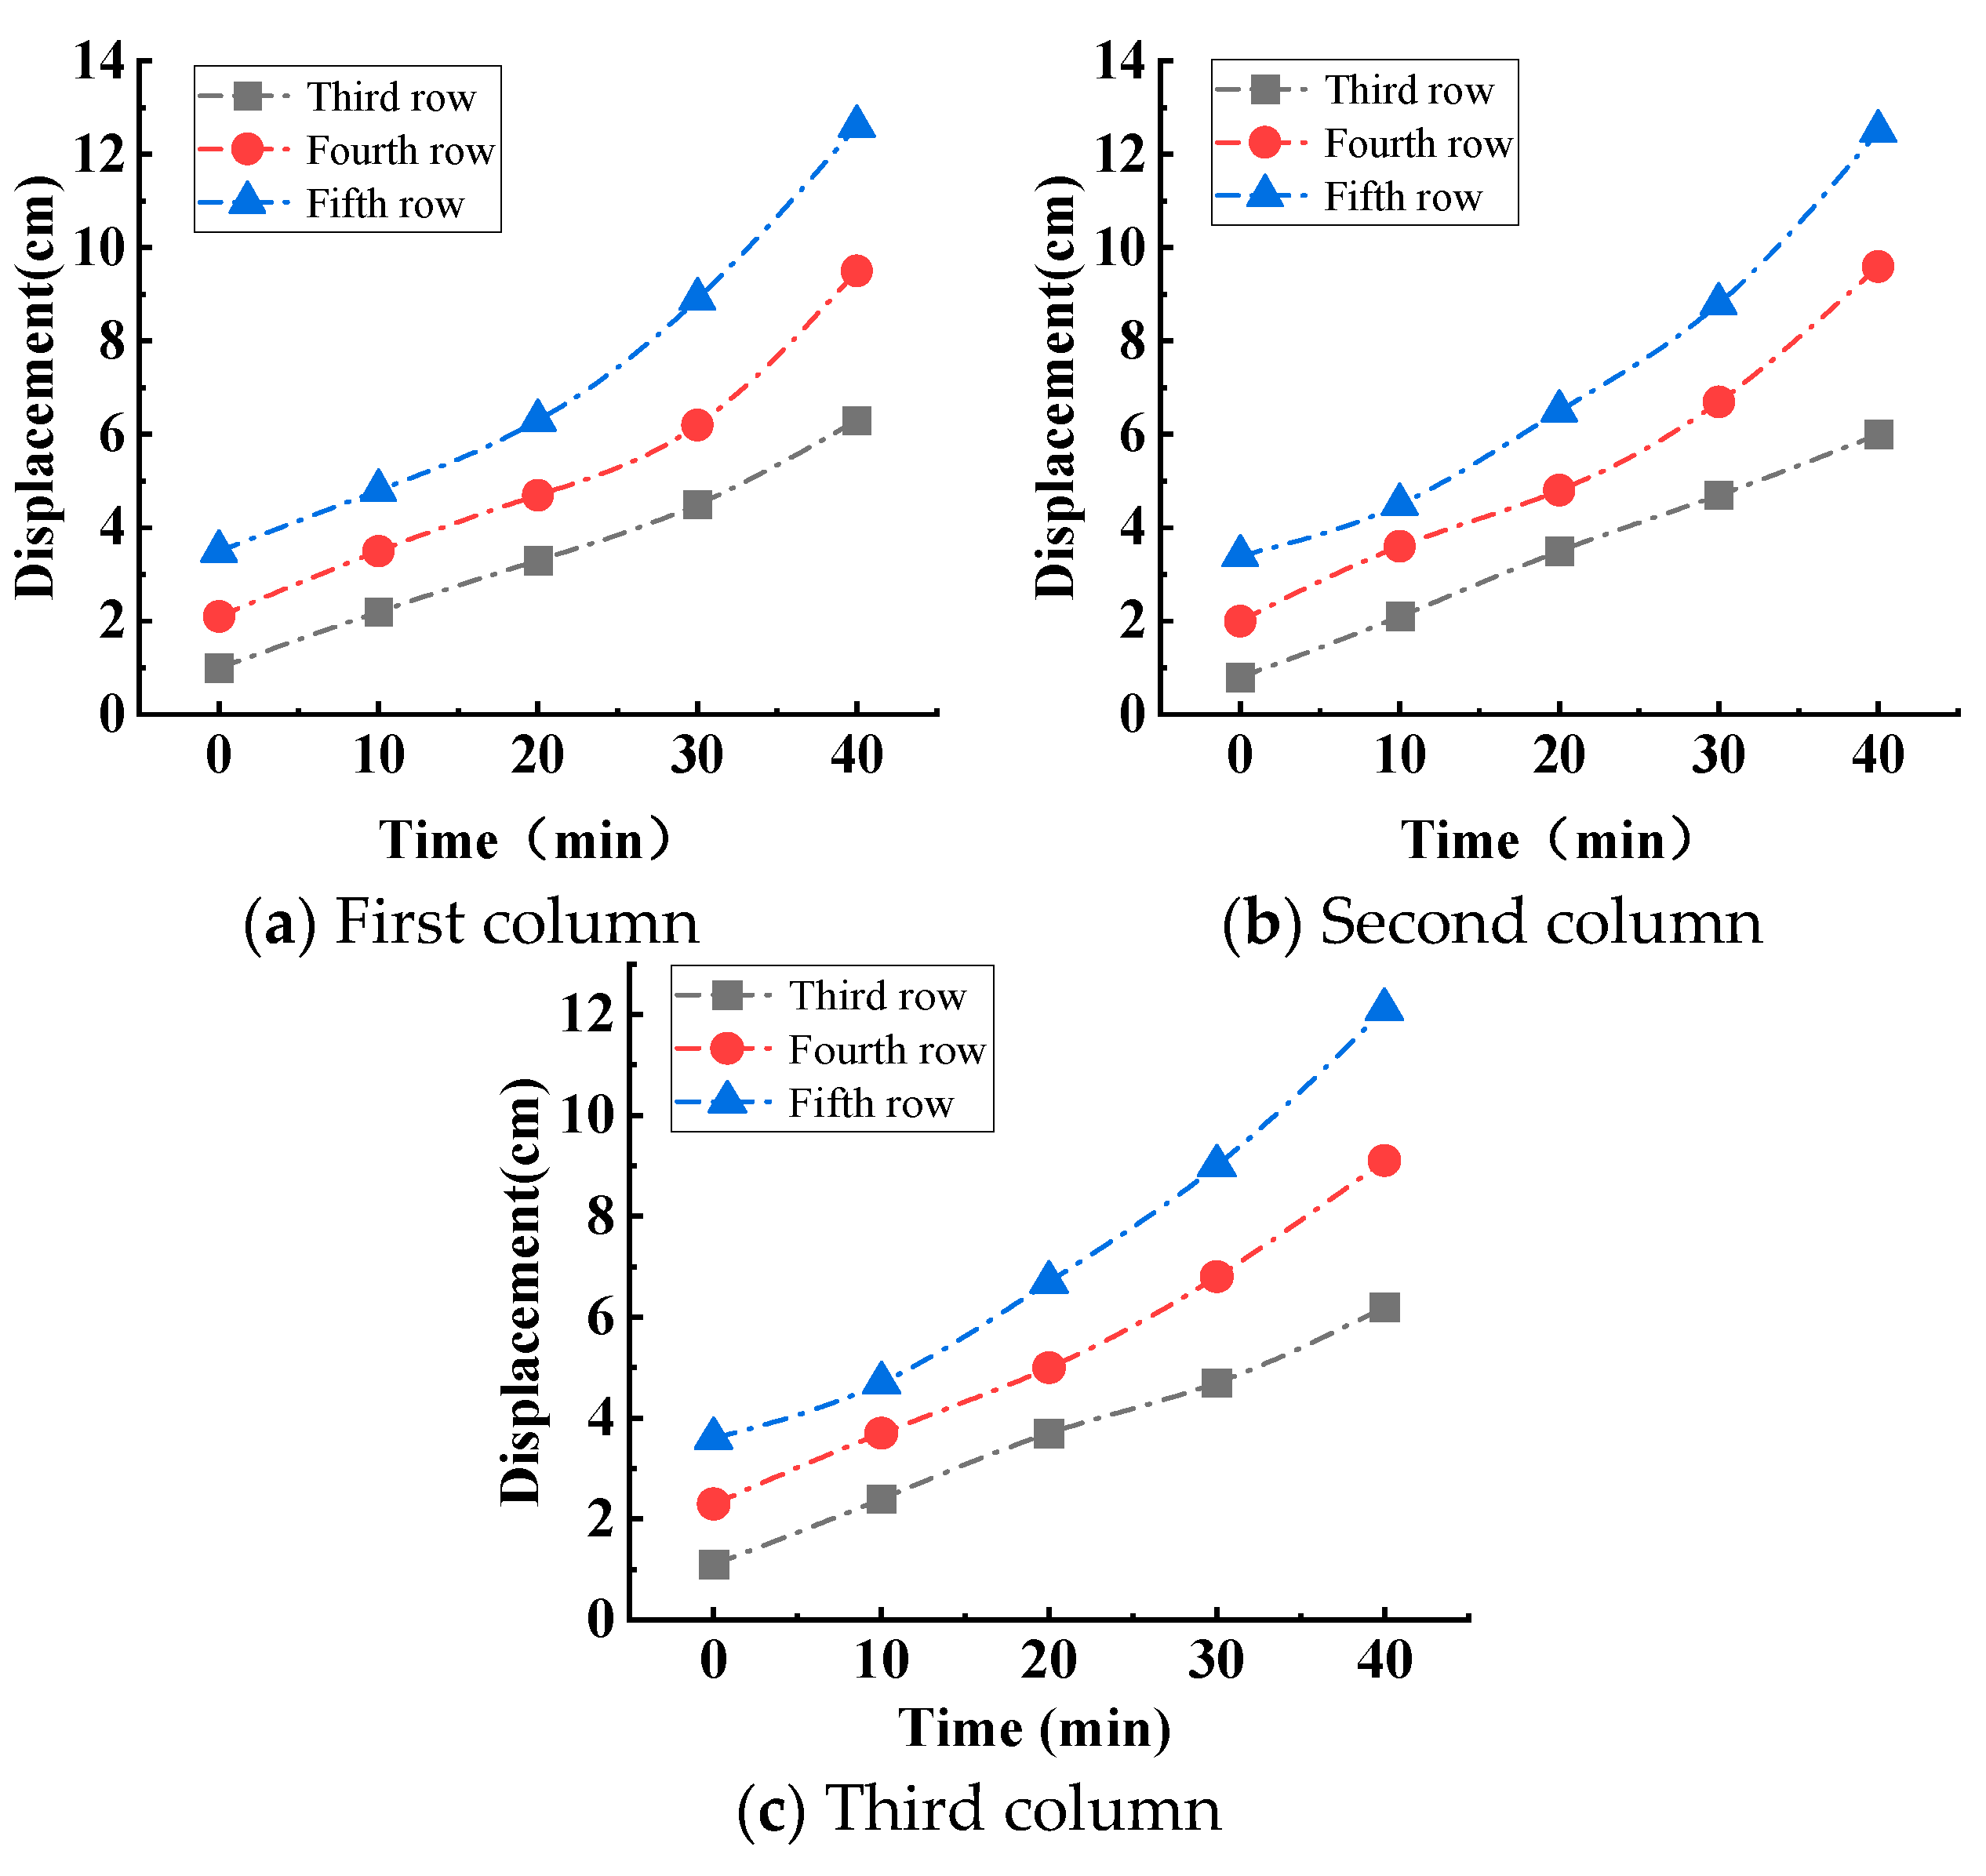
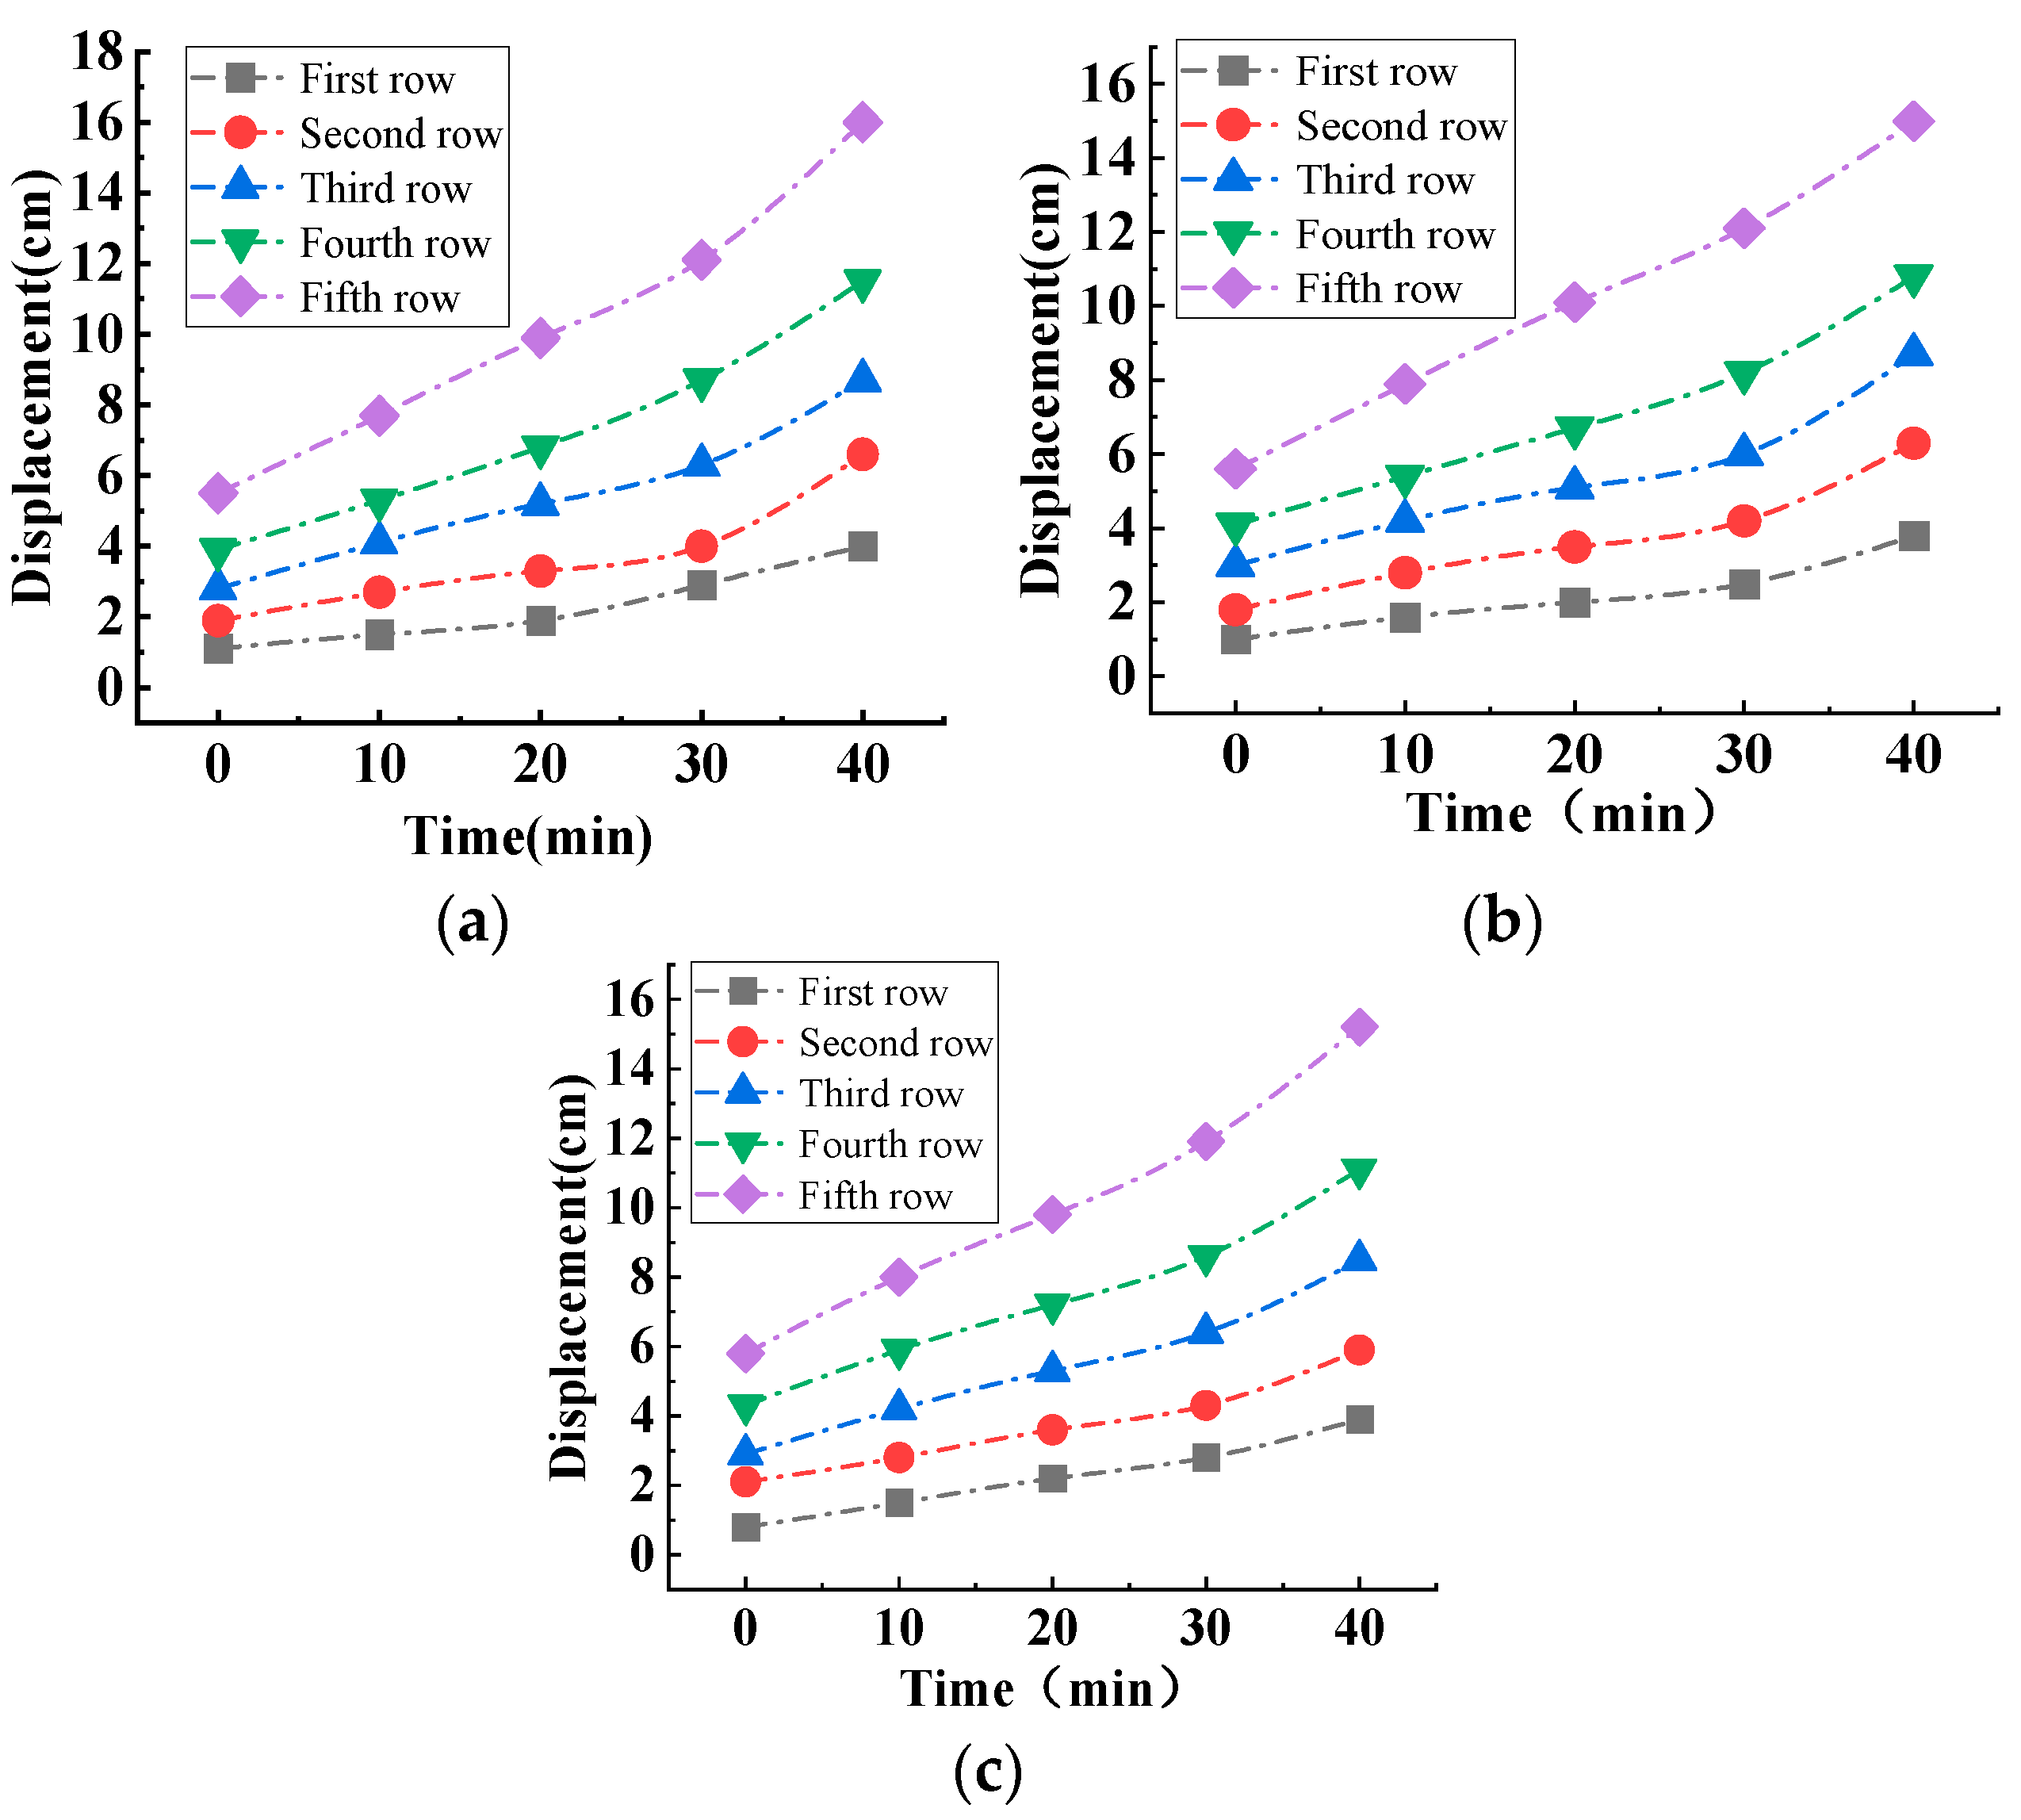
3.4. Displacement Evolution Law of Red Mud Dams with Seepage Failure at Different Water Levels

Five rows of pins were located for the displacement measurement of the red mud dam under the water level change, and each row of pins were located in three columns, which were used to observe the upper, middle, and bottom displacements of the red mud dam, respectively. The arrangements of pins are shown in Figure 16.
The displacement at each position was measured with a steel ruler close to the slope surface. Figure 17 shows the displacement measurement of the red mud dam body.
Figure 18 illustrates the displacement of the dam body where seepage failure occurs under condition T1. The infiltration line extends to the surface of the slope, causing visible cracks to emerge, and subsequent monitoring of dam body displacement. Consequently, these cracks progressively widen, leading to increased displacement along the slope.
The red mud dam body displacement measurements started after the infiltration line reached the slope and cracks started to appear, and were measured every 10 min; the results are shown in Figure 19. The displacement of the red mud dam body under condition T1 (slope ratio: 1:2, preset water level line: 36.51 cm) reveals that the infiltration line does not fully cover the slope surface upon reaching the slope surface. The first two rows of pins show no displacement, registering 0, while the subsequent three rows below the infiltration line exhibit notable displacements. The displacement pattern of the dam’s pins indicates a gradual increase in the third row, a faster increase in the fourth row compared to the third, and the most rapid and significant increase in the fifth row. Notably, whole displacement occurs below the main crack position, resulting in no displacement in the first two rows of pins. The pins in the third row, located close to the main crack, primarily reflect the crack’s expansion, with the displacement proportional to the crack’s widening. The fifth row of pins, located at the slope’s base, record the largest displacements following the dam body’s displacement.
Figure 20 illustrates the displacement of the dam body where seepage failure occurs under condition T2. The infiltration line reaches the entire slope surface, and the cracks appear at the top of the slope. Subsequently, these cracks progressively widen, causing a continuous increase of displacement.
In Figure 21, the displacement of the red mud dam body under condition T2 (slope ratio: 1:2, preset water level line: 60.85 cm) reveals the infiltration line completely covers the entire slope surface upon reaching the slope surface. All pins on the slope surface have significant displacements. The displacements of first and second rows increase slowly, the displacements of fourth row increase faster than the displacements of third row, and the displacements of the fifth row have the most pronounced increment. Due to the high water level, the main crack is located at the dam top, with overall displacement occurring below the main crack; the displacements of the front two rows exhibit minimal variation, while the third, fourth, and fifth rows show significant displacement, with the fifth row having the greatest displacement. It can be observed that the larger the primary crack expansion is, the greater the whole displacement of the red mud dam body is.
Based on the displacements resulting from seepage failure under conditions T1 and T2, when the slope ratio is 1:2, at low water levels, the infiltration line does not encompass the entire slope surface, resulting in predominant dam body displacement below the infiltration line. Conversely, at high water levels, the infiltration line covers the entire slope surface causing displacement across the entire slope of the dam body. The dam body displacement is attributed to the continuous expansion of the primary cracks occurring during seepage failure; the higher the water level is, the greater the dam body displacement is.

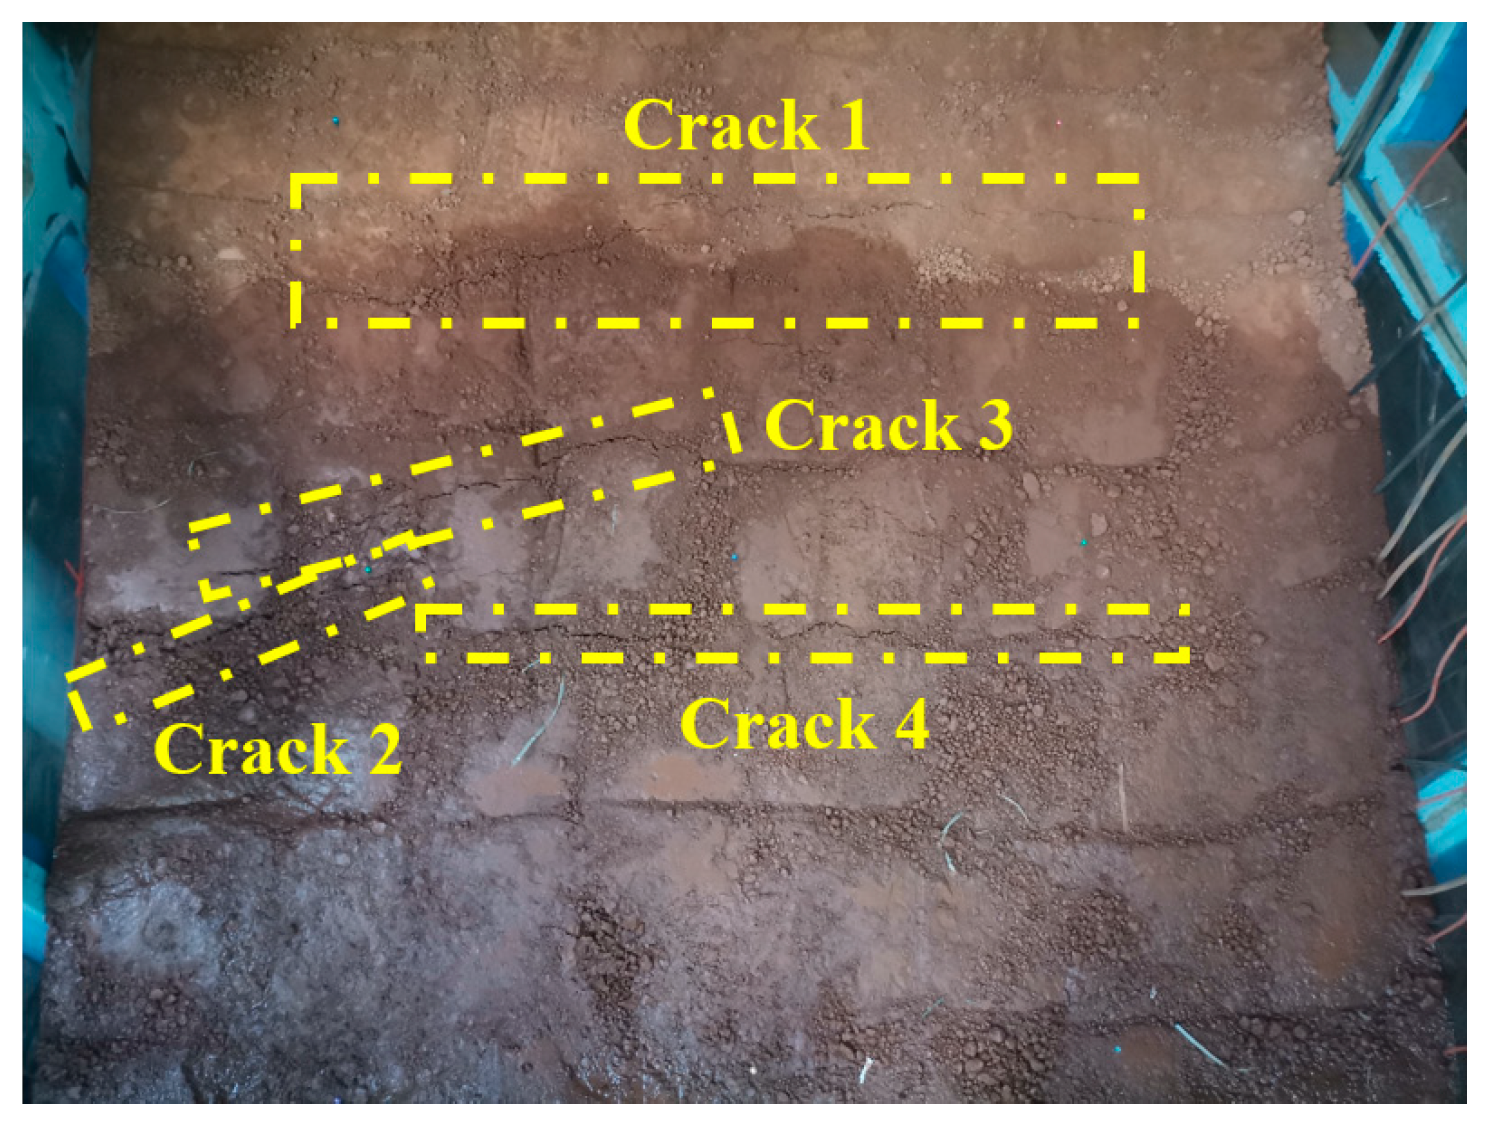
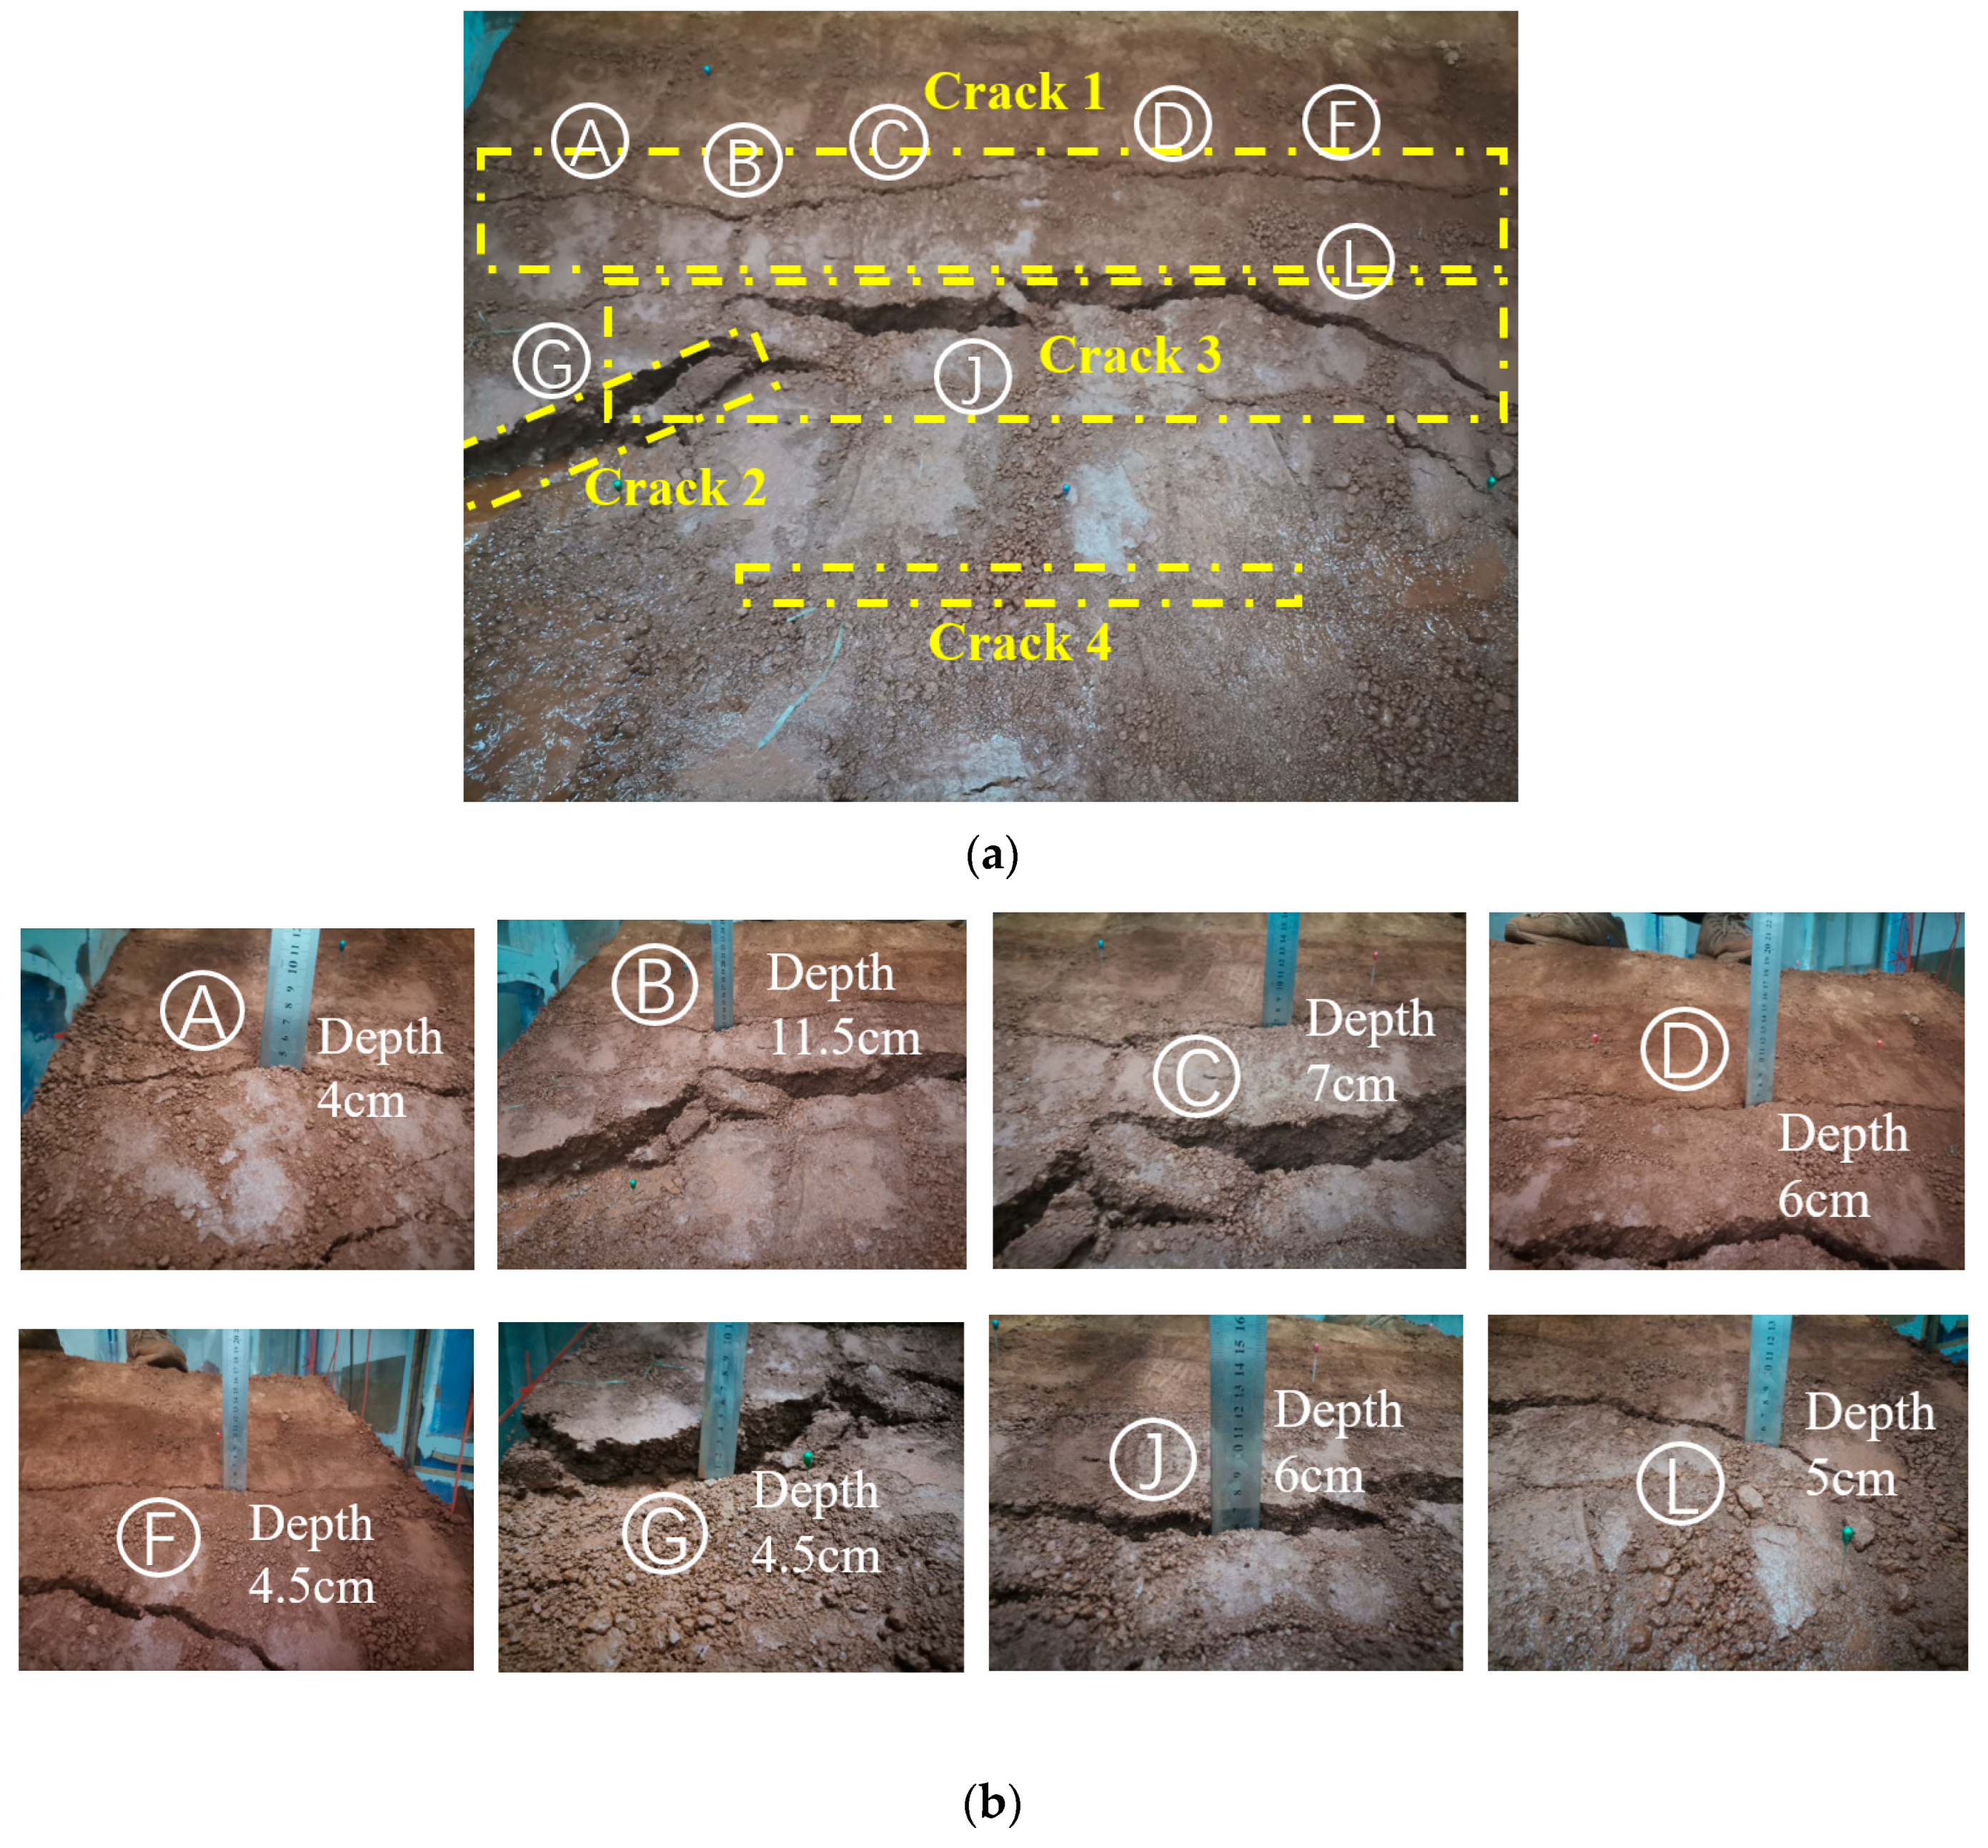
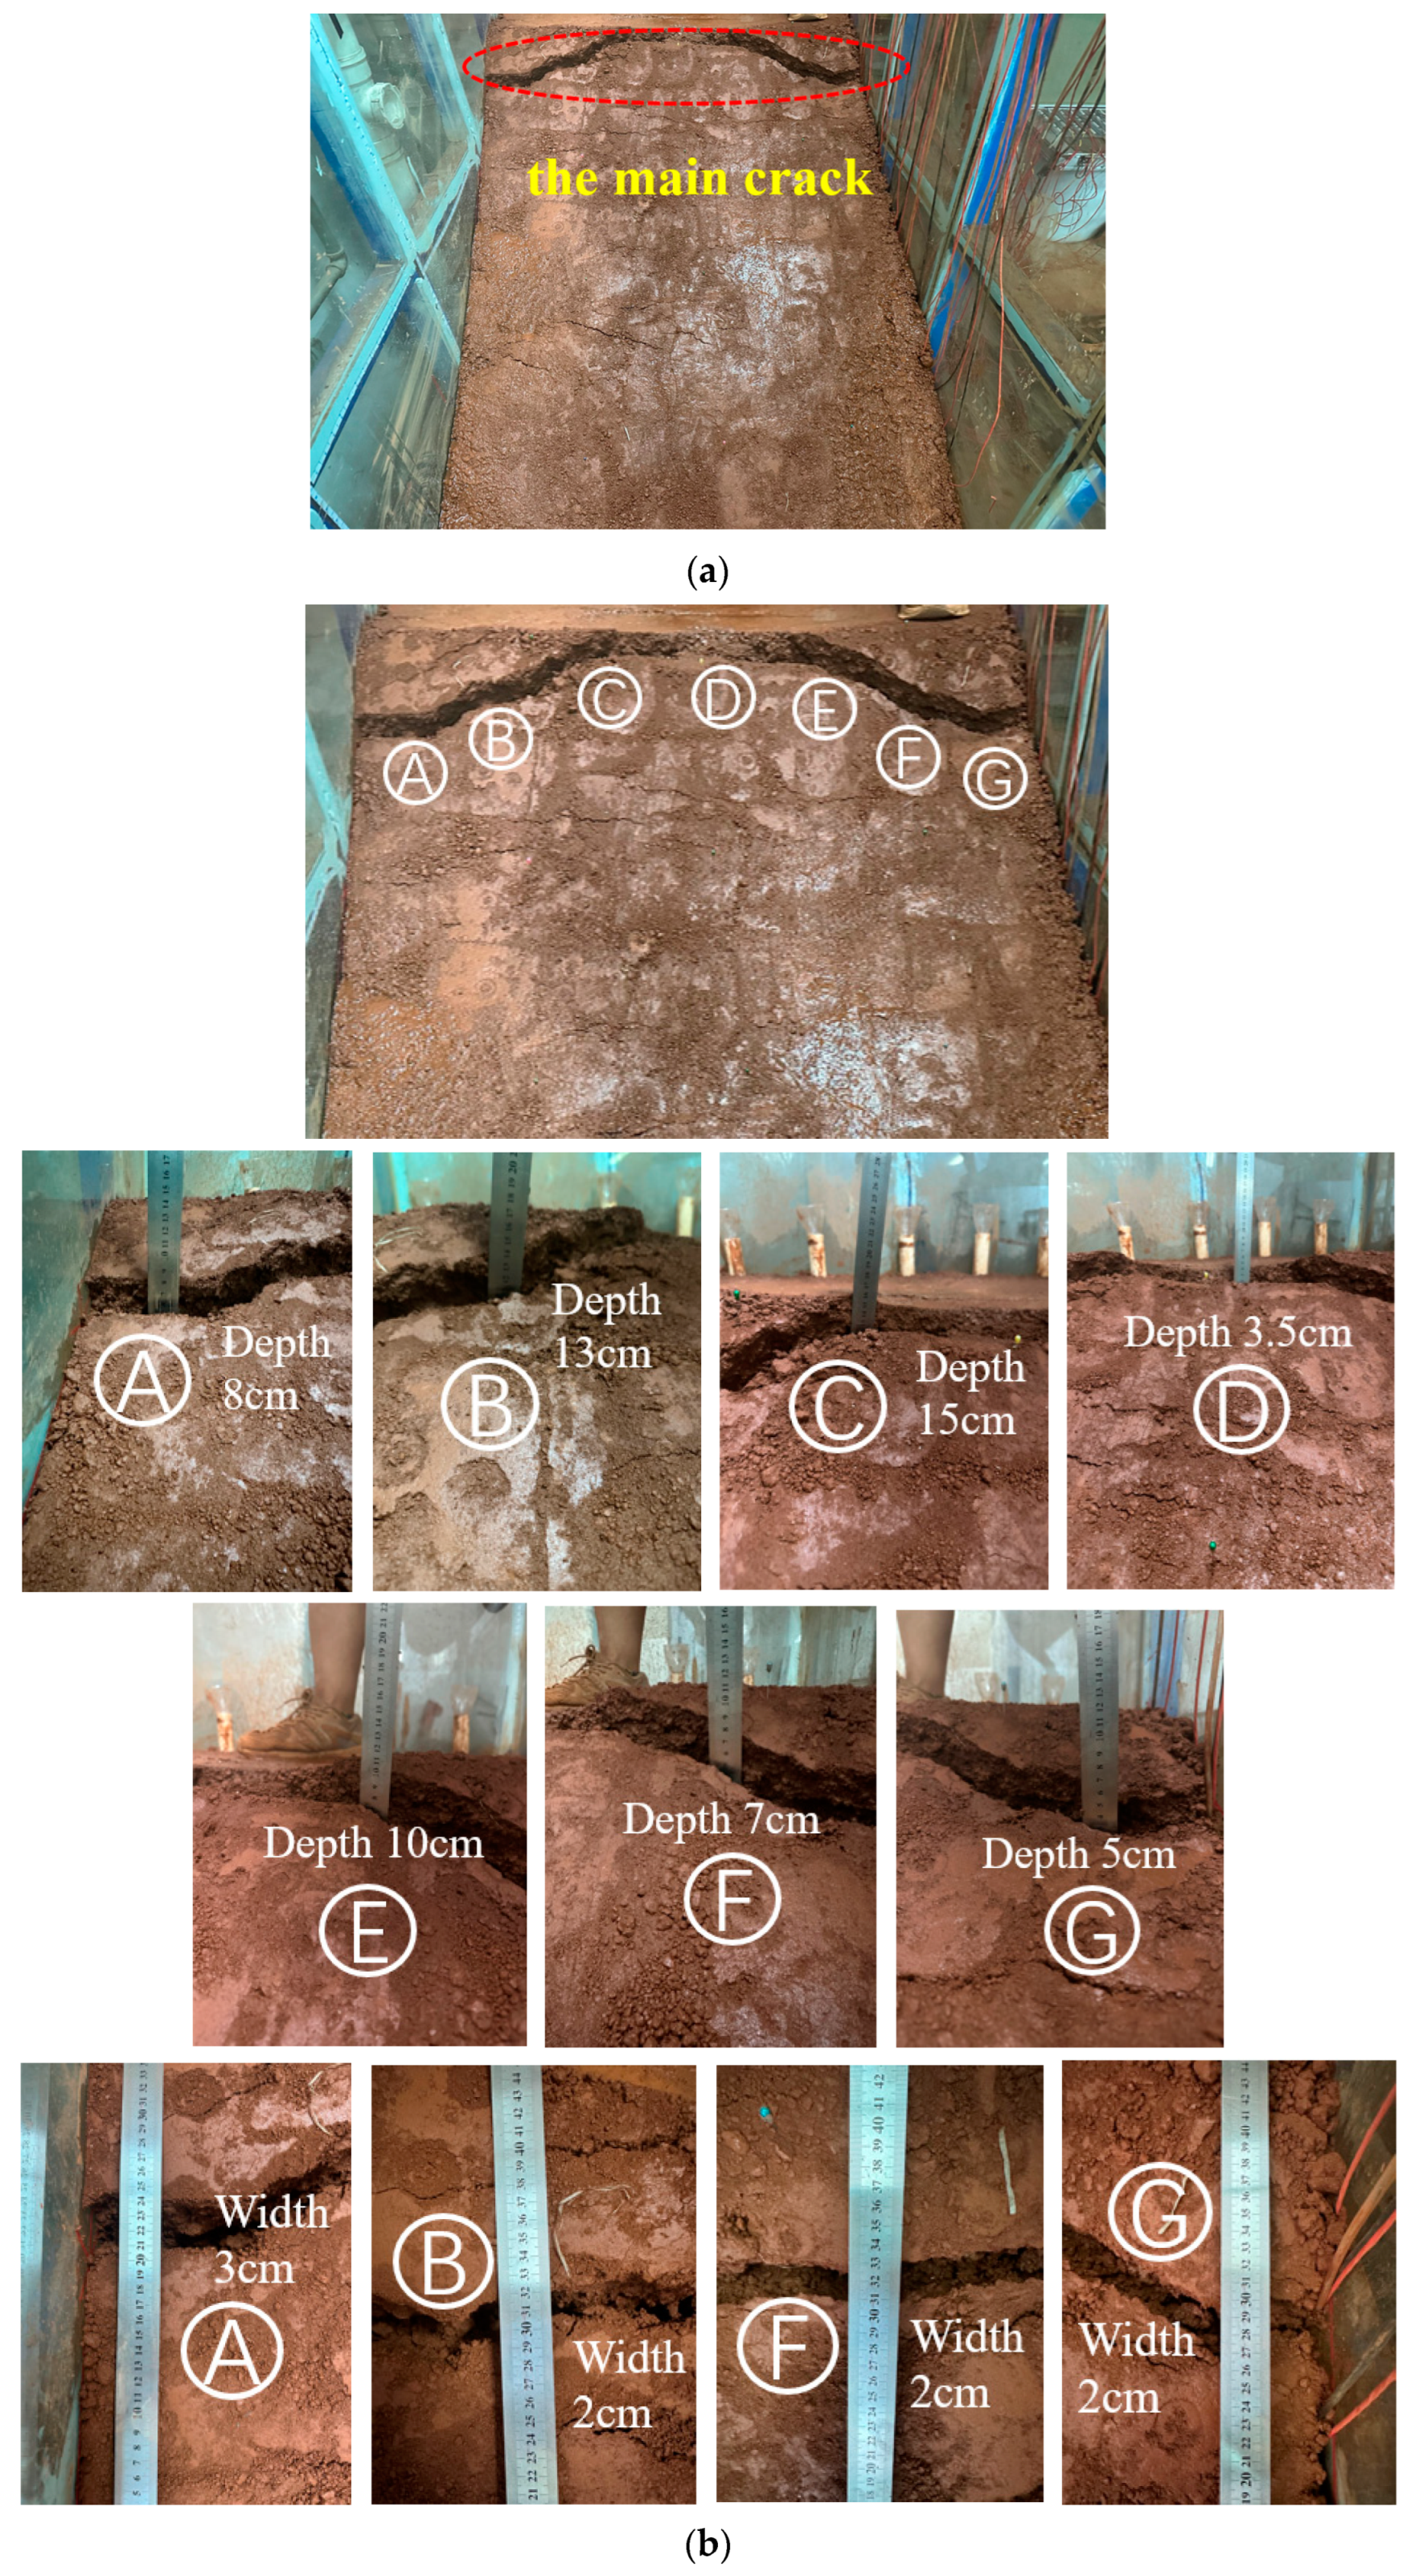
3.5. Evolution Law of Cracks in Red Mud Dams with Seepage Failure at Different Water Levels

In conditions T1 and T2, the slope ratios were 1:2, and the predefined water levels were 36.51 cm and 60.85 cm, respectively. Condition T1 corresponds to a low water level, where the seepage line does not cover the entire slope surface. The primary crack resulting from seepage erosion appears in the slope center as a longitudinal crack across the entire slope surface. Contrastingly, condition T2 is characterized by a high water level, where the seepage line covers the entire slope surface. The major crack induced by seepage erosion is located at the top of the slope, again manifesting as a longitudinal crack that extends across the entire slope top.

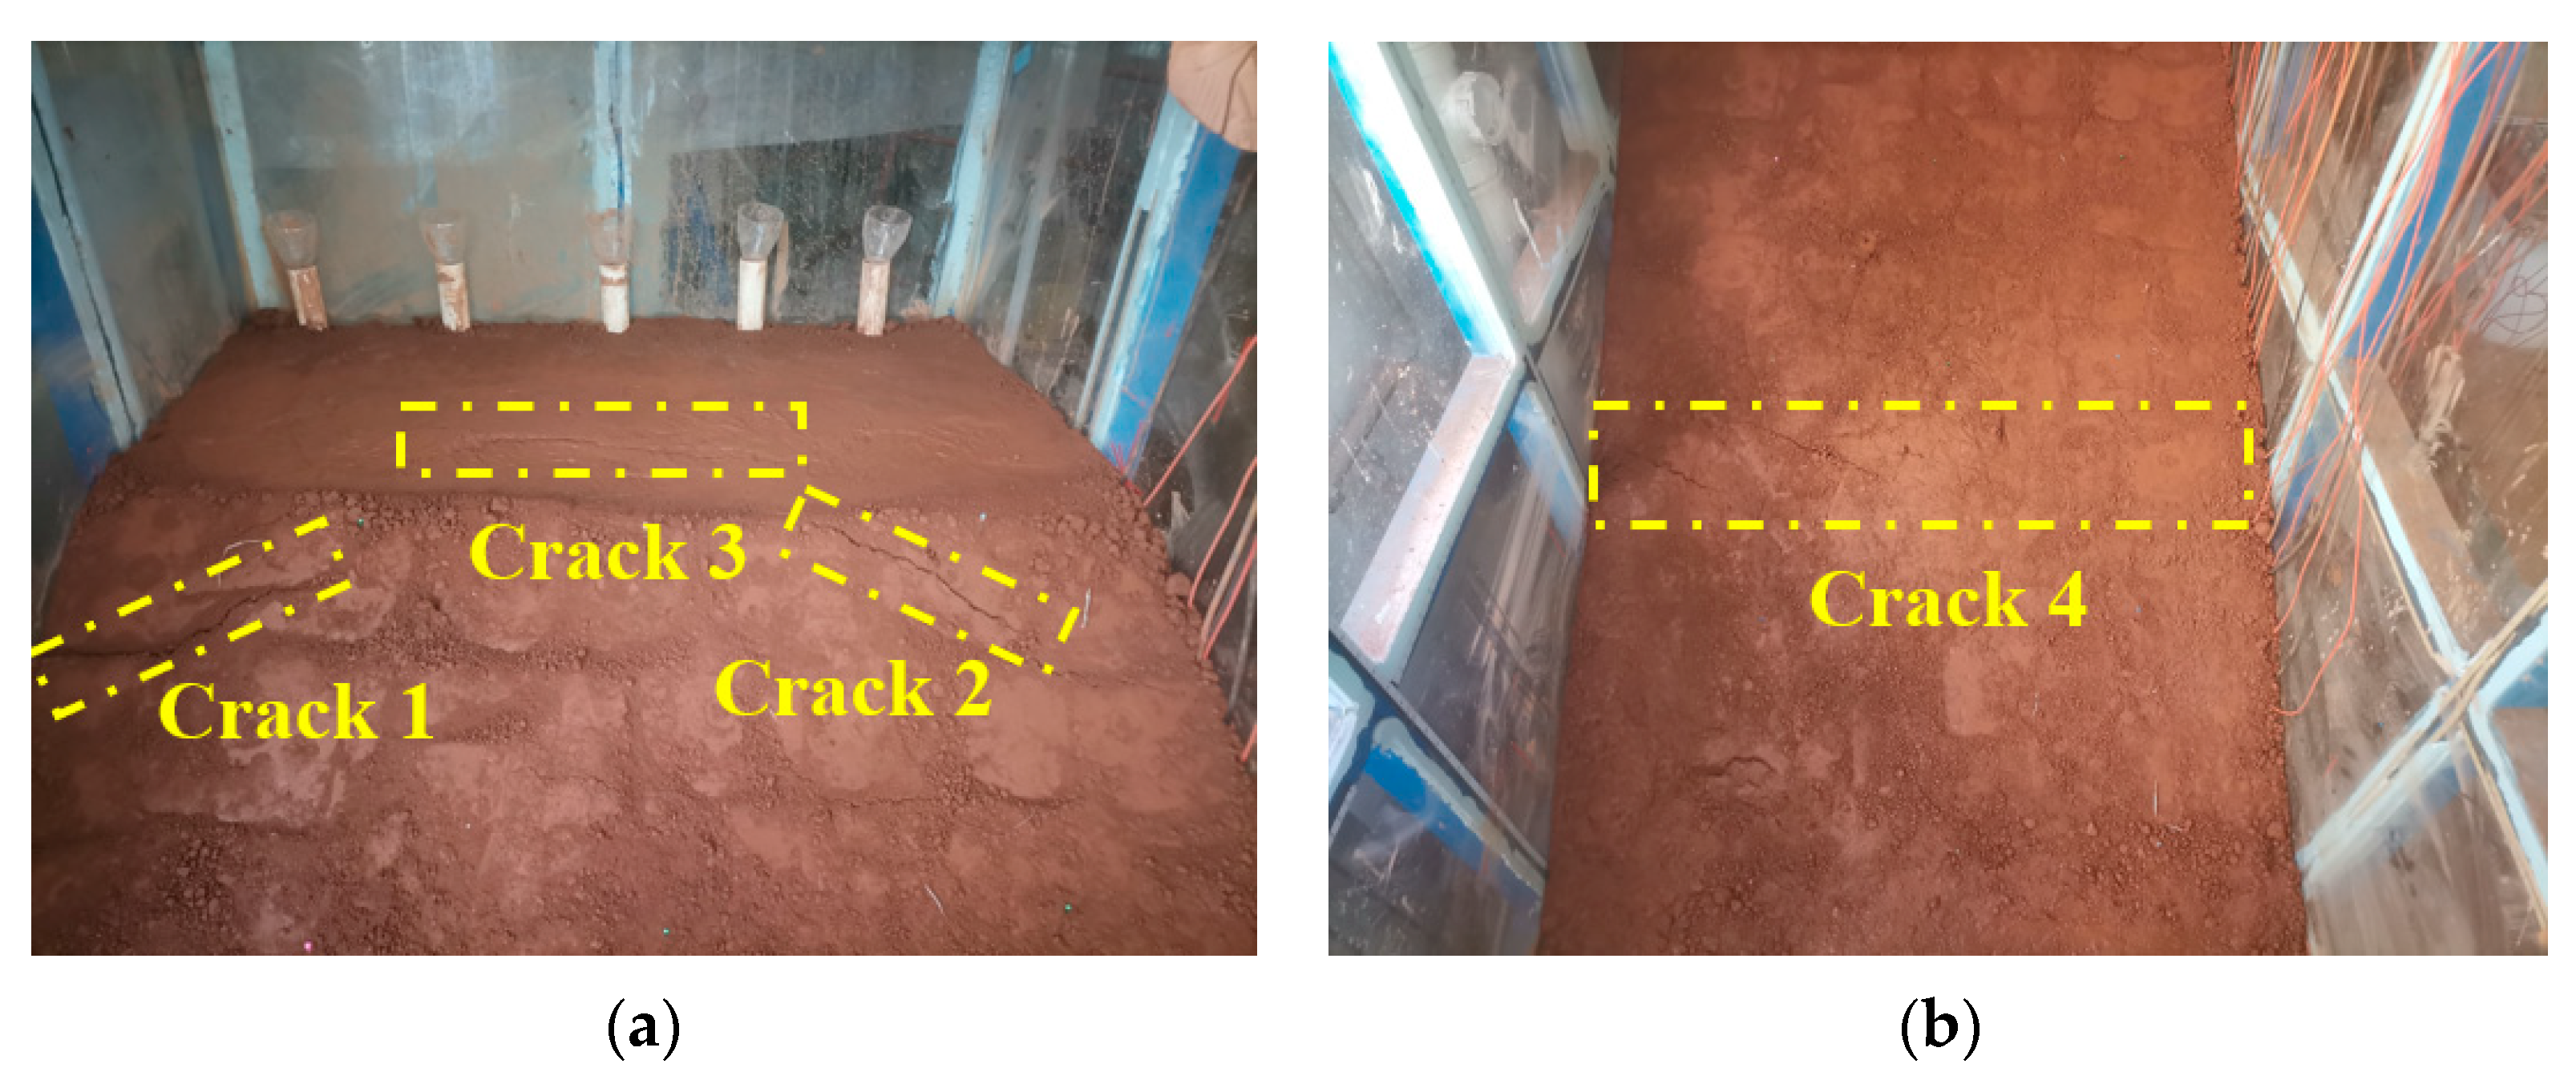
3.5.1. Evolution Law of Cracks in Red Mud Dams with Seepage Failure in Condition T1

In Figure 22 under Condition T1, micro cracks are observed on the slope. When the water level was set as 36.51 cm, the infiltration line does not completely cover the entire slope. During the initial development phase, four longitudinal cracks primarily appear near and below the slope, and they are parallel to the axis of the red mud dam body. These cracks are respectively labeled as Crack 1, Crack 2, Crack 3, and Crack 4. When micro cracks appear, the widths of Crack 1, Crack 2, Crack 3, and Crack 4 are approximately 2–3 mm. Crack 1 and Crack 4 are relatively longer, exceeding half of the slope width, while Crack 2 is the shortest and is located close to the model tank edge. The development and expansion of micro cracks can be observed from Figure 23. Crack 1 almost runs through the entire red mud dam body, Crack 2 extends towards the middle section of the dam body, Crack 3’s length exceeds more than half of the slope width, and Crack 4 shows minimal change.
From Figure 24a, the longitudinal cracks expansions are as follows: Crack 1 runs through the red mud dam body, and the width significantly increases; the width of Crack 2 also significantly increases and extends along the length direction to Crack 3; for Crack 3, the length remains basically unchanged, but the width increases most significantly; however, Crack 4 remains almost unchanged. In order to summarize the crack expansion laws, the depths of points A, B, C, D, F, G, J, and L were measured. According to the dates in Figure 24b, the depth of point A is 4 cm, point B is 11.5 cm deep, point C is 7 cm deep, point D is 6 cm deep, points F and G are both 4.5 cm deep, point J is 6 cm deep, and point L is 5 cm deep.
From Figure 25a, it can be seen that the width of Crack 1 has significantly increased; Cracks 2 and 3 are connected, with significant increases in width and noticeable height difference between the cracks. Crack 4 remains basically unchanged, while Crack 5 significantly expands. In order to summarize the crack expansion laws, the depths of points A to N were measured. According to the dates in Figure 25b, the depth of point A is 9 cm, point B is 12 cm deep, point C is 7 cm deep, point D is 12 cm deep, point E is 11 cm deep, point F is 5 cm deep, point G is 5 cm deep, point H is 4.5 cm deep, point I is 7.5 cm deep, point J is 9.5 cm deep, point K is 7 cm deep, point L is 5 cm deep, point M is 4 cm deep, and point N is 2 cm deep. Compared with Figure 24b, the depths of points A, B, D, F, G, and J increase by 5 cm, 0.5 cm, 6 cm, 0.5 cm, 0.5 cm, and 3.5 cm, and the depths of points C and L remain unchanged. In the middle of the slope, the increases of crack depths are most significant, while the increases on both sides are less, and some cracks even do not increase. In addition, the widths of Cracks 1 and 3 at point B are 2.5 cm and 2.5 cm; the widths of Crack 1 and 3 at point I are the same at 2 cm; and the widths of Crack 1 and 3 at point J are 2.5 cm and 1.5 cm. It can be observed that the widths of Cracks 1 and 3 have significantly increased.
From the crack expansion laws of seepage failure in condition T1, it can be seen that during the seepage failure process, Crack 1 gradually penetrates through the width direction of the red mud, and the width and depth increase significantly. Cracks 2 and 3 finally connect, with a significant increase in width and height difference. At this time, the red mud slope has obvious displacement, Crack 4 has no significant change, and Crack 5 appears in the later stage of seepage failure. With the intensification of seepage failure, Crack 5 also shows significant expansion, and eventually Cracks 1, 2, and 3 develop into the main cracks, which are the main cracks causing the damage to the red mud dam.

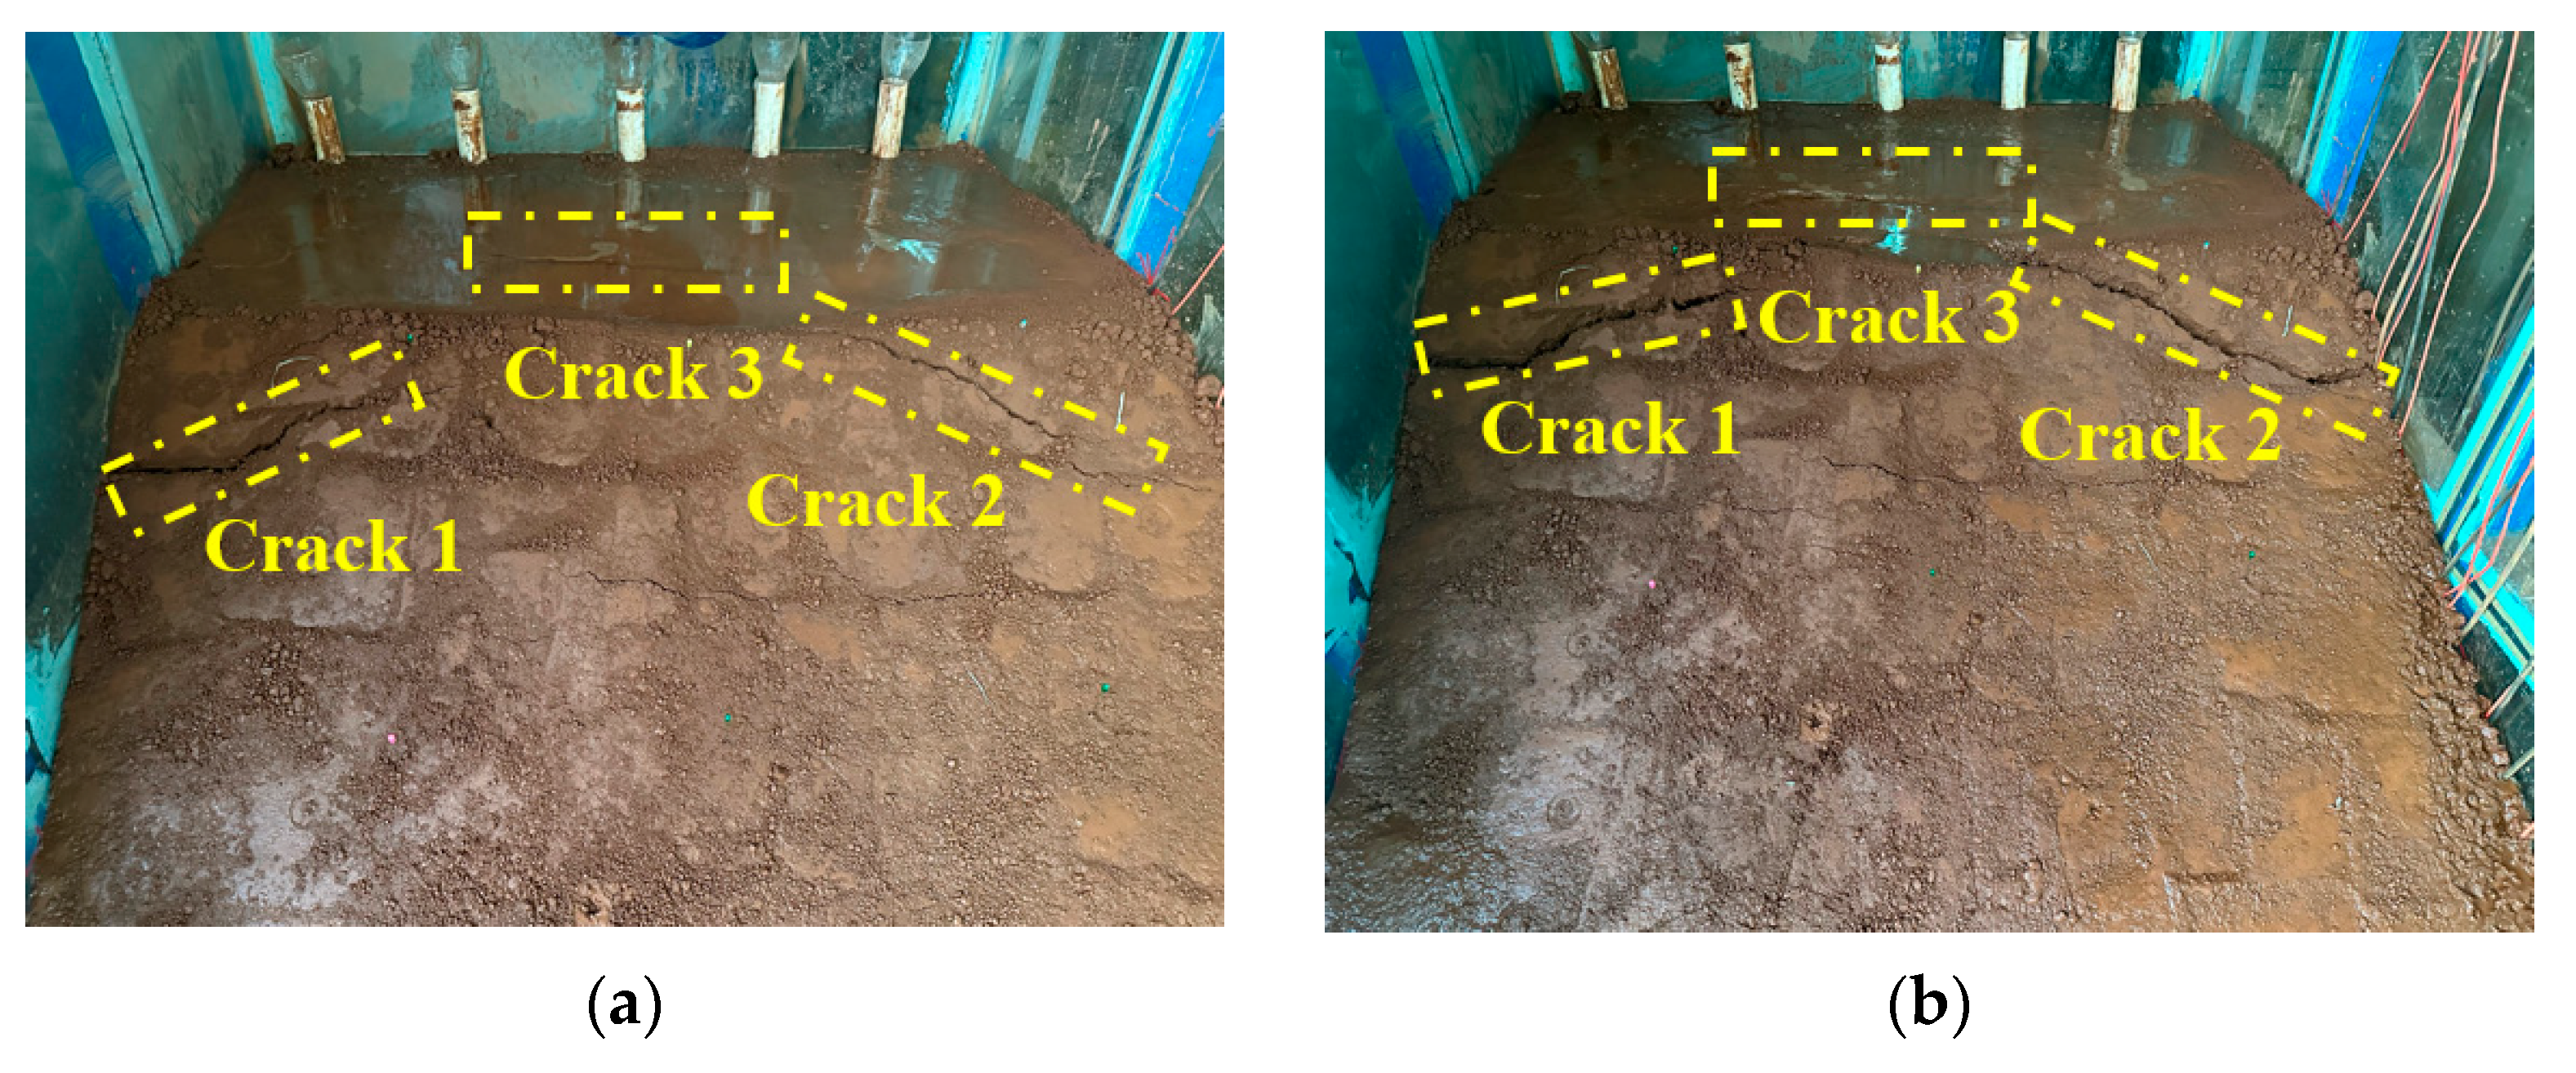
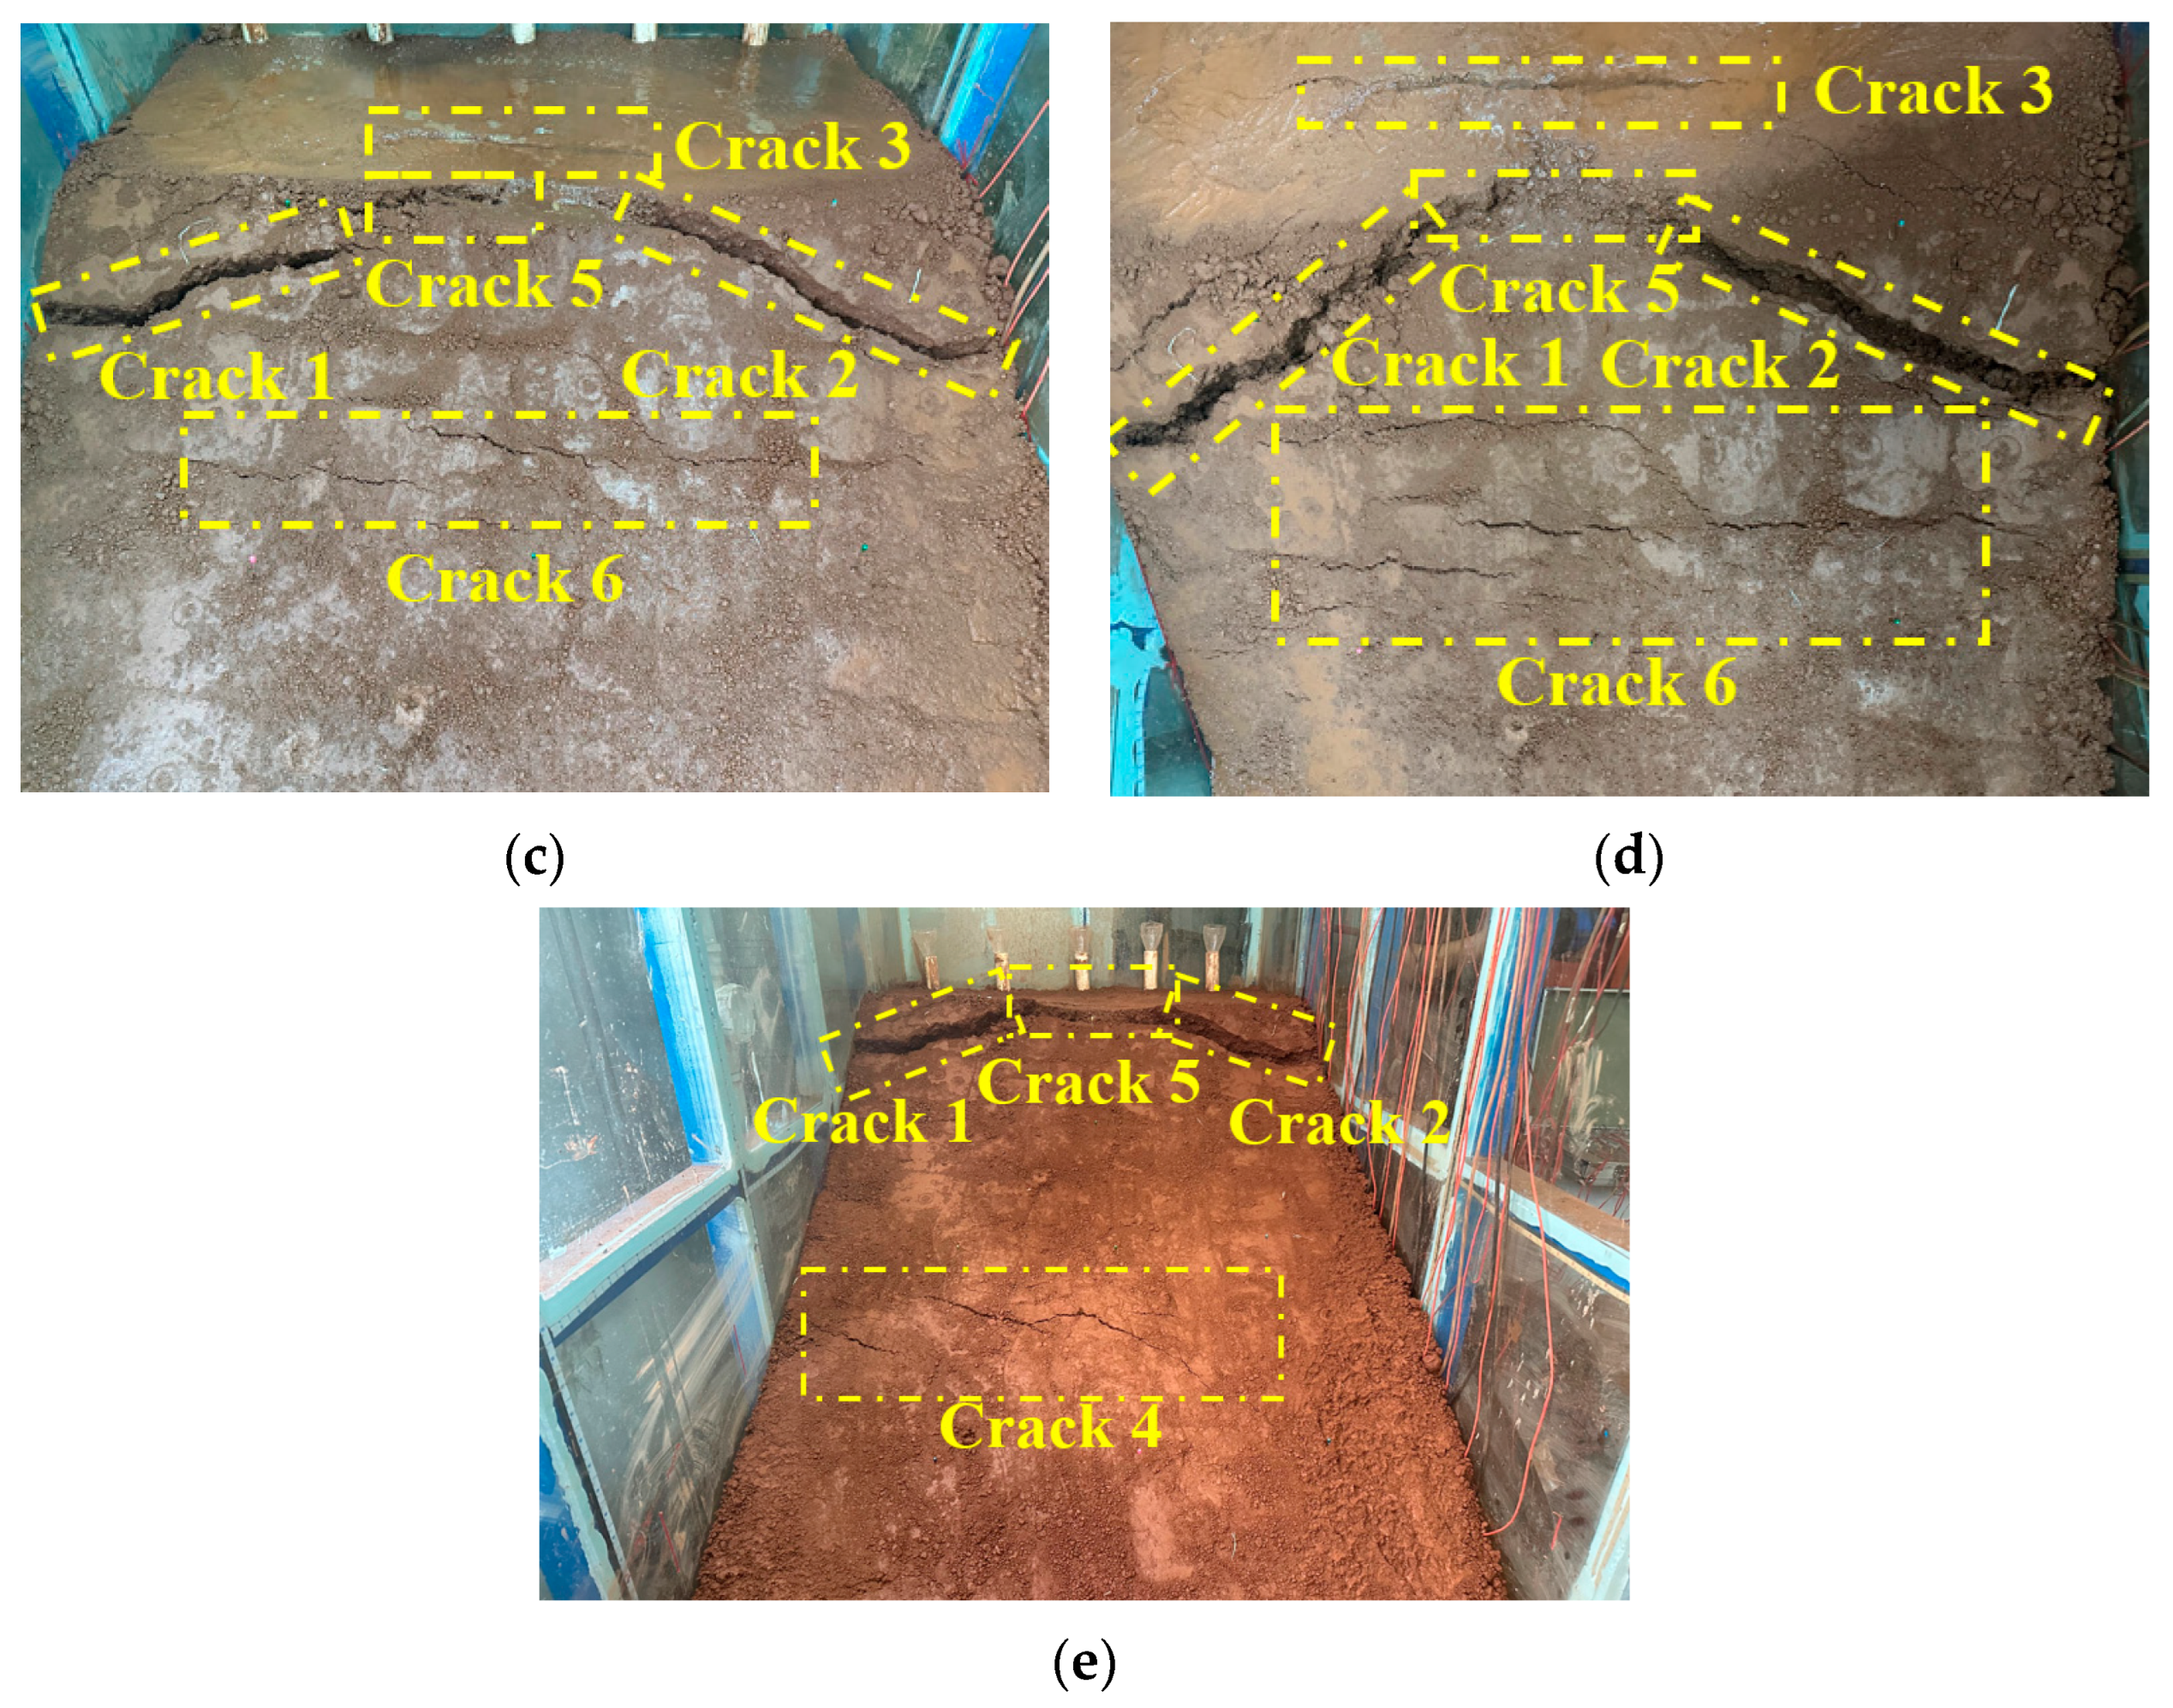
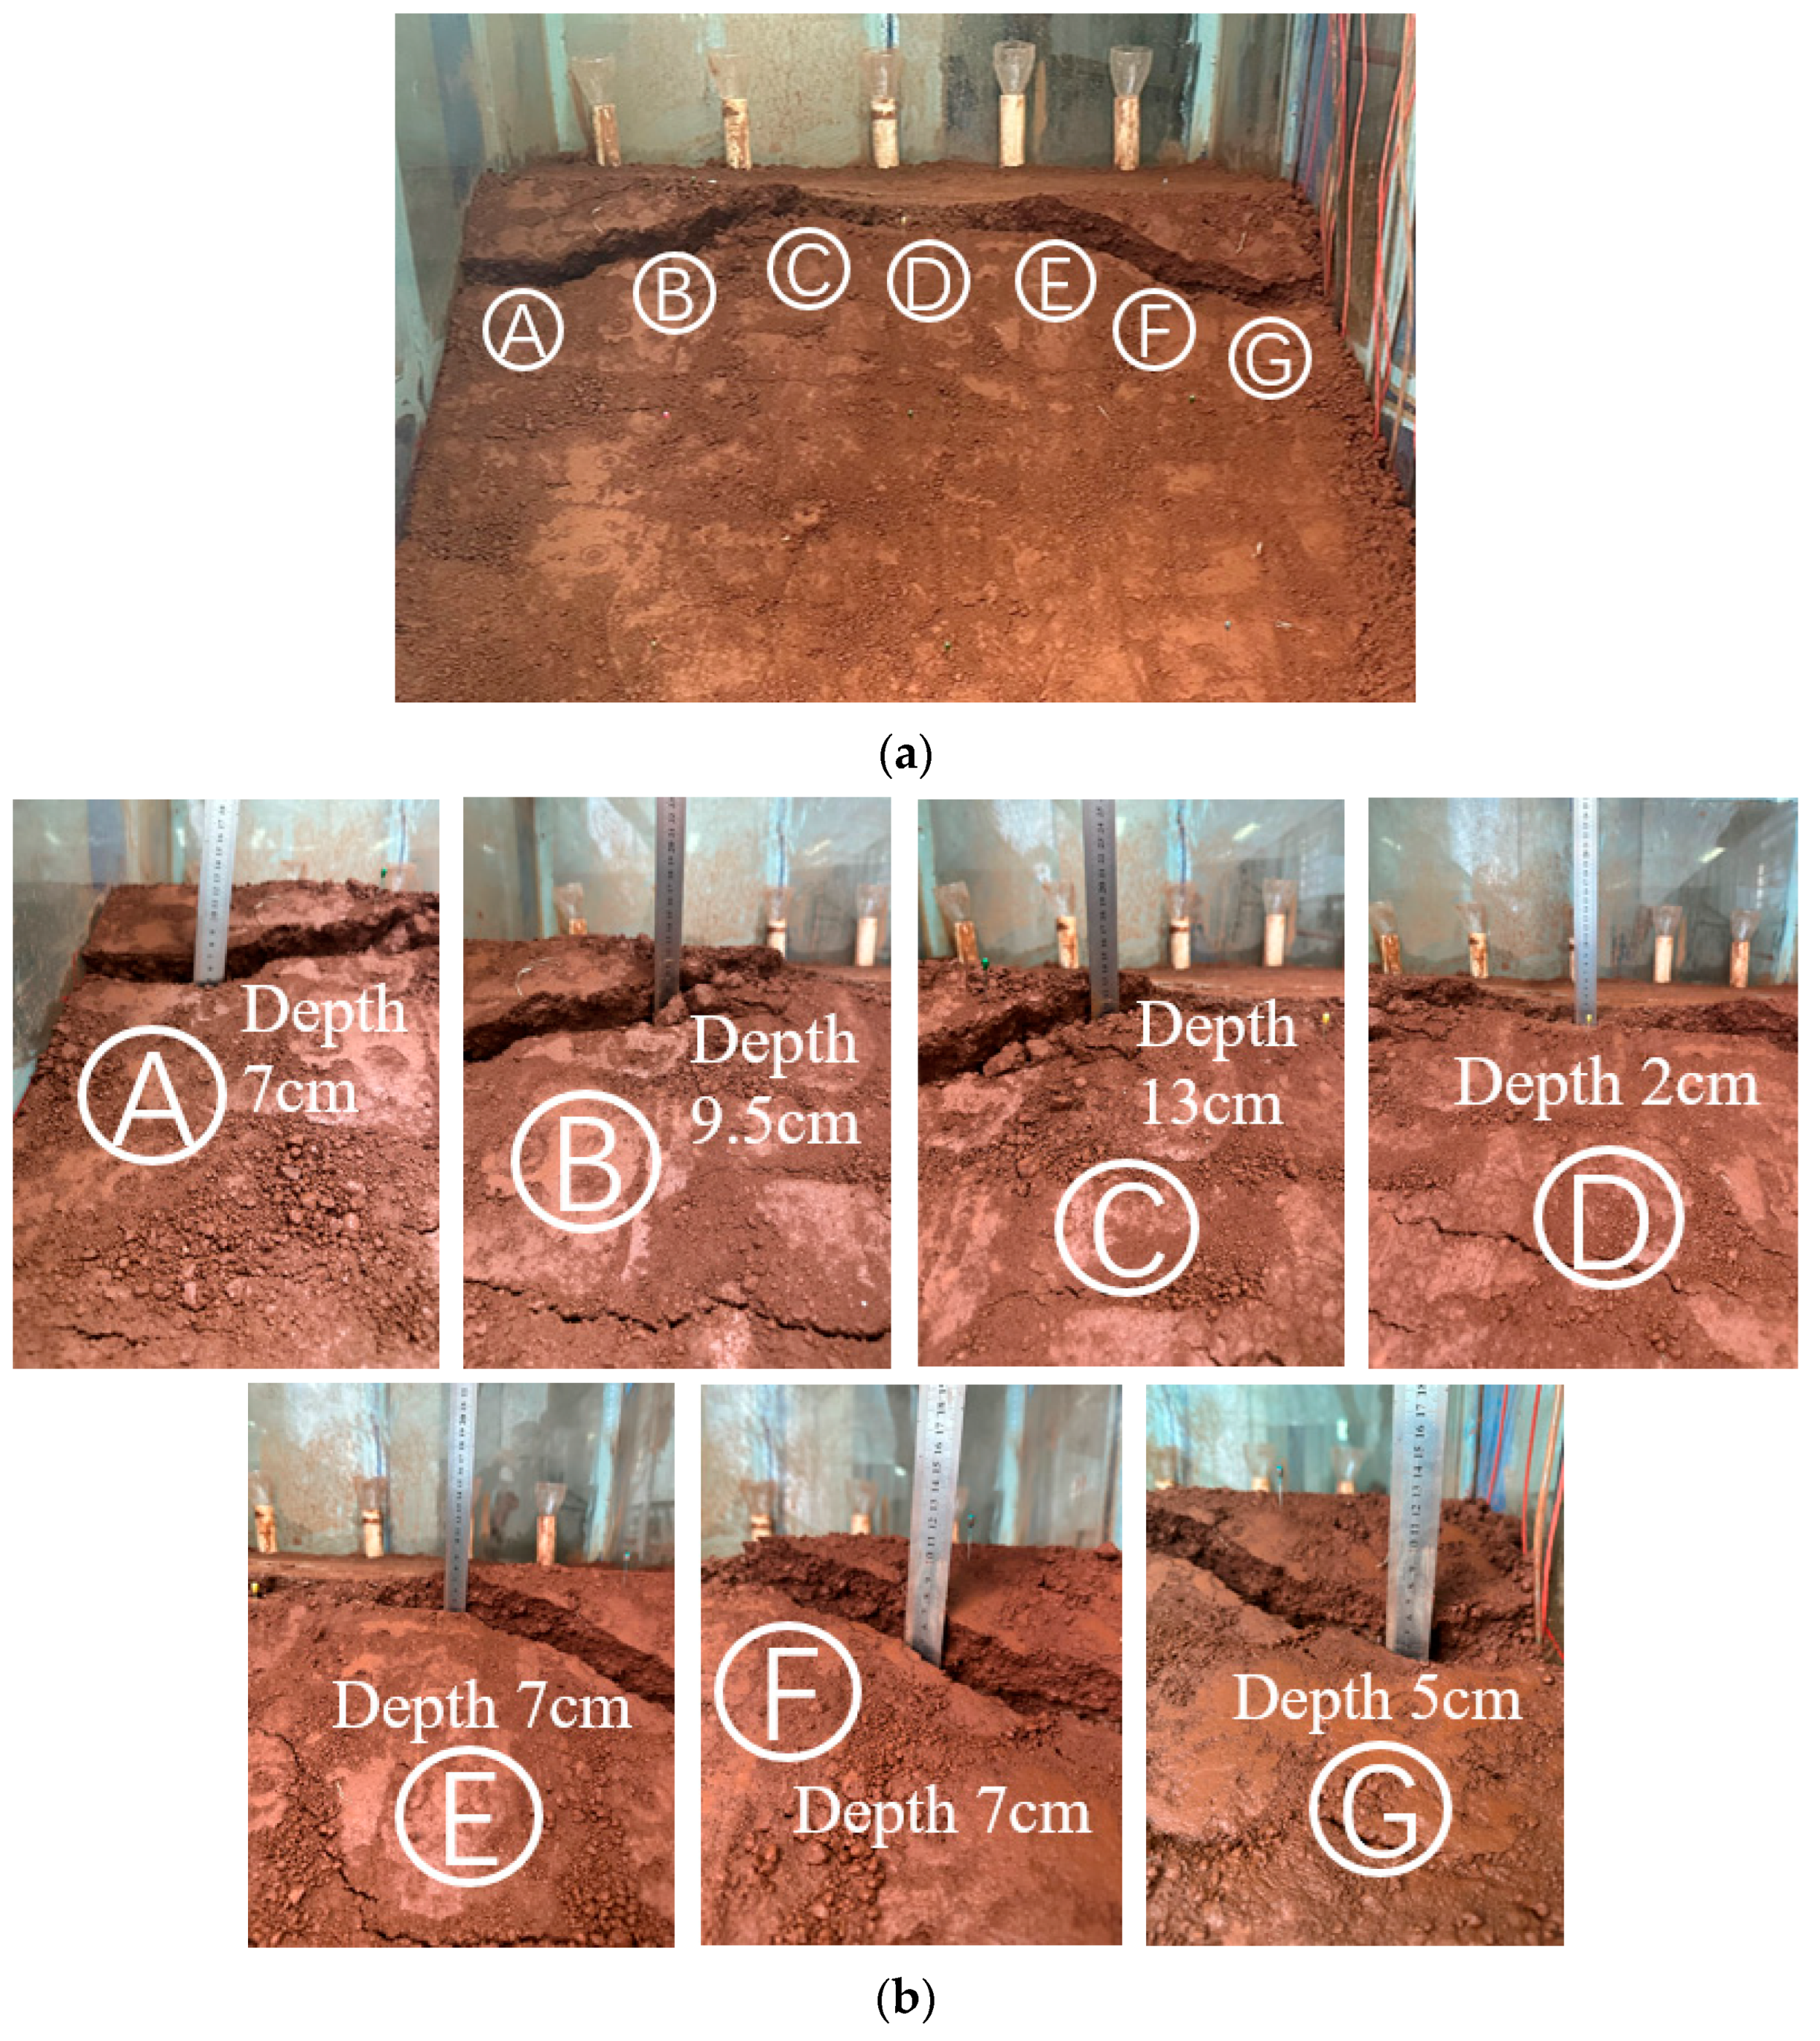
3.5.2. Evolution Law of Cracks in Red Mud Dams with Seepage Failure in Condition T2

According to Figure 26, the water level change under condition T2 causes the generation of micro cracks on the slope surface. The preset water level line for condition T2 is 60.85 cm, and after the infiltration line reaches the slope surface, it completely covers the entire slope surface. In the early stage of longitudinal crack development, four cracks mainly appear at the top and middle of the slope: Cracks 1 and 2 appear near the slop top, Crack 3 appears at the slop top platform, and Crack 4 appears in the middle of the slope.
From Figure 27a–c, it can be seen that as water injection continues, Cracks 1, 2, and 3, located at the slope top, begin to develop and expand. Among them, Cracks 1 and 2 expand the most significantly, with their length developing longitudinally towards the slope top and their width continuously increasing. From Figure 27d, it can be seen that Cracks 1, 2, and 5 finally connect and form longitudinal cracks parallel to the axis of the red mud dam at the slope top. At this time, the slope has already shown significant displacement. From Figure 27c,d, it can be seen that Crack 6 appears in the later stage of water injection, and as the water injection continues, Crack 6 also shows significant expansion. Further analysis from Figure 27b,e indicates that the growth rate of Crack 4 is comparatively slower although it appears earlier.
In Figure 28a, the longitudinal cracks parallel to the axis of the red mud dam have already formed at the top of the slope. In order to summarize the crack expansion laws, points A, B, C, D, E, F, G were selected and their depths were measured. From Figure 28b, it can be seen that the depths of points A, B, C, D, E, F, and G are 7 cm, 9.5 cm, 13 cm, 2 cm, 7 cm, 7 cm, and 5 cm. Among them, the depth of point D in the middle of the slope top is the shallowest, and the depths on both sides are deeper.
In Figure 29a, there is a more obvious height difference in the longitudinal cracks that run through the slope top. From Figure 29b, it can be seen that in the final form, the depths of points A, B, C, D, E, F, and G are 8 cm, 13 cm, 15 cm, 3.5 cm, 10 cm, 7 cm, and 5 cm. Compared with Figure 28b, the depths of points A, B, C, D, and E increase by 1 cm, 3.5 cm, 2 cm, 1.5 cm, and 3 cm, and the depths of points F and G remained unchanged. The depths of points in the middle and left side increase significantly. In the final form, the widths of points A, B, F, and G are 3 cm, 2 cm, 2 cm, and 2 cm. Compared with the early stage, the depths and widths of the longitudinal cracks at the top of the slope have significantly increased, and the displacements have also increased significantly, moving from the cracks at the slope top downwards as a whole. From the crack expansion laws of seepage failure in condition T2, it can be seen that micro cracks appear at the top and middle of the slope during the seepage failure process. With the continuous water injection, Cracks 1, 2, and 5, located at the slope top, expand most rapidly, and finally the three cracks penetrate into longitudinal cracks parallel to the axis of the red mud dam, which are the main cracks causing the damage to the red mud dam.
The crack evolution laws of the red mud dam caused by seepage damage in conditions T1 and T2 reveal that the cracks generated by seepage damage mainly appear below the infiltration line. During the continuous seepage process, the seepage force drives the movement of red mud particles, forming water channels inside the dam body. Cracks appear on the surface of the dam body, and the fastest expanding crack is the main crack. The main cracks in conditions T1 and T2 are longitudinal cracks parallel to the dam axis, and the higher the water level line is, the higher the position of the main crack is. The main cracks continuously expand until they penetrate the entire width direction of the dam. With the continuous water injection, the width and depth of the main crack increase, and the sliding occurs at the lower part of the dam body of the main crack.

3.6. Discussion

Two sets of seepage damage tests with varying water level heights were conducted in this research to investigate the characterization and evolution of seepage damage in red mud tailings dams. With a higher water level causing seepage damage, the infiltration line reaches the slope surface more quickly and at a higher elevation. This can be attributed to the fact that red mud is a type of fine-grained tailing with low permeability; fine-grained soils typically exhibit a higher horizontal permeability coefficient compared to the vertical permeability coefficient, which explains the elevated water level line on the red mud dam slope after rainfall. Similar findings were observed in others’ research [26,27]. Additionally, the seepage force within the dam body drives the movement of red mud particles, creating water channels within the structure, leading to the formation of cracks on the slope, as evidenced in others’ research [13]. Changes in soil pressure sensors, moisture sensors, and pore water pressure sensors can further prove the water seepage pathways within the red mud dam and the causes of damage.
Red mud leachate is strongly alkaline, and the seepage damage of the red mud tailing dam studied in this research are mainly caused by red mud leachate. The leachate flowing out from the dam not only damages the red mud dam, but also may pollute the surrounding environment if there is no efficient management for red mud leachate. Therefore, safe operation of red mud tailings ponds, as well as timely recovery and treatment of red mud leachate, are all necessary.
In order to ensure the accuracy of the test, a set of parallel tests were conducted for conditions T1 and T2 in this research. Two sets of parallel tests were compared and analyzed, in order to create a graph; one set of the test results were analyzed in this paper. In addition to this 1:2 seepage damage test, a 1:1 seepage damage test was also conducted. The seepage damage characteristics with a slope ratio of 1:1 are similar to those with a slope ratio of 1:2 presented in this paper. Regardless of the water level height, the dam damage with a slope ratio of 1:1 has the main crack near the top of the slope, and the damage is faster and more severe. The test was conducted again if the results of the parallel test differed greatly. Red mud is a type of fine-grained tailing, with a large specific surface area, large pore ratio, poor permeability, and rapid reduction of strength after water contact; the infiltration line is relatively high compared with that of coarse-grained tailings storage, which can cause large head pressure on the slope of the tailings dam. In the test, under the high water level, the infiltration line first arrives at the slope surface at a higher position and then covers the whole slope surface, causing much more serious damage, and the test results are in line with the expected results. In following studies, mathematical theory and numerical simulation will be combined with the test results to verify the accuracy of the test.
The analysis of seepage damage characteristics and evolution laws of red mud tailings dams shows that drainage efficiency should be fully considered to avoid long-time water accumulation for designing red mud tailings ponds. In daily maintenance, timely observation of the dam body surface should be performed to determine whether water seepage and crack phenomena take place; on the one hand, cracks generated should be timely dealt with, and on the other hand, drainage measures can be taken to ensure the safety of red mud tailings ponds. After rainfall, rainwater in red mud tailings ponds must be recycled through the drainage system inside or outside the pond to avoid the surrounding soil and groundwater pollution caused by strongly alkaline red mud leachate.

4. Conclusions

In this study, seepage damage tests were conducted to analyze the damage characteristics and distribution patterns of dam bodies, including soil pressure, seepage line, pore water pressure, dam displacement, crack evolution, and other relevant factors. The destabilization mechanism of the red mud dam body slope due to seepage damage was also investigated based on the research results; the conclusions obtained are as follows:
(1)
The maximum pore water pressure is located at the highest infiltration line of the slope surface. Horizontal soil pressure gradually increases under the action of pore water pressure; as the pore water pressure increases, the effective stress decreases, the shear strength decreases, and the likelihood of damage increases. It can also be seen from the test results that the high water level seepage damage is faster and occurs at a higher damage location than low level seepage;
(2)
For the displacement of the dam body caused by seepage damage, the infiltration line does not cover the whole slope under the influence of low water levels, the displacement of the dam body mainly appears in the dam body below the infiltration line, and the dam body above the infiltration line does not have any displacement during the process of water level change. The infiltration line covers the whole slope surface under the influence of high water levels, and displacement occurs on the whole dam slope surface. The displacement of the dam body is mainly due to the continuous expansion of the main crack produced by seepage damage, and the higher the water level is, the greater the displacement of the dam body is;
(3)
The crack evolution law of seepage-induced damage in the red mud dam reveals that the cracks primarily occur below the infiltration line. As seepage continues, the seepage force mobilizes red mud particles, creating water pathways within the dam body and resulting in surface cracks. The main crack, expanding most rapidly, is a longitudinal crack aligned with the dam axis. The higher the water level, the higher the position at which the primary crack emerges. The main crack continues to expand until it penetrates the entire width direction of the dam body. With continuous water injection, both the width and depth of the main crack increase.

Author Contributions

Conceptualization, S.C. and X.D.; methodology, S.C., H.Z. and Y.H.; formal analysis, S.C.; investigation, S.C. and X.L.; writing—original draft preparation, S.C. and X.L.; writing—review and editing, X.X., X.D. and X.L.; supervision, X.D. and X.L. All authors have read and agreed to the published version of the manuscript.

Funding

This research was supported by the National Natural Science Foundation of China (No. 51978438) (No. 52378360) (No. 52281340410); the Natural Science Foundation for Young Scientists of Shanxi Province, China (No. 202103021223122); the School Foundation of Taiyuan University of Technology (No. 2022QN044); the Research Project Supported by Shanxi Scholarship Council of China (2023-060); the Taiyuan University of Technology Innovation and entrepreneurship Project (2022-139); and the Shanxi Key Laboratory of Civil Engineering Disaster Prevention and Control, the Special Fund for Science and Technology Innovation Teams of Shanxi Province. This research was also supported by the Open Research Fund of the State Key Laboratory of Geomechanics and Geotechnical Engineering, Institute of Rock and Soil Mechanics, Chinese Academy of Sciences, Grant NO. SKLGME022012.

Institutional Review Board Statement

Not applicable.

Informed Consent Statement

Not applicable.

Data Availability Statement

All the data used in this paper are provided in the manuscript.

Conflicts of Interest

The authors declare no conflicts of interest.

References

  1. Wei, D.; Jun-Hui, X.; Yang, P. Iron Extraction from Red Mud using Roasting with Sodium Salt. Miner. Process. Extr. Metall. Rev. 2019, 42, 153–161. [Google Scholar] [CrossRef]
  2. Reddy, P.S.; Narala, G.R.; Serjun, V.Z.; Mohanty, B.; Rao, B.H. Properties and assessment of applications of red mud (bauxite residue): Current status and research needs. Waste Biomass Valorization 2021, 33, 1185–1217. [Google Scholar] [CrossRef]
  3. Fang, H.; Guo, N.X. The Current Situation of Recovery and Utilization of Red Mud from Alumina Solid Waste. China Resour. Compr. Util. 2011, 29, 21–24. (In Chinese) [Google Scholar]
  4. Nan, X.L.; Zhang, T.A.; Liu, Y. Comprehensive utilization and analysis of Chinese red mud. Process Eng. 2010, 10, 264–270. [Google Scholar]
  5. Bian, J.; Li, S.; Zhang, Q. Experimental Investigation on Red Mud from the Bayer Process for Cemented Paste Backfill. Int. J. Environ. Res. Public Health 2022, 19, 11926. [Google Scholar] [CrossRef] [PubMed]
  6. Wang, S.; Jin, H.; Deng, Y. Comprehensive utilization status of red mud in China: A critical review. J. Clean. Prod. 2021, 289, 125136. [Google Scholar] [CrossRef]
  7. Lima, M.S.S.; Thives, L.P. Evaluation of red mud as filler in Brazilian dense graded asphalt mixtures. Constr. Build. Mater. 2020, 260, 119894. [Google Scholar] [CrossRef]
  8. Hui, S.; Charlebois, L.E.W.; Sun, C. Real-time monitoring for structural health, public safety, and risk management of mine tailings dams. Can. J. Earth Sci. 2017, 55, 221–229. [Google Scholar] [CrossRef]
  9. Song, C.W.; Yu, G.M.; Xue, B.F. A huge source of pollution hazard -Disaster and cure of tailings pond. In Proceedings of the IEEE International Conference on Electronics, Communications and Control (ICECC), Ningbo, China, 9–11 September 2011. [Google Scholar]
  10. Lin, S.Q.; Wang, G.J.; Liu, W.L.; Zhao, B.; Shen, Y.M.; Wang, M.L.; Li, X.S. Regional Distribution and Causes of Global Mine Tailings Dam Failures. Metals 2022, 12, 905. [Google Scholar] [CrossRef]
  11. Clarkson, L.; Williams, D. An Overview of Conventional Tailings Dam Geotechnical Failure Mechanisms. Min. Metall. Explor. 2021, 38, 1305–1328. [Google Scholar] [CrossRef]
  12. Lyu, Z.J.; Chai, J.; Qin, Y.; Cao, J. A Comprehensive Review on Reasons for Tailings Dam Failures Based on Case History. Adv. Civ. Eng. 2019, 2019, 4159306. [Google Scholar] [CrossRef]
  13. Wang, G.J.; Tian, S.; Xu, Z.; Kong, X. Evolution Pattern of Tailings Flow from Dam Failure and the Buffering Effect of Debris Blocking Dams. Water 2019, 11, 2388. [Google Scholar] [CrossRef]
  14. Wang, G.J.; Tian, S.; Hu, B.; Kong, X.Y.; Chen, J. An experimental study on tailings deposition characteristics and variation of tailings dam saturation line. Geomech. Eng. 2020, 23, 85–92. [Google Scholar]
  15. Yin, G.; Li, G.; Wei, Z.; Wan, L.; Shui, G.; Jing, X. Stability analysis of a copper tailings dam via laboratory model tests: A Chinese case study. Miner. Eng. 2011, 24, 122–130. [Google Scholar] [CrossRef]
  16. Du, C.; Jiang, X.; Wang, L.; Yi, F.; Niu, B. Experimental study on dynamic characteristics of tailings under different consolidation conditions. Sci. Rep. 2024, 14, 735. [Google Scholar] [CrossRef] [PubMed]
  17. Luo, C.; Li, D.; Xu, B. Study on the Evolution of Tailings Dam Break Disaster under Complex Environment. Sustainability 2023, 15, 14728. [Google Scholar] [CrossRef]
  18. Özgenç Aksoy, A.; Doğan, M.; Oğuzhan Güven, S.; Tanır, G.; Güney, M.Ş. Experimental and Numerical Investigation of the Flood Waves Due to Partial Dam Break. Iran. J. Sci. Technol. Trans. Civ. Eng. 2022, 46, 4689–4704. [Google Scholar] [CrossRef]
  19. Schaefer, M.; Bugnion, L. Velocity Profile Variations in Granular Flows with Changing Boundary Conditions: Insights from Experiments. Phys. Fluids 2013, 25, 063303. [Google Scholar] [CrossRef]
  20. Wang, S.R.; Zhang, H.Q.; Zou, Z.S.; Liu, X.L. Liquid-solid coupling analysis of tailings dam under complex engineering conditions. In Proceedings of the 3rd International Symposium on Mine Safety Science and Engineering (ISMS), Montreal, QC, Canada, 13–19 August 2016. [Google Scholar]
  21. Li, Q.; Zhang, L.T.; Qi, Q.L. Instability characteristics and stability analysis of a tailings dam based on fluid-solid coupling theory. Rock Soil Mech. 2012, 33, 243–250. [Google Scholar]
  22. Liu, H.X.; Li, N.; Liao, X. Unsteady seepage analysis of tailings dams considering coupling of stress and seepage fields. J. Rock Mech. Eng. 2004, 23, 2870. [Google Scholar]
  23. Lu, M.L.; Cui, L. Three-dimensional seepage analysis for complex topographical tailings dam. Rock Soil Mech. 2006, 27, 1176–1180. [Google Scholar]
  24. Singh, S.; Kumar, A.; Sitharam, T.G. Investigating the strength and durability properties of alkali activated red mud for tailings pond embankment material. Geomech. Energy Environ. 2023, 36, 100500. [Google Scholar] [CrossRef]
  25. Wang, C.; Harbottle, D.; Liu, Q.X.; Xu, Z.H. Current state of fine mineral tailings treatment: A critical review on theory and practice. Miner. Eng. 2014, 58, 113–131. [Google Scholar] [CrossRef]
  26. Li, Q.; Wu, B.Z.; Li, X.; Jia, S.; Zhen, F.H.; Gao, S. The Relatively Stable Seepage Field: A New Concept to Determine Seepage Field in the Design of a Dry-Stack Tailings Pond. Appl. Sci. 2022, 12, 12123. [Google Scholar] [CrossRef]
  27. Cui, W.W.; Dong, X.Q.; Duan, W.; Liu, J.J.; Zhao, R.Y.; He, G.L. Design of all solid waste red mud-based cementitious materials based on the simplex centroid method. Constr. Build. Mater. 2024, 418, 135439. [Google Scholar] [CrossRef]
  28. Tian, H.; Williams, D.J.; Mandisodza, K.; Zhang, C.M.; Olaya, S.Q.; Zhang, W.Q.; Tang, C.Y. Engineering properties of fine-grained red mud, International Journal of Mining. Reclam. Environ. 2023, 37, 399–418. [Google Scholar] [CrossRef]
  29. Liu, D.Y.; Wu, C.S. Stockpiling and Comprehensive Utilization of Red Mud Research Progress. Materials 2012, 5, 1232–1246. [Google Scholar] [CrossRef]
Figure 1. Laboratory test tank.
Water 16 01487 g001
Figure 2. The water level control system.
Water 16 01487 g002
Figure 3. Spirit level, pin, and steel ruler.
Water 16 01487 g003
Figure 4. Layout of benchmarks.
Water 16 01487 g004
Figure 5. Red mud tamping and data monitoring.
Water 16 01487 g005
Figure 6. Location of sensor burial for working condition T1. (a) Layout location of soil pressure sensors. (b) Location of soil moisture sensor arrangement. (c) Pore water pressure sensor burial location.
Water 16 01487 g006aWater 16 01487 g006b
Figure 7. Location of sensor burial for working condition T2. (a) Layout location of soil pressure sensors. (b) Location of soil moisture sensor arrangement. (c) Pore water pressure sensor burial location.
Water 16 01487 g007aWater 16 01487 g007b
Figure 8. Distribution of moisture content in conditions T1 and T2.
Water 16 01487 g008
Figure 9. Evolution law of infiltration line under working conditions T1 and T2.
Water 16 01487 g009
Figure 10. Distribution of vertical soil pressure near the slope in condition T1.
Water 16 01487 g010
Figure 11. Distribution of horizontal soil pressure near the slope in condition T1.
Water 16 01487 g011
Figure 12. Transmission of horizontal thrust in condition T1.
Water 16 01487 g012
Figure 13. Distribution of vertical soil pressure near the slope in condition T2.
Water 16 01487 g013
Figure 14. Horizontal soil pressure distribution under condition T2.
Water 16 01487 g014
Figure 15. Trend of pore water pressure change in working conditions T1 and T2.
Water 16 01487 g015
Figure 16. Location of pin embedding. (a) Horizontal arrangement of pins. (b) Vertical arrangement of pins.
Water 16 01487 g016
Figure 17. The displacement measurement of the red mud dam body.
Water 16 01487 g017
Figure 18. Displacement of red mud dam body with seepage failure in condition T1. (a) The infiltration line reaches the slope surface. (b) Tiny cracks appear on the slope surface. (c) Red mud dam damage.
Water 16 01487 g018
Figure 19. Displacement of red mud dam body under condition T1.
Water 16 01487 g019
Figure 20. Displacement of red mud dam body with seepage failure in condition T2. (a) The infiltration line reaches the slope surface. (b) Cracks appear at the top of the slope. (c) Red mud dam damage.
Water 16 01487 g020
Figure 21. Displacement of red mud dam body under condition T2. (a) First column of dam displacements. (b) Second column of dam displacements. (c) Third column of dam displacements.
Water 16 01487 g021
Figure 22. The occurrence of micro cracks on the slope in condition T1.
Water 16 01487 g022
Figure 23. Development and extension of microcracks in condition T1.
Water 16 01487 g023
Figure 24. Longitudinal crack propagation in condition T1. (a) Longitudinal crack propagation in condition T1. (b) Crack depth during the longitudinal crack propagation stage of condition T1.
Water 16 01487 g024
Figure 25. Final morphology of longitudinal cracks in condition T1. (a) Final morphology of longitudinal cracks in condition T1. (b) The depth and width of the final stage of longitudinal cracks in condition T1.
Water 16 01487 g025
Figure 26. The occurrence of micro cracks on the slope in condition T2. (a) At the top of the slope. (b) In the middle of the slope.
Water 16 01487 g026
Figure 27. Development and propagation of microcracks in condition T2. (a) The appearance of micro cracks at the top of the slope. (b) The development of cracks at the top of the slope. (c,d) Expansion of cracks at the top of the slope. (e) The final stage of slope top cracks.
Water 16 01487 g027aWater 16 01487 g027b
Figure 28. Longitudinal crack propagation in condition T2. (a) Expansion of longitudinal cracks in condition T2. (b) Crack depth during the longitudinal crack propagation stage of condition T2.
Water 16 01487 g028
Figure 29. Final morphology of longitudinal cracks in condition T2. (a) Final morphology of longitudinal cracks in condition T2. (b) The depth and width of the final stage of longitudinal cracks in condition T2.
Water 16 01487 g029
Table 1. Chemical composition and percentage content of red mud.
Chemical CompositionCaOFe2O3Al2O3SiO2TiO2Na2OSO3Others
Percentage content (%)26.3925.7117.7715.066.835.910.811.52
Table 2. Basic physical properties of red mud.
Relative DensityMaximum Dry DensityOptimum MoisturePermeability CoefficientLiquid LimitPlastic LimitPlasticity IndexVoid RatioPH
2.711.33 g/cm333%2.58 × 10−6 cm/s42.729.812.91.0211
Table 3. Model similarity ratios.
Physical QuantitySimilarity RatioPhysical QuantitySimilarity RatioPhysical QuantitySimilarity Ratio
Length1:200Permeability Coefficient1:1Volume1:2003
Cohesiveness1:1Density1:1Internal Friction Angle1:1
Acceleration200:1Moisture Content1:1Stress1:1
Strain1:1Slope1:1Displacement1:200
Table 4. Test program.
Sequence NumberInitial Dry DensityInitial Water ContentSlope RatioWater Levels
T11.279 g/cm325%1:236.51 cm
T21.283 g/cm325%1:260.85 cm
Disclaimer/Publisher’s Note: The statements, opinions and data contained in all publications are solely those of the individual author(s) and contributor(s) and not of MDPI and/or the editor(s). MDPI and/or the editor(s) disclaim responsibility for any injury to people or property resulting from any ideas, methods, instructions or products referred to in the content.

