Abstract
This study aimed to develop a geochemical database by thoroughly analyzing groundwater and sediments from coastal aquifers of southwest Bangladesh. Moreover, we investigated the source of sediment deposition and the mechanisms behind the presence of arsenic and salinity in groundwater. The seasonal distribution patterns of arsenic among the shallow and deep coastal aquifers were found to be 45.12 µg/l and 20.65 µg/l during dry and wet seasons, respectively. Moreover, the groundwater salinity distribution ranged from 3262.88 mg/l to 1930.88 mg/l during the dry and wet seasons. Cored sediment samples showed fine to medium sands of 92%, with silt and clay particles. The petrographic study of authigenic and heavy minerals revealed that the mineral grains were subangular to angular, indicating their textural immaturity of coastal sediments. The reactivity of goethite (FeOOH) and siderite (FeCO3) minerals suggests that the aquifers were subjected to slightly oxidized to moderately reducing conditions, with ORP values ranging from +50.40 mv to −149.5 mv. Such redox conditions could potentially result in the enrichment and mobility of arsenic in the groundwater. Although arsenic concentrations in deep aquifers are relatively low, higher salinity values are found in both shallow and intermediate coastal aquifers.
1. Introduction
Saltwater intrusion in coastal aquifers is a global concern, especially for those who rely solely on groundwater as their freshwater source [1,2]. In addition, millions of people living in the low-lying areas of southern Bangladesh, West Bengal state of India, are in danger of being exposed to high concentrations of arsenic in groundwater [3,4]. High levels of arsenic concentrations are significant issues affecting groundwater in coastal aquifers of Bangladesh [5]. The southwest coastal regions of Bangladesh, especially Satkhira, Khulna, and Bagerhat districts, are highly susceptible to numerous climatic hazards, such as floods, cyclones, and waterlogging [6,7,8]. Natural disasters such as rising sea levels due to climate change can move saltwater into the freshwater aquifers through river networks connected with the Bay of Bengal [9]. Saltwater intrusion into coastal aquifers can be caused by anthropogenic reasons, such as the over-extraction of groundwater to meet daily demands for industrial or agricultural purposes [10]. Due to such human activities and naturally induced phenomena, the balance between the freshwater and saline water interface is differentiated in the coastal regions.
The lithological conditions and depth variation of groundwater aid in moving the saltwater both laterally and vertically into freshwater aquifer systems in the coastal regions [11]. Eventually, this mechanism makes fresh water unsuitable for human consumption or agricultural use in coastal areas of Bangladesh [12]. Thus, the groundwater quality within the coastal aquifers is seriously affected by the presence of arsenic (As) concentrations and salinity intrusion within shallow aquifers (less than 50 m deep) and the presence of salinity between both shallow and deep aquifers (more than 150 m deep) [13]. This phenomenon also impacts the health of water consumers living in the vicinity [14]. After the 1970s, many people in Bangladesh shifted their methods of water consumption from surface water sources to groundwater sources, such as using hand-pumped shallow tubewells [15]. The second option of using pathogen-free groundwater from shallow tubewells became popular in the country until 1993, when arsenic was first detected among tubewells [16]. Since then, due to the widespread consumption of such contaminated groundwater, access to reliable freshwater supplies has been dramatically reduced, resulting in poor sanitation and inadequate health management in Bangladesh [17]. Because of the global sea-level rise [18] and climate disequilibrium, approximately 11% of the coastal areas of Bangladesh are projected to be submerged by 2050, including the southwest coastal regions [19].
Therefore, relevant research should be conducted to identify and implement effective measures to tackle this national critical issue and to ensure the well-being of arsenic and salinity-affected residents of the country. Understanding and quantifying arsenic contamination and associated groundwater geochemistry variation within coastal aquifers is a significant concern in tackling these issues [20,21]. Failing to monitor groundwater contamination patterns may result in the incorrect management of safe drinking water resources and costs associated with adverse weather phenomena. Some researchers have examined the correlation between groundwater arsenic and sediment geochemistry in the Bengal basin at shallower depths [22,23]. Very few research studies report that the shallow coastal aquifers within the Ganges delta have been affected by extended saltwater infiltration due to rising sea levels, which might also be the consequence of greenhouse effects [24]. However, the mechanism of arsenic distribution and salinity intrusion in deep coastal aquifers of Bangladesh has not been established well.
In this study, we developed a comprehensive geochemical database based on groundwater analysis and a mineralogical database from aquifer sediments analysis in the southwest coastal regions of Bangladesh. Moreover, we visualized salinity and arsenic distribution patterns among shallow and deep coastal aquifers of the study area. Finally, we assessed the provenance of sediment deposition and mobility mechanisms of arsenic concentration and salinity intrusion found in the groundwater.
2. Study Area Description: Regional Geology and Hydrostratigraphy
Bangladesh is bounded by the West Bengal states of India to the west, Meghalaya to the north, and Tripura to the east. The south portion is open to the Bay of Bengal (Figure 1). The study area primarily lies in the southwestern portion of Bangladesh known as Satkhira district, which is subdivided into seven upazila namely, Kalaroa, Satkhira Sadar, Tala, Debhata, Assasuni, Kaliganj, and Shyamnagar, and one upazila of the Khulna district called Paikgacha (Figure 1). We also visualized salinity and arsenic distribution patterns within the extended study area boundary nearby Satkhira, Khulna and Bagerhat district, as shown in Figure 2. The Satkhira district is located with GPS coordinates of 21°36′ N and 22°54′ N latitudes and longitude within 88°54′ E and 89°20′ E, respectively. The primary study area comprises nearly 3817 sq. km, with a population density of 574 people per sq. km. In terms of hydroclimatic regions, Satkhira has tropical climates with an average high temperature of about 30 °C (86 °F) per year, an average low temperature of about 21 °C (69 °F) per year, and an average rainfall of about 1690 mm per year [25].
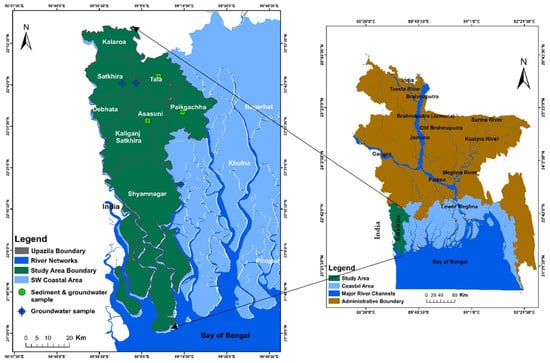
Figure 1.
Map showing the study area (Satkhira district) located near the southwest end of coastal Bangladesh.
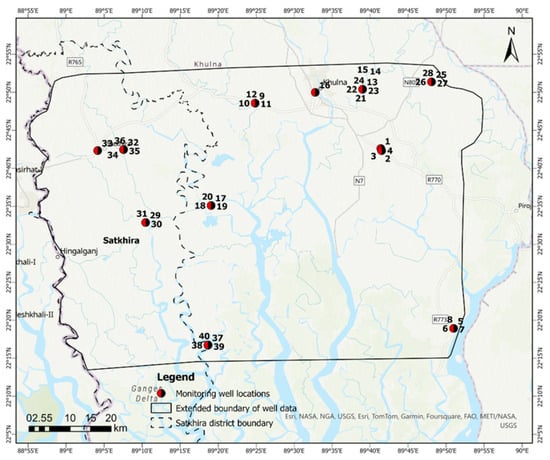
Figure 2.
Extended boundary of sampling locations of 40 monitoring wells and respective well numbers. Groundwater salinity data were collected from these 40 wells only for GIS interpolation. Data source: Bangladesh Water Development Board (BWDB).
The uplift of the Himalayan Mountain and associated hydroclimatic patterns significantly impacted the amount and distribution of sediments in the Bengal basin [26]. The regional hydrogeology of southwestern Bangladesh suggests the presence of three aquifer types in the coastal regions of the country namely, shallow (<50 m depth), intermediate or main (50 m to 150 m depth), and deep (>150 m depth) aquifers [27]. These three primary aquifers are made up of medium to fine-grained sand layers, which are separated by clayey aquitard layers, as shown in Figure 3. Additionally, the presence of alternating layers of clay acts as a barrier between the deep and shallow aquifers among coastal lithological sequences. Regionally, the portion of the first aquifer is confined and leaky in nature, as noted by BWDB-UNDP in 1982 [28], which can be found up to 100 m below ground [29,30].
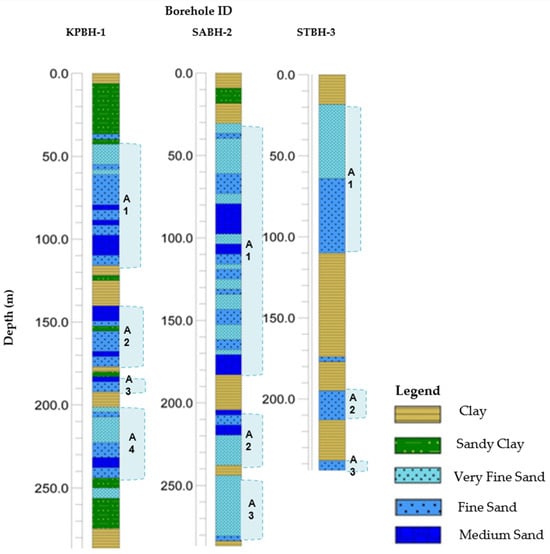
Figure 3.
Subsurface litholog of three selected boreholes from where sediment samples were collected using the rotary drilling method, as located in Figure 1. Abbreviation: BH—borehole, KP—Khulna Paikgacha, SA—Satkhira Assasuni, ST—Satkhira Tala upazila, A1—Aquifer 1, A2—Aquifer 2, A3—Aquifer 3, and A4—Aquifer 4. Detail hydrostratigraphic description provided in Table S1.
The general characteristics of multilayered aquifers in the southwest coastal regions of Bangladesh include being mostly unconfined and leaky in nature and having different levels of transmissivity across the area [31]. The physiography of coastal regions of Bangladesh is primarily composed of the Flood Plains of Meghna, the Chittagong to Cox’s Bazar Coasts, and the Ganges Brahmaputra Meghna deltaic complex, and land surfaces have a decreasing slope trend from the north towards the southern direction in the country [32]. The Ganges Brahmaputra Meghna (GBM) delta received its massive amount of sediments during the Holocene through three large rivers, namely, Padma (also known as Ganges), Jamuna (also known as Brahmaputra), and Meghna [33]. The geological formations in the central regions of Bangladesh have low permeability, where units are covered by Pliocene–Pleistocene clay deposits, which are popularly known as Madhupur and Barind tracts [34]. In the eastern hilly regions of Bangladesh, pre-Holocene deposits are predominant. The southwestern portion of Bangladesh comprises tidal deltaic deposits adjacent to the large Sundarban mangrove forests. The rest of the land areas in Bangladesh are predominantly covered by alluvial deposits with relatively higher permeable geological units [35].
Borehole well log information from the coastal regions of Bangladesh shows lithological changes within the sediment layers at a depth of up to 290 m (Figure 3). Lithological characterization of the study area reveals that the aquifer sediment distribution and hydrogeological settings seem to be complex in the coastal regions of Bangladesh. Aquifer sediment types in the Satkhira district primarily consist of fine sands, medium sands, and silty clay layers where aquifer–aquitard alteration happens rapidly. The lithologic profile section, as shown in Figure 3, signifies that an aquiclude layer is present from 0 to 30 m at the Assasuni area (Well ID: SABH-2). Below that layer, there are three aquifers present from 30 to 184 m, 204 to 238 m, and 255 to 284 m, separated by clay aquitard layers. The aquitard layer thickness varies from 6 to 18 m. Similar gross-type lithologic successions were observed in both Tala upazila (Well ID: STBH-3) and Paikgacha upazila (Well ID: KPBH-1) at varying depths from hydrostratigraphic columns as represented in Figure 3, Table S1.
3. Materials and Methods
We analyzed groundwater samples and Quaternary sediments, specifically Holocene alluvium sandstones, with a combination of field observations and laboratory analysis and gathered primary data. We also used secondary data sources from the Bangladesh Water Development Board (BWDB). The summary of the overall research methodology is discussed in the following subsections.
3.1. Primary Data Collection Methods
3.1.1. Sediment Samples Collection and Processing
Sediment core samples from three boreholes were collected using a split-spoon sampler provided by the BWDB within selected GPS locations of southwestern Bangladesh (Figure 1). Sediment samples were collected at 30 m intervals until the bottom of the chosen borehole with a total depth of 304.8 m below the ground level. Sediment samples were carefully preserved in lab-quality plastic PVC bags and transported to the BWDB headquarters in Dhaka, Bangladesh. We collected thirty-six (36) preserved sediment samples from three monitoring wells (twelve from each) from the BWDB sample repository during the summer 2022 fieldwork and transported them to Auburn University (Table 1). We dried all sediment samples in the lab-quality oven for 24 h and securely preserved them in the host laboratory for further analysis and processing.

Table 1.
Inventory of collected sediment samples used to prepare both polished and unpolished thin sections. [Abbreviation: A—Assasuni upazila, H—heavy minerals, P—Paikgacha upazila, T—Tala upazila].
We categorized the preserved and dried aquifer sediments based on color, texture, grain size, sorting, and composition [36]. Unconsolidated dried sand samples (30 g per sample) were disintegrated and placed in separatory funnels for heavy mineral separation using Tetrabromoethane (C2H2Br4). The separatory funnels were kept in a fume hood for 24 h, enabling light minerals to float on top and heavy minerals to sink at the bottom of the heavy liquid. Then, we preserved the separated heavy minerals for further laboratory examination based on their optical properties under a polarizing microscope. The composition and percentage of heavy mineral grains were identified using mineral oil on transparent glass slides under a microscope. In addition, fifteen unpolished and four polished standard (27 mm × 46 mm) petrographic thin sections were prepared from collected dried sediment samples at Wagner Petrographic Laboratory Services, Lindon, UT, USA, and National Petrographic Service, Inc., in Rosenberg, TX, USA, during September 2022 (Table 1). Unpolished thin sections were stained for potassium (k) and plagioclase feldspar detection. Sediment compositional analysis was carried out by a petrographic study of these thin sections prepared from some key depths of salinity and arsenic occurrences. We determined sediment mineralogy and geochemistry through whole-rock petrographic analysis on unpolished and polished thin sections, as listed in Table 1, by using a Nikon E600 polarizing microscope (Leica Microsystems Inc., Deerfield, IL, USA) with a photomicrographic set up in the host laboratory [37].
3.1.2. Thin-Section Petrography and Mineralogical Profiling of Sediments
Fifteen thin sections were analyzed through petrographic studies to determine the aquifer sediment composition at specific aquifer depths where salinity and arsenic concentrations were found (Table 1).
Quantitative Data Calculation
The Gazzi–Dickinson point counting method was utilized in this study to perform a statistical calculation of the mineral components present in the sediments (modified after [38,39,40]). We considered the following parameters for counting the mineral grains in the Holocene aquifer sediments of the study area:
Qt = Qm + Qp, where
Qt = total quartzose grains
Qm = monocrystalline quartzose grains
Qp = polycrystalline quartz, including chert grains
F = P + K, where
F = total feldspar grains
P = plagioclase feldspar grains
K = potassium feldspar grains
L = Ls + Lv + Lm, where
Ls = sedimentary lithic fragments, mostly argillites
Lv = volcanic lithic fragments
Lm = metamorphic lithic fragments
Lt = L + Qp where, Lt = total lithics
P/F = plagioclase/total feldspar grains
We employed the highly precise energy dispersive X-ray diffraction (XRD) methods to meticulously study heavy, light, and authigenic minerals from sediment core samples. This was performed using a state-of-the-art Bruker D2 Phaser X-ray Diffractometer (Bruker, Billerica, MA, USA) [41]. Two powdered sediment samples (weighing 65 g each) were then subjected to analysis using a portable Bruker Elemental Tracer IV-ED XRF. This instrument allowed for semiquantitative measurements of trace element concentration, such as iron, arsenic, sulfur, etc., in the sediment samples [42]. The DIFFRAC.EVA version 6 software, a product of the BRUKER corporation, was utilized to analyze the samples and determine their mineral composition, including quantitative percentage, by searching for and matching peaks on the XRD spectra. The size and texture of some selected mineral grains were further identified using a Zeiss EVO 50VP Scanning Electron Microscope (SEM), Zeiss, Oberkochen, Germany [43]. Both SEM images and their respective energy dispersive spectroscopy (EDS) spectra were processed in Oxford INCA microanalysis software system (2011, Concord, MA, USA) at the Auburn University Research Instrumentation Facility (AURIF). During spectrum processing, no peaks were omitted, and all elemental concentrations were normalized. Four (4) iteration numbers were used for SEM analytical calculations.
3.1.3. Groundwater Sample Collection and Analysis
At the beginning of sample collection, a field sampler opened the caps of selected monitoring wells, pumped water for 15 to 20 min, and collected representative fresh groundwater samples. Then, two plastic bottles were filled (500 mL each) with representative water samples from each well. All water samples were filtered during sampling through the 0.22 um filter to avoid debris and preserved with proper labels. The first sample bottle from each well was sealed immediately and marked as non-acidified (NA). In the other sample bottle from each well, 61–79% pure nitric acid (HNO3) was added and preserved for cation analysis using ICP-MS. After adding 16 drops of HNO3 to the 500 mL of nonacidified water, the pH dropped below 2.00, later marked as acidified (A). Three multiparameter field kits were used for reading in situ sample parameter testing, namely, (i) Aquaread, (ii) Aquaprobe—AP 800, and (iii) Aquameter Am-200. These multiparameter field kits measured and documented the physical parameters such as pH, ORP, salinity, dissolved oxygen, and temperature. Then, we collected 60 mL of acidified and non-acidified groundwater samples from each 500 mL bottle and transported them to the host research laboratory for further analysis based on our research objectives. We collected 24 groundwater samples in the dry season of 2020 and 24 groundwater samples in the wet season of 2021 from those selected monitoring well locations, as shown in Figure 1.
Our primary study area was meticulously chosen at Satkhira district, as shown in Figure 1. In this district boundary, we collected groundwater samples from 12 nested monitoring well networks, as documented in Table S2a,b. We analyzed major cations and trace element composition from 24 acidified groundwater samples in ppm units using ICP-MS [44]. We followed a rigorous analytical procedure during the ICP-MS analysis of groundwater based on the mass balance calculation. Similarly, we analyzed twenty-four (24) nonacidified groundwater samples from the same wells for anion concentrations using Ion Chromatography (IC) [45]. A Dionex Ion Chromatograph, which included a GP40 gradient pump, ED40 electrochemical detector (Dionex Corporation, Sunnyvale, CA, USA), and AS 3500 auto-sampler (Applied Biosystems, Foster City, CA, USA), was used to analyze the samples. The analytical column used was the Dionex IonPac AS16 (Thermo Fisher Scientific Inc., Waltham, MA, USA) with dimensions of 4 × 250 mm, while the guard column was the IonPac AG16 with dimensions of 4 × 50 mm. The analysis was performed using an Eluent of 18.75 mM sodium hydroxide (Dionex Corporation, Sunnyvale, CA, USA) in water, with a flow rate of 0.8 mL/min. A three-point calibration curve was used for the analysis. This highly effective IC tool allowed for calculating the concentrations of fluoride, chloride, bromine, nitrate, nitrite, phosphate, and sulfate ions in the parts-per-million (ppm) range.
3.2. Use of GIS Exploratory Interpolation Techniques
The Geographic Information Systems (GISs) interpolation method is a powerful technique for estimating variable values (salinity and arsenic) at unsampled locations using known values from surrounding sample points [46]. Among the deterministic and geostatistical interpolation methods available, the Inverse Distance Weighting (IDW), Kriging, and Empirical Bayesian Kriging (EBK) methods were particularly effective in accurately estimating arsenic concentration values using available data [47].
We collected groundwater arsenic and salinity data within the extended study area boundary of 40 monitoring wells, as shown in Figure 2, to perform GIS interpolation methods. Data were sourced from the Bangladesh Water Development Board (BWDB). In the first step, we utilized an exploratory interpolation tool in ArcGIS Pro 3.1 software to determine spatial extents of arsenic and salinity occurrences in the study area. This software tool iteratively evaluated different interpolation techniques, quantified their accuracy with cross-validation metrics (e.g., Root Mean Square Error (RMSE), and ranked the output accordingly [48]. The exploratory interpolation tool was applied to the sample of known arsenic and salinity levels recorded during the wet season of 2021 and dry season of 2020 from the 40 monitoring wells and is listed in Table S3. Following the interpolation process, we chose the top-ranked method based on the RMSE. Empirical Bayesian Kriging (EBK) was the optimal interpolation method for the arsenic distribution, while Ordinary Kriging (OK) was selected to estimate the distribution of salinity distribution. We also utilized the cross-validation (CV) wizard in ArcGIS Pro version 3.1 software to assess the precision of these interpolation models. The RMSE values were used to evaluate the level of accuracy between the actual measurements and the model predictions, with lower values indicative of greater accuracy. A CV mean close to zero suggests minimal bias in our model predictions. Where the CV mean surpassed zero, it implied that the model consistently overestimated actual values. In contrast, a CV mean below zero indicated an underestimation of the values, according to the threshold set by ESRI [49].
4. Results
4.1. Geochemical Data from Groundwater Analysis
4.1.1. Arsenic (As) Distribution in Groundwater
The concentration of major cations, anions, and the physical parameters of groundwater samples are summarized in Supplementary Materials (Table S2a,b). Data from the ICP-MS analysis indicate that in Satkhira, the average concentrations of arsenic were 45.12 µg/l and 20.65 µg/l during the dry season 2020 and wet season 2021, respectively. The arsenic values range from a minimum of 0.16 µg/l at a depth of 30 m to a maximum of 92.42 µg/l at a depth of 45.5 m in the no SKSN2PZ-1/1 and SKASPZ-1well, respectively, during the wet season of 2021, whereas during the dry season of 2020, the minimum amount of As was found as 0.94 µg/l at 212 m depth in well SKSN2PZ3, and the maximum amount of As occurred at 187 µg/l at a shallow depth (45.5 m) in well SKASPZ1, respectively. The spatial distribution map of arsenic shows that the maximum amount of arsenic within a range of 37.23 μg/ to 65.19 μg/l was found in the southwestern side of Satkhira (Figure 4a). The minimum level of As occurrence was distributed towards the southern portion of Satkhira district within a range of 2.38 μg/l to 3.94 μg/l (Figure 4a).
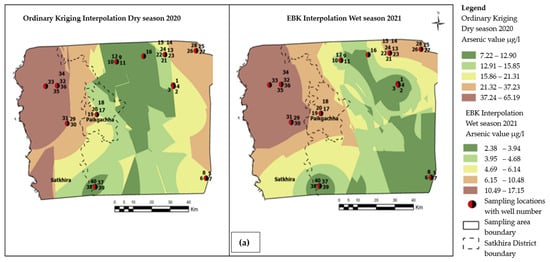
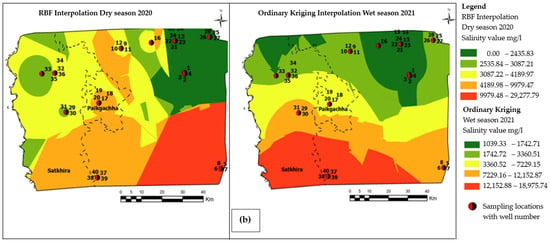
Figure 4.
(a) Visualization of groundwater arsenic distribution pattern derived from top-ranked GIS interpolation methods within the extended study area boundary, as shown in Figure 2. (b) Visualization of groundwater salinity distribution pattern derived from top-ranked GIS interpolation methods within the extended study area boundary, as shown in Figure 2 and Table S3.
4.1.2. Salinity Distribution in Groundwater
The spatial distribution pattern of salinity shows that a maximum of 29,277.79 mg/l salinity was found in the southernmost portion of the study area. Moreover, a minimum of 1039.33 mg/l salinity was distributed towards the northeastern direction of the study area. For salinity, the color bands represented in mg/l and can be categorized as slightly saline (deep green to light green), moderate saline (yellow and brown), to highly saline (red), respectively as depicted in Figure 4b.
4.1.3. Cross Validation (CV) of Salinity and Arsenic Distribution from Interpolation Models
Apart from RMSE and mean CV values, prediction and error plots were generated using data input in the geostatistical wizard window showing the measured salinity and arsenic concentrations versus predicted concentrations. An accurate model shows a regression line that follows a slope of 1, indicating that the predicted concentrations align with the measured concentrations. Deviations from a slope of 1 indicate errors in the model fit. For example, for the salinity interpolation, Ordinary Kriging (OK) showed a correlation error slope of −0.83 versus a measured slope of 0.43 during the wet season of 2021 (Figure 5a). Similarly, for arsenic distribution, the Empirical Bayesian Kriging (EBK) interpolation methods showed a correlation error slope of −0.92 versus a measured slope of 0.45 during the wet season of 2021 (Figure 5b).
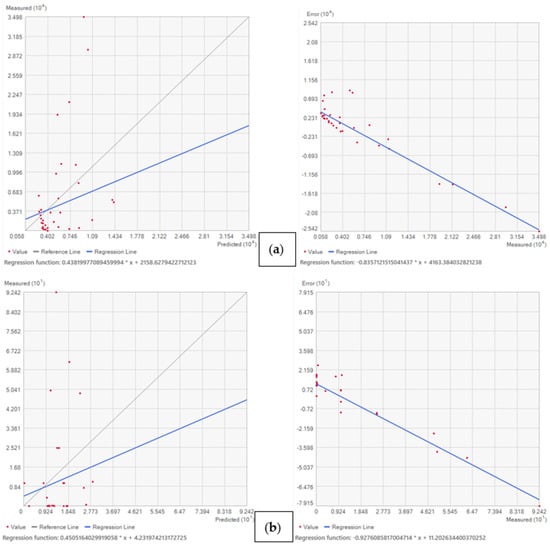
Figure 5.
(a) Measured salinity (y axis) vs. predicted salinity (x axis) and error vs. measured salinity (mg/l) based on Ordinary Kriging interpolation during wet season 2021. (b) EBK interpolation methods showing measured arsenic vs. predicted arsenic and error vs. measured arsenic during wet season of 2021.
Applying Ordinary Kriging (OK) interpolation for salinity distribution (Table S4a) revealed that the mean CV was −473.51 and the lowest Root Mean Square Error was 5691.81 during the wet season of 2021 in the study area, whereas after utilizing Radial Basis Function (RBF) interpolation during the dry season of 2020, the CV mean was −651.23, and the Root Mean Square Error was 3436.52 for salinity distribution. Therefore, the Ordinary Kriging interpolation method is the best one considering the lower amount of RMSE during the wet season of 2021, and this model consistently underestimates actual values of salinity in the study area during the wet season of 2021.
In contrast, the OK interpolation model overestimates actual values of salinity with a CV mean value of 44.39 and RMSE of 4262.11 during the dry season of 2020. Similarly, RBF interpolation, as represented in (Table S4a), reveals that the mean CV mean was 16.08 and the Root Mean Square Error was 7006.44 during the wet season of 2021 in the study area. So, this RBF interpolation model consistently overestimates actual values of salinity during the wet season of 2021. The trend of measured arsenic (As) vs. predicted As and measured As vs. error plots are shown in Figure S1, and the detail data are provided in Table S4b. During the dry season of 2020 and wet season of 2021, the other two interpolation methods show similar interpretations and vice versa for the arsenic distribution pattern.
4.1.4. Seasonal Variation of Salinity
The seasonal variability histogram shows erratic ups and downs in salinity trends during the 2020 dry and 2021 wet seasons in the Satkhira district (Figure 6). Detailed data tables are provided in Table S3. For well no 8, there was a sharp increase in salinity during the dry season of 2020 of about 21,797.12 mg/l and it showed a sudden decreasing trend towards well no 9, which reached about 1792 mg/l. Afterward, a continuous fluctuating salinity happened for the 2020 dry and 2021 wet seasons until well no 37. From well no 36, a sharp increasing salinity trend was found at about 29,728 mg/l and reached its peak at well no 38 of about 34,976 mg/l. After well 38, a sharp decreasing trend went as low as 5533. 44 for well no 39. The United States Geological Survey reported in the year of 2018 that fresh water has a salinity level of less than 1000 ppm. Slightly saline water has a salt concentration between 1000 ppm and 3000 ppm. Moderately salty water ranges between 3000 ppm and 10,000 ppm of salt concentration, while highly salty water ranges from 10,000 ppm to 35,000 ppm. Water with a salt concentration greater than 35,000 ppm is considered pure seawater. According to the exploratory interpolation method, over 50% of the Satkhira district experiences high groundwater salinity levels, with a maximum of 34,976 mg/l (Figure 6).
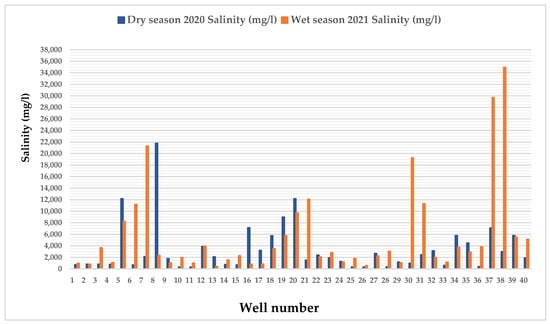
Figure 6.
Seasonal variability of groundwater salinity (mg/l) among 40 wells in southwest regions of Bangladesh.
The correlation among the physical parameters such as pH, Salinity, ORP and trace elements concentration of As and Fe is depicted in Figure 7. In addition, this correlation matrix is explained in the discussion Section 5.2. Detailed correlation data provided in Table S5a,b.
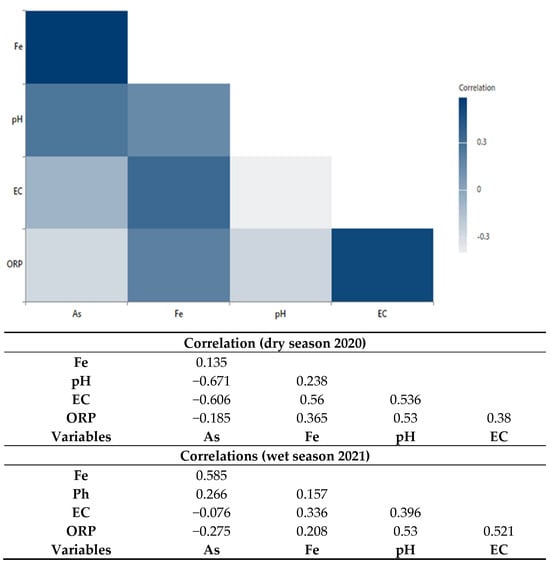
Figure 7.
Correlogram of pH, EC (µS/cm), As (µg/l), Fe (mg/l), and ORP (mv) and associated Pearson correlation matrix during dry season of 2020 and wet season of 2021, visualizing and comparing the strength and direction of the linear relationship between pairs of variation among these variables.
The Eh-pH diagram (Figure 8) shows certain chemical conditions in the Fe-HCO3−H2O system. The following major illustrations of concentration dimensions for the active species for this stability were considered in this study: Fe2+ = 10−3, HCO3− = 10−2. A temperature of 25 °C and a pressure of 1.013 bars were considered. Groundwater samples were located between the area where authigenic mineral, goethite (FeOOH) and siderite (FeCO3), concretions were dominantly present with a pH value between 7.02 and 8.20.
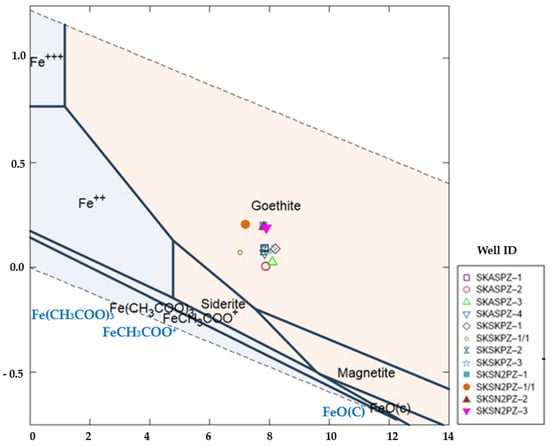
Figure 8.
Eh-pH diagram for Fe-HCO3 system showing the stability field of goethite, siderite, magnetite, and location of 12 groundwater samples during wet and dry seasons.
4.2. Mineralogy of Sediments
Sandstone samples commonly comprised quartz, feldspar, some mica, lithic fragments, and trace amounts of calcite cement mixtures (Figure 9). The studied sediment samples primarily comprise quartz (65% of framework grains), most of which is monocrystalline quartz (58%), orthoclase (k) feldspars that are comprised of plagioclase (20%), and (Na) feldspars (9%). Lithic fragments comprise about 10% of the framework grains, most of which are sedimentary types (8%), followed by metamorphic types (2%). A trace amount of volcanic lithic fragments is also found. The normalized modal percentage of the point count data is represented in Table 2.
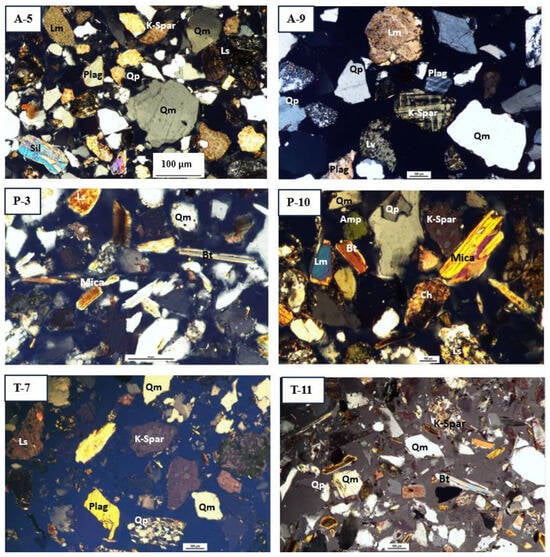
Figure 9.
Representative photomicrographs of minerals from different sediment depths of three selected boreholes arranged as per sample number listed in Table 2. Abbreviation: Qm—monocrystalline quartz; Qp—polycrystalline quartz; K-Spar—potassium feldspar; Plag—plagioclase feldspar; Ls—sedimentary lithic; Lm—metamorphic lithic; Ch—chert; Sil—sillimanite; Bt—biotite.

Table 2.
Normalized modal compositions showing percentages of individual framework grains of the 15 sediment samples from Satkhira district.
4.2.1. Heavy Minerals Study
A 30 g sediment sample from each aquifer, labeled as HT-06 and HA-03 in Table 1, was separated under 0.063 mm sieve size fractions. We found 4.4% of heavy minerals in Tala upazila at a depth of 121.92 m. Moreover, 6.56% of heavy minerals was found in Assasuni upazila at a depth of 30 m, respectively (Figure 10). Most of the heavy mineral assemblages in this area were opaque varieties that make up between 33% and 53% of the total counted grains (Table S6a,b). In the Quaternary sediments of the Satkhira district, around fourteen (14) different heavy mineral species were identified. The most-found heavy minerals’ weight % in the sediment sample HA-03 was tourmaline (3.9%), garnet 3.25%, zircon 5.19%, rutile 3.25%, biotite 7.79%, kyanite 4.55%, sillimanite 5.84%, magnetite 7.79%, and apatite 6.49% (Table S6a,b; Figure 10 and Figure 11).
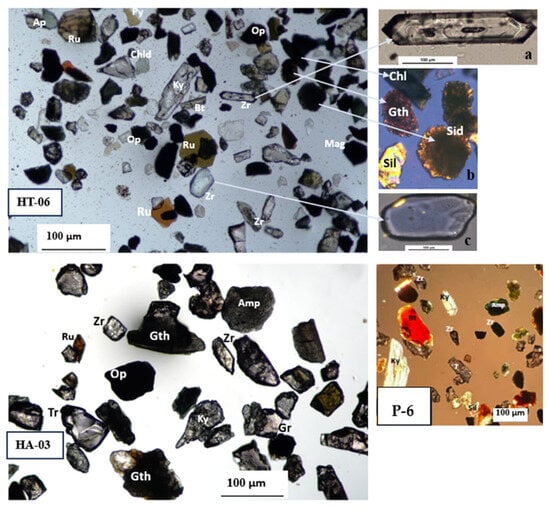
Figure 10.
Representative photomicrographs of heavy mineral assemblages from different depth of sediments of selected three boreholes arranged as per sample number listed in Table 1. (a) Zircon crystal inclusion. (b) Heavy minerals in XPL. (c) Abraded zircon crystal. Abbreviation: Amp—amphibole, Ap—apatite, Bt—biotite, Chl—chlorite, Chld—chloritoid, Gr—garnet, Gth—goethite, Ky—kyanite, Mag—magnetite, Op—opaque, Py—pyrite, Ru—rutile, Sil—sillimanite, Sid—siderite, Tr—tourmaline, Zr—zircon.
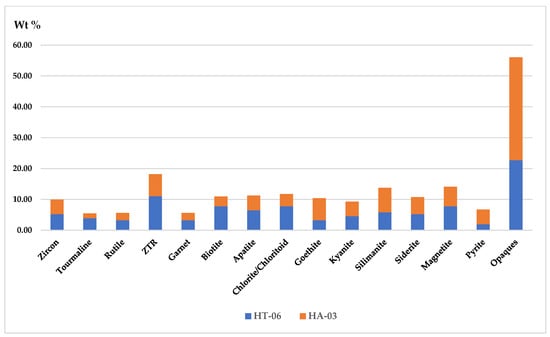
Figure 11.
Stacked diagram showing the normalized weight percentage (%) of heavy mineral concentration among sediments in shallow well (30 m depth), HA-03, and in a deep well (122 m depth), HT-06, in Satkhira district. Abbreviation: ZTR: zircon–tourmaline–rutile, H: heavy mineral, A: Assasuni upazila, T: Tala upazila.
4.2.2. XRD Analysis of Sediments
Figure 12 depicts the major and minor minerals that were detected in sediment sample A-12 through the analysis of XRD spectra using Defrac.EVA version 6 software. Aquifer sediments from the Satkhira district are rich in authigenic minerals primarily composed of Fe-oxides (mainly goethite or FeO(OH) and Fe-carbonates (mostly siderite or FeCO3), which make up 1.8% of the total S-Q%. This comprehensive analysis of sediments also reveals the presence of calcite (21.7%), quartz (33.4%), illite (9.9%), kaolinite (1.6%), carbon (3.3%), sulfur (4.2%), and biotite (16.5%) minerals, as shown in Table S7.
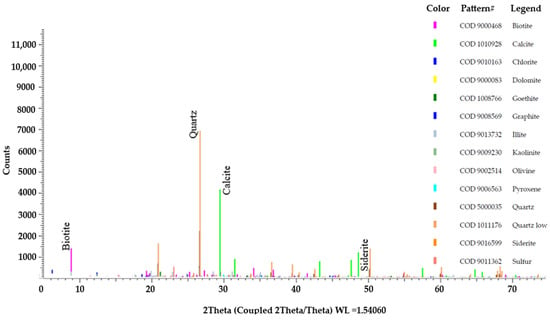
Figure 12.
Detected major and minor minerals constituent from the XRD spectra of sample A-12.
4.2.3. Scanning Electron Microscope (SEM) Analysis of Sediments
A detailed Scanning Electron Microscope (SEM) analysis of the sediment sample A-12 shows the mineral concretion of goethite and biotite. The SEM analysis captured Backscattered Electron (BSE) images, obtained associated EDS spectra, and created elemental color maps of the distribution of these mineral grains, as shown in Figure 13. The SEM and EDS analysis accurately identified the specific elements present in these two selected mineral grains. The EDS spectrum obtained from this study revealed that biotite and goethite mineral grains contain three dominant elements—silicon (34.71%), oxygen (47.71%), and iron (3.56%), respectively. The percentages were counted three times on the same mineral grains for better accuracy. Moreover, these mineral grains contain trace elements such as Al, Ca, K, and Mg in oxide forms with an average concentration of 5.90%, 2.61%, 2.12%, and 0.58%, respectively, based on their decreasing abundance, as detailed in Table S8. However, the SEM-EDS spectral peaks could not confirm the presence of detectable limits of arsenic within these mineral grains.
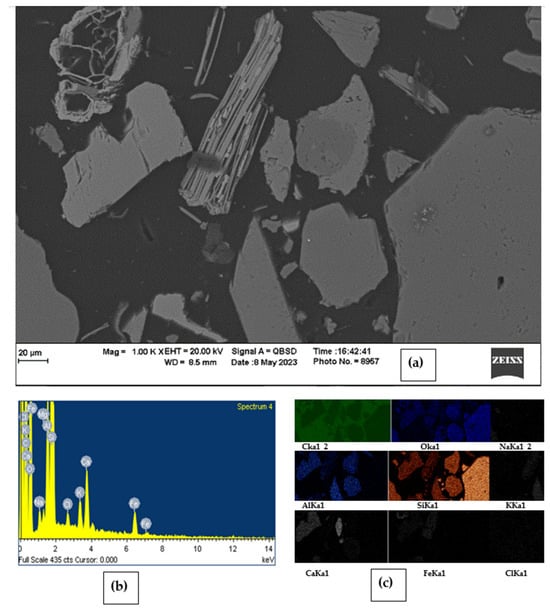
Figure 13.
(a) SEM image of sample A-12 shows the aggregated crystalline structure of biotite and goethite mineral grains; (b) corresponding EDS spectrum showing different peaks of respective elemental composition; (c) color maps showing the elemental variation across these mineral grains.
5. Discussion
5.1. Hydrochemical Facies of Groundwater
The piper triangular diagram [50] signifies that groundwater can be categorized as the Ca-Cl-HCO3 type in the dry season for the wells SKASPZ-1 and SKSKPZ-4, but it turns to the mixed Na-Cl-HCO3 type in the wet season for both wells, respectively (Figure 14). During the wet season, these wells had more Na than Ca concentrations, indicating that Na on clay may have been replaced by Ca from the water via ion exchange.
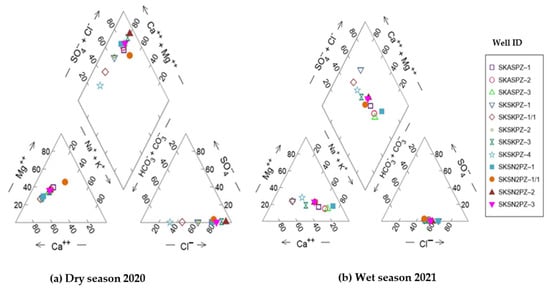
Figure 14.
Piper diagrams showing the hydrochemical processes between different water sources among 12 monitoring wells located in the Satkhira district, Bangladesh. (a) Dry season of 2020; (b) wet season of 2021. Well ID abbreviation: SK—Satkhira district; AS—Assasuni upazila; and PZ—Piezometer.
Two hydrochemical facies, Ca-Cl-HCO3 type and Na-Cl-HCO3 type, dominate the groundwater during the dry and wet seasons, respectively. The high HCO3− concentration may be derived from the dissolution of inorganic calcite or the decomposition of organic matter. The Na-HCO3-type water may be produced by the cation exchange process, in which Ca or Mg in the water exchange with Na on the clay minerals when seawater enters a freshwater aquifer zone. A geochemical process known as cation exchange, if occurring, could add Na-HCO3 to the groundwater, accompanied by calcite dissolution [51], as explained by Equation (1) or (2) below:
Na+ + Ca-clay ⇌ Na-clay + Ca2+
CaCO3 + Na2-clay + H+ ⇌ Ca-clay + 2Na+ + HCO3−
This cation exchange reaction would consume H+ and release Na+ and HCO3− into the water. Thus, the observed Na-HCO3-type water with a relatively high pH may be produced by a cation exchange process, in which Ca or Mg in the water exchange with Na on the clay minerals. Clay minerals in a high-salinity environment during dry seasons are typically Na-rich from their equilibrium with saltwater. Overall, the major ionic trends of both shallow aquifers (<50 m deep) and deep aquifers (>150 m deep) during dry seasons are Ca2+ > Mg2+ > Na+ > K+ and Cl− > HCO3− > SO4−2.
Weathering and dissolution of carbonates, silicates rocks, and minerals release Na+, Ca2+, and Mg2+ elements into the groundwater. Clay-rich layers present in the aquifers soften the water by reactions after exchanging calcium and magnesium ions with absorbed sodium ions on the clay minerals [52]. Few Na-Cl-type deep aquifer waters found in the southwest regions of the study area indicate the presence of connate water confined in the inter-basin during Holocene transgression [53]. Therefore, conservative mixing between saltwater and freshwater or seasonal salinity change may drive non-conservative water–rock interaction such as mineral (calcite) dissolution and cation exchange.
The hydrochemical analysis also revealed the presence of two distinct facies types: the Na-Cl type and Ca-Cl type. In the wet season, the samples SKSN2PZ1, SKASPZ2, and SKASPZ3 comprised approximately 80% Na-Cl types of water. This finding suggests that the coastal aquifers in the study area are affected by seawater. Conversely, in the dry season, a combination of water types, such as Ca-HCO3, Na-HCO3, and Ca-Cl facies, constituted 20% of these samples, indicating the existence of a freshwater phase in the coastal aquifers [54]. The dominance of Na+ in cations and the interactions between HCO3 and Cl− in anions have been observed in both facies types. The Na-Cl facies type, which constitutes the majority, indicates the presence of high levels of sodium and chloride ions. On the other hand, the Na-Cl-HCO3 facies type shows the presence of bicarbonate ions, which interact with the chloride ions in the water system. Therefore, it is noteworthy that saltwater intrusion has played a significant role in shaping the chemical composition of the studied area [55].
The calculation of SICalcite shows that groundwater in the aquifer layers was typically oversaturated with calcite, showing a maximum value of 1.91 during the dry season and 1.68 during the wet season, respectively. SICalcite values decrease to a level close to saturation, which is indicated by a range between 0.29 and 0.56, respectively, during the wet season (Figure S2a,b). The occurrence of oversaturated calcite may happen because of the slow dissolution of CaCO3 from the breakup of ancient organic materials in freshwater. Therefore, the continuous breakdown of calcite leads to higher salinity levels despite the ionic exchange absorbing the dominant portion of Ca2+ and Mg2+ after releasing from their host rocks.
5.2. Distribution Mechanism of Arsenic (As) and Iron (Fe) in Groundwater
The type of rock formations in the aquifer have confining clay layers found in the lithostratigraphic column (Figure 3) that reduce the rate at which water is absorbed into the ground. In addition, the tiny pore spaces between the sediment particles slow down the movement of water and can lead to more minerals being dissolved. Areas with high levels of arsenic in groundwater tend to have a proportion of correlation with other trace elements and physical parameters such as Fe, pH, EC, and ORP, respectively. Arsenic (As) and manganese (Mn) are positively correlated with Fe and pH (Figure S3) which suggests that As in the aquifer may be derived from bacterial iron reduction in iron and manganese [56].
4 FeOOH + CH2O + 7H+ → 4 Fe2+ + HCO3− + 6H2O
As is negatively correlated with ORP, which suggests that more negative ORPs under moderately reducing conditions may lead to the reductive dissolution of Fe oxides and increase the level of trace elements, including As and Fe, in groundwater. Due to ion exchange, as explained in Equations (1) and (2) above, organic clay minerals become mixed, causing significant microbial activity, such as the reduction in Fe-oxyhydroxides, which eventually results in the release of high levels of arsenic and delimits iron (Fe) concentration into groundwater.
The findings from the Eh-pH diagram (Figure 8), XRD analysis (Figure 12), and SEM analysis (Figure 13) show the correlation of authigenic goethite (FeOOH) and siderite (FeCO3) minerals with the arsenic release mechanism. The XRD data (Table S7) show that shallow sediments contain minor monoclinic biotite grains, whereas the deeper sediments contain major monoclinic biotite. The weathering of biotite [K(Mg, Fe)₃AlSi₃O₁₀(F, OH)₂] and goethite [FeO(OH)] in sediments could release Fe and As into groundwater [57]. The presence of goethite and siderite suggests that the aquifer was under slightly oxidized to moderately reducing conditions, which is consistent with the measured ORP value of (+50.40 mv) in the groundwater well no. SKSN2PZ-1 during the dry season of 2020 and with the negative ORP value ranging between −53 mv and −149.5 mv, respectively, among all other wells (Table S2a,b). This reactivity of these Fe-oxyhydroxide minerals may, in turn, contribute to the enrichment and mobility of As in groundwater in the study area [58].
5.3. Vertical Distribution of Arsenic (As) and Salinity Contents and Heavy Mineral wt% within Aquifer Sediments
Figure 15 shows the depth-wise vertical distribution of As concentration, salinity contents, and associated wt% of heavy mineral assemblages. The sediment analysis of aquifers in well no SA BH-2 (Sample ID: HA-03) and well no STBH-3 (sample ID: HT-06) has revealed a significant variation in the weight percentage of heavy minerals. Further examination of groundwater samples from the two wells has indicated elevated levels of arsenic of 121.92 µg/l and 92.42 µg/l during the dry and wet seasons at shallow depths of 30.48 m and intermediate depths of 121.93 m, respectively (Figure 15a). The difference in magnetic susceptibility in the minerals between the two depths suggests a relationship between the abundance of strongly magnetic minerals, such as magnetite, goethite, siderite, Fe-oxides (20.13%), and moderately magnetic minerals, like biotite and garnet (11.04%), in the sediments with the increased concentrations of arsenic in the groundwater (Figure 15c). Moreover, higher amounts of salinity (~30,080.00 mg/l) were observed at the 30.48 m depth, where an abundance of strongly magnetic minerals, particularly iron-oxyhydroxides, was observed (Figure 15b).
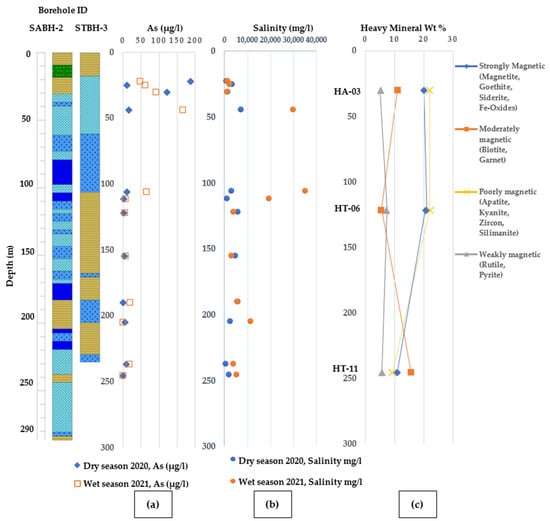
Figure 15.
Vertical distribution showing (a) arsenic vs. Depth variation (As) (b) salinity intrusion vs. depth variation and (c) heavy mineral wt% vs. depth variation within aquifer sediments from selected depts of monitoring wells and associated depth-wise arsenic and salinity distribution pattern. [Lithologic legends are provided in Figure 3].
The aquifers in the study area consist of unconsolidated sediments, such as sands, silts, and clays minerals, and hold significant amounts of authigenic and detrital minerals. This abundance of detrital minerals in intermediate and deeper aquifer layers suggests rapid sedimentation and subsidence of Holocene sediments in the coastal Bengal basin. This distinct mineral composition provides valuable insights into the geological history and processes of the area.
The sediments from deeper sections of the wells present a unique composition, rich in biotite, sillimanite, chlorite/chloritoid, and zircon. Notably, the most commonly found opaque minerals in the Assasuni upazila are magnetite and goethite. These opaque minerals are highly dominant in older sediments (Oligocene to Pliocene) in the Bengal basin, while the Quaternary sediments comprise a lower average of 5% [59]. At depths of 200 m within the aquifer, concentrations of As varied between 0.094 µg/l and 19.04 µg/l. Notably, these aquifers contained a significant proportion of moderately magnetic heavy minerals, namely biotite and garnet, which accounted for 15.75% of the heavy mineral composition.
The release of arsenic, even in negligible amounts, into the Holocene deep aquifers may result from the interaction between infiltrated surface water and reduction in biotite and goethite [60]. However, the reactivity of biotite and most silicate minerals is considered stable and relatively insoluble via acid leaching compared to other minerals containing iron oxides and organic clay minerals. Thus, having biotite in deeper aquifers does not readily mobilize arsenic into groundwater under the aquifer chemical and redox conditions [61]. Instead, it may have been relieved from iron oxides or organic matter, as described by Equations (1) and (2) in Section 5.1 [62].
The general trend of arsenic occurrences happens at shallower depths (<50 m below the ground) and reached a maximum amount of 92.42 µg/l during the wet season and 121.92 µg/l during the dry season at a depth of 45.5 m. In contrast, deeper groundwater wells show significantly lower levels of groundwater arsenic, about 0.94 μg/l at 212 m depth during the dry season and 0.28 μg/l during the wet season, respectively. The maximum permissible level of arsenic in drinking water is 10 µg/l or 0.010 mg/l, according to U.S. Environmental Protection Agency (EPA) reports, and Bangladesh’s standard limit of arsenic is 50 μg/l or 0.05 mg/l, as reported by the WHO [63]. Hence, the arsenic concentration level found during wet season was much higher than the EPA and WHO permissible limits in the study area.
Groundwater salinity gradually decreases and reaches its lowest point in April or May throughout the winter or dry season, as shown in Figure 15. The arrival of the monsoon or wet season from June to September flushes salts from aquifer sediments, gradually increasing groundwater salinity and reaching as high as 35,000 mg/l. Conversely, if the sea levels rise, the salinity of the water may also increase, which can release more arsenic into the fresh water. Seasonal variations also impact arsenic dynamics in groundwater. During the dry season, arsenic in groundwater was higher, about 190 μg/l. Meanwhile, during the wet or monsoon season (July–October), dissolved arsenic concentrations in groundwater showed significant variations from the dry season and decreased to 160 μg/l, respectively.
5.4. Sediment Composition and Texture Analysis
The ternary plots emphasize overall sandstone modes of mineral grains in QFL and source rocks’ provenance types in QtFL diagrams, as shown in Figure 16. The Quaternary sediment samples are plotted nearer to the recycled orogenic and transitional continental provenance fields, although the overall trend is more toward the recycled orogenic provenance field (Figure 16). The compositional study suggests that sediment sources throughout the Cenozoic did not significantly change and the coastal sediments were transported via the major river systems from the Himalayas, Indo-Burman Ranges, and the Indian Shield [64]. The higher number of the zircon–tourmaline–rutile (ZTR) maturity index (more than 20%) usually indicates a higher proportion of abraded, broken detrital zircons, as shown in Figure 10. The zircons in the Paleogene strata of the Bengal basin might have originated from an older source (Indian craton) compared to the zircons of the Holocene sediments, which may have come from the uplifted orogenic sources [65]. However, the results from this study, with a low ZTR index of about 11%, indicate a heterogeneous source from low-to-intermediate grade metamorphic rocks.
The provenance fields of the Holocene sediments in the Satkhira district are mostly recycled orogenic, collisional fold belts and continental blocks, as shown in Figure 16. Almost all the samples fall in the sandstone compositional fields of arkose to lithic arkose. Most feldspar grains are subangular to angular, and quartz grains are subangular to subrounded, suggesting that the sediments were deposited rapidly in a cooler and/or dry environment that prevented feldspars from undergoing significant chemical weathering. The angular to sub-angular quartz grains signify short travel distances, from a high relief in the source areas. The greater angularity of the coastal sediments reveals their relatively short transportation and quick burial before any coastal turbulent flow could affect them. This inference from the coastal sediments validates the source constraints of older geologic (Oligocene to Pleistocene) sediment samples in the Bengal basin [66]. This observation indicates that the Holocene coastal sediments are relatively texturally immature compared to the older exposed and drilled sediments of the Miocene to Pleistocene sequences in the Bengal basin [67].
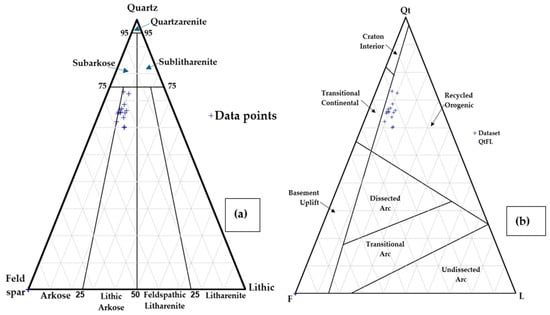
Figure 16.
(a) QFL triangular diagram showing average sand classification of Satkhira, Bangladesh, modified after Folk, 1974 [68]. (b) QtFL Provenance Plot of sandstone in Satkhira, Bangladesh, modified after Dickinson, 1985.
6. Conclusions
Groundwater is dominated by two hydrochemical facies: the Ca-Cl-HCO3 type during the dry season and the Na-Cl-HCO3 type during the wet season. Groundwater among aquifers in southwestern Bangladesh contains major elements like Ca, Mg, Na, K, and Fe, released through weathering and dissolution of carbonates, silicates, and evaporite rocks and minerals. Observation of higher salinity in the intermediate to deeper aquifers suggests rapid sedimentation and subsidence of the area with repeated sea level changes. The concentration of authigenic and heavy minerals in the Quaternary succession of the Bengal basin varies throughout the entire succession. The simplified Fe-HCO3 system in the Eh-pH plot shows the stability field of goethite and siderite minerals, suggesting that the aquifer is under slightly oxidized to moderately reducing conditions. The sediments found in the southwest coastal areas of Bangladesh are compositionally and texturally immature, as indicated by a lower ZTR index of 11%. These sediments may have traveled a short distance from source areas and did not go through intense chemical weathering. The microbial activity in the groundwater results from the interaction between water, calcite (CaCO3) minerals, and organic matter, likely responsible for dissolved HCO3−. Arsenic is positively correlated with Fe and pH, suggesting that As may be derived from the bacterial iron reduction of Fe oxides. Arsenic is negatively correlated with ORP. This mechanism indicates that more negative ORPs under moderately reducing conditions may lead to the reductive dissolution of Fe oxides and increased trace element levels, including As and Fe, in groundwater. The lack of correlation between As and EC suggests that salinity and increased ionic competition for mineral sorbing sites with Fe oxides may not control As mobilization. The spatial distribution trend of groundwater arsenic follows a particular pattern, for example that higher levels of arsenic concentration occur in shallow aquifers and a lower concentration occurs in deep aquifers in the study area. Hence, arsenic concentration in groundwater among shallow aquifers is nearly eighteen times more than the EPA standards and four times higher than the WHO’s and Bangladesh’s standard levels. Comparing the spatial distribution pattern of arsenic and salinity, we can infer that nearby regions with a higher amount of arsenic occurrence show a significant distribution of salinity. However, this hypothesis requires special attention and further study, with more sampling points in the southern margin of coastal Bangladesh.
Supplementary Materials
The following supporting information can be downloaded at: https://www.mdpi.com/article/10.3390/w16101442/s1. Table S1. Borehole lithologic log of Satkhira Assasuni upazila, southwest Bangladesh. Table S2a. Levels of physical parameters, major ions from the groundwater samples during dry season 2020 among 12 monitoring wells of Satkhira district, Bangladesh. Table S2b. Levels of physical parameters, major ions from the groundwater samples during wet season 2021 among 12 monitoring wells of Satkhira district, Bangladesh. Table S3. Primary data from 40 monitoring well groundwater sample analysis. Table S4a. Ranks of Interpolation models and cross validation data from geostatistical wizard for salinity during dry season 2020 and wet season 2021 in the extended study area boundary as shown in Figure 2. Table S4b. Ranks of Interpolation models and cross validation data from geostatistical wizard for arsenic during dry season 2020 and wet season 2021 in the extended study area boundary as shown in Figure 2. Table S5a. Pearson Correlation matrix among field parameters and major ions found in the 12 groundwater samples at Satkhira district during dry season 2020. Table S5b. Pearson Correlation matrix among field parameters and major ions found in the 12 groundwater samples at Satkhira district during wet season 2021. Table S6a. Depthwise heavy mineral distribution. Table S6b. Depthwise heavy minerals wt% among deep, intermediate and shallow aquifers. Table S7. Data retrieved in Defrac.EVA from XRD analysis of the sample A-12 in Satkhira district. Table S8. SEM Data showing elemental weight percentage with respective sample ID among nine sediment samples in Satkhira district. Figure S1. Ordinary Kriging interpolation methods showing measured As vs. Predicted As and measured As vs. Error during Dry season 2020. Figure S2: Distribution plots of Saturation Index of (a) calcite versus salinity and (b) dolomite versus salinity during wet season 2021 and dry season 2020 in Satkhira district. Figure S3: Scatter plots showing correlation between As vs. Fe, and As vs. ORP during dry 2020 and wet season 2021.
Author Contributions
Research concept design: M.R.U. and A.U.; Methodology: M.R.U., A.U., M.-K.L. and J.N.; Field parameter analysis and sample collection: A.Z., M.M.H. and N.S.; Geostatistical analysis: M.R.U.; Original draft: M.R.U.; Manuscript review: M.R.U., A.U., M.-K.L., J.N., A.Z., M.M.H. and N.S. All authors have read and agreed to the published version of the manuscript.
Funding
This research received funding from (1) GSA graduate student research grant 2022, grant number 13716-22. (2) AU CAST Hydroclimate graduate student mini-grant award 2022, grant number USGS-G22AC00083-00 and (3) AU Geosciences Advisory Board research grant, 2022.
Data Availability Statement
Data are contained within the article and Supplementary Materials.
Acknowledgments
The authors would like to acknowledge the Geological Society of America, the Geoscience Advisory Board at Auburn University, and the USGS minigrant program for providing funding for this research. The researchers are also thankful to the Bangladesh Water Development Board for providing the sediment and groundwater samples. Zeki Billor is acknowledged for providing hands-on training in ICP-MS, XRF, XRD, and analytical data. Additionally, we are grateful to CAIS Lab for Environmental Analysis at the University of Georgia and Auburn University Research and Instrumentation Facility for analyzing the groundwater anions and sediment samples, respectively. All individuals included in this acknowledgement have consented to publish obtained data and results. The authors would like to express their sincere gratitude to the Water journal reviewers for their rigorous peer review, constructive feedback, and suggestions.
Conflicts of Interest
The authors declare no conflicts of interest.
References
- Hasan, M.N.; Siddique, M.A.B.; Reza, A.H.M.S.; Khan, R.; Akbor, M.A.; Elius, I.B.; Hasan, A.B.; Hasan, M. Vulnerability assessment of seawater intrusion in coastal aquifers of southern Bangladesh: Water quality appraisals. Environ. Nanotechnol. Monit. Manag. 2021, 16, 100498. [Google Scholar] [CrossRef]
- Zahid, A.; Rahman, A.; Ali, M.M.; Zakaria, M.; Hassan, M.R. Determining Sources of Groundwater Salinity in the Multi-layered Aquifer System of the Bengal Delta, Bangladesh. BRAC Univ. J. Sci. Eng. 2016, 11, 37–51. [Google Scholar]
- Ahmed, K.M.; Bhattacharya, P.; Hasan, M.A.; Akhter, S.H.; Alam, S.M.M.; Bhuyian, M.A.H.; Imam, M.B.; Khan, A.A.; Sracek, O. Arsenic enrichment in groundwater of the alluvial aquifers in Bangladesh: An overview. Appl. Geochem. 2004, 19, 181–200. [Google Scholar] [CrossRef]
- Mukherjee, A.; Fryar, A.E.; Howell, P.D. Regional hydrostratigraphy and groundwater flow modeling in the arsenic-affected areas of the western Bengal basin, West Bengal, India. Hydrogeol. J. 2007, 15, 1397–1418. [Google Scholar] [CrossRef]
- Shamsudduha, M.; Marzen, L.J.; Uddin, A.; Lee, M.K.; Saunders, J.A. Spatial relationship of groundwater arsenic distribution with regional topography and water-table fluctuations in the shallow aquifers in Bangladesh. Environ. Geol. 2009, 57, 1521–1535. [Google Scholar] [CrossRef]
- Ali, A. Vulnerability of Bangladesh to Climate Change and Sea Level Rise through Tropical Cyclones and Storm Surges. J. Water Air Soil Pollut. 1996, 92, 171–191. [Google Scholar]
- Islam, S.M.D.; Uddin, M.J. Impacts, vulnerability and coping with cyclone hazard in coastal region of Bangladesh: A case study on Kalapara upazila of Patuakhali district. Jahangirnagar Univ. Environ. Bull. 2015, 4, 11–30. [Google Scholar]
- Mahmud, M.I.; Mia, A.J.; Uddin, M.R.; Rahman, M.M.; Rahman, M.H. Assessment on seasonal variations in waterlogging using remote sensing and GIS techniques in Satkhira district in Bangladesh. Barisal Univ. J. Part 1 2017, 4, 67–80. [Google Scholar]
- Ashrafuzzaman, M.D.; Artemi, C.; Santos, F.D.; Schmidt, L. Current and Future Salinity Intrusion in the South-Western Coastal Region of Bangladesh. Span. J. Soil Sci. 2022, 12, 10017. [Google Scholar] [CrossRef]
- Kabir, M.M.; Hossain, N.; Islam, A.R.M.T.; Akter, S.; Fatema, K.J.; Hilary, L.N.; Hasanuzzaman, M.; Didar-ul-Alam, M.; Choudhury, T.R. Characterization of groundwater hydrogeochemistry, quality, and associated health hazards to the residents of southwestern Bangladesh. Environ. Sci. Pollut. Res. 2021, 28, 68745–68761. [Google Scholar] [CrossRef]
- Rahman, D.M.M.; Bhattacharya, D.A.K. Saline Water Intrusion in Coastal Aquifers: A Case Study from Bangladesh. IOSR J. Eng. 2014, 4, 7–13. [Google Scholar] [CrossRef]
- Bear, J.; Alexander, H.D.; Cheng, S.S.; Driss, O.; Ismael, H. Seawater Intrusion in Coastal Aquifers, Concepts, Methods and Practices; Springer Science & Business Media: Dordrecht, The Netherlands, 1999; Volume XV, p. 627. ISBN 978-0-7923-5573-1. [Google Scholar] [CrossRef]
- Ahmed, N. Saltwater Intrusion and Trace Element Contaminations at the Coastal Aquifers of the Ganges Delta. Master’s Thesis, Auburn University, Auburn, AL, USA, 2016; p. 124. [Google Scholar]
- Toufique, K.; Yunus, M. Vulnerability of Livelihoods in the Coastal Districts of Bangladesh. Bangladesh Dev. Stud. 2013, 36, 95–120. [Google Scholar]
- BGS; DPHE. Arsenic Contamination of Groundwater in Bangladesh Final Report. BGS Technical Report. 2001; Volume 2, WC/00/19. Available online: https://www2.bgs.ac.uk/groundwater/health/arsenic/Bangladesh/home.html (accessed on 29 April 2023).
- Ravenscroft, P.; Burgess, W.G.; Ahmed, K.M.; Burren, M.; Perrin, J. Arsenic in groundwater of the Bengal Basin, Bangladesh: Distribution, field relations, and hydrogeological setting. Hydrogeol. J. 2005, 13, 727–751. [Google Scholar] [CrossRef]
- Khalequzzaman, M.; Faruque, F.S.; Mitra, A.K. Assessment of Arsenic Contamination of Groundwater and Health Problems in Bangladesh. Int. J. Environ. Res. Public Health 2005, 2, 204–213. [Google Scholar] [CrossRef] [PubMed]
- Box, J.E.; Hubbard, A.; Bahr, D.B. Greenland ice sheet climate disequilibrium and committed sea- level rise. Natl. Clim. Change 2022, 12, 808–813. [Google Scholar] [CrossRef]
- Akhter, M.N.; Chakraborty, T.K.; Ghosh, G.C.; Ghosh, P.; Jahan, S. Migration Due to Climate Change from the South-West Coastal Region of Bangladesh, A Case Study on Shymnagor Upazilla, Satkhira District. Am. J. Environ. Prot. 2016, 5, 145–151. [Google Scholar] [CrossRef][Green Version]
- Ahmed, N.; Ambrogi, O.A.; Muir, J. The Impact of Climate Change on Prawn Postlarvae Fishing in Coastal Bangladesh: Socioeconomic and Ecological Perspectives. Mar. Policy 2013, 39, 224–233. [Google Scholar] [CrossRef]
- Sikder, A.M.; Khan, M.H.; Hasan, M.A.; Ahmed, K.M. Mineralogical Characteristics of the Meghna Floodplain Sediments and Arsenic Enrichment in Groundwater in Bangladesh; Taylor & Francis Group: London, UK, 2005; ISBN 041536 700 X. [Google Scholar]
- Horneman, A.; Van Geen, A.; Kent, D.; Mathe, P.E.; Zheng, Y.; Dhar, R.K.; O’Connell, S.; Hoque, M.A.; Aziz, Z.; Shamsudduha, M.; et al. Decoupling of As and Fe release to Bangladesh groundwater under reducing conditions, Part I, Evidence from sediment profiles. Geochim. Cosmochim. Acta 2004, 68, 3459–3473. [Google Scholar] [CrossRef]
- Anawar, H.M.; Akai, J.; Mihaljevič, M.; Sikder, A.M.; Ahmed, G.; Tareq, S.M.; Rahman, M.M. Arsenic Contamination in Groundwater of Bangladesh: Perspectives on Geochemical, Microbial and Anthropogenic Issues. Water 2011, 3, 1050–1076. [Google Scholar] [CrossRef]
- Rashid, M.; Islam, M.S. Adaptation to climate changes for sustainable development of Bangladesh agriculture. In Proceedings of the Third Session of the Technical Committee of the Asian and Pacific Center for Agriculture Engineering and Machinery, Beijing, China, 20–21 November 2007. [Google Scholar]
- BBS. Population and Housing Census Preliminary Report. 2023; ISBN 978-984-35-2977-0. Available online: http://www.bbs.gov.bd (accessed on 15 February 2023).
- Uddin, A.; Lundberg, N. Cenozoic history of the Himalayan-Bengal system, Sand composition in the Bengal basin, Bangladesh. Geol. Soc. Am. Bull. 1998, 110, 497–511. [Google Scholar] [CrossRef]
- Rahman, M.T.; Majumder, R.K.; Rahman, S.H.; Halim, M.A. Sources of deep groundwater salinity in the southwestern zone of Bangladesh. Environ. Earth Sci. 2011, 63, 363–373. [Google Scholar] [CrossRef]
- BWDB-UNDP. Groundwater Survey: The Hydrogeological Conditions of Bangladesh; UNDP Technical Report DP/UN/BGD-74-009/1; United Nation Development Programme: New York, NY, USA; Bangladesh Water Development Board: Dhaka, Bangladesh, 1982; 113p. Available online: http://ceip-bwdb.gov.bd/Tech_Report/LTM/March22.pdf (accessed on 15 April 2023).
- Hoque, M.A.; Burgess, W.G.; Ahmed, K.M. Integration of aquifer geology, groundwater flow and arsenic distribution in deltaic aquifers a unifying concept. Hydrol. Process 2017, 31, 2095–2109. [Google Scholar] [CrossRef]
- Davies, J.; Rastall, P.; Herbert, R. Field Determination of Vertical Permeability. British Geological Survey Technical Report,1990, WD, 98, 2C. Available online: https://core.ac.uk/download/pdf/33449952.pdf (accessed on 10 April 2023).
- Jahan, K.; Zahid, A.; Bhuiyan, M.A.E.; Ali, I. A Resilient and Nature-Based Drinking Water Supply Source for Saline and Arsenic Prone Coastal Aquifers of the Bengal Delta. J. Environ. Cult. Econ. Soc. Sustain. 2022, 14, 6703. [Google Scholar] [CrossRef]
- Dowling, C.B.; Poreda, R.J.; Basu, A.R. The Groundwater Geochemistry of the Bengal: Weathering, Chemsorption and Trace Metal Flux to the Oceans. Geochim. Cosmochim. Acta 2003, 67, 2117–2136. [Google Scholar] [CrossRef]
- Uddin, A.; Shamsudduha, M.; Saunders, J.A.; Lee, M.K.; Ahmed, K.M.; Chowdhury, M.T. Mineralogical profiling of alluvial sediments from arsenic-affected Ganges–Brahmaputra floodplain in central Bangladesh. Appl. Geochem. 2011, 26, 470–483. [Google Scholar] [CrossRef]
- Shamsudduha, M.; Taylor, R.G.; Haq, M.I.; Nowreen, S.; Ahmed, K.M.U.; Sakib, N. The Bengal Water Machine: Quantified freshwater capture in Bangladesh. Science 2022, 377, 1315–1319. [Google Scholar] [CrossRef]
- Rahman, A.F.; Danilo, D.; Bassil, E. Response of the Sundarbans coastline to sea level rise and decreased sediment flow: A remote sensing assessment. Remote Sens. Environ. 2011, 115, 3121–3128. [Google Scholar] [CrossRef]
- Wentworth, K. A Scale of Grade and Class Terms for Clastic Sediments. J. Geol. 1922, 30, 377–392. [Google Scholar] [CrossRef]
- Francus, P. An image-analysis technique to measure grain-size variation in thin sections of soft clastic sediments. Sediment. Geol. 1998, 121, 289–298. [Google Scholar] [CrossRef]
- Ingersoll, R.V.; Bullard, T.F.; Ford, R.L.; Grimm, J.P.; Pickle, J.D.; Sares, S.W. The effect of grain size on detrital modes: A test of the Gazzi-Dickinson point counting method. J. Sediment. Petrol. 1984, 54, 103–116. [Google Scholar]
- Dickinson, W.R. Interpreting Provenance Relations from Detrital Modes of Sandstones. In Provenance of Arenites; Zuffa, G.C., Ed.; D. Reidel Publishing Company: Dordrecht, The Netherlands, 1985; pp. 333–362. [Google Scholar]
- Graham, S.A.; Ingersoll, R.V.; Dickinson, W.R. Common provenance for lithic grains in Carboniferous sandstones from Ouachita Mountains and Black Warrior Basin. J. Sediment. Petrol. 1976, 46, 620–632. [Google Scholar]
- Rahman, M.M.; Lee, M.; Uddin, A. Geochemistry of Groundwater and Naturally Occurring Biogenic Pyrite in the Holocene Fluvial Aquifers in Uphapee Watershed, Macon County, Alabama. Minerals 2020, 10, 912. [Google Scholar] [CrossRef]
- Bish, D.L.; Post, J.E. Modern Powder Diffraction. Reviews in Mineralogy. Mineral. Soc. Am. 1989, 20, 220–231. Available online: http://www.minsocam.org/msa/rim/rim20.html (accessed on 29 March 2023).
- Fitton, G. X-Ray fluorescence spectrometry. In Modern Analytical Geochemistry: An Introduction to Quantitative Chemical Analysis Techniques for Earth, Environmental and Materials Scientists, 1st ed.; Gill, R., Ed.; Routledge: London, UK, 1997; p. 342. ISBN 9781315844381. [Google Scholar] [CrossRef]
- Cheng, Z.; Zheng, Y.; Mortlock, R.; van Geen, A. Rapid multi-element analysis of groundwater by high-resolution inductively coupled plasma mass spectrometry. Anal. Bioanal. Chem. 2004, 379, 512–518. [Google Scholar] [CrossRef] [PubMed]
- José, A.M.; Ligbel, S.D.G.; Johan, M. Determination of chloride, sulfate and nitrate in groundwater samples by ion chromatography. J. Chromatogr. Anal. 2000, 884, 185–190. [Google Scholar] [CrossRef] [PubMed]
- Tobler, W.R. A Computer Movie Simulating Urban Growth in the Detroit Region. Econ. Geography. 1970, 46, 234–240. [Google Scholar] [CrossRef]
- Liu, C.W.; Jang, C.S.; Liao, C.M. Evaluation of arsenic contamination potential using indicator kriging in the Yun-Lin aquifer (Taiwan). Sci. Total Environ. 2004, 321, 173–188. [Google Scholar] [CrossRef] [PubMed]
- ESRI. Spatial Interpolation with ArcGIS Pro. 2023. Available online: https://www.esri.com/training/catalog/5c92b940fa73df28264fb8ed/spatial-interpolation-with-arcgis-pro/ (accessed on 22 March 2023).
- Fischer, A.; Lee, M.-K.; Ojeda, A.S.; Rogers, S.R. GIS interpolation is key in assessing spatial and temporal bioremediation of groundwater arsenic contamination. J. Environ. Manag. 2021, 280, 111683. [Google Scholar] [CrossRef] [PubMed]
- Piper, A.M. A graphic procedure in the geochemical interpretation of water-analyses. EOS Trans. Am. Geophys. Union 1944, 25, 914–928. [Google Scholar]
- Penny, E.; Lee, M.K.; Morton, C. Groundwater and microbial processes of Alabama coastal plain aquifers. Water Resour. Res. 2003, 39, 1320. [Google Scholar] [CrossRef]
- Appelo, C.A.J.; Postma, D. Geochemistry, Groundwater, and Pollution; CRC Press: London, UK, 2005; p. 683. [Google Scholar] [CrossRef]
- Sarker, M.M.R.; Hermans, T.; Van Camp, M.; Hossain, D.; Islam, M.; Ahmed, N.; Bhuiyan, M.A.Q.; Karim, M.M.; Walraevens, K. Identifying the Major Hydrogeochemical Factors Governing Groundwater Chemistry in the Coastal Aquifers of Southwest Bangladesh Using Statistical Analysis. Hydrology 2022, 9, 20. [Google Scholar] [CrossRef]
- Moorthy, P.; Sundaramoorthy, S.; Roy, P.D.; Usha, T.; Dash, S.K.; Gowrappan, M.; Chokklingam, L. Evaluation of spatial and temporal dynamics of seawater intrusion in coastal aquifers of southeast India: Insights from hydrochemical facies analysis. Environ. Monit Assess. 2024, 196, 179. [Google Scholar] [CrossRef] [PubMed]
- Sivasubramanian, P.; Balasubramanian, N.; Soundranayagam, J.P.; Chandrasekar, N. Hydrochemical characteristics of coastalaquifers of Kadaladi, Ramanathapuram District, Tamilnadu, India. Appl. Water Sci. 2013, 3, 603–612. [Google Scholar] [CrossRef]
- Zobrist, J.; Dowdle, P.R.; Davis, J.A.; Oremland, R.S. Mobilization of Arsenite by Dissimilatory Reduction of Adsorbed Arsenate. Environ. Sci. Technol. 2000, 34, 4747–4753. [Google Scholar] [CrossRef]
- Ashraf, A.S.; Harue, M.; Muneki, M.; Keiji, S.; Toshiro, Y.; Takaaki, I.; Teruyuki, M.; Kenji, U.; Ahmed, K.M.; Dipak, K.B. Arsenic release from biotite into a Holocene groundwater aquifer in Bangladesh. Appl. Geochem. 2008, 23, 2236–2248. [Google Scholar] [CrossRef]
- Mukherjee, A.; Verma, S.; Mahanta, C.; Choudhury, R.; Badonie, R.P.; Joshi, G. Arsenic fate in the Brahmaputra river basin aquifers: Controls of geogenic processes, provenance and water-rock interactions. Appl. Geochem. 2019, 107, 171–186. [Google Scholar] [CrossRef]
- Shamsudduha, M. Mineralogical and Geochemical Profiling of Arsenic-Contaminated Alluvial Aquifers in the Ganges Brahmaputra Floodplain Manikganj, Bangladesh. Master’s Thesis, Auburn University, Auburn, AL, USA, 2007; p. 203. [Google Scholar]
- Pal, T.; Mukherjee, P.K.; Sengupta, S. Nature of arsenic pollutants in groundwater of Bengal Basin—A case study from Baruipur area, West Bengal, India. Curr. Sci. 2002, 82, 554–561. [Google Scholar]
- Wells, H.C.; Haverkamp, R.G. Characterization of the Heavy Mineral Suite in a Holocene Beach Placer, Barrytown, New Zealand. Minerals 2020, 10, 86. [Google Scholar] [CrossRef]
- Sengupta, S.; Mukherjee, P.K.; Pal, T.; Shone, S. Nature and origin of arsenic carriers in shallow aquifer sediments of Bengal delta, India. Environ. Geol. 2004, 45, 1071–1081. [Google Scholar] [CrossRef]
- U.S. Environmental Protection Agency (EPA). Drinking Water Requirements for States and Public Water Systems, Chemical Contaminant Rules. 2023. Available online: https://www.epa.gov/ground-water-and-drinking-water/national-primary-drinking-water-regulations (accessed on 29 March 2023).
- Flood, R.P.; Barr, I.D.; Weltje, G.J.; Roberson, S.; Russell, M.I.; Meneely, J.; Orford, J.D. Provenance and depositional variability of the Thin Mud Facies in the lower Ganges-Brahmaputra delta, West Bengal Sundarbans, India. Mar. Geol. 2018, 395, 198–218. [Google Scholar] [CrossRef]
- Uddin, A.; Kumar, P.; Sarma, J.N.; Akhter, S.H. Heavy-mineral constraints on provenance of Cenozoic sediments from the foreland basins of Assam, India and Bangladesh: Erosional history of the eastern Himalayas and the Indo-Burman ranges. In Heavy Minerals in Use, Developments in Sedimentology; Mange, M.A., Wright, D.T., Eds.; Elsevier: Amsterdam, The Netherlands, 2007; Volume 58, pp. 823–847. [Google Scholar] [CrossRef]
- Hilmar, V.E.; Reinhard, G. Provenance of Cretaceous synorogenic sandstones in the Eastern Alps: Constraints from framework petrography, heavy mineral analysis and mineral chemistry. Sediment. Geol. 1999, 124, 81–111. [Google Scholar] [CrossRef]
- Mukherjee, A.; Alan, E.F.; William, A.T. Geologic, geomorphic, and hydrologic framework and evolution of the Bengal basin, India and Bangladesh. J. Asian Earth Sci. 2009, 34, 227–244. [Google Scholar] [CrossRef]
- Folk, R.L. Petrology of Sedimentary Rocks, 2nd ed.; Hemphill Press: Austin, TX, USA, 1974; p. 182. [Google Scholar]
Disclaimer/Publisher’s Note: The statements, opinions and data contained in all publications are solely those of the individual author(s) and contributor(s) and not of MDPI and/or the editor(s). MDPI and/or the editor(s) disclaim responsibility for any injury to people or property resulting from any ideas, methods, instructions or products referred to in the content. |
© 2024 by the authors. Licensee MDPI, Basel, Switzerland. This article is an open access article distributed under the terms and conditions of the Creative Commons Attribution (CC BY) license (https://creativecommons.org/licenses/by/4.0/).