Article

Research on Salt Drainage Efficiency and Anti-Siltation Effect of Subsurface Drainage Pipes with Different Filter Materials

1
Institute of Agricultural Resources and Environment, Ningxia Academy of Agriculture and Forestry Sciences, Yinchuan 750002, China
2
Station of Observation and Experiment National Agricultural Environment in Yinchuan, Yinchuan 750002, China
*
Author to whom correspondence should be addressed.
Water 2024, 16(10), 1432; https://doi.org/10.3390/w16101432
Submission received: 18 April 2024 / Revised: 13 May 2024 / Accepted: 16 May 2024 / Published: 17 May 2024
(This article belongs to the Special Issue Effects of Hydrology on Soil Erosion and Soil Conservation)

Abstract

:
Subsurface pipes covered with geotextiles and filters are essential for preventing clogging and ensuring efficient drainage. To address low salt discharge efficiency due to subsurface drainage pipes (SDPs) clogging easily, sand gravel, straw, and combined sand gravel–straw were set above SDPs, respectively, within a setting of uniform geotextiles. The influences of different filter materials on the drainage efficiency and salt discharge effect of the SDPs, as well as the effects of different filter materials on the salt drainage efficiency and anti-siltation effect of the SDPs were studied by performing simulation experiments in a laboratory. The results confirmed the following: (1) The salt removal rates of the SDPs externally wrapped with materials exceeded 95%. The subsurface pipe treated with the sand gravel filter material had the highest desalting rate (93.69%) and soil profiles with total salt contents that were 17.7% and 20.5% lower than those treated with the straw and combined sand gravel–straw materials, respectively. (2) The soil salinity of the sand gravel filter material around the SDPs was between 1.57 and 3.6 g/kg, and the drainage rate (R) was 0.97, so its salt-leaching effect was the best. (3) The sand gravel filter material increased the characteristic particle size of the soil above the SDP by 8.4%. It could effectively intercept coarse particles, release fine particles, and facilitate the formation of a highly permeable soil skeleton consisting of coarse particles, such as sand particles surrounding the soil. (4) The use of the straw filter material produced dense filter cake layers on the upstream surfaces of the geotextiles. When the sand gravel and combined sand gravel–straw filter materials were used, soil particles remained in the geotextile fiber structure, and a large number of pores were still retained. Therefore, the sand gravel filter material was the most suitable for the treatment of Yinbei saline–alkali soil in Ningxia Hui Autonomous Region.

1. Introduction

Soil salinization is one of the factors that causes soil degradation, reduces food production, and affects the ecological health of agriculture and forestry [1]. It has been reported that more than 100 countries and regions worldwide are affected by soil salinization with an area of 950 million hectares (ha) [2,3]. By the middle of the twenty-first century, more than half of arable lands will experience different degrees of salinization [4]. Saline soils in China cover an area of about 100 million ha and are mainly distributed in arid inland regions of Northern, Northeastern, Northwestern, and coastal China [5]. Ningxia Hui Autonomous Region is located in the arid inland region of Northwest China. The Yellow River irrigation region in the north is clearly characterized by high evaporation and low precipitation levels, a flat and low-lying terrain, high groundwater levels, and salt migration, resulting in severe soil salinization. In the Yellow River irrigation region of Ningxia Hui Autonomous Region, the area of saline–alkali cultivated land is about 1.4 × 10⁶ ha, accounting for 32.5% of the total arable land area [6]. The rational utilization of saline–alkali land can be considered as an alternative for land resources for the sustainable development of agriculture and forestry, which is of great importance for holding the red line of 1.2 billion ha of arable land. The amelioration and utilization of saline–alkali land can reduce groundwater levels and prevent secondary salinization. Planting plants can improve the soil structure, increase the level of coverage, and improve the field microclimate [7]. Especially with the intensification of the greenhouse effect, arid areas are facing both salinization and water shortages, which undoubtedly have an adverse impact on the economy, society, and ecological environment. Therefore, utilization of saline–alkali land plays a key role in the improvement of the ecological environment in the middle and upper reaches of the Yellow River as well as the promotion of ecological protection and high-quality development in the Yellow River Basin.
An efficient irrigation and drainage system can eliminate solutes and serve as a barrier to prevent salinity and alkalinity [8,9]. As part of underground drainage facilities, SDPs are highly efficient and contribute to water as well as land conservation, giving rise to mechanized operations [10,11,12]. SDPs can decrease soil salinity while controlling groundwater levels and overcome the drawbacks of traditional amendment methods that cannot discharge salts from soil [13,14]. A subsurface pipe drainage technique was introduced in Ningxia Hui Autonomous Region in 1980. After years of its application, the total area of SDPs in the field has reached 1.7 × 10⁵ ha, and subsurface pipes have become the preferred solution for solving salinization hazards in Yinbei Irrigation District [15]. Subsurface drainage systems promote salt discharge by affecting the saturated hydraulic conductivity and effective porosity of the soil [16]. Climatic and soil conditions are the main factors determining the spacing and depth of SDPs [17]. Several researchers have proposed measurements for the depth, spacing, and diameter of SDPs based on different desalination standards [18,19]. However, the clogging of SDPs by soil particles, plant roots, and solutes in saline–alkali land can restrict their efficient salt discharge. Coarse sand or clay loam can form natural anti-filter layers, which are less likely to clog the filter material around SDPs. Soils with low clay contents and high finer particle contents are more likely to clog SDPs [20]. The soil in the Yinbei region of Ningxia Hui Autonomous Region mostly consists of sticky clay loam or loam clay, which are more likely to cause clogging.
Currently, the main components of the subsurface drainage system are external geotextiles and filter materials such as sands, gravels, and straw to prevent or alleviate siltation. Filter materials can effectively prevent or reduce siltation caused by soil that enters the SDPs with the water flow. The SDPs must be equipped with external filter materials to form a high permeable layer around them to reduce the water flow resistance and head loss [21]. Sand gravel filter materials are laid around the SDPs. Since the filter materials wrapped around the SDPs are porous media of the same texture, a continuous soil–water potential gradient field is formed around the SDPs. The water in the soil has a significant hysteresis effect, while the water and salt in the soil accumulate at the bottom of the SDPs, weakening the drainage effect. Sand–gravel filter materials are laid on top of the SDP. The water conductivity difference between the fine sand mat and clay loam is employed to slow down the soil water flow rate around the bottom of the SDP, so that a local saturated zone is generated in the upper part of the SDP, promoting salt drainage through the SDP [22]. Reasonable filter materials allow the soil above the SDP to form a bridge, filter cake, and natural soil areas from bottom to top with a good filter structure. The main considerations when setting up the filter material for the SDP include the following: the O90/d90 value (O90 is the pore diameter of the filter materials, of which 90% are smaller than this value; d90 is the size of the soil particles, of which 90% are smaller than this value; and O90/d90 ≥ 1.0 should be satisfied), suitable permeability coefficient, and thickness of the filter material [20]. Research on the anti-siltation of SDP filter material mainly adopts laboratory simulation experiments [23], involving seepage boxes, soil columns, soil boxes, and so on. Research has also been conducted by sampling outdoor field surveys [24]. The application of filter materials is greatly influenced by soil characteristics, and their reverse filtration effect is closely related to the composition of soil particles and the pore size of filter materials [25]. The clogging type of geotextiles wrapped with sand and straw filter materials as well as the formation of soil-permeable skeletons around filter materials are bottlenecks that need to be investigated and resolved.
Filter materials are the key factor affecting the drainage efficiency of SDPs. Field experiments have been performed to explore the anti-clogging effects of various SDP filter materials. Laboratory simulation experiments have confirmed an improvement in drainage and desalination by external adsorption materials [24,26]. However, it is worthwhile to conduct further research on the effects of different filter materials, such as sand and straw, on the salt drainage efficiency and anti-silting effect of SDPs by using typical saline–alkali soil in the Yinbei region of Ningxia Hui Autonomous Region and a laboratory simulation device.
Therefore, we designed a laboratory simulation device to systematically evaluate the effects of sand gravel and straw filter materials on the salt discharge efficiency and anti-silting effect of SDPs. The soil particle size composition above the filter materials was analyzed. The surface and internal structures of the geotextiles were evaluated using an electron microscope to reveal the clogging types of SDPs externally wrapped with different filter materials, so as to guide the scientific development of SDP filter materials. Our findings provide a scientific basis for the long-term drainage and desalination of SDPs as well as an improvement in the quality of low-lying saline soil.

2. Materials and Methods

2.1. Tested Soils

Experiments were performed from May to October 2023. The soil samples used for experiments were taken from Haiyan Village, Yanzidun Township, Huinong District, Shizuishan City, Ningxia Hui Autonomous Region (39°03′ N, 106°54′ E, Figure 1). This region belongs to the Yinbei Irrigation Area of Ningxia Hui Autonomous Region, with low-lying terrain and high groundwater levels. Under the influence of the arid climate, the soil salt in this region has risen significantly, and soil salinization is severe. The region is an arid semi-desert saline land in the middle and upper reaches of the Yellow River with a temperate continental climate. Annual average precipitation and evaporation rates are 173 mm and 1755 mm, respectively. Precipitation in this region is sparse, unevenly distributed, and mainly concentrated from July and September. The depth of groundwater ranges from 1.3 to 2.0 m. Soil samples were collected from 0 to 60 cm below ground surface, with high salt content up to 50 g∙kg−1 and pH below 8.93 (Table 1). The 0–60 cm soil layer contained 10.2% clay particles, 36.4% silt sand particles, and 53.4% sand particles, while the soil texture was loam soil [27]. The d90 values of soil layers at depths of 0–20, 20–40, and 40–60 cm were 86.8, 94.7, and 99.4 μm, respectively. The ratio of soil clay content to silt content was 0.28, which was lower than 0.5 [20]. The soil type was loamy soil with a low level of cohesion. It is not easy to form a natural filter layer around subsurface drainage pipes, leading to a high possibility of clogging. SDPs that are not wrapped with geotextiles and filter materials are susceptible to mechanical clogging, which affects the normal operation of drainage systems.

2.2. Simulation Device for Subsurface Pipe Drainage

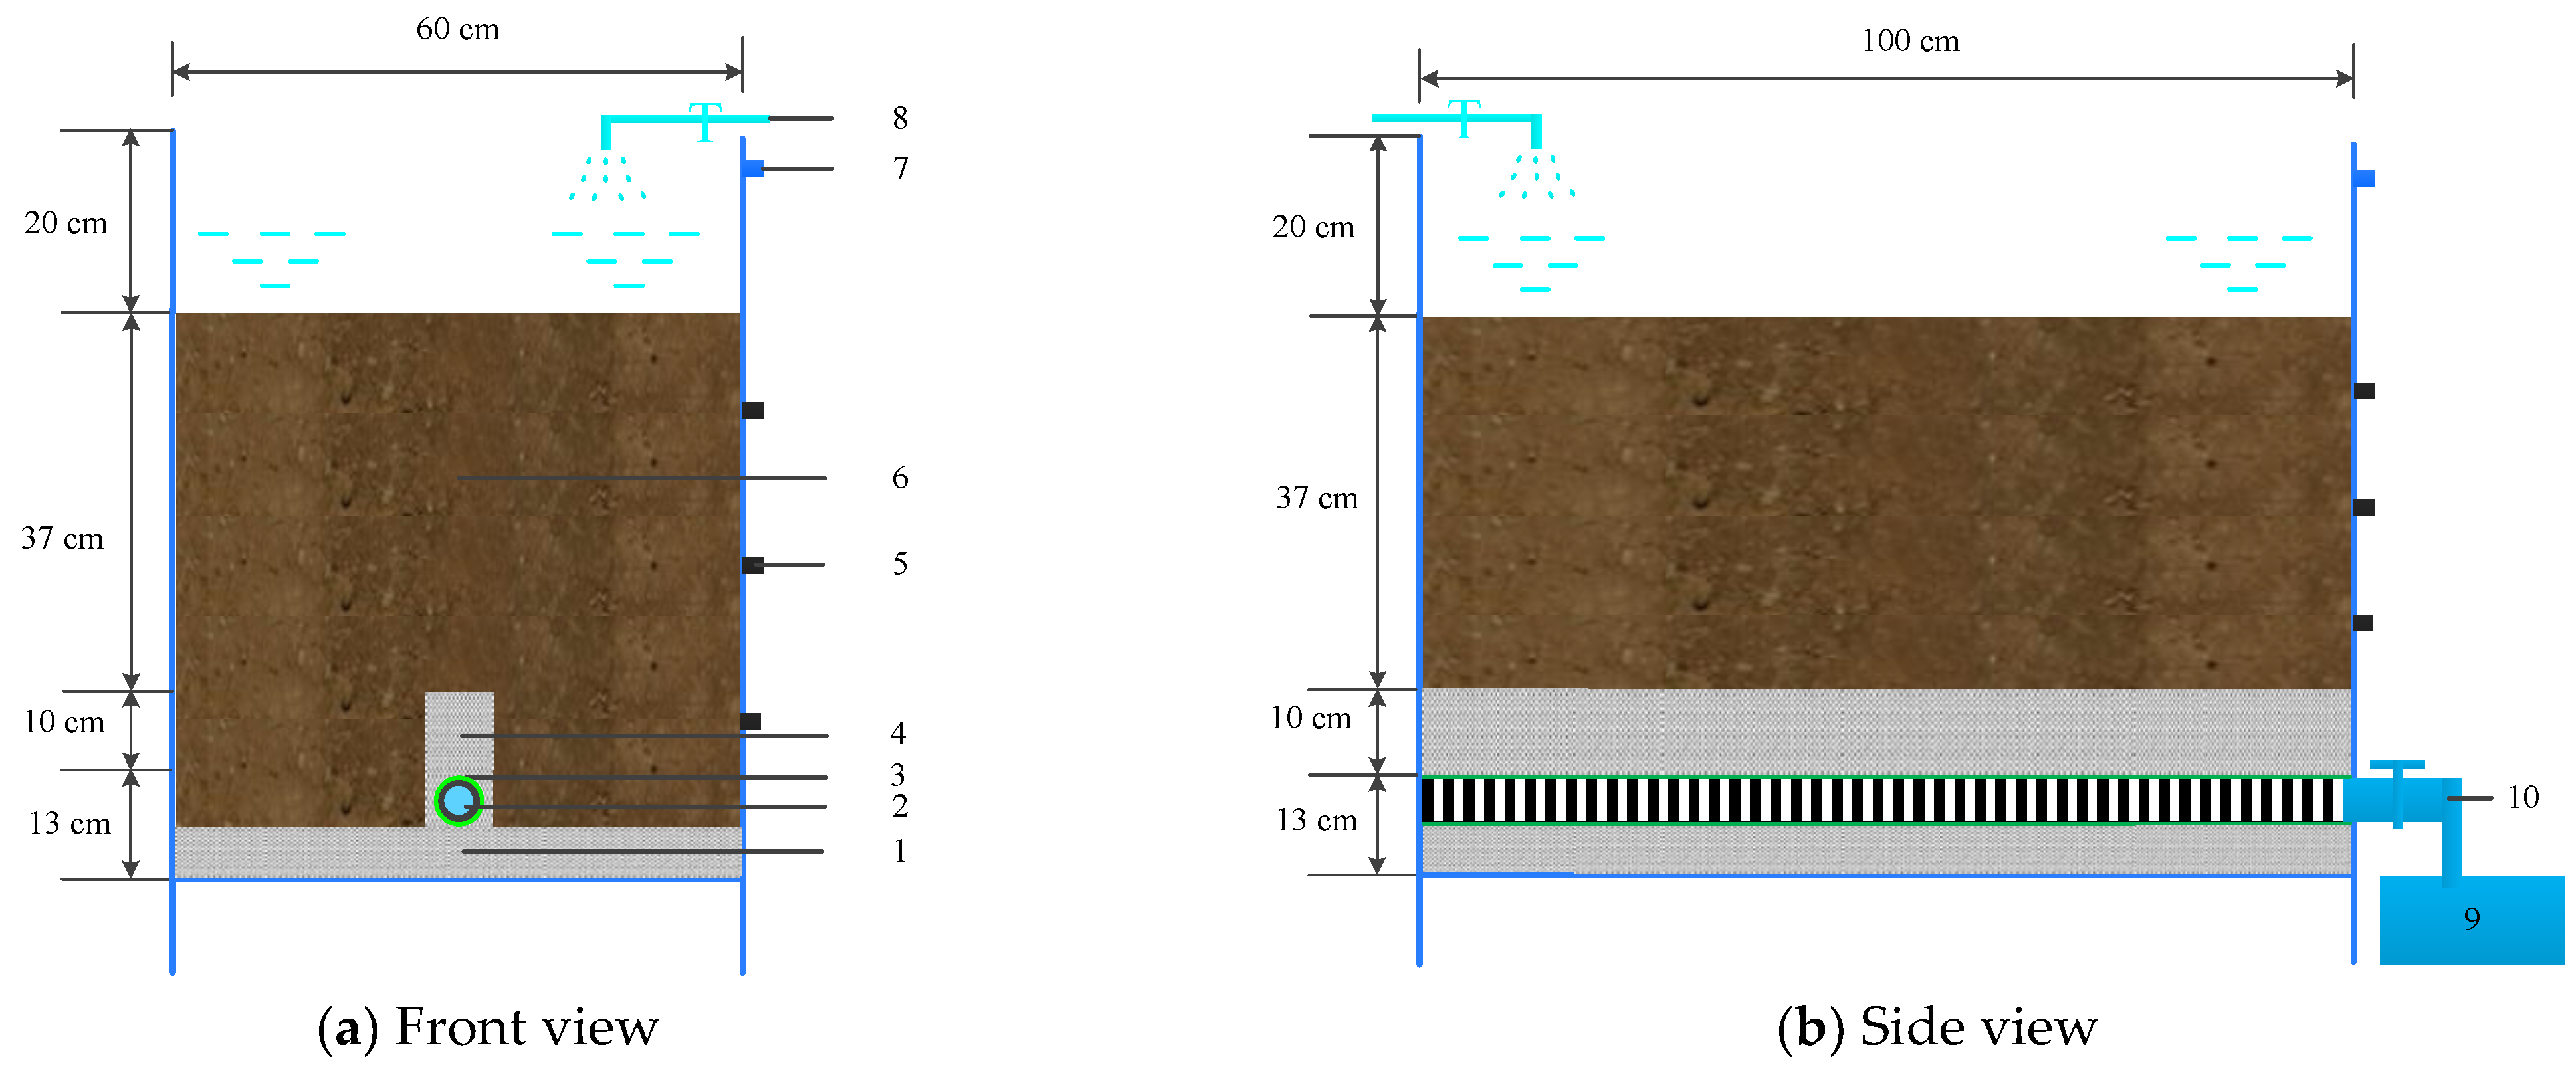
The depth of the object at the studied site was 150 cm, the thickness of filter material was 30 cm, the thickness of backfill soil layer was 112.5 cm, and the outer diameter of SDP was 7.5 cm. With reference to laboratory simulations of subsurface pipe drainage, simulation experiments designed by Tao et al. (2016) with a 1:3 scale ratio were adopted for our experiments [28]. The designed laboratory simulation test device for subsurface pipe drainage was composed of a water supply system, a seepage box, and a collector box. Seepage box was 1.0 m long, 0.6 m wide, and 0.8 m high (Figure 2). To prevent preferential flow along the wall during leaching process, the inner surface of testing device was polished with sandpaper. In the experimental device, the depth of SDP was 50 cm, and the thickness of filter material was 10 cm. The thickness of backfill soil was 37.5 cm, and diameter of SDP was 2.5 cm. The thickness of the organic glass around the seepage box was 8 mm. An overflow port was installed 5 cm away from the top of the seepage box to prevent excessive water accumulation during leaching process, and three sampling ports were installed on box wall.

2.3. Experiment Design and Process

To determine the effects of sand gravel, straw, and combined sand gravel–straw filter materials on salt drainage and anti-silting effects of SDPs, the laboratory simulation experiments were conducted in Yanzidun Township from May to October 2023 based on a self-designed laboratory simulation device for subsurface pipe drainage. Using unified covering of geotextiles for subsurface drainage pipes, three scenarios with sand gravel (T1), straw (T2), and combined sand gravel–straw (T3) as wrapped filter materials were designed, with three tests repeated for each scenario. Average values of the data from three tests were used to analyze the test results.
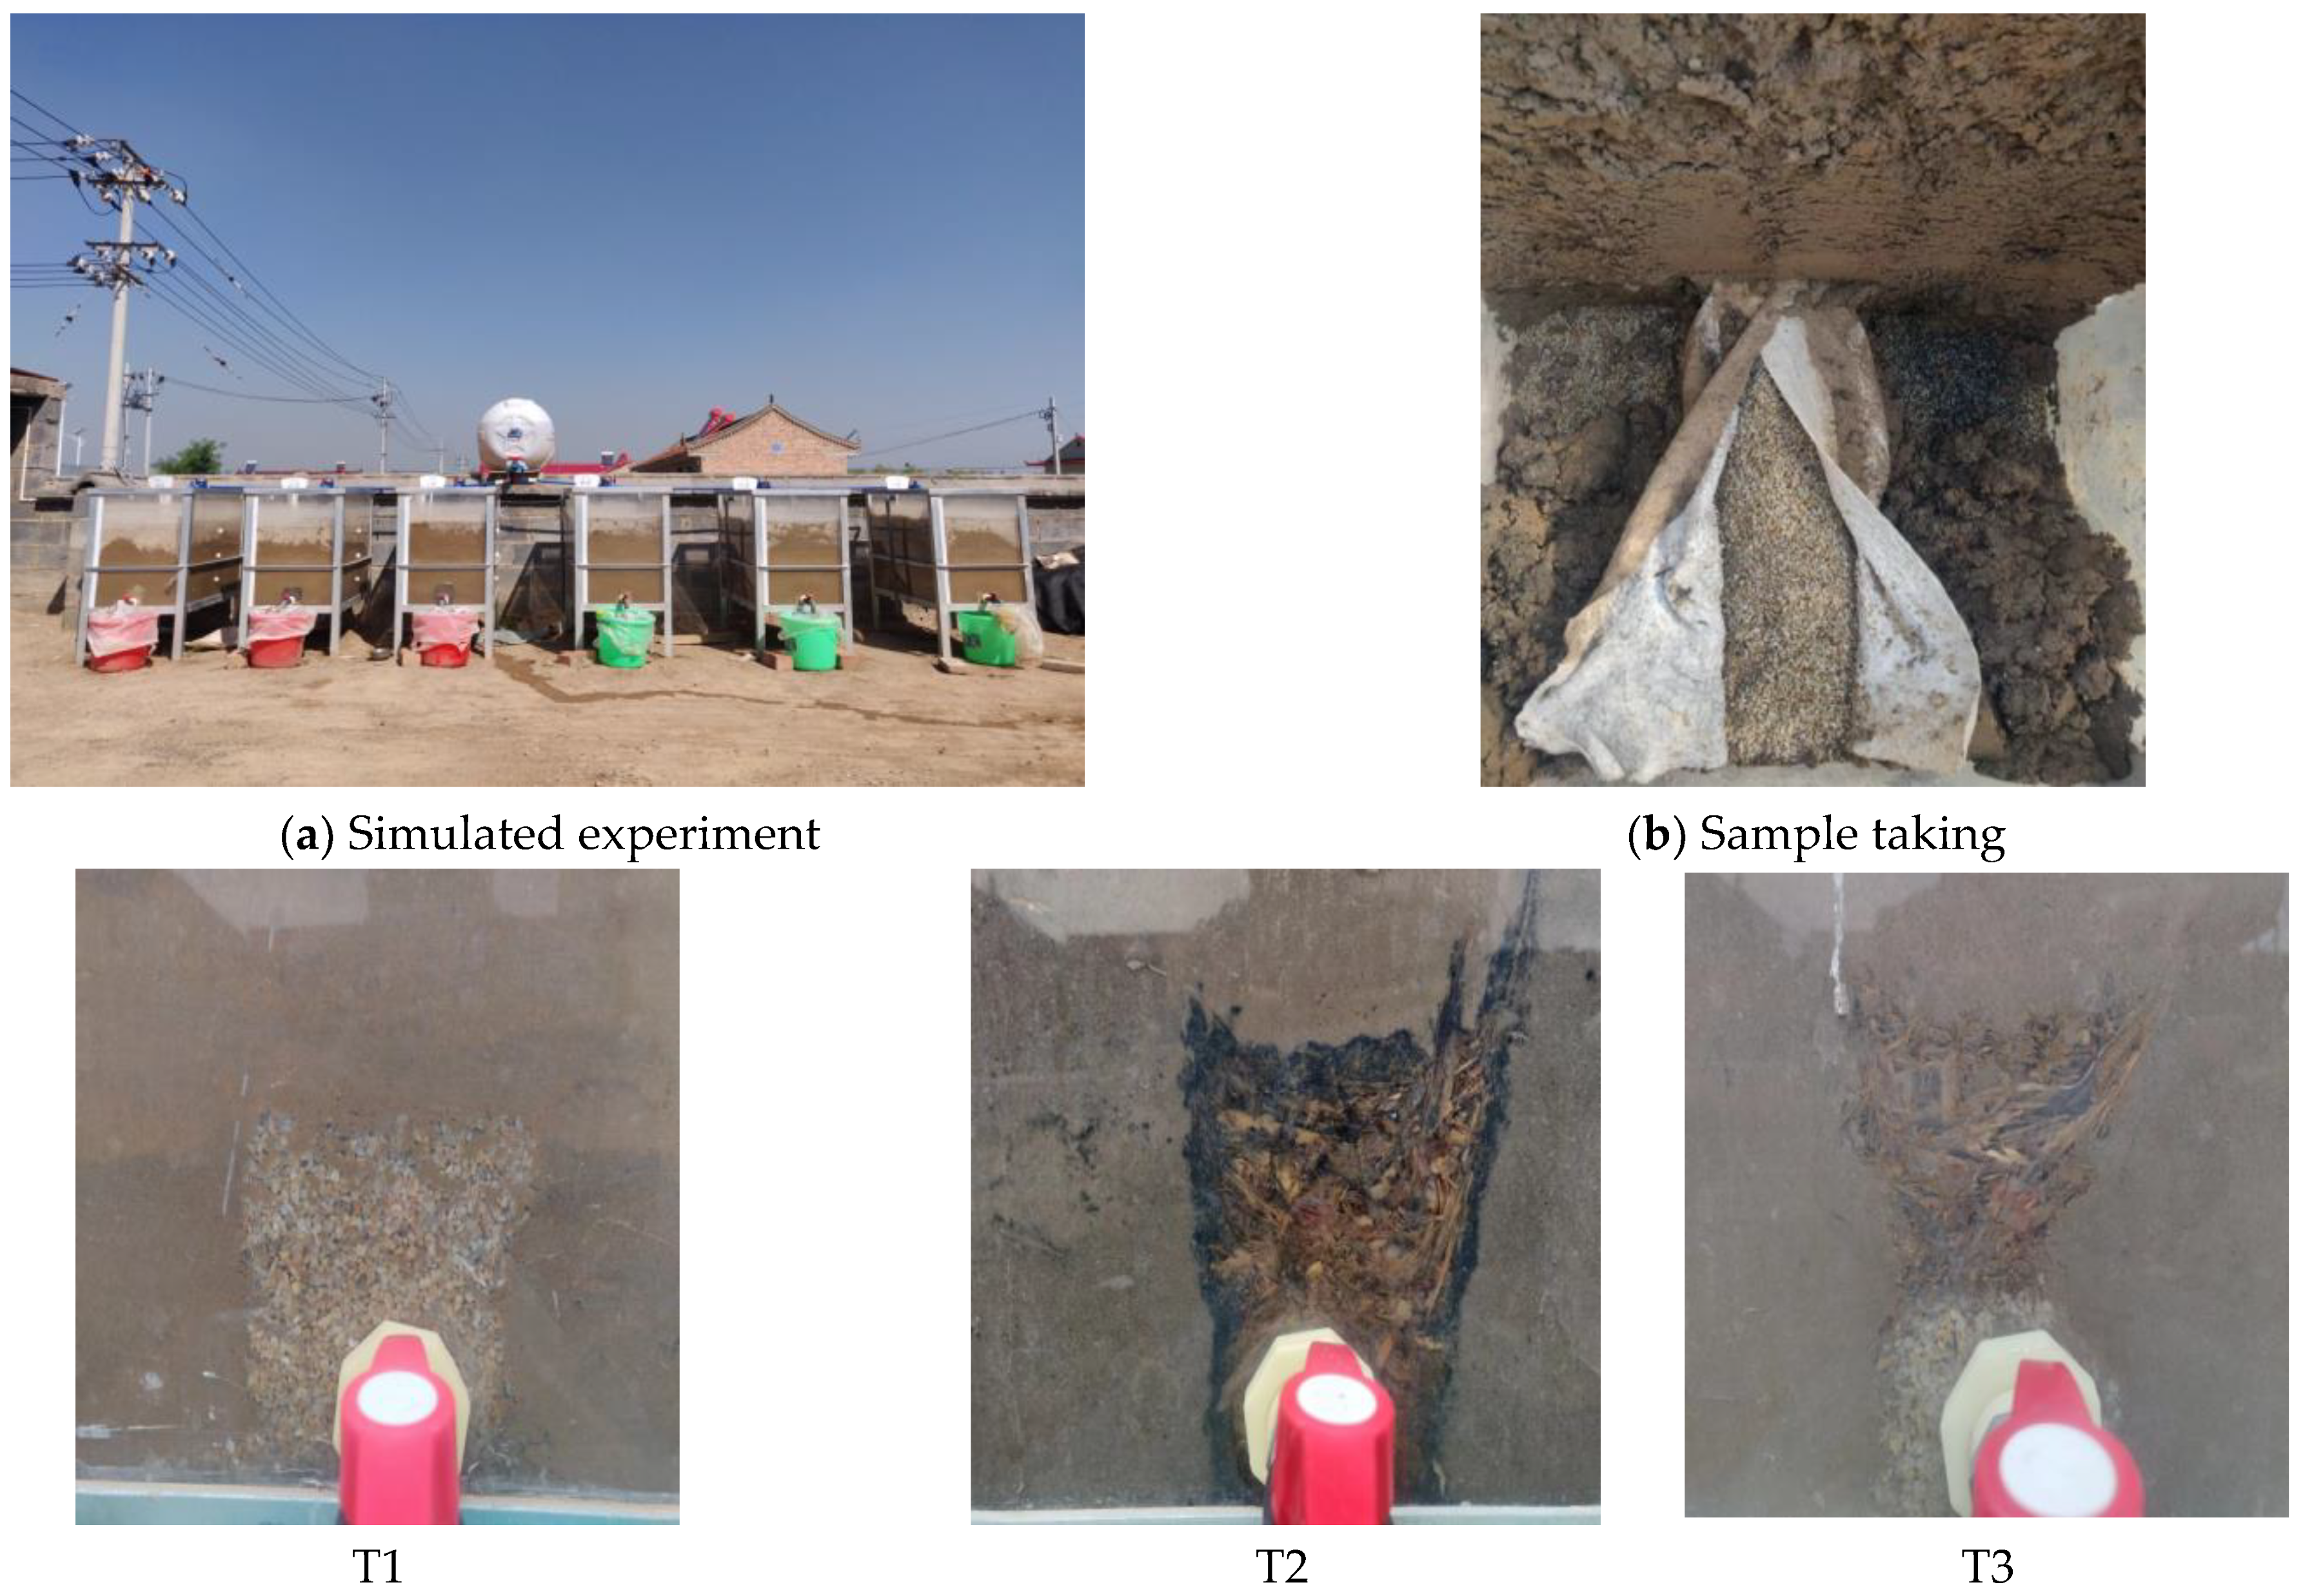
Plant residues and debris such as gravel were removed from soil samples. The prepared samples were then air-dried, grinded, and passed through a 2 mm sieve. A 5 cm thick sand layer was placed on the bottom, and a subsurface pipe wrapped with geotextiles was placed on quartz sand filter layer. The hole area percentage of subsurface pipe was 5%. The soil was loaded into the test soil box and was compacted layer by layer to a thickness of 60 cm. Thereafter, it was left overnight to establish a water content equilibrium. Leaching quota was calculated according to the equation derived by Hu et al. (2010) [29]. The calculated leaching quota was 6750 m3∙hm−2, which was equivalent to 0.4 m3 per seepage box. Leaching process began at 9:00 AM on 7 June 2023. The leaching process was repeated multiple times using water injection method. The depth of water level during leaching process was maintained at 10 cm, and municipal tap water was used. Leaching water salinity was 0.44 g∙L−1. Photos of simulation experiment are presented in Figure 3.

2.4. Sample Collection and Measurement

The anti-clogging effect of geotextiles for SDPs was demonstrated by the weight of the soil lost in seepage box as well as the amount and rate of clogging. Three SDPs treated with geotextiles were weighed before experiments. During the experiments, drained water and mineralization of SDPs were regularly monitored every day, while the mineralization of leaching water was regularly measured. Upon the completion of experiments (i.e., when subsurface pipe drainage ceased), soil profile was manually excavated, and samples were collected at distances 5, 15, and 25 cm away from the center of the SDP to measure water content, salt content, and soil particle size. Each soil sample was collected three times. The soil discharged through the SDP was collected and dried for weighing, the geotextile wrapped around the SDP was removed and weighed, and geotextile samples were taken from face water surface for observation by scanning electron microscopy.

2.5. Measurement and Methods

The water content of soil was determined by drying method. The supernatant was fully shaken at a soil-to-water ratio of 1:2.5, and the pH was measured using a Mettler Toledo S220 (METTLER TOLEDO, Greifensee, Switzerland) multi-parameter tester. The obtained supernatant was fully shaken at a soil-to-water ratio of 1:5 and was measured using a DDS-307A (INESA, Shanghai, China) soil conductivity meter, which was converted to the total salt content [30]. The mechanical composition of the soil was determined by a laser particle size analyzer (Microtrac S3000, Microtrac, York, PA, USA). Water filling amount was measured by a flow meter, and mineralization was measured using a conductivity meter. Drainage duration was measured using a stopwatch, and drainage volume of the SDP was obtained using measuring cylinders. Geotextile structures were observed using scanning electron microscopy (Hitachi TM4000plus, Hitachi, Tokyo, Japan). Loss of soil mass was calculated as the weight of soil lost through geotextiles after the completion of experiments. Clogging amount was considered as the soil mass adsorbed on the upstream surface of the geotextile and retained inside it after the completion of experiments. Clogging rate was defined as the ratio of the clogging amount to the original weight of the geotextile.

2.6. Calculation Equations

The equations for calculating drainage rate (Rw), salt discharge rate (Rs), desalination rate (LR), discharge-to-removal ratio (R), and clogging rate (w) of SDPs are expressed as follows [31]:
R w = Q w L 100 %
where Rw is the drainage rate of SDP, in %; Qw is total drainage amount from SDP, in cm3; and L is total leaching water amount, in cm3.
R s = Q s S 0 + L s 100 %
where Rs is the salt discharge rate of the subsurface pipe, in %; Qs is the total amount of salt discharged from the subsurface pipe, in kg; S0 is the initial total salt content of soil, in kg; and Ls is the salt content of leaching water, in kg.
L R = S 0 S t S 0 100 %
where LR is the soil leaching desalination rate, in %; S0 is the total salt content of soil before leaching, in kg; and St is the total salt content of soil after leaching, in kg.
R = R s L R
where R is the discharge rate of SDP; R s is the salt discharge rate of SDP; and L R is the soil leaching desalination rate.
w = W t W 0 W 0 100 %
where w is the siltation rate, in %; Wt is the weight of the geotextile after experiment, in g; and W0 is the initial weight of the geotextile, in g.

2.7. Data Processing and Analysis

Microsoft Excel 2010 was employed for data processing while Surfer 10 was used to plot nephograms. SPSS 19.0 software was applied to perform significance tests and correlation analyses.

3. Results

3.1. Soil Moisture Distribution under Different Scenarios

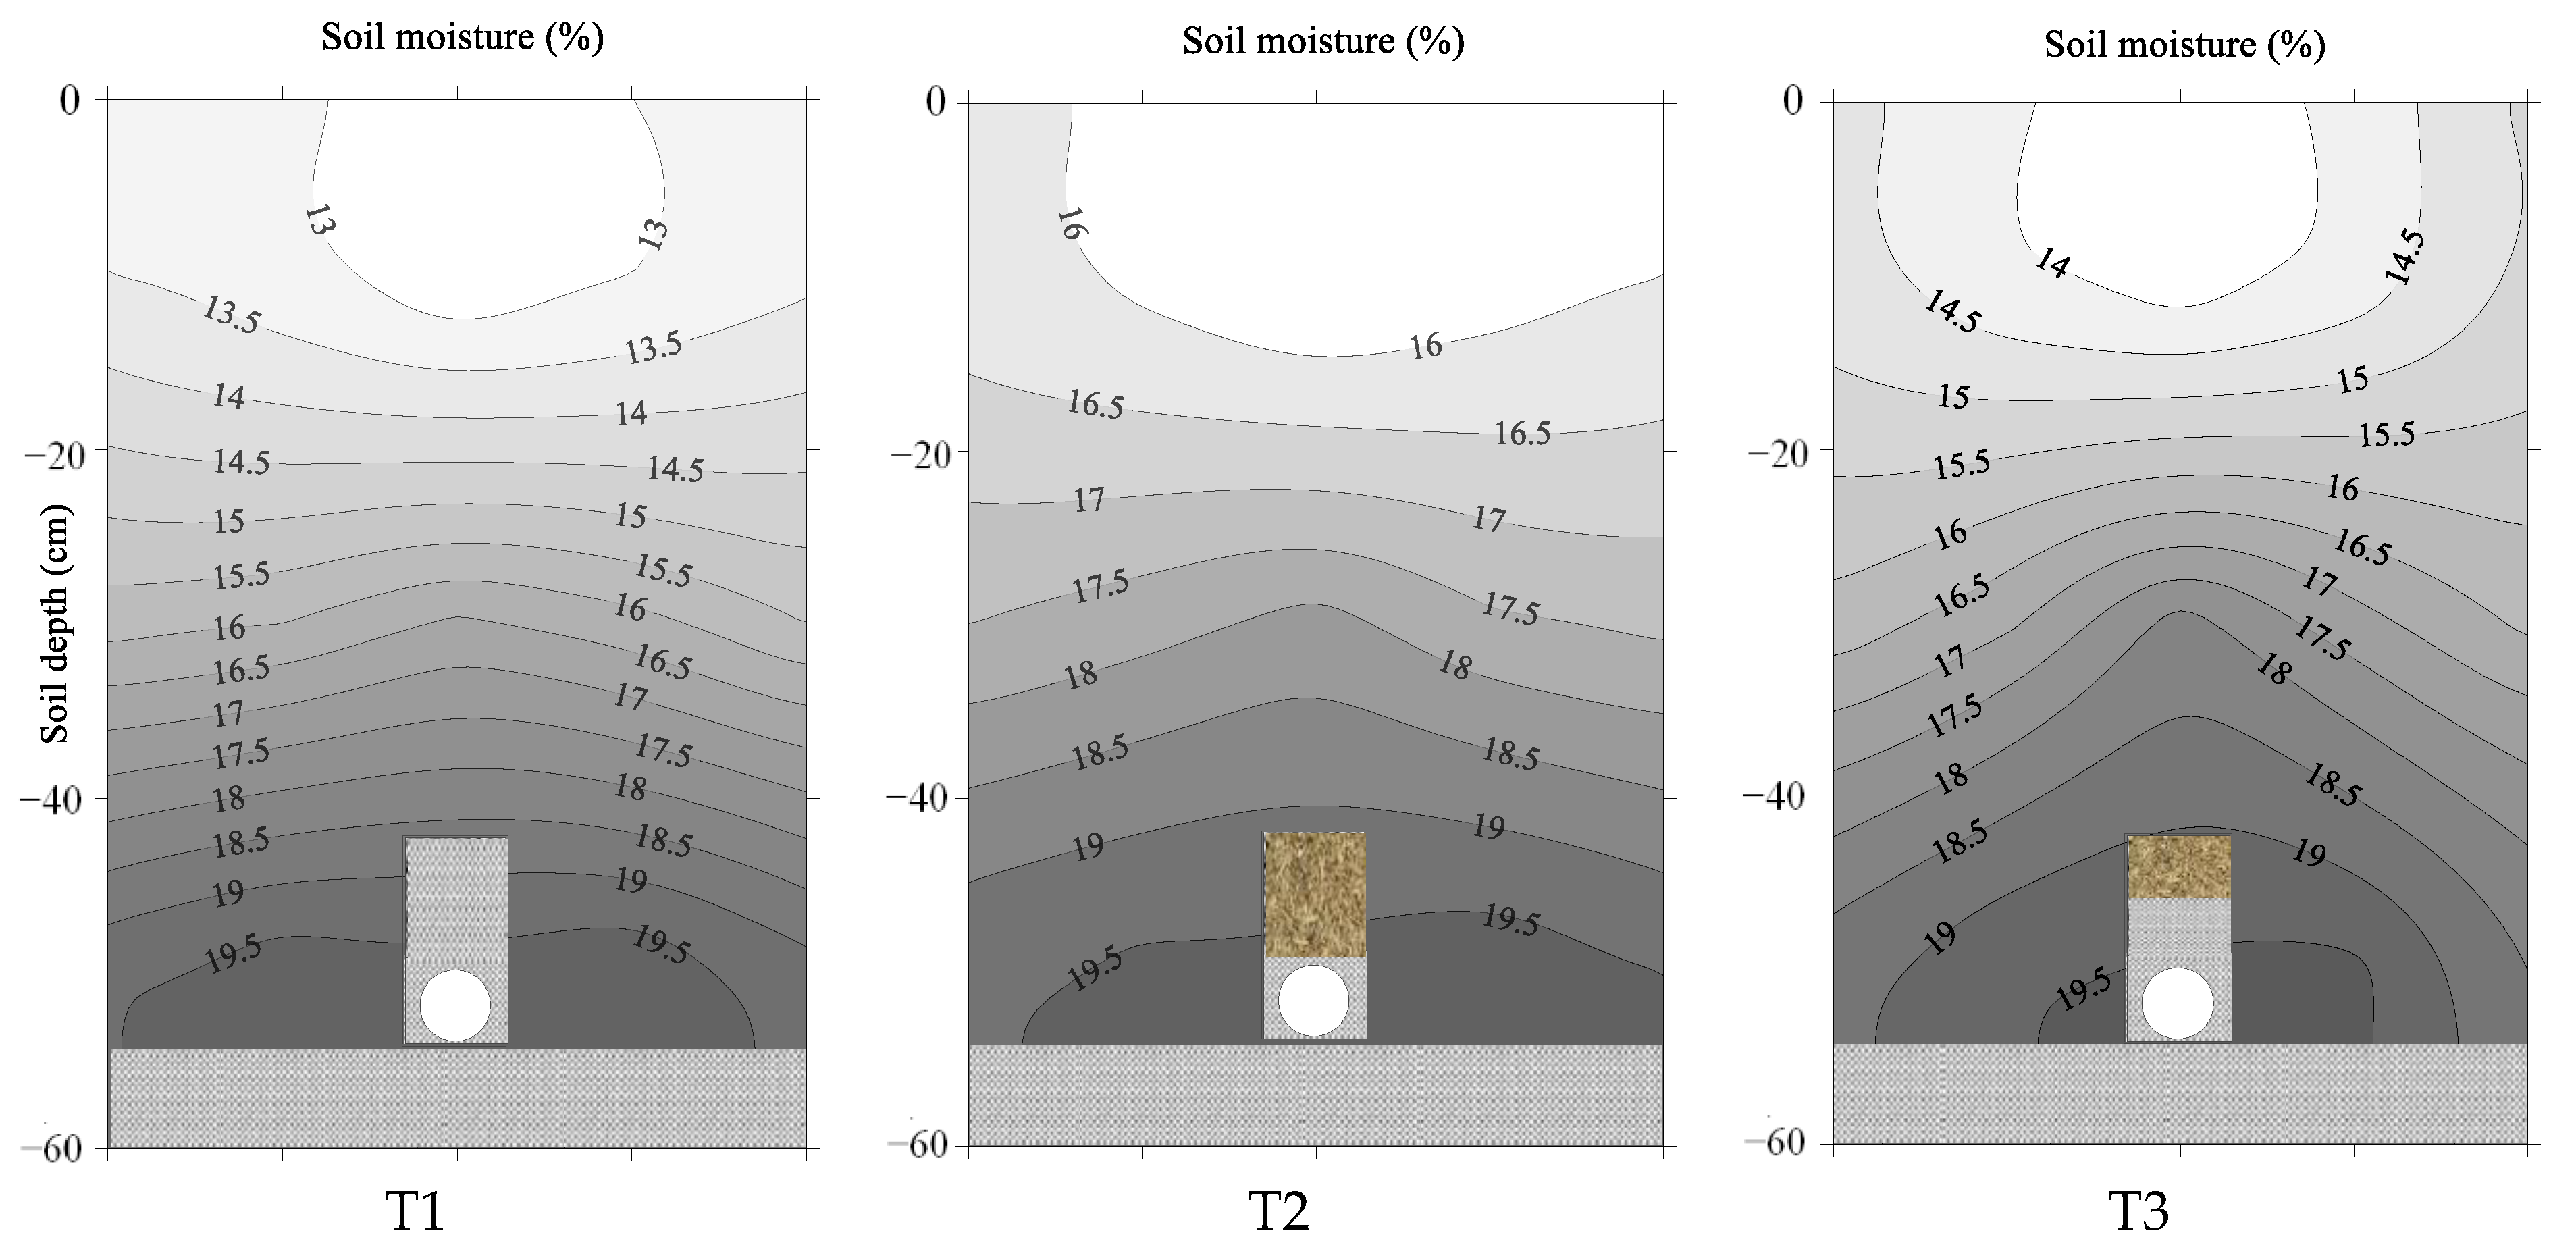
Our measurements showed that the water contents of the soil at a depth of 0–60 cm ranged from 12.6 ± 0.23% to 19.9 ± 0.32% for scenario T1, from 15.5 ± 0.15% to 19.8 ± 0.28% for scenario T2, and from 13.7 ± 0.24% to 19.6 ± 0.36% for scenario T3 (Figure 4). The water content of the soil layer at a depth of 0–20 cm under scenario T1 was the lowest, while that under scenario T2 was the highest. The water content of the soil layer at a depth of 0–60 cm under scenario T2 was higher than those under scenarios T1 and T3, and the difference in the water contents of the soil layers at depths of 20–40 cm and 40–60 cm between scenarios T1 and T3 was small. The water contents of the soil under the three scenarios increased with the increase in soil depth, and the water content of the area near the SDPs was remarkably higher than that of the upper soil. The SDPs were coated with sand, straw, and other filter materials, which may have resulted in the movement of water towards them.

3.2. Soil Salt Distributions under Different Scenarios

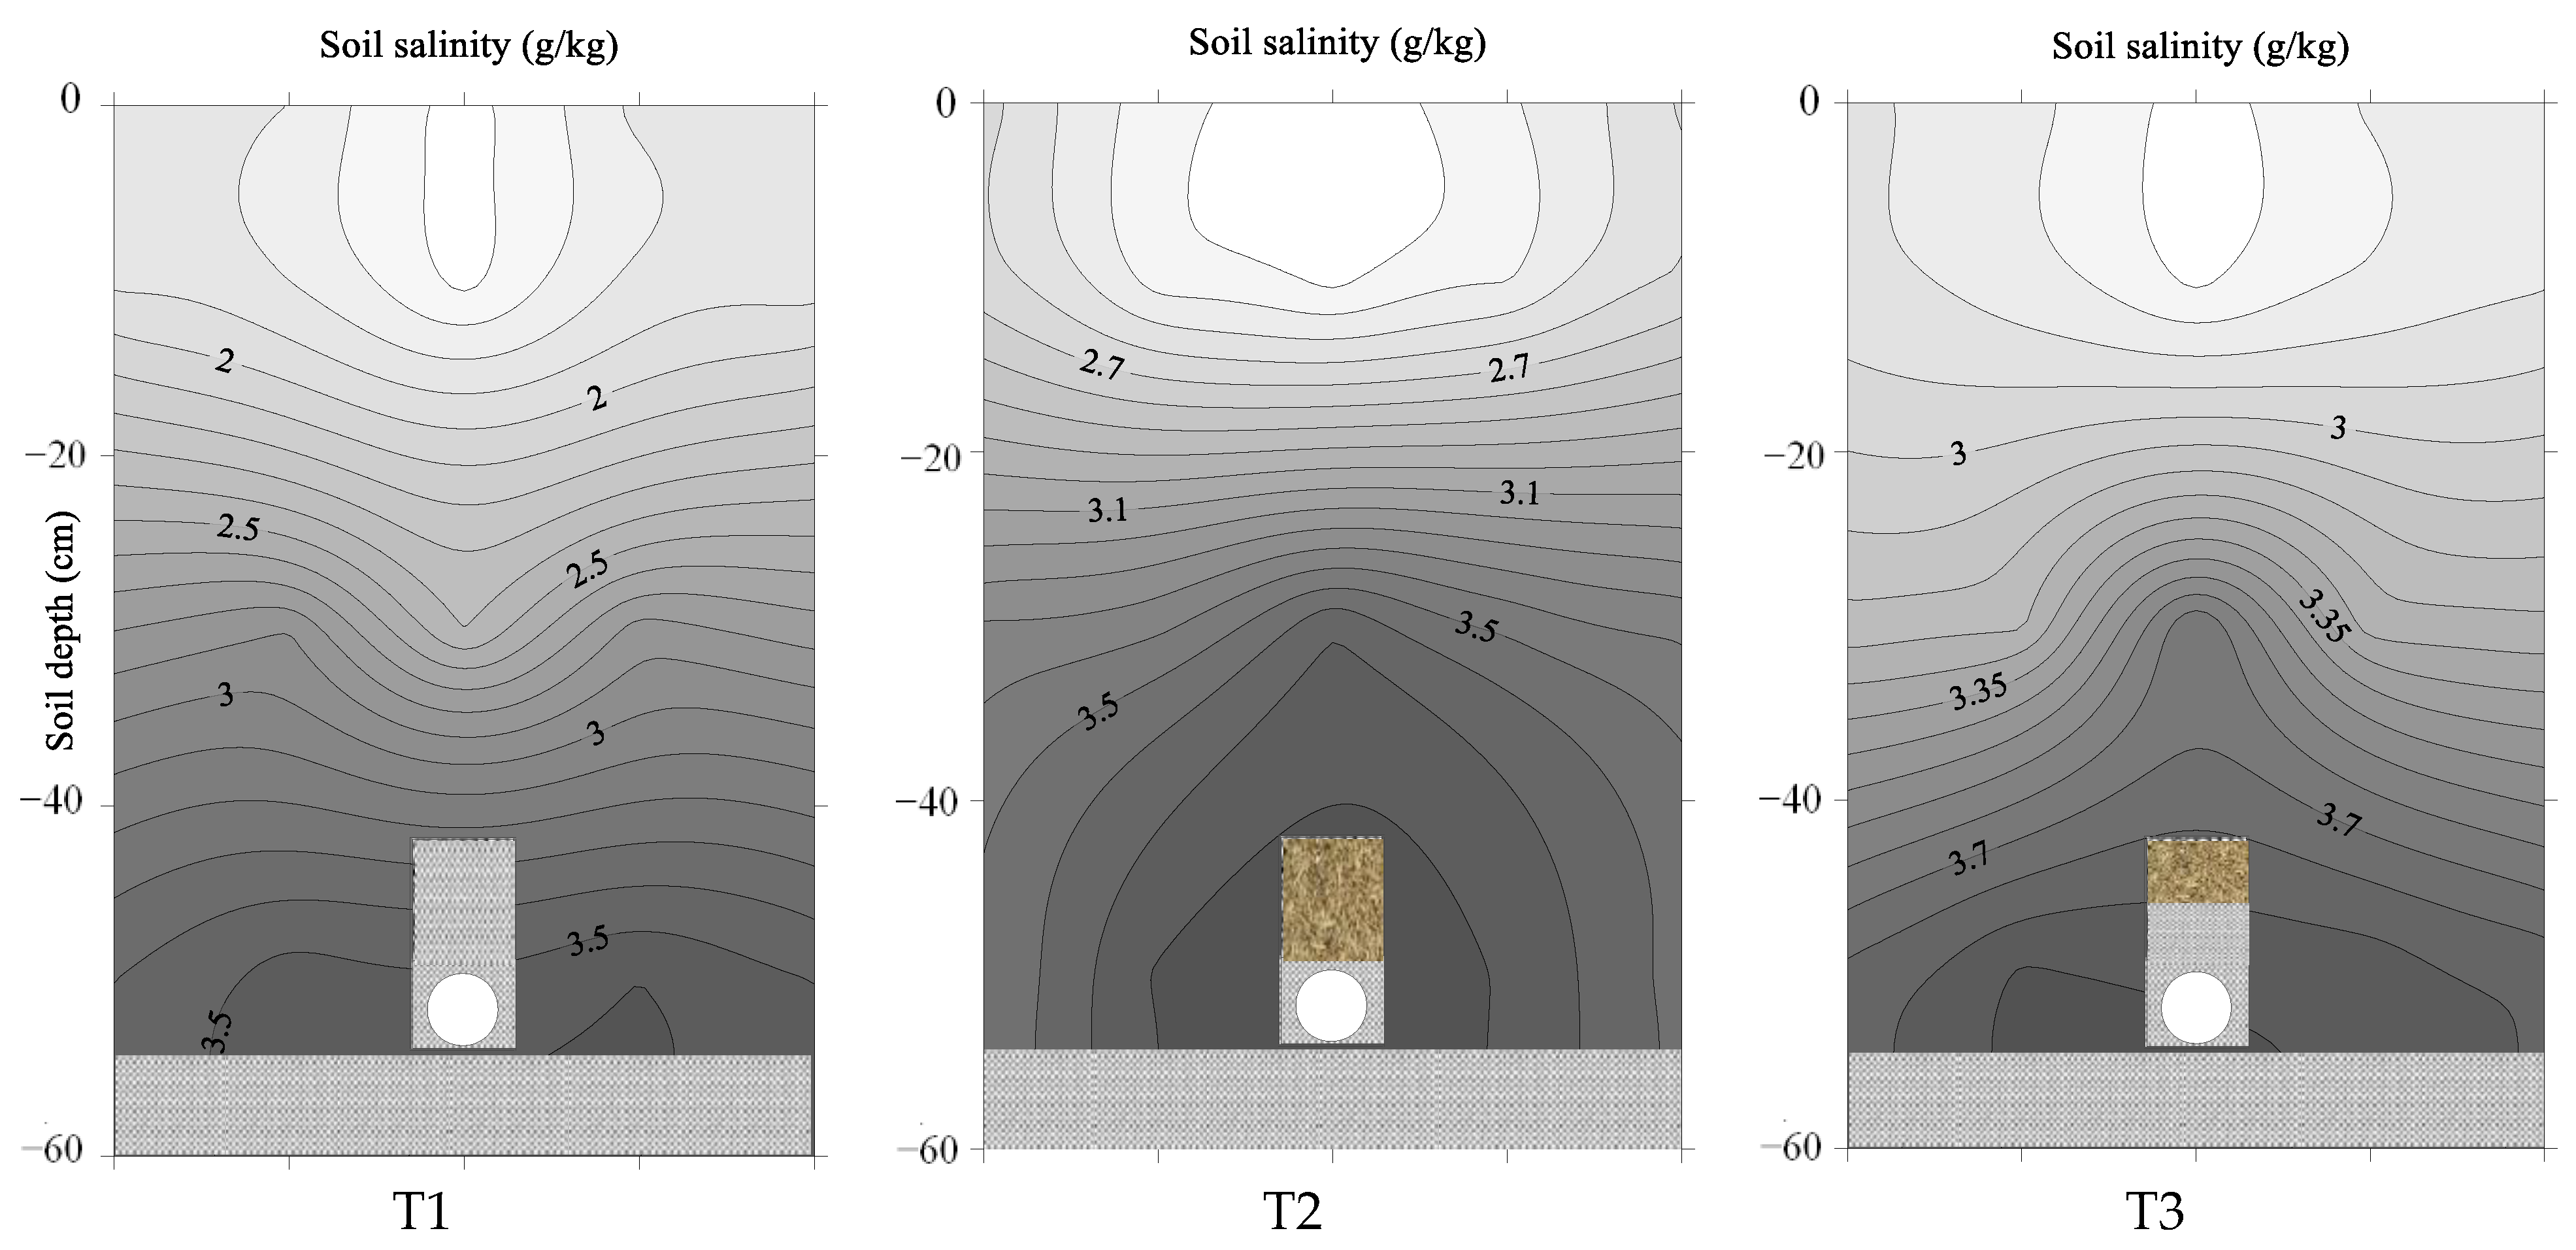
The salt contents of the tested soils ranged from 58.4 to 87.5 g∙kg−1, and the salt contents in the soil profiles under the three scenarios after leaching were below 3.9 g∙kg−1 (Figure 5). The salt content of the soil profile under scenario T1 was between 1.57 ± 0.15 and 3.60 ± 0.17 g/kg, while those under scenarios T2 and T3 were between 2.70 ± 0.25 and 3.92 ± 0.08 g/kg and between 2.35 ± 0.15 and 3.75 ± 0.30 g/kg, respectively. The salt contents of the soil profiles of the three scenarios increased with the increase in soil depth. The salt content of the soil immediately above the SDPs was remarkably lower than that on both sides of the SDPs, with the lowest value. The salinity of the soil profile at a depth of 0–20 cm under scenario T1 was lower than 2.4 g/kg, which was the lowest among the three scenarios. The salt accumulated in the soil layer at a depth below 40 cm. The salt distribution of the soil layer at a depth of 0–60 cm under scenario T3 was uniform, and the salinity of the soil profile ranged from 2.4 to 3.8 g/kg.

3.3. Analysis of the Effects of Soil Salt Leaching and Alkali Reduction under Different Scenarios

Before the experiment, the pH values of the samples collected from the soil layers at depths of 0–20, 20–40, and 40–60 cm were 8.83 ± 0.02, 8.93 ± 0.05, and 8.79 ± 0.03, respectively, which indicated that the pH distributions of the soil were relatively uniform. The pH values at depths of 0–60 cm under scenarios T1, T2, and T3 varied from 8.52 to 8.76, from 8.46 to 8.77, and from 8.50 to 8.76, respectively. In the single leaching experiment, the reduction in soil pH was not significant under the different scenarios, and no significant differences were found among the three scenarios (Table 2).
Before the experiments, the salt content of the tested soils exceeded 58 g∙kg−1, and the total salt content in the soil layer at a depth of 0–60 cm was 30.03 kg. After the leaching experiments, the soil salt contents under the three scenarios were all less than 3.8 g∙kg−1. The soil salt contents under scenarios T1, T2, and T3 were between 1.75 and 3.45, 2.43 and 3.75, and 2.78 and 3.78 g∙kg−1, respectively. After the leaching experiments, the total soil salt contents in the seepage boxes under scenarios T1, T2, and T3 were 1.16 ± 0.07, 1.41 ± 0.07, and 1.46 ± 0.03 kg, which were 96.1%, 95.3%, and 95.1% lower than those before the experiments, respectively. After the leaching experiments, the soil salinity at a depth of 0–20 cm under scenario T1 was 1.75 ± 0.16 g∙kg−1, which was significantly lower than those under scenarios T2 and T3. The soil salt content of the soil layer at a depth of 20–40 cm under scenario T1 was 2.70 ± 0.26 g/kg, which was much lower than those under scenarios T2 and T3. The soil salt content of the soil layer at a depth of 40–60 cm under scenario T1 was lower than those under scenarios T2 and T3, and no significant differences were observed among the three scenarios (p > 0.05). The total soil salt under scenario T1 was the lowest, which was 17.7% and 20.5% lower than those under scenarios T2 and T3, respectively. The sand–gravel scenario had the best salt-leaching effect.

3.4. Analysis of Salt-Leaching Efficiency under Different Scenarios

Table 3 summarizes our experimental observations. It was seen that the drainage rate (Rw) was the largest (34.42%) under scenario T1 and the lowest under scenario T2 and that the Rw values of the three scenarios were significantly different (p ˂ 0.05). Scenario T1 had the largest Rw, salt discharge rate (Rs), and ratio of drainage rate (R) among the three scenarios, and there were significant differences in the Rw and Rs indexes among the three scenarios (p ˂ 0.05). The desalination rate (LR) under scenario T1 was 96.16%, which was significantly higher than those under scenarios T2 and T3 (p ˂ 0.05). Scenario T2, in which straw filter material was used, had a higher initial Rw value but lower Rw and Rs values than those under the other two scenarios, which was due to the large pores of the straw filter material and its high drainage rate in the early stage. With the passage of time, a large amount of water carried sediment into the filter materials, the soil particles were prone to stay in the straw filter material, and clogging occurred, causing a decrease in Rw and Rs values in the later stage. The drainage ratio (R) under scenario T1 was 0.97, which was the best for salt drainage.

3.5. Geotextile Clogging and Soil Retention Effect

After one leaching test cycle, the soil losses under the three scenarios exceeded 120 g (Table 4). The soil loss under scenario T1 was the highest, while that under scenario T2 was the lowest. The soil loss under scenario T1 was 34.9% and 10.2% lower than those under scenarios T2 and T3, respectively, and significant differences were found among the three scenarios (p ˂ 0.05). All three scenarios exhibited different clogging degrees, and the clogging rate under scenario T1 was the lowest, which was 22.2% and 6.3% lower than those under scenarios T2 and T3, respectively. Compared with the original soil, after leaching, the clay and silt contents of the soil above the filter material under scenario T1 were decreased, while the sand content was increased. However, the clay and silt contents of the soil above the filter material under scenario T2 were increased, while the sand content was decreased (Table 5). The d90 value of the soil above the filter material under scenario T1 was 8.4% higher than that of the original soil. Under scenario T1, the clogging rate was decreased, and the d90 value of the soil above the filter material was significantly higher than those under scenarios T2 and T3 (p ˂ 0.05), which presented a good filtration performance. The straw filter material scenario had a strong interception effect, in which more particles were gathered above the geotextiles, a filter cake was more likely to form, and the soil preservation effect was good. However, a dense filter cake layer could be easily formed on the upstream surface, resulting in high clogging rates. The pores of the sand–gravel filter material were more uniform, which could intercept coarse soil particles and release fine particles, forming a good filter body structure and improving the filtration effect.

3.6. Clogging Types of Geotextiles under Different Scenarios

The particles in the soils were entrained by flowing water; some particles passed through the geotextiles into the drainage system, while others were intercepted by the geotextiles. The soil particles were generally intercepted through clogging and siltation. Under scenarios T1 and T3, siltation occurred inside the geotextiles, in which fine soil particles were trapped in the geotextile fiber structure, decreasing its permeable area. Under scenario T2, clogging occurred in the upstream surface of the geotextile, where soil particles were accumulated to form a low-permeability filter cake layer (Figure 6). Our observations of the surface and internal structures of the geotextile using scanning electron microscopy showed that the pores of the geotextile wrapped around the SDPs were clogged or blocked by clusters of fine soil particles. Under scenario T2, a clear and dense filter cake layer was formed on the geotextile upstream surface. Under scenarios T1 and T3, the soil particles did not completely block the geotextile, and a large number of pores were present.

4. Discussion

The SDPs had stronger effects on the desalination of the upper soil layer in the field, which could decrease the spatial heterogeneity of the soil salinity and transform the soil salinity from “high-salinity heterogeneity” to “low-salinity homogeneity” [13]. The results also verified that the soil desalination rates of the wrapped SDPs exceeded 95% and that the desalination effect of the soil immediately above the SDP was obvious. The pores of SDP filter material were closely related to the migration laws of the water and salt in the soil. Tao et al. (2016) showed that a filter layer with a good particle gradation was one of the key factors in the reverse filtration effect [28]. The clogging degree of the filter material was found to affect the drainage efficiency and the total displacement of SDPs, resulting in differences in the distributions of water and salt in the soil profile. In this experiment, the sand gravel filter material yielded the lowest clogging rate, the highest drainage and salt discharge rates, the largest total displacement, and the best salt-leaching effect for the soil layer at a depth of 0–60 cm. The straw filter material presented a high silting rate, leading to low drainage and salt discharge rates as well as a low total displacement. The salt-leaching effect of the profile under the straw filter material was not as good as those under other filter materials. The filter materials could reasonably facilitate the soil above the SDP to form a bridge, filter cake, and natural soil areas from bottom to top, with a good filter structure. Some researchers have improved subsurface pipes’ drainage capacity by improving the structure and material of the filter layer around the SDPs. However, some of these techniques have only been at the stage of simulation tests and have not been applied on a large scale in the field [25,26]. The medium porosity of the SDP sand filter material mixed with fine sand and fine gravel could form a stable filter layer, resulting in water stratification in the soil profile, improving the water retention rate in the subsurface soil and preventing the salt from returning [32]. The experiments also confirmed that the sand filter materials could form a good filter layer and promote the salt discharge of the SDPs. In the straw filter material scenario, the leaching water flow was faster in the early stage, which was due to the large pores of the straw filter material and high drainage rate in the early stage. With the passage of time, a large amount of water carried the sediment into the filter material, the soil particles could easily stay in the straw filter material, and clogging occurred, which decreased the drainage and salt discharge rates in the later stage.
The directional migration of the soil particles occurred within a short period of time after the drainage began. Fine particles in the soil gradually moved downwards by the drag of the water flow to fill pores. This particle redistribution led to the continuous compaction of the soil, and the drainage flow rate of the SDPs gradually decreased. In severe cases, this could result in the loss of drainage function [25]. The interior of the geotextile is a network of fibers with many small pores that can create flow channels and block the passage of soil particles. Filter materials such as sand and straw can increase the soil’s likelihood of interception and particle-screening ability. The filter materials wrapped around the SDPs were used to screen nearby soil particles under the action of the water flow. Large particles were intercepted and gradually accumulated outside to form a soil-permeable skeleton with a high level of permeability, inducing the formation of a natural filter layer in the soil above [21,33]. The geotextiles increased the characteristic particle size d90 values of the soils by more than 20% through particle screening, resulting in the formation of a highly permeable soil skeleton on their surfaces [24]. In our research, the sand–gravel filter material increased the characteristic particle size d90 value of the soil above the SDPs by 8.4%, which effectively played the role of a filter material in intercepting coarse particles and releasing fine particles and induced the surrounding soil to form a soil-permeable skeleton consisting of coarse particles, such as sand particles.
Existing research has shown that spunbonded polypropylene geotextiles have smooth surfaces and are prone to produce thin particles called “pancakes” after contact with the soil [34]. After the long-term operation of SDPs, small particles in the soil are accumulated in the filter layer, causing mechanical clogging and affecting their drainage effects. In this study, the geotextiles’ surface was clogged under the scenario of the straw filter material, which might be due to the fact that the filter material did not have a significant screening effect on the soil particles above it due to the non-uniformity of the pores of the straw, which failed to form a highly permeable soil skeleton structure. Soil particles of different sizes entered the straw filter material and eventually remained in the straw and geotextile. In this study, our scanning electron microscopy results revealed that the straw filter material scenario formed a dense filter cake layer on the upstream surface, and this filter cake layer continued to absorb smaller soil particles that moved with the water. The thickness of the filter cake gradually increased over time, decreasing the permeability. For the scenarios of the sand gravel filter and combined sand gravel–straw filter materials, soil particles were trapped in the geotextiles’ fiber structure. The soil particles did not completely block the geotextiles, and there were still a large number of effective pores.

5. Conclusions

In order to solve the technical bottleneck of low salt discharge efficiency due to SDPs clogging easily, this study systematically evaluated the influences of three kinds of filter materials, namely sand gravel, straw, and combined sand–gravel straw, on the salt discharge efficiency and anti-silting effect of SDPs by adopting a self-designed laboratory simulation experiment device. The following conclusions were drawn:
(1)
The salt removal rates of the SDPs externally wrapped with the filter materials exceeded 95%. The sand gravel filter material scenario had the highest desalting rate, and its soil profiles had total salt contents that were 17.7% and 20.5% lower than those of the straw and combined sand gravel–straw scenarios, respectively. The soil salinity of the sand gravel filter material around the SDP was between 1.57 and 3.6 g/kg, and its salt-leaching effect was the best.
(2)
Under the straw filter material scenario, dense filter cake layers were formed on the upstream surfaces of the geotextiles. Under the sand gravel and combined sand gravel–straw scenarios, the soil particles remained in the geotextiles’ fiber structure, and a large number of pores were retained.
(3)
The sand gravel filter materials increased the characteristic particle size of the soil above the SDP by 8.4%, which effectively intercepted coarse particles, released fine particles, and induced the formation of a highly permeable soil skeleton consisting of coarse particles, such as sand particles, surrounding the soil. Therefore, the sand gravel filter material was the most suitable for the treatment of Yinbei saline–alkali soil in Ningxia Hui Autonomous Region.

Author Contributions

Investigation, X.W. and Y.Z.; Data curation, J.S. and Y.Z.; Writing—original draft, J.S. and L.F.; Writing—review & editing, X.W.; Visualization, L.F. All authors have read and agreed to the published version of the manuscript.

Funding

This research was funded by National Natural Science Foundation (42367043); National Key Research and Development Plan (2021YFD1900605-05); Chinese Academy of Sciences ‘Western Light’ Talent Training Program ‘Western Young Scholars’; Agricultural Science and Technology Independent Innovation of Ningxia Hui Autonomous Region (NGSB-2021-11-03); and Observation and Monitoring of Basic Long-Term Scientific and Technological Work in Agriculture (NAES091AE18).

Data Availability Statement

Data are contained within the article.

Conflicts of Interest

The authors declare no conflicts of interest.

References

  1. Tarolli, P.; Luo, J.; Park, E.; Barcaccia, G.; Masin, R. Soil salinization in agriculture: Mitigation and adaptation strategies combining nature-based solutions and bioengineering. iScience 2024, 27, 108830. [Google Scholar] [CrossRef] [PubMed]
  2. Cuevas, J.; Daliakopoulos, I.; Moral, F.; Hueso, J.; Tsanis, I. A review of soil-improving cropping systems for soil salinization. Agronomy 2019, 9, 295. [Google Scholar] [CrossRef]
  3. Minhas, P.; Ramos, T.; Ben, A.; Pereira, L. Coping with salinity in irrigated agriculture: Crop evapotranspiration and water management issues. Agric. Water Manag. 2020, 227, 105832. [Google Scholar] [CrossRef]
  4. James, O. History of the roles of gypsum in soil reclamation and establishment of SAR/EC water quality guidelines. In Proceedings of the First IUSS Conference on Sodic Soil Reclamation, Changchun, China, 30 July–2 August 2021. [Google Scholar]
  5. Yang, J.; Yao, R.; Wang, X.; Xie, W.; Zhang, X.; Zhu, W.; Zhang, L.; Sun, R. Research on Salt-affected Soils in China: History, Status Quo and Prospect. Acta Pedol. Sin. 2022, 59, 10–27. (In Chinese) [Google Scholar]
  6. Liu, T.; Wang, B.; Xiao, H.; Wang, R.; Yang, B.; Cao, Q.; Cao, Y. Differentially improved soil microenvironment and seedling growth of Amorpha fruticosa by plastic, sand and straw mulching in a saline wasteland in northwest China. Ecol. Eng. 2018, 122, 126–134. [Google Scholar] [CrossRef]
  7. Wang, Z.; Yin, D.; Wang, H.; Zhao, C.; Li, Z. Effects of biochar on waterlogging and the associated change in micro-ecological environment of maize rhizosphere soil in saline-alkali land. Bioresources 2020, 15, 9303–9323. [Google Scholar] [CrossRef]
  8. Askri, B.; Khodmi, S.; Bouhlila, R. Impact of subsurface drainage system on waterlogged and saline soils in a Saharan palm grove. Catena 2022, 212, 106070. [Google Scholar] [CrossRef]
  9. Askar, M.; Youssef, M.; Chescheir, G.; Negm, L.; King, K.; Hesterberg, D.; Amoozegar, A.; Skaggs, R. DRAINMOD simulation of macropore flow at subsurface drained agricultural fields: Model modification and field testing. Agric. Water Manag. 2020, 242, 106401. [Google Scholar] [CrossRef]
  10. Ritzema, H.; Abdel-Dayem, S.; El-Atfy, H.; Nasralla, M.; Shaheen, H. Challenges in modernizing the subsurface drainage systems in Egypt. Agric. Water Manag. 2023, 288, 108484. [Google Scholar] [CrossRef]
  11. Soe, Y.; Shinogi, Y.; Taniguchi, T. Changes in Certain Paddy Soil Properties under Perforated Sheet Pipe as Subsurface Shallow Drainage. Jpn. Agric. Res. Q. JARQ 2022, 56, 59–66. [Google Scholar] [CrossRef]
  12. Heng, T.; Feng, G.; Yang, L.; He, X.; Yang, G.; Li, F.; Xu, X.; Feng, Y. Soil salt balance in a cotton field under drip irrigation and subsurface pipe drainage systems. Agron. J. 2021, 113, 4875–4888. [Google Scholar] [CrossRef]
  13. Acharya, U.; Chatterjee, A.; Daigh, A. Effect of Subsurface Drainage Spacing and Depth on Crop Yield. Agron. J. 2019, 111, 1675–1681. [Google Scholar] [CrossRef]
  14. Chen, G.; Wei, Z.; Liu, H. Study on Soil Desalination Process of Saline-Alkaline Grassland along the Yellow River in Western Inner Mongolia under Subsurface Drainage. Sustainability 2022, 14, 14494. [Google Scholar] [CrossRef]
  15. Rong, Z.; Wang, S.; Hao, R.; Hao, R.; Tao, Y. Permeability and anti-clogging performance of geotextile envelope material around subsurface drainage pipe in Yinbei Irrigation District in Ningxia. Trans. Chin. Soc. Agric. Eng. 2021, 37, 68–75. (In Chinese) [Google Scholar]
  16. Talukolaee, M.; Naftchali, A.; Parvariji, L.; Ahmadi, M. Investigating long-term effects of subsurface drainage on soil structure in paddy fields. Soil Tillage Res. 2018, 177, 155–160. [Google Scholar] [CrossRef]
  17. Mante, A.; Ranjan, R.; Bullock, P. Subsurface drainage for promoting soil strength for field operations in southern Manitoba. Soil Tillage Res. 2018, 184, 261–268. [Google Scholar] [CrossRef]
  18. Han, D.; Chen, C.; Wang, F.; Li, W.; Peng, H.; Jin, Q.; Bi, B.; Shaghaleh, H.; Hamoud, Y.A. Effects of Subsurface Pipe Drainage Spacing on Soil Salinity Movement in Jiangsu Coastal Reclamation Area. Sustainability 2023, 15, 13932. [Google Scholar] [CrossRef]
  19. Tian, F.; Miao, Q.; Shi, H.; Li, R.; Dou, X.; Duan, J.; Liu, J.; Feng, W. Study on Water and Salt Transport under Different Subsurface Pipe Arrangement Conditions in Severe Saline–Alkali Land in Hetao Irrigation District with DRAINMOD Model. Water 2023, 15, 3001. [Google Scholar] [CrossRef]
  20. Liu, W.; Luo, W.; Jia, Z.; Pan, Y.; Tang, S.; Yuan, H.; Li, S. Experimental study on geotextile envelope for subsurface drainage in Yellow River Delta. Trans. Chin. Soc. Agric. Eng. 2013, 29, 109–116. (In Chinese) [Google Scholar]
  21. Hu, L.; Yang, S.; Liang, Z.; Zhang, W.; Wang, W. An Experimental Study on Wrapping Materials of Subsurface Drain for Farmland in the Downstream Hetao Irrigation District. J. Irrig. Drain. 2022, 41, 141–148. (In Chinese) [Google Scholar]
  22. Qin, W.; Li, M.; Li, Y.; Liu, H. Proposed Gravel Filters for Pipe-Drain to Improve the Efficacy of the Drainage System under Drip Irrigation. J. Irrig. Drain. 2017, 36, 80–85. (In Chinese) [Google Scholar]
  23. Ghane, E.; Dialamel, B.; Abdalaal, Y.; Ghane, M. Knitted-sock geotextile envelopes increase drain inflow in subsurface drainage systems. Agric. Water Manag. 2022, 274, 107939. [Google Scholar] [CrossRef]
  24. Bao, Z.; Tong, B.; Zhang, Z. Application Effects of Wraped Materials Outside Drainage Pipe in Ningxia Irrigation Area of Yellow River. J. Irrig. Drain. 2007, 26, 47–50. (In Chinese) [Google Scholar]
  25. Zhang, Y.; Wang, S.; Hao, R.; Rong, Z. Comparative test on the anti-filtration effect of geotextile envelope material around subsurface drainage pipe using two kinds of soil. Trans. Chin. Soc. Agric. Eng. 2023, 39, 270–276. (In Chinese) [Google Scholar]
  26. Li, J.; Wang, H.; Ma, J.; Guo, L.; Jin, M. Improving the desalination of subsurface drain pipe with envelope adsorption filter using seepage tank test. Trans. Chin. Soc. Agric. Eng. 2023, 39, 121–130. (In Chinese) [Google Scholar]
  27. Zhang, G. Soil Series of China; Science Press: Beijing, China, 2020. (In Chinese) [Google Scholar]
  28. Tao, Y.; Wang, S.; Xu, D.; Zhai, X. Effect of Structure-type on Improved Subsurface Drainage Performance. Trans. Chin. Soc. Agric. Mach. 2016, 47, 113–118. (In Chinese) [Google Scholar]
  29. Hu, S.; Tian, C.; Song, Y. Calculation of salinity leaching quota based on saturated infiltration theroy. Acta Pedol. Sin. 2010, 47, 563–567. (In Chinese) [Google Scholar]
  30. Wang, X.; Sun, Z.; Liu, X.; Bao, Z.; Jiao, B.; Li, X.; Zeng, Y.; Sameh, E. Amelioration of Alkalized Solonchak Soils by Subsurface Gravel Blind Ditches and Desulfurized Gypsum. Appl. Ecol. Environ. Res. 2019, 17, 7865–7879. [Google Scholar] [CrossRef]
  31. Chen, M.; Huang, J.; Zeng, W.; Ao, C.; Liu, D.; Liu, Y. Water-salt transport law of subsurface pipes with geotextiles under the condition of salt discharge. Trans. Chin. Soc. Agric. Eng. 2020, 36, 130–139. (In Chinese) [Google Scholar]
  32. Liu, J.; Tian, J.; Zhang, M.; Wang, J.; Yang, Z.; Zhao, G. Effect of Sand Filter in Subsurface Drain on Water and Salt Movement in Paddy Soil. J. Irrig. Drain. 2022, 41, 114–121. (In Chinese) [Google Scholar]
  33. Tao, Y.; Wang, S.; Xu, D.; Guan, X.; Ji, M.; Liu, J. Theoretical analysis and experimental verification of the improved subsurface drainage discharge with ponded water. Agric. Water Manag. 2019, 213, 546–553. [Google Scholar] [CrossRef]
  34. Elzoghby, M.; Jia, Z.; Luo, W. Experimental study on the hydraulic performance of nonwoven geotextile as subsurface drain filter in a silty loam area. Ain Shams Eng. J. 2021, 12, 3461–3469. [Google Scholar] [CrossRef]
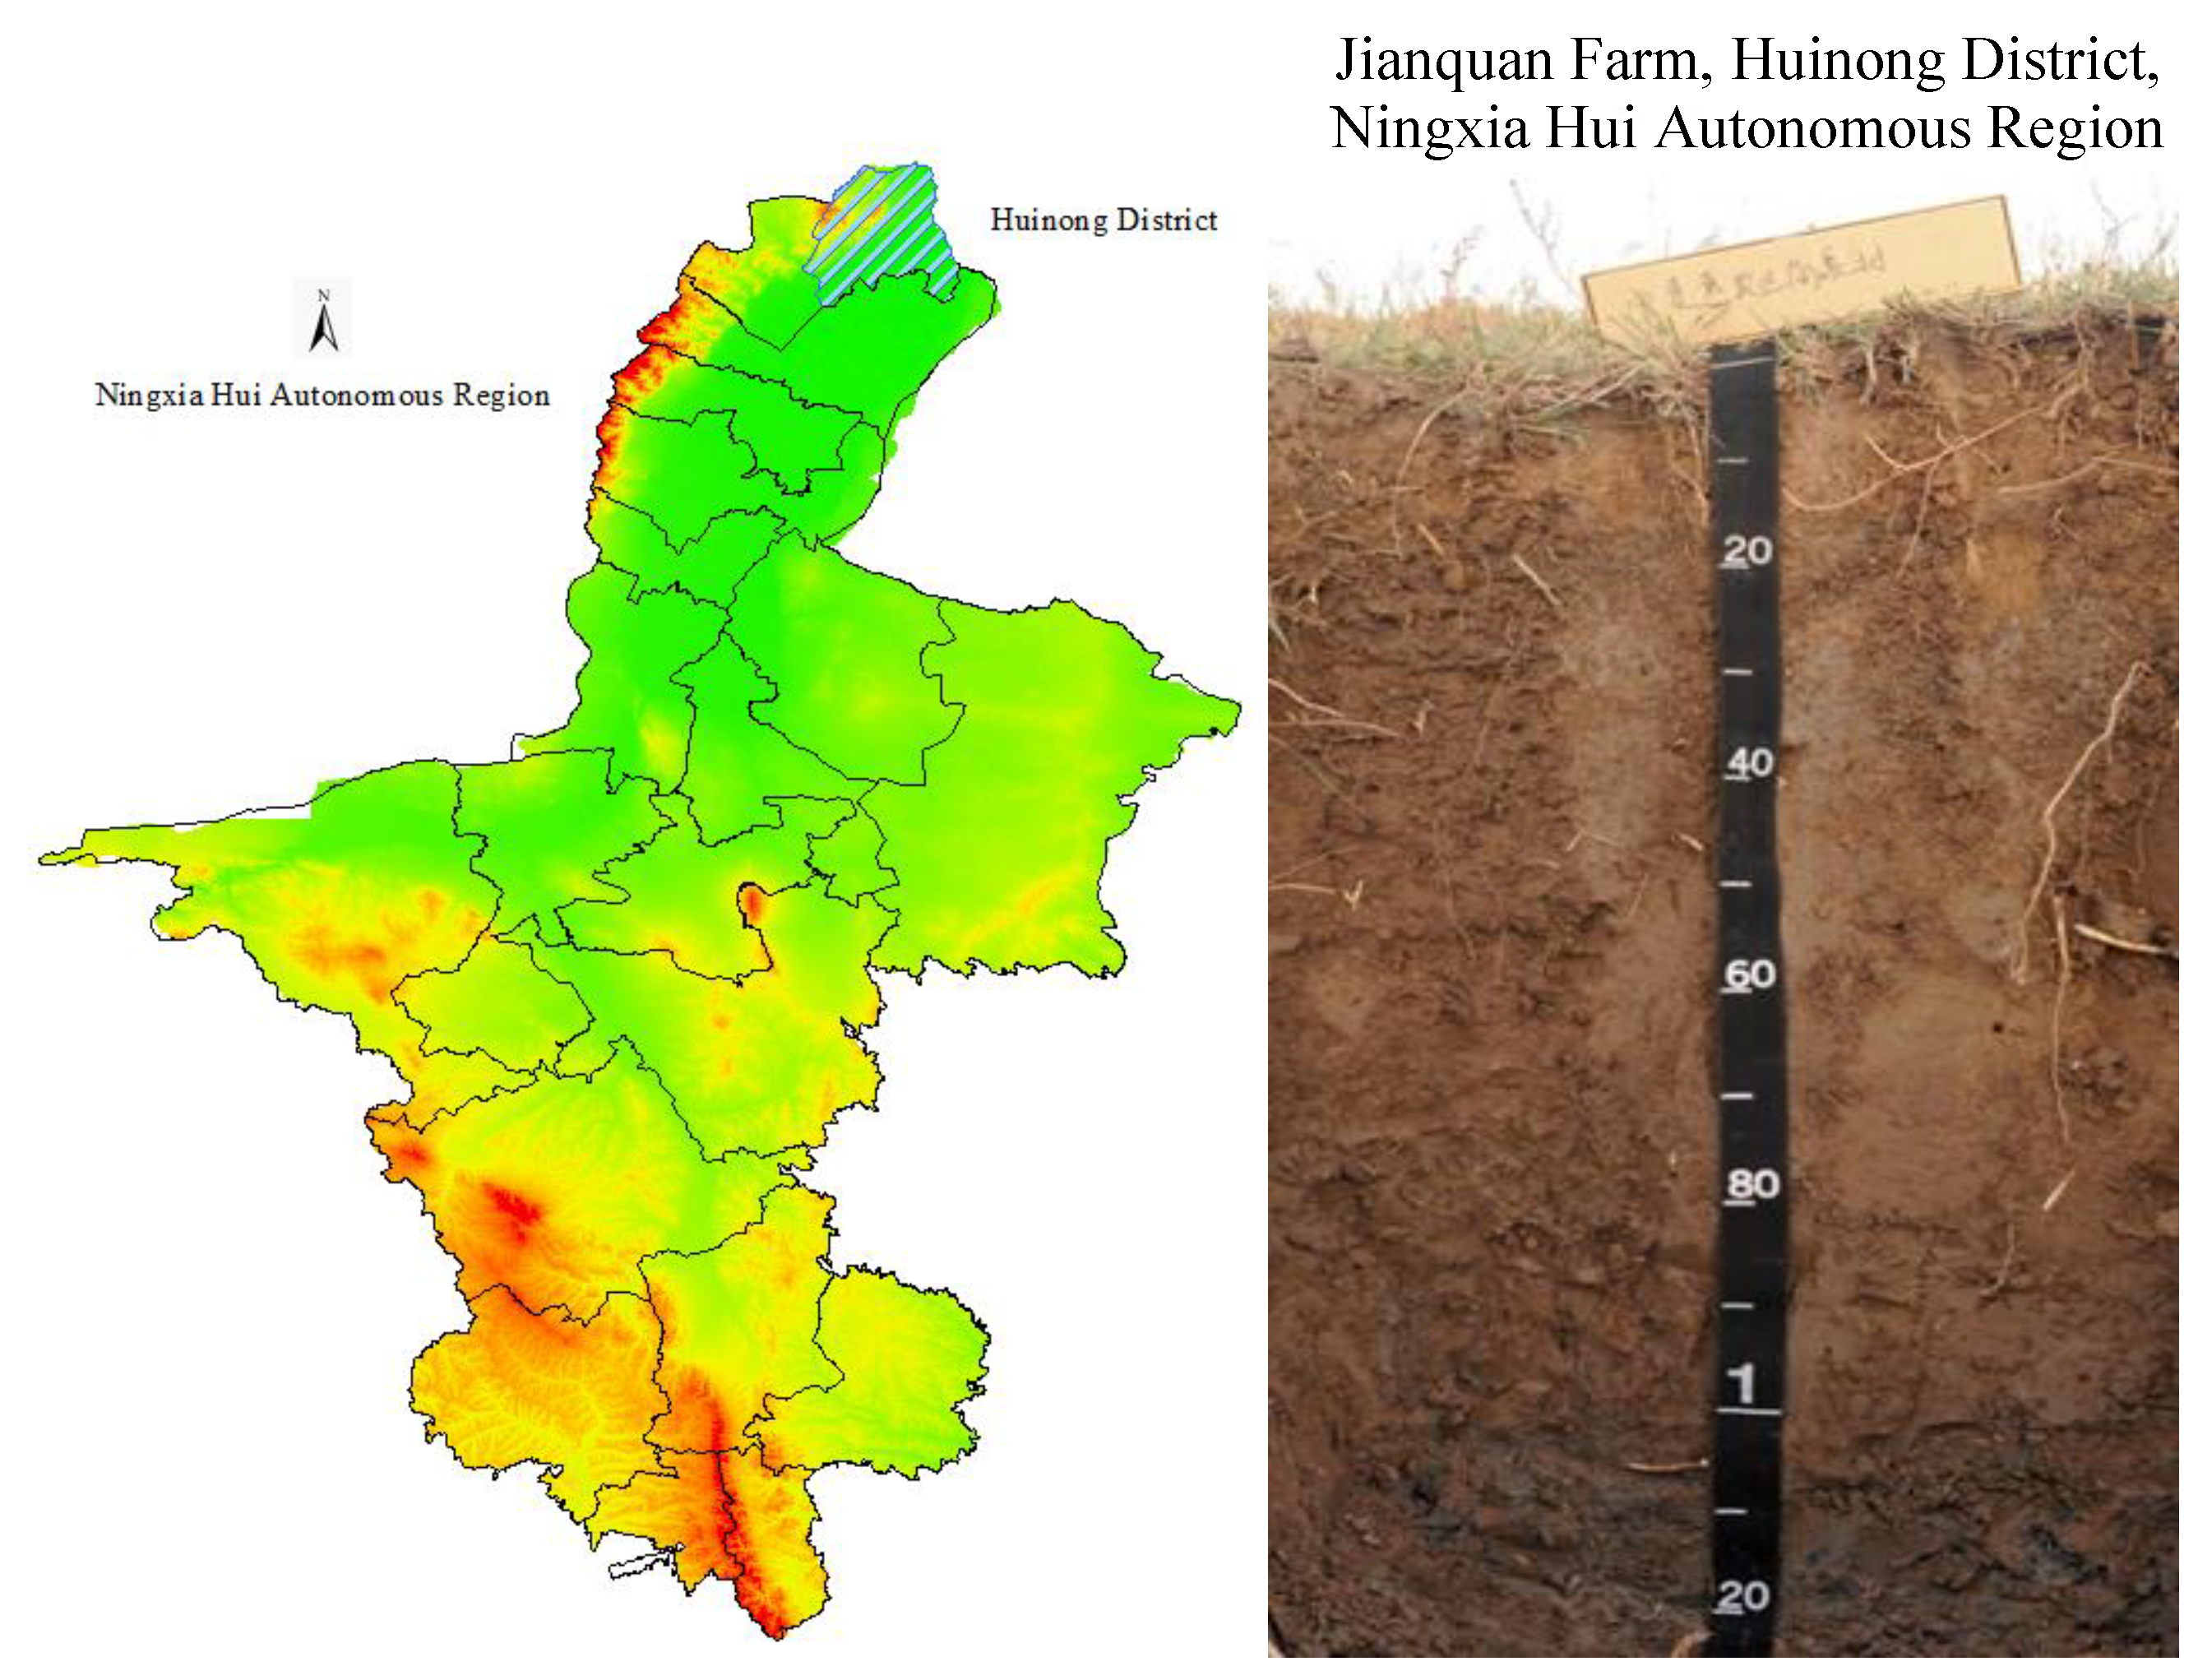
Figure 1. Geographical position of the study area and photo of soil type [27] (Red represents mountains in Ningxia, yellow represents hills in Ningxia, and green represents plains in Ningxia).
Water 16 01432 g001
Figure 2. Schematic diagram of simulation device. 1. Quartz sands, 2. SDP, 3. Geotextiles, 4. Gravels, 5. Sampling port, 6. Soil, 7. Overflow port, 8. Water intake port, 9. Header tank, and 10. Outlet of SDP.
Water 16 01432 g002
Figure 3. Photos of simulated experiment.
Water 16 01432 g003
Figure 4. Soil moisture distributions under different scenarios.
Water 16 01432 g004
Figure 5. Distributions of soil salinity under different scenarios.
Water 16 01432 g005
Figure 6. Electron microscopy scanning images of geotextiles.
Water 16 01432 g006
Table 1. Physical and chemical properties of soil at the experimental site.
Soil Depth
/(cm)
Soil TexturepHSoil Salinity/(g/kg)Dry Density/(g/cm3)Porosity/
(%)
Field Capacity/
(%)
0~20Loam soil8.83 ± 0.0287.5 ± 4.141.45 ± 0.0345.28 ± 0.5218.7 ± 0.42
20~40Loam soi8.93 ± 0.0559.6 ± 3.471.52 ± 0.0442.64 ± 0.4619.0 ± 0.37
40~60Loam soi8.79 ± 0.0358.4 ± 3.851.58 ± 0.0240.38 ± 0.3820.1 ± 0.64
Note: Field capacity is water content by mass.
Table 2. Effects of different scenarios on soil salinity and pH.
Soil Depth/(cm)Original SoilT1T2T3
Salinity (g/kg)pHSalinity (g/kg)pHSalinity (g/kg)pHSalinity (g/kg)pH
0~2087.5 ± 4.148.83 ± 0.021.75 ± 0.168.52 ± 0.022.43 ± 0.148.53 ± 0.022.78 ± 0.078.53 ± 0.03
20~4059.6 ± 3.478.93 ± 0.052.70 ± 0.268.76 ± 0.033.42 ± 0.088.77 ± 0.043.36 ± 0.308.76 ± 0.03
40~6058.4 ± 3.858.79 ± 0.033.45 ± 0.098.53 ± 0.013.75 ± 0.258.46 ± 0.013.78 ± 0.168.50 ± 0.02
Total salinity (kg)30.03 ± 0.17/1.16 ± 0.07/1.41 ± 0.07/1.46 ± 0.03/
Table 3. Drainage rate and salt discharge rate of SDPs under different scenarios.
ScenarioDrainage Rate/Rw (%)Salt Discharge Rate/Rs (%)Desalination Rate/LR (%)R (Rs/LR)
T134.42 ± 0.17 a93.69 ± 0.14 a96.16 ± 0.15 a0.97 ± 0.0002 b
T232.52 ± 0.27 c87.72 ± 0.17 c95.31 ± 0.14 b0.92 ± 0.0004 a
T333.43 ± 0.19 b89.72 ± 0.18 b95.16 ± 0.16 b0.94 ± 0.0004 c
Note: Different letters indicate significant differences among different scenarios at 0.05 level.
Table 4. Soil loss and siltation on geotextile materials around SDPs.
ScenarioWeight of Soil Loss/(g)Initial Weight of Geotextile/(g)Weight of Clogged Geotextile/(g)Clogging Ratio/(%)
T1198.78 ± 2.33 a9.12 ± 0.13 b12.57 ± 0.09 c37.75 ± 0.01 c
T2129.43 ± 5.32 c9.30 ± 0.06 ab13.81 ± 0.03 a48.51 ± 0.01 a
T3144.13 ± 5.94 b9.35 ± 0.10 a13.12 ± 0.13 b40.28 ± 0.02 b
Note: Different letters indicate significant differences among scenarios at the same soil depth at 0.05 level.
Table 5. Analysis results of soil particle size above the filter material.
ScenarioMass Fraction/(%)d90/(μm)
ClaySiltSand
Original soil10.22 ± 1.2436.41 ± 1.4553.41 ± 1.2994.70 ± 4.10
T18.02 ± 0.31 c24.06 ± 7.28 b67.92 ± 7.43 a108.25 ± 5.32 a
T218.20 ± 1.54 a42.93 ± 4.25 a38.87 ± 5.78 b74.25 ± 2.71 c
T313.98 ± 1.35 b27.23 ± 2.68 b58.79 ± 3.81 a89.83 ± 4.58 b
Note: Different letters indicate significant differences among treatments at the same soil depth at 0.05 level.
Disclaimer/Publisher’s Note: The statements, opinions and data contained in all publications are solely those of the individual author(s) and contributor(s) and not of MDPI and/or the editor(s). MDPI and/or the editor(s) disclaim responsibility for any injury to people or property resulting from any ideas, methods, instructions or products referred to in the content.