Article

Monsoons and Tide-Induced Eddies Deflect the Dispersion of the Thermal Plume in Nan Wan Bay

1
Department of Marine Environmental Informatics, National Taiwan Ocean University, Keelung 202301, Taiwan
2
Institute of Marine Biology, National Dong Hwa University, Pingtung 94450, Taiwan
3
Taiwan Ocean Research Institute, National Applied Research Laboratories, Kaohsiung 85243, Taiwan
4
Department of Oceanography, National Sun Yat-sen University, Kaohsiung 80424, Taiwan
5
Department of Life Science, National Taiwan Normal University, Taipei 11677, Taiwan
*
Author to whom correspondence should be addressed.
Water 2024, 16(10), 1420; https://doi.org/10.3390/w16101420
Submission received: 30 March 2024 / Revised: 24 April 2024 / Accepted: 4 May 2024 / Published: 16 May 2024

Abstract

:
The present work employs a three-dimensional ocean model (MITgcm) driven by tidal and climatological forcings to assess the range of impacts of thermal wastewater discharge from the Third Nuclear Power Plant (NP_No.3) in Nan Wan Bay on the local ecosystem. Tides and daily wind forcings are incorporated into the MITgcm to examine their effects on thermal plume dispersion and water circulation in Nan Wan Bay. The model results reveal that the thermal plume is most likely to disperse to the southwest in the summer; it is unlikely to drift to the southeast or northeast because of the presence of the gentle southwesterly monsoon. In the winter, the thermal plume is most likely to be directed to the southwest and is unlikely to be directed to the northeast or southeast because of the prevailing northeasterly monsoon. Additionally, it is worth emphasizing that strong tidal currents generate a pair of counter-rotating eddies that significantly influence the dispersion of the thermal plume. However, seasonal monsoons also play an essential role in modifying the thermal plume’s direction and dispersion.

1. Introduction

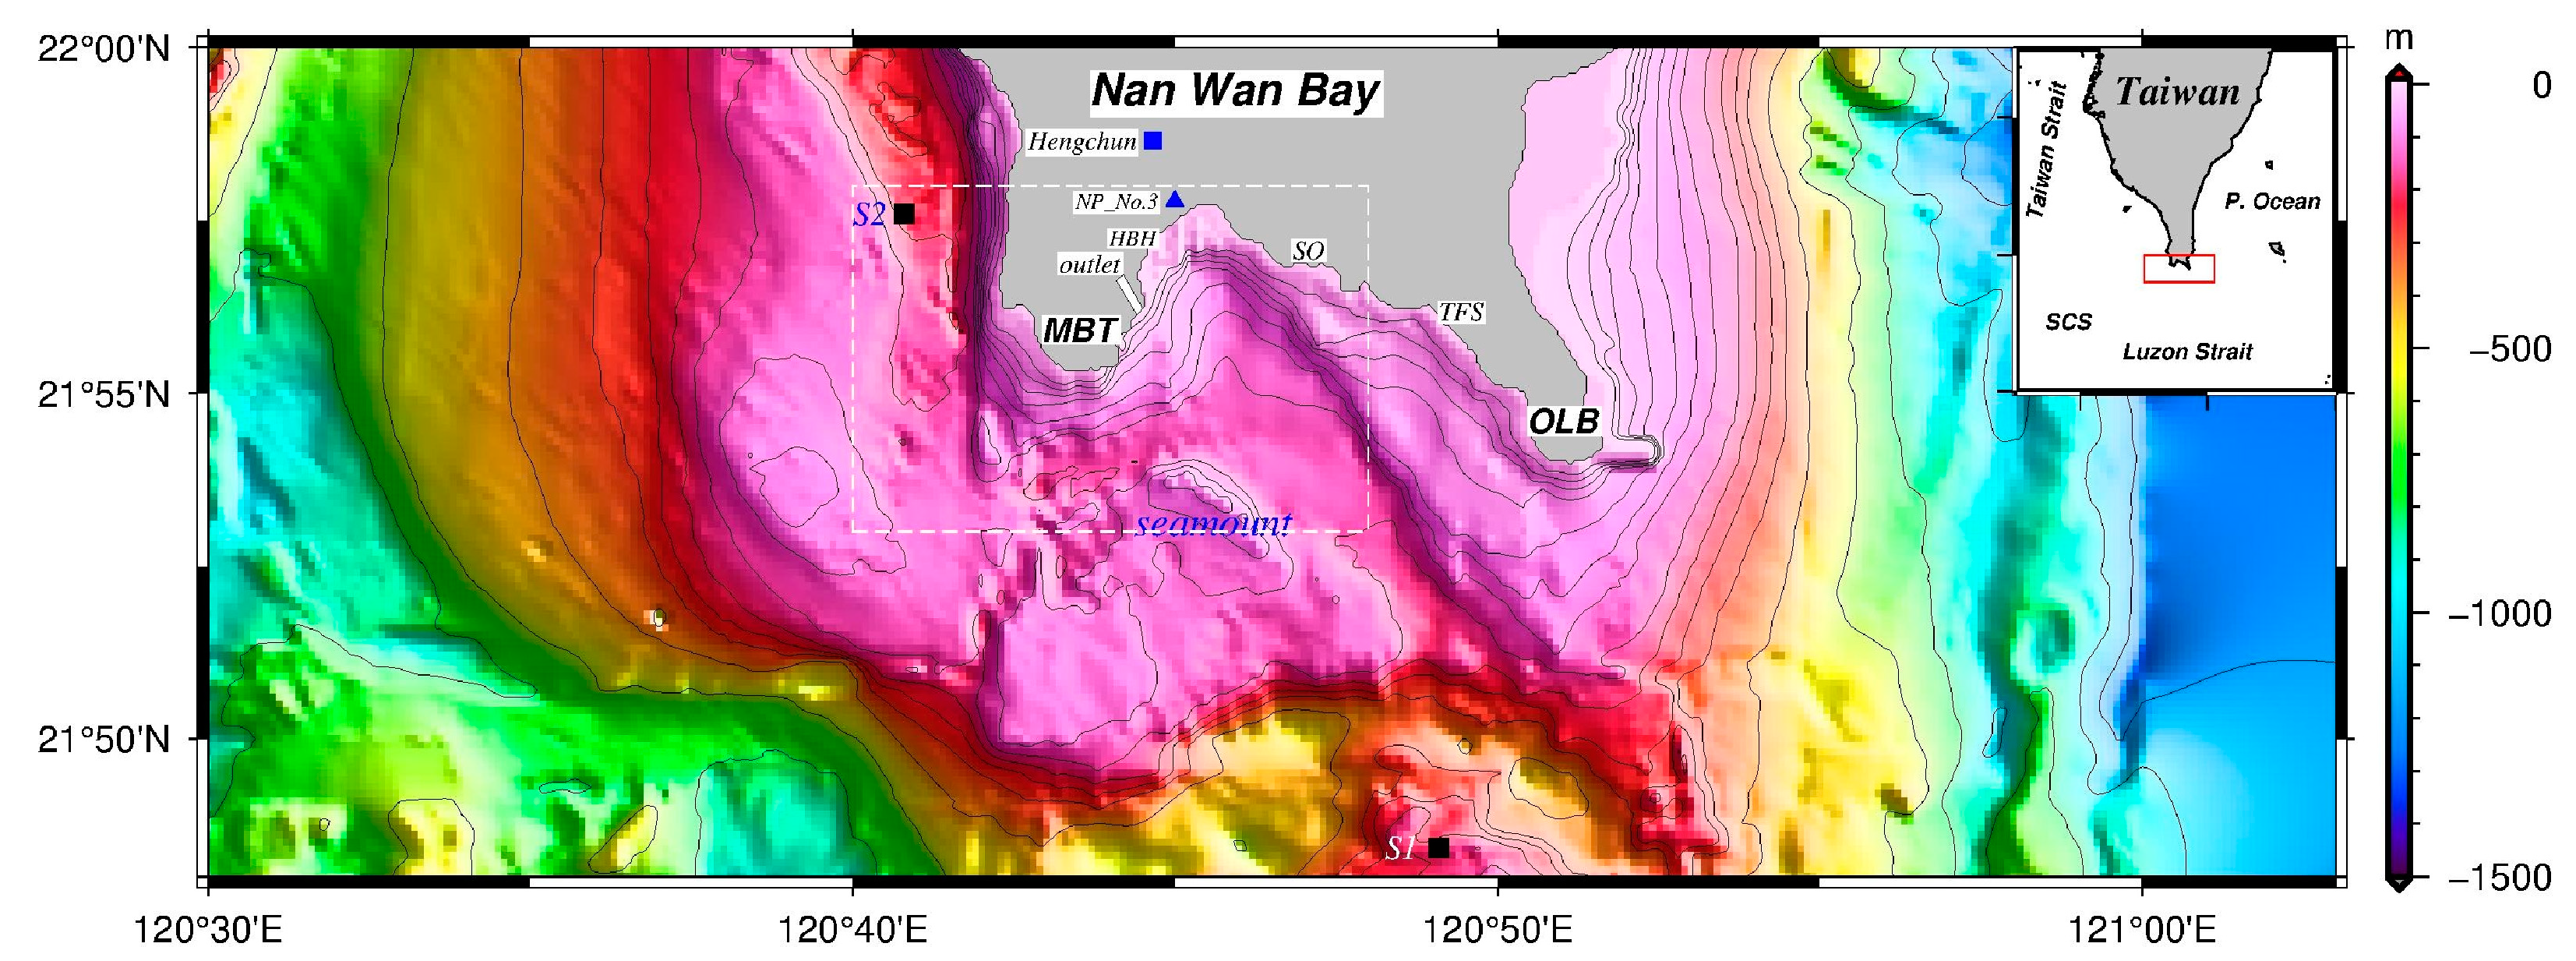
Nan Wan Bay, situated at the southernmost tip of Taiwan, is a well-known tourist destination and a part of the Kenting National Park. The bay is bounded by two capes that extend unequally to the south, as shown in Figure 1. The west cape, locally known as Mou-Bi-Tou (MBT), does not reach as far south as the east cape, locally known as O-Luan-Bi (OLB). A seamount exists not far off the southeast point of MBT and partially obstructs the north–south passages. Toward the south and southwest, Nan Wan Bay opens up to the Luzon Strait (LS) and the South China Sea (SCS), respectively. The semi-enclosed basin is adjacent to the western Pacific Ocean (WPO) on the east side and the southern end of the Taiwan Strait on the west side. The part of the seamount closest to the surface is at a depth of approximately 50 m [1]. The bay does not have a clear continental shelf on its west side, but it has a 4 km wide shelf on its east side. Between the seamount to the south and the landmass to the north, the terrain is deep, and this depth extends toward the two capes, forming an open-ended, arc-shaped channel.
The movement of water masses in Nan Wan Bay is primarily governed by robust tidal forces, including diurnal and semidiurnal tides, and is additionally influenced by seasonal monsoons [3,4]. In the offshore parts of Nan Wan Bay, during ebb tides, tidal currents typically flow eastward from the southern end of the Taiwan Strait to the western Pacific Ocean through the bay; conversely, they flow westward during flood tides. The tidal range peaks at about 1.6 m during spring tides but decreases to approximately 0.6 m during neap tides. Diurnal and semidiurnal tides have nearly equal energy [1]. Locally, tidal currents are swift, especially outside the bay. During ebb spring tides, the speed of tidal currents can reach up to 1.7 m/s in and around the bay, especially around MBT, where it has been observed to exceed 2 m/s [1]. In the continental shelf on the eastern half of the bay, circulation is relatively straightforward during neap tides, typically following the isobaths. However, during flood spring tides, the circulation pattern is more complex due to the appearance of anticyclonic eddies. On the western side of the bay, cyclonic eddies are easily generated in the flow field during ebb tides, irrespective of whether they are spring or neap tides.
Choi and Wilkin [5] confirmed that thermal plumes, which are characteristic of regions in which the density of water on the surface is low, generally disperse in response to wind forcings [6]. In winter, northeasterly monsoons usually blow from mid-September to April, peaking in December. Winter monsoons over the local mountain blow down toward the sea surface from the mountaintop. The seaward winds, locally known as downhill winds, become very intense and often lead to the destratification of the water column. The mixing layer’s thickness increases from 30 m in summer to 100 m in winter. Summer monsoons, which are much weaker than winter monsoons, last from July to August. In addition, the sea surface temperature (SST) in Nan Wan Bay is typically in the range of 22–26 °C in winter but 24–29 °C in summer [1].
Almost without exception, nuclear power plants are always built near a coast or lake because a large amount of seawater is required to cool the reactors of these plants. Seawater is circulated through a nuclear reactor to transfer or remove heat, and the output of this process is thermal waste seawater. This seawater is frequently drained through a long diversion dike into an area near the shore, such as into a bay or an estuary [3,7]. The Third Nuclear Power Plant (NP_No. 3) of Taiwan is situated in the inner reaches of Nan Wan Bay, as shown in Figure 1. Through a long diversion dike, considerable thermal seawater (also known as thermal pollution) is discharged into the bay on the east side of MBT. Thermal wastewater, which is less dense than seawater, typically floats on the sea surface layer and flows back and forth due to tidal currents. The fate of a thermal plume’s dispersal depends on the strength and direction of tidal currents, which features a fortnightly spring–neap cycle. As previously mentioned, the presence of eddies, particularly during spring tides, results in the higher complexity of a flow field.
Hessner et al. [8] investigated the Rhine outflow plume around the river mouth using 41 synthetic aperture radar (SAR) images and a numerical model. They highlighted that the pattern and locations of the interface outcropping lines near the river mouth are primarily controlled by semidiurnal tides. Additionally, they thought that the factors related to tidal residual currents and river discharge that contribute to the Rhine River plume were of secondary importance. Additionally, by applying different tidal dynamics to distinguish seawater stratification in terms of temporal and spatial features, both regions of strong tidal currents and weak tidal currents were investigated by Huang et al. [9]. These authors pointed out that thermal plume dispersion from a local power plant affects the area within 3 km around the outlet, and stratification occurs most significantly at 0.5 km–1.0 km from the outlet, where tidal currents are strong. Wei et al. [10] employed a neural network combined with prior location knowledge to categorize the thermal plume types from 66 nuclear power plants worldwide. Their study indicated that surface plumes larger than 4 km2 occur frequently in the Great Lakes, whereas smaller surface thermal plumes of less than 1 km2 occur primarily in estuaries. In addition, employing a numerical model (OGCM) in their study, Lin et al. [11] reported that winds, tides, and river forcing mainly dominate the behavior of small-scale plumes from the Ying-Yang Bay. In contrast to large-scale plumes, where wind-induced dispersal is primarily driven by Ekman drifts [6,12], small-scale plumes tend to disperse in the windward direction. One exception is when a landward wind compresses plume water toward the shore, leading to its dispersal influenced by tidal advection and density forcing. Lin et al.’s [13] study also highlighted that alongshore tides generate recirculation eddies within the bay during flood and ebb tides. These eddies cause plume movements within the bay that are out of phase with the tidal currents over the shelf. The advection is rather asymmetric to the bay’s axis due to the earth’s rotation. Ho et al. [14] emphasized that regardless of whether flood or ebb tidal currents are suppressed by strong Asian monsoons, this mechanism helps to prevent the contamination of the harbor’s water quality during northeasterly winds. In contrast, the southwesterly monsoon drives the geostrophic current northward along the coast. Simultaneously, the coastal sea level rises, creating a surface isobar slope up toward the coast, which generates a secondary flow to enhance alongshore geostrophic currents. The northward geostrophic currents deflect the plumes shoreward, resulting in the formation of a relatively narrow-band plume.
In addition to being breeding grounds for countless species of marine life and habitats, coral reefs are very important ecosystems. The coral reefs in Nan Wan Bay are among the most beautiful marine landscapes in Taiwan; they not only provide a breeding ground for marine animals, forming an ecosystem with considerable biodiversity, but also attract many tourists wishing to appreciate and explore this ecosystem. However, the dispersal of the thermal plume from NP_No. 3 conceivably affects the growth and status of this coral reef ecosystem within its vicinity [15]. Therefore, the objective of the present work is focused on describing the behavior of thermal plume dispersion from NP_No. 3 during spring tides in summer and winter. Since the speed and direction of the local flow fields in Nan Wan Bay change with time, measured data cannot fully capture the comprehensive outline of the thermal plume distribution. Indeed, it is difficult to measure a thermal plume’s location at any given time point when relying solely on CTD samplings and satellite images. Hence, we adopt a numerical model to simulate the flow, temperature, and salinity field of Nan Wan Bay and compare the model results with satellite images. If successfully developed and applied, the circulation model can be used to simulate and evaluate the plume behaviors of thermal wastewater from the NP_No.3. A more detailed description of the model formulation is presented below. The historical data used in this study, including ADCP flow fields, hydrographic data, and other relevant materials, are detailed in Section 2. The model configuration is introduced in Section 3. Section 4 presents the model results, while Section 5 compares these results with observational data. Following that, Section 6 also discusses the findings and makes conclusions.

2. Observed Data

2.1. Hydrographic Data

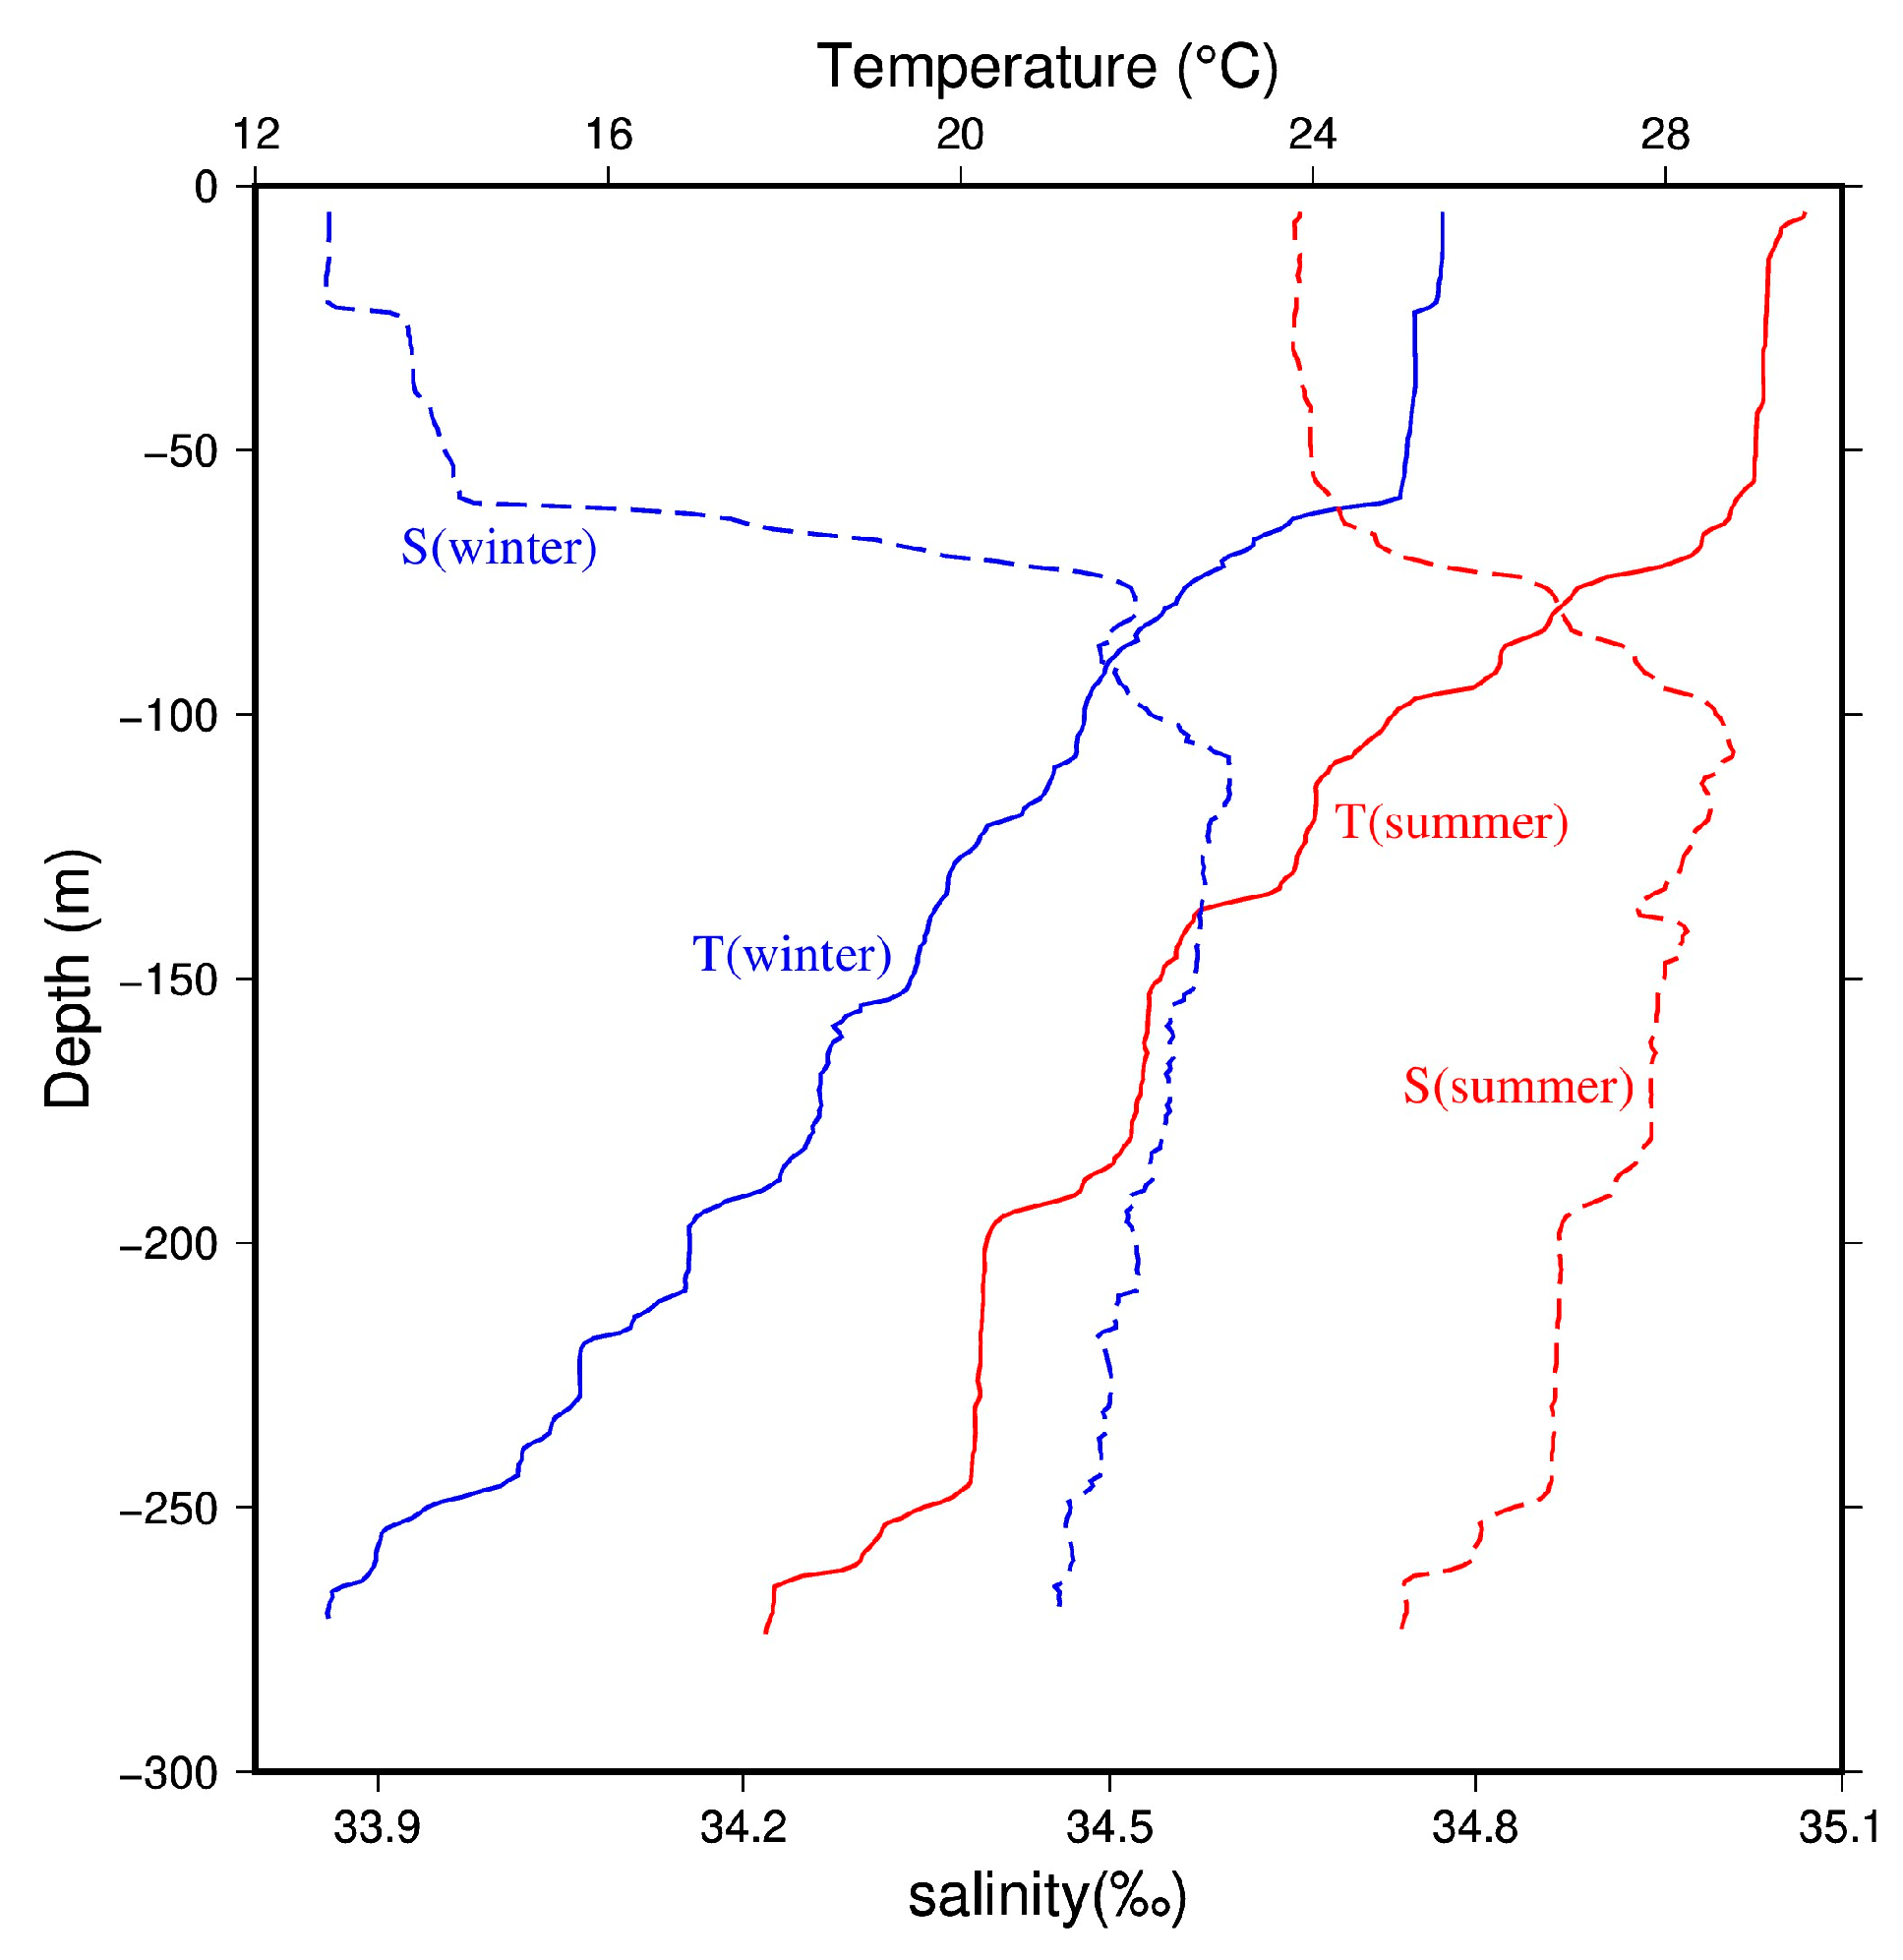
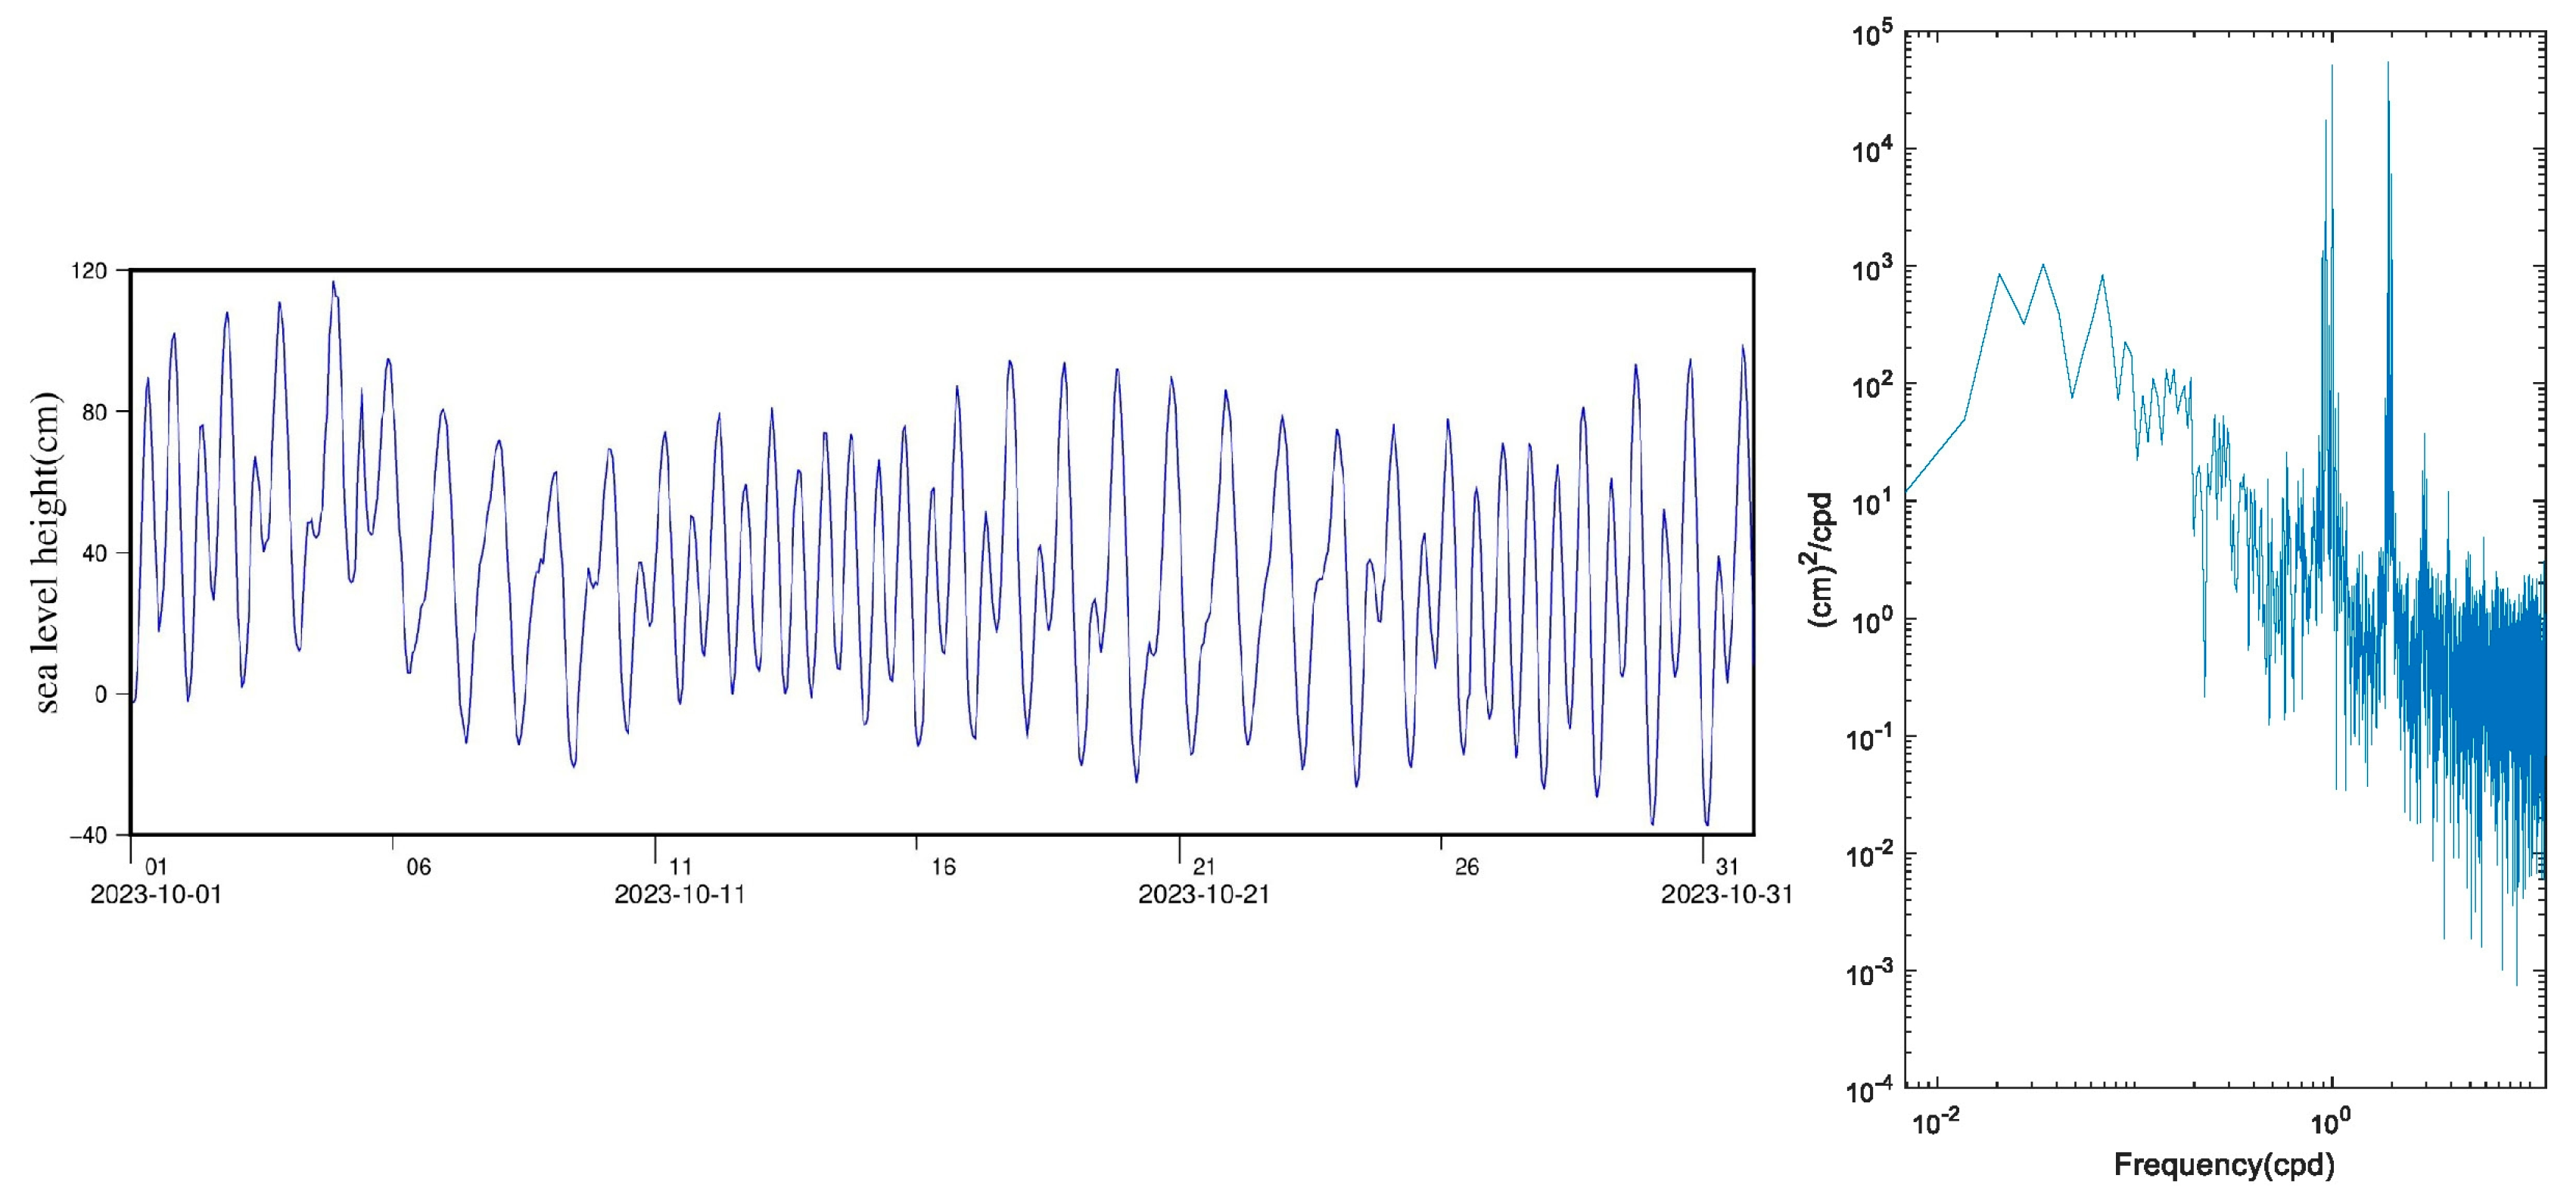
According to the bulk of historical data, strong tidal currents dominate the water circulation of Nan Wan Bay. Figure 2 (left panel) shows selected sea level variations measured at Houbihu Harbor (HBH) from 1 to 31 October 2023, with a pronounced spring–neap cycle. The tidal ranges can reach up to 1.4 m during spring tides but drop to approximately 0.8 m during neap tides. During spring tides, the flood tide lasts longer than the ebb because of the similar long-standing wave with a small drop between the lower high water and the higher high water. Figure 2 (right panel) presents a power spectrum of the sea level height measured at a station at HBH; the spectrum contains two peaks corresponding to diurnal and semidiurnal tides. The relative spectral energies of these peaks are almost equal. As depicted in Figure 2, other frequency spectral energies can be neglected, except for diurnal and semidiurnal peaks. Figure 3 displays the typical temperature and salinity profiles for Nan Wan Bay based on data measured on 11 August 2015 (at 121.8183° E, 21.807° N) and on 5 December 2012 (at 120.6833° E, 21.9662° N), respectively. In summer, the temperature of the surface mixing layer above 50 m reaches 28–29 °C, and starting from the top of the thermocline layer at approximately 50 m in depth, the temperature gradually decreases with increasing depth. Similarly, in winter, the temperature of the surface mixing layer reaches 25–26 °C and decreases with increasing depth, starting from approximately 50 m in depth. As indicated in Figure 3, the salinity profiles in the summer and winter are different. In winter, the surface layer salinity is low and approaches a constant value of 33.86‰ throughout the water column with a depth of 0–20 m. However, in summer, the salinity level remains at approximately 34.6‰ in the mixing layer, and even in deep water, the salinity level remains different.

2.2. Seasonal Monsoons

Besides the strong tidal currents that govern water mass motion in Nan Wan Bay, climatological wind stresses are a secondary force influencing circulation. Monsoons generally modulate the winds in and around Nan Wan Bay. Theoretically, summer monsoons blow gentle southwest winds. Their prevailing period, which is from July to mid-September, is much shorter than the winter monsoon period, during which strong northeast winds prevail until April of the following year, with a peak in January.
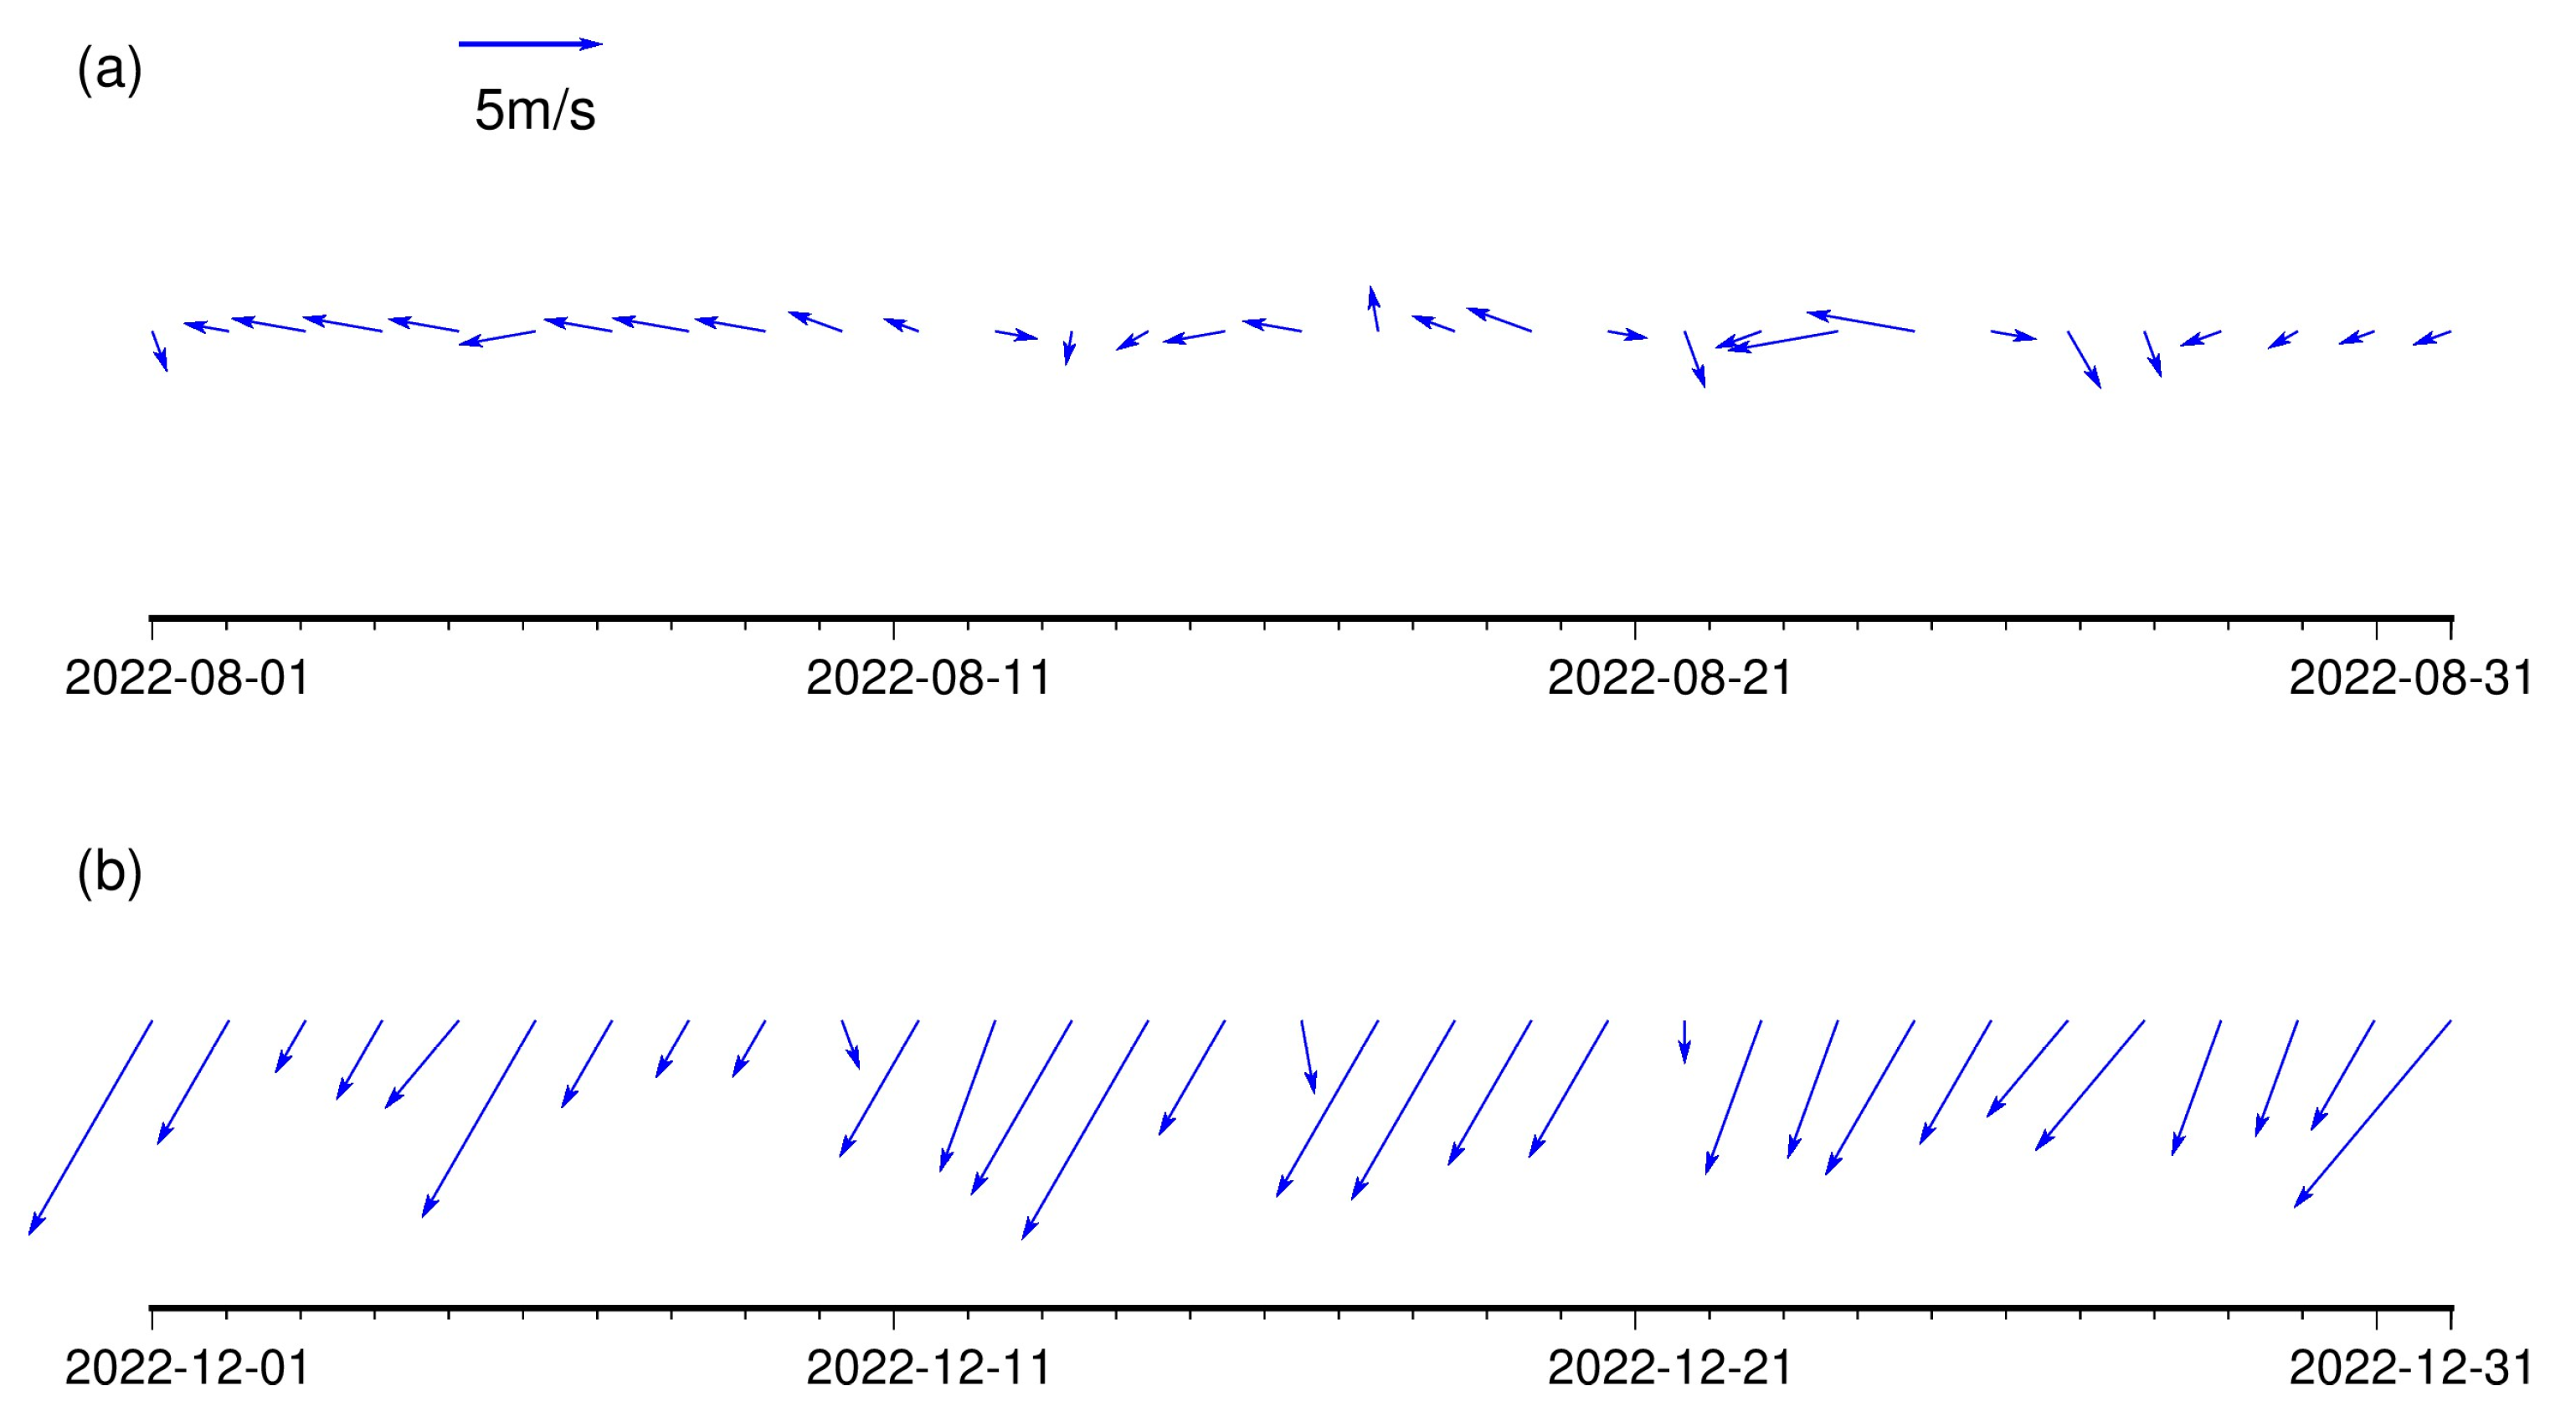
Figure 4 presents stick diagrams of climatological winds measured in August and December 2022 at the Hengchun weather station of Taiwan’s Central Weather Administration (CWA). As shown in Figure 4a, the average wind speed was approximately 3 m/s in summer, and the wind blew mainly from the southeast–east direction; however, it sometimes blew in the northwest direction for a short period. By contrast, the winds over Nan Wan Bay were expected to have originated from the southwesterly monsoon. A possible cause for this phenomenon is that the mountain surrounding the bay modified the wind direction because these winds were weak. Conversely, in December 2022 (Figure 4b), strong winds that originated from the northeasterly monsoon prevailed, intensifying to a wind speed greater than 10 m/s.

2.3. Overall Flow Fields

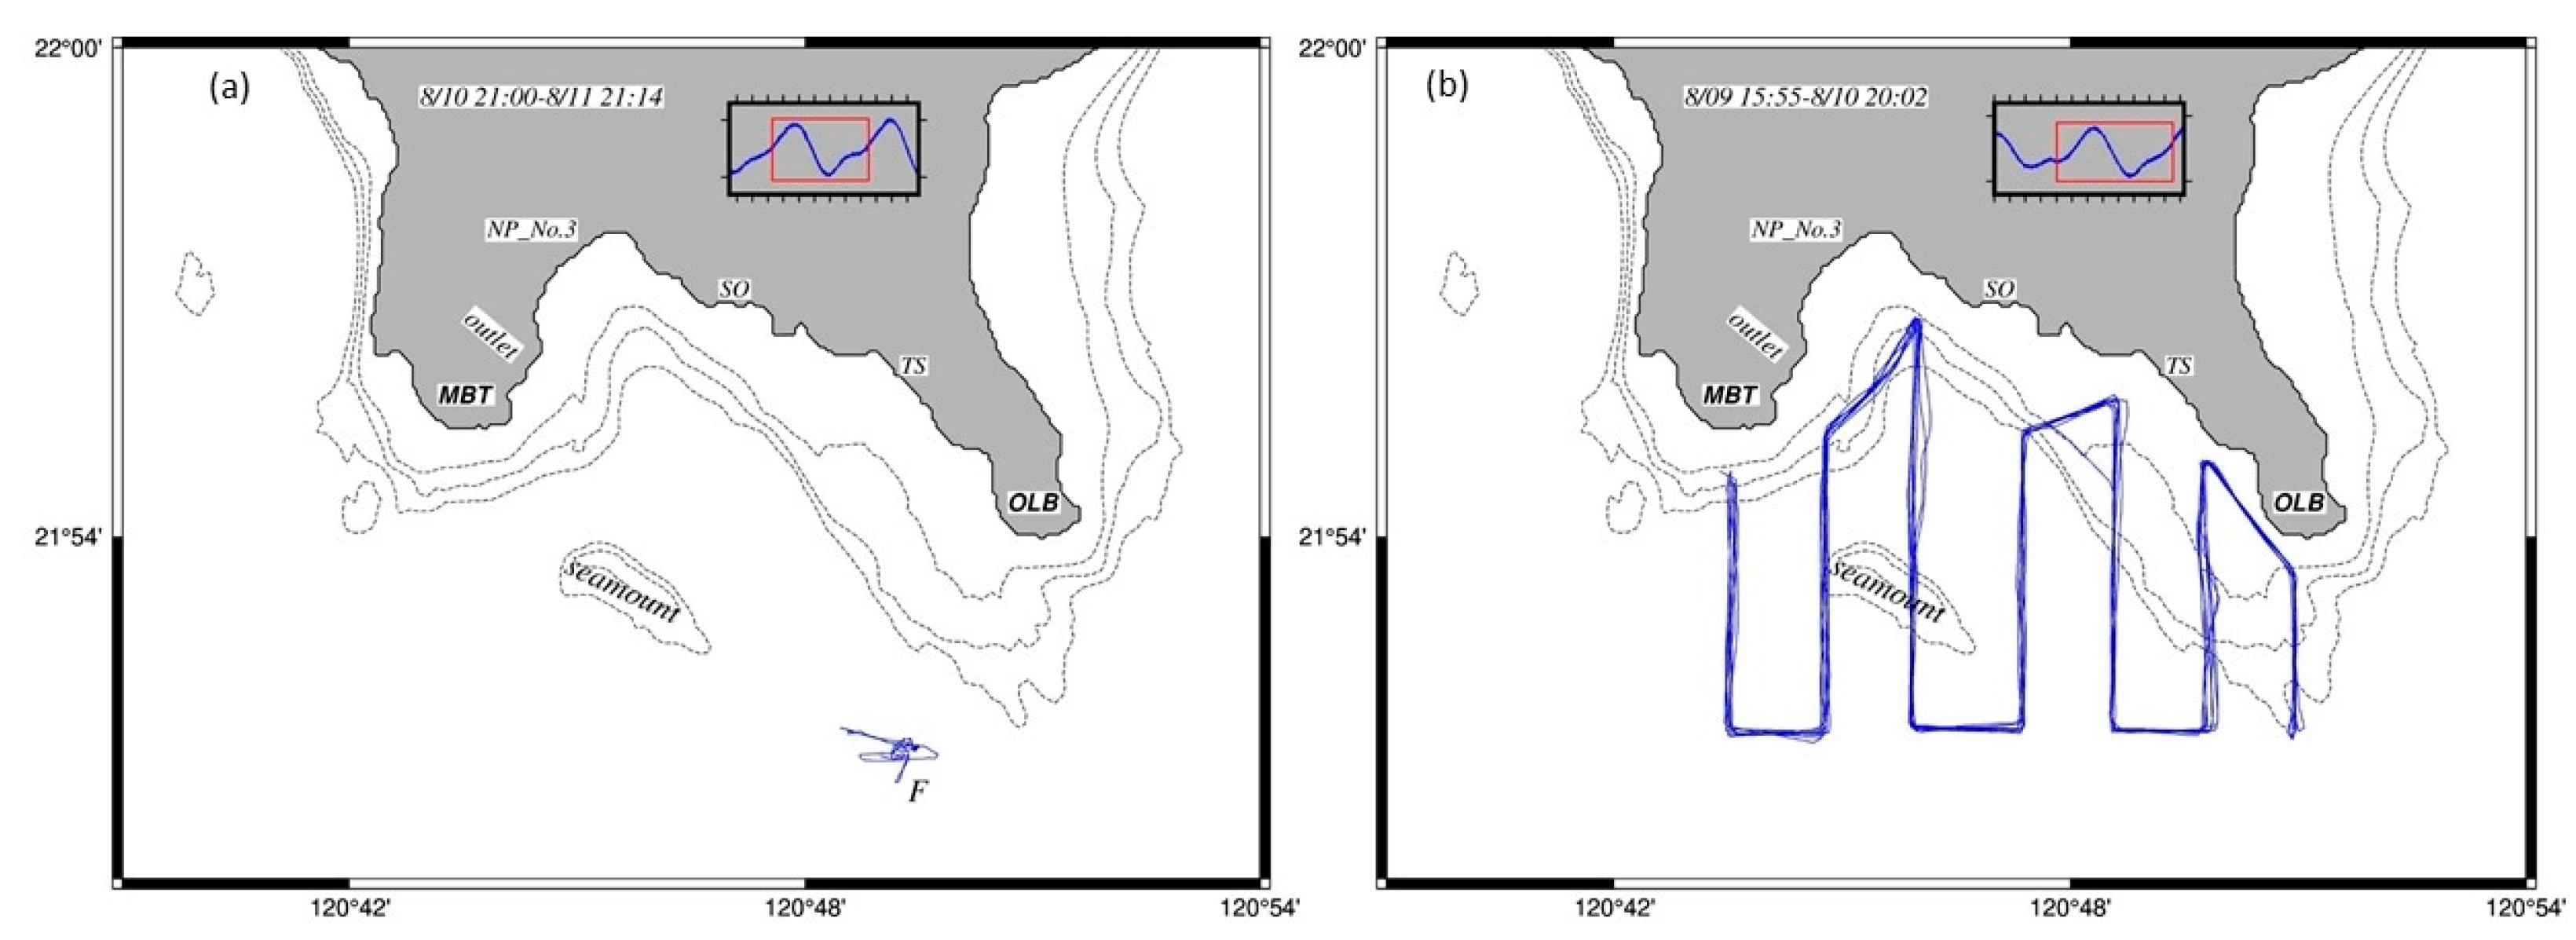
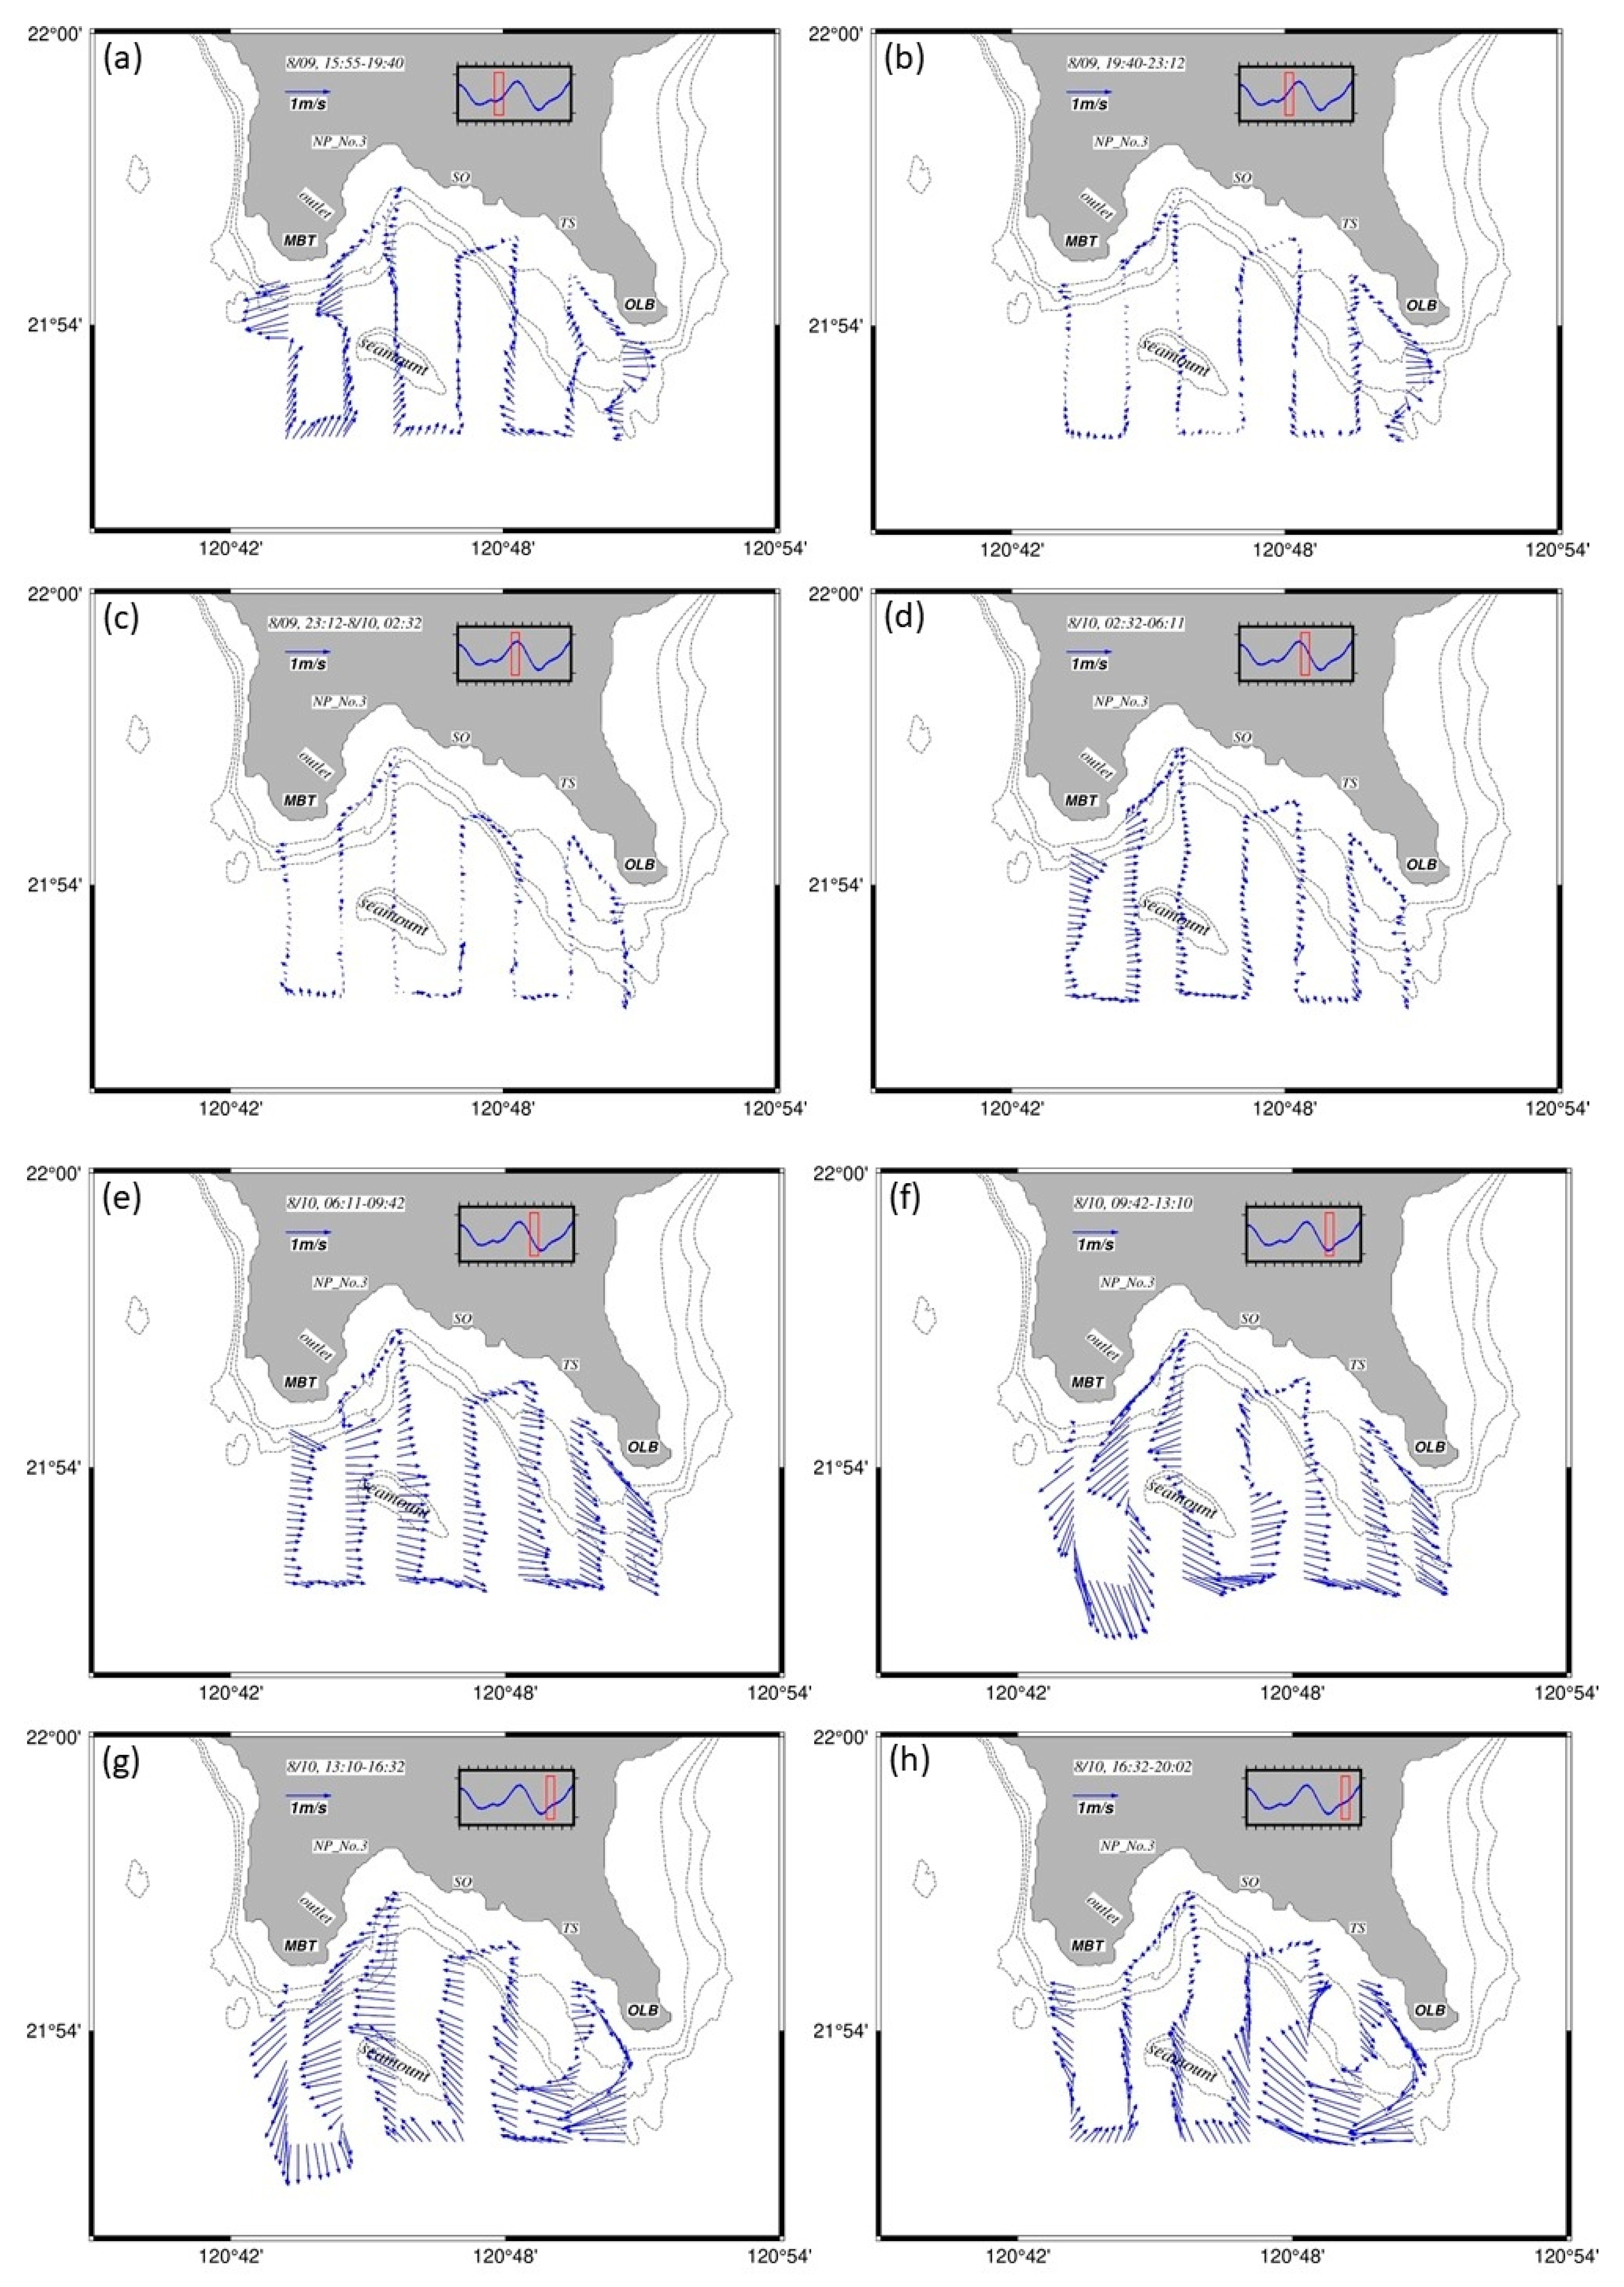
To understand the comprehensive flow patterns in and around Nan Wan Bay, this study analyzed data collected by an ocean research vessel during fixed-site observations and following a surveying route. Figure 5 illustrates the path of the survey conducted by the R/V Ocean Researcher III on 9–11 August 2004; the current study conducted a reanalysis of historical shipboard ADCP (Acoustic Doppler Current Profiler) data obtained at a fixed site (labeled F in Figure 5a) and along a repeated survey trajectory (Figure 5b). The small insets of the two panels in the figure indicate the corresponding observed phase of local tides. The stick diagram for the data obtained at the fixed site F is shown in Figure 6 and indicates the velocity and directions of a fixed point in the flood–ebb tidal cycle for the period from 21:00 on 10 August to 21:14 on 11 August 2004. The sea level variation occurring from the flood tide to the higher high water indicates that the currents flowed northwestward at a speed of approximately 0.5 m/s over the aforementioned period. After the peak following the ebb tides, the ebb tidal currents flowed southeastward, and the speed of the currents increased to greater than 1 m/s. The currents maintained a roughly similar direction to the southeast until the lower high water was approached, at which point the currents slowed. Then, after 14:00 on 11 August 2004, the tidal currents changed direction back to approximately northwest or southwest. To ensure that as many of the synoptic features as possible are retained, tidal current patterns obtained from the eight tracks of the trajectory are presented; each track was obtained over a period of approximately 3.3–3.7 h, from 15:55 on 9 August to 20:02 on 10 August 2004, as shown in Figure 5b. Figure 7 presents the tidal flow fields at a depth of 10.4 m in the eight tracks. The red rectangle shown in the inset of each panel in Figure 7 indicates the period of the tidal phase during which the track was performed. Figure 7a–c show the tidal flow patterns from lower high water to higher high water. As indicated in Figure 7a, the currents off the outer mouth of MBT flowed west–southwestward, whereas the currents off the south of OLB moved eastward; the currents in and around the bay were sluggish, with an average speed of less than 0.05 m/s. The flow pattern shown in Figure 7b,c resembles that shown in Figure 7a but with a notable difference in the strength of the flows; the flows presented in Figure 7b,c are much weaker than those in Figure 7a. Over the slack water of the higher high water, the ebb tidal currents launched and began to flow eastward, with the currents being particularly prevalent off MBT, as shown in Figure 7d. Figure 7e displays the entire ebb flow field in and around the bay and indicates strong easterly currents with a speed greater than 1 m/s. With the exception of those in the most eastward flow pattern, the currents in the inner reaches around MBT exhibited a tendency of being cyclonic eddies in the phase period. As indicated in Figure 7f, the flow pattern outside the bay exhibited typical flows similar to those presented in Figure 7e, but a sizeable cyclonic eddy also circulated the seamount. Meanwhile, the flows were quite strong, irrespective of whether they were a typical ebb flow or a circulating cyclonic eddy. After passing the slack water of the lower low water, the flow pattern rapidly changed direction from eastward to westward and reached a high velocity, and an anticyclonic eddy formed on the southwest side of OLB, as illustrated in Figure 7g. Figure 7h shows that an energetic anticyclonic eddy circulated over the continental shelf and the deeper reaches on the southwest side of OLB. In this phase, a well-defined anticyclonic eddy emerged in the region and exhibited a robust circulating speed in excess of 1.32 m/s.

2.4. Satellite Images

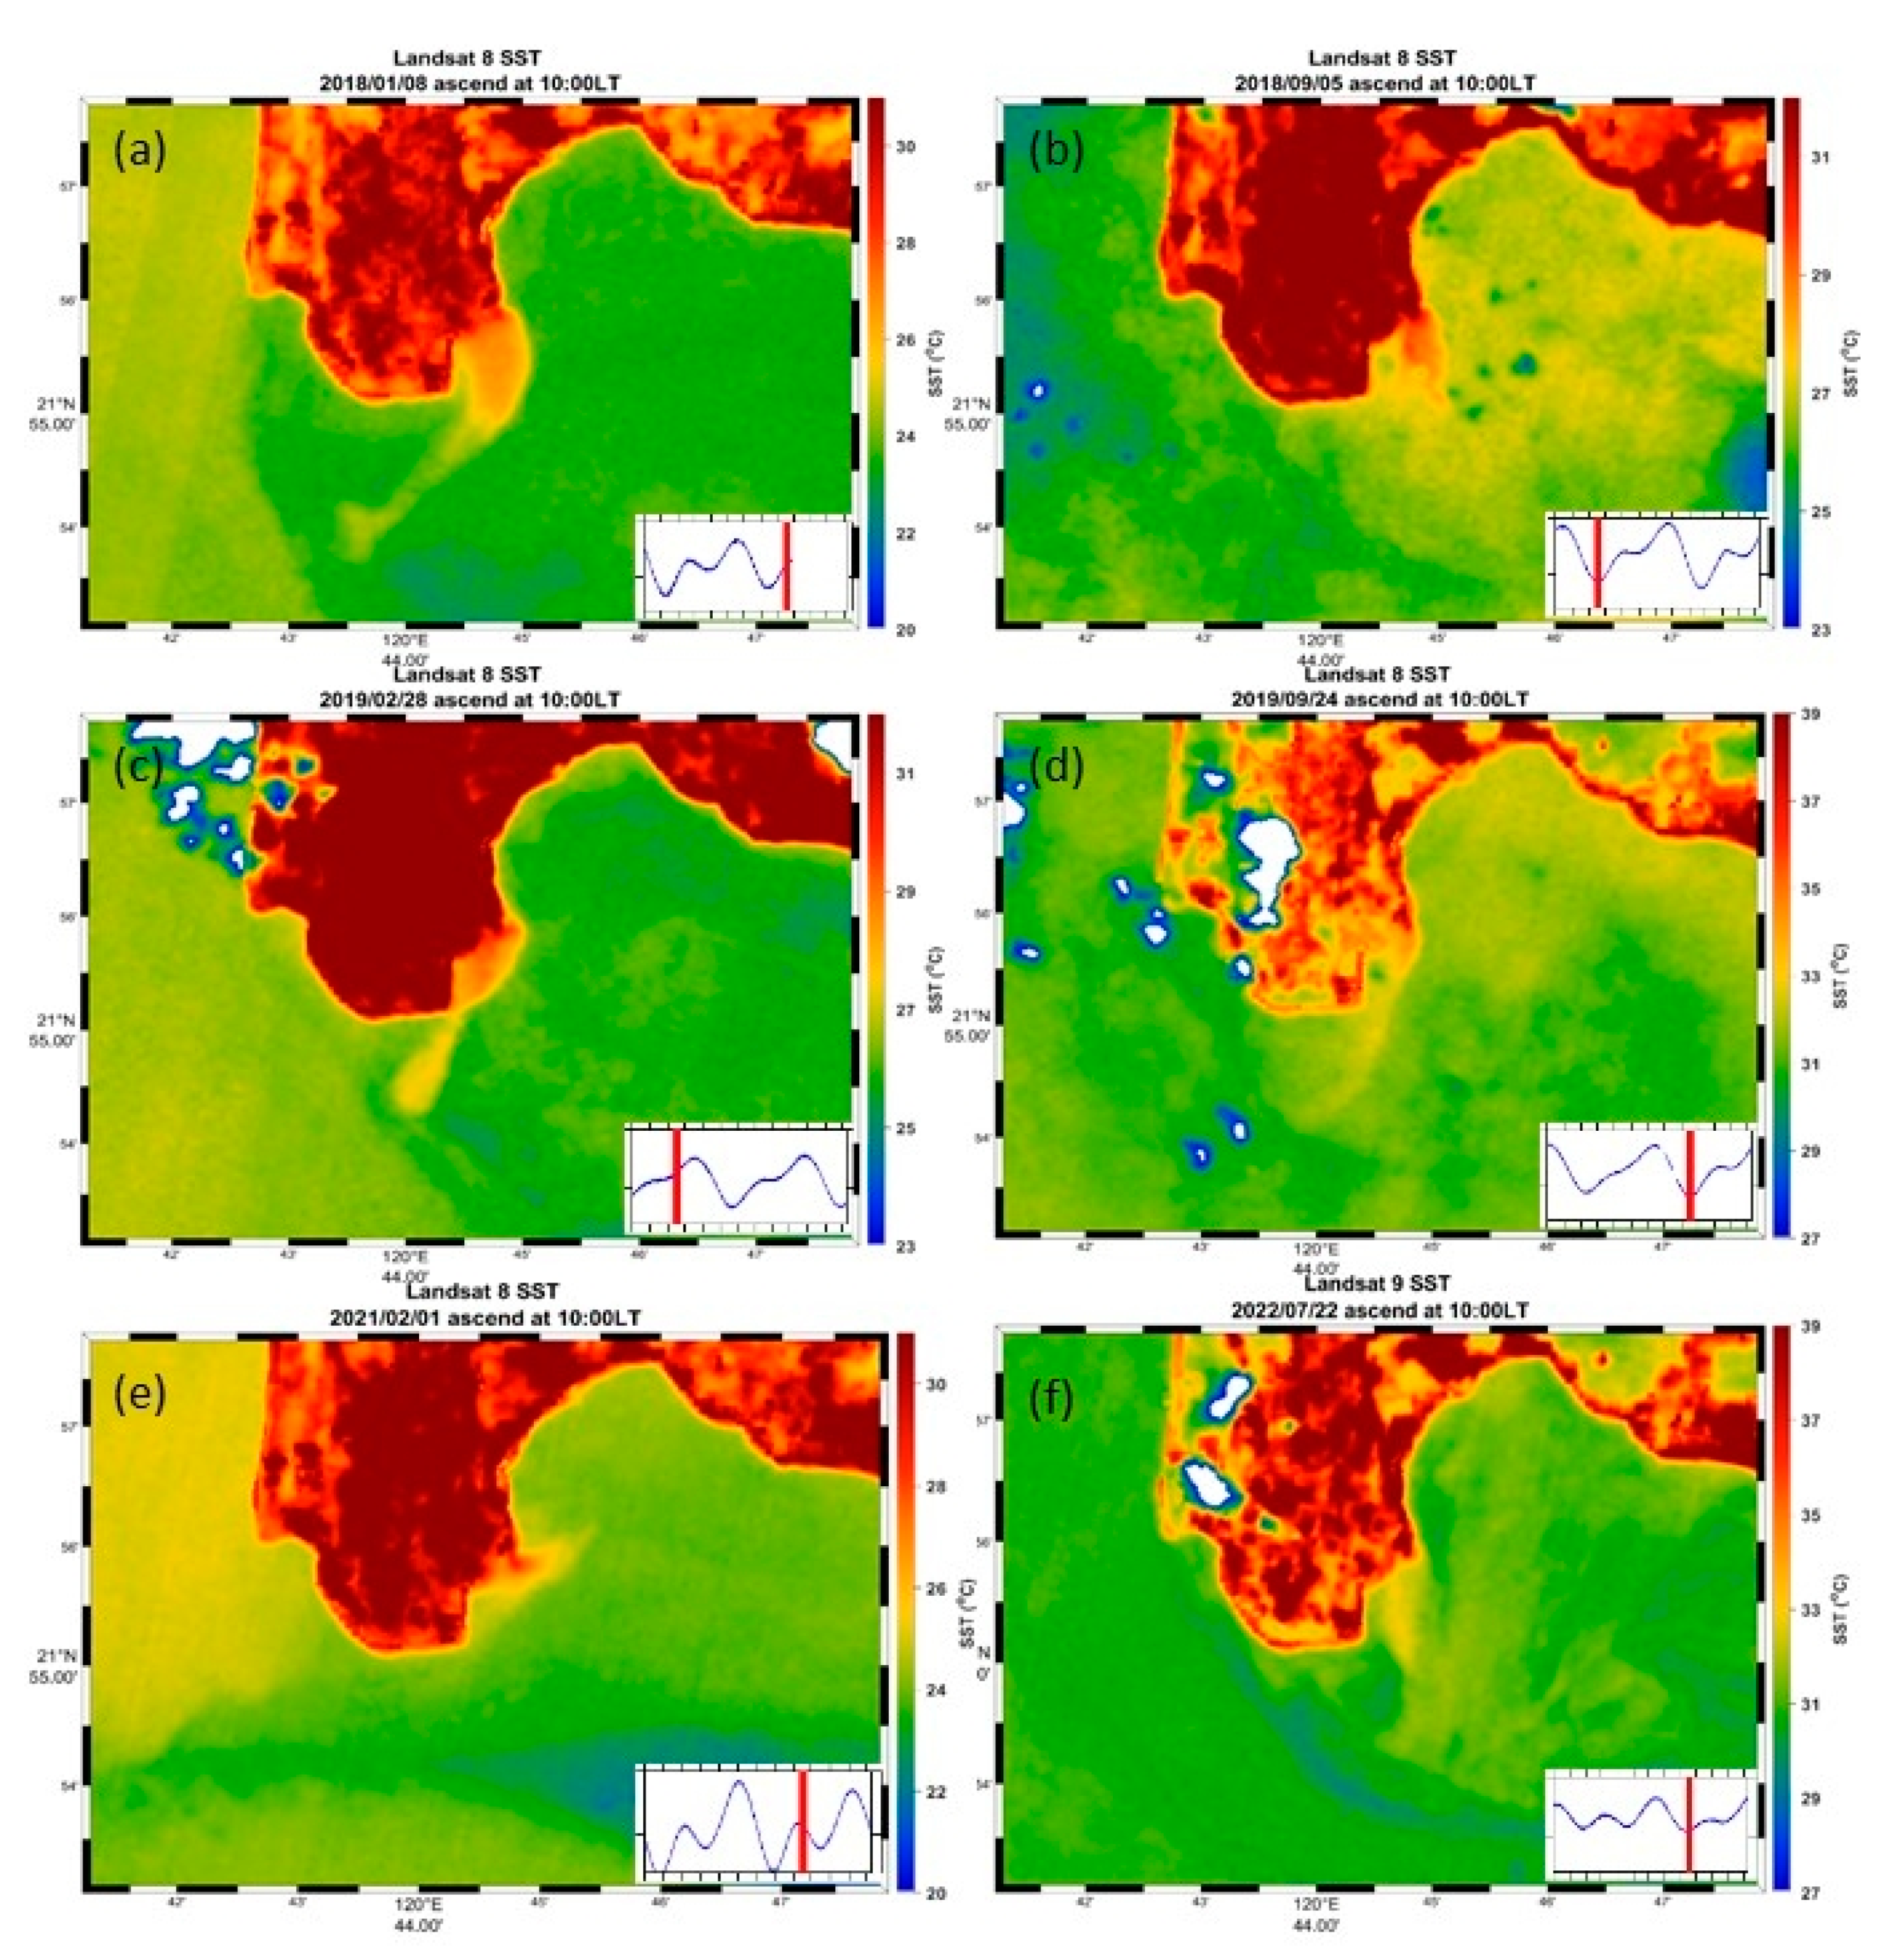
A comprehensive approach was employed to assess the range of impacts of thermal wastewater discharged from the Third Nuclear Power Plant on the nearby ecosystem. Landsat 8 satellite images for the period of 2018–2022 were used to analyze the patterns of plume dispersion. The Landsat 8 satellite payload contains an Operational Land Imager (OLI) and a Thermal Infrared Sensor (TIRS). The size of the scenes captured by Landsat 8 is 185 km × 180 km, and the images employed in this study were acquired at approximately 10:00 AM local time. The spatial resolutions are 30 m and 100 m for the visible and thermal bands, respectively. Hence, Landsat 8 has sufficient scene coverage and spatial resolutions to enable an investigation of the thermal plume discharge from the Third Nuclear Power Plant. Figure 8 displays the SST fields around the western side of Nan Wan Bay, with snapshots selected at specific instances. Figure 8a indicates that the thermal plume from the outlet of the NP_No.3 does not flow directly to the southeast, which is the direction of the diversion dike. Instead, the thermal plume follows the eastern side of MBT and flows along the western coast of the bay to the south as the plume approaches the lower high water. A part filament of the thermal plume leaves the MBT coast and enters the nearshore sea area. During the phase of the lower low water, the NP_No.3 thermal plume directly streams to the south, and the thermal plume front seems to be rapidly advected and diluted (Figure 8b), indicating that the plume disperses within a small area before disappearing. Over the slack water of the higher low water (Figure 8c), the plume exhibits a behavior similar to that depicted in Figure 8a. However, it seems to more closely adhere to the MBT coast and leaves the cape toward the south–southwest direction. While the phase stays in the lower low water slack, as illustrated in the inset and the main part of Figure 8d, the thermal plume swifts to the south and becomes a narrow-band filament that is advected to the offshore region. Accordingly, during the phase between higher high water and lower low water, the flow field in the bay prevails over the ebb tidal currents and can easily cause the formation of a cyclonic eddy. In Figure 8e, the thermal plume immediately turns to the northeast when it leaves the outlet. As a result, the thermal plume’s behavior is affected by the advection of an anticyclonic eddy, leading to the plume flowing northeastward. Except for Figure 8f, satellite images were all captured during spring tides. In Figure 8f, the thermal plume also disperses to the south of MBT from the outlet.

3. Model Description and Setups

3.1. Model Description

We employed the well-known MITgcm (Massachusetts Institute of Technology General Circulation Model), which was designed to explore a wide range of oceanic and atmospheric phenomena from a small scale of meters in an ocean to a large scale of thousands of kilometers for a global issue. This numerical model solves the three-dimensional momentum, temperature, salinity, and continuity equations under Boussinesq and hydrostatic (or non-hydrostatic) approximations. The governing equations are as follows [16].
D v h D t + ( 2 Ω × v ) h + h = F h
D r ˙ D t + k ^ · ( 2 Ω × v ) + r + b = F r ˙
h v h + r ˙ r = 0
D θ D t = Q θ
D S D t = Q s
and D D t = t + v is a nonlinear operator.
In these equations, t is time; v and r ˙ are the velocities in the horizontal and vertical directions, respectively; r is the vertical coordinate; Ω is the earth’s rotation; b is buoyancy; θ is the potential temperature; S is salinity; F is the forcing and dissipation of v ; Q s is the forcing and dissipation of S; and Q θ is the forcing and dissipation of θ .
More details about the model formulation are provided in its documentation at https://mitgcm.readthedocs.io/en/ (accessed on 13 September 2023).
The MITgcm is a time-marching ocean circulation model with non-hydrostatic capabilities and is suitable for studying a wide range of phenomena [16,17,18]. The current study used the MITgcm to examine and predict the dispersal of the thermal plume from the Third Nuclear Power Plant in Nan Wan Bay. Under Boussinesq and hydrostatic approximations, the model solves the equations for three-dimensional momentum, temperature, salinity, and continuity. The study area of the present work ranges from 120.5° to 121.05° in longitude and from 21.8° to 22° in latitude (Figure 1), with a horizontal resolution of 200 m, indicating that the horizontal grid size (i.e., Δ x or Δ y ) equals 200 m. For the vertical direction’s resolution, 35 layers are adopted in the model, and each layer’s thickness corresponds to that in the U.S. Navy’s Global Hybrid Coordinate Model (HYCOM; more details regarding the model formulation are provided at https://www.hycom.org/, accessed on 17 May 2023). In this study, a Cartesian Coordinate System was adopted, resulting in a total of 875,000 grids (250 × 100 × 35) arranged in the x-axis, y-axis, and z-axis directions. The topographic data presented in Figure 1 were obtained from the Ocean Data Bank (ODB) of the Nation Science and Technology Council (NSTC) of Taiwan and privately collected through the use of a fishing boat.

3.2. Boundary and Initial Conditions

During a flood tide period in the study area, a tidal wave propagates from the western Pacific Ocean to Taiwan, and after impacting the landmass, it separates into two flood tidal waves. The southward wave runs along the southeastern coast of Taiwan, goes around OLB into Nan Wan Bay, and passes MBT to head toward the Taiwan Strait. Conversely, the ebb tidal wave propagates from the Taiwan Strait into Nan Wan Bay and flows northward into the western Pacific Ocean during the prevailing ebb tides. Hence, for the model’s open boundaries, tidal currents were set to flow in and out freely at only the northern boundary. During flood tides, the tidal currents flow perpendicular to the northeastern open boundary into the model domain and flow perpendicularly out of the model domain from the northwestern open boundary. Parallel to the northern open boundary, the tangential component velocities were fixed at zero. The remaining open boundary conditions—including those for the eastern, southern, and western boundaries—are described below; we stipulated the conditions of no normal flow through all solid boundaries [6].
v n ^ = 0
where n ^ is a vector of unit normal to an arbitrary open boundary.
n ^ ( T , S ) = 0
where T and S are the temperature and salinity parallel to these boundaries, and their tangential velocities are set as indicated below.
v t n ^ = 0
The observed characteristic temperature and salinity profiles displayed in Figure 3 were adopted for all open boundaries and initial conditions. For the sea surface, no momentum, heat, or salt flux was input, but winds in the summer and winter were imposed. The mixing coefficient is 8 m2/s for the momentum equation and 0.8 m2/s for the temperature and salinity equations in the horizontal direction. Irrespective of whether dynamic momentum or thermohaline is being considered, the nonlocal K-Profile Parameterization (KPP) scheme is adopted to account for various unresolved mixing in the vertical direction [19]. Solid boundaries at the bottom are impermeable and impenetrable, where quadratic friction with a dimensionless drag coefficient of 0.0025 is adopted. More details about the model formulation are provided in its documentation (https://mitgcm.readthedocs.io/en/, accessed on 13 September 2023).

3.3. Tidal Driving Force

The initial model was of a motionless ocean; tidal currents were then imposed on the northeastern and northwestern boundaries. The oscillating tidal currents were transformed based on data from eight diurnal and semidiurnal tidal constituents (M2, S2, N2, K2, K1, O1, P1, and Q1) obtained from the NAO.99b data bank [20]. The transformation from sea level variations into oscillating tidal currents is described in more detail in [18]. Except for the driving forces on the northeastern and northwestern boundaries, summer and winter monsoons (Figure 4) were also imposed on the model sea surface for different seasons. To enable an analysis of the NP_No.3 thermal plume, the water flux through the diversion dike was specified as being 121.3 m3/s in summer and 61.2 m3/s in winter (https://cwms.ptepb.gov.tw/PUBLIC/RealTime/Get_AVGR.aspx, accessed on 10 April 2023). In addition to the water flux, the discharge temperature in the diversion dike was set to 36.4 °C and 34.2 °C for summer and winter, respectively. The released position of the thermal plume is located at the upstream boundary, approximately 5 grid spaces from the mouth of the diversion dike. To ensure that the temperature and salinity fields remained stable, restoration forcings were adopted for nudging these fields toward the initial hydrographic fields. The restoration rate for the temperature and salinity fields was set to 30 days (i.e., using the RBCS package). Starting from an initially motionless state in which there was no motion, the model was run for 1 month, with a time step of 18 s, throughout the entire course of the study. The model results from the final 10 days were sampled instantaneously for the discussion below, specifically during spring tides.

4. Numerical Model Results

4.1. Circulation and Upwelling Regions

Although the model simulated the fortnightly spring–neap cycles, the day-to-day flow field changes were highly visible. The quasicyclical stationary equilibrium on a daily time scale can be rapidly reached at approximately 2 days if the model is computationally stable. The results from the final 10 days in the simulation were sampled instantaneously for the discussion, with a focus on the results for the spring periods.
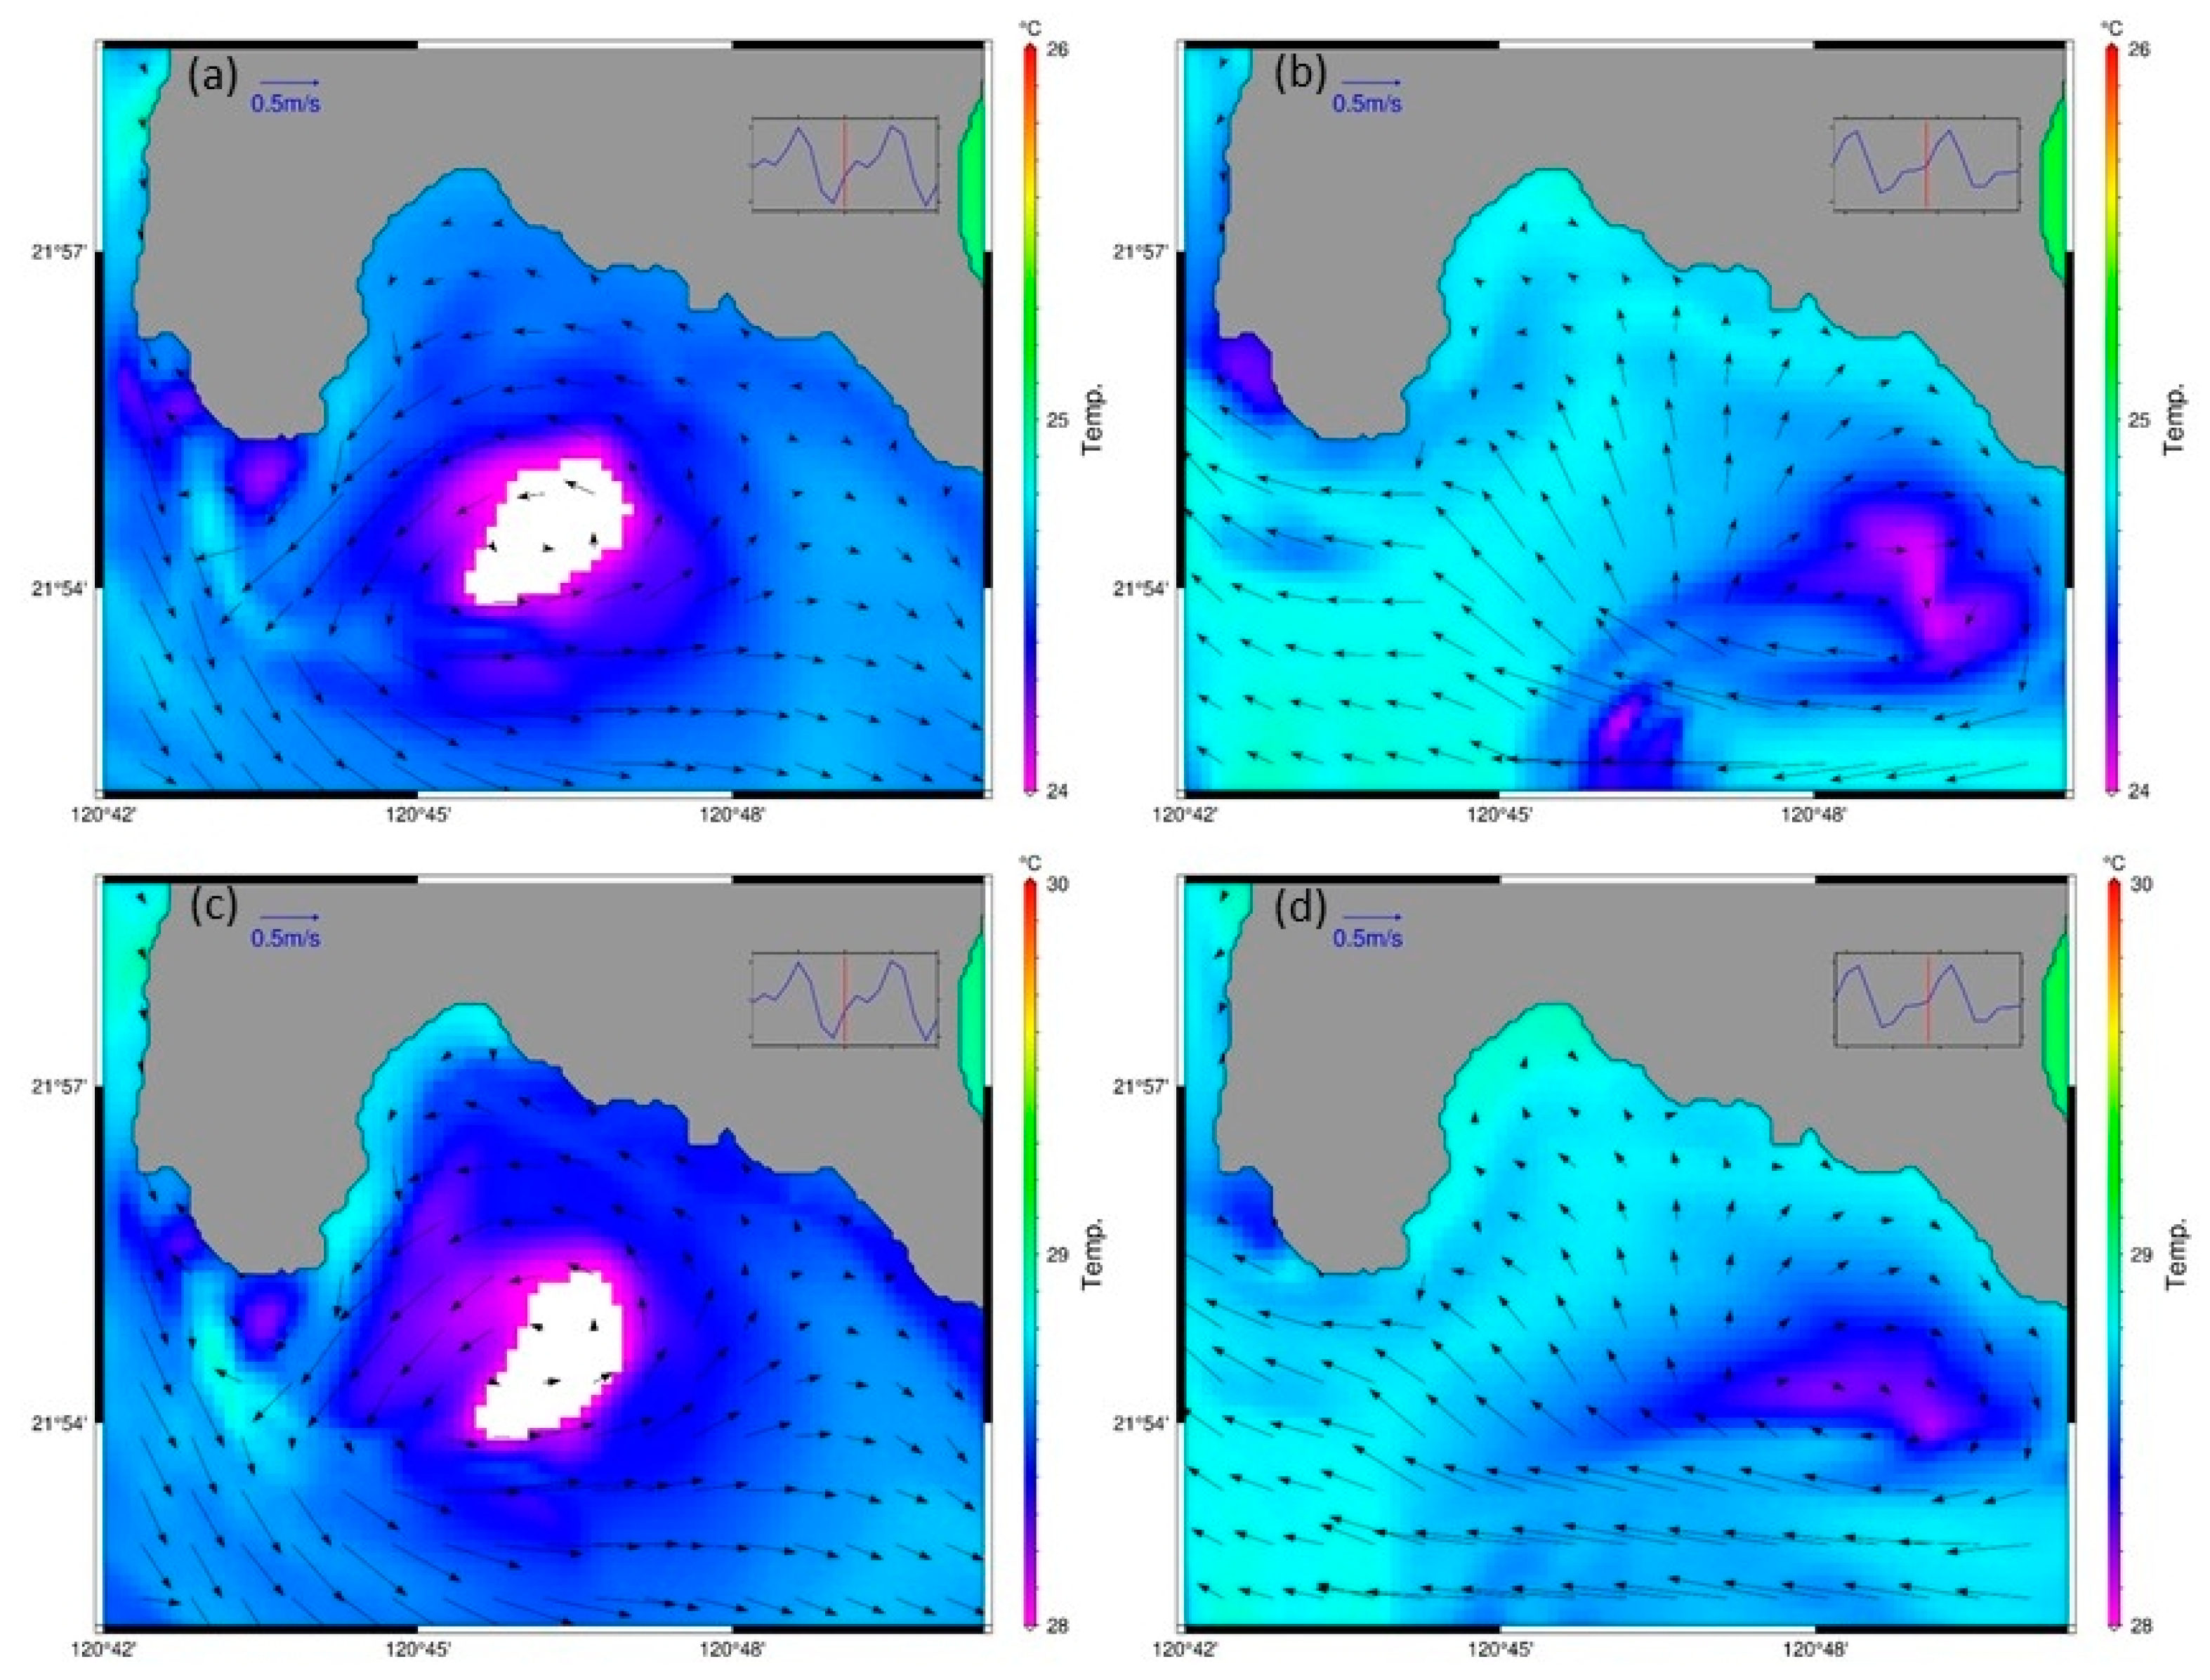
Figure 9 illustrates the model-produced surface circulation and temperature fields in summer and winter. In the winter, the prevailing ebb tidal currents from the southern end of the Taiwan Strait pass by MBT, i.e., from the northern open boundary on the western side of the model. Partial currents enter the bay to create a cyclonic eddy during the phase between the lower low water and lower high water stages (Figure 9a).
The ebb currents to the east of the eddy center flow northward onto the shelf, impact the shallow coast, and then separate into two sets of currents. One set of currents flows northwestward to complete the eddy circulation; the other set flows southeastward along the continental shelf, leaving Nan Wan Bay from OLB and then entering the Pacific Ocean. It is worth noting that the ebb tidal flow passing OLB also forms a robust cyclonic eddy to the east of OLB.
The ebb-tide cyclonic eddy in the western part of the bay induces the local upwelling of cold water around the eddy center. This temperature characteristic aligns with the historical data, as shown in Figure 9a. The cold water upwelling on the western side of the bay is visibly more robust than that on the east side of OLB. During flood tides in winter (Figure 9b), a westward flood tidal current from the northeastern offshore region of the Hengchun peninsula, which flows over the shallow bottom to the south of OLB, gains anticyclonic vorticity and then deflects into Nan Wan Bay. Some of the currents flow northward onto the continental shelf to form an anticyclonic eddy to the west of OLB during the phase beyond the lower high water phase. Cold water upwelling occurs around the anticyclonic eddy’s center but is much weaker than that occurring around the cyclonic eddy in the western side of the bay. Similar to what happens in winter, in summer, southeastward ebb currents from the southern end of the Taiwan Strait flow into the bay, while some of the currents flow northward into the bay, forming a cyclonic eddy during the phase of lower low water. Although the sea level is in the same phase as that in winter, the outlines of cyclonic eddies are slightly different, as is the strength, because of seasonal monsoon effects. The model-produced temperature drops around the centers of the cyclonic eddies decrease to a smaller degree than the temperature drops in winter, as illustrated in Figure 9c. Figure 9d presents a snapshot of the model-produced flow and temperature fields in summer during the period of higher low water. Because of the different monsoon effects, the feature shapes of the model-produced anticyclonic eddy shown in Figure 9d are distinguishable in winter and summer. Meanwhile, the anticyclonic-induced low-temperature anomaly in the eddy center is dispersed chiefly to the west, and the area over which it diffuses is smaller than the area in winter.
Many flow fields and temperature patterns in Nan Wan Bay are mentioned in the preceding paragraphs, irrespective of whether they were derived from observed data or numerical model results. The flood–ebb tidal currents generate a pair of counter-rotating eddies that modify how the thermal plume disperses off the outlet’s mouth. To quantify the model output, the model water temperature, defined as exceeding 29 °C in summer (25 °C in winter), was used to represent the NP_No.3 thermal plume source, as such temperatures are not naturally present in the ocean during these seasons.

4.2. Thermal Plume Dispersion in Summer

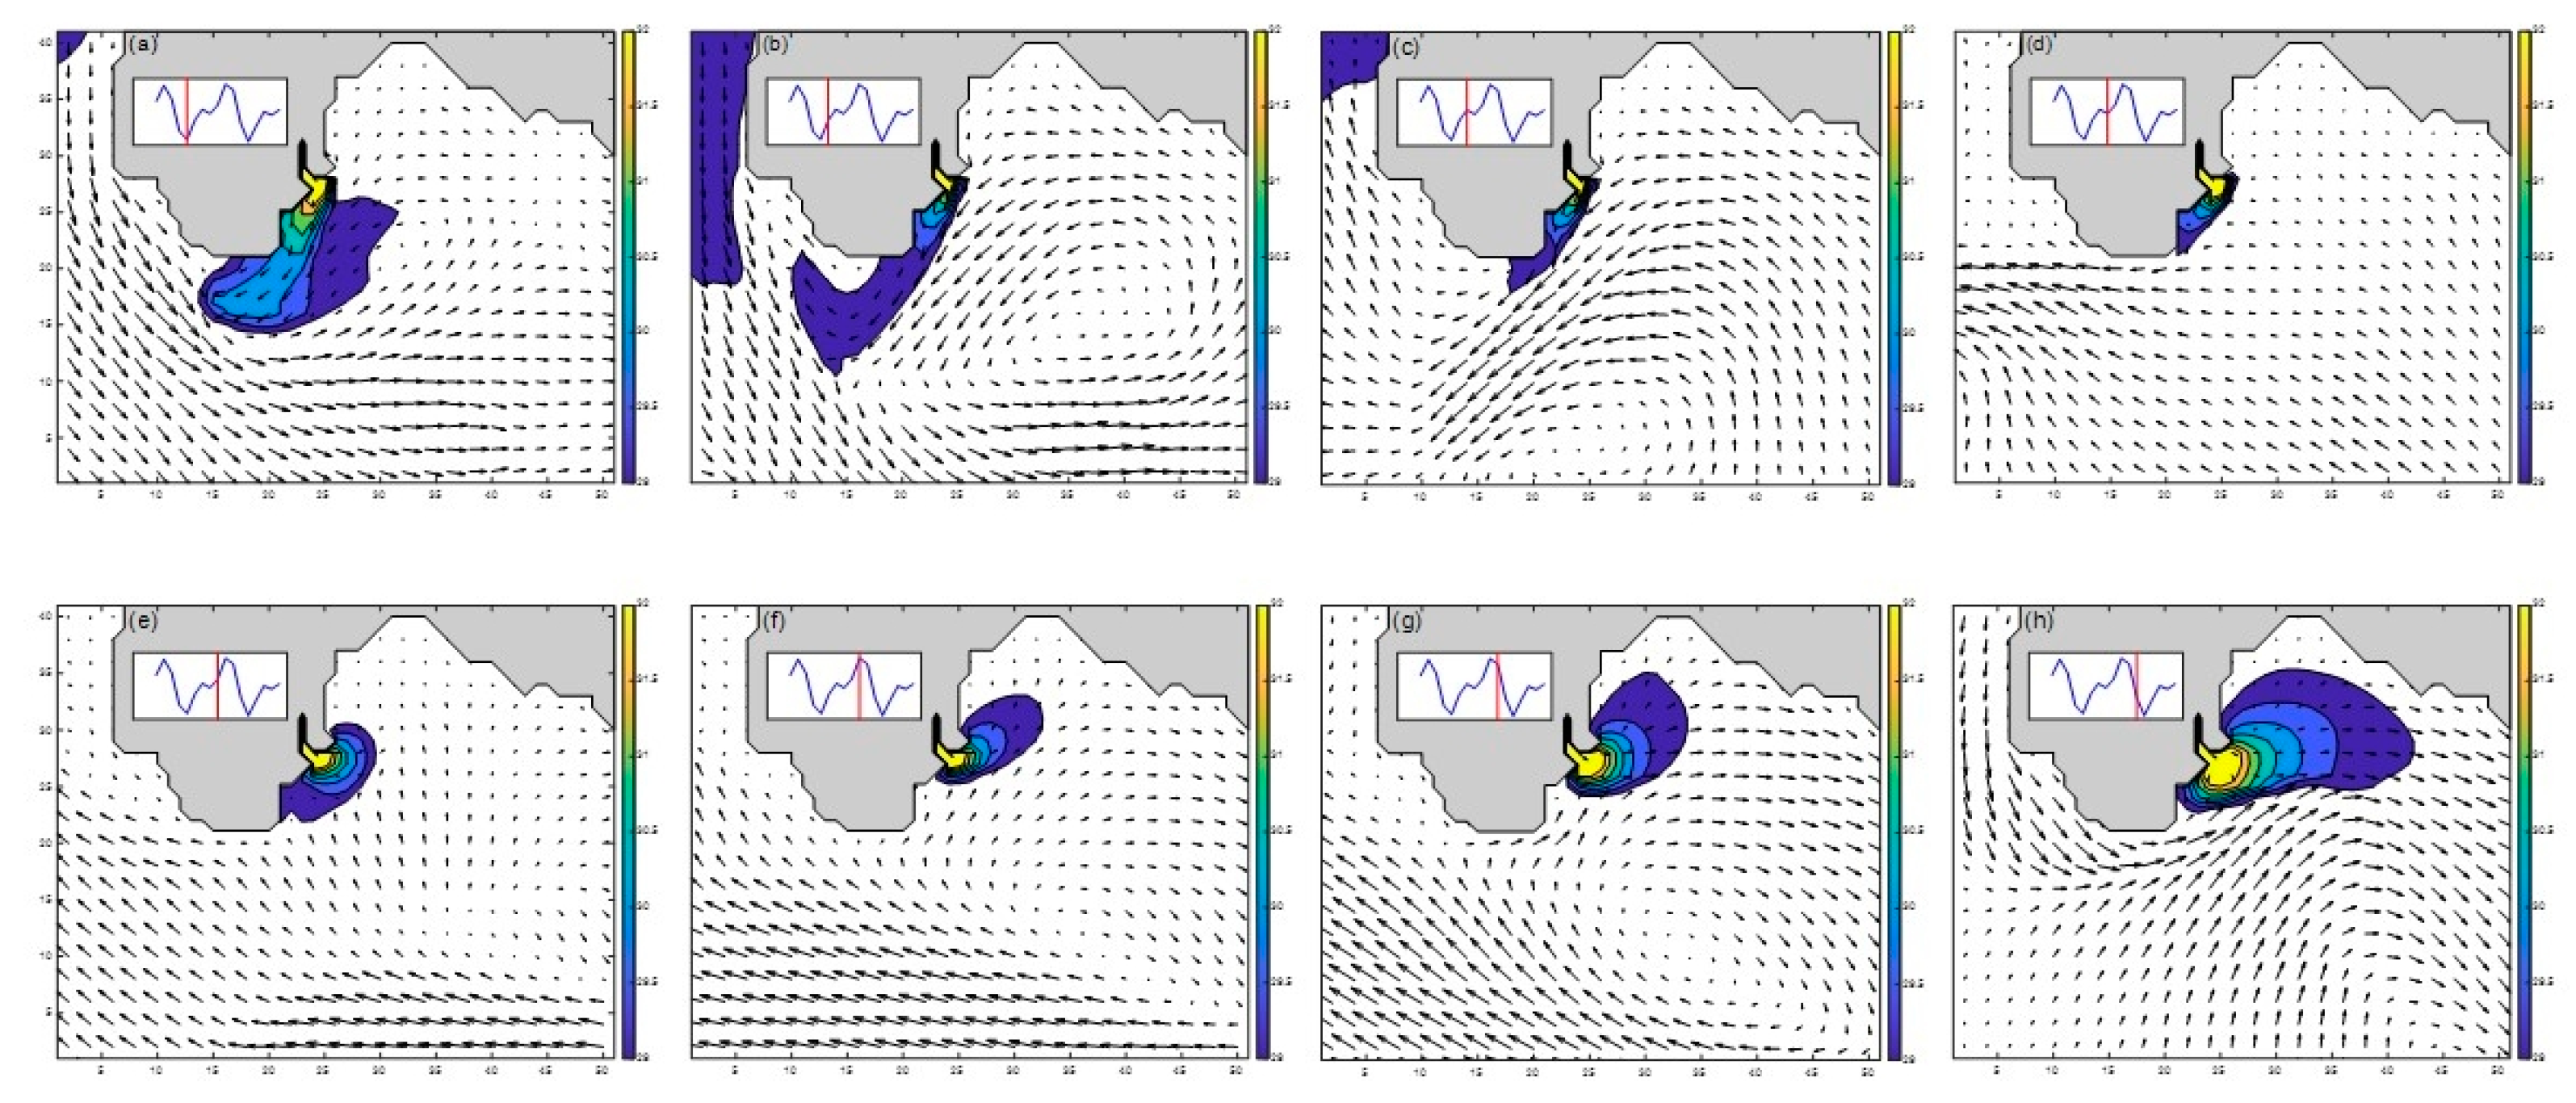
Figure 10 illustrates the model-produced behavior of the thermal plume in summer around the inner reaches of MBT in a diurnal cycle during spring tides. The tidal phase concerning the diurnal cycle is shown in the inset in the left corner of each panel. In Figure 10a, the thermal plume during the lower low water phase, with a temperature exceeding 29 °C, disperses southwestward along the coast. At this time, the prevailing ebb tidal currents generate a relatively minor cyclonic eddy off the southeastern coast of MBT. The returning flow of the eddy circulation close to the coast of MBT pushes the thermal plume from the outlet’s mouth to the southwest direction. The thermal plume front touching the prevailing ebb currents south of MBT is quickly advected and dissipated. Therefore, the flow field restricts the thermal plume dispersion to the northeast and the inner reaches of the bay. When the sea level phase is between lower low water and lower high water, as depicted in Figure 10b, a fully developed cyclone almost completely occupies the western part of the bay, which is accompanied by a swift tidal current to the south of MBT that flows southeastward. At this time, the thermal plume carried by the shear flow of the eddy’s periphery becomes a narrow-band thermal filament streaming toward the southwest. A recirculating current in the shadow zone, located south of MBT, even carries some of the thermal plume to the northwest. Because the sea level phase is transitional at the lower high water (Figure 10c), the fully developed cyclone gradually weakens and then converts to flood tides. However, the southwestward shear flow of the eddy’s outer ring remains intense. The thermal plume visibly adheres to the coast of MBT, and the previous thermal plume, flowing northwestward from the south of MBT, also retracts to form a narrow band. Figure 10d shows that a weak flood current from the southeast directly flows northwestward to MBT during the phase between lower high water and higher low water. The thermal plume is confined to the outer northeast side of MBT, and the high-temperature (exceeding 32 °C) thermal plume is accumulated near the outlet due to the weak flow field. Similar to the situation shown in Figure 10e, the thermal plume disperses forward due to a large amount of high-temperature water accumulating at the outlet. As depicted in Figure 10f, the thermal plume accumulated at the outlet front begins moving northeast, driven by the northeastward shear flow of the anticyclonic eddy’s periphery. A fully developed anticyclone covers Nan Wan Bay, and the intense shear flow pushes more high-temperature water to the northeast during the phase of higher high water, as illustrated in Figure 10g. Subsequently, the anticyclonic shear flow is enhanced by ebb tidal currents from the northwest of the Hengchun peninsula, resulting in more high-temperature water being pushed toward the inner reaches of the bay during the phase between higher high water and lower low water, as shown in Figure 10h.

4.3. Thermal Plume Dispersion in Winter

The winter thermal plume is discovered to be similar to that in summer at the same phase in relation to the same diurnal cycle during spring tides.
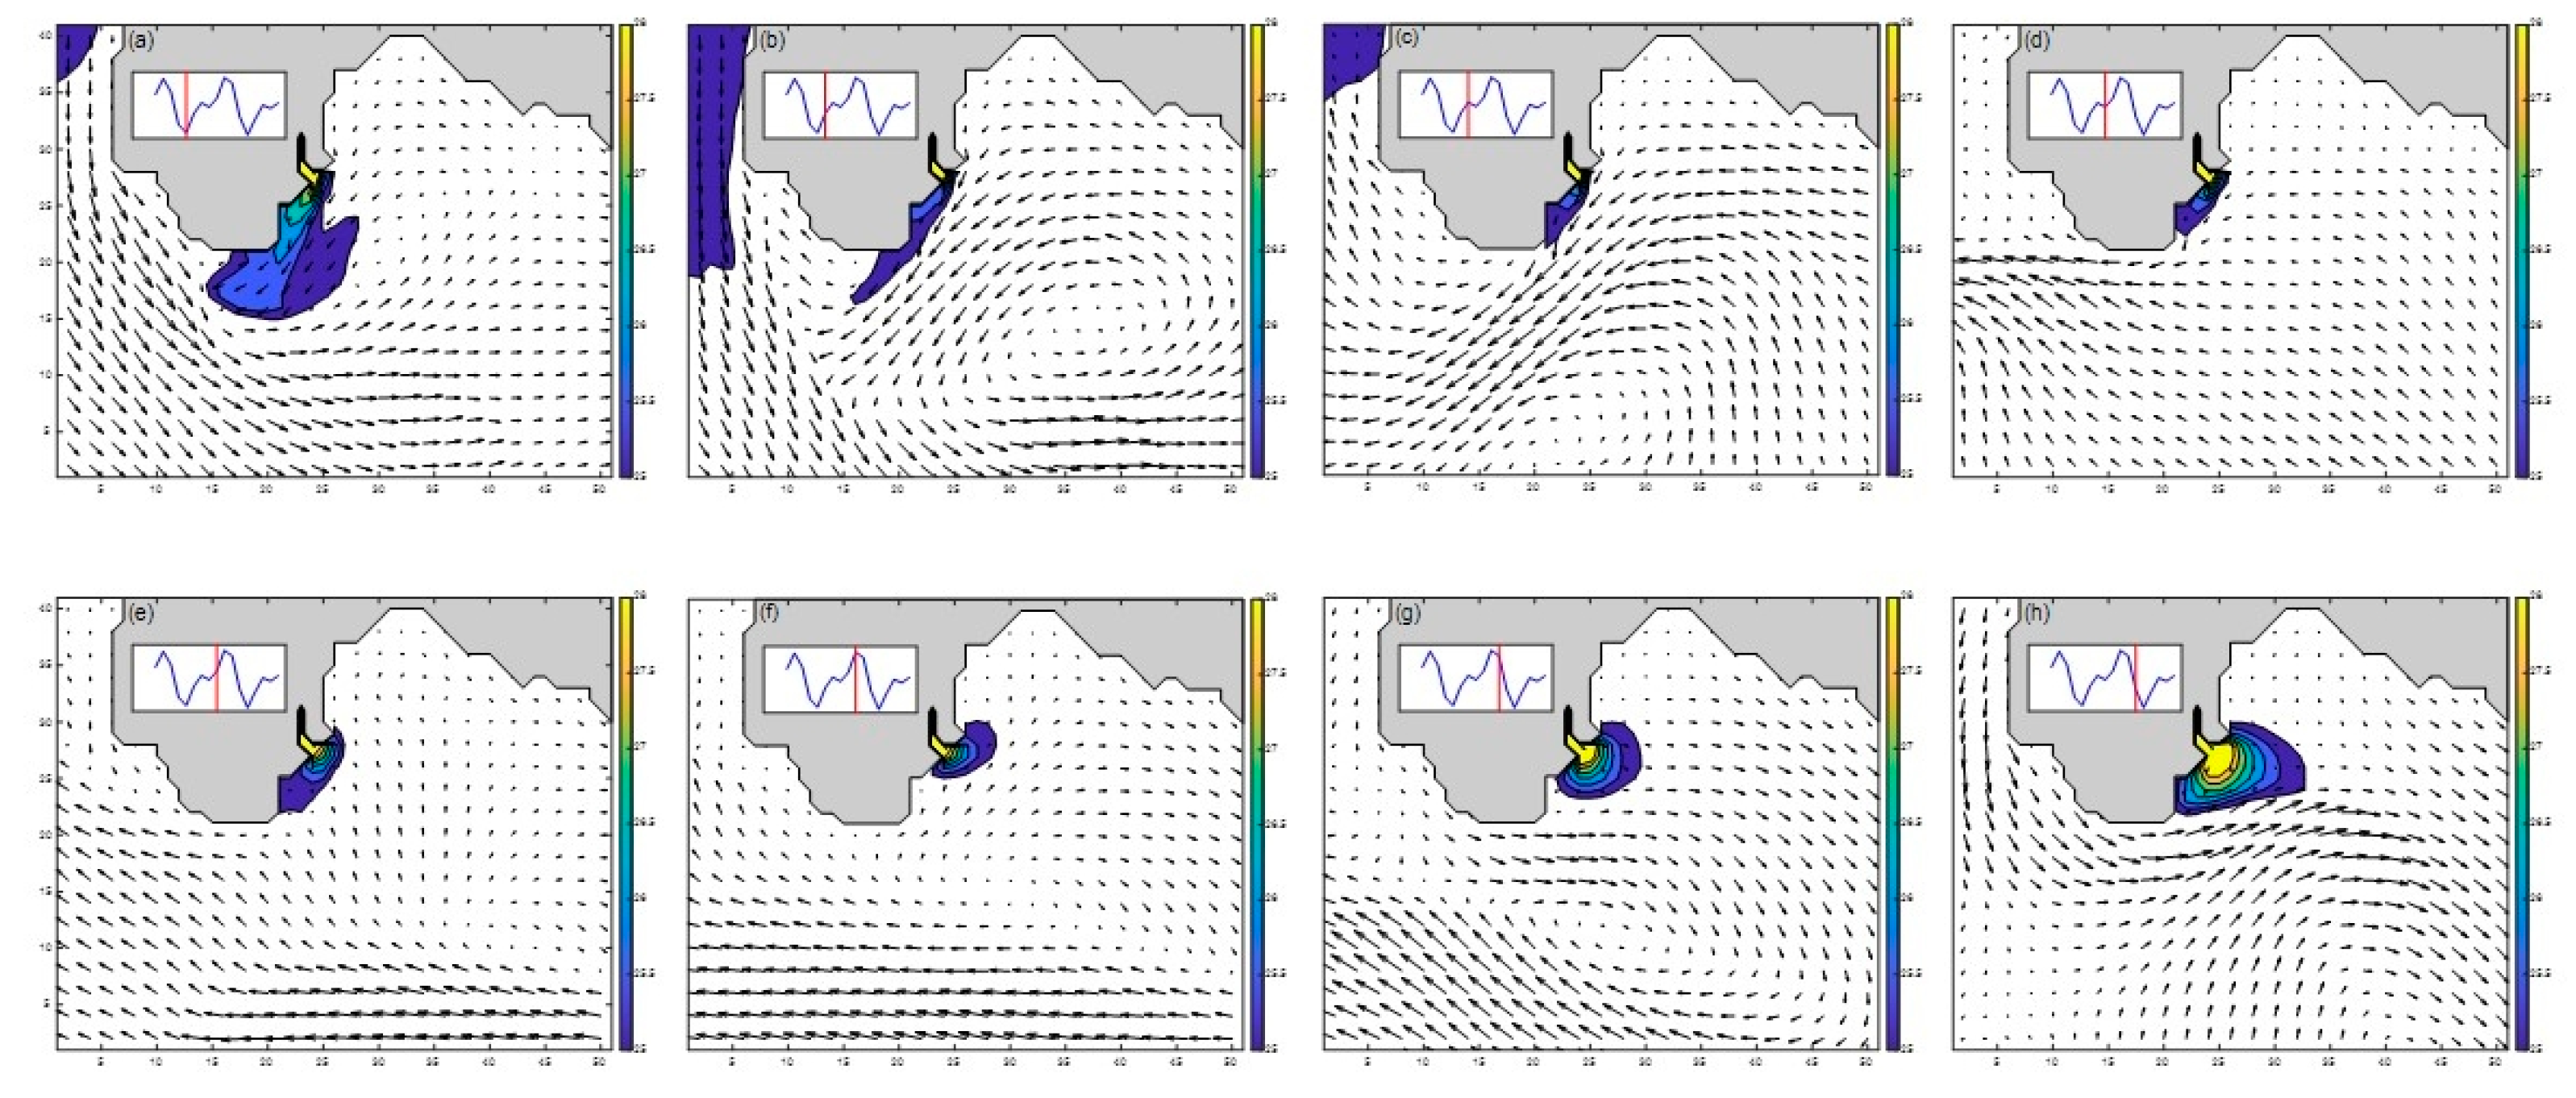
If any thermal plume dispersion occurs, it is attributable to the influence of distinct seasonal monsoons. In Figure 11a, a minor cyclonic eddy initially develops near the southeastern side of MBT and, concurrently, a southeastward tidal current develops on the south side. The returning flow of the eddy circulation close to the coast of MBT drives the thermal plume from the diversion dike’s mouth to the southwest. At this time, the thermal plume disperses along the MBT coast toward the southeast, and the front of the plume touches the prevailing ebb currents south of MBT, at which time the plume is quickly advected and diluted. As shown in Figure 11b, as the sea level phase falls between lower low water and lower high water, a fully developed cyclone covers the bay’s western side, with the cyclone being accompanied by a swift tidal current to the south of MBT that is flowing southeastward. At this time, the thermal plume becomes a narrow-band thermal filament streaming toward the southwest because the plume is compressed by the shear flow of the eddy’s periphery. As shown in Figure 11c, while the sea level phase is transiting at the lower high water, the fully developed cyclone weakens and is gradually converted to a flood pattern, but the southwestward shear flow of the eddy’s outer ring remains intense. The thermal plume visibly forms a small, narrow band along the MBT coast. Figure 11d, which illustrates the higher low water phase, is similar to Figure 11c and reveals that flood tidal currents are developing. The thermal plume appears confined to the north of MBT, with high-temperature water (exceeding 28 °C) becoming concentrated at the outlet. This is similar to the results shown in Figure 11e; during the sea level phase between higher low water and higher high water, the thermal plume dispersion is confined to the zone surrounding the outlet because the northwestward flow field is weak. As illustrated in Figure 11f, the thermal plume, which has slightly accumulated at the outlet front, begins drifting to the northeast, being driven by the northeastward shear flow of the anticyclonic eddy. Subsequently, a well-developed anticyclone covers Nan Wan Bay, and the shear flow pushes the thermal water to the southeast during the phase of higher high water, as shown in Figure 11g. The situation when the plume disperses southeastward from the outlet differs from that presented in Figure 10g, in which the considerable thermal plume drifts to the northeast. As shown in Figure 11h, the anticyclonic shear flow subsequently combines with the ebb tidal currents coming from the western side of MBT, leading to more high-temperature water being pushed toward the east during the phase between higher high water and lower low water. Simultaneously, much of the high-temperature water (greater than 28 °C) seemingly accumulates around the outlet front.
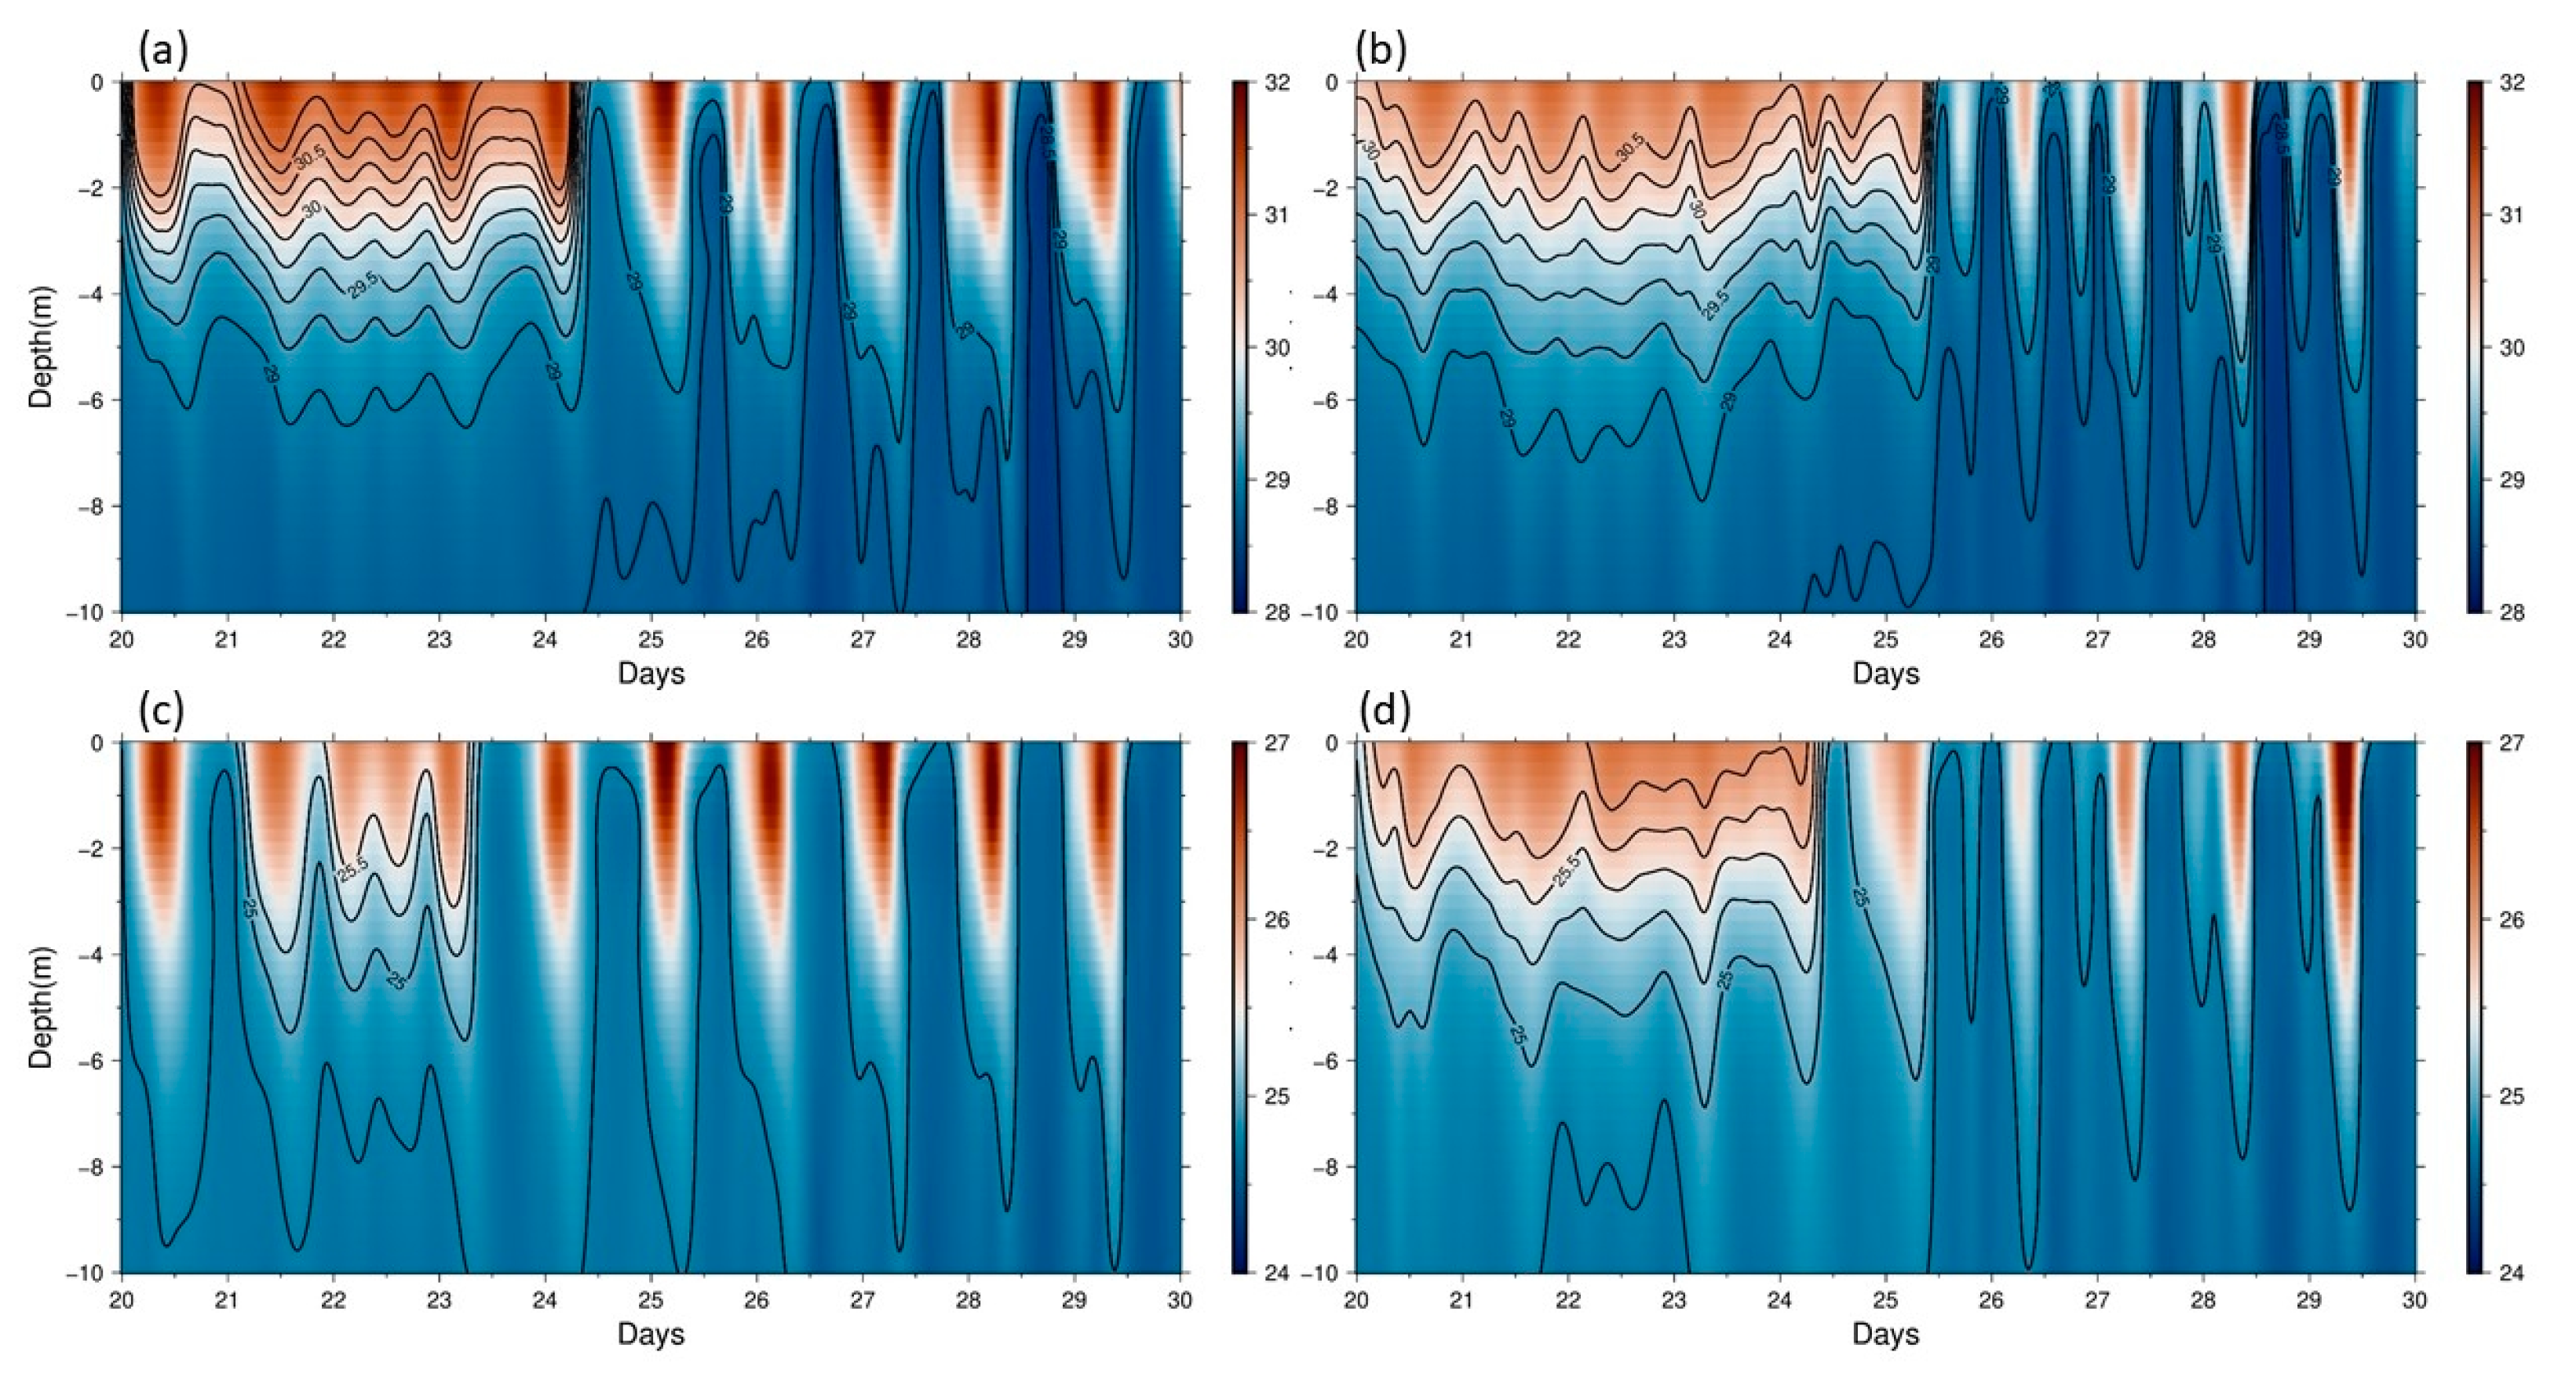
Two selected model sites to the east and south of the outlet at a distance of approximately 500 m were sampled to illustrate their time series of temperature profiles in both summer and winter, and the results are shown in Figure 12. In Figure 12, it is evident that the thermal plume in summer and winter typically remains between the sea surface and 6 m water depth, where it floats on the surface layer due to the lighter density of water. The thermal plume appears unable to reach greater depths. During neap tides, which occur approximately from the 20th to the 25th day, the thermal plume always surrounds the outlet, as it is unable to disperse to distant locations through tidal advection. However, an exception to this is observed in the case of the east station in winter, as depicted in Figure 12c. Due to the strong winter monsoon blowing from northeast to southwest, the wind direction opposes that of the northeastward tidal current, giving rise to a partial thermal plume that moves southwestward. As shown in Figure 12c, the volume of the warm pool in the first 5 days appears smaller than in the other cases (in Figure 12a,b,d). This case serves as a demonstration of the impact of winter monsoon and how it modifies the dispersion of the NP_No.3 thermal plume. During spring tides, it can be observed that the thermal plume experiences significant fluctuations in terms of appearance and disappearance with the diurnal cycles. Irrespective of whether it is summer or winter, the duration of the thermal plume staying at the east station is approximately 10 h, which is much shorter than its duration at the south station. This result corresponds with Chen et al.’s [3] study of the flow field in Nan Wan Bay.

5. Discussion

In this study, we incorporated tides and daily wind forcings into the MITgcm to examine their effects on the thermal plume from the NP_No.3 and its circulation in Nan Wan Bay. Regardless of flow fields or thermal plumes, the model results agree well with the observational data, which comprise satellite images and shipboard ADCP survey data. In terms of the output results, the model captures the major circulation features, which reveal that the current from the west side of MBT flows around MBT into the bay during early ebb tides. The weak ebb current often flows southeastward along the isobaths, running more or less parallel to the coastline, as shown in Figure 7d,e. As the sea level progresses to the lower low water phase, a well-developed cyclonic eddy covers the western part of Nan Wan Bay and is accompanied by a fast and southeastward-flowing tidal current to the south of MBT. Our model results and the findings of the shipboard ADCP survey both capture the corresponding flow patterns (Figure 7f and Figure 9a). The thermal plume characteristics (Figure 10a,b) derived from the model results correspond to those of the Landsat 8 SST fields in summer, as indicated in Figure 8b,d,f. To this point, the recirculating flow of a cyclonic eddy, adhering to the inner MBT coast, pushes the thermal plume to stably flow southwestward. We propose that the force pushing the thermal plume southwestward always exists when the sea level is between the higher high water and the mid-lower high water phases, i.e., a cyclonic eddy dominates the ocean circulation on the west side of the bay.
Interestingly, a well-developed anticyclone subsequently covers Nan Wan Bay during the tidal phase between higher low water and higher high water, as shown in Figure 9b and Figure 7h, and the currents of the anticyclonic outer ring in the south flow northwestward to impact the thermal water pool at the outlet’s mouth. As a result, this leads to some of the thermal plume being pushed to the northeast by the north-separated branch, as shown in Figure 8e and Figure 10e,f. In summer, as the anticyclonic eddy gradually expands, the direction in which the thermal plume disperses appears to become more consistent with the eddy outer-ring circulation, as indicated in Figure 10f,g. In winter, the strong northeasterly monsoon acts as an opposing force on the sea surface, resulting in the anticyclonic eddy structure being destroyed, as shown in Figure 9d. As is the case with the prevailing northeasterly monsoon, the northeastward thermal plume is suppressed and further turns to disperse eastward, as indicated in Figure 11f–h. In summer, the thermal plume in the same phase appears to diffuse to the northeast during the prevailing mild southwesterly monsoon, as shown in Figure 10f–h. By examining the flushing time of the thermal plume in Nan Wan Bay, insights derived from analyzing Figure 10, Figure 11 and Figure 12 indicate that the thermal plume remains either to the south or north of the outlet mouth for roughly 12 h each. Additionally, two selected model sites to the east and south of the outlet at a distance of approximately 500 m were sampled to illustrate their time series of temperature profiles in both summer and winter, as shown in Figure 12. In both summer and winter, the thermal plume often exists between the sea surface and a depth of 6 m, floating on the surface layer due to the lighter density of water. During neap tides, the thermal plume consistently surrounds the outlet as it faces limitations in dispersing to distant regions through tidal advection, but an exception to this pattern is observed in the case of the east station in winter, as depicted in Figure 12c. During spring tides, noticeable amplitude fluctuations can be observed in the appearance or disappearance of the thermal plume in line with the diurnal cycles. Therefore, the flushing time of the thermal plume is estimated to be roughly 10 h at the east station and 6 h at the south station.
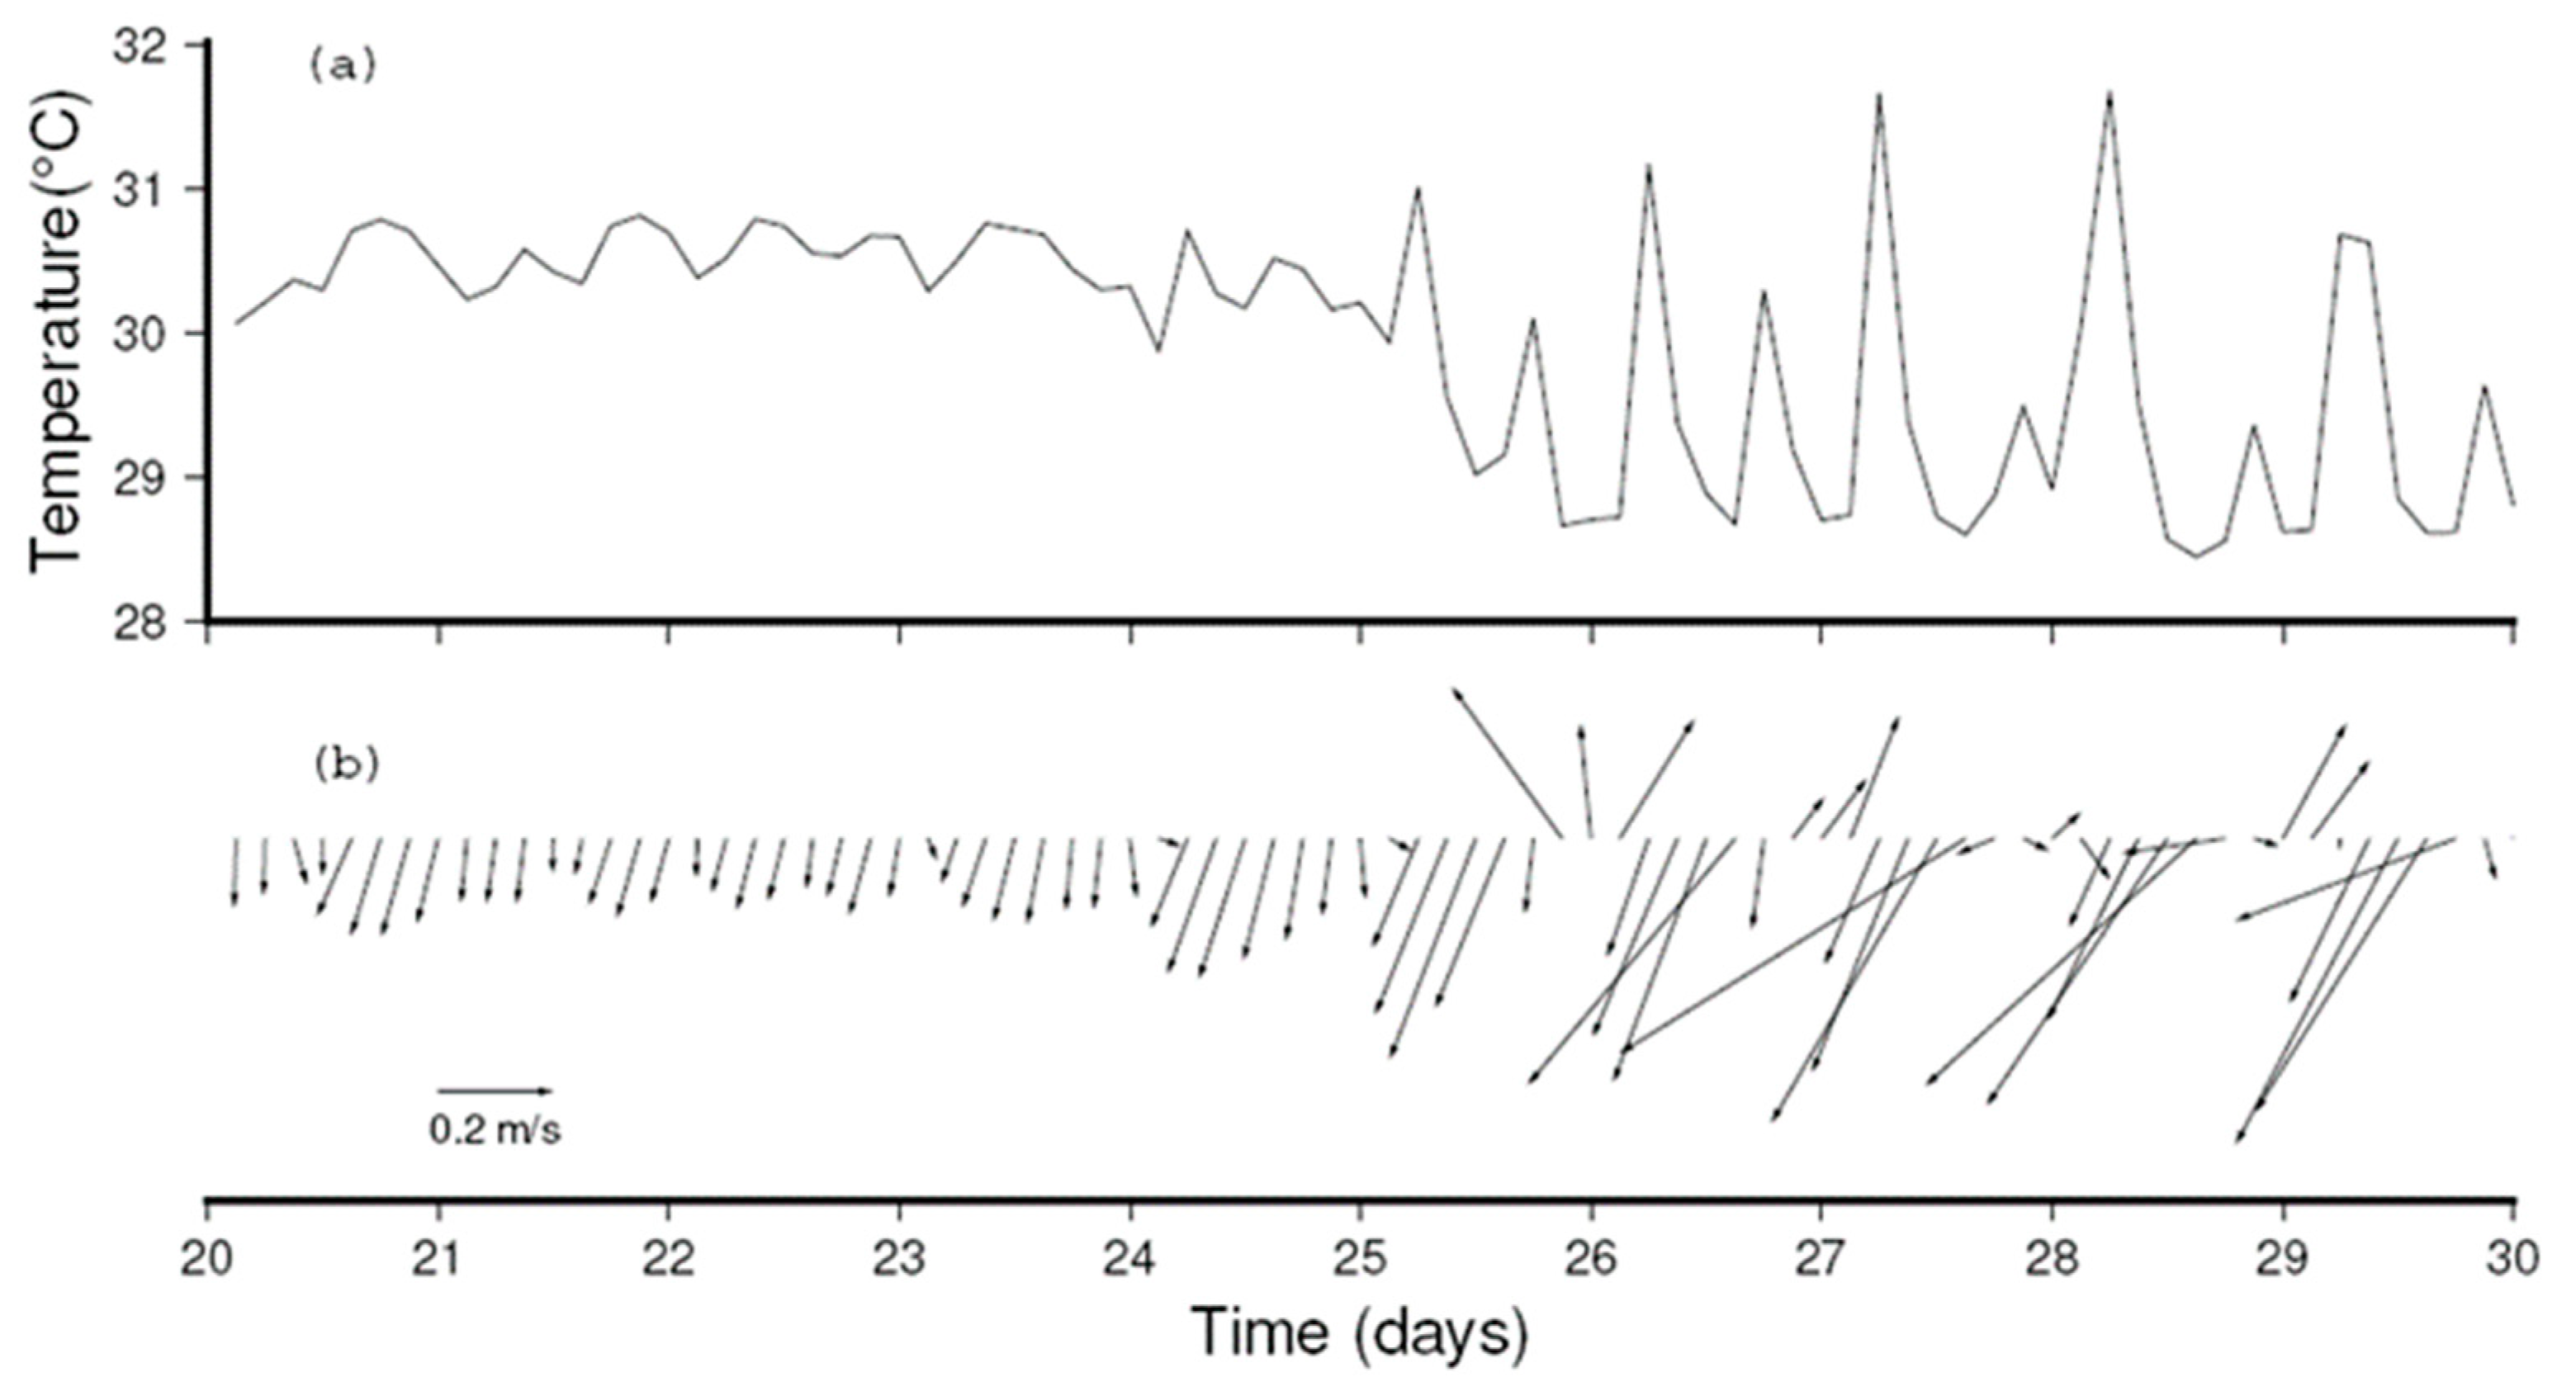
In order to understand the interactions between the thermal plume dispersion and the eddies on the west side of the bay in detail, the model south station is selected as an instance to illustrate how the peripheral shear flow of the tide-generated cyclonic eddy influences thermal plume behavior. Examples of continuous traces are given in Figure 13 and Figure 14. In Figure 13b, during neap tides between the 20th and the 25th day in summer, the southward tidal current (approximately 0.2 m/s) slowly carries the thermal plume water to the south or south–southwest. Hence, the water of the south station always keeps up a high temperature at about 30.5 °C on average (Figure 13a). Conversely, most strong tidal currents during spring tides flow southwestward, and at this time, the peripheral shear flow of the tide-generated cyclonic eddy is generated near the east side of MBT. At the beginning, the southward shear flow carries the thermal water flowing southward, giving rise to the increase in water temperature. Subsequently, the strong shear flow readily dilutes the thermal water, immediately leading to decreased water temperature. For instance, the 28th day in Figure 13a is a typical example. In winter, as a whole, the winter situation is similar to that in summer.
The water in Figure 14a maintains a higher temperature at roughly 26 °C between the 20th and the 25th day during neap tides, and at this time, the slow shear flow of the model south station is flowing to the south in Figure 14b. Therewith, most of the tidal currents during spring tides flow southwestward, and the circulating shear flow of the tide-generated cyclonic eddy carries the thermal plume from the outlet to the southwest. Meanwhile, the northeast monsoon enhances the strength of the tidal currents to dilute the thermal water, resulting in a rapid decrease in water temperature, such as the 26th day in Figure 14a. Because of the prevailing northeast monsoon in winter, the northeastward tidal currents, in opposition to the direction of the monsoon wind stress, are barely visible and much weaker, with shorter durations. The high-temperature pulse becomes sharper in winter than in summer, as shown in Figure 13 and Figure 14.
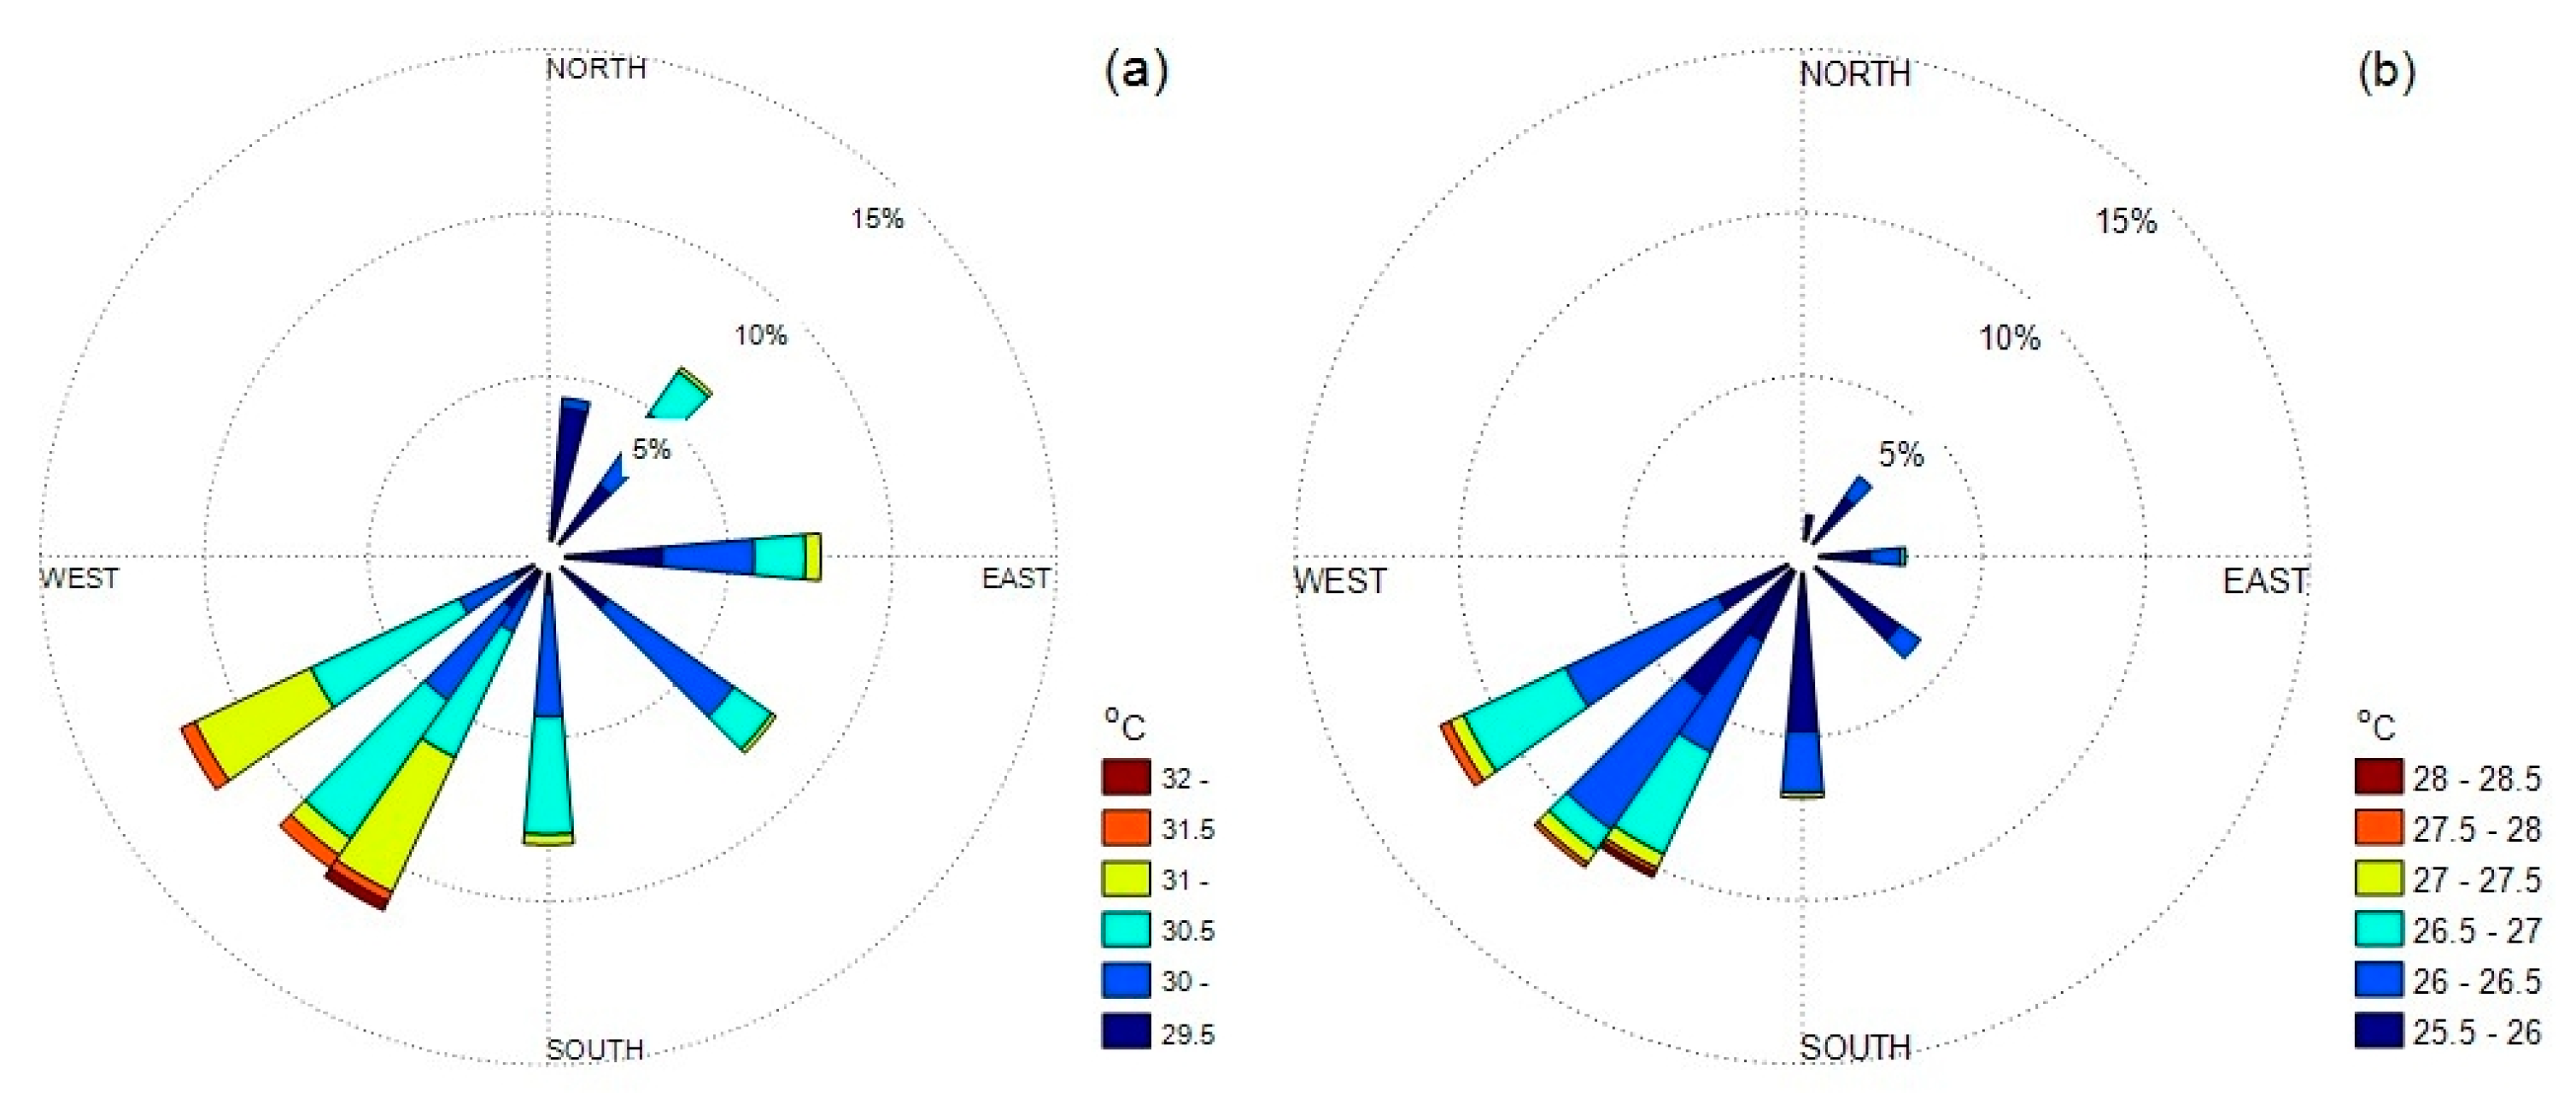
The model stations around the outlet at a distance of approximately 500 m were sampled to create the rose diagrams displayed in Figure 15. As indicated in Figure 15a, the thermal plume is highly likely to disperse to the southwest (43%) in summer, although there is also a small probability of it drifting to the southeast (15%) or northeast (10.5%) because of the influence of the gentle southwesterly monsoon. In winter, as shown in Figure 15b, the thermal plume is most likely to disperse to the southwest (40.5%) and highly unlikely to disperse to the northeast (3.5%) or southeast (5.5%) due to influence of the prevailing northeasterly monsoon.
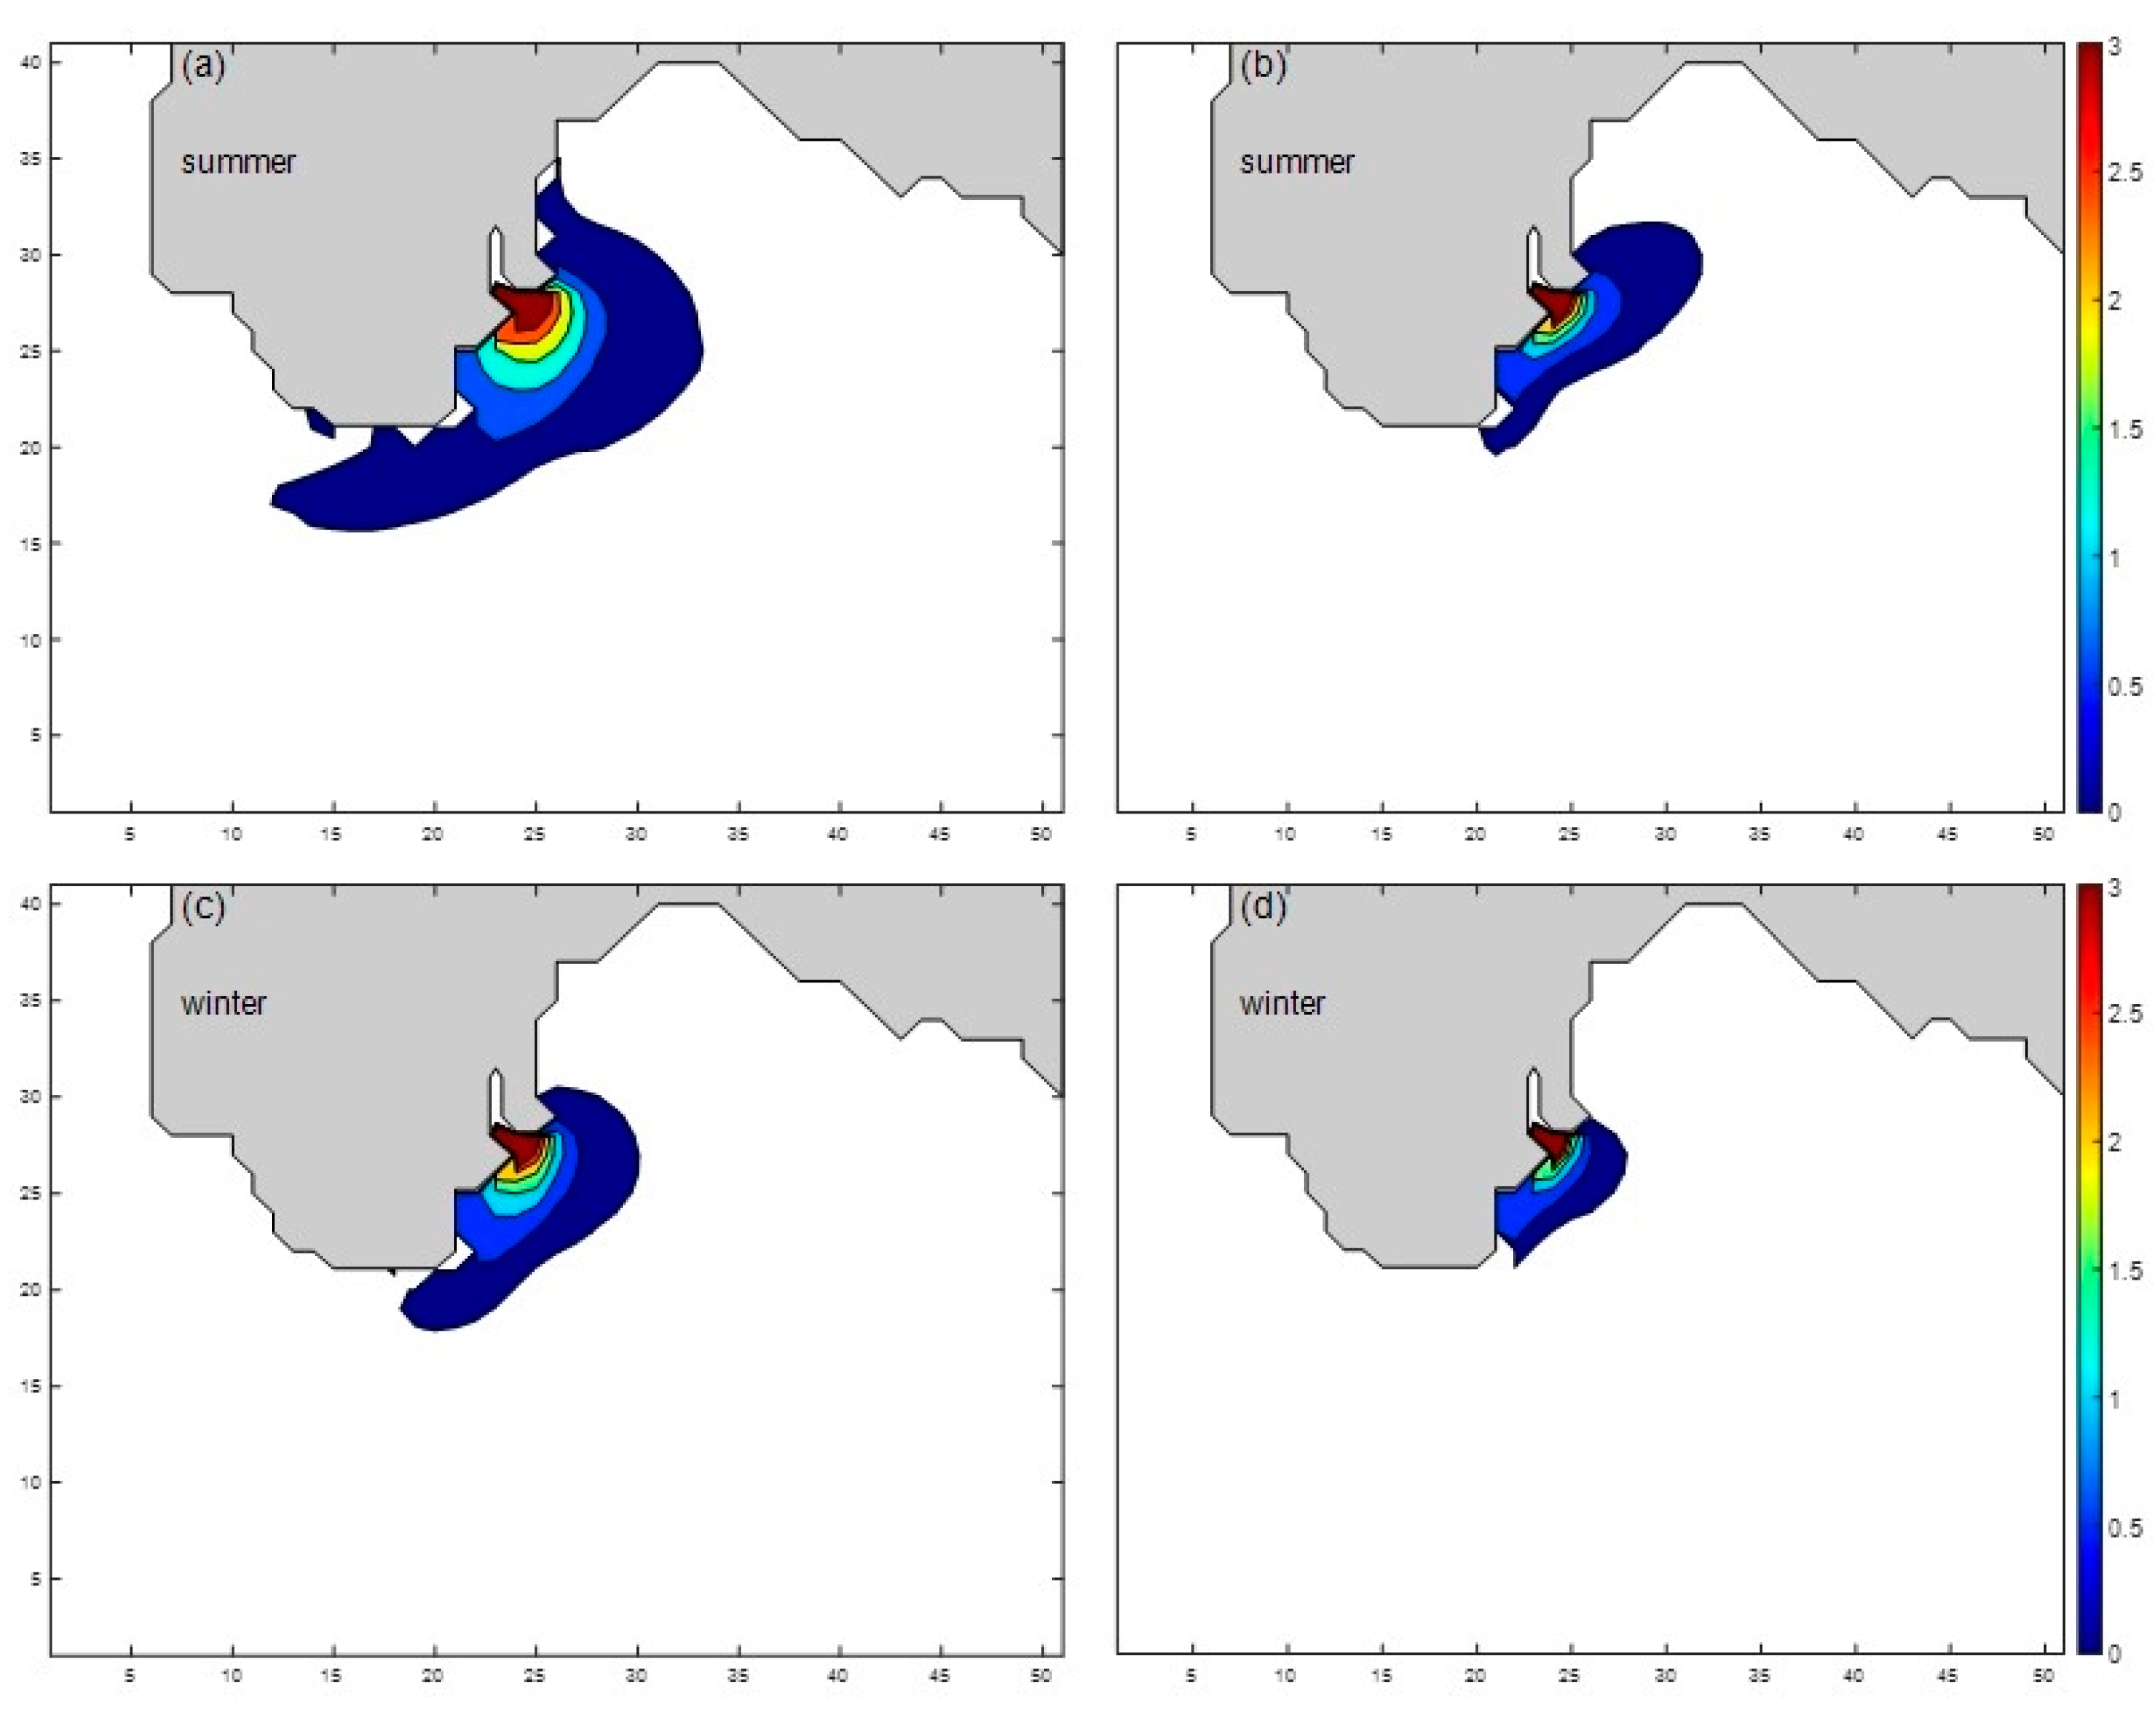
To estimate the degree of influence of the thermal plume after one tidal cycle, the horizontal distribution of the plume is comprehensively estimated in terms of the equivalent depth of the thermal plume, σ T w , defined as [5]
σ T w = h η T ( z ) T a T a d z
where Ta is an average or reference temperature representative of the typical coastal water of the bay, T(z) is the temperature of the water column, η means sea level, and here, h is 10 m at the bottom depth of the locally thermal water column. In summer, the distribution of the equivalent depth of thermal plume during neap tides is shown in Figure 16a. When the winds blow the mild southwest monsoons over the bay in summer, the thermal water readily accumulates to form a semicircle bulge around the outlet, particularly during the neap tides, due to the lack of swift advection and dilution to far fields. The equivalent depth of the thermal plume after one tidal cycle gradually decreases with increasing distance from the outlet mouth (roughly 3 m thick). However, its distribution of equivalent depth still deflects to the southwest due to the influence of the weakly southwestward tidal currents, even existing in the outer of MBT, as given in Figure 16a. On the contrary, during spring tides, the rapid current dilutes some of the thermal water flowing to the southwest, resulting in a situation where the thermal water equivalent depth to the southwest of the outlet becomes thinner, as depicted in Figure 16b.
Overall, the distribution range of the equivalent depth of the thermal plume during neap tides is notably smaller compared with that observed during spring tides in summer, with a tendency for distribution toward the northeast. In winter, during neap tides, the distribution range of the equivalent depth of the thermal plume is significantly smaller than during summer neap tides, with its distribution also deflected toward the southwest. During spring tide, the distribution range of the equivalent depth is even smaller than during neap tide, as illustrated in Figure 16c,d.

6. Conclusions

The primary objective of this study is to demonstrate how monsoons and a pair of counter-rotating eddies affect flow fields and how they alter the dispersion of the thermal plume from the NP_No.3 outlet. In this study, we incorporated tides and daily wind forcings into the MITgcm to examine their effects on the thermal plume from NP_No.3 and its circulation in Nan Wan Bay. The model results from the stick diagram analysis indicate that during summer, the probability of coastal currents flowing southwest along the eastern side of MBT is approximately 82%, and during winter, this probability increases to about 84%. Apart from the dominant southwest direction, tidal currents are almost exclusively oriented toward the northeast. Conceivably, the thermal plume from the NP_No.3 outlet either disperses to the southwest or the northeast, driven by local tidal currents. The rose diagrams reveal that the thermal plume is highly likely to disperse to the southwest (43%) in summer, although there is also a small probability of it drifting to the northeast (10.5%) as a result of the influence of the breezy southwest monsoon. During the winter northeast monsoon, there is a notable tendency for the thermal plume to disperse to the southwest (40.5%), with only a 3.5% probability of dispersion to the northeast. During spring tides, the equivalent depth of the thermal plume gradually decreases with increasing distance from the outlet mouth (approximately 3 m thick), and its distribution range of equivalent depth still deflects to the southwest, even extending to the outer part of MBT in summer. During the winter northeasterly monsoon, the distribution range of the equivalent depth of the thermal plume during neap tides is significantly smaller than during summer neaps. Moreover, similar to spring tides, its distribution also deviates toward the southwest direction during winter spring tides.
In conclusion, it is worth emphasizing that strong tidal currents generate a pair of counter-rotating eddies that predominantly influence the dispersion of the thermal plume, and seasonal monsoons also play an essential role in modifying the plume’s direction and dispersion.
Author Contributions

Conceptualization, H.-J.L., S.-J.H., P.-J.M., and C.-C.C.; methodology, H.-J.L., Y.-C.T., and C.-Y.H.; software, C.-Y.H. and Y.-C.T.; validation, H.-J.L.; formal analysis, S.-J.H., Y.-C.T., and C.-Y.H.; investigation, P.-J.M. and C.-C.C.; writing—review and editing, H.-J.L. All authors have read and agreed to the published version of the manuscript.

Funding

H.-J. Lee, C.-Y. Ho, and Y.-C. Tsai were supported by the NSTC of Taiwan under grant NSTC 112-2611-M-019-016. S.-J. Huang was supported by the CWB of Taiwan under grants CWB 112H80506, CWB 111H80506, and MOST 108-2611-M-019-018. P.-J. Meng was supported by the MOST and NSTC of Taiwan under grants MOST 111-2611-M-259-002, MOST 110-2611-M-259-002, MOST 109-2611-M-259-003, MOST 108-2611-M-291-005, MOST 107-2611-M-291-001, and MOST 106-2611-M-291-006.

Data Availability Statement

The topographic and hydrological observational data that support the findings of this study are openly available from the ODB of the National Science and Technology Council (NSTC), Taiwan, at https://www.odb.ntu.edu.tw/en/ (accessed on 2 May 2023). The ADCP data that support the findings of this study are available upon request from the NSTC, Taiwan, at https:// www.odb.ntu.edu.tw/en/ (accessed on 4 July 2023). The satellite imagery datasets were obtained from public resources at https://www.usgs.gov/landsat-missions/landsat-8 (accessed on 15 May 2023). The datasets of sea level heights and winds used to support the findings of this study are available upon request from the Central Weather Administration (CWA), Taiwan, at https://e-service.cwa.gov.tw/wdps/ (accessed on 28 November 2023).

Acknowledgments

The authors also received invaluable assistance from the R/V (New) Ocean Researchers No. 3 and No. 1.

Conflicts of Interest

The authors declare no conflicts of interest.

References

  1. Lee, H.J.; Chao, S.Y.; Fan, K.L.; Kuo, T.Y. Tide-induced eddies and upwelling in a semi-enclosed basin: Nan Wan. Estuar. Coast. Shelf Sci. 1999, 49, 775–787. [Google Scholar] [CrossRef]
  2. Wessel, P.; Luis, J.F.; Uieda, L.; Scharroo, R.; Wobbe, F.; Smith, W.H.F.; Tian, D. The Generic Mapping Tools version. Geochem. Geophys. Geosyst. 2019, 20, 5556–5564. [Google Scholar] [CrossRef]
  3. Chen, C.T.; Jan, S.; Chen, M.H.; Liu, L.L.; Huang, J.F.; Yang, Y.J. Far-Field Influences Shadow the Effects of a Nuclear Power Plant’s Discharges in a Semi-Enclosed Bay. Sustainability 2023, 15, 9092. [Google Scholar] [CrossRef]
  4. Jan, S.; Chen, C.T.; Tu, Y.Y.; Tsai, H.S. Physical properties of thermal plumes from a nuclear power plant in the southernmost Taiwan. J. Mar. Sci. Technol. 2004, 12, 433–441. [Google Scholar] [CrossRef]
  5. Choi, B.J.; Wilkin, J.L. The effect of wind on the dispersal of the Hudson River plume. J. Phys. Oceanogr. 2007, 37, 1878–1897. [Google Scholar] [CrossRef]
  6. Chao, S.Y. Tidal Modulation of Estuarine Plumes. J. Phys. Oceanogr. 1990, 20, 1115–1123. [Google Scholar] [CrossRef]
  7. Laguna-Zarate, L.; Barrios-Piña, H.; Ramírez-León, H.; García-Díaz, R.; Becerril-Piña, R. Analysis of Thermal Plume Dispersion into the Sea by Remote Sensing and Numerical Modeling. J. Mar. Sci. Eng. 2021, 9, 1437. [Google Scholar] [CrossRef]
  8. Hessner, K.; Rubino, A.; Brandt, P.; Alpers, W. The Rhine Outflow Plume Studied by the Analysis of Synthetic Aperture Radar Data and Numerical Simulations. J. Phys. Oceanogr. 2001, 31, 3030–3044. [Google Scholar] [CrossRef]
  9. Huang, F.; Lin, J.; Zheng, B. Effects of Thermal Discharge from Coastal Nuclear Power Plants and Thermal Power Plants on the Thermocline Characteristics in Sea Areas with Different Tidal Dynamics. Water 2019, 11, 2577. [Google Scholar] [CrossRef]
  10. Wei, J.; Feng, L.; Tong, Y.; Xu, Y.; Shi, K. Long-term observation of global nuclear power plants thermal plumes using Landsat images and deep learning. Remote Sens. Environ. 2023, 295, 113707. [Google Scholar] [CrossRef]
  11. Lin, C.T.; Chao, S.Y.; Fan, K.L. Wind modulation of small-scale plumes from Yin-Yang bay. Terr. Atmos. Ocean. Sci. 1995, 6, 621–639. [Google Scholar] [CrossRef]
  12. Lin, C.T.; Fan, K.L.; Chao, S.Y. Small-scale Plumes From a Semi-enclosed Basin: Yin-Yang Bay. Terr. Atmos. Ocean. Sci. 1994, 5, 91–107. [Google Scholar] [CrossRef]
  13. Chao, S.Y. River-forced estuarine plumes. J. Phys. Oceanogr. 1988, 18, 72–88. [Google Scholar] [CrossRef]
  14. Ho, C.Y.; Fang, T.H.; Wu, C.H.; Lee, H.J. Interplay between Asian Monsoon and Tides Affects the Plume Dispersal of the New Hu-Wei River off the Coast of Midwest Taiwan. Water 2022, 14, 152. [Google Scholar] [CrossRef]
  15. Chew, L.L.; Chong, V.C.; Wong, R.C.S.; Lehette, P.; Ng, C.C.; Loh, K.H. Three decades of sea water abstraction by Kapar power plant (Malaysia): What impacts on tropical zooplankton community? Mar. Pollut. Bull. 2015, 101, 69–84. [Google Scholar] [CrossRef] [PubMed]
  16. Marshall, J.; Jones, H.; Hill, C.N. Efficient ocean modeling using non-hydrostatic algorithms. J. Mar. Syst. 1998, 18, 115–134. [Google Scholar] [CrossRef]
  17. Marshall, J.; Shuckburgh, E.; Jones, H.; Hill, C. Estimates and implications of surface eddy diffusivity in the southern ocean derived from tracer transport. J. Phys. Oceanogr. 2006, 36, 1806–1821. [Google Scholar] [CrossRef]
  18. Lee, H.J.; Lee, M.A.; Ho, C.Y.; Hsu, P.C.; Wang, Y.C. Crescent-Shaped Low-Temperature Distribution along the Convex Topography in the Southeastern Edge of Taiwan Bank in Summer. J. Phys. Oceanogr. 2022, 52, 2705–2723. [Google Scholar] [CrossRef]
  19. Large, W.G.; McWilliams, J.C.; Doney, S.C. Oceanic vertical mixing: A review and a model with a nonlocal boundary layer parameterization. Rev. Geophys. 1994, 32, 363–403. [Google Scholar] [CrossRef]
  20. Matsumoto, K.; Takanezawa, T.; Ooe, M. Ocean tide models developed by assimilating TOPEX/POSEIDON altimeter data into hydrodynamical model: A global model and a regional model around Japan. J. Oceanogr. 2000, 56, 567–581. [Google Scholar] [CrossRef]
Figure 1. Map of Nan Wan Bay showing the station locations and bathymetry (in meters). The large-scale map in the upper-right corner indicates the study area, model domain, and adjacent seas (generated using the Generic Mapping Tools software package [2]). The triangle denotes the location of the Third Nuclear Power Plant in Taiwan, while the blue square indicates the Hengchun Township. The black squares mark the CTD sampling sites, and the dashed line square denotes the range of the satellite images.
Water 16 01420 g001
Figure 2. Sea level time series measured at Houbihu Harbor (HBH) from 1 to 31 October 2023 (left panel), and relative energy spectrum from 1 January to 31 October 2023, with the frequency in units of cycles per day (right panel).
Water 16 01420 g002
Figure 3. Typical temperature (solid line) and salinity (dashed line) profiles at (120.8183° E, 21.807° N; S1 marked in Figure 1) on 11 August 2015 in the summer (red) and at (120.6833° E, 21.9662° N; S2 marked in Figure 1) on 5 December 2012 in the winter (blue).
Water 16 01420 g003
Figure 4. Wind vectors measured at the Hengchun station of the Central Weather Administration (CWA; marked with a blue square in Figure 1), represented as sticks, in (a) the summer in August 2022 and in (b) the winter in December 2022.
Water 16 01420 g004
Figure 5. Repeated tracks of the shipboard ADCP survey (a) at a fixed site indicated as F, and (b) R/V Ocean Researcher III surveying tracks. The red rectangles indicate the sampling period.
Water 16 01420 g005
Figure 6. Stick diagram illustrating current vectors over approximately 24 h (F station marked in Figure 5). The inset in the upper-left corner indicates sea level fluctuations. The red rectangular box indicates the sampling period.
Water 16 01420 g006
Figure 7. Surface currents at 8 m depth derived from the Ocean Researcher III survey data measured during the periods of (a) 15:55–19:40 on 9 August, (b) 19:40–23:12 on 9 August, (c) 23:12 on 9 August to 02:32 on 10 August, (d) 02:32–06:11 on 10 August, (e) 06:11–09:42 on 10 August, (f) 09:42–13:10 on 10 August, (g) 13:10–16:32 on 10 August, and (h) 16:32–20:02 on 10 August. In the insets, the red rectangles indicate the tidal phase period.
Water 16 01420 g007
Figure 8. Satellite images showing the instantaneous SST derived from Landsat 8 at (a) 10:00 on 8 January 2018; (b) 10:00 on 5 September 2018; (c) 10:00 on 28 February 2019; (d) 10:00 on 24 September 2019; (e) 10:00 on 1 February 2021; and (f) 10:00 on 22 July 2022. The small inset with a vertical red line in the lower-right corner of each panel indicates the local tidal phase. With the exception of panel (f), satellite images were all captured during spring tides.
Water 16 01420 g008
Figure 9. Model-produced tidal currents and temperature fields on the surface layer during (a) ebb tides in winter; (b) flood tides in winter; (c) ebb tides in summer; and (d) flood tides in summer. In the inset in the upper-right corner of each panel, the sea level marked by a vertical red line indicates the tidal phase.
Water 16 01420 g009
Figure 10. Model-produced tidal currents and thermal plume fields on the surface in summer. The panels (ah) show the tidal phases. A small inset in the upper-left corner, featuring the sea level marked by a vertical red line, indicates the model tidal phase.
Water 16 01420 g010
Figure 11. Model-produced tidal currents and thermal plume fields on the surface in winter. Panels (ah) show the tidal phases. A small inset in the upper left corner, featuring the sea level marked by a vertical red line, indicates the model tidal phase.
Water 16 01420 g011
Figure 12. Two selected model sites to the east (120.752° E, 21.932° N) and south (120.748° E, 21.926° N), located at a distance of approximately 500 m from the outlet, were sampled to illustrate the time series of temperature profiles at the stations: (a) east in summer, (b) south in summer, (c) east in winter, and (d) south in winter.
Water 16 01420 g012
Figure 13. The model results in summer are sampled at the south station (120.748° E, 21.926° N) to exhibit (a) the time series of water temperature and (b) the time series of the stick diagram.
Water 16 01420 g013
Figure 14. The model results in winter are sampled at the south station (120.748° E, 21.926° N) to exhibit (a) the time series of water temperature and (b) the time series of the stick diagram.
Water 16 01420 g014
Figure 15. Rose diagrams indicating the direction of thermal plume dispersion and thermal accumulation in the (a) summer and (b) winter.
Water 16 01420 g015
Figure 16. Equivalent depth of the thermal plume σ T w (in m) after one tidal cycle (a) during neap tides in summer, (b) during spring tides in summer, (c) during neap tides in winter, and (d) during spring tides in winter.
Water 16 01420 g016
Disclaimer/Publisher’s Note: The statements, opinions and data contained in all publications are solely those of the individual author(s) and contributor(s) and not of MDPI and/or the editor(s). MDPI and/or the editor(s) disclaim responsibility for any injury to people or property resulting from any ideas, methods, instructions or products referred to in the content.