Article

Sorption-Based Removal Techniques for Microplastic Contamination of Tap Water

by
Natalya S. Salikova
1,
Almagul R. Kerimkulova
2,
Javier Rodrigo-Ilarri
3,*,
Kulyash K. Alimova
4,
María-Elena Rodrigo-Clavero
3 and
Gulzhanat A. Kapbassova
1
1
Department of Ecology, Life Safety and Environmental Protection, Abay Myrzakhmetov Kokshetau University, Kokshetau 020000, Kazakhstan
2
Department of Chemical Physics and Materials Science, Al-Farabi Kazakh National University, Almaty 050000, Kazakhstan
3
Instituto de Ingeniería del Agua y del Medio Ambiente (IIAMA), Universitat Politècnica de València, 46022 Valencia, Spain
4
Department of Engineering Systems and Networks, K.I. Satpaev Kazakh National Research Technical University, Almaty 050000, Kazakhstan
*
Author to whom correspondence should be addressed.
Water 2024, 16(10), 1363; https://doi.org/10.3390/w16101363
Submission received: 18 April 2024 / Revised: 2 May 2024 / Accepted: 9 May 2024 / Published: 11 May 2024
(This article belongs to the Topic Microplastics Pollution)

Abstract

:
This study investigates the presence of microplastics in tap drinking water and evaluates the efficacy of various sorbents for their removal in the context of Kazakhstan’s water treatment system. Water samples taken in the cities of Kokshetau and Krasny Yar (Akmola region) were analyzed. Microplastics were detected in all samples, with concentrations ranging from 2.0 × 10⁻² to 6.0 × 10⁻² particles/dm3, predominantly in fiber form (74.1%). Outdated technologies and non-compliance with treatment regimens contribute to poor water quality, including high turbidity (87% of samples), color deviations (40% of samples), and acidity issues (20% of samples). To address these challenges, the study examined the sorption efficiency of different sorbents, with results indicating high retention rates (82.7–97.8%) for microplastic particles. Notably, aliphatic structures like PE and PP exhibited higher retention than PET. Among the sorbents tested, the synthesized carbon sorption material (CSM) demonstrated the highest efficiency in both microplastic retention and improvement in water quality parameters, making it a promising option for water treatment facilities and household filters.

1. Introduction

Microplastics, particles smaller than 5 mm, pervade various environmental objects, as evidenced by ongoing scientific investigations worldwide. Documentation exists on their presence in natural waters [1,2], soils [3,4], atmospheric air [5,6], wastewater [7], and municipal solid waste landfills [8]. Initial studies exploring microplastic contamination of drinking water date back to 2017, encompassing examinations of raw and treated water from treatment facilities, tap water, and bottled water [9,10]. Disparities emerge in microplastic concentrations between natural and treated waters, attributed to the lesser susceptibility of groundwater to anthropogenic influences [11].
Nevertheless, the quantification of microplastics in drinking water yields variable data. For instance, in ref. [12], no microplastic particles were discerned, despite employing an analytical method with a relatively high detection limit (60 µm). Conversely, ref. [11] identified minute concentrations, averaging 0.7 microplastics/m3.
The concentration of microplastic fragments increases inversely with particle size, with the regular fragmentation contributing to heightened levels in smaller particles. Consequently, analyses of microplastics smaller than 10 μm in mineralized drinking water [13] unveiled elevated concentrations (656.8 μg/L). Notably, nanomicroplastics, ranging from 0.7 to 20 μm, were detected in Barcelona tap water at notable concentrations, up to 19 μg/L. Diverse polymers such as polyethylene (PE), polypropylene (PP), polyisoprene (PI), polybutadiene (PBD), polystyrene (PS), polyamide (PA), and polydimethylsiloxanes (PDMS) have been identified [14].
Furthermore, studies commonly report higher concentrations of microplastics in bottled water compared to tap water, potentially linked to contamination from plastic packaging materials (e.g., caps and bottles) [15]. Researchers also explore the size distribution of microplastics in drinking water. Disparities in particle size between raw and treated water are documented in [16], where particles larger than 125 µm predominate in raw water, while those between 20 nm and 125 µm are prevalent in treated water.
Understanding the origins of microplastic contamination of drinking water is also a subject of investigation. The primary source of contamination of treated drinking water may be the materials used in containers (e.g., water pipes, bottles) [17]. Additionally, potential secondary contamination may arise from the erosion of plastic pipes within the water supply system [17,18]. The choice of pipe materials is assumed to significantly influence the migration of microplastics during water conveyance and storage. Notably, tap water in contact with polymer pipes exhibits the highest average concentrations of microplastics (polyvinyl chloride (PVC), polyamide (PA), polypropylene (PP), polyethylene (PE), and polyethylene terephthalate (PET)).
The primary forms of microplastic content in drinking water include PET, PP, and PE fibers [16], as well as films [19]. Concerns arise regarding the presence of microplastics in natural waters (potential sources of drinking water) and treated drinking water [19,20], particularly due to the potential ingestion of microplastics through swimming or drinking. Moreover, published data highlight the detection of microplastics in aquatic organisms [21,22], food items [23], and human organs [24,25], suggesting a potential trophic transfer of microplastics through the food chain [26], thereby raising concerns about the potential toxic risks to human health associated with the ingestion of microplastics in food and water [27,28,29].
Reports documenting the presence of microplastics in water are widespread across various regions worldwide, including North and South America [30,31], Asia [32], and Europe [10,33]. However, there has been no systematic monitoring of microplastics in the environment in Kazakhstan. Kazakhstan, ranked 93rd out of 180 countries in the Environmental Performance Index [34] in 2022 and 76th out of 85 in 2023 [35], faces significant environmental quality challenges, particularly concerning the quality of drinking water [36,37]. Consequently, efforts by Kazakhstani authorities and scientists primarily focus on achieving drinking water quality according to standardized indicators, which currently do not include microplastics. Kazakhstani scientists initiated the study of microplastic distribution in human-contact media only in 2022, funded by the Ministry of Science and Higher Education. The widespread use and unregulated disposal of plastics, coupled with a deficient waste management system, pose significant risks of plastic waste pollution in Kazakhstan’s natural environment, potentially serving as sources of microplastics in the soil and natural waters [38,39]. The absence of standards and quality control measures for drinking water regarding microplastic content heightens the likelihood of these pollutants entering the Kazakhstani population’s bodies through drinking water consumption.
The aim of this study is to assess the presence of microplastics in tap water and, by analyzing the current water treatment infrastructure, identify optimal filtration materials for microplastic removal in Kazakhstan. However, purifying water from microplastics presents a formidable challenge. Microplastics represent a diverse group of emerging pollutants with varying structures, sizes, and densities, compounded by their inert properties, rendering them resistant to removal from water [40,41]. Existing water treatment systems exhibit variable efficacy in trapping microplastics, contingent upon factors such as size, nature, and technological sophistication [7,42]. A straightforward approach in drinking water treatment involves passing water through filter media, where the effectiveness of microplastic removal hinges on the pore size of the filter medium. In resource-constrained settings like Kazakhstan, quartz sand serves as a readily available and cost-effective filtering material in drinking water treatment systems. Nonetheless, zeolites and coals, including those indigenous to Kazakhstan, demonstrate notable sorption capabilities against organic contaminants, heavy metals, and radionuclides [43,44,45,46]. Published findings suggest that sand filters could be replaced effectively by aluminosilicate filter media [47], and zeolites have shown promise in microplastic treatment in wastewater [48], while granular coals, when combined with ion exchange and microfiltration, have demonstrated efficacy in removing certain microplastic types [49].
However, research on microplastic water treatment primarily focuses on wastewater and is limited to specific types and sizes of microplastics. Moreover, studies on water treatment for microplastics are comparatively scant, falling short of evidence substantiating their presence in water. There is a dearth of sorption studies for domestically produced plastics in the Kazakhstani market utilizing locally sourced sorbents. Consequently, investigating microplastic content in local tap water as an indicator of water treatment system efficiency in Kazakhstan and evaluating the viability of incorporating local zeolites, activated carbon sorbents (derived from local organic waste) and widely available ion-exchange resins into the sorption complex represents novel and pertinent research. The outcomes of this study will contribute to a better understanding of drinking water quality and offer guidance for effective management of water treatment systems in Kazakhstan in terms of microplastic content.

2. Materials and Methods

2.1. Methods of Sampling and Analyzing Tap Water

To assess microplastic particles and physicochemical parameters in tap water, 15 water samples were collected over the course of one month from various buildings in Kokshetau city and Krasny Yar village, located in the Akmola region of Kazakhstan. These buildings exhibit varying degrees of water supply system degradation, including flats with centralized water supply in multistory buildings and individual houses with water supply pipes constructed between 1960 and 2008.
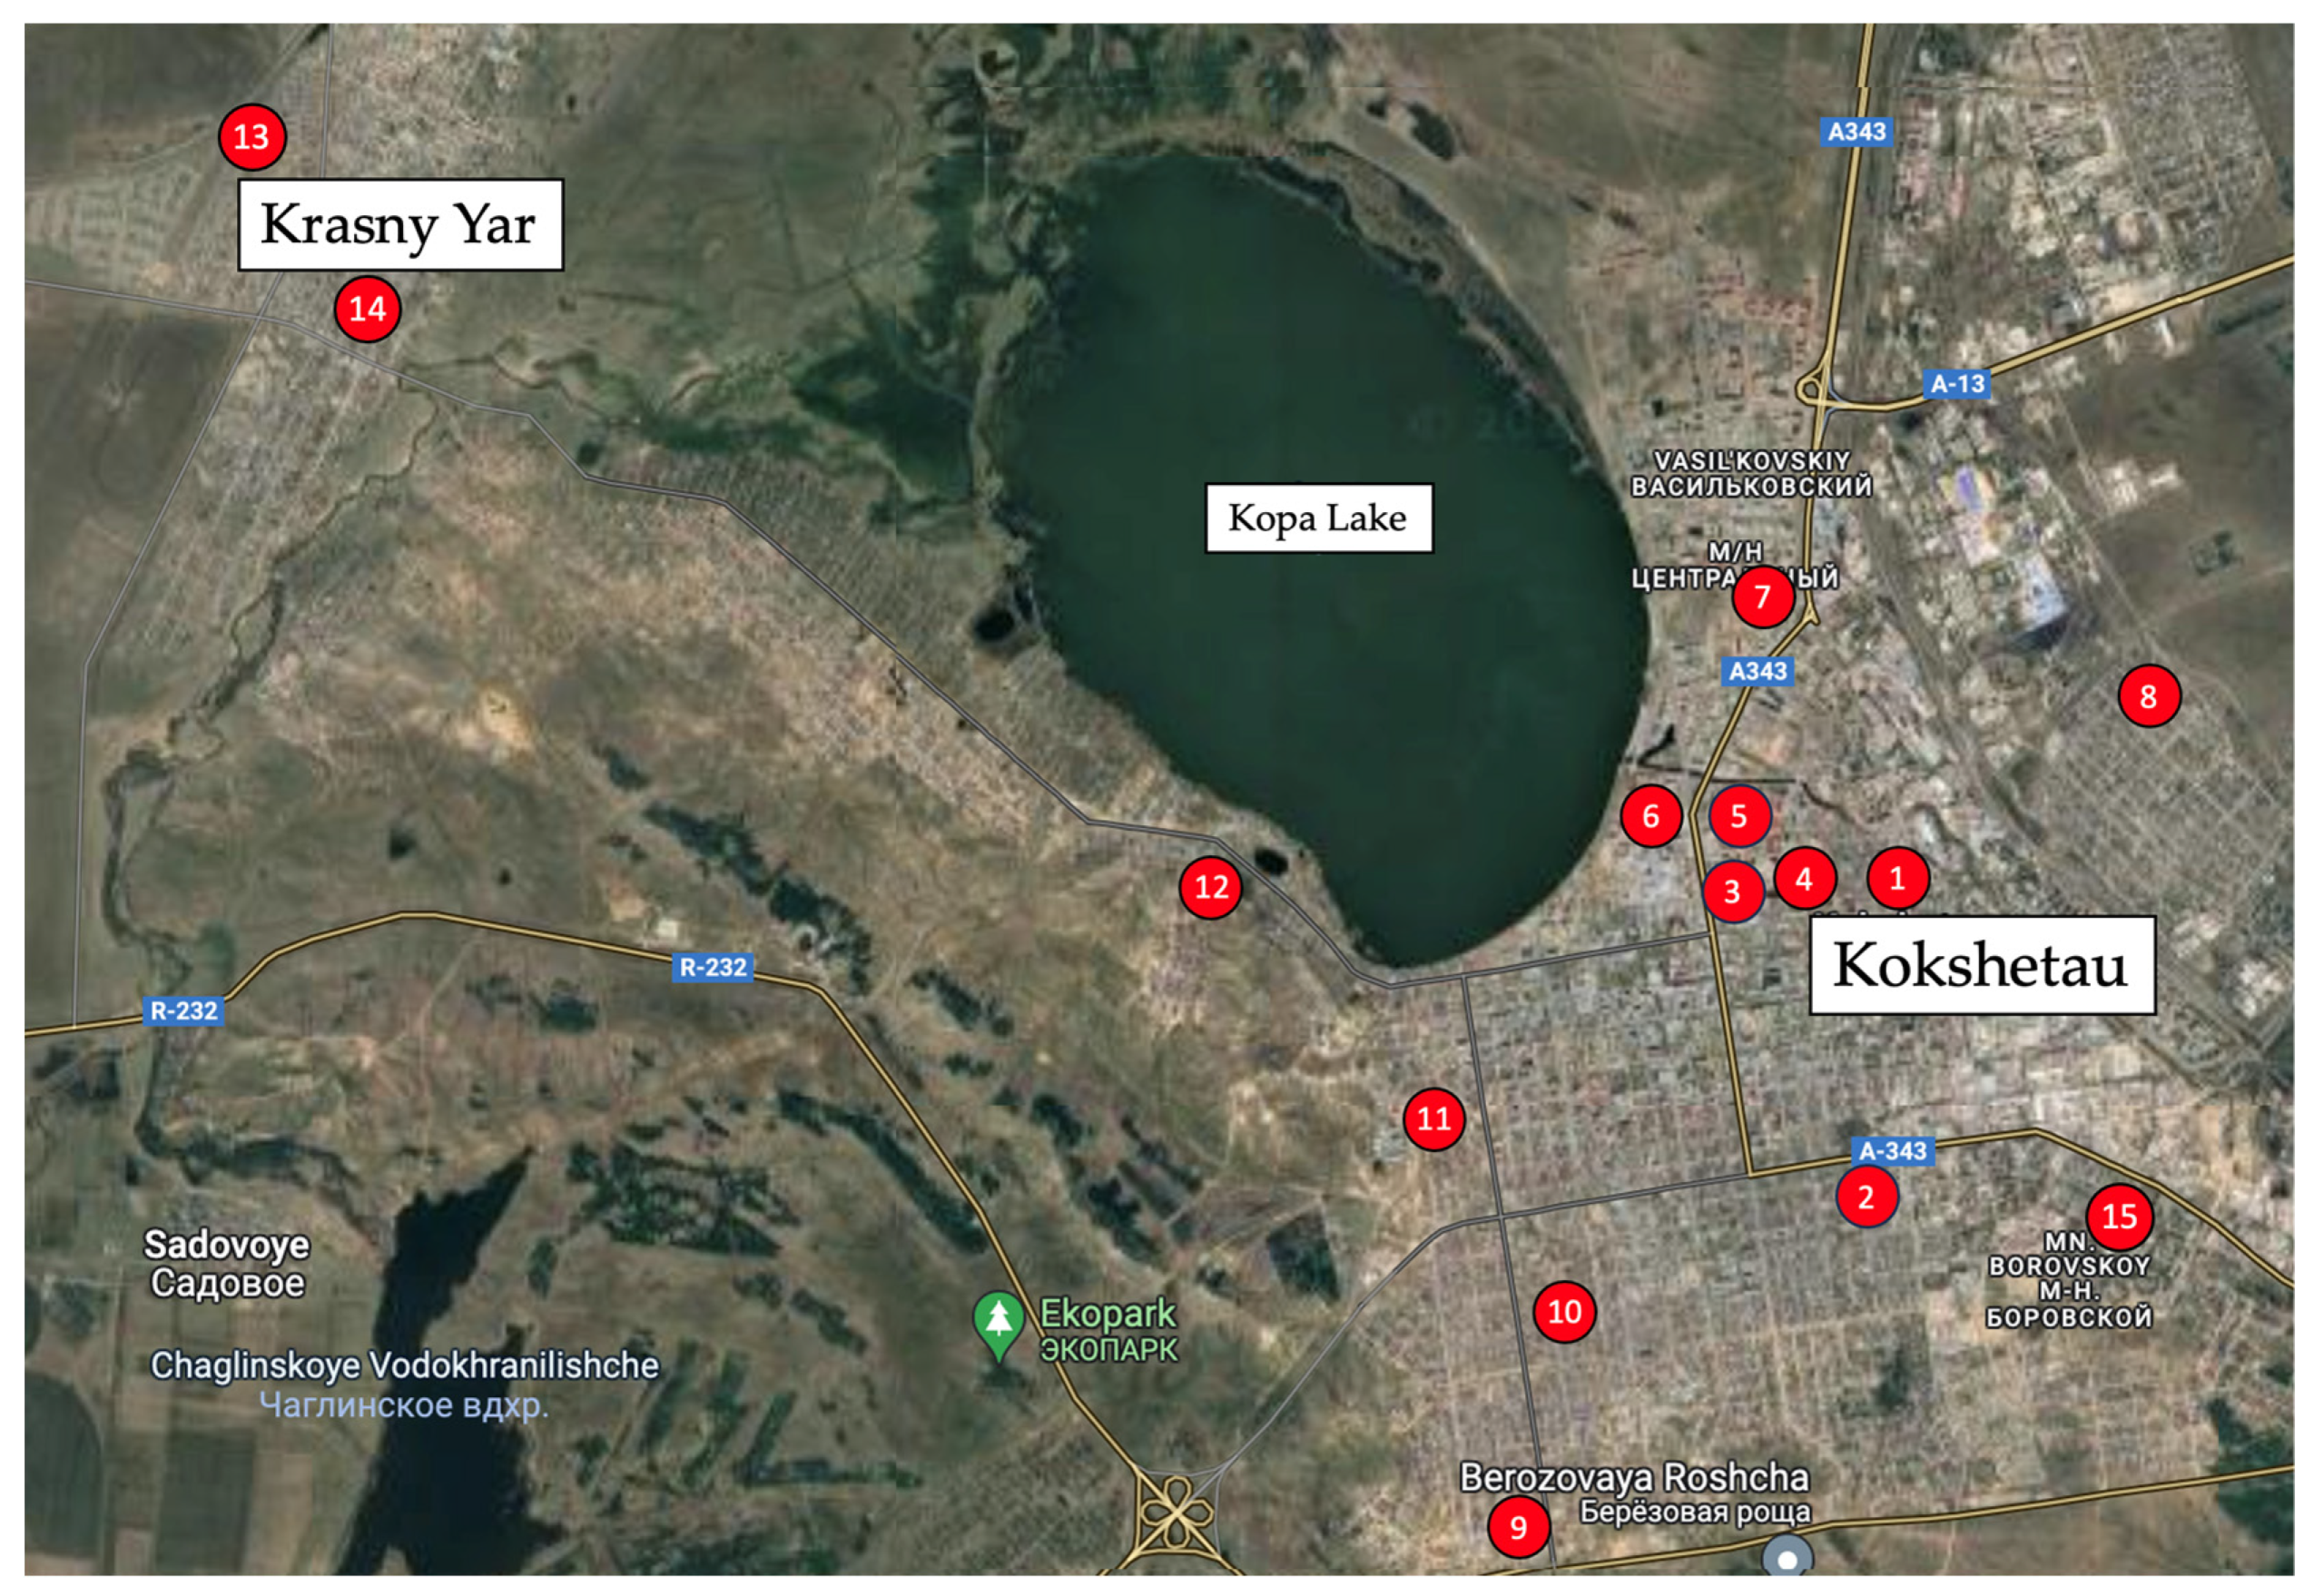
Figure 1 illustrates the geographical location of Kokshetau and Krasny Yar within the Akmola region, while Figure 2 and Table 1 provide details regarding the specific sampling points for tap water within these two cities.
Tap water sampling for microplastic analysis was conducted directly at the water source following the protocol outlined in [50]. Microplastic extraction from water was accomplished using a custom-designed filtration device, which comprised a plastic slip-on coupling with sealing gaskets measuring 110 mm in diameter, featuring a transition from polypropylene. This transition tightly joined with the coupling, as detailed in [51], and connected to a Sefar polyamide filter with a diameter of 120 mm and a mesh size of 300 µm. During tap water sampling, 100 dm3 of water was passed through the polyamide filter. The volume of water drawn was controlled using a metal bucket with a capacity of 10 dm3. Before each filtration, the bucket and filtering device underwent thorough rinsing with distilled water. Subsequently, the filters were placed in labeled glass petri dishes and transported to the laboratory for further analysis.
The surface of the filters was washed with distilled water, and the filter washes were collected in glass heat-resistant beakers. The collected samples underwent non-destructive oxidation for plastics, followed by density separation and the collection of microplastics on filters for subsequent optical identification [52,53,54,55]. To prevent microplastic degradation, the filters were dried in a desiccator at a temperature not exceeding 35 °C within closed petri dishes [56]. The dried filters were then examined under a DTX 500 LCD Levenhuk microscope with photoregistration at magnifications ranging from 100 to 500 [57,58,59]. The concentration of particles/dm3 was calculated based on the volume of water filtered through the filter [60].
In the study, measures were taken to prevent cross-contamination of samples with microplastic according to quality criteria [61,62,63]. The estimation of microplastic particle losses at different stages of the study was carried out by introducing a mixture of microplastics of different compositions into blank samples and further extraction of a known number of colored particles. According to the results of the positive control, the recovery rate of microplastics of the 170–300 µm fraction was 80.32 ± 6.01%.
Analysis of physicochemical parameters of water was carried out according to State mandatory standards 31868-2012 [64], 3351-74 [65], 26449.1-85 [66] and ISO standard 4316-2019 [67].

2.2. Methodology for Sorption Treatment of Water from Microplastics

The investigation into the removal of microplastics from drinking water was conducted using model waters representing the most common types of plastics (PET, PP, PE) utilized for transporting or storing drinking water in Kazakhstan. To generate plastic microparticles, PET bottles and water pipes made of PP and PE were crushed using a homemade crusher, grinding equipment, laboratory mill, and other methods. The resulting shredded particles were then sieved using a Lab-VIBSIEVE-8 electric vibrating screen (Bessaiman Group LLP, Almaty, Kazakhstan) to obtain fractions with sizes of 0.45 mm, 0.2 mm, 0.105 mm, and 0.0063 mm.
Sorption materials were chosen based on their availability and widespread application in water treatment in Kazakhstan and globally [68,69,70,71]:
  • Carbon sorption material (CSM), obtained by carbonizing apricot pits, an annually renewable waste material from plant sources.
  • Zeolite sourced from the Chankanaisky zeolite deposit in the Kerbulak district of the Almaty region, Republic of Kazakhstan. This zeolite is a medium-porous material with a brown hue, featuring particle sizes not exceeding 2–4 mm. Its generalized formula is Kx/n [Alx Si Oy2 (x + y)] × pH2O, where K represents alkali and alkaline-earth metal cations, ammonium, etc., p denotes cation charge, y/x = 1:6, and p/x = 1:4.
  • A complex comprising activated carbon sorption material (CSM) and ion exchange resins, specifically anionite Ecotar-B and cationite KU-2-8, utilized in household filters for drinking water treatment at a ratio of 1:1:1 (CSM:anionite:cationite).
The carbon sorption material was derived from the carbonization of apricot pits, which are agricultural industry by-products. Dried apricot pits were crushed into particles ranging from 2 to 4 mm in size and then placed in a carbonization reactor. The carbonization process was conducted under precisely controlled isothermal conditions (at a temperature of 850 °C) within a rotating reactor, and the environment was filled with an inert gas (argon), supplied into the reactor at a constant rate of 50 cm3/min. Following carbonization, the samples were activated using a potassium hydroxide solution in a 1:2 ratio.
Electron microscopy was employed to examine the morphological and structural characteristics of the synthesized carbon sorption materials (CSMs) using a Quanta 3D 200iDualSystem (FEI company, Hillsboro, OR, USA), an FEI double-beam microscope that integrates scanning electron microscopy (SEM) and ion scanning microscopy. Additionally, it features an integrated energy-dispersive microanalysis system. The specific surface area of the sorbents and the specific pore volume were determined on a Sorbtometer-M analyzer manufactured by Katakon LLP (Novosibirsk, Russia) using the Brunauer–Emmet–Teller low-temperature nitrogen adsorption method [72]. This method is associated with the evacuation of air and moisture from the sample by heating (to 200 °C) under high vacuum, which makes it impossible to determine the specific surface area and specific pore volume of sorption materials of organic origin, such as ion exchange resins.
The elemental composition of the sorbents, including a sample of carbon sorption material and zeolite, was determined using an energy dispersive spectrometer, which serves as an auxiliary device of the Quanta 3D 200iDualSystem scanning electron microscope (refer to Table 2 and Table 3 for detailed results).
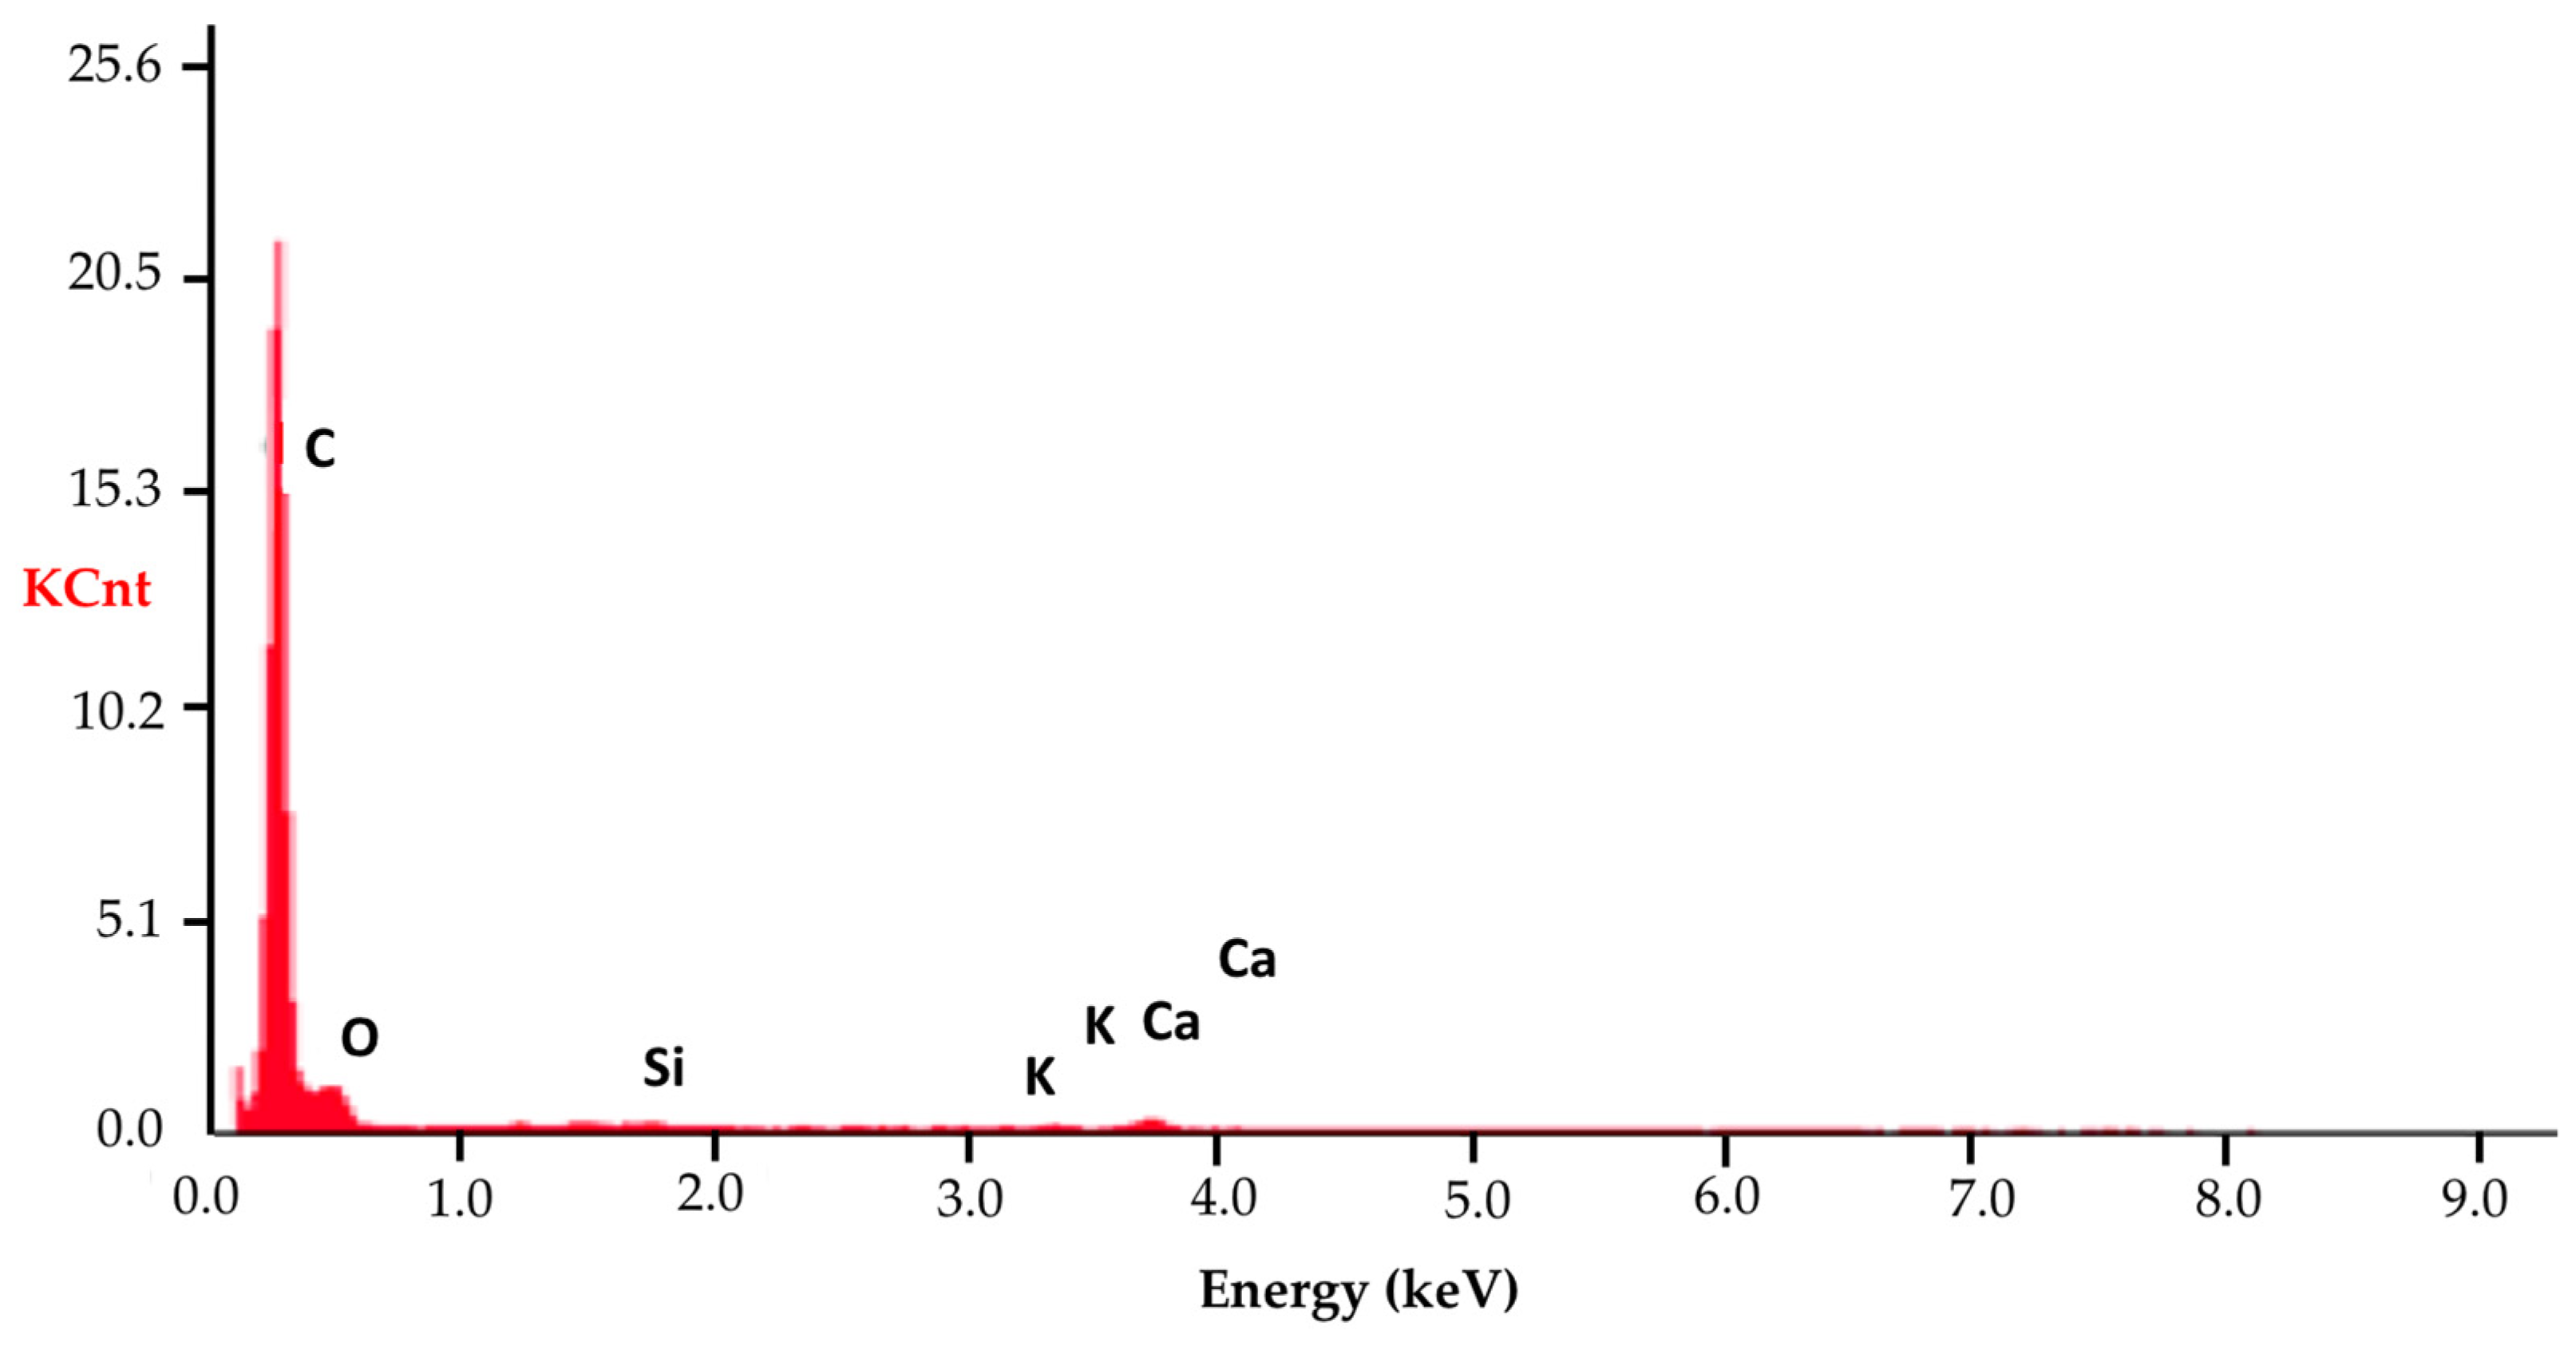
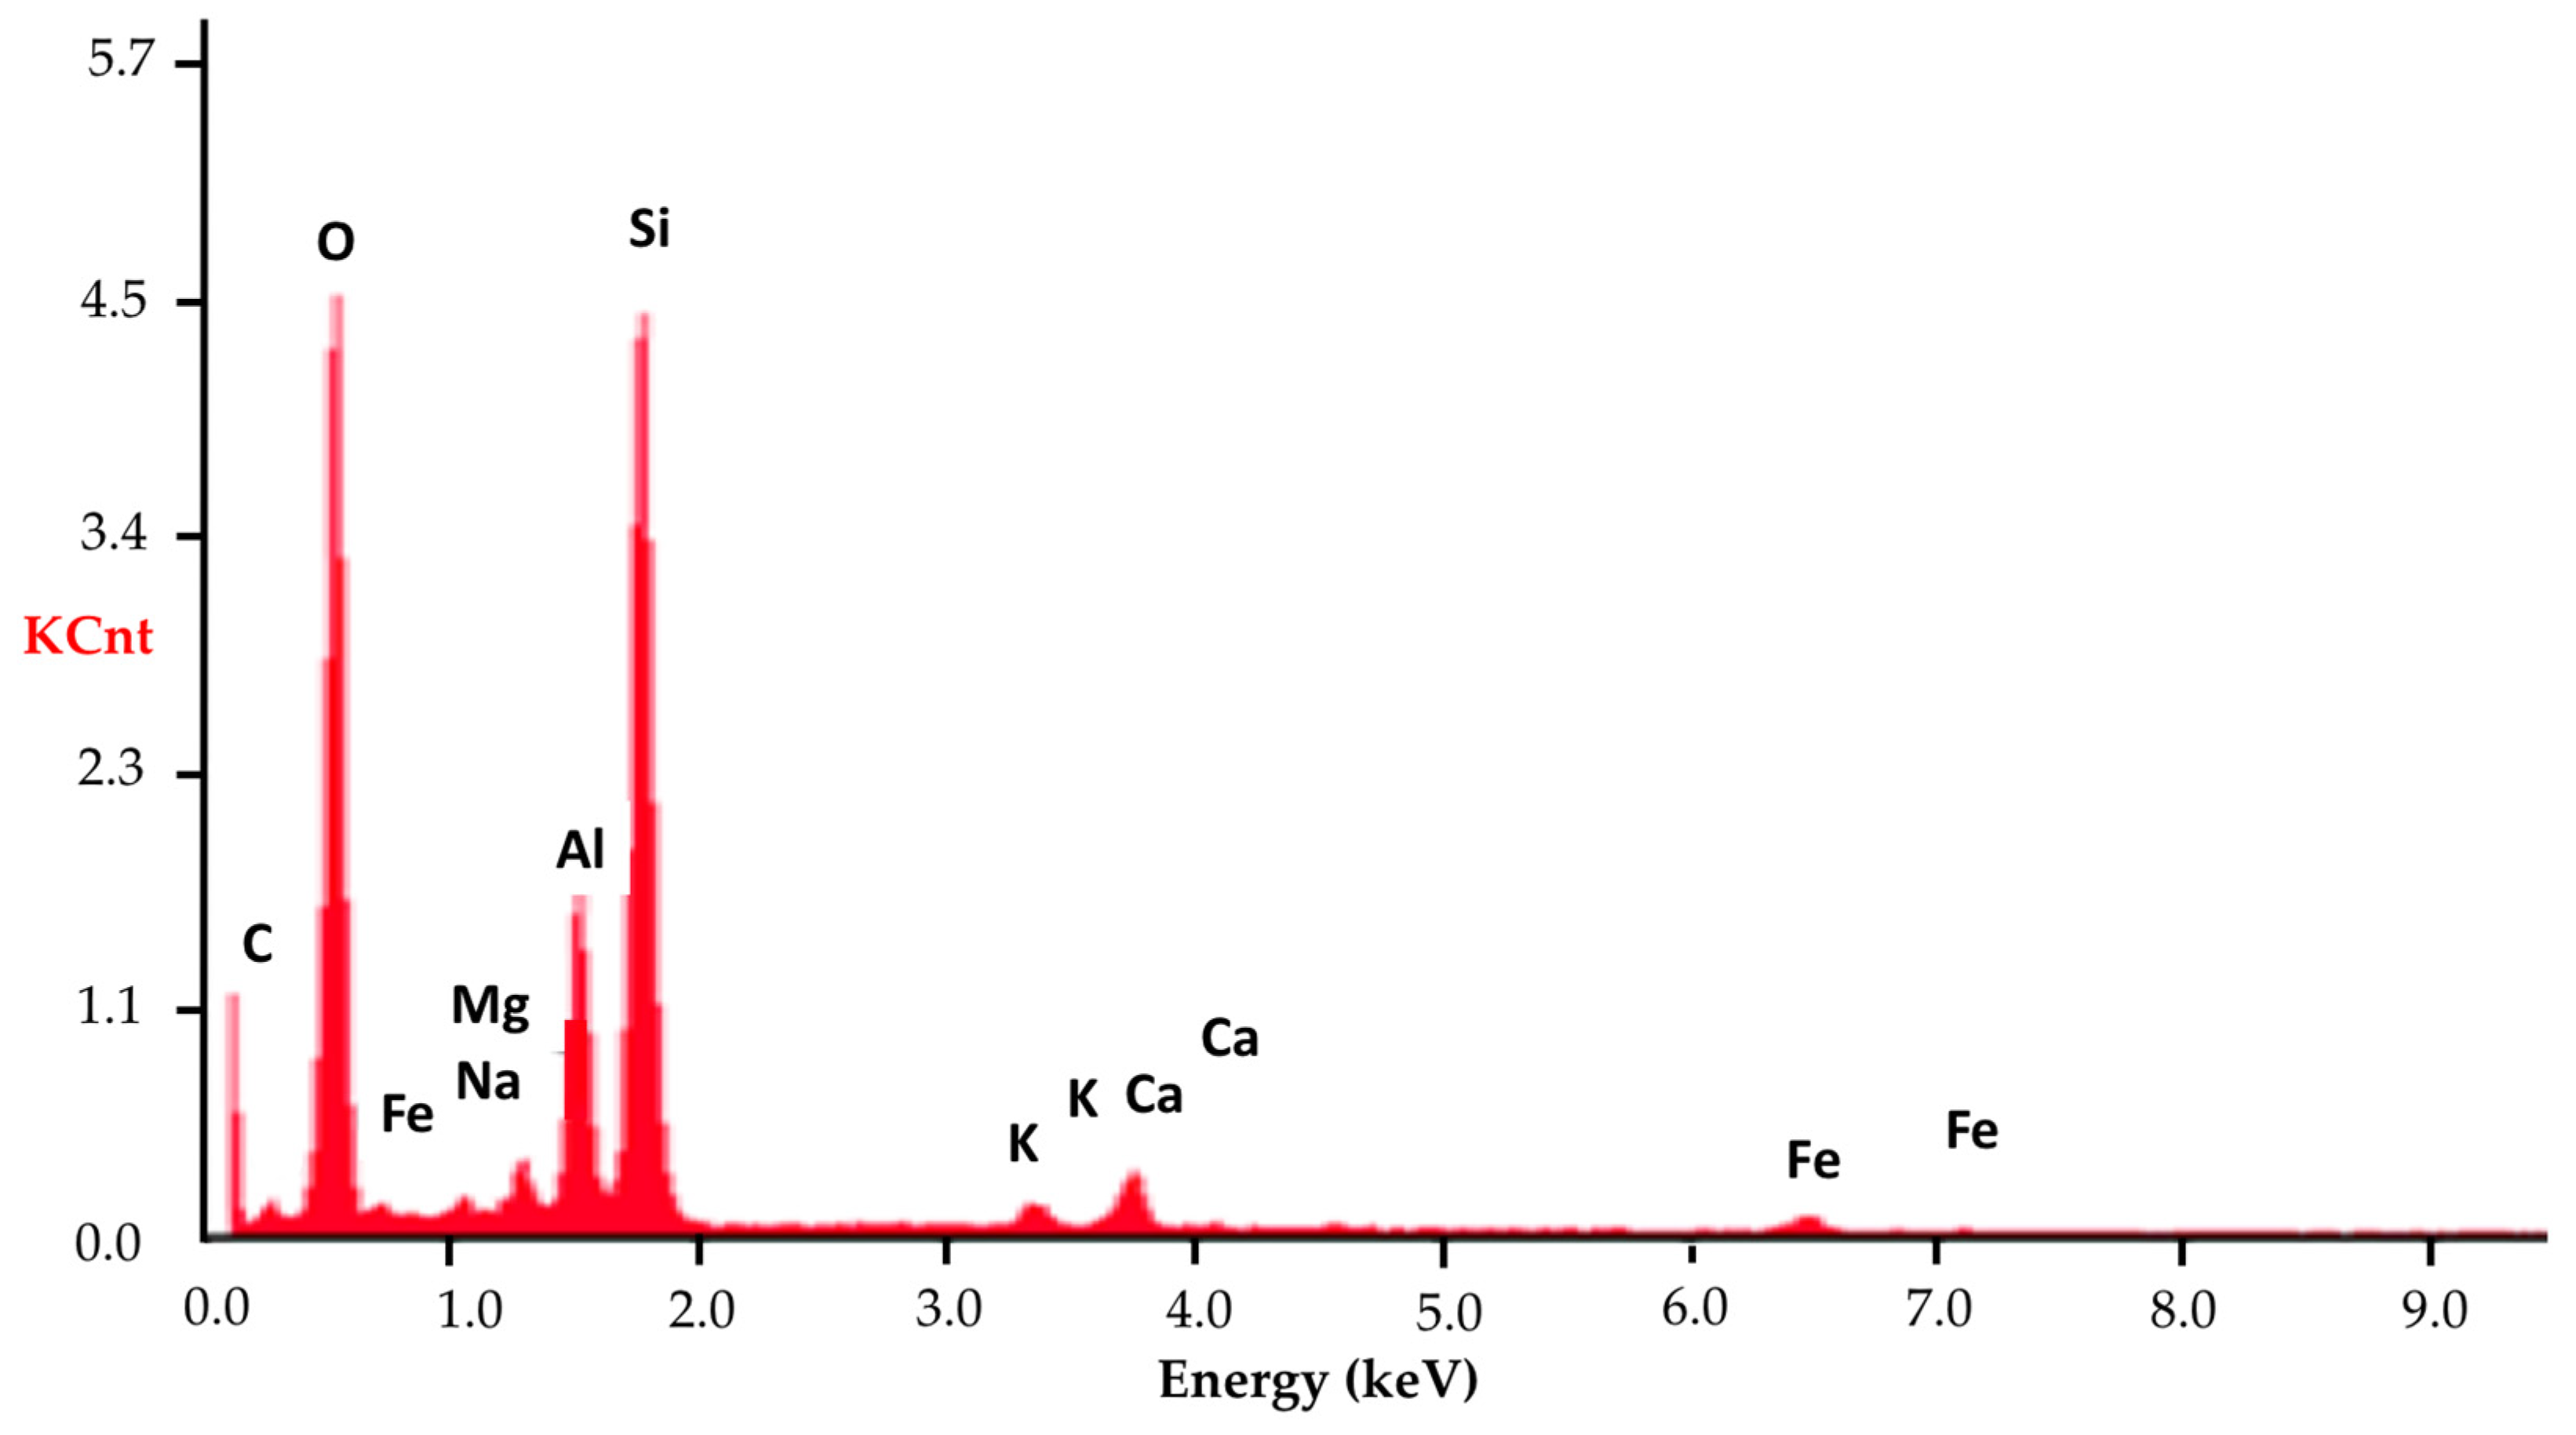
As shown in Table 2, 92.45% of the composition of CSM is carbon. The EDX spectrum of carbon sorption material is shown in Figure 3. The energy-dispersive spectrum of elemental composition of zeolite is presented in Figure 4. The main element in the composition of zeolites is oxygen (60.09% of the total composition), as shown in Table 3.
The energy-dispersive spectrum of the elemental composition of the sorbent (ion exchange resins) was established using an energy-dispersive X-ray analyzer built into a JSM-6490LA scanning electron microscope (JEOL Ltd., Tokyo, Japan) and is presented in Figure 5.
The main element in the composition of sorbent (CSM + ion exchange resins) is carbon (84.06%), as shown in Table 4. There is a decrease in carbon content and an increase in oxygen content in comparison with the original CSM.
Glass columns containing sorbent materials (CSM, zeolite, complex of CSM + ion-exchange resins) were prepared for purifying water from plastic microparticles. Prior to sorption, the columns were rinsed with distilled water (300 dm3 volume) to remove any fine dust-like particles of sorbents. Model solutions of polymers (PET, PP, PE) were created by mixing 0.2 g of microplastics of a specific fraction in 10 dm3 of distilled water. The mass of microplastics before and after sorption was measured using a RADWAG 220R2 analytical scale (RADWAG Wagi Elektroniczne, Radom, Poland) with an accuracy of ±0.0001 g.
The prepared model solutions of microplastics were then passed through the sorbent columns, followed by washing the columns with 200 mL of distilled water. The water that passed through the columns was collected for subsequent optical analysis.
Samples of the initial plastics used to prepare the model solutions were analyzed using infrared (IR) spectroscopy on a Shimadzu IR-Prestige 21 instrument (Shimadzu Corporation, Kyoto, Japan) in the wavelength range of 4000–400 cm−1. The IR spectra were obtained without special sample preparation using the DuraSampl IR II (Smiths detection, Danbury, CT, USA) broken total internal reflection attachment with single reflection (prism material diamond on ZnSe substrate). To identify polymers, we analyzed absorption bands caused by stretching and bending vibrations of groups characteristic of certain types of polymers. IR spectra were compared with library databases such as IRs Polymer2, Polymer, T-Polymer and T-Organic in order to identify the structures of polymers that are difficult to interpret (PET, microplastics found in tap water).

3. Results and Discussion

3.1. Analysis of Technological Processes of Water Treatment in Kazakhstan

Surface water sources constitute the primary source of drinking water for the population of cities in Kazakhstan, accounting for 96.1% of supply, with centralized water supply serving 94.7% of the population. Among these, 14.6% of the population utilizes standpipes [73].
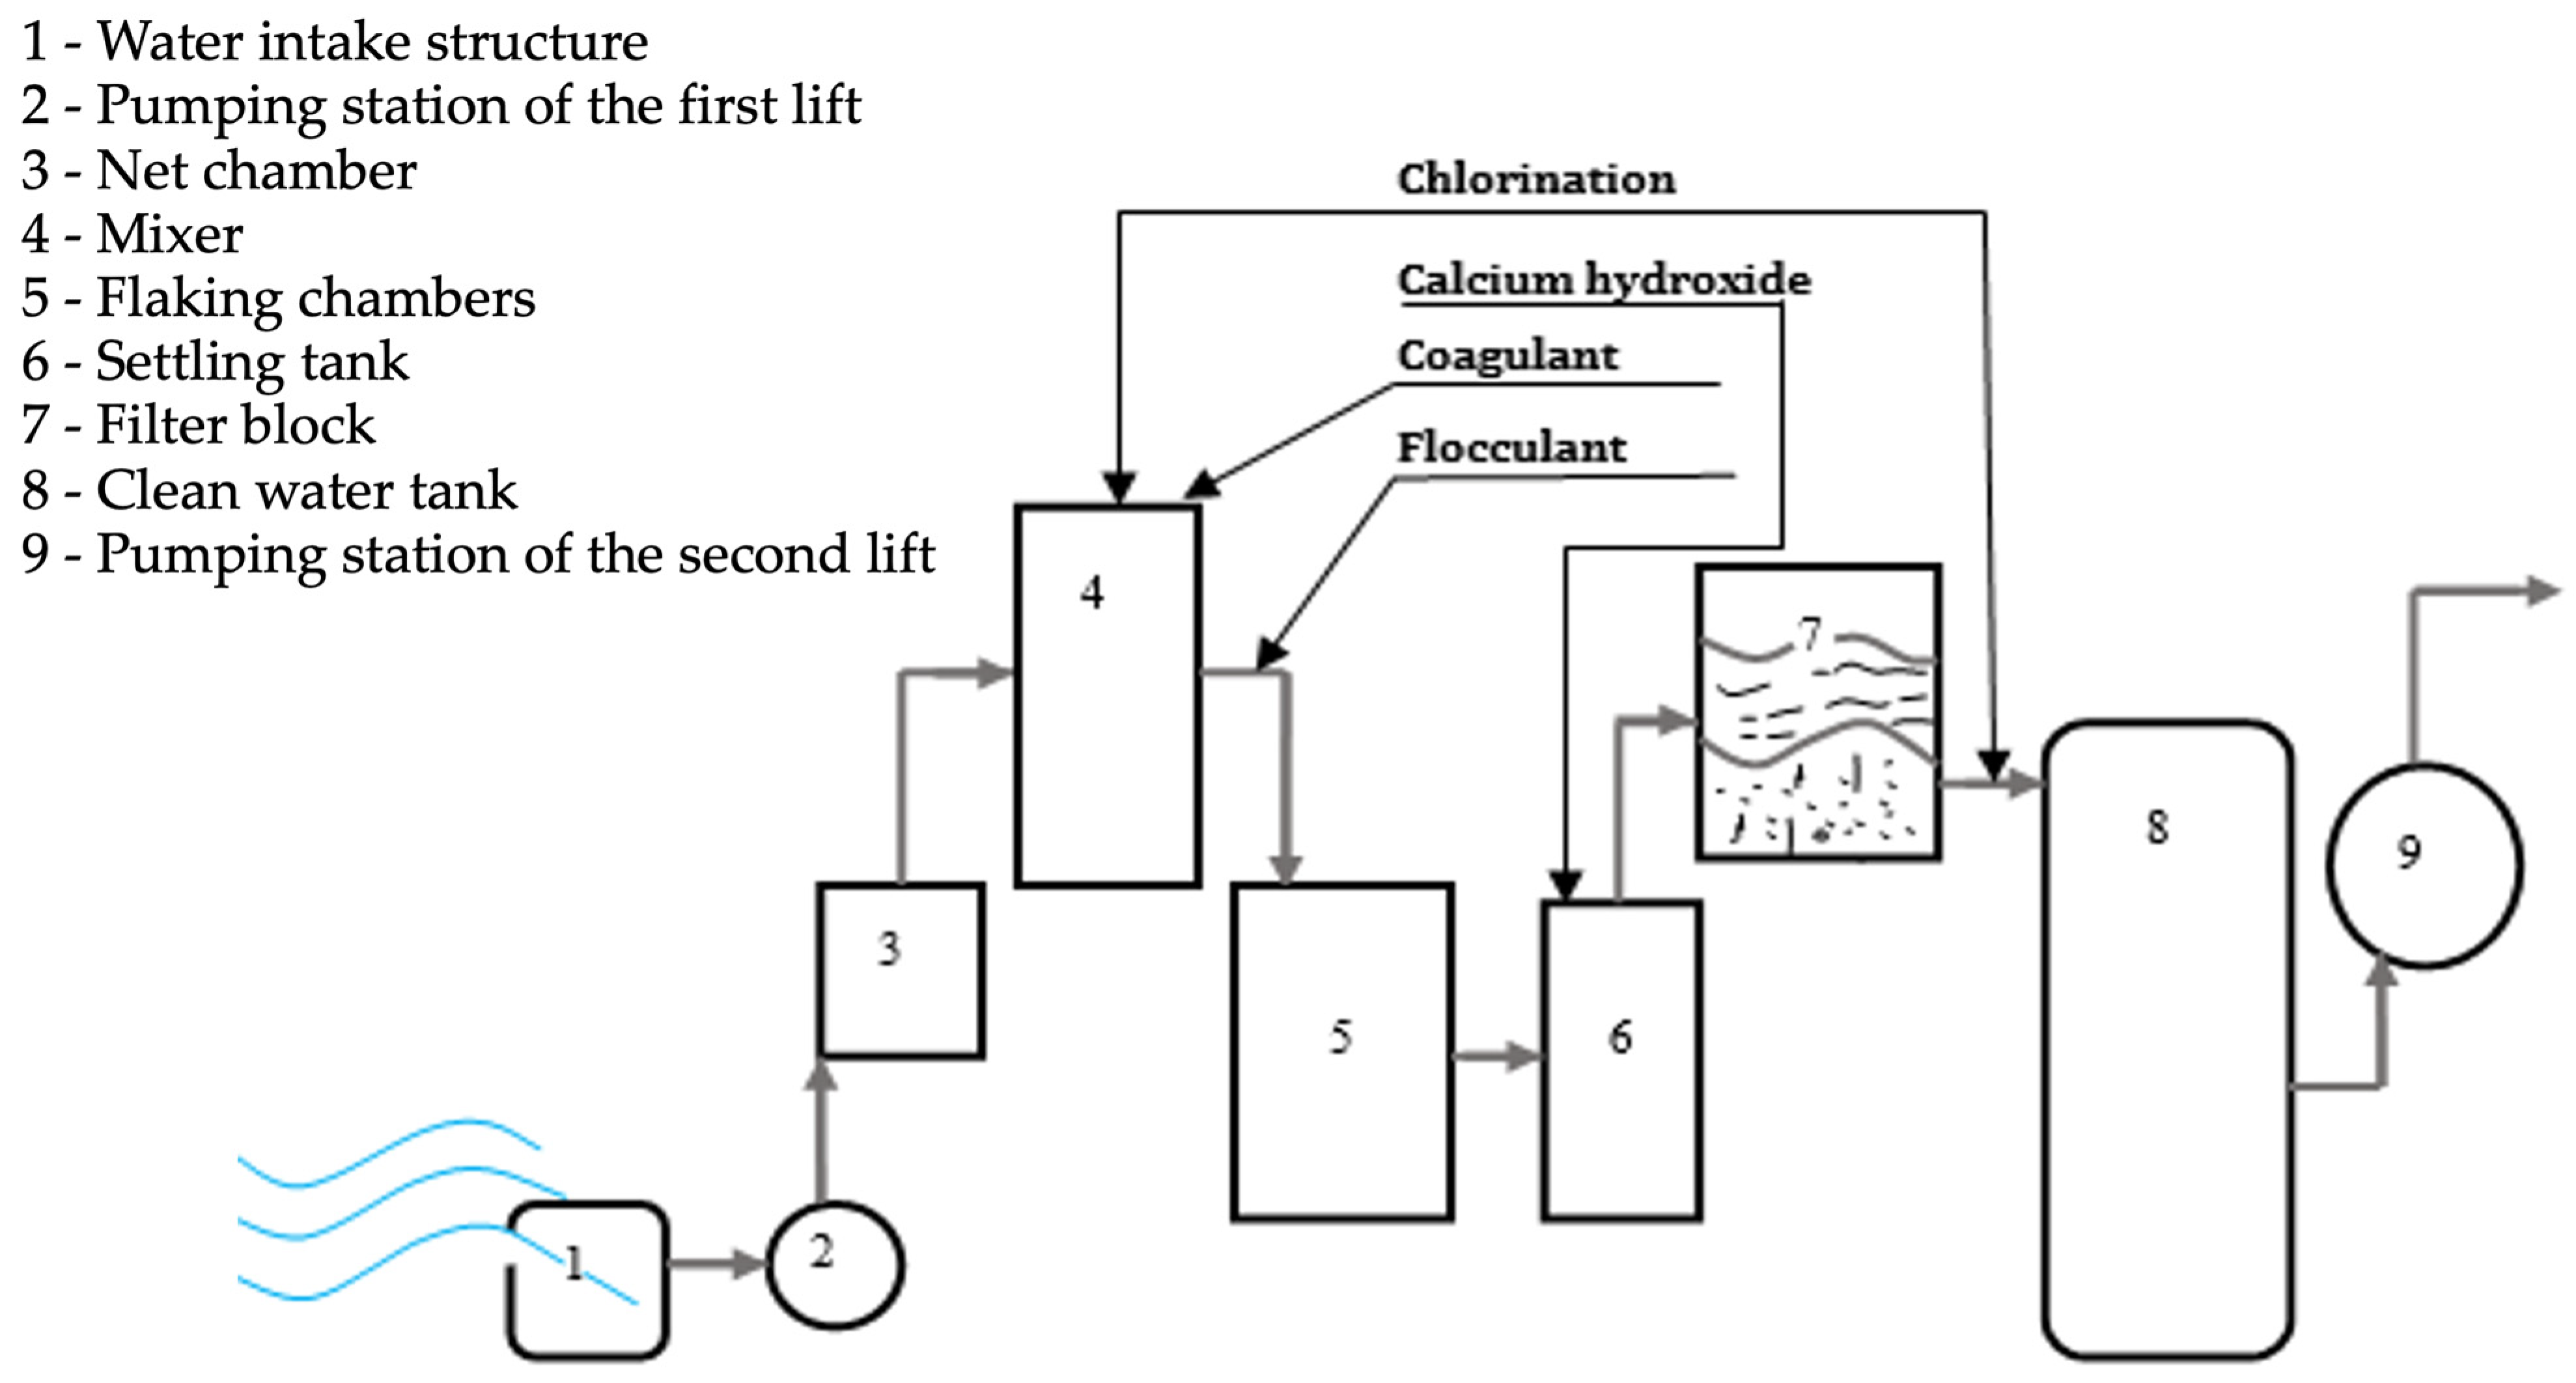
The construction of water supply systems in Kazakhstani cities began in the early 1950s, with significant development occurring between 1960 and 1970. During this period, extensive water supply and sewerage infrastructure was established, resulting in a total urban water supply network length of 23.44 thousand kilometers. However, prolonged operation without adequate maintenance and timely renovation has led to considerable wear and tear of the fixed assets within water supply and sewerage systems. Consequently, the technical condition of water supply and drainage systems in most cities and towns of Kazakhstan is deemed critical [74]. The fundamental processes of drinking water treatment technology within the water supply system are depicted schematically in Figure 6.
A conventional purification scheme is implemented to clarify and treat water entering the municipal water supply, encompassing the following processes.
  • Mechanical cleaning: Coarse debris is removed through screening or gridding.
  • Settling: Preliminary removal of suspended solids occurs in settling tanks (radial or horizontal).
  • Coagulation: Reagents such as iron chloride or aluminum sulfate are used to induce coagulation.
  • Flocculation: Aggregation of particles into larger masses for easier removal.
  • Alkalization: Water may be alkalinized with a calcium hydroxide solution if necessary.
  • Clarification: Large impurities precipitate and settle in settling tanks for 3–4 h after coagulation and flocculation.
  • Filtration: Final clarification and removal of bacteria, and small impurities are achieved through rapid filtration. Quartz sand (Kokshetau) or a combination of quartz sand and silica (Almaty) serve as filtering materials.
  • Disinfection: Water is disinfected by chlorination to maintain residual free chlorine content in the supplied water at 0.3–0.5 mg/L. Currently, water disinfection is accomplished using sodium hypochlorite (NaClO) solution produced from table salt at electrolysis plants.
  • Fluoridation: Fluoride content in drinking water is adjusted at the fluorator unit when it falls below 0.5 mg/L, raising it to a concentration of 0.9–1.2 mg/L. Sodium fluoride is typically used as the reagent.
The treated water is conveyed to clean drinking water tanks, from where it is distributed to consumers through gravity and pumping stations within the distribution network. Quality control of treated drinking water is conducted to ensure compliance with sanitary norms [75], which presently do not stipulate limits on the content of microplastic particles.
Analysis of the technological process of drinking water treatment in Kazakhstan has enabled an assessment of its potential efficacy in retaining particles smaller than 5 mm. The disinfection stage, particularly chlorination, may impact the structure of polymers, indirectly influencing their sorption and sedimentation capacity. However, there is no definitive consensus on the effect of chlorination on the degree of microplastic removal from drinking water [76,77]. Due to the unique physicochemical properties of microplastics, characterized by a small surface area and minimal porosity, their removal from water is primarily influenced by mechanical processes such as filtration and sedimentation, as well as the physicochemical process of coagulation [78,79,80].
In Kazakhstan, mechanical filtration of treated water is performed through screens and grids featuring vertical or inclined metal bars spaced at regular intervals (15–20 mm or more) to create a mesh-like structure (Figure 7a). This design anticipates that natural water pretreatment on these grids can effectively capture macroplastic particles larger than 15–20 mm. Subsequently, water coarse-filtered from larger impurities on the meshes/grids undergoes further treatment in sedimentation tanks (Figure 7b), engineered to retain suspended solids larger than 0.2–1 mm [81].
The potential efficacy of the coagulation stage within the Kazakhstani water treatment system can be assessed based on findings from published studies. For instance, in ref. [82], the efficiency of microplastics removal using coagulants derived from Al and Fe salts in the presence of sodium dodecylbenzenesulfonate was reported as 95.92% and 98.9%, respectively. However, the specific size range of effectively removed microplastic particles was not specified in the study. Conversely, in [83], it was observed that with the coagulant Al2(SO4)3, the deposition rate of pure plastic remained below 2.0% for all plastic particle sizes. Even with the addition of the coagulant PolyDADADMAC, the maximum removal achieved was only 13.6% for particle sizes ranging from 45–53 μm. The authors highlighted that the critical size at which microplastic removal efficiency significantly decreased was within the range of 10–20 μm. However, the sequential combination of coagulation and sand filtration was found to completely remove microplastics larger than 45 μm [84].
Thus, by adhering to the prescribed technological process regimes of drinking water treatment in Kazakhstan, it is feasible to retain microplastic particles larger than 45 microns. However, the non-compliance with water treatment protocols in Kokshetau city, such as the absence of coagulation and flotation units, coupled with a limited number of sand filters with low productivity, results in the presence of microplastics in tap water samples from Kokshetau city, particularly in sizes exceeding 300 µm (refer to Section 3.2).

3.2. Microplastics in Tap Water

The results of the physicochemical analysis of 15 water samples for color, turbidity, pH, acidity, and microplastic content are summarized in Table 5.
Analysis of Table 5 reveals inconsistencies in the quality of drinking water across the majority of samples, potentially attributable to the degradation of water supply networks and the subpar quality of water provided by the Kokshetau Su Arnasy water treatment facilities. Exceedances of sanitary and hygienic quality standards for drinking water are observed in the following parameters.
  • Turbidity: Exceedance in 87% of samples (ranging from 1.26 to 6.33 times the maximum allowable concentration).
  • Color: Exceedance in 40% of samples (ranging from 1.10 to 1.85 times the maximum allowable concentration).
  • Acidity: Exceedance in 20% of samples (ranging from 1.1 to 1.36 times the maximum allowable concentration).
Only two samples, collected from private houses in Krasny Yar village (samples 13 and 14), comply with sanitary–hygienic norms. These samples from Krasny Yar village met the standards for the studied indicators.
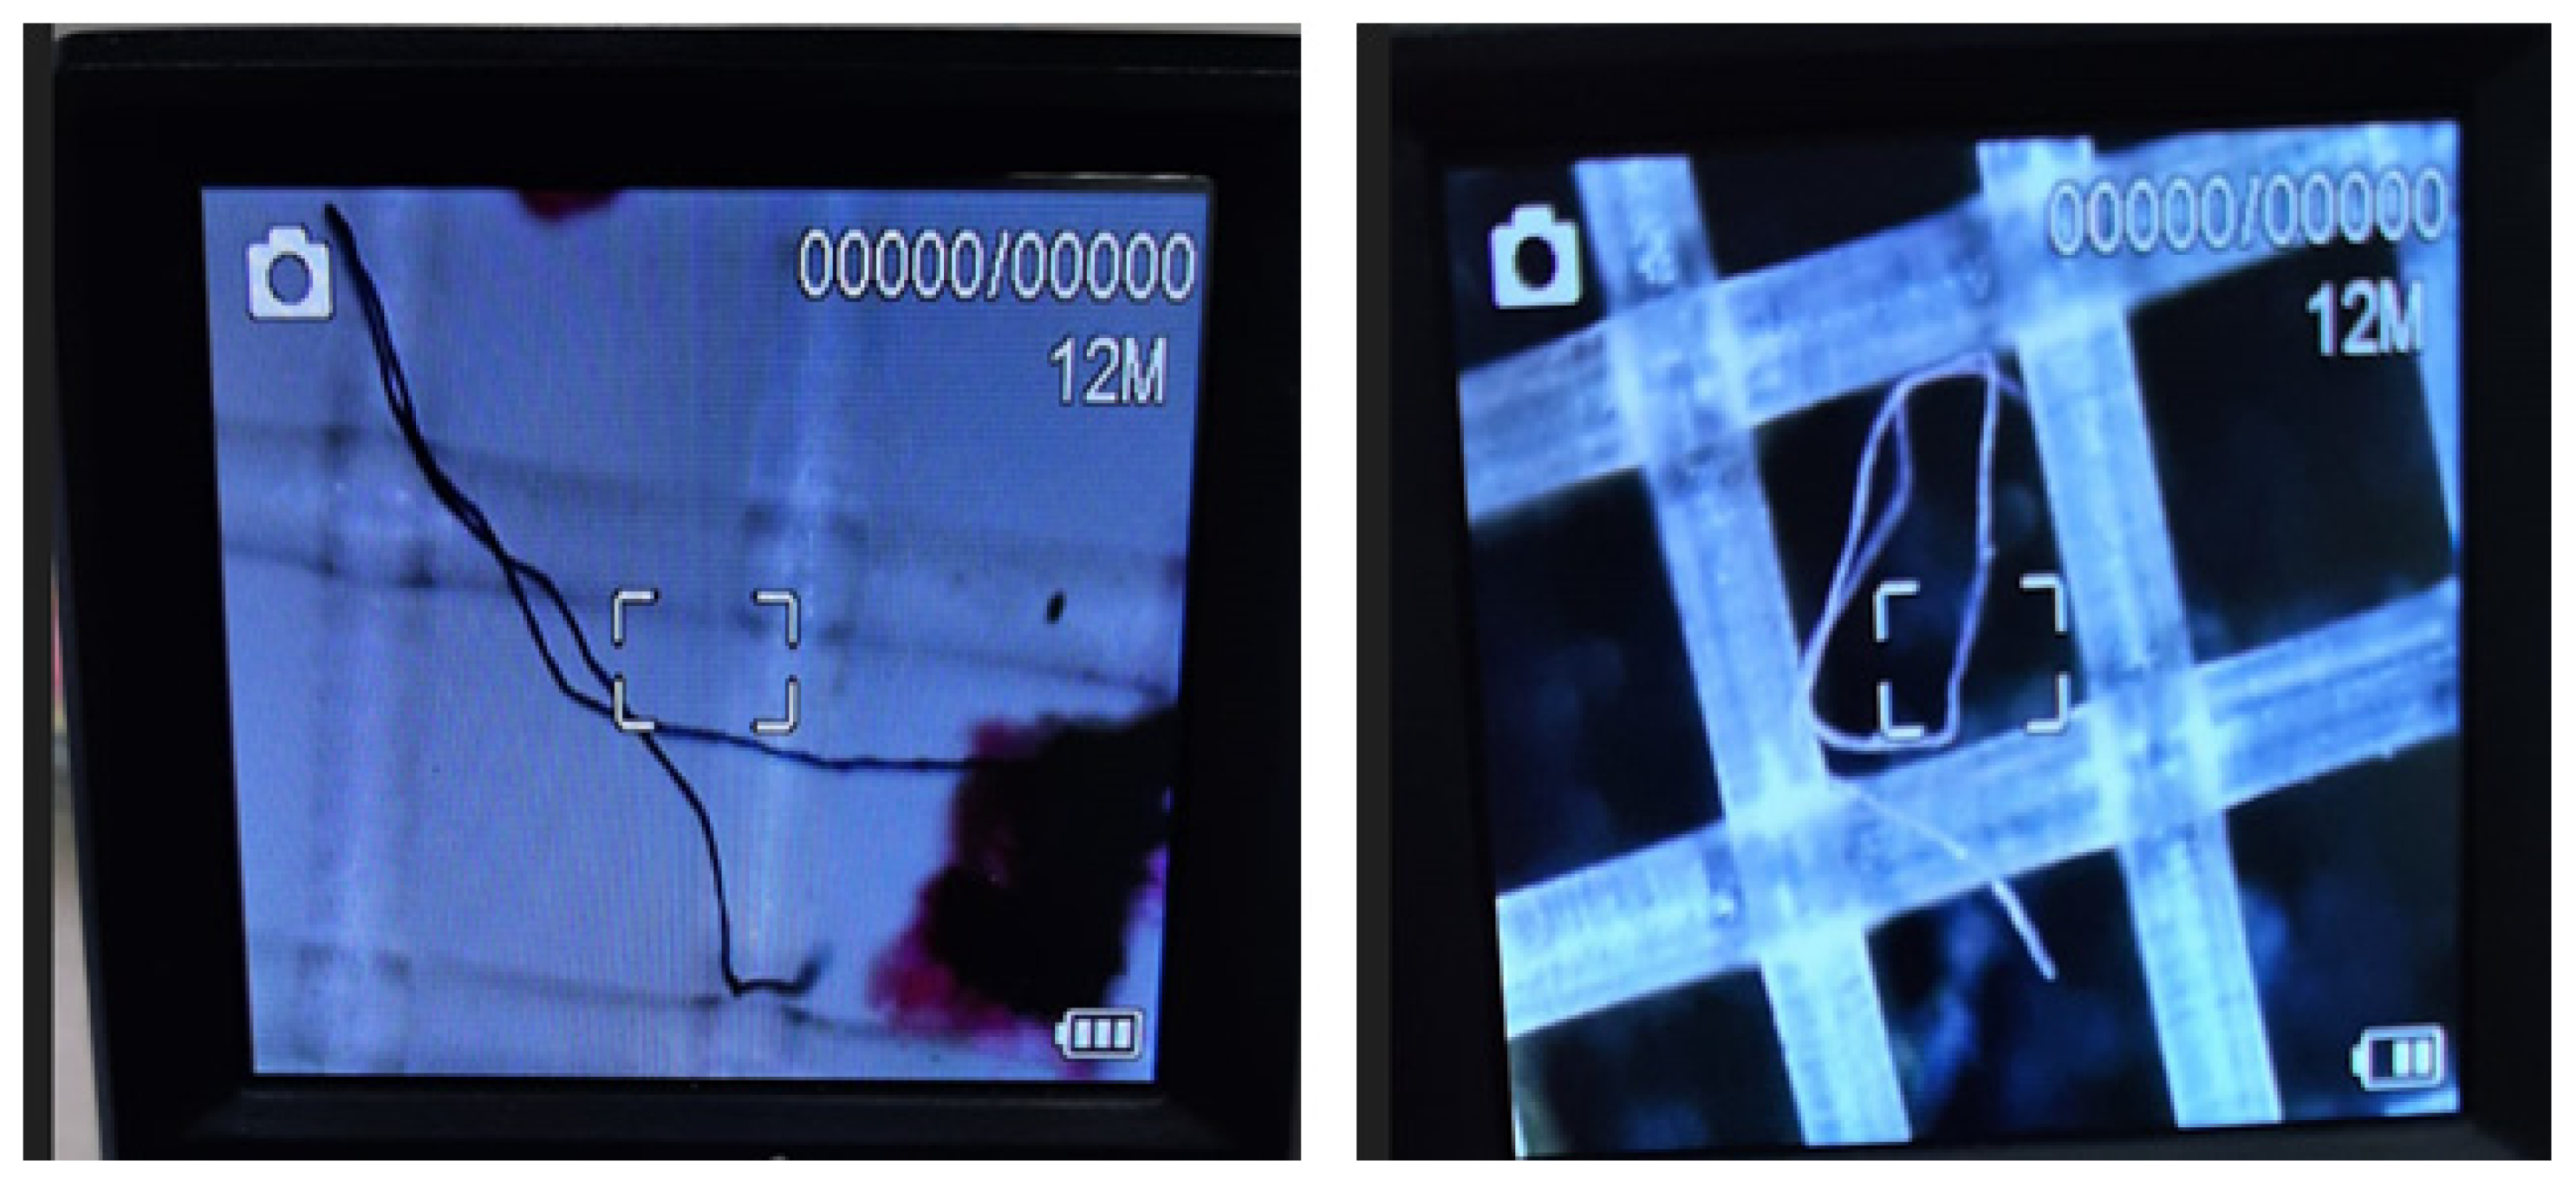
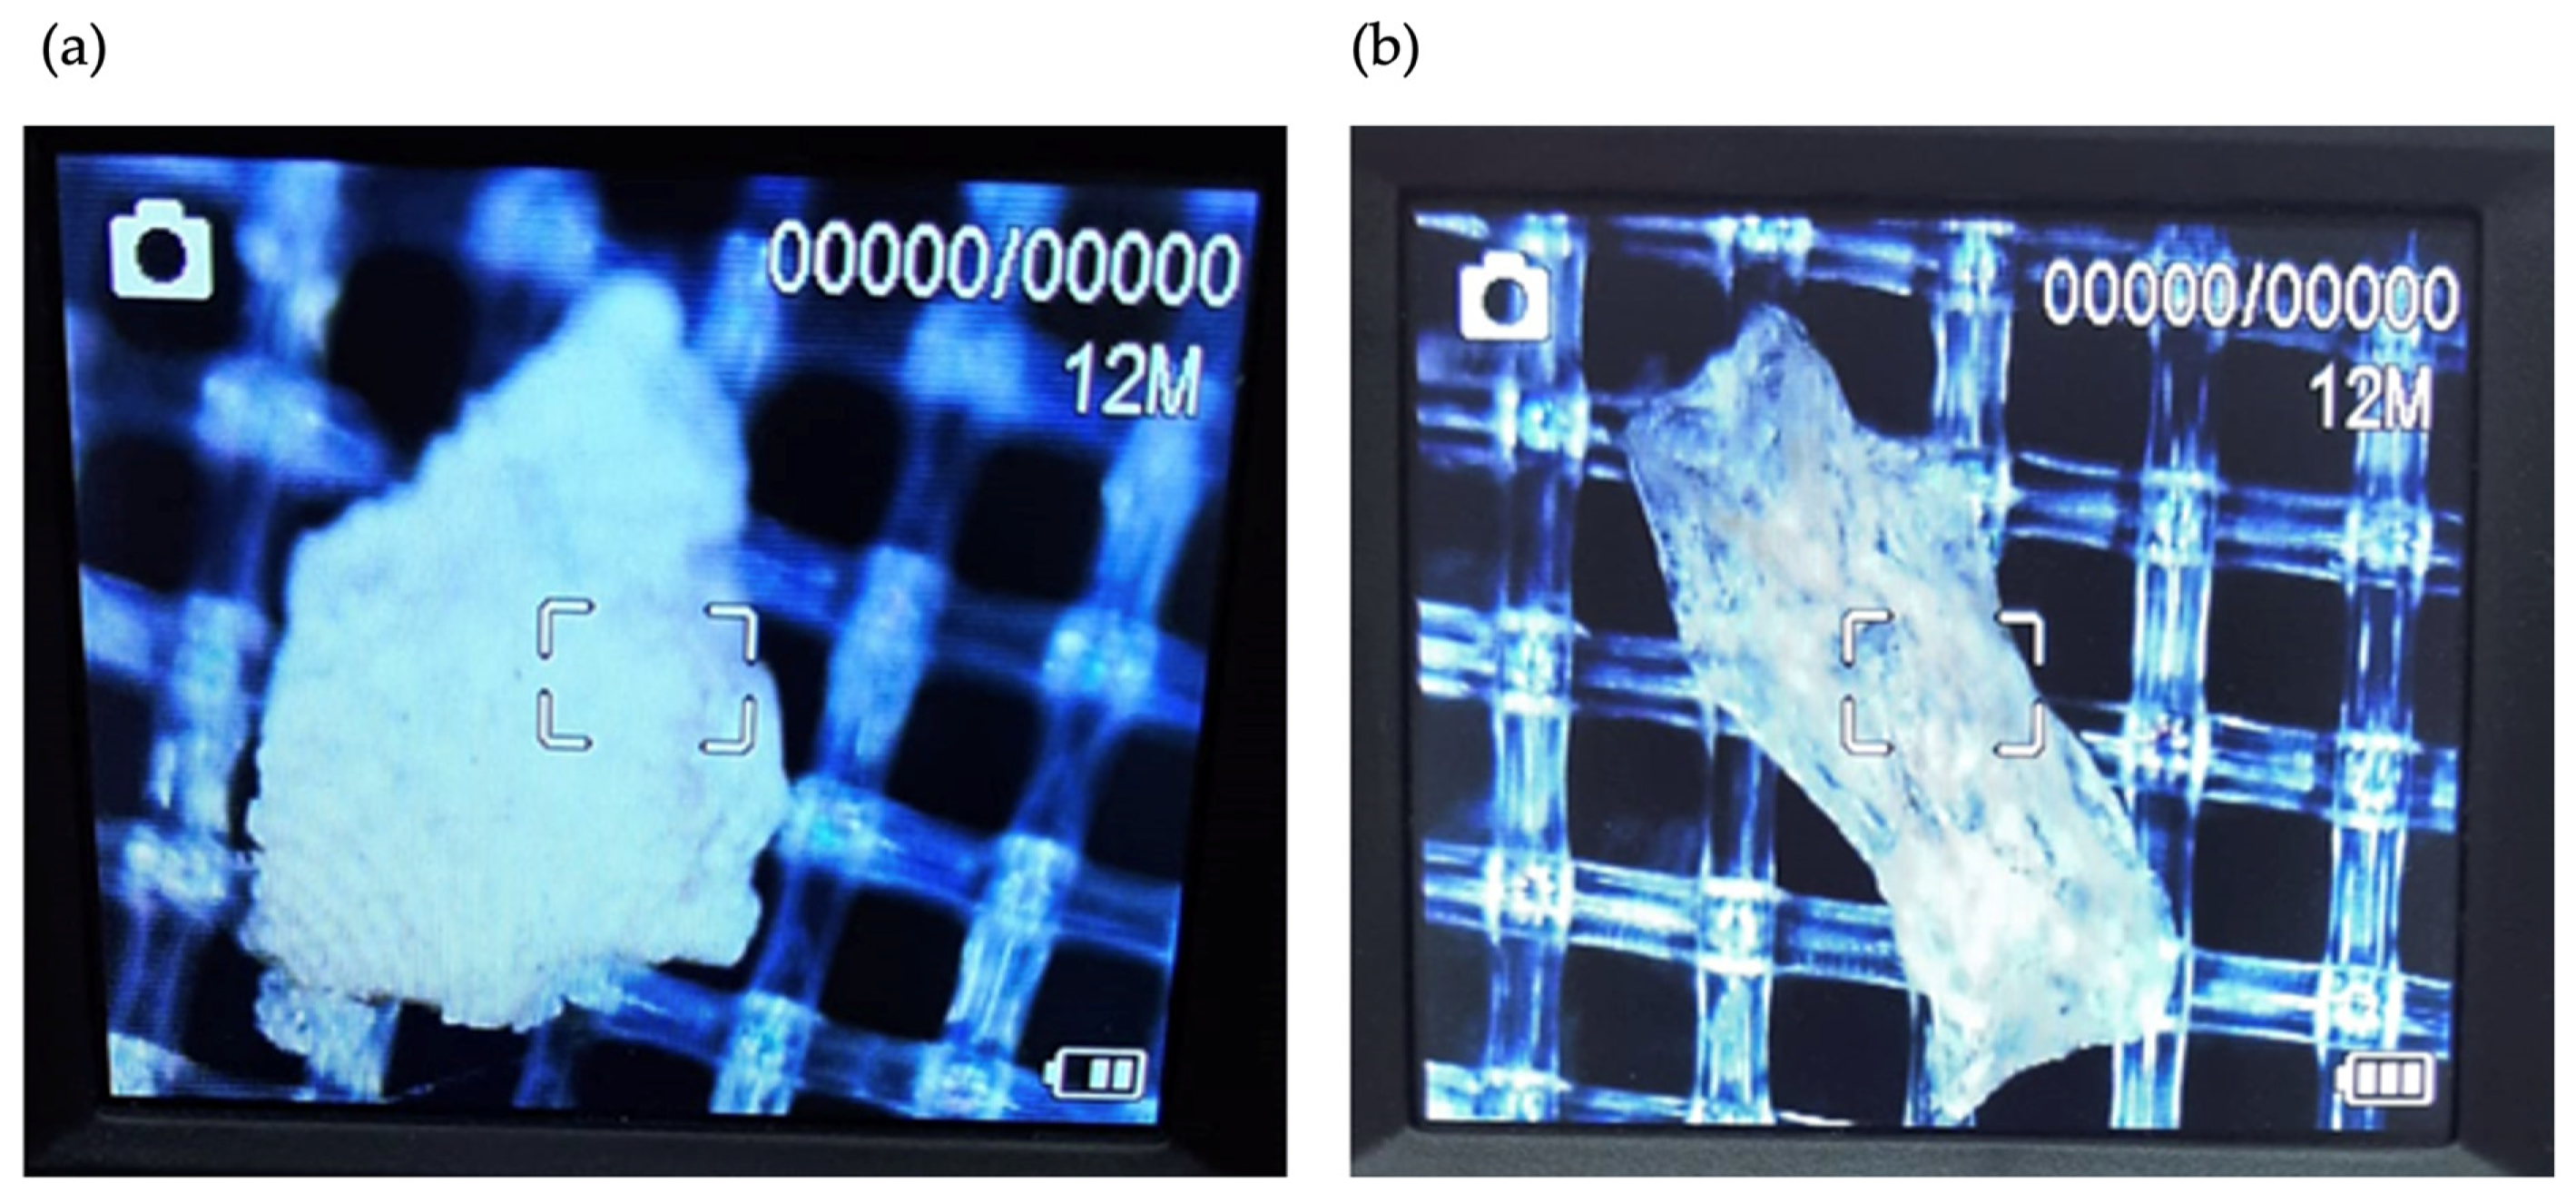
All tap water samples exhibit the presence of microplastics in various forms, as depicted in Figure 8 and Figure 9. Fiber-shaped microplastics (acrylic, viscose, polyamide) comprise the majority, accounting for 74.1% of the total number of microplastic particles, followed by fragments at 22.2% (polyethylene terephthalate, polypropylene, and polystyrene). Additionally, one particle (3.7%) in the form of a film (polyimide) was identified. These findings are consistent with published data, indicating that fibers dominate over fragments and other forms of microplastic in drinking water, often comprising up to 90% of the total microplastic content [85]. The Supplementary Materials presents FTIR spectra of the types of microplastics found in tap water and their identification in Figures S1–S14.
The microplastic content in the analyzed tap water samples ranges from 2.0 × 10⁻² to 6.0 × 10⁻² particles/dm3, aligning with published data worldwide, which typically ranges from 1 × 10⁻⁴ to 100 particles/dm3 [11].
Table 6 presents a comparison between the concentration of microplastics observed in this study and those reported in several previous studies conducted at various sites worldwide.
The results shown in Table 6 demonstrate that the concentration of microplastics found in Kokshetau city and Krasny Yar village is similar to those found in Barcelona [86] and England and Wales [89]. It has been observed that the tap water quality in Kokshetau City and Krasny Yar village, in terms of microplastic concentration, is better than in the rest of the case studies found in the scientific literature. However, the detection of microplastic particles in 100% of the analyzed tap water samples, coupled with the unsatisfactory quality of water based on physical and chemical indicators, underscores the necessity to explore new technological solutions for the water treatment system in Kazakhstan, particularly focusing on sorption processes.
The detection of microplastic particles in 100% of the analyzed tap water samples, coupled with the unsatisfactory quality of water based on physical and chemical indicators, underscores the necessity to explore new technological solutions for the water treatment system in Kazakhstan, particularly focusing on sorption processes.

3.3. Treatment of Water from Microplastics by Sorption Methods

Our study departed from using standard polymer granules of known quality and instead employed grinding to mimic the forms of microplastics found in water more accurately. In identifying plastics, the study considered the infrared (IR) spectrum of PET, which exhibits absorption bands characteristic of out-of-plane and in-plane vibrations of the benzene group, stretching vibrations of the C=O bond of ester groups, the carbonyl group C=O conjugated with the benzene ring, and asymmetric stretching of the C-O-C group (at 721, 870, 1018, 1246, 1710, and 1095 cm−1, respectively).
Polypropylene was identified based on the presence of absorption bands characteristic of stretching and bending vibrations of CH, CH2, and CH3 groups in its IR spectrum (at 2950, 2918, 2836, 1456, and 1376 cm−1). Similarly, the IR spectrum of PE contains absorption bands (at 2916, 2846, 1468, and 717 cm−1) arising from stretching and bending vibrations of the CH2 group [95]. Furthermore, the complex structure of PET was further elucidated by comparing its FTIR spectrum with those in polymer library databases. The Supplementary Materials present the spectra of polymers used in the sorption process in Figures S15–S18.
The efficacy of the selected sorbents in retaining microplastics (PET, PP, PE) of various fractions was also assessed (Table 7).
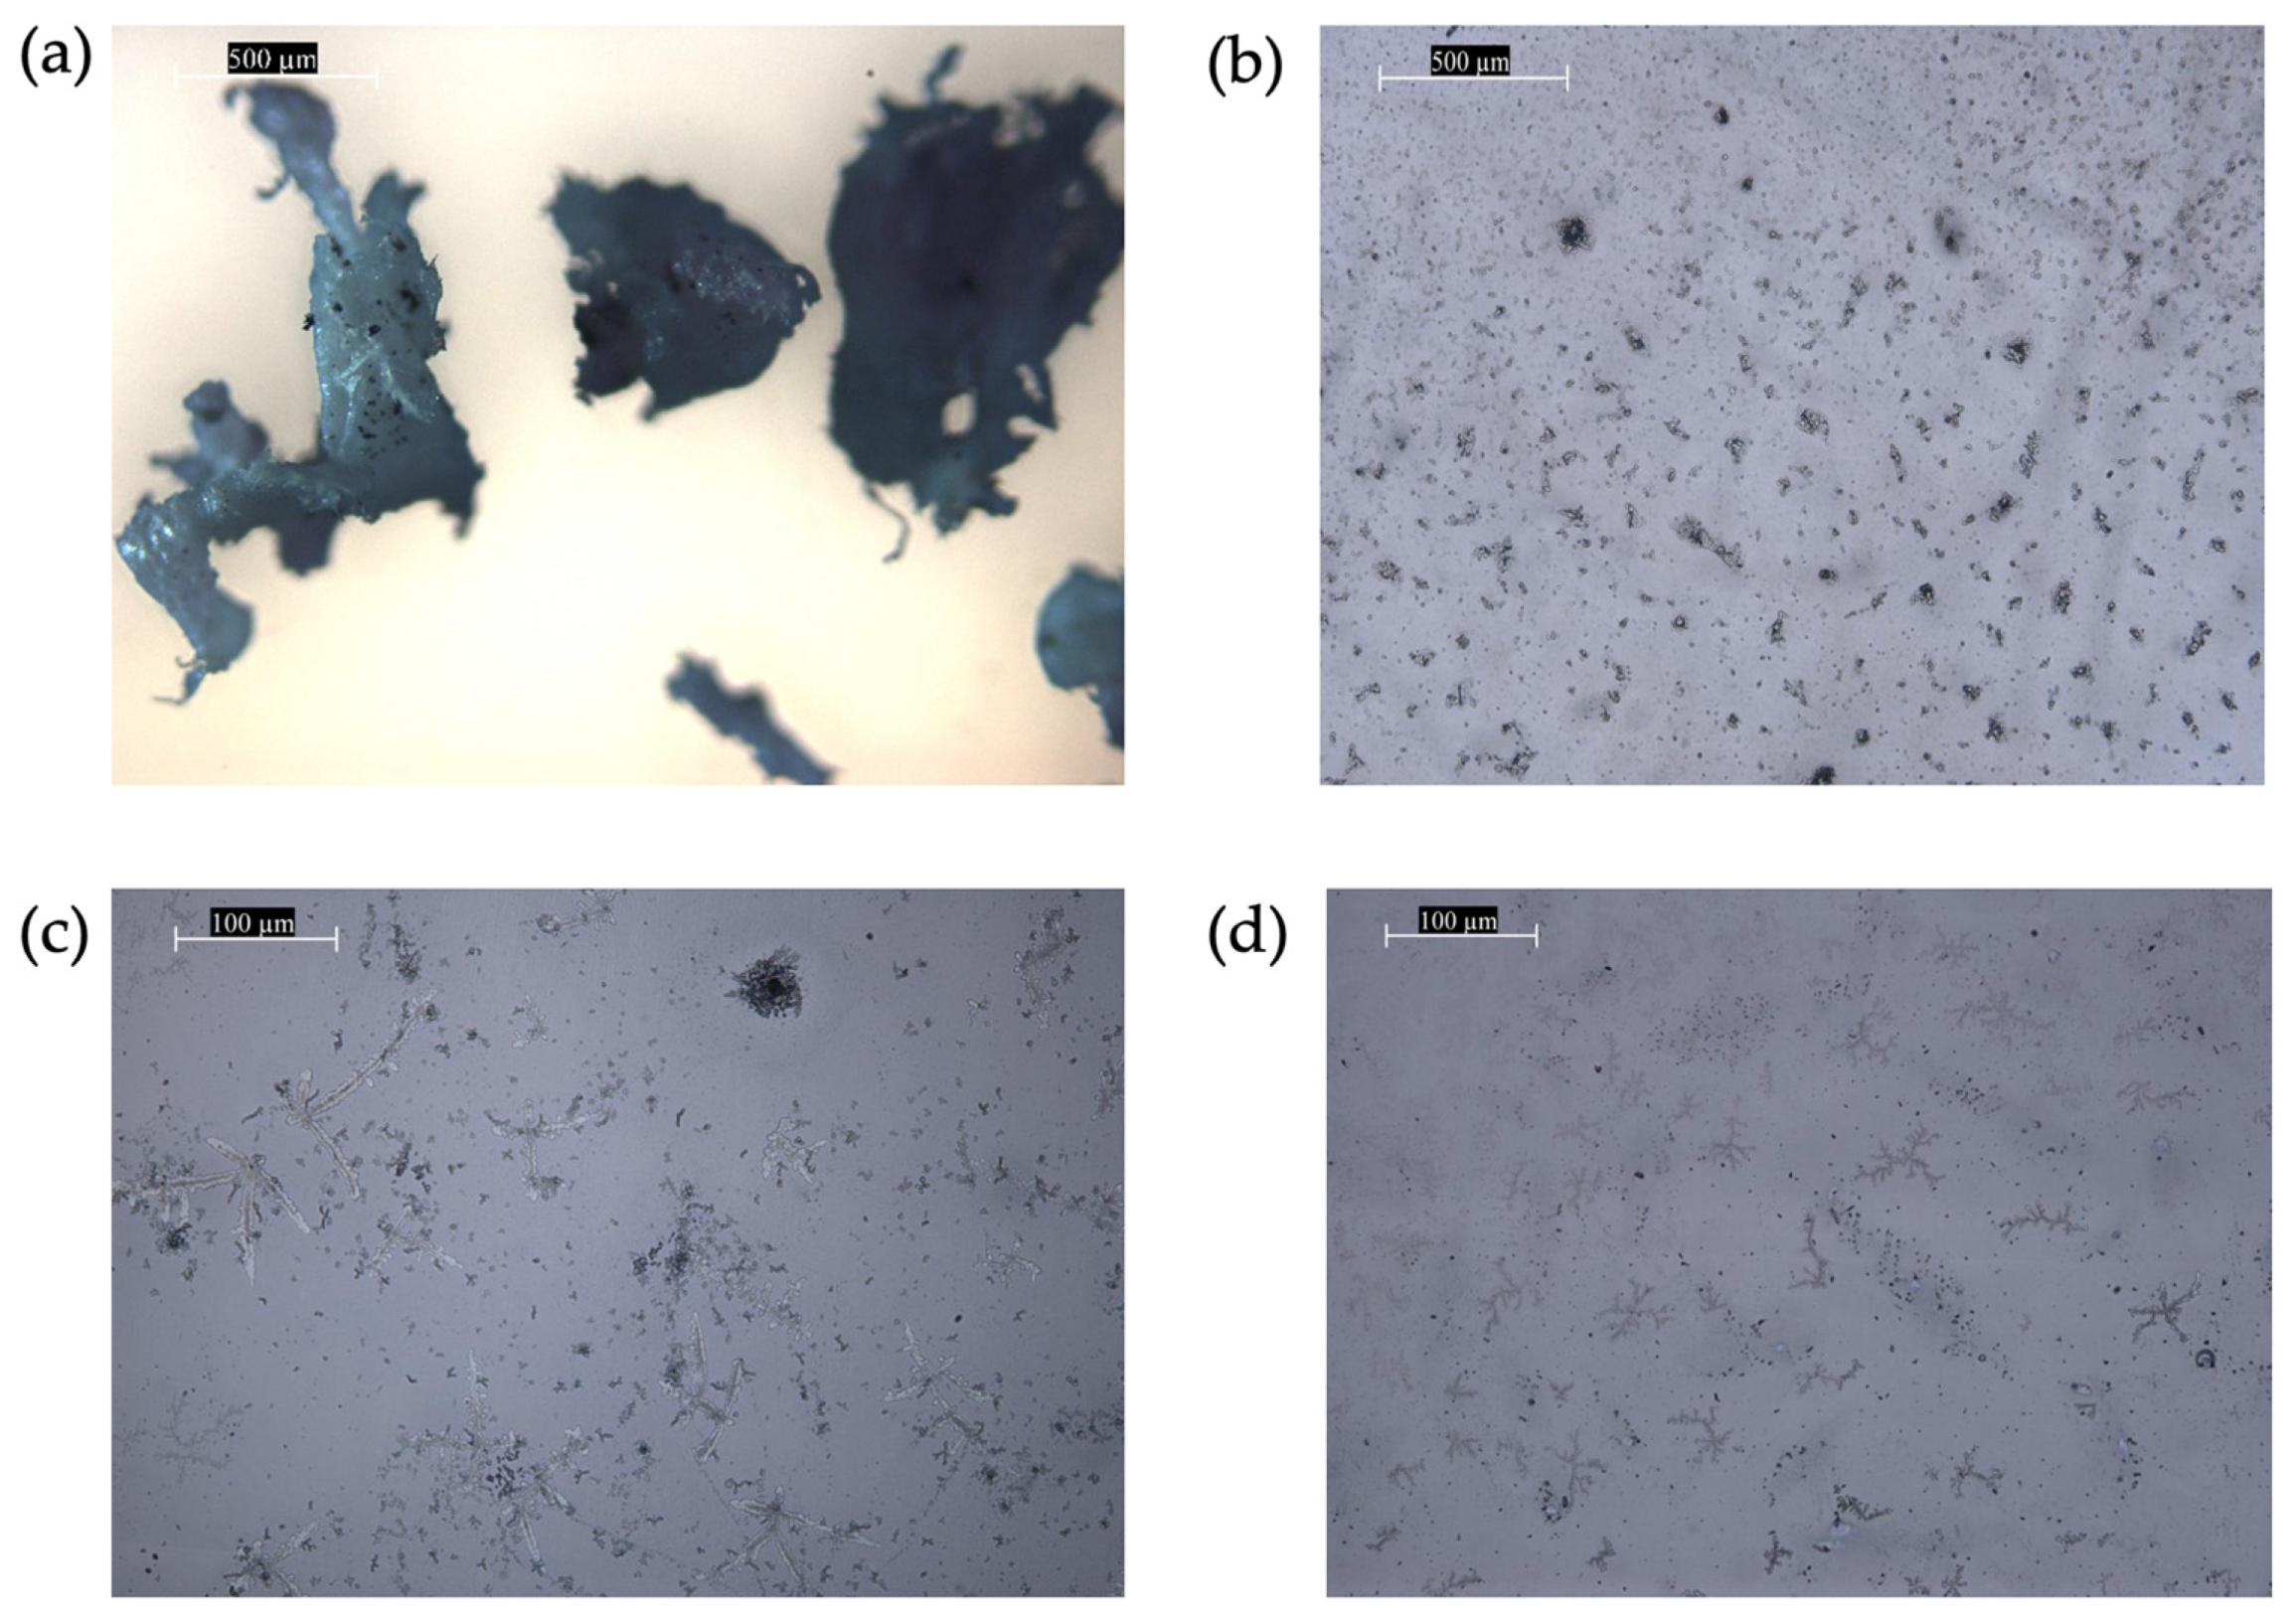
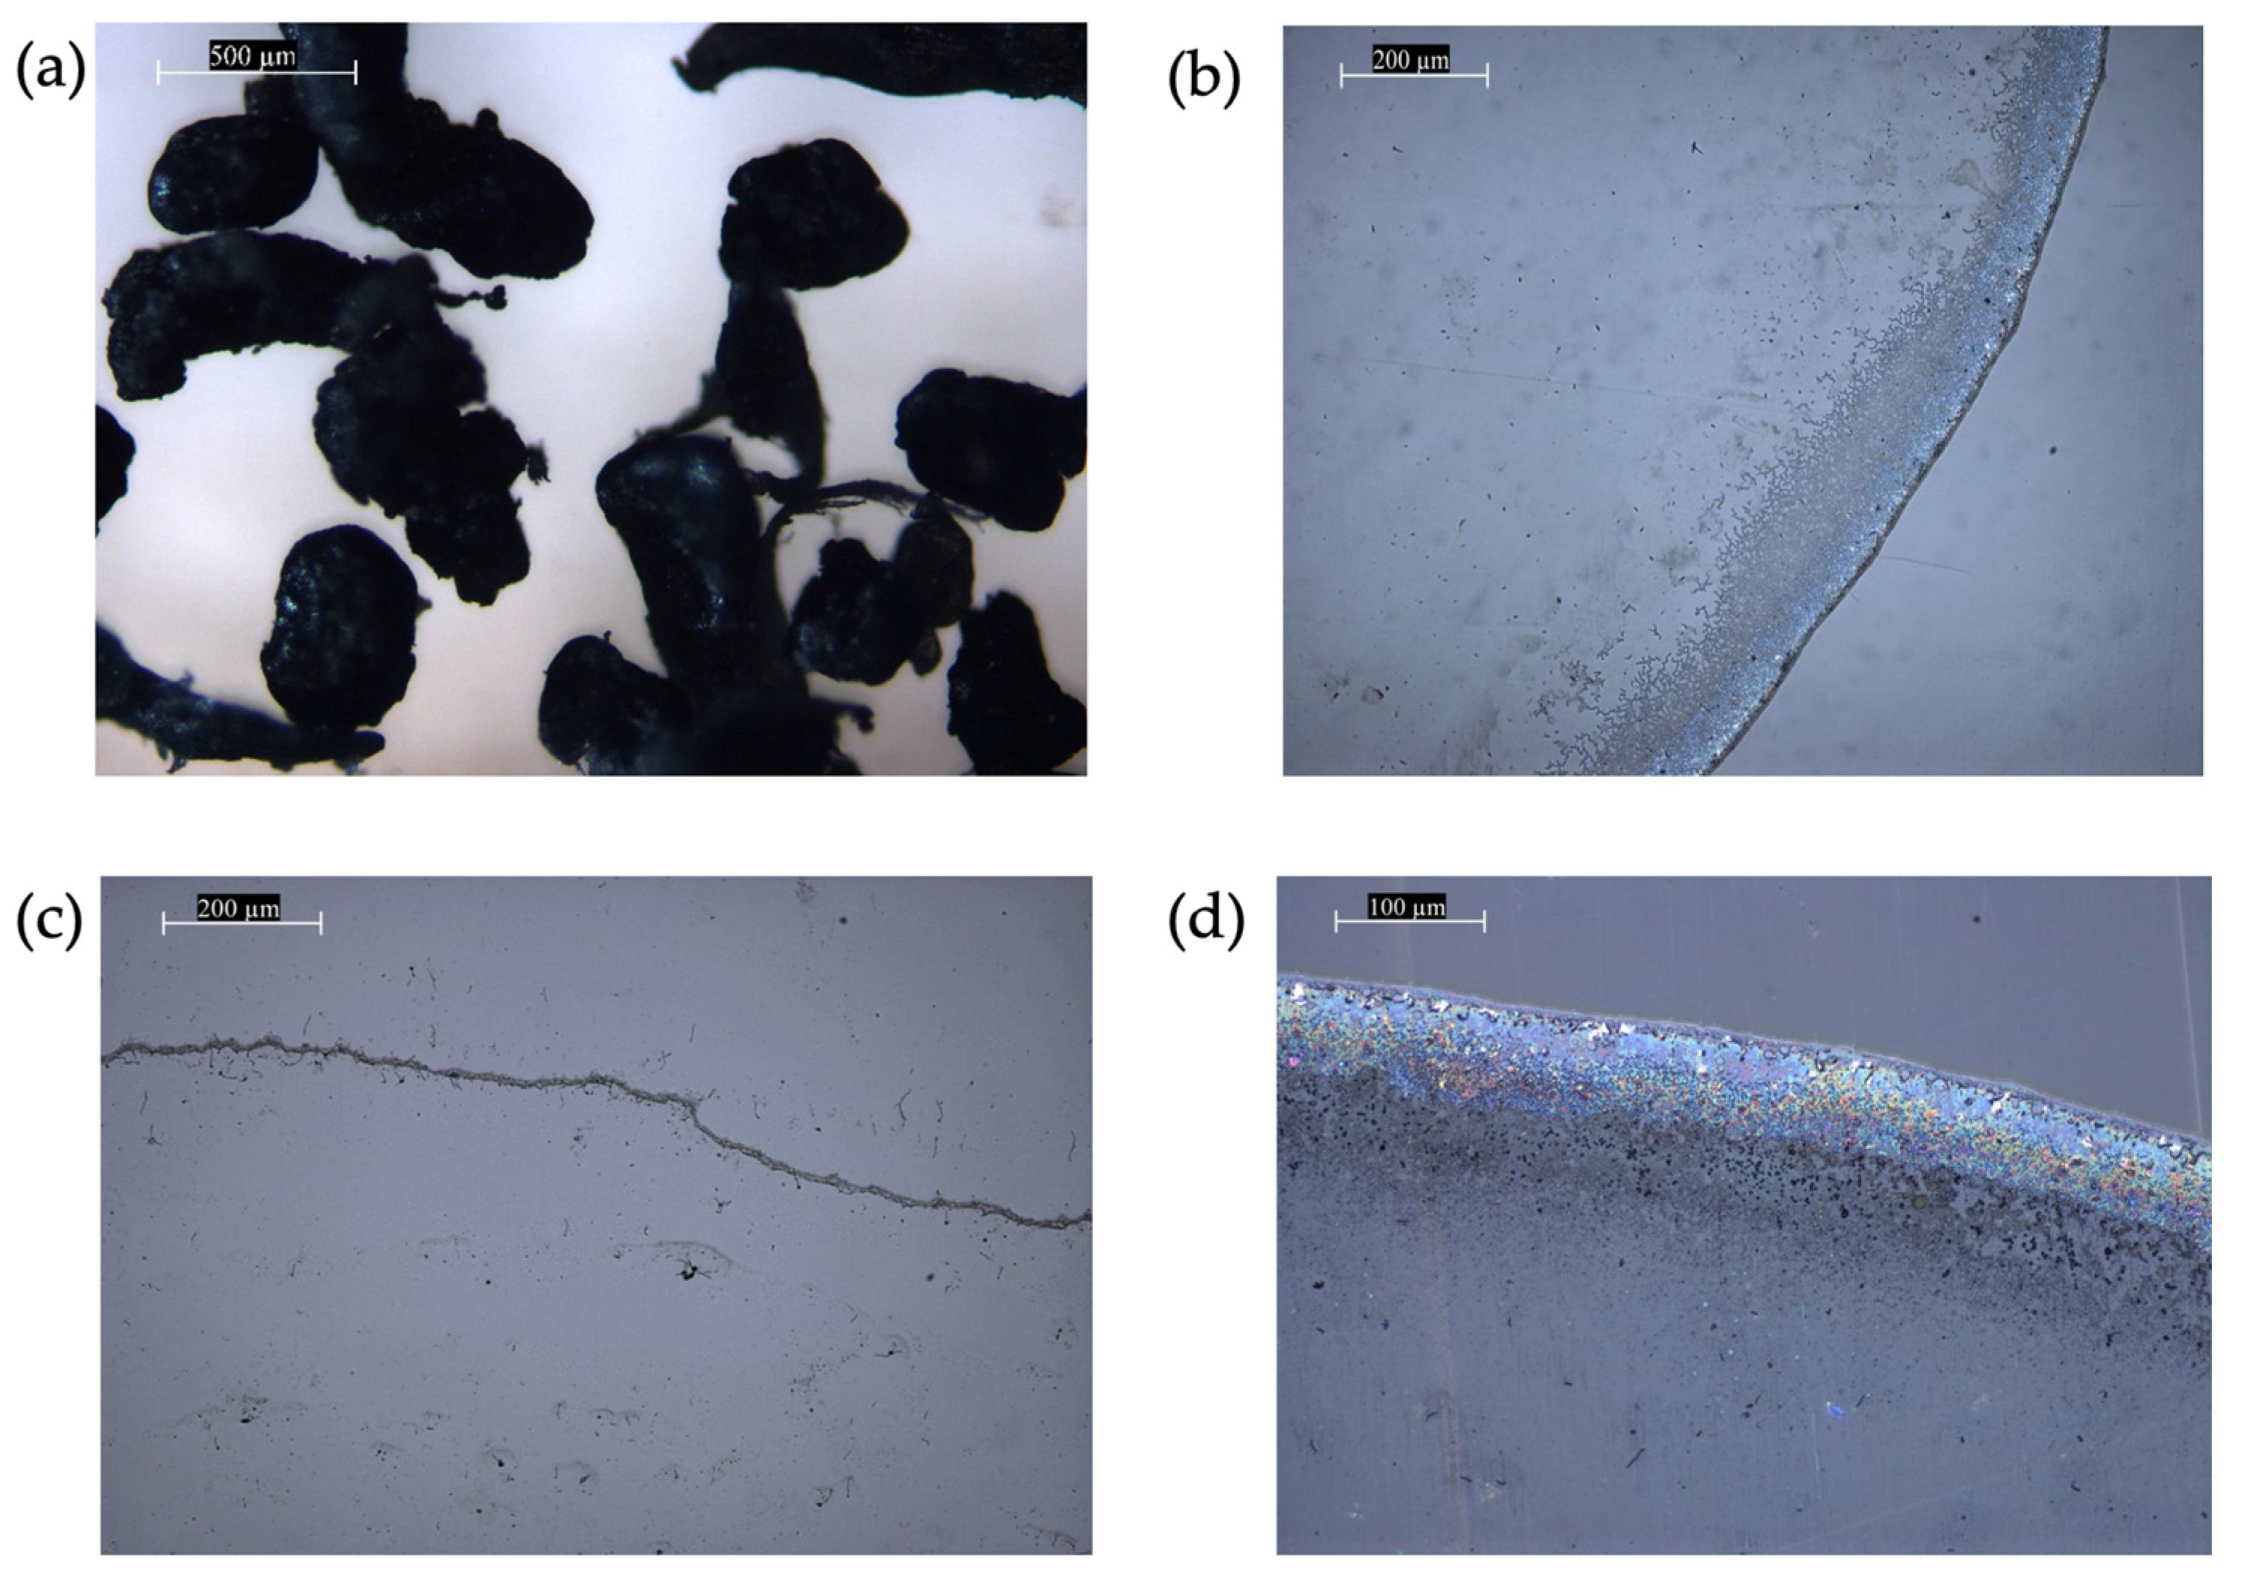
The sorption findings demonstrate a high retention of microplastic particles by the investigated sorbents, ranging from 82.7% to 97.8%. These results from weight analysis were corroborated by optical microscopy examinations of aqueous solutions before and after filtration through the sorbents. Figure 10, Figure 11 and Figure 12 show microphotographs of water samples containing PET, PP, and PE microparticles (0.45 mm fraction as an example) after filtration through columns containing the examined sorbents.
Optical scanning microscope studies revealed that in all solutions filtered through the sorbents, there was virtually no microplastic content of any fraction. The utilization of zeolite for microplastic retention at filter stations in the Kazakhstani drinking water treatment system can be justified due to its high efficiency in retaining microplastic particles (PP, PE, PET), ranging from 90.4% to 92.8%. However, the denser structure of zeolite, as opposed to the uneven and rough surface of highly porous CSM, as established by scanning microscopy (Figure 13), demonstrates lower microplastic retention. Specifically, the average efficiency of PP retention on zeolite is 91.3%, while on CSM it is 95.1%.
The hydrophobic structure of CSM, with a high specific surface area (475 m2/g) and its porosity (specific pore volume—0.0642 cm3/g) create significantly more potential sites for the sorption of inert microplastics in comparison with zeolite (specific surface area—7 m2/g, specific pore volume—0.0091 cm3/g) [96,97].
The addition of ion exchange resins to the CSM diminishes its sorption capacity against all types and sizes of microplastics. It is likely that ion exchange sorbents are not effective against inert microplastic particles. Furthermore, ion exchange resins compete with microplastic particles during sorption on free cavity carbon sorbent (CSM). Consequently, the average efficiency on the mixed sorbent averages 88.1%, decreasing with decreasing microplastic fraction size from 89.8% (for 0.45 mm particles) to 86.7% (for 0.105 mm particles).
The highest degree of retention of PE particles was observed, with an average efficiency of sorption on the three sorbents reaching 93.7%. Following PE, PP exhibited the next-highest retention, with an average sorption efficiency on the three sorbents at 91.2%. PET showed a lesser degree of sorption retention (89.6%). These results may suggest the predominance of hydrophobic effects in the sorption of aliphatic compounds (PE, PP) over π–π donor–acceptor interactions, which are characteristic in the case of carbon affinity for compounds containing an aromatic ring (PET). Thus, based on their ability to retain microplastic particles, the studied sorbents can be ranked in the following order, according to the degree of efficiency reduction: carbon sorbent (CSM) > zeolite > complex (CSM + ion exchange resins).
The efficiency of drinking water treatment from microplastics should also ensure the improvement of the treated water quality according to standardized indicators, generally accepted in the world and Kazakhstan practice. This primarily concerns the content of suspended substances of organic and inorganic nature capable of sorbing microplastic particles, as determined in the study by color, turbidity, and oxidizability. The results of the study on the effect of selected sorbents on the physicochemical parameters of water—color, turbidity, and acidity—as well as on the ability of these sorption processes to alter the acid–base balance of treated water are presented in Table 8.
As evident from the results presented in Table 7, the sorption of suspended organic and inorganic impurities on the studied sorbents results in a reduction in water turbidity, a shift in pH towards a more neutral environment, and an improvement in color and acidity parameters.
The investigated sorbents exhibited the highest efficiency with respect to acidity and chromaticity. The average efficiency of sorbents in terms of water acidification was 99.8% for CSM, 99.5% for zeolite, and 96.7% for the complex (CSM + ion exchange resins).
Regarding the water color index, the average efficiency of sorbents was 100% for CSM, 90.0% for zeolite, and 79.2% for the complex (CSM + ion exchange resins). Additionally, the average efficiency of sorbents on the water turbidity index was 74.5% for CSM, 60.6% for the complex (CSM + ion exchange resins), and 22.9% for zeolite.
Furthermore, sorption on all sorbents resulted in a shift in pH of treated water towards a more neutral value, averaging 4.2–8.3%.
Our synthesized sorbent, CSM, demonstrated the highest efficiency among the investigated sorbents, both for microplastic particles (PP, PE, PET) and concerning all investigated water parameters (color, acidity, turbidity). Therefore, it can be recommended as an effective sorbent for treatment facilities in cities of Kazakhstan and in household filters for drinking water purification.
It is difficult to compare the sorption efficiency of microplastics in this study with other published works, due to the impossibility of ensuring equality of experimental conditions (types and shapes of microplastics, their size, and concentration). However, based on the efficiency value (%), it can be argued that the carbon sorption material we synthesized shows better results than new sorbents such as organic sponge materials (81.2% at pH 6–9) [98]. Modification of biochar adsorbents, Mg, and Zn demonstrates high efficiency rates (97.7%) against high-concentration polystyrene (0.1 g/mL) [99]. Synthesized Zn–Al layered double hydroxide shows high sorption efficiency (100%) at very low pH values (pH = 4), which are not found in natural and tap waters. Increasing the pH to 9 leads to a decrease in the efficiency of polystyrene sorption to 37% [100], which is significantly lower than the results obtained in our study.
A combination of sorption processes based on carbon sorption material and zeolite with microfiltration can improve the efficiency of removing microplastic particles. Complex methods of water purification, including carbon sorbents, were tested in [49] and showed sorption efficiency of PVC and PET (with particle sizes of 30–1000 microns) of 78–86% and 94–100%, respectively.
However, in the conditions of Kazakhstan, the use of physical barriers, such as membrane filters with a pore size of less than 1 micron, is unlikely in the near future due to their high cost of implementation. That is why our further research on purifying drinking water from microplastics will relate to increasing the efficiency of existing water treatment technologies to minimize enterprise costs for their implementation.

4. Conclusions

The assessment of microplastic content in tap drinking water and its potential retention by the water treatment system in Kazakhstan is critical, particularly given that the centralized water supply is the main source of drinking water for the population. In our study, microplastic was detected in all drinking water samples, regardless of the service life of water pipes. The concentrations ranged from 2.0 × 10⁻² to 6.0 × 10⁻² particles/dm3, with fibers being the predominant form (74.1%), followed by fragments (22.2%) and films (3.7%). These findings align with internationally published data.
The need to remove microplastics from water and improve the physical and chemical parameters of treated water prompted the search for new technologies and materials in the water treatment system. Analysis revealed that outdated technologies and noncompliance with treatment regimens result in the presence of microplastics in tap water samples of Kokshetau city and poor water quality in terms of turbidity (87% of samples), color (40% of samples), and acidity (20% of samples).
To address this, we studied the efficiency of sorption of microplastics and other pollutants on various sorbents. The results showed high retention of microplastic particles by the investigated sorbents (82.7–97.8%). Sorbents with larger pores and hydrophobic interactions exhibited greater retention efficiency. Specifically, aliphatic structures, such as PE and PP, showed higher retention (93.7% for PE, 91.2% for PP) compared to PET (89.6%), which has a more complicated structure.
The investigated sorbents were ranked based on their ability to retain microplastic particles: carbon sorbent (CSM) > zeolite > (CSM + ionites). Moreover, the sorption of suspended impurities on the studied sorbents led to a reduction in water turbidity, pH adjustment towards neutrality, and improvement in color and acidity parameters.
Among the studied sorbents, our synthesized sorbent, CSM, demonstrated the highest efficiency in retaining microplastic particles and improving water parameters. Therefore, it can be recommended for use in treatment facilities across cities in Kazakhstan and in household filters for drinking water purification.

Supplementary Materials

The following supporting information can be downloaded at https://www.mdpi.com/article/10.3390/w16101363/s1. Figure S1: FTIR spectrum of Polyamide fiber (experimental sample); Figure S2: Identification of Polyamide fiber by FTIR spectrum of library databases; Figure S3: FTIR spectrum of Acryl fiber (experimental sample); Figure S4: Identification of Acryl fiber by FTIR spectrum of library databases; Figure S5: FTIR spectrum of Viscose fiber, Bember (experimental sample); Figure S6: Identification of Viscose fiber (Bember) by FTIR spectrum of library databases; Figure S7: FTIR spectrum of polyethylene terephthalate (experimental sample); Figure S8: Identification of polyethylene terephthalate by FTIR spectrum of library databases; Figure S9: FTIR spectrum of polystyrene (experimental sample); Figure S10: Identification of polystyrene by FTIR spectrum of library databases; Figure S11: FTIR spectrum of polyimide film Kapton, (experimental sample); Figure S12: Identification of polyimide film (Kapton) by FTIR spectrum of library databases; Figure S13: FTIR spectrum of polypropylene (experimental sample); Figure S14: Identification of polypropylene by FTIR spectrum of library databases; Figure S15: FTIR spectrum of polypropylene (experimental sample); Figure S16: FTIR spectrum of polyethylene (experimental sample); Figure S17: FTIR spectrum of polyethylene terephthalate (experimental sample); Figure S18: Identification of polyethylene terephthalate by PET FTIR spectrum of library databases.

Author Contributions

Conceptualization, N.S.S. and J.R.-I.; methodology, N.S.S.; software, J.R.-I. and M.-E.R.-C.; validation, N.S.S.; formal analysis, N.S.S. and J.R.-I.; investigation, N.S.S. and J.R.-I.; resources, N.S.S. and J.R.-I.; data curation, N.S.S., A.R.K., K.K.A. and G.A.K.; writing—original draft preparation, N.S.S. and J.R.-I.; writing—review and editing, J.R.-I. and M.-E.R.-C.; visualization, J.R.-I. and M.-E.R.-C.; supervision, N.S.S. and J.R.-I.; project administration, N.S.S.; funding acquisition, N.S.S. and J.R.-I. All authors have read and agreed to the published version of the manuscript.

Funding

This research was funded by the Science Committee of the Ministry of Science and Higher Education of the Republic of Kazakhstan through the research project “Health risk modelling based on the identification of microplastics in water systems and the reasoning about actions to manage the water resources quality” (grant AP14869081).

Data Availability Statement

Data is contained within the article and Supplementary Material.

Acknowledgments

The authors thank Seythan Azat, Director of the Engineering Profile Laboratory at Satbayev University for providing the laboratory for sorption research, and Nurbol Appazov, Director of the Institute of Chemical Research and Technology at Korkyt Ata Kyzylorda University, for his leadership in the quantitative analysis of microplastics using FTIR analysis.

Conflicts of Interest

The authors declare no conflicts of interest.

References

  1. Ma, H.; Chao, L.; Wan, H.; Zhu, Q. Microplastic Pollution in Water Systems: Characteristics and Control Methods. Diversity 2024, 16, 70. [Google Scholar] [CrossRef]
  2. D’avignon, G.; Gregory-Eaves, I.; Ricciardi, A. Microplastics in lakes and rivers: An issue of emerging significance to limnology. Environ. Rev. 2022, 30, 228–244. [Google Scholar] [CrossRef]
  3. He, D.; Luo, Y.; Lu, S.; Liu, M.; Song, Y.; Lei, L. Microplastics in soils: Analytical methods, pollution characteristics and ecological risks. TrAC Trends Anal. Chem. 2018, 109, 163–172. [Google Scholar] [CrossRef]
  4. Wang, C.; Tang, J.; Yu, H.; Wang, Y.; Li, H.; Xu, S.; Li, G.; Zhou, Q. Microplastic Pollution in the Soil Environment: Characteristics, Influencing Factors, and Risks. Sustainability 2022, 14, 13405. [Google Scholar] [CrossRef]
  5. Habibi, N.; Uddin, S.; Fowler, S.W.; Behbehani, M. Microplastics in the atmosphere: A review. J. Environ. Exp. Asses. 2022, 1, 6. [Google Scholar] [CrossRef]
  6. Abad López, A.P.; Trilleras, J.; Arana, V.A.; García-Alzate, L.S.; Grande-Tovar, C.D. Atmospheric microplastics: Exposure, toxicity, and detrimental health effects. RSC Adv. 2023, 13, 7468–7489. [Google Scholar] [CrossRef] [PubMed]
  7. Sun, J.; Dai, X.; Wang, Q.; van Loosdrecht, M.C.M.; Ni, B.J. Microplastics in wastewater treatment plants: Detection, occurrence and removal. Water Res. 2019, 152, 21–37. [Google Scholar] [CrossRef] [PubMed]
  8. Calero, M.; Martín-Lara, M.A.; Godoy, V.; Quesada, L.; Martínez, D.; Peula, F.; Soto, J.M. Characterization of plastic materials present in municipal solid waste: Preliminary study for their mechanical recycling. Detritus 2018, 4, 104. [Google Scholar] [CrossRef]
  9. Mintenig, S.M.; Int-Veen, I.; Löder, M.G.J.; Primpke, S.; Gerdts, G. Identification of microplastic in effluents of waste water treatment plants using focal plane array-based micro-Fourier-transform infrared imaging. Water Res. 2017, 108, 365–372. [Google Scholar] [CrossRef]
  10. Pivokonsky, M.; Cermakova, L.; Novotna, K.; Peer, P.; Cajthaml, T.; Janda, V. Occurrence of microplastics in raw and treated drinking water. Sci. Total Environ. 2018, 643, 1644–1651. [Google Scholar] [CrossRef]
  11. Mintenig, S.M.; Löder, M.G.J.; Primpke, S.; Gerdts, G. Low numbers of microplastics detected in drinking water from ground water sources. Sci. Total Environ. 2019, 648, 631–635. [Google Scholar] [CrossRef] [PubMed]
  12. Uhl, W.; Eftekhardadkhah, M.; Svendsen, C. Mapping Microplastic in Norwegian Drinking Water. Available online: www.norskvann.no (accessed on 11 April 2024).
  13. Zuccarello, P.; Ferrante, M.; Cristaldi, A.; Copat, C.; Grasso, A.; Sangregorio, D.; Fiore, M.; Oliveri Conti, G. Exposure to microplastics (<10 μm) associated to plastic bottles mineral water consumption: The first quantitative study. Water Res. 2019, 157, 365–371. [Google Scholar] [CrossRef]
  14. Vega-Herrera, A.; Llorca, M.; Borrel-Diaz, X.; Redondo-Hasselerharm, P.E.; Abad, E.; Villanueva, C.M.; Farré, M. Polymers of micro(nano) plastic in household tap water of the Barcelona Metropolitan Area. Water Res. 2022, 220, 118645. [Google Scholar] [CrossRef] [PubMed]
  15. Oßmann, B.E.; Sarau, G.; Holtmannspötter, H.; Pischetsrieder, M.; Christiansen, S.H.; Dicke, W. Small-sized microplastics and pigmented particles in bottled mineral water. Water Res. 2018, 141, 307–316. [Google Scholar] [CrossRef]
  16. Negrete Velasco, A.; Ramseier Gentile, S.; Zimmermann, S.; Le Coustumer, P.; Stoll, S. Contamination and removal efficiency of microplastics and synthetic fibres in a conventional drinking water treatment plant in Geneva, Switzerland. Sci. Total Environ. 2023, 880, 163270. [Google Scholar] [CrossRef]
  17. Mohammadi, A.; Dobaradaran, S.; Schmidt, T.C.; Malakootian, M.; Spitz, J. Emerging contaminants migration from pipes used in drinking water distribution systems: A review of the scientific literature. Environ. Sci. Pollut. Res. 2022, 29, 75134–75160. [Google Scholar] [CrossRef]
  18. Lam, T.W.L.; Ho, H.T.; Ma, A.T.H.; Fok, L. Microplastic Contamination of Surface Water-Sourced Tap Water in Hong Kong—A Preliminary Study. Appl. Sci. 2020, 10, 3463. [Google Scholar] [CrossRef]
  19. Gambino, I.; Bagordo, F.; Grassi, T.; Panico, A.; De Donno, A. Occurrence of Microplastics in Tap and Bottled Water: Current Knowledge. Int. J. Environ. Res. Public Health 2022, 19, 5283. [Google Scholar] [CrossRef]
  20. Weber, F.; Kerpen, J.; Wolff, S.; Langer, R.; Eschweiler, V. Investigation of microplastics contamination in drinking water of a German city. Sci. Total Environ. 2021, 755, 143421. [Google Scholar] [CrossRef]
  21. Gray, A.D.; Weinstein, J.E. Size- and shape-dependent effects of microplastic particles on adult daggerblade grass shrimp (Palaemonetes pugio). Environ. Toxicol. Chem. 2017, 36, 3074–3080. [Google Scholar] [CrossRef]
  22. Li, J.; Green, C.; Reynolds, A.; Shi, H.; Rotchell, J.M. Microplastics in mussels sampled from coastal waters and supermarkets in the United Kingdom. Environ. Pollut. 2018, 241, 35–44. [Google Scholar] [CrossRef]
  23. Almaiman, L.; Aljomah, A.; Bineid, M.; Aljeldh, F.M.; Aldawsari, F.; Liebmann, B.; Lomako, I.; Sexlinger, K.; Alarfaj, R. The occurrence and dietary intake related to the presence of microplastics in drinking water in Saudi Arabia. Environ. Monit. Assess. 2021, 193, 1–13. [Google Scholar] [CrossRef] [PubMed]
  24. Ragusa, A.; Svelato, A.; Santacroce, C.; Catalano, P.; Notarstefano, V.; Carnevali, O.; Papa, F.; Rangioletti, M.C.A.; Baiocco, F.; Draghi, S.; et al. Plasticenta: First evidence of microplastics in human placenta. Environ. Int. 2021, 146, 106274. [Google Scholar] [CrossRef]
  25. Amato-Lourenço, L.F.; Carvalho-Oliveira, R.; Júnior, G.R.; dos Santos Galvão, L.; Ando, R.A.; Mauad, T. Presence of airborne microplastics in human lung tissue. J. Hazard. Mater. 2021, 416, 126124. [Google Scholar] [CrossRef]
  26. Farrell, P.; Nelson, K. Trophic level transfer of microplastic: Mytilus edulis (L.) to Carcinus maenas (L.). Environ. Pollut. 2013, 177, 1–3. [Google Scholar] [CrossRef] [PubMed]
  27. Leslie, H.A.; Depledge, M.H. Where is the evidence that human exposure to microplastics is safe? Environ. Int. 2020, 142, 105807. [Google Scholar] [CrossRef] [PubMed]
  28. Lee, Y.; Cho, J.; Sohn, J.; Kim, C. Health Effects of Microplastic Exposures: Current Issues and Perspectives in South Korea. Yonsei Med. J. 2023, 64, 301–308. [Google Scholar] [CrossRef]
  29. Jadhav, E.B.; Sankhla, M.S.; Bhat, R.A.; Bhagat, D.S. Microplastics from food packaging: An overview of human consumption, health threats, and alternative solutions. Environ. Nanotechnol. Monit. Manag. 2021, 16, 100608. [Google Scholar] [CrossRef]
  30. Eriksen, M.; Mason, S.; Wilson, S.; Boz, C.; Zellers, A.; Edwards, W.; Farley, H.; Amato, S. Microplastic pollution in the surface waters of the Laurentian Great Lakes. Mar. Pollut. Bull. 2013, 77, 177–182. [Google Scholar] [CrossRef]
  31. Nacaratte, F.; Cuevas, P.; Becerra-Herrera, M.; Manzano, C.A. Early screening of suspected microplastics in bottled water in the Santiago Metropolitan Region of Chile. Environ. Pollut. 2023, 334, 122118. [Google Scholar] [CrossRef]
  32. Yuan, C.; Almuhtaram, H.; McKie, M.J.; Andrews, R.C. Assessment of microplastic sampling and extraction methods for drinking waters. Chemosphere 2022, 286, 131881. [Google Scholar] [CrossRef] [PubMed]
  33. Horton, A.A.; Svendsen, C.; Williams, R.J.; Spurgeon, D.J.; Lahive, E. Large microplastic particles in sediments of tributaries of the River Thames, UK—Abundance, sources and methods for effective quantification. Mar. Pollut. Bull. 2017, 114, 218–226. [Google Scholar] [CrossRef]
  34. Environmental Performance Index. Available online: https://epi.yale.edu/epi-results/2022/component/epi (accessed on 11 April 2024).
  35. Most Sustainable Countries—U.S. News. Available online: https://www.usnews.com/news/best-countries/most-sustainable-countries (accessed on 11 April 2024).
  36. Nurtazin, S.; Pueppke, S.; Ospan, T.; Mukhitdinov, A.; Elebessov, T. Quality of Drinking Water in the Balkhash District of Kazakhstan’s Almaty Region. Water 2020, 12, 392. [Google Scholar] [CrossRef]
  37. Salikova, N.S.; Rodrigo-Ilarri, J.; Alimova, K.K.; Rodrigo-Clavero, M.E. Analysis of the Water Quality of the Ishim River within the Akmola Region (Kazakhstan) Using Hydrochemical Indicators. Water 2021, 13, 1243. [Google Scholar] [CrossRef]
  38. Salikova, N.S.; Rodrigo-Ilarri, J.; Rodrigo-Clavero, M.E.; Urazbayeva, S.E.; Askarova, A.Z.; Magzhanov, K.M. Environmental Assessment of Microplastic Pollution Induced by Solid Waste Landfills in the Akmola Region (North Kazakhstan). Water 2023, 15, 2889. [Google Scholar] [CrossRef]
  39. Salikova, N.S.; Rodrigo-Ilarri, J.; Makeyeva, L.A.; Rodrigo-Clavero, M.E.; Tleuova, Z.O.; Makhmutova, A.D. Monitoring of Microplastics in Water and Sediment Samples of Lakes and Rivers of the Akmola Region (Kazakhstan). Water 2024, 16, 1051. [Google Scholar] [CrossRef]
  40. Chu, X.; Zheng, B.; Li, Z.; Cai, C.; Peng, Z.; Zhao, P.; Tian, Y. Occurrence and distribution of microplastics in water supply systems: In water and pipe scales. Sci. Total Environ. 2022, 803, 150004. [Google Scholar] [CrossRef] [PubMed]
  41. Wang, Z.; Lin, T.; Chen, W. Occurrence and removal of microplastics in an advanced drinking water treatment plant (ADWTP). Sci. Total Environ. 2020, 700, 134520. [Google Scholar] [CrossRef] [PubMed]
  42. Acarer, S. Abundance and characteristics of microplastics in drinking water treatment plants, distribution systems, water from refill kiosks, tap waters and bottled waters. Sci. Total Environ. 2023, 884, 163866. [Google Scholar] [CrossRef]
  43. Kuldeyev, E.I.; Orynbekov, Y.S.; Mansurov, Z.A.; Nurlybayev, R.E.; Zhumadilova, Z.O.; Murzagulova, A.A. Applicability of Zeolite from the Daubabinsk and Chankanai Deposits as a Sorbent for Natural Waters. Water 2023, 15, 2231. [Google Scholar] [CrossRef]
  44. Sobczyk, M.; Nguyen Dihn, C.; Marzec, M.; Bazarkina, E.; Kvashnina, K.O.; Cwanek, A.; Lokas, E.; Bajda, E. Insights into uranium sequestration by coal fly-ash-derived zeolites: Understanding via wet chemistry, and advanced spectroscopies. J. Clean Prod. 2024, 449, 141206. [Google Scholar] [CrossRef]
  45. Shilina, A.S.; Bakhtin, V.D.; Burukhin, S.B.; Askhadullin, S.R. Sorption of cations of heavy metals and radionuclides from the aqueous media by new synthetic zeolite-like sorbent. Nucl. Energy Technol. 2017, 3, 249–254. [Google Scholar] [CrossRef]
  46. Marisela, A.; Franco, M.; Rojas García, E.; Medina, R.L.; Arturo, A.; Ramírez, C. Properties and applications of natural zeolites. Braz. J. Develop. 2024, 10, 1713–1799. [Google Scholar] [CrossRef]
  47. Shen, M.; Hu, T.; Huang, W.; Song, B.; Zeng, G.; Zhang, Y. Removal of microplastics from wastewater with aluminosilicate filter media and their surfactant-modified products: Performance, mechanism and utilization. J. Chem. Eng. 2021, 421, 129918. [Google Scholar] [CrossRef]
  48. Spacilova, M.; Dytrych, P.; Lexa, M.; Wimmerova, L.; Masin, P.; Kvacek, R.; Solcova, O. An Innovative Sorption Technology for Removing Microplastics from Wastewater. Water 2023, 15, 892. [Google Scholar] [CrossRef]
  49. Cherian, A.G.; Liu, Z.; McKie, M.J.; Almuhtaram, H.; Andrews, R.C. Microplastic Removal from Drinking Water Using Point-of-Use Devices. Polymers 2023, 15, 1331. [Google Scholar] [CrossRef] [PubMed]
  50. ST RK GOST R 51593-2003; Drinking Water. Sampling. State Standard of the Republic of Kazakhstan: Republic of Kazakhstan. Available online: https://online.zakon.kz/Document/?doc_id=30015917 (accessed on 11 April 2024).
  51. Kondratyeva, E.M. Monitoring of surface waters of the southern Baikal in conditions of increasing anthropogenic load. Innov. Sci. Educ. 2021, 35, 60–64. Available online: https://elibrary.ru/item.asp?id=46324676 (accessed on 11 April 2024). (In Russian).
  52. Oni, B.A.; Sanni, S.E. Occurrence of Microplastics in Borehole Drinking Water and Sediments in Lagos, Nigeria. Environ. Toxicol. Chem. 2022, 41, 1721–1731. [Google Scholar] [CrossRef] [PubMed]
  53. Mattsson, K.; da Silva, V.H.; Deonarine, A.; Louie, S.M.; Gondikas, A. Monitoring anthropogenic particles in the environment: Recent developments and remaining challenges at the forefront of analytical methods. Curr. Opin. Colloid Interface Sci. 2021, 56, 101513. [Google Scholar] [CrossRef]
  54. Shi, H.; Wang, X.; Zhu, L.; Li, D. Comprehensive Comparison of Various Microplastic Sampling Methods in Sea Water: Implications for Data Compilation. Water 2023, 15, 1035. [Google Scholar] [CrossRef]
  55. Monteiro, S.S.; Rocha-Santos, T.; Prata, J.C.; Duarte, A.C.; Girao, A.V.; Lopes, P.; Cristovao, T.; da Costa, J.P. A straightforward method for microplastic extraction from organic-rich freshwater samples. Sci. Total Environ. 2022, 815, 152941. [Google Scholar] [CrossRef] [PubMed]
  56. Munno, K.; Helm, P.A.; Jackson, D.A.; Rochman, C.; Sims, A. Impacts of temperature and selected chemical digestion methods on microplastic particles. Environ. Toxicol. Chem. 2018, 37, 91–98. [Google Scholar] [CrossRef] [PubMed]
  57. Tirkey, A.; Upadhyay, L.S.B. Microplastics: An overview on separation, identification and characterization of microplastics. Mar. Pollut. Bull. 2021, 170, 112604. [Google Scholar] [CrossRef] [PubMed]
  58. Faure, F.; Demars, C.; Wieser, O.; Kunz, M.; De Alencastro, L.F. Plastic pollution in Swiss surface waters: Nature and concentrations, interaction with pollutants. Environ. Chem. 2015, 12, 582–591. [Google Scholar] [CrossRef]
  59. Cole, M.; Webb, H.; Lindeque, P.K.; Fileman, E.S.; Halsband, C.; Galloway, T.S. Isolation of microplastics in biota-rich seawater samples and marine organisms. Sci. Rep. 2014, 4, 1–8. [Google Scholar] [CrossRef] [PubMed]
  60. Mendoza, L.M.R.; Balcer, M. Microplastics in freshwater environments: A review of quantification assessment. TrAC Trends Anal. Chem. 2019, 113, 402–408. [Google Scholar] [CrossRef]
  61. Aminah, I.S.; Ikejima, K. Potential sources of microplastic contamination in laboratory analysis and a protocol for minimising contamination. Environ. Monit. Assess. 2023, 195, 1–9. [Google Scholar] [CrossRef] [PubMed]
  62. Wesch, C.; Elert, A.M.; Wörner, M.; Braun, U.; Klein, R.; Paulus, M. Assuring quality in microplastic monitoring: About the value of clean-air devices as essentials for verified data. Sci. Rep. 2017, 7, 1–8. [Google Scholar] [CrossRef] [PubMed]
  63. Hermsen, E.; Pompe, R.; Besseling, E.; Koelmans, A.A. Detection of low numbers of microplastics in North Sea fish using strict quality assurance criteria. Mar. Pollut. Bull. 2017, 122, 253–258. [Google Scholar] [CrossRef]
  64. Interstate Standard 31868-2012; Water. Interstate Standard 31868-2012; Water. Methods for Determining Color. Interstate Council for Standardization, Metrology and Certification: Moscow, Russia, 2019; p. 12. Available online: https://docs.cntd.ru/document/1200097407 (accessed on 31 March 2024).
  65. Interstate Standard 3351-74; Drinking Water. Method for Determination of Odour, Taste, Color and Turbidity. Publishing House of Standards: Moscow, Russia, 2003; p. 8. Available online: https://meganorm.ru/Index2/1/4294850/4294850608.htm (accessed on 31 March 2024).
  66. State Mandatory Standard 26449.1-85; Stationary Distillation and Desalination Plants. Methods for Chemical Analysis of Salt Waters. USSR State Committee on Standards: Moscow, Russia, 1985; p. 101. Available online: https://files.stroyinf.ru/Index2/1/4294850/4294850335.htm (accessed on 31 March 2024).
  67. ISO Standard 4316-2019; Surfactants. Determination of pH of Aqueous Solutions. Potentiometric Method. Technical Committee ISO/TC91. International Organization for Standardization: Geneva, Switzerland, 1977. Available online: https://online.zakon.kz/Document/?doc_id=33823182&pos=30;-10#pos=30;-10 (accessed on 31 March 2024).
  68. Kuldeyev, E.; Seitzhanova, M.; Tanirbergenova, S.; Tazhu, K.; Doszhanov, E.; Mansurov, Z.; Azat, S.; Nurlybaev, R.; Berndtsson, R. Modifying Natural Zeolites to Improve Heavy Metal Adsorption. Water 2023, 15, 2215. [Google Scholar] [CrossRef]
  69. Tauanov, Z.; Azat, S.; Baibatyrova, A. A mini-review on coal fly ash properties, utilization and synthesis of zeolites. Int. J. Coal Prep. Util. 2022, 42, 1968–1990. [Google Scholar] [CrossRef]
  70. Krstić, V. Role of zeolite adsorbent in water treatment. In Handbook of Nanomaterials for Wastewater Treatment: Fundamentals and Scale up Issues; Elsevier: Amsterdam, The Netherlands, 2021; pp. 417–481. [Google Scholar] [CrossRef]
  71. Calmon, C. Recent developments in water treatment by ion exchange. React. Polym. Ion Exch. Sorbents 1986, 4, 131–146. [Google Scholar] [CrossRef]
  72. Sinha, P.; Datar, A.; Jeong, C.; Deng, X.; Chung, Y.G.; Lin, L.-C. Surface Area Determination of Porous Materials Using the Brunauer–Emmett–Teller (BET) Method: Limitations and Improvements. J. Phys. Chem. C 2019, 123, 20195–20209. [Google Scholar] [CrossRef]
  73. Bureau of National Statistics of the Agency for Strategic Planning and Reforms of the Republic of Kazakhstan. Available online: https://old.stat.gov.kz/for_users/ecologic_indicators/ecologic_indicator/water_consumption (accessed on 11 April 2024).
  74. Salikova, N.S.; Alimova, K.K. Communal, Domestic and Industrial Water Supply in Kazakhstan: Interim Report on the Project IRN AP14869081 “Modelling of Health Risks Based on Identification of Microplastics in Water Systems and Justification of Actions to Manage the Quality of Water Resources”; Abay Myrzakhmetov Kokshetau University: Kokshetau, Kazakhstan, 2022; 57p, Available online: https://kuam.edu.kz/sites/default/files/2022/salikova_n.s._alimova_k.k._communal_domestic_and_industrial_water_supply_in_kazakhstan._interim_report_on_the_project_irn_ap14869081.pdf (accessed on 1 May 2024).
  75. Order of the Minister of Health of the Republic of Kazakhstan from 20 February 2023 №26 ‘Sanitary and Epidemiological Requirements for Water Sources, Places of Water Intake for Household and Drinking Purposes, Household and Drinking Water Supply and Places of Cultural and Domestic Water Use and Safety of Water Bodies’. 2023. Available online: https://adilet.zan.kz/rus/docs/V2300031934 (accessed on 11 April 2024).
  76. Miao, M.; Liu, J.; Dou, Y.; Hao, H.; Cheng, X.; Zhang, M.; Li, Y. Effects of microplastics on DBPs formation under the chlorination of natural organic matters. Chemosphere 2022, 296, 134067. [Google Scholar] [CrossRef] [PubMed]
  77. Miao, M.; Yu, B.; Cheng, X.; Hao, T.; Dou, Y.; Zhang, M.; Li, Y. Effects of chlorination on microplastics pollution: Physicochemical transformation and chromium adsorption. Environ. Pollut. 2023, 323, 121254. [Google Scholar] [CrossRef] [PubMed]
  78. Rullander, G.; Lorenz, C.; Herbert, R.B.; Strömvall, A.-M.; Vollertsen, J.; Dalahmeh, S.S. How effective is the retention of microplastics in horizontal flow sand filters treating stormwater? J. Environ. Manag. 2023, 344, 118690. [Google Scholar] [CrossRef] [PubMed]
  79. Azizi, N.; Pirsaheb, M.; Jaafarzadeh, N.; Nodehi, R.N. Microplastics removal from aquatic environment by coagulation: Selecting the best coagulant based on variables determined from a systematic review. Heliyon 2023, 9, e15664. [Google Scholar] [CrossRef] [PubMed]
  80. Lange, K.; Magnusson, K.; Viklander, M.; Blecken, G.-T. Removal of rubber, bitumen and other microplastic particles from stormwater by a gross pollutant trap—bioretention treatment train. Water Res. 2021, 202, 117457. [Google Scholar] [CrossRef]
  81. Prasad, K.Y. Sedimentation in Water and Used Water Purification. In Handbook of Water and Used Water Purification; Springer: Cham, Germany, 2019; pp. 1–27. [Google Scholar] [CrossRef]
  82. Ziembowicz, S.; Kida, M.; Koszelnik, P. Efficient removal of polyethylene and polyvinyl chloride microplastics from water using a modified coagulation process supported by the addition of a surfactant. Desalination Water Treat. 2023, 288, 51–59. [Google Scholar] [CrossRef]
  83. Zhang, Y.; Diehl, A.; Lewandowski, A.; Gopalakrishnan, K.; Baker, T. Removal efficiency of micro- and nanoplastics (180 nm–125 μm) during drinking water treatment. Sci. Total Environ. 2020, 720, 137383. [Google Scholar] [CrossRef]
  84. Na, S.-H.; Kim, M.-J.; Kim, J.-T.; Jeong, S.; Lee, S.; Chung, J.; Kim, E.-J. Microplastic removal in conventional drinking water treatment processes: Performance, mechanism, and potential risk. Water Res. 2021, 202, 117417. [Google Scholar] [CrossRef] [PubMed]
  85. Hossain, M.B.; Yu, J.; Banik, P.; Noman, A.; Nur, A.-A.U.; Haque, R.; Rahman, M.; Albeshr, M.F.; Arai, T. First evidence of microplastics and their characterization in bottled drinking water from a developing country. Front. Environ. Sci. 2023, 11, 1232931. [Google Scholar] [CrossRef]
  86. Li, L.; Quinlivan, P.A.; Knappe, D.R. Effects of activated carbon surface chemistry and pore structure on the adsorption of organic contaminants from aqueous solution. Carbon 2002, 40, 2085–2100. [Google Scholar] [CrossRef]
  87. Nguyen, T.H.; Cho, H.H.; Poster, D.L.; Ball, W.P. Evidence for a pore-filling mechanism in the adsorption of aromatic hydrocarbons to a natural wood char. Environ. Sci. Technol. 2007, 41, 1212–1217. [Google Scholar] [CrossRef] [PubMed]
  88. Wang, Z.; Sun, C.; Li, F.; Chen, L. Fatigue resistance, re-usable and biodegradable sponge materials from plant protein with rapid water adsorption capacity for microplastics removal. Chem. Eng. J. 2021, 415, 129006. [Google Scholar] [CrossRef]
  89. Wang, J.; Sun, C.; Huang, Q.-X.; Chi, Y.; Yan, J.-H. Adsorption and thermal degradation of microplastics from aqueous solutions by Mg/Zn modified magnetic biochars. J. Hazard. Mater. 2021, 419, 126486. [Google Scholar] [CrossRef] [PubMed]
  90. Tiwari, E.; Singh, N.; Khandelwal, N.; Monikh, F.A.; Darbha, G.K. Application of Zn/Al layered double hydroxides for the removal of nano-scale plastic debris from aqueous systems. J. Hazard. Mater. 2020, 397, 122769. [Google Scholar] [CrossRef] [PubMed]
  91. Dalmau-Soler, J.; Ballesteros-Cano, R.; Ferrer, N.; Boleda, M.R.; Lacorte, S. Microplastics throughout a tap water supply network. Water Environ. J. 2022, 36, 292–298. [Google Scholar] [CrossRef]
  92. Taghipour, H.; Ghayebzadeh, M.; Ganji, F.; Mousavi, S.; Azizi, N. Tracking microplastics contamination in drinking water in Zahedan, Iran: From source to consumption taps. Sci. Total Environ. 2023, 872, 162121. [Google Scholar] [CrossRef]
  93. Shruti, V.; Pérez-Guevara, F.; Kutralam-Muniasamy, G. Metro station free drinking water fountain- A potential “microplastics hotspot” for human consumption. Environ. Pollut. 2020, 261, 114227. [Google Scholar] [CrossRef]
  94. Johnson, A.C.; Ball, H.; Cross, R.; Horton, A.A.; Jürgens, M.D.; Read, D.S.; Vollertsen, J.; Svendsen, C. Identification and Quantification of Microplastics in Potable Water and Their Sources within Water Treatment Works in England and Wales. Environ. Sci. Technol. 2020, 54, 12326–12334. [Google Scholar] [CrossRef] [PubMed]
  95. Kuptsov, A.; Zhizhin, G. Fourier-Raman and Fourier-IR Spectra of Polymers; Fizmatlit: Moscow, Russia, 2001; 657p, Available online: https://www.researchgate.net/publication/262416516_Kupcov_AH_Zizin_GN_Fure-KR_i_Fure-IK_spektry_polimerov_m_Fizmatlit_2001_657_s/references (accessed on 1 May 2024).
  96. Pittroff, M.; Mueller, Y.K.; Witzig, C.S.; Scheurer, M.; Storck, F.R.; Zumbuelte, N. Microplastic analysis in drinking water based on fractionated filtration sampling and Raman microspectroscopy. Environ. Sci. Pollut. Res. 2021, 28, 59439–59451. [Google Scholar] [CrossRef] [PubMed]
  97. Zhou, G.; Wu, Q.; Wei, X.-F.; Chen, C.; Ma, J.; Crittenden, J.C.; Liu, B. Tracing microplastics in rural drinking water in Chongqing, China: Their presence and pathways from source to tap. J. Hazard. Mater. 2023, 459, 132206. [Google Scholar] [CrossRef] [PubMed]
  98. Ramaremisa, G.; Tutu, H.; Saad, D. Detection and characterisation of microplastics in tap water from Gauteng, South Africa. Chemosphere 2024, 141903. [Google Scholar] [CrossRef]
  99. Strand, J.; Feld, L.; Murphy, F.; Mackevica, A.; Hartmann, N.B. Analysis of Microplastic Particles in Danish Drinking Water; APA: Aarhus, Denmark, 2018. [Google Scholar]
  100. Mukotaka, A.; Kataoka, T.; Nihei, Y. Rapid analytical method for characterization and quantification of microplastics in tap water using a Fourier-transform infrared microscope. Sci. Total Environ. 2021, 790, 148231. [Google Scholar] [CrossRef]
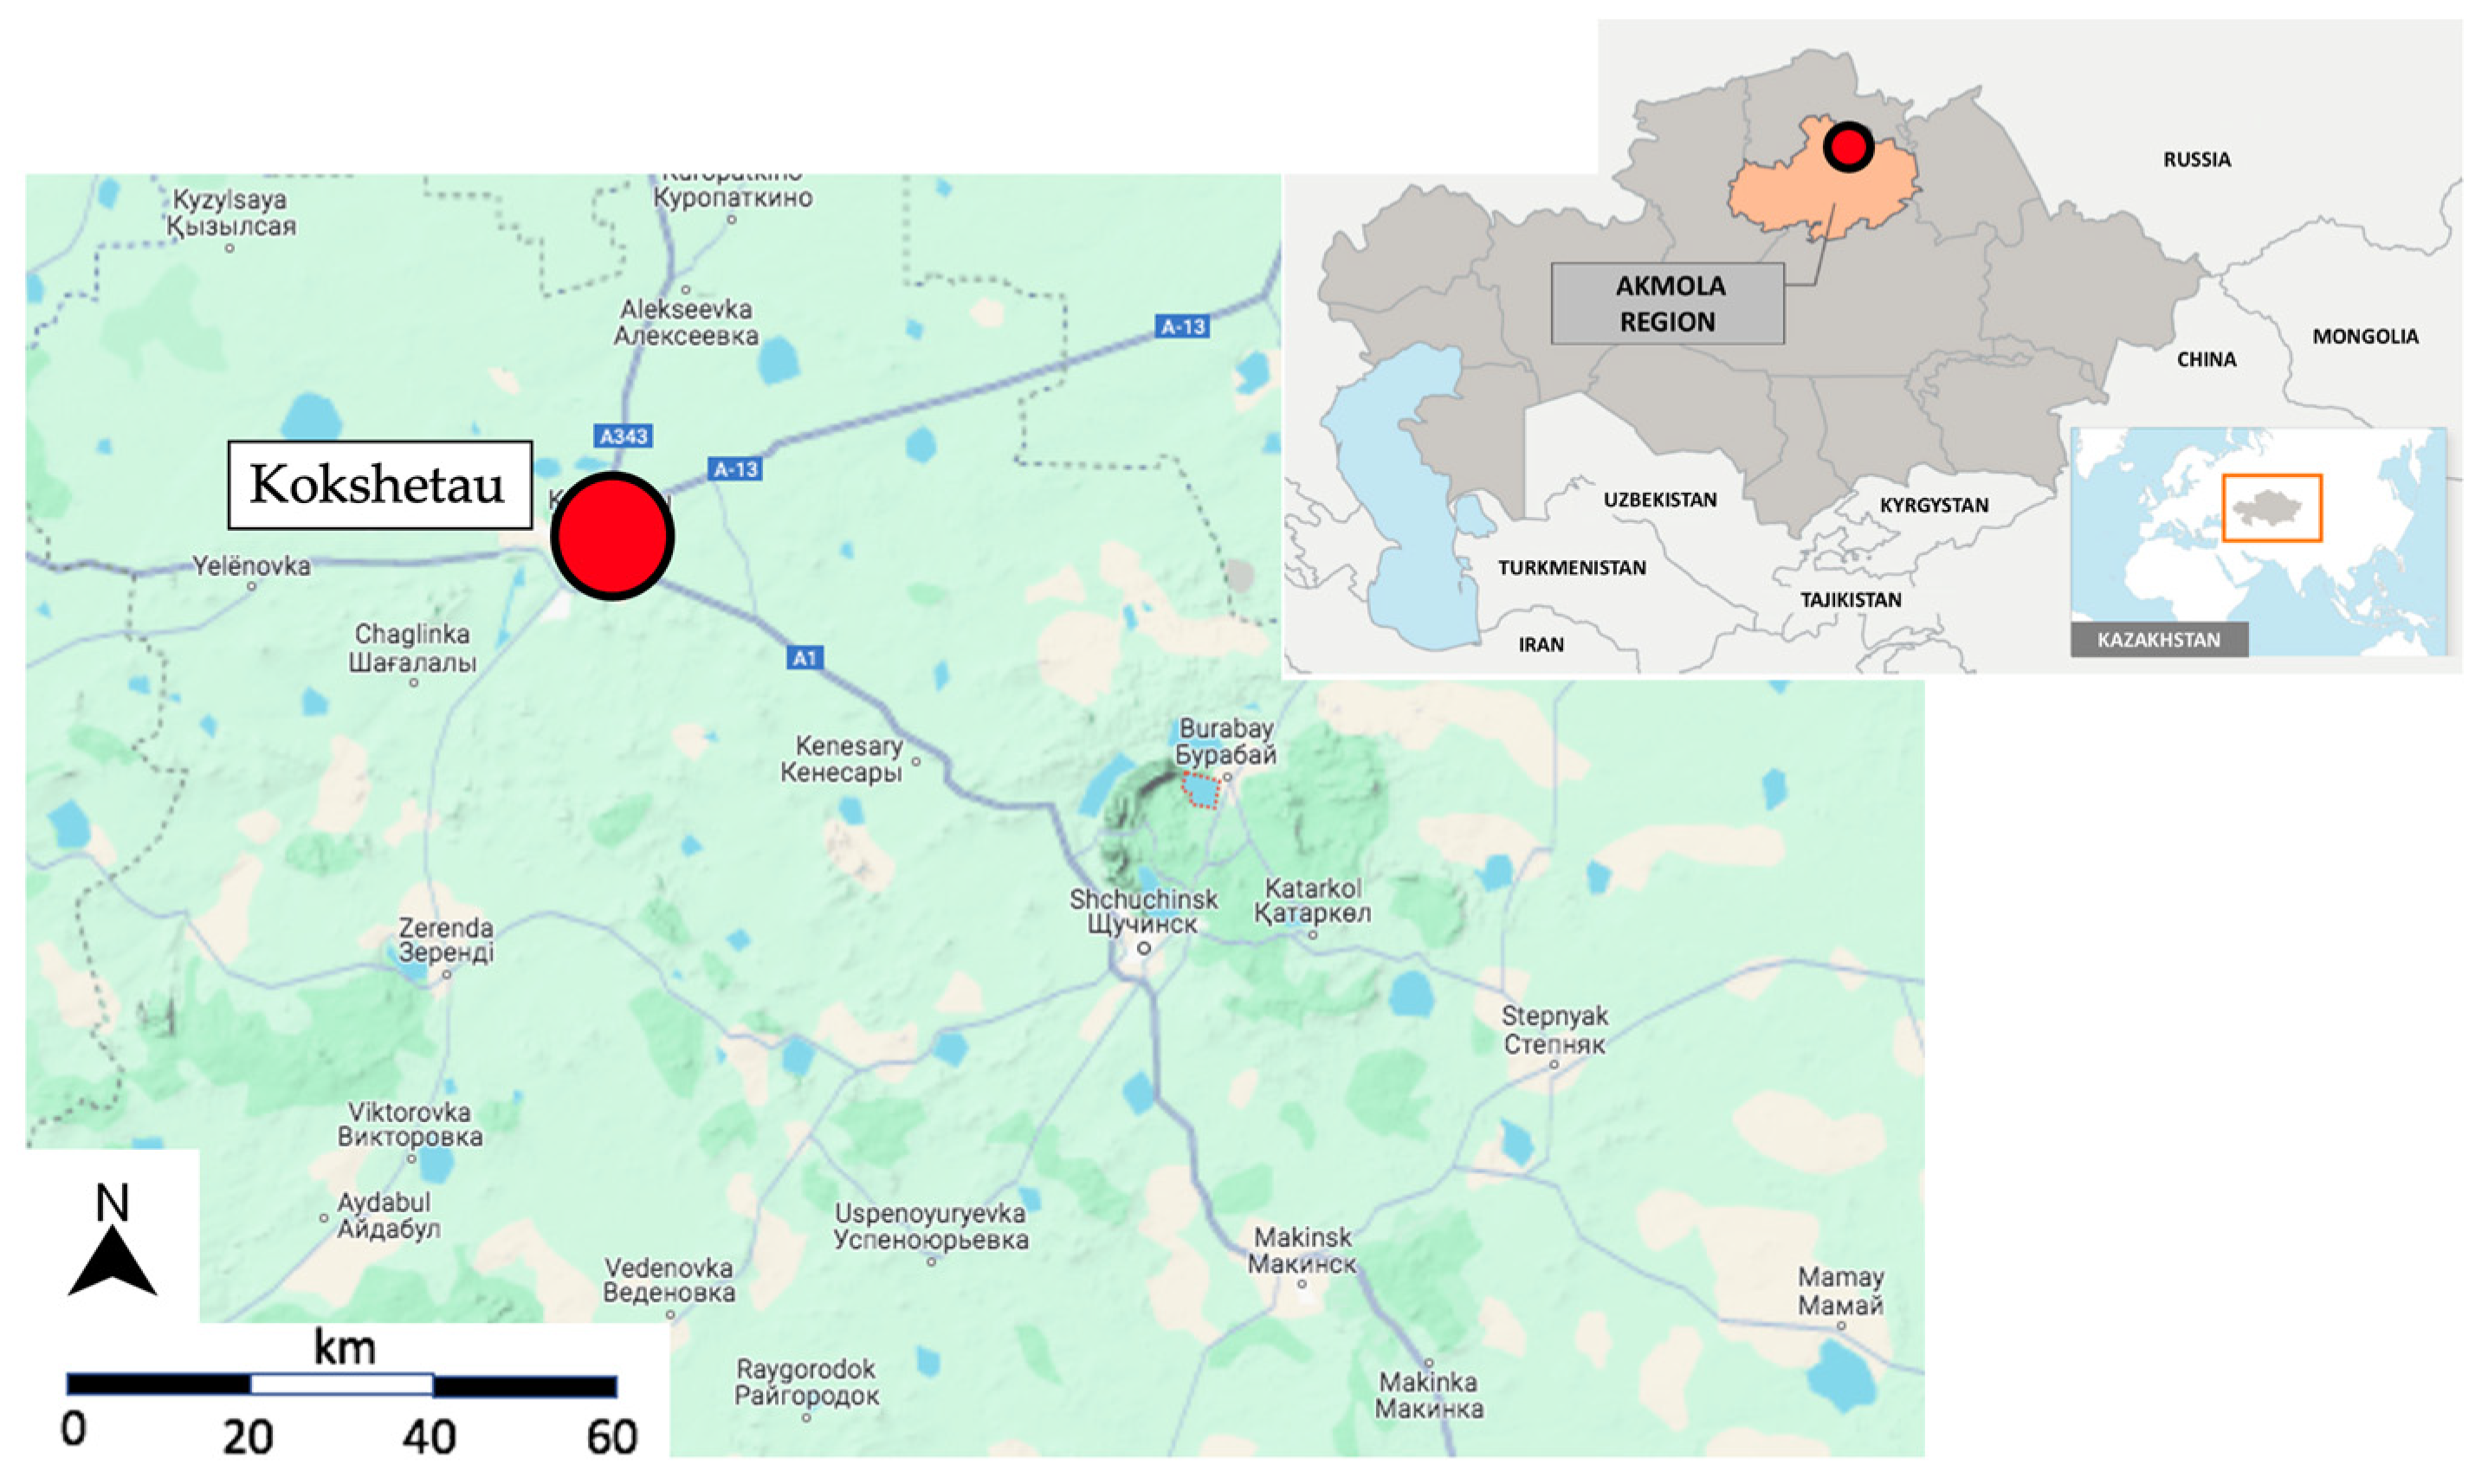
Figure 1. Location of Kokshetau city inside the Akmola region in Kazakhstan.
Water 16 01363 g001
Figure 2. Location of tap water sampling points inside Kokshetau and Krasny Yar.
Water 16 01363 g002
Figure 3. EDX spectrum of carbon sorption material.
Water 16 01363 g003
Figure 4. EDX spectrum of the zeolite.
Water 16 01363 g004
Figure 5. EDX spectrum of the sorbent (CSM + ion exchange resins).
Water 16 01363 g005
Figure 6. Technological scheme of water intake and treatment of water treatment facilities in Kazakhstan.
Water 16 01363 g006
Figure 7. (a) Grate system for coarse debris removal at Kokshetau, and (b) radial settling tank for fines removal at Almaty.
Water 16 01363 g007
Figure 8. Examples of microplastic fibers found in tap water samples.
Water 16 01363 g008
Figure 9. (a) Fragments, and (b) films of microplastics found in tap water samples.
Water 16 01363 g009
Figure 10. Microphotographs of water samples with 0.45 mm PET microparticles before and after sorption. (a) Model solution before sorption; (b) complex (CSM + ion exchange resins); (c) zeolite; (d) CSM.
Water 16 01363 g010
Figure 11. Microphotographs of water samples with PP microparticles of 0.45 mm fraction before and after sorption. (a) Model solution before sorption; (b) complex (CSM + ion exchange resins); (c) zeolite; (d) CSM.
Water 16 01363 g011
Figure 12. Microphotographs of water samples with 0.45 mm PE microparticles before and after sorption. (a) Model solution before sorption; (b) complex (CSM + ion exchange resins); (c) zeolite; (d) CSM.
Water 16 01363 g012
Figure 13. Electronic images of CSM structure (a) and zeolite structure (b).
Water 16 01363 g013
Table 1. Universal Transverse Mercator (UTM) coordinates of the sampling points.
Sample No.UTM XUTM YSample No.UTM XUTM Y
153.28900869.404590953.25282769.359687
253.27420769.4058281053.26498069.371940
353.28920469.3911701153.27750069.361754
453.28948869.3923081253.29231869.336518
553.29333869.3861381353.32999069.253996
653.29247869.3863591453.32222969.264094
753.30646669.3899171553.27103369.428809
853.30204569.427693
Table 2. Elemental composition of CSM (%).
Chemical ElementCOSiKCa
Share (%)92.456.870.060.170.44
Table 3. Elemental composition of zeolite (%).
Chemical ElementCONaMgAlSiKCaFe
Share (%)8.5260.090.521.156.9119.290.681.621.22
Table 4. Elemental composition of the sorbent (CSM + ion exchange resins), %.
Chemical ElementCOAlSiCaIn
Share (%)84.0614.030.750.610.350.20
Table 5. Results of physicochemical analysis of the tap water samples.
Sample No.Color (Degrees)Turbidity
(mg/dm3)
pHOxidization
(mg/dm3)
Microplastic Concentration
(Particles/dm3)
MPC≤20≤1.56–9≤5-
1189.516.826.84.0 × 10−2
2114.526.815.44.0 × 10−2
3153.426.805.84.0 × 10−2
4144.136.834.72.0 × 10−2
5375.226.823.32.0 × 10−2
6232.647.013.36.0 × 10−2
7223.107.103.26.0 × 10−2
832 3.137.123.26.0 × 10−2
9183.827.132.42.0 × 10−2
10352.917.042.94.0 × 10−2
11293.507.103.22.0 × 10−2
12161.907.032.82.0 × 10−2
1360.347.120.72.0 × 10−2
1470.467.100.84.0 × 10−2
15264.937.022.94.0 × 10−2
Table 6. Comparison with results from previous research about microplastic concentration in tap water.
ReferenceLocationNumber of SamplesMicroplastic Concentration
(Particles/dm3)
This studyKokshetau and Krasny Yar (Kazakhstan)154.0 × 10⁻²–6.0 × 10⁻²
[23]Central region (Saudi Arabia)21.8
[86]Barcelona city (Spain)210–5.0 × 10⁻²
[40]Tianjin (China)113.23
[87]Zahedan (Iran)107.5 × 10⁻²–40.0 × 10⁻²
[88]Mexico City (Mexico)425.0–91.0
[11]North-western region (Germany)241 × 10−4–100
[89]England and Wales (UK)390–2.4 × 10⁻²
[90]Baden-Wurttemberg (Germany)20.6 × 10⁻²–7.4 × 10⁻²
[91]Chongqing (Southwest China)11.4
[92]Gauteng (South Africa)304.7–31
[93]Denmark178.0 × 10−2–60.0 × 10⁻²
[94]Japan2829–45
Table 7. Sorption efficiency of microplastic by different sorbents (%).
PolymerFractional Size of Microplastic (mm)
0.1050.20.45
Complex (CSM + ion exchange resins)
PET82.785.286.0
PE91.792.193.6
PP85.885.789.9
Average efficiency by sorbent86.787.789.8
Zeolite
PET91.091.391.2
PE90.290.894.3
PP89.990.092.8
Average efficiency by sorbent90.490.792.8
Carbon sorption material (CSM)
PET92.792.693.3
PE95.397.297.8
PP95.094.996.8
Average efficiency by sorbent94.394.996.0
Table 8. Results of physicochemical analysis of water before and after sorption.
Sample No.Color
(Degrees)
Turbidity
(mg/dm3)
pHOxidization
(mg/dm3)
InitialFinalEFFICIENCY
(%)
InitialFinalEfficiency
(%)
InitialFinalEfficiency
(%)
InitialFinalEfficiency
(%)
Sorbent 1—Zeolite
110190.01.871.4124.68.057.526.5132.00.6799.5
29090.01.871.4323.57.967.535.4132.80.7099.5
310190.01.901.5120.58.007.535.8132.70.6099.5
Sorbent 2—CSM
1100100.01.870.5073.38.057.388.3132.00.3299.8
29.00.0100.01.870.4675.47.967.387.2132.80.2599.8
3100100.01.900.4874.78.007.397.6132.70.3099.8
Sorbent 3—(CSM + ion exchange resins)
110280.01.870.7758.88.057.635.2132.04.3296.7
29277.71.870.7361.07.967.624.2132.84.4096.7
310280.01.900.7262.18.007.605.0132.74.2596.8
Disclaimer/Publisher’s Note: The statements, opinions and data contained in all publications are solely those of the individual author(s) and contributor(s) and not of MDPI and/or the editor(s). MDPI and/or the editor(s) disclaim responsibility for any injury to people or property resulting from any ideas, methods, instructions or products referred to in the content.