Classification of Pollution Sources and Their Contributions to Surface Water Quality Using APCS-MLR and PMF Model in a Drinking Water Source Area in Southeastern China
Abstract
1. Introduction
2. Materials and Methods
2.1. Study Area and Data
2.1.1. Study Area
2.1.2. Data Description
2.2. Methodology
2.2.1. Principal Component Analysis (PCA)
2.2.2. Absolute Principal Component Analysis
2.2.3. Multivariate Linear Regression
2.2.4. Positive Matrix Factorization (PMF)
3. Results
3.1. Variations in Water Quality Indicators
3.2. PCA Results
3.3. Source Identification
3.4. Source Pollutant Contributions
3.5. Comparison of the Results
4. Discussion
5. Conclusions
- (1)
- The observed water quality analysis results showed that the water quality of Pukou was the worst among the eight monitored sections, and the maximum values of EC, COD, NH3-N, TN, and TP occurred in Pukou. In addition to TN, the average values of the other water quality indicators were above Class II. The variation characteristics of daily NH3-N and TN were consistent. The Nemerow index was the largest for Pukou. Most sections had no significant annual change trends, except for a significant decrease in Xinguan.
- (2)
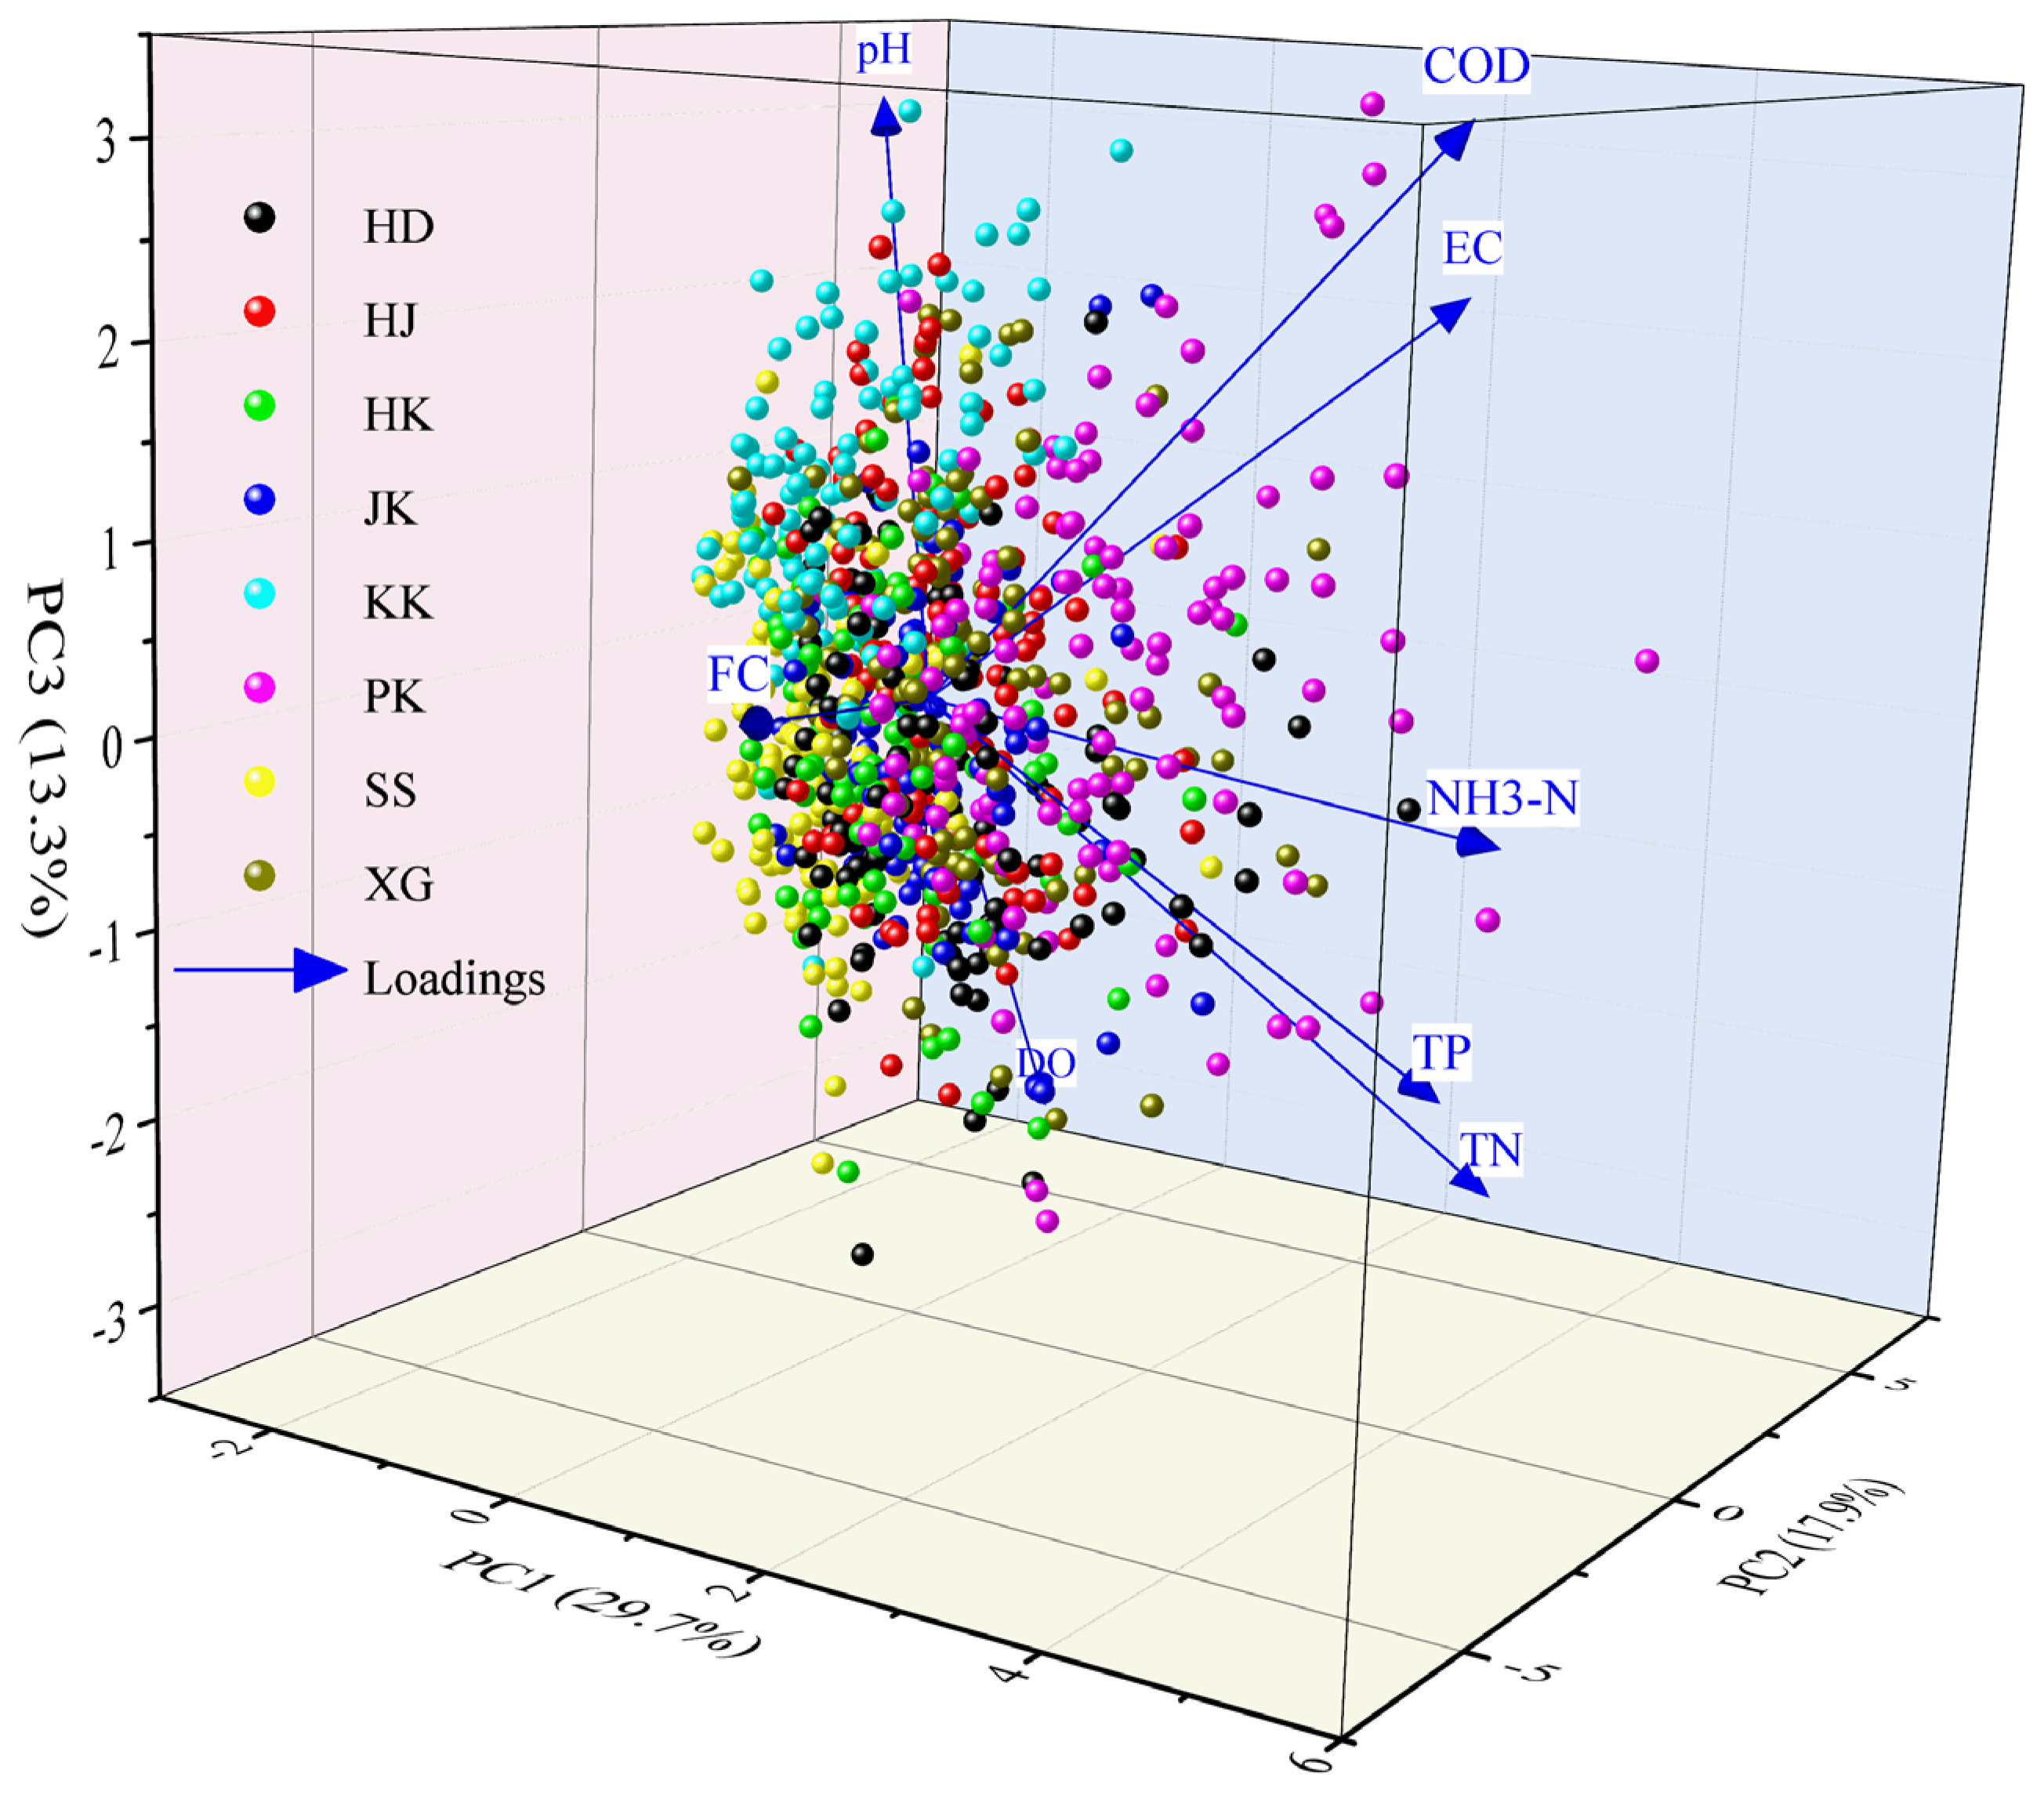
- The results of the correlation analysis demonstrated that EC and COD, COD and NH3-N, NH3-N and TP, and TN and TP may have similar pollution sources. The sources of pH and FC were significantly different from other indicators.
- (3)
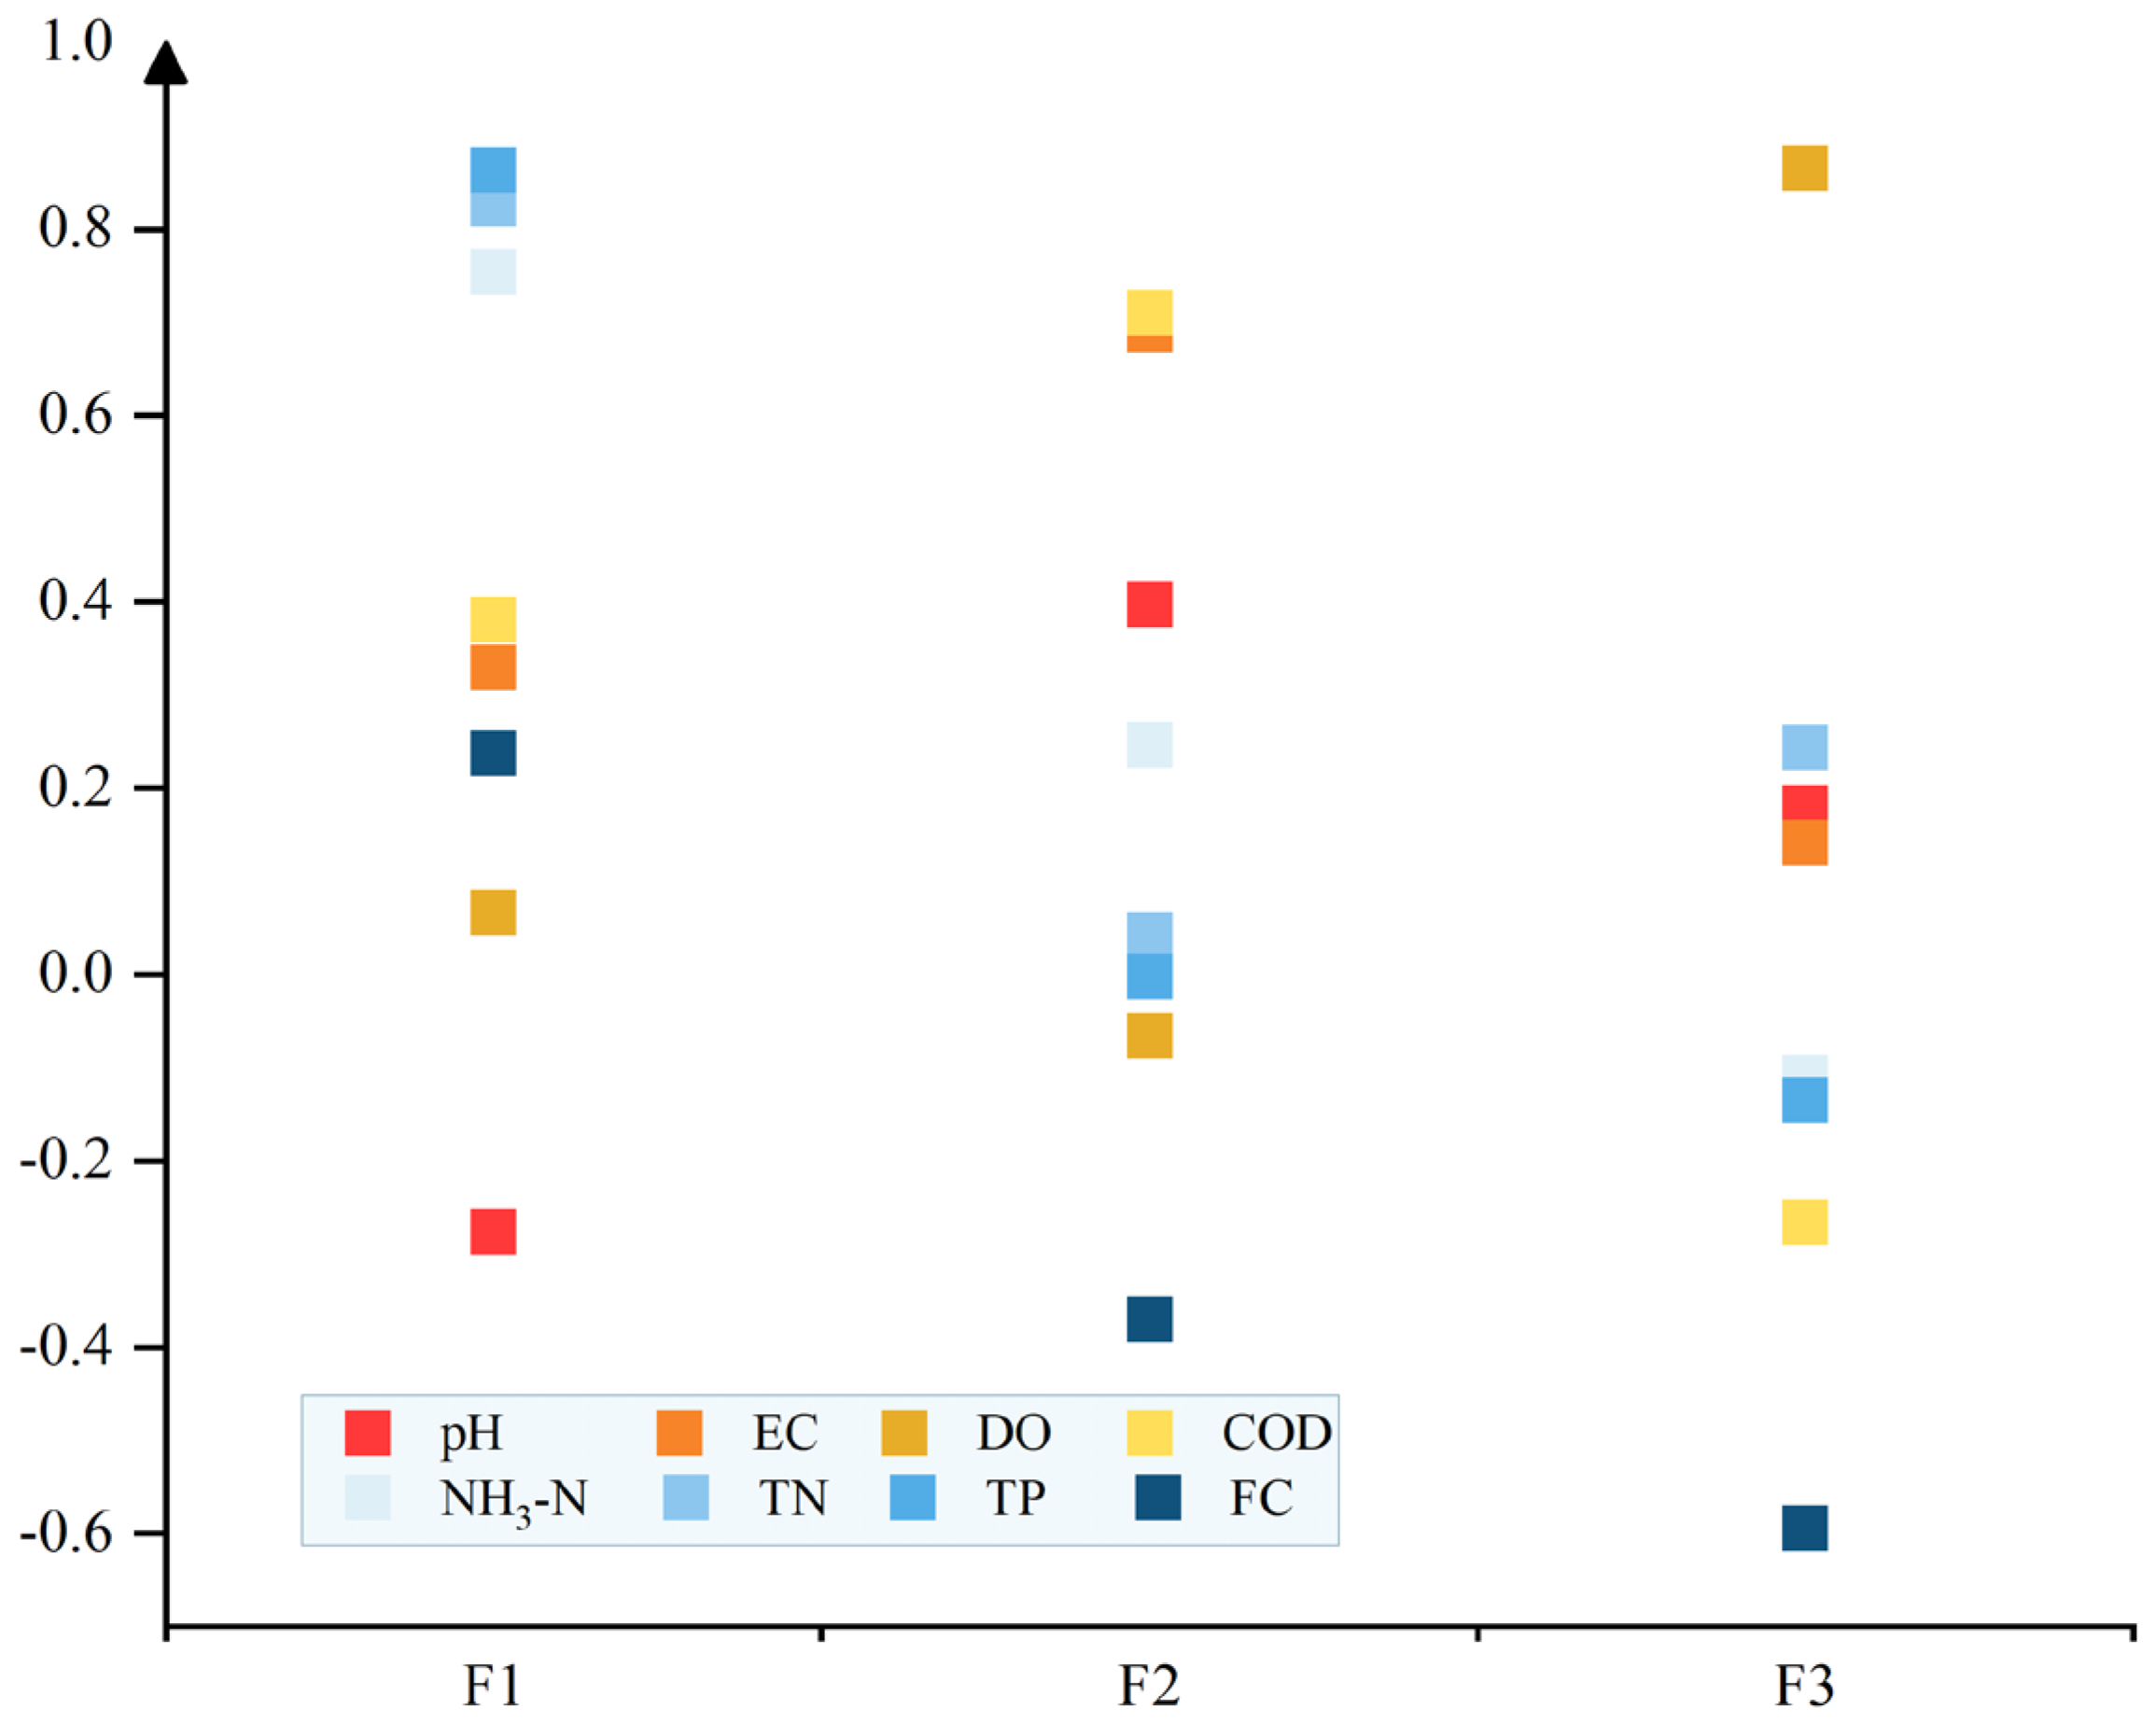
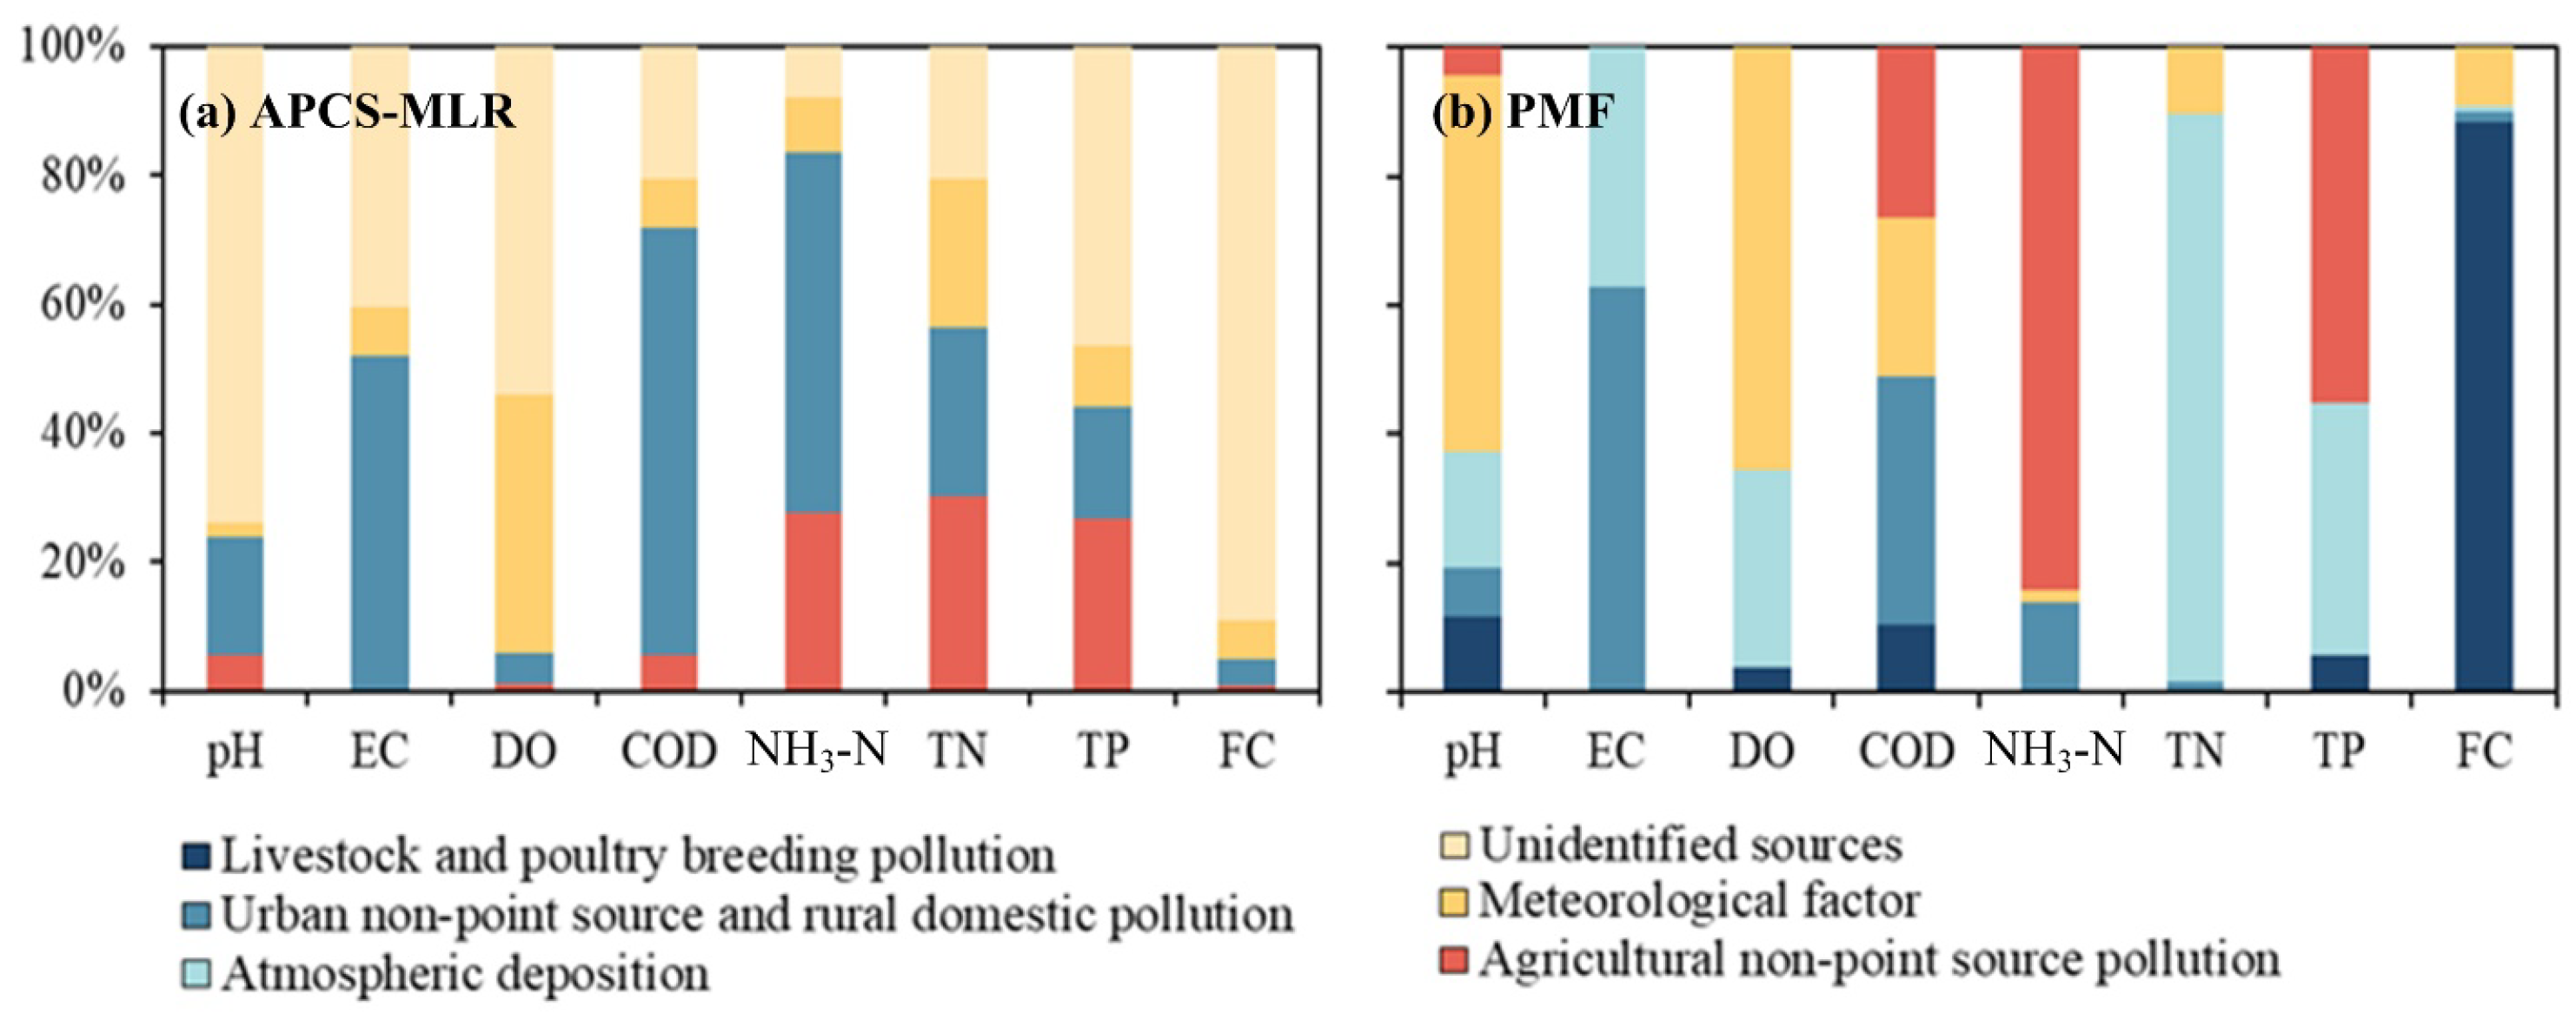
- For APCS-MLR, three pollution sources were defined. For EC, COD, and NH3-N, the major pollution sources were urban nonpoint sources and rural domestic pollution, accounting for 50.4%, 66.2%, and 55.7%, respectively. The major contamination source of TN was agricultural nonpoint source pollution (30.4%). The major pollution sources of pH, DO, TP, and FC were unidentified factors, which represented 73.9%, 54.1%, 46.5%, and 89.1%, respectively, of the total pollution.
- (4)
- For the PMF model, five pollution sources were defined. pH and DO were affected by meteorological factors. NH3-N and TP were influenced mainly by agricultural nonpoint source pollution, and the contribution rates were 84.2% and 55.3%, respectively. Atmospheric deposition was the main pollution source (87.9%) of TN. FC was mostly derived from livestock and poultry breeding (88.3%). EC and COD were mostly affected by urban nonpoint sources and rural domestic pollution, accounting for 62.9% and 38.5%, respectively.
- (5)
- Both models identified agricultural nonpoint source pollution, urban nonpoint source pollution and rural domestic pollution, and meteorological factors. The sum of these three sources was very close, accounting for 60% and 58%, respectively. The remaining 40% of the APCS-MLRs were unidentified. According to the PMF model, the remaining 42% were associated with atmospheric deposition (27%) and livestock and poultry breeding pollution (15%).
Author Contributions
Funding
Data Availability Statement
Conflicts of Interest
References
- Brown, T.C.; Froemke, P. Nationwide assessment of nonpoint source threats to water quality. BioScience 2012, 62, 136–146. [Google Scholar] [CrossRef]
- Saksena, D.; Garg, R.; Rao, R. Water quality and pollution status of Chambal river in National Chambal sanctuary, Madhya Pradesh. J. Environ. Biol. 2008, 29, 701–710. [Google Scholar] [PubMed]
- Ren, X.; Cheng, Y.; Zhao, B.; Xiao, J.; Gao, D.; Zhang, H. Water quality assessment and pollution source apportionment using multivariate statistical and PMF receptor modeling techniques in a sub-watershed of the upper Yangtze River, Southwest China. Environ. Geochem. Health 2023, 45, 6869–6887. [Google Scholar] [CrossRef] [PubMed]
- Mester, T.; Benkhard, B.; Vasvári, M.; Csorba, P.; Kiss, E.; Balla, D.; Fazekas, I.; Csépes, E.; Barkat, A.; Szabó, G. Hydrochemical Assessment of the Kisköre Reservoir (Lake Tisza) and the Impacts of Water Quality on Tourism Development. Water 2023, 15, 1514. [Google Scholar] [CrossRef]
- Iqbal, J.; Shah, M.H. Occurrence, risk assessment, and source apportionment of heavy metals in surface sediments from khanpur lake, pakistan. J. Anal. Sci. Technol. 2014, 5, 28. [Google Scholar] [CrossRef]
- Summya, N.; Zeshan, A.; Riffat, N. Water quality assessment of river Soan (Pakistan) and source apportionment of pollution sources through receptor modelling. Arch. Environ. Contam. Toxicol. 2016, 71, 97–112. [Google Scholar]
- Koundouri, P. Current issues in the economics of groundwater resource management. J. Econ. Surv. 2010, 18, 703–740. [Google Scholar] [CrossRef]
- Cheng, G.; Wang, M.; Chen, Y.; Gao, W. Source apportionment of water pollutants in the upstream of Yangtze River using APCS-MLR. Environ. Geochem. Health 2020, 42, 3795–3810. [Google Scholar] [CrossRef]
- Moya, C.E.; Raiber, M.; Taulis, M.; Cox, M.E. Hydrochemical evolution and groundwater flow processes in the Galilee and Eromanga basins, Great Artesian Basin, Australia: A multivariate statistical approach. Sci. Total Environ. 2015, 508, 411–426. [Google Scholar] [CrossRef]
- Singh, K.P.; Malik, A.; Mohan, D.; Sinha, S. Multivariate statistical techniques for the evaluation of spatial and temporal variations in water quality of Gomti River (India)—A case study. Water. Res. 2004, 38, 3980–3992. [Google Scholar] [CrossRef]
- Wang, A.; Tang, L.; Yang, D. Spatial and temporal variability of nitrogen load from catchment and retention along a river network: A case study in the upper Xin’anjiang catchment of China. Hydrol. Res. 2016, 47, 869–887. [Google Scholar] [CrossRef]
- Hou, X.K.; Zhang, K.; Duan, P.Z.; Wang, X.; Ta, L.; Guo, Y.; Xia, R. Pollution source apportionment of Tuohe River Based on absolute principal component score-multiple linear regression. Res. Environ. Sci. 2021, 34, 2350–2357. [Google Scholar]
- Hou, X.K.; Zhan, X.Y.; Zhou, F.; Yan, X.Y.; Gu, B.J.; Reis, S.F.; Wu, Y.L.; Liu, H.B.; Piao, S.L.; Tang, Y.H. Detection and attribution of nitrogen runoff trend in China’s croplands. Environ. Pollut. 2018, 234, 270–278. [Google Scholar] [CrossRef]
- Arnold, J.G.; Allen, P.M.; Bernhardt, G. A comprehensive surface-groundwater flow model. J. Hydrol. 1993, 142, 47–69. [Google Scholar] [CrossRef]
- Bicknell, B.R.; Imhoff, J.C.; Kittle, J.L. Hydrological Simulation Program: Fortran; User’s manual for release 10; U.S. Environmental Protection Agency: Washington, DC, USA, 1993.
- Young, R.A.; Onstad, C.A.; Bosch, D.D.; Anderson, W.P. AGNPS: A nonpoint-source pollution model for evaluating agricultural watersheds. J. Soil. Water. Conserv. 1989, 44, 168–173. [Google Scholar]
- Ji, J.; Xu, Z. Progress on tracing sources and biogeochemical cycling of phosphorus by using oxygen isotopes of phosphate. Environ. Sci. Technol. 2010, 33, 360–363. [Google Scholar]
- Thurston, G.D.; Spengler, J.D. A quantitative assessment of source contributions to inhalable particulate matter pollution in metropolitan Boston. Atmos. Environ. 1985, 19, 9–25. [Google Scholar] [CrossRef]
- Zhou, F.; Liu, Y.; Guo, H. Application of multivariate statistical methods to water quality assessment of the watercourses in Northwestern New Territories, Hong Kong. Environ. Monit. Assess. 2007, 132, 1–13. [Google Scholar] [CrossRef] [PubMed]
- Shi, W.; Gu, Z.; Feng, Y. Source apportionment of heavy metals in sediments with application of APCS-MLR model in Baoxiang River. Environ. Sci. Technol. 2020, 43, 51–59. [Google Scholar]
- Guan, Q.; Zhao, R.; Pan, N.; Wang, F.; Yang, Y.; Luo, H. Source apportionment of heavy metals in farmland soil of Wuwei, China: Comparison of three receptor models. J. Clean. Prod. 2019, 237, 117792.1–117792.10. [Google Scholar] [CrossRef]
- Wu, J.; Margenot, A.J.; Wei, X.; Fan, M.; Zhang, H.; Best, J.L.; Wu, P.; Chen, F.; Gao, C. Source apportionment of soil heavy metals in fluvial islands, Anhui section of the lower Yangtze River: Comparison of APCS–MLR and PMF. J. Soil. Sediment. 2020, 20, 3380–3393. [Google Scholar] [CrossRef]
- Zhang, H.; Cheng, S.; Li, H.; Fu, K.; Xu, Y. Groundwater pollution source identification and apportionment using PMF and PCA-APCA-MLR receptor models in a typical mixed land-use area in Southwestern China. Sci. Total Environ. 2020, 741, 140383. [Google Scholar] [CrossRef] [PubMed]
- Liu, L.; Tang, Z.; Kong, M.; Chen, X.; Zhou, C.; Huang, K.; Wang, Z. Tracing the potential pollution sources of the coastal water in Hong Kong with statistical models combining APCS-MLR. J. Environ. Manag. 2019, 245, 143–150. [Google Scholar] [CrossRef] [PubMed]
- Liu, Z.; Ding, C.; Chao, J.; Zheng, Z.; Cui, Y. Pollution source apportionment of Changtan Reservoir of Zhejiang province based on APCS-MLR model. J. Ecol. Rural Environ. 2023, 39, 530–539. [Google Scholar]
- Wang, S.; Cai, L.M.; Wen, H.H.; Luo, J.; Wang, Q.S.; Liu, X. Spatial distribution and source apportionment of heavy metals in soil from a typical county-level city of Guangdong province, China. Sci. Total Environ. 2019, 655, 92–101. [Google Scholar] [CrossRef]
- Wang, Y.; Li, Y.; Yang, S.; Liu, J.; Zheng, W.; Xu, J.; Cai, H.; Liu, X. Source apportionment of soil heavy metals: A new quantitative framework coupling receptor model and stable isotopic ratios. Environ. Pollut. 2022, 314, 120291. [Google Scholar] [CrossRef] [PubMed]
- Cho, Y.C.; Choi, H.; Lee, M.G.; Kim, S.H.; Im, J.K. Identification and apportionment of potential pollution sources using multivariate statistical techniques and APCS-MLR model to assess surface water quality in Imjin river watershed. South Korea. Water 2022, 14, 793. [Google Scholar] [CrossRef]
- Gholizadeh, M.H.; Melesse, A.M.; Reddi, L. Water quality assessment and apportionment of pollution sources using APCS-MLR and PMF receptor modeling techniques in three major rivers of South Florida. Sci. Total Environ. 2016, 566–567, 1552–1567. [Google Scholar] [CrossRef] [PubMed]
- Wang, J.; Wu, H.; Wei, W.; Xu, C.; Tan, X.; Wen, Y.; Lin, A. Health risk assessment of heavy metal (loid)s in the farmland of megalopolis in China by using APCS-MLR and PMF receptor models: Taking Huairou District of Beijing as an example. Sci. Total Environ. 2022, 835, 155313. [Google Scholar] [CrossRef]
- Zhang, M.; Wang, X.; Liu, C.; Lu, J.; Qin, Y.; Mo, Y.; Xiao, P.; Liu, Y. Quantitative source identification and apportionment of heavy metals under two different land use types: Comparison of two receptor models APCS-MLR and PMF. Environ. Sci. Pollut. Res. 2020, 27, 42996–43010. [Google Scholar] [CrossRef]
- Salim, I.; Sajjad, R.U.; Paule-Mercado, M.C.; Memon, S.A.; Lee, B.Y.; Sukhbaatar, C.; Lee, C.H. Comparison of two receptor models PCA-MLR and PMF for source identification and apportionment of pollution carried by runoff from catchment and sub-watershed areas with mixed land cover in South Korea. Sci. Total Environ. 2019, 663, 764–775. [Google Scholar] [CrossRef]
- Howden, N.J.K.; Burt, T.P.; Mathias, S.A.; Worrall, F.; Whelan, M.J. Modelling long-term diffuse nitrate pollution at the catchment-scale: Data, parameter and epistemic uncertainty. J. Hydrol. 2011, 403, 337–351. [Google Scholar] [CrossRef]
- Zhu, D.; Zhang, J.; Chen, H.; Geng, L. Security assessment of urban drinking water sources I: Indicator system and assessment method. J. Hydraul. Eng. 2010, 41, 778–785. [Google Scholar]
- Wang, S.; Wang, A.; Yang, D.; Gu, Y.; Tang, L.; Sun, X. Understanding the spatiotempoal variability in nonpoint source nutrient loads and its effect on water quality in the upper Xin’an river basin, Eastern China. J. Hydrol. 2023, 621, 129582. [Google Scholar] [CrossRef]
- Chen, F.; Wang, R. Study on long-acting effect of ecological compensation mechanism in Xin’an River Basin. Yangtze River 2021, 52, 44–49. [Google Scholar]
- Wu, X. Water environment protection and river water quality ranking of Xin’an River Basin in Huangshan City. China Res. Comp. Util. 2017, 35, 79–81. [Google Scholar]
- Wang, X.; Wang, Q.; Wu, C.; Liang, T.; Zheng, D.; Wei, X. A method coupled with remote sensing data to evaluate non-point source pollution in the Xin’anjiang catchment of China. Sci. Total Environ. 2012, 430, 132–143. [Google Scholar] [CrossRef] [PubMed]
- Zhai, X.; Zhang, Y.; Wang, X.; Xia, J.; Liang, T. Non-point source pollution modelling using Soil and Water Assessment Tool and its parameter sensitivity analysis in Xin’anjiang catchment, China. Hydrol. Process. 2014, 28, 1627–1640. [Google Scholar] [CrossRef]
- GB3838-2002; Environmental Quality Standards for Surface Water. Ministry of Ecology and Environment: Beijing, China, 2002.
- Pearson, K. On Lines and Planes of Closest Fit to Systems of Points in Space. Philos. Mag. 1901, 2, 559–572. [Google Scholar] [CrossRef]
- Hotelling, H. Analysis of a Complex of Statistical Variables into Principal Components. J. Educ. Psychol. 1933, 24, 417–441. [Google Scholar] [CrossRef]
- Aidoo, E.; Appiah, S.; Awashie, G.; Boateng, A.; Darko, G. Geographically weighted principal component analysis for characterising the spatial heterogeneity and connectivity of soil heavy metals in kumasi, ghana. Heliyon 2021, 7, e08039. [Google Scholar] [CrossRef] [PubMed]
- Olsen, R.L.; Chappell, R.W.; Loftis, J.C. Water quality sample collection, data treatment and results presentation for principal components analysis a literature review and Illinois River watershed case study. Water. Res. 2012, 46, 3110–3122. [Google Scholar] [CrossRef]
- Davis, J.C. Statistics and Data Analysis in Geology, 3rd ed.; Wiley: Hoboken, NJ, USA, 2002; p. 638. [Google Scholar]
- Jackson, J.E. A User’s Guide to Principal Components; Wiley: Hoboken, NJ, USA, 2003; p. 569. [Google Scholar]
- Jolliffe, I.T. Principal Component Analysis, 2nd ed.; Springer: Berlin/Heidelberg, Germany, 2002; p. 487. [Google Scholar]
- Manly, B.F.J. Multivariate Statistical Methods: A Primer, 2nd ed.; Chapman and Hall/CRC: Boca Raton, FL, USA, 2000; p. 25. [Google Scholar]
- Shaw, P.J.A. Multivariate Statistics for the Environmental Sciences; Hodder Education Publishers: London, UK, 2003; p. 233. [Google Scholar]
- Jiang, Y.; Chao, S.; Liu, J.; Yang, Y.; Chen, Y.; Zhang, A.; Cao, H. Source apportionment and health risk assessment of heavy metals in soil for a township in Jiangsu province, China. Chemosphere 2017, 168, 1658–1668. [Google Scholar] [CrossRef] [PubMed]
- Chai, L.; Wang, Y.H.; Wang, X.; Ma, L.; Cheng, Z.X.; Su, L.M. Pollution characteristics, spatial distributions, and source apportionment of heavy metals in cultivated soil in Lanzhou, China. Ecol. Indic. 2021, 125, 107507. [Google Scholar] [CrossRef]
- Tan, J.; Duan, J.; Ma, Y.; He, K.; Cheng, Y.; Deng, S.X.; Huang, Y.L.; Si-Tu, S.P. Long-term trends of chemical characteristics and sources of fine particle in Foshan City, Pearl River Delta: 2008–2014. Sci. Total Environ. 2016, 565, 519–528. [Google Scholar] [CrossRef] [PubMed]
- Kaiser, H.F. An index of factorial simplicity. Psychometrika 1974, 39, 31–36. [Google Scholar] [CrossRef]
- Liu, Y.; Wang, S.; Lohmann, R.; Yu, N.; Zhang, C.; Gao, Y.; Zhao, J.; Ma, L. Source apportionment of gaseous and particulate PAHs from traffic emission using tunnel measurements in Shanghai, China. Atmos. Environ. 2015, 107, 129–136. [Google Scholar] [CrossRef]
- Shi, W.; Li, T.; Feng, Y.; Su, H.; Yang, Q. Source apportionment and risk assessment for available occurrence forms of heavy metals in Dongdahe Wetland sediments, southwest of China. Sci. Total Environ. 2020, 815, 152837. [Google Scholar] [CrossRef]
- Han, X.; Zhu, G.; Wu, Z.; Chen, W.; Zhu, M. Spatial-temporal variations of water quality parameters in Xin’anjiang reservoir (lake qiandao) and the water protection strategy. J. Lake Sci. 2013, 25, 836–845. [Google Scholar]






| Parameter | pH | EC | DO | COD | NH3-N | TN | TP | FC |
|---|---|---|---|---|---|---|---|---|
| Unit | - | μS/cm | mg/L | mg/L | mg/L | mg/L | mg/L | MPN/L |
| Hengjiang | 7.9 ± 0.6 | 235 ± 101 | 9.1 ± 1.7 | 2.1 ± 0.7 | 0.18 ± 0.14 | 1.54 ± 0.58 | 0.053 ± 0.029 | 4665 ± 3585 |
| Shuaishui | 7.9 ± 0.5 | 67 ± 33 | 9.1 ± 1.5 | 1.4 ± 0.5 | 0.11 ± 0.06 | 0.99 ± 0.29 | 0.035 ± 0.022 | 4087 ± 3267 |
| Xinguan | 7.8 ± 0.5 | 257 ± 77 | 8.3 ± 1.7 | 2.0 ± 0.6 | 0.21 ± 0.15 | 1.81 ± 1.05 | 0.055 ± 0.029 | 4060 ± 3824 |
| Huangkou | 7.6 ± 0.5 | 147 ± 71 | 9.1 ± 1.5 | 1.9 ± 0.7 | 0.25 ± 0.18 | 1.45 ± 0.50 | 0.057 ± 0.024 | 5955 ± 3374 |
| Huangdun | 7.7 ± 0.5 | 152 ± 62 | 9.7 ± 2.0 | 2.1 ± 0.9 | 0.26 ± 0.23 | 1.62 ± 0.54 | 0.074 ± 0.034 | 5280 ± 3632 |
| Pukou | 7.7 ± 0.5 | 345 ± 210 | 7.8 ± 1.8 | 2.6 ± 0.8 | 0.41 ± 0.28 | 2.24 ± 0.81 | 0.106 ± 0.038 | 6342 ± 3339 |
| Kengkou | 7.7 ± 0.5 | 203 ± 107 | 8.2 ± 1.6 | 2.3 ± 0.8 | 0.25 ± 0.19 | 0.08 ± 0.13 | 0.031 ± 0.015 | 4287 ± 3559 |
| Jiekou | 7.8 ± 0.5 | 146 ± 44 | 8.9 ± 1.5 | 1.8 ± 0.5 | 0.02 ± 0.03 | 1.59 ± 0.26 | 0.058 ± 0.009 | 2538 ± 2987 |
| Class I | 6~9 | - | ≤7.5 | ≤2 | ≤0.15 | ≤0.2 | ≤0.02 | ≤200 |
| Class II | - | ≤6 | ≤4 | ≤0.5 | ≤0.5 | ≤0.1 | ≤2000 | |
| Class III | - | ≤5 | ≤6 | ≤1 | ≤1 | ≤0.2 | ≤10,000 | |
| Class IV | - | ≤3 | ≤10 | ≤1.5 | ≤1.5 | ≤0.3 | ≤20,000 | |
| Class V | - | ≤2 | ≤15 | ≤2 | ≤2 | ≤0.4 | ≤40,000 |
| Component | Initial Eigenvalue | Extraction Sums of Squared Loadings | Rotation Sums of Squared Loadings | ||||||
|---|---|---|---|---|---|---|---|---|---|
| Total | Variance (%) | Cumulative (%) | Total | Variance (%) | Cumulative (%) | Total | Variance (%) | Cumulative (%) | |
| 1 | 2.377 | 29.719 | 29.719 | 2.377 | 29.719 | 29.719 | 2.022 | 28.276 | 25.276 |
| 2 | 1.429 | 17.858 | 47.576 | 1.429 | 17.858 | 47.576 | 1.477 | 18.459 | 43.736 |
| 3 | 1.067 | 13.334 | 60.910 | 1.067 | 13.334 | 60.910 | 1.374 | 17.175 | 60.910 |
| Items | APCS-MLR | PMF | ||
|---|---|---|---|---|
| O/S | R2 | O/S | R2 | |
| pH | 1 | 0.41 | 0.89 | 0.75 |
| EC | 1 | 0.61 | 1.17 | 0.76 |
| DO | 1 | 0.67 | 1.17 | 0.53 |
| COD | 1 | 0.69 | 1.05 | 0.69 |
| NH3-N | 1 | 0.60 | 1.16 | 0.60 |
| TN | 1 | 0.65 | 1.008 | 0.82 |
| TP | 0.997 | 0.67 | 0.96 | 0.75 |
| FC | 1 | 0.57 | 0.998 | 0.93 |
Disclaimer/Publisher’s Note: The statements, opinions and data contained in all publications are solely those of the individual author(s) and contributor(s) and not of MDPI and/or the editor(s). MDPI and/or the editor(s) disclaim responsibility for any injury to people or property resulting from any ideas, methods, instructions or products referred to in the content. |
© 2024 by the authors. Licensee MDPI, Basel, Switzerland. This article is an open access article distributed under the terms and conditions of the Creative Commons Attribution (CC BY) license (https://creativecommons.org/licenses/by/4.0/).
Share and Cite
Wang, A.; Wang, J.; Luan, B.; Wang, S.; Yang, D.; Wei, Z. Classification of Pollution Sources and Their Contributions to Surface Water Quality Using APCS-MLR and PMF Model in a Drinking Water Source Area in Southeastern China. Water 2024, 16, 1356. https://doi.org/10.3390/w16101356
Wang A, Wang J, Luan B, Wang S, Yang D, Wei Z. Classification of Pollution Sources and Their Contributions to Surface Water Quality Using APCS-MLR and PMF Model in a Drinking Water Source Area in Southeastern China. Water. 2024; 16(10):1356. https://doi.org/10.3390/w16101356
Chicago/Turabian StyleWang, Ai, Jiangyu Wang, Benjie Luan, Siru Wang, Dawen Yang, and Zipeng Wei. 2024. "Classification of Pollution Sources and Their Contributions to Surface Water Quality Using APCS-MLR and PMF Model in a Drinking Water Source Area in Southeastern China" Water 16, no. 10: 1356. https://doi.org/10.3390/w16101356
APA StyleWang, A., Wang, J., Luan, B., Wang, S., Yang, D., & Wei, Z. (2024). Classification of Pollution Sources and Their Contributions to Surface Water Quality Using APCS-MLR and PMF Model in a Drinking Water Source Area in Southeastern China. Water, 16(10), 1356. https://doi.org/10.3390/w16101356


