1. Introduction
Groundwater serves as the primary source of water for potable use, making up about 97% of the freshwater accessible for human consumption [
1]. The management of groundwater resources necessitates reliable models and understanding of groundwater recharge [
2]. Modeling groundwater recharge in coastal plain environments and other high-yield settings is crucial for understanding and utilizing water resources wisely in the face of increased demand and climatological changes in these regions [
3,
4]. West–Central Florida, with a high reliance on groundwater resources for a potable water supply, faces seawater intrusion and surface wetland/streamflow impacts [
5]. This scenario is not unique to Florida; globally, coastal regions are experiencing pressures due to population growth and intensified urbanization, which not only place increased stress on water demand but also pose significant threats to groundwater and coastal ecosystems [
6,
7,
8,
9].
In most environments, the source of groundwater is mainly from precipitation infiltration and then percolation to the water table [
10]. The rate of groundwater recharge can be affected by many factors, such as land use land cover (LULC) [
11], hydraulic conductivity (
KS), antecedent moisture content, evapotranspiration (ET) rate, soil moisture retention, and depth to water table (DTWT). In order to manage water resources for domestic, agricultural, and industrial use, computational models are employed to evaluate alternatives and the implications of climate variability [
12,
13]. The accurate estimation of groundwater recharge from rainfall infiltration has always been a challenge in groundwater modeling [
14]. Estimation usually requires complex models, often over large and diverse areas. However, the actual recharge mechanics in the models are often overly simplistic, such as applying a fractional multiplier to the rainfall volume [
15], or flawed because of the uncertainties and assumptions that differ in each model, and the timing aspects are rarely addressed properly [
15].
Understanding and modeling the timing and magnitude of groundwater recharge from rainfall infiltration through vadose-zone percolation is complex because the flux is being acted on by root-zone evapotranspiration (ET), and very little of the rainfall infiltration ever becomes water-table recharge [
16,
17]. Compounding this complexity, recharge in deeper water-table settings can take considerable time (months to years) and is very sensitive to the moisture conditions above equilibrium (hydrostatic pressures) and the vertical hydraulic conductivity, which varies to the power of seven or eight with moisture content [
18].
Established coupled surface flow and groundwater modeling, such as MODFLOW [
19] and HSPF [
20], are widely used to simulate groundwater recharge for water resource management [
21]. These models fundamentally conceptualize the soil system as a dynamic reservoir [
22] with moderately physical or purely empirical connectivity. In addition, these models operate on the principle that infiltrating water, which is a function of soil characteristics and prevailing hydrological conditions, will contribute to the water table, with a discernible fraction potentially recharging the aquifer even within the day of occurrence. However, the relationship between DTWT and recharge timescale, the time required for infiltrated water to reach the groundwater and raise the water table, is highly non-linear. Even for shallow water tables (e.g., DTWT of 1 m or less), where the recharge timescale is presumed to be near immediate, many existing models only poorly predict the recharge to groundwater [
23], leading to unrealistic water balance in the models and poor stress-evaluation performance.
Research, for example, by Gonçalves et al. [
24] and Zhang et al. [
25], has shown that air entrapment can significantly reduce vertical hydraulic conductivity and the available pore space for water storage. This effect can lead to an overestimation of both the recharge rate and the corresponding recharge timescale. However, data regarding the estimation of recharge timescales and threshold conditions in different environments remain sparse.
Lehman et al. [
26] studied the space and time scale of a soil surface subjected to direct evaporation and developed several characteristic length scales (LC and LG) to describe the contribution from direct film support and diffusive vaporization of evaporation. While they studied similar sandy soils as this study, the length scales they were working with, the uppermost soil layer (90–140 mm), and the non-dimensional characterization did not address recharge and were not directly usable for this study.
Pozdniakov et al. [
27] studied the space and timescale behavior of specific yield, advancing the theoretical hydrostatic-based analysis by Nachabe [
28], and the temporal modeling and laboratory work of Shah and Ross [
29]. Their analysis was more relevant as they studied the behavior of the capillary zone and especially the capillary fringe transition associated with a water table subjected to bottom vertical fluxes (pumping) to help characterize the specific yield for timescales from diurnal to seasonal. They proposed a dimensionless time scale for GW fluctuations and an approximate formula (the theoretical equation was apparently not integratable) and tested the behavior and performance with HYDRUS-1D on a great variety of soils. Their work helps characterize the specific yield with van Genuchten parameters subjected to specific temporal pumping stress. However, it only considered changes in the capillary zone from pumping (below) and not wetting through the column. Further study of their results and normalization is underway to better characterize water reaching the capillary zone, which translates to direct water-table movement.
This research proposes a concept of moisture condition above equilibrium, referred to as “wet equilibrium”, directly as a function of depth to the water table and moisture-retention characteristics, which must be exceeded to have appreciable recharge. “Wet Equilibrium” conditions are representative pressures above hydrostatic but insufficient to generate appreciable recharge over hydrologic timescales of weeks or months (seasonal). Generally, excess moisture in this condition would be acted on by root-zone uptake and thereby would not likely survive the slow percolation through the root zone to ultimately become groundwater recharge. This study defines the conditions and timescales of excess wetting fronts and bulk recharge once wet equilibrium has been exceeded. A calibrated Hydrus-1D model [
30] for West–Central Florida soils, Myakka-type fine sand type [
31,
32], was used to identify percolation and recharge characteristics, and the parameters controlling fluxes and timing for various DTWT were identified. HYDRUS-1D uses a numerical solution of Richard’s equation [
33] on small discretization and can be used for investigating unsaturated/saturated soil water movement [
30]. However, reliance on this type of solution for large-scale (i.e., regional) model applications is impractical and is computationally too demanding for long-term simulation.
Richards’ equation [
33] describes the water movement in the unsaturated zone in general [
34], which can be used to describe infiltration and percolation. [
35]. However, this equation faces criticism for its highly nonlinear nature and complexity, leading to complex and sensitive numerical solutions and significant computational demands [
36]. Soil moisture-retention behavior must be described, and the van Genuchten [
37] retention model is often used to define the relationship between the soil moisture content and pressure head.
There are numerous studies that have used van Genuchten soil moisture retention in HYDRUS-1D solutions in recent years. Neto et al. [
38] used Fourier analysis, cross-correlation, and R/S analysis to estimate water-table fluctuation to later compare with HYDRUS-1D soil column modeling. Their approach numerically estimated recharge rates and unsaturated soil hydraulic properties to assess the timescale of aquifer recharge. Their investigations revealed that aquifer recharge, with a 10-m vertical profile, required, on average, an 89-day timescale under specific conditions. The research, conducted through continuous simulation, compared the timing of water reaching the water table with overlapping and variable rainfall events. However, it did not address antecedent conditions or the DTWT sensitivity, which are critical factors for affecting water movement within the soil column.
De Silva [
39] used HYDRUS-1D to simulate potential groundwater recharge and compare the results to soil moisture balance and water-table fluctuations obtained in the Jaffna Peninsula of Sri Lanka. Batalha et al. [
40] use HYDRUS-1D to estimate groundwater recharge at three sites in Brazil. Those studies noted several uncertainties, such as root-zone thickness, root-uptake models, and parameters. However, these example studies failed to address soil moisture thresholds and conditions affecting recharge.
Yang et al. [
41] studied infiltration and water-table response at different rainfall volumes in sandy soil at shallow water-table settings in China by obtaining data from water-content sensors. Their observations compared rainfall events, noting that one rainfall event of 71.6 mm for 140 cm DTWT, for example, experienced 13 cm of water-table rise after 23 h, while other events resulted in a negligible water-table response in similar DTWT. Their study also used HYDRUS-1D to study the observed water-table fluctuation. Their analysis concluded that, in general, Hydrus over-predicted the observed water-table rise, but this was likely due to initial condition assumptions in their model tests.
In another example for a deeper water-table setting, Ibrahim et al. [
42] used numerical analysis to conclude that recharge in a 10 m DTWT semiarid aquifer in Niger could take 35–60 years. In another example, a model study by Mattern and Vanclooster [
43] suggested that groundwater recharge time for water-table depths of 15–50 m, could take in excess of 10 years, but no observations or further supporting analysis was offered.
The analysis presented herein is novel in the emphasis and parameterization of recharge timing. The objective of this research was to use HYDRUS-1D solutions to examine the timing aspects and to develop a more simplistic means to characterize the timing quantification and parameters affecting recharge in shallow-to-medium (1–10 m) water-table settings typical of sandy coastal plain environments. Rainfall characteristics, such as volume, duration, intensity, and soil characteristics, especially saturated hydraulic conductivity, have been investigated as to the effect on timing in this study. Normalized (non-dimensional) timing characteristics are identified for arrival and bulk recharge, which may prove useful for understanding the relationship between rainfall infiltration and saturated water-table recharge. The results and limitations are discussed.
2. Methodology
The numerical model HYDRUS-1D [
30] was used to simulate the water progression through the vadose zone. HYDRUS-1D is a one-dimensional numerical solution of the Richards equation [
33] and has been widely used as a tool to simulate water movement in the variably saturated soil column.
HYDRUS-1D allows the use of the van Genuchten [
37] soil moisture retention model to represent the water retention and conduction properties of the soil; the combination resolves the pressure, moisture, and hydraulic conductivity properties for water percolating through in the unsaturated zone [
30,
37].
Volumetric soil moisture content
θ(
h), a function of matrix head
θ(
h), can be defined based on
θr,
θS,
α,
h,
m, and
n as follows:
where the van Genuchten fitting parameters,
m and
n, are
and
Se is relative saturation, defined as
in which
θ is the volumetric water content (L
3 L
−3);
θS is the saturated water content (L
3 L
−3);
θr is the residual water content (L
3 L
−3); and
KS is the saturated hydraulic conductivity (L T
−1).
α and
n are constitutive relation constants that control the soil moisture retention curve. The pore-connectivity parameter
l in the
K(
h) function is commonly set to 0.5 [
30,
44].
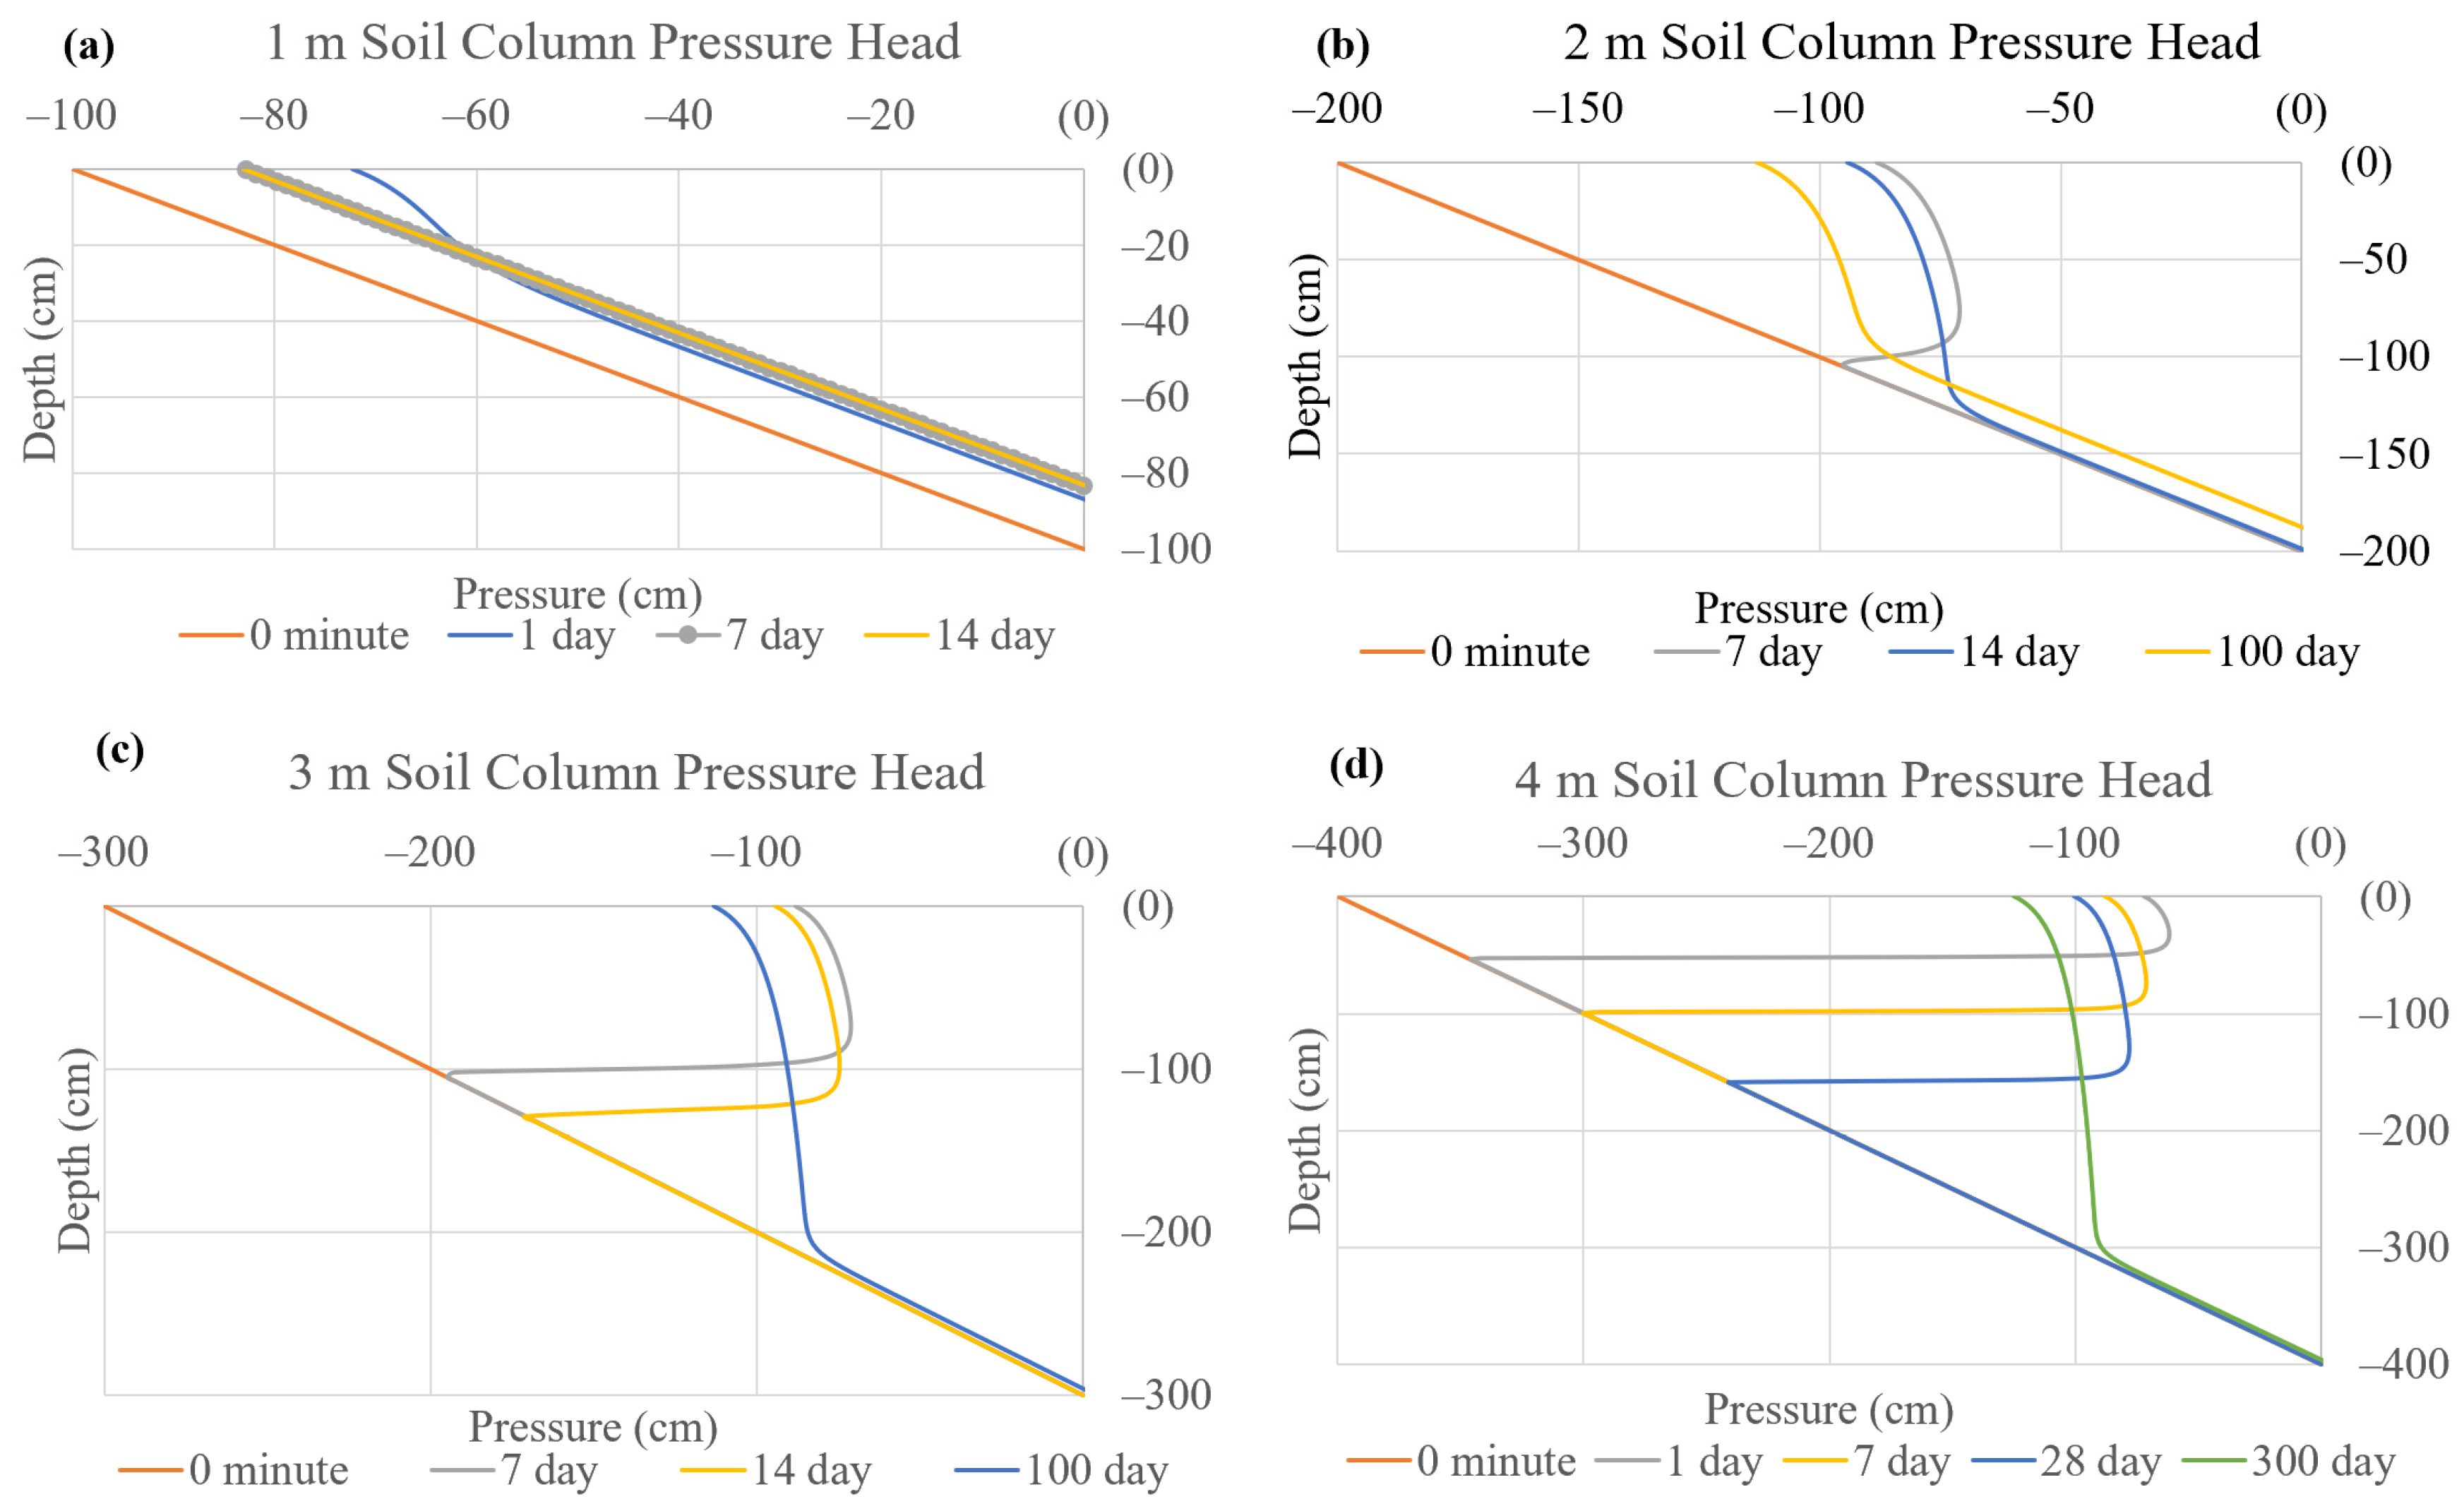
In order to help define the “wet equilibrium” moisture profile for various water-table depths and to determine a generalized time period for the recharge process above equilibrium, four preliminary model runs were made at initial DTWTs of 1, 2, 3, and 4 m. The soil columns were discretized into a 101-node finite element mesh for each DTWT. A rainfall intensity of 0.2 cm/min for 25 min was applied at the surface for a total of 5 cm of rainfall depth. The sensor spacing was adjusted for each DTWT: 1, 2, 3, and 4 m DTWT soil column with an equilibrium initial condition run and with results gathered to 14, 100, 100, and 300 days, respectively. Atmospheric surface boundary conditions without runoff and no flux bottom boundary conditions were assigned on the top and the bottom of the soil column without ET uptake. The wet equilibrium conditions were derived for all DTWT runs according to the preliminary model’s test results. The wet equilibrium conditions are defined further in
Section 3.1.
After the “wet equilibrium” initial conditions were established, additional 5 cm rainfall events were tested at various DTWT conditions, namely 1, 2, 3, 4, and 10 m DTWT. For the purpose of accuracy, the 10 m DTWT soil column is discretized into 1001 nodes. No ET uptake was selected on the lab-fitted soil parameters of Myakka soil [
28] commonly found in Florida. Calibrated van Genuchten soil-retention and conductivity parameters were used [
28]. The selected soil parameters are shown in
Table 1. For each of the rainfall events at different DTWTs, there was an ambient run made from wet equilibrium without additional rainfall to establish background flux conditions that could be subtracted from the additional prescribed rainfall-event evaluations. The purpose of setting up this initially wet but mostly stable “ambient run” for each scenario was to find the ultimate estimations of additional flux arrival time (1%), flux completion time (80%), and water-table changes over and above the slight changes of the initial wet conditions.
To study the arrival time and completion time at different elevations, observation points/sensors were set along the soil column in HYDRUS-1D. The location of the observation points varied in each DTWT setup; they were roughly distributed within the soil column and are listed in
Table 2.
For shallow water-table conditions, (1 m DTWT), observation points were fully within the capillary zone (for this type of soil approximately 1 m). For medium-to-deep water-table conditions, 2, 3, 4, and 10 m depths, the observation points were mainly set up in three zones, which are (1) above the capillary zone, (2) the top of the capillary zone, and (3) the middle of the capillary zone. The observation points located in the above capillary zone were P1 through P6, P1 through P8, P1 through P7, and P1 through P8 for 2, 3, 4, and 10 m depths, respectively. The observation points located on the top of the capillary zone were P7 through P9, P9, P8, and P9 for 2, 3, 4, and 10 m, respectively. The observation points located in the middle of the capillary zone are P10, P10, P9, and P10 for 2, 3, 4, and 10 m, respectively.
The equilibrium and multiple wetting front profiles of soil retention and the identified capillary zone for the Myakka soil used in this study are shown in
Figure 1 for 4 m DTWT as an example. The capillary zone is herein defined as a region above the water table exhibiting strongly hydrostatic pressure distribution that moves relatively unaltered up or down with water-table movement. It includes the near-saturation capillary fringe (approximately 20 cm) above the water table, defined by the atmospheric or zero pressure elevation. The capillary zone for this soil was approximately 1 m, extending up to the near-vertical retention upper gravity layer.
Figure 1 gives an example of the moisture profile of the Myakka soil column and the approximate dimension of the capillary zone. The thickness of the capillary zone is defined as
ZCZ (see
Figure 1) for the purpose of normalizing the depth in Equation (8).
Several analyses were made to evaluate which factors had more or less impact on the observed water-table recharge events. In this study, appropriate variable conditions for the coastal plain (common Florida soil conditions) were evaluated. This included different combinations of DTWT,
KS, rainfall intensity, and rainfall pulse volume from the initial artificially constituted wet conditions.
Table 3 summarizes the different combinations of simulations investigated.
3. Timing of Arrival (1%) and Bulk Recharge (80%) Flux
Two flux conditions were investigated to evaluate the time scale of groundwater recharge, the flux arrival time (
ta), and the flux completion time (
tp). When studying the model results, it is difficult and subjective to determine the exact moment of arrival of a wetting front and, given the exponential nature of bulk recharge, it is difficult to define the ultimate recharge state. Even after many years, the water table will still be changing a small amount for deeper water-table conditions, as it tends towards hydrostatic pressure distribution. Thus, this study defined two conditions for flux arrival time. Arrival was assumed when 1% of the additional rainfall (over the background ambient flux) passed by the observation point and 1% of the total rise of the water table for each of the various simulation periods. For the bulk recharge flux timing, an arbitrary 80% of the total amount of the flux passed by the observation point or 80% of the total rise of the water table was defined as the completion time. The elevations and observed fluxes (i.e.,
ta and
tp) for
KS = 0.0212 cm/min and rainfall intensity = 0.05 cm/min are provided in
Table 4 as an example. For 1, 2, 3, and 4 m DTWT, not all the flux from the 5 cm applied rainfall passes through all the stations due to the proximity of the capillary fringe (the station is or becomes within the capillary zone). For 10m DTWT, three different rainfall depths were tested (5, 10, and 20 cm) to evaluate the sensitivity of a deep water table’s recharge timing to rainfall depth, also provided in
Table 4.
For the purpose of developing a normalized and thus more widely applicable solution, non-dimensionalized variables were defined after an investigation of parameter sensitivity. Time scale and depth were expected and shown to be dependent on saturated hydraulic conductivity,
KS, and sensor depth,
d. A non-dimensional time,
τ, was defined from the ratio of saturated hydraulic conductivity,
KS, and sensor depth,
d. Saturated hydraulic conductivity,
KS, and
d were then used to normalize time,
t, and depth,
z, as defined below. Dimensionless depth,
z′, is depth,
z, normalized by capillary-zone thickness,
zCZ (shown in
Figure 1 and Equation (8)). Dimensionless time,
t′, and depth,
z′, are defined as follows.
3.1. Preliminary Model Test Results for Moisture Thresholds
From the preliminary model runs shown in
Figure 2a, the results indicate that, for a 1m DTWT, the total recharge process is less than 7 days from equilibrium initial conditions. In this time period, the soil column virtually becomes equilibrium (hydrostatic) again at the adjusted water-table depth. This rapid equilibration was expected for this depth due to the close proximity of the capillary zone to the land surface. DTWT was approximately equal to the thickness of the capillary zone. Both
ta and
tp flux rates were observed to be very rapid (less than 1 day) within the capillary zone for all runs, and this was consistent for the 1 m DTWT condition. Thus, one important observation noted for all DTWT conditions is that percolation reaching the capillary zone (as defined) results in a very quick water-table response (minutes to a few hours). Furthermore, for all the DTWT conditions evaluated, percolation flux reaching the middle of the capillary zone resulted in a near-instantaneous (seconds to minutes) water-table response.
After wetting the soil with the initial rainfall event, for 2 and 3 m DTWT, the average pressure head above the capillary zone was observed to settle at around −80 cm for the upper soil column (gravity zone) above the wetting front after 14 days of simulation.
Figure 2b,c depict wetting fronts reaching 120 cm and 110 cm, respectively.
Figure 2d shows an average −80 cm pressure head above the wetting front for the “wet equilibrium” −4 m DTWT condition that happened after 7 days of simulation. Thus, for all future runs, the initial wet equilibrium conditions were set as a constant initial pressure head from the top of the soil column to 80 cm above the water-table elevation of the soil column as −80 cm. From 0 to 80 cm above the water table, the pressure head was observed for all simulations to be constantly hydrostatic and, thus, was initially set to hydrostatic in all runs for this lowest layer of the soil.
Based on these observations, for the initial wet equilibrium conditions, the pressure head from the top of the soil column to 80 cm above the water table was selected as −80 cm uniformly as nearly “wet equilibrium conditions”. Then, from 0 to 80 cm to the water table, the pressure head was set to hydrostatic, and this was the initial condition selected for all soil tests.
From the preliminary results using equilibrium (complete hydrostatic conditions), a considerable volume above equilibrium was required and must be exceeded for additional flux to become recharged to the water table in a reasonable time (months). Pressure heads must exceed −80 cm (for this Myakka soil), thereby defining the “wet equilibrium” threshold. It should be noted that the timescale of recharge interest for this paper was days to months (defining seasonal variability) with the understanding that, in the field setting, this flux would be subjected to root-zone uptake, and longer durations would most likely never make it to the water table.
3.2. Ambient (“Wet Conditions”) Setup
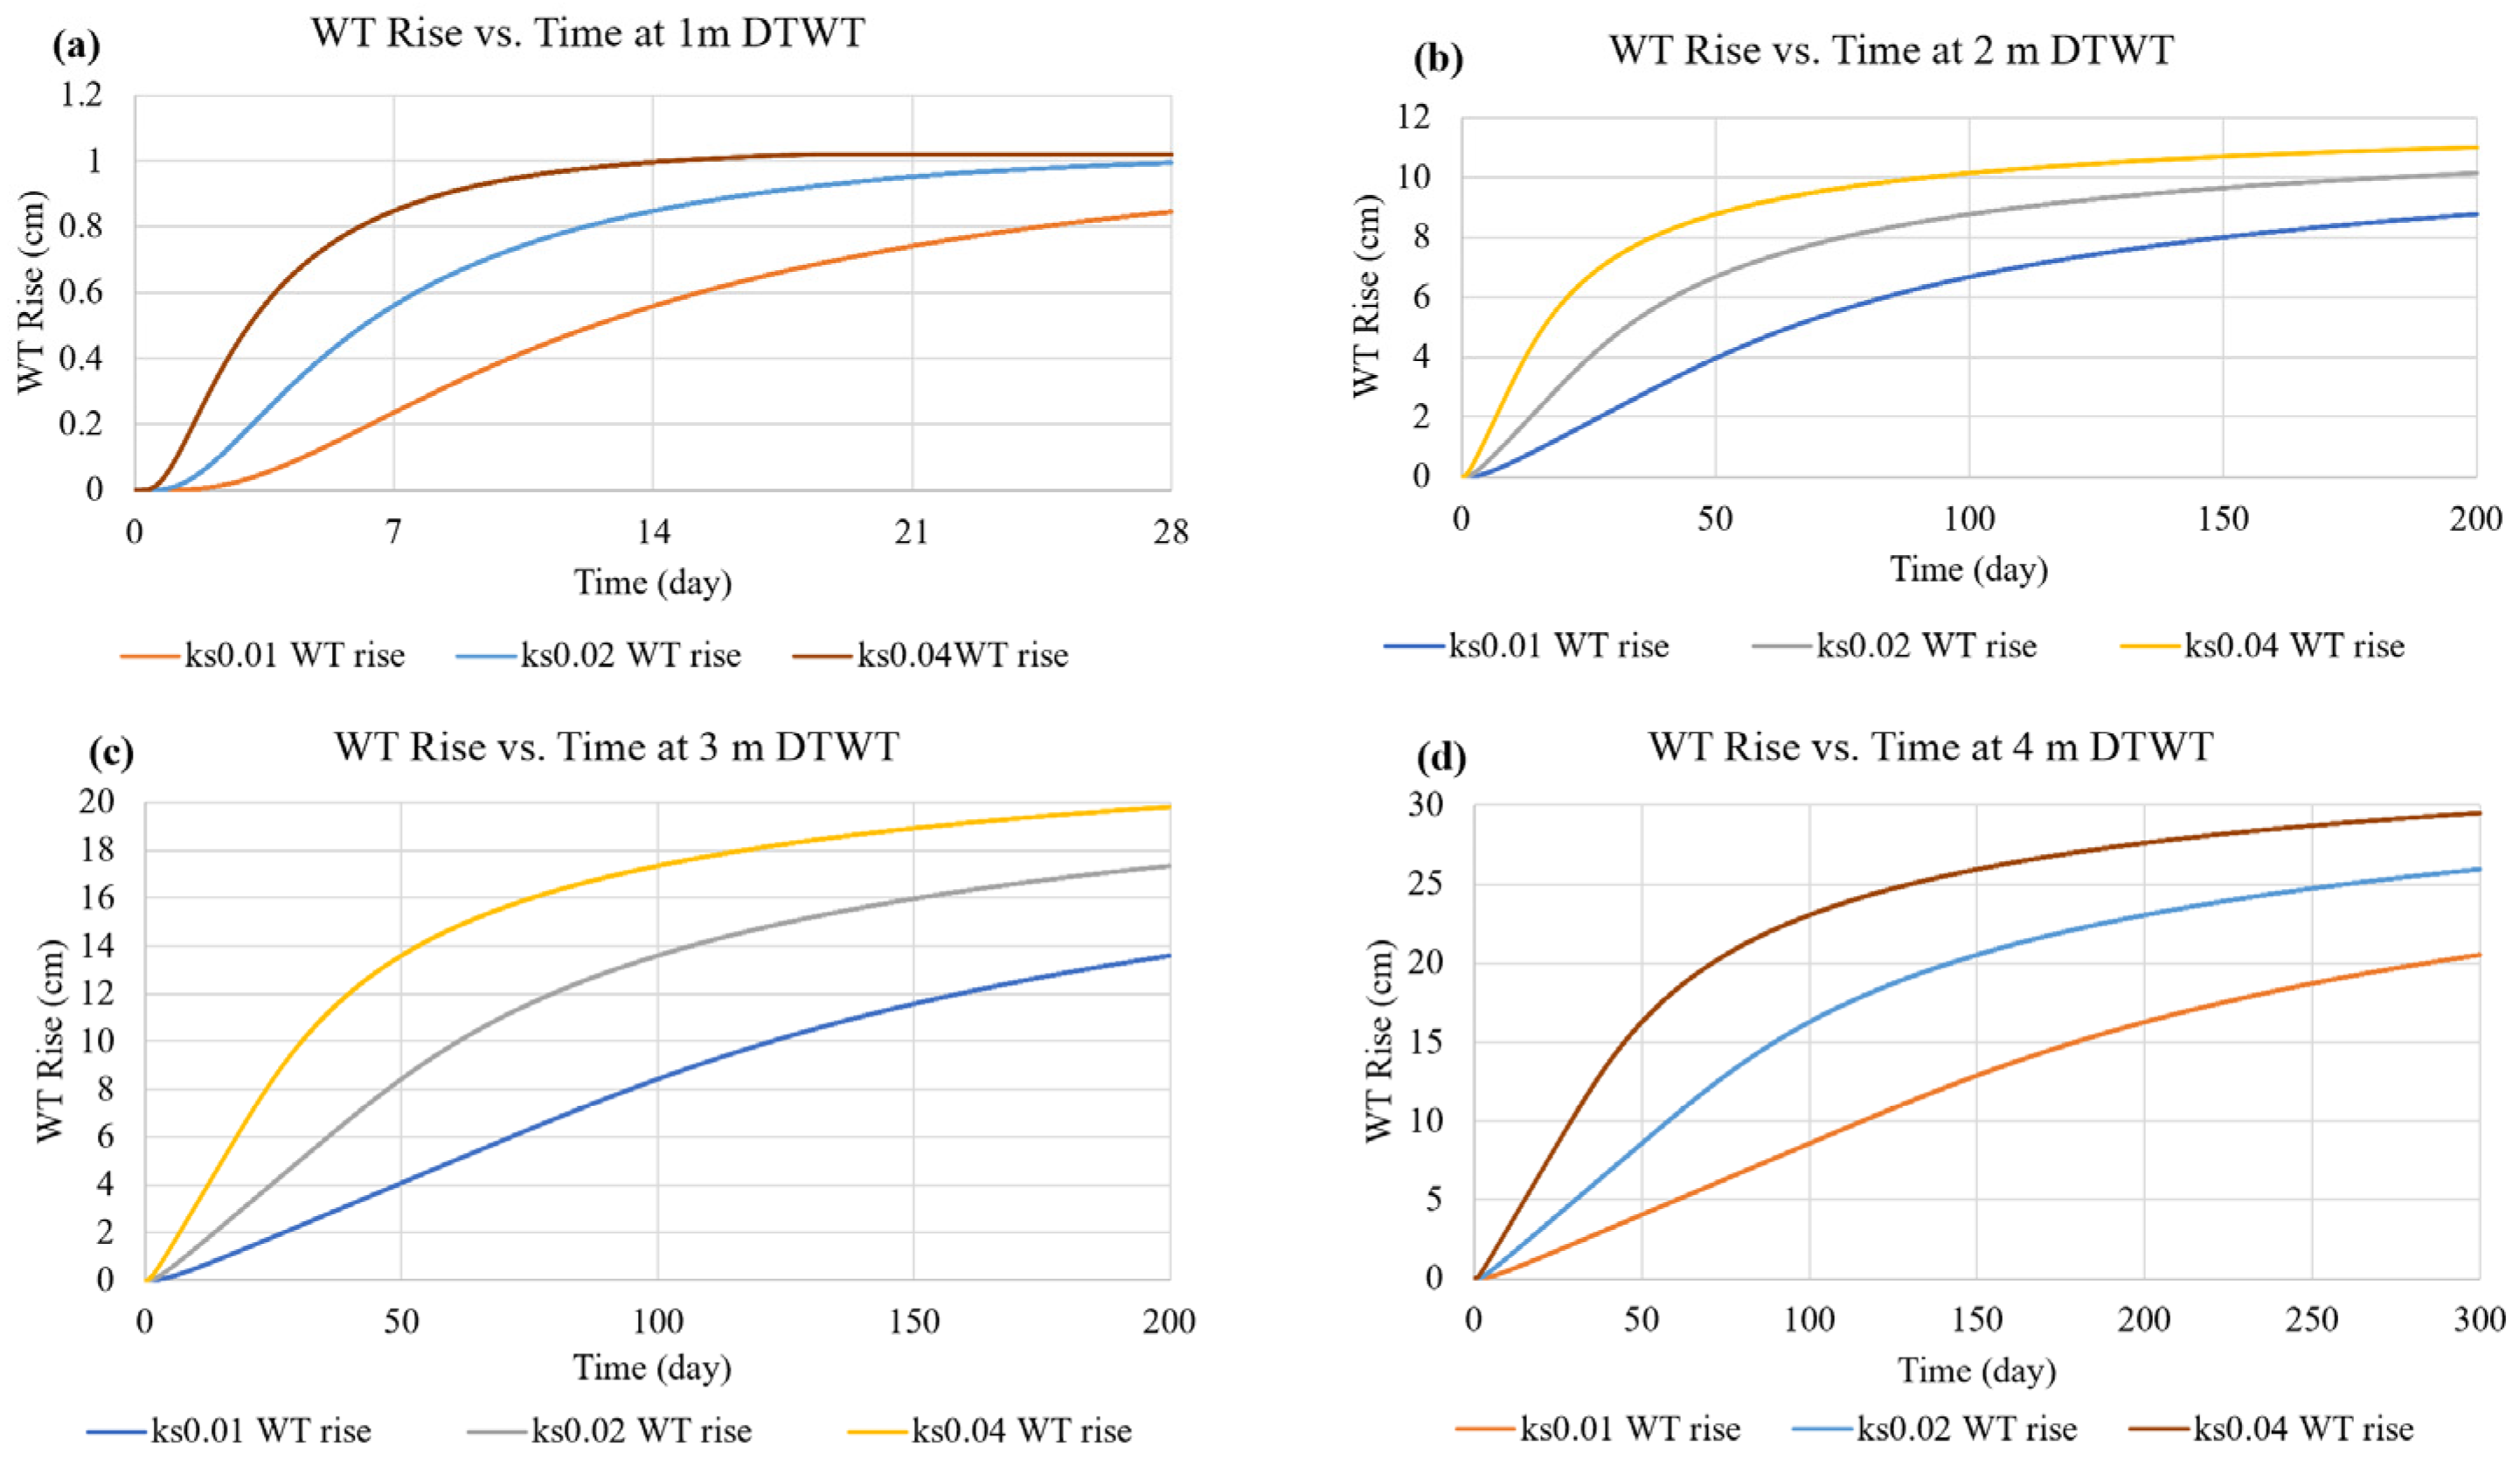
The ambient runs were established for the Myakka soil from the “wet equilibrium” defined previously with varying DTWTs and saturated hydraulic conductivity but with no rainfall addition. The simulation periods for the ambient runs for 1, 2, 3, 4, and 10 m initial DTWTs were 28, 200, 200, 300 days, and 5 years, respectively. These durations were required to capture the majority of the recharge response in each of these conditions. The purpose of running the ambient models was to develop a baseline flux response that could be subtracted from the applied rainfall events. Again, the purpose was to understand and quantify the timescale of recharge from the initially consistent “wet conditions” that were recognized as non-hydrostatic. “Wet conditions” water-table rise timings and quantifications are provided in
Table 5 and
Figure 3, respectively.
Due to the extreme timescales simulated, the computational time steps for 2, 3, 4, and 10 m DTWT runs were extended from the initial 1 min to 10 min. Observations of fluxes and water-table response were noted to be mathematically different but not considered substantially different. Thus, no significant timestep sensitivity was evaluated for these analyses. However, the resulting differences in water-table rise were less than 1 day for very long runs and, thus, considered negligible concerning the results interpretation but were beneficial for managing the data manipulation.
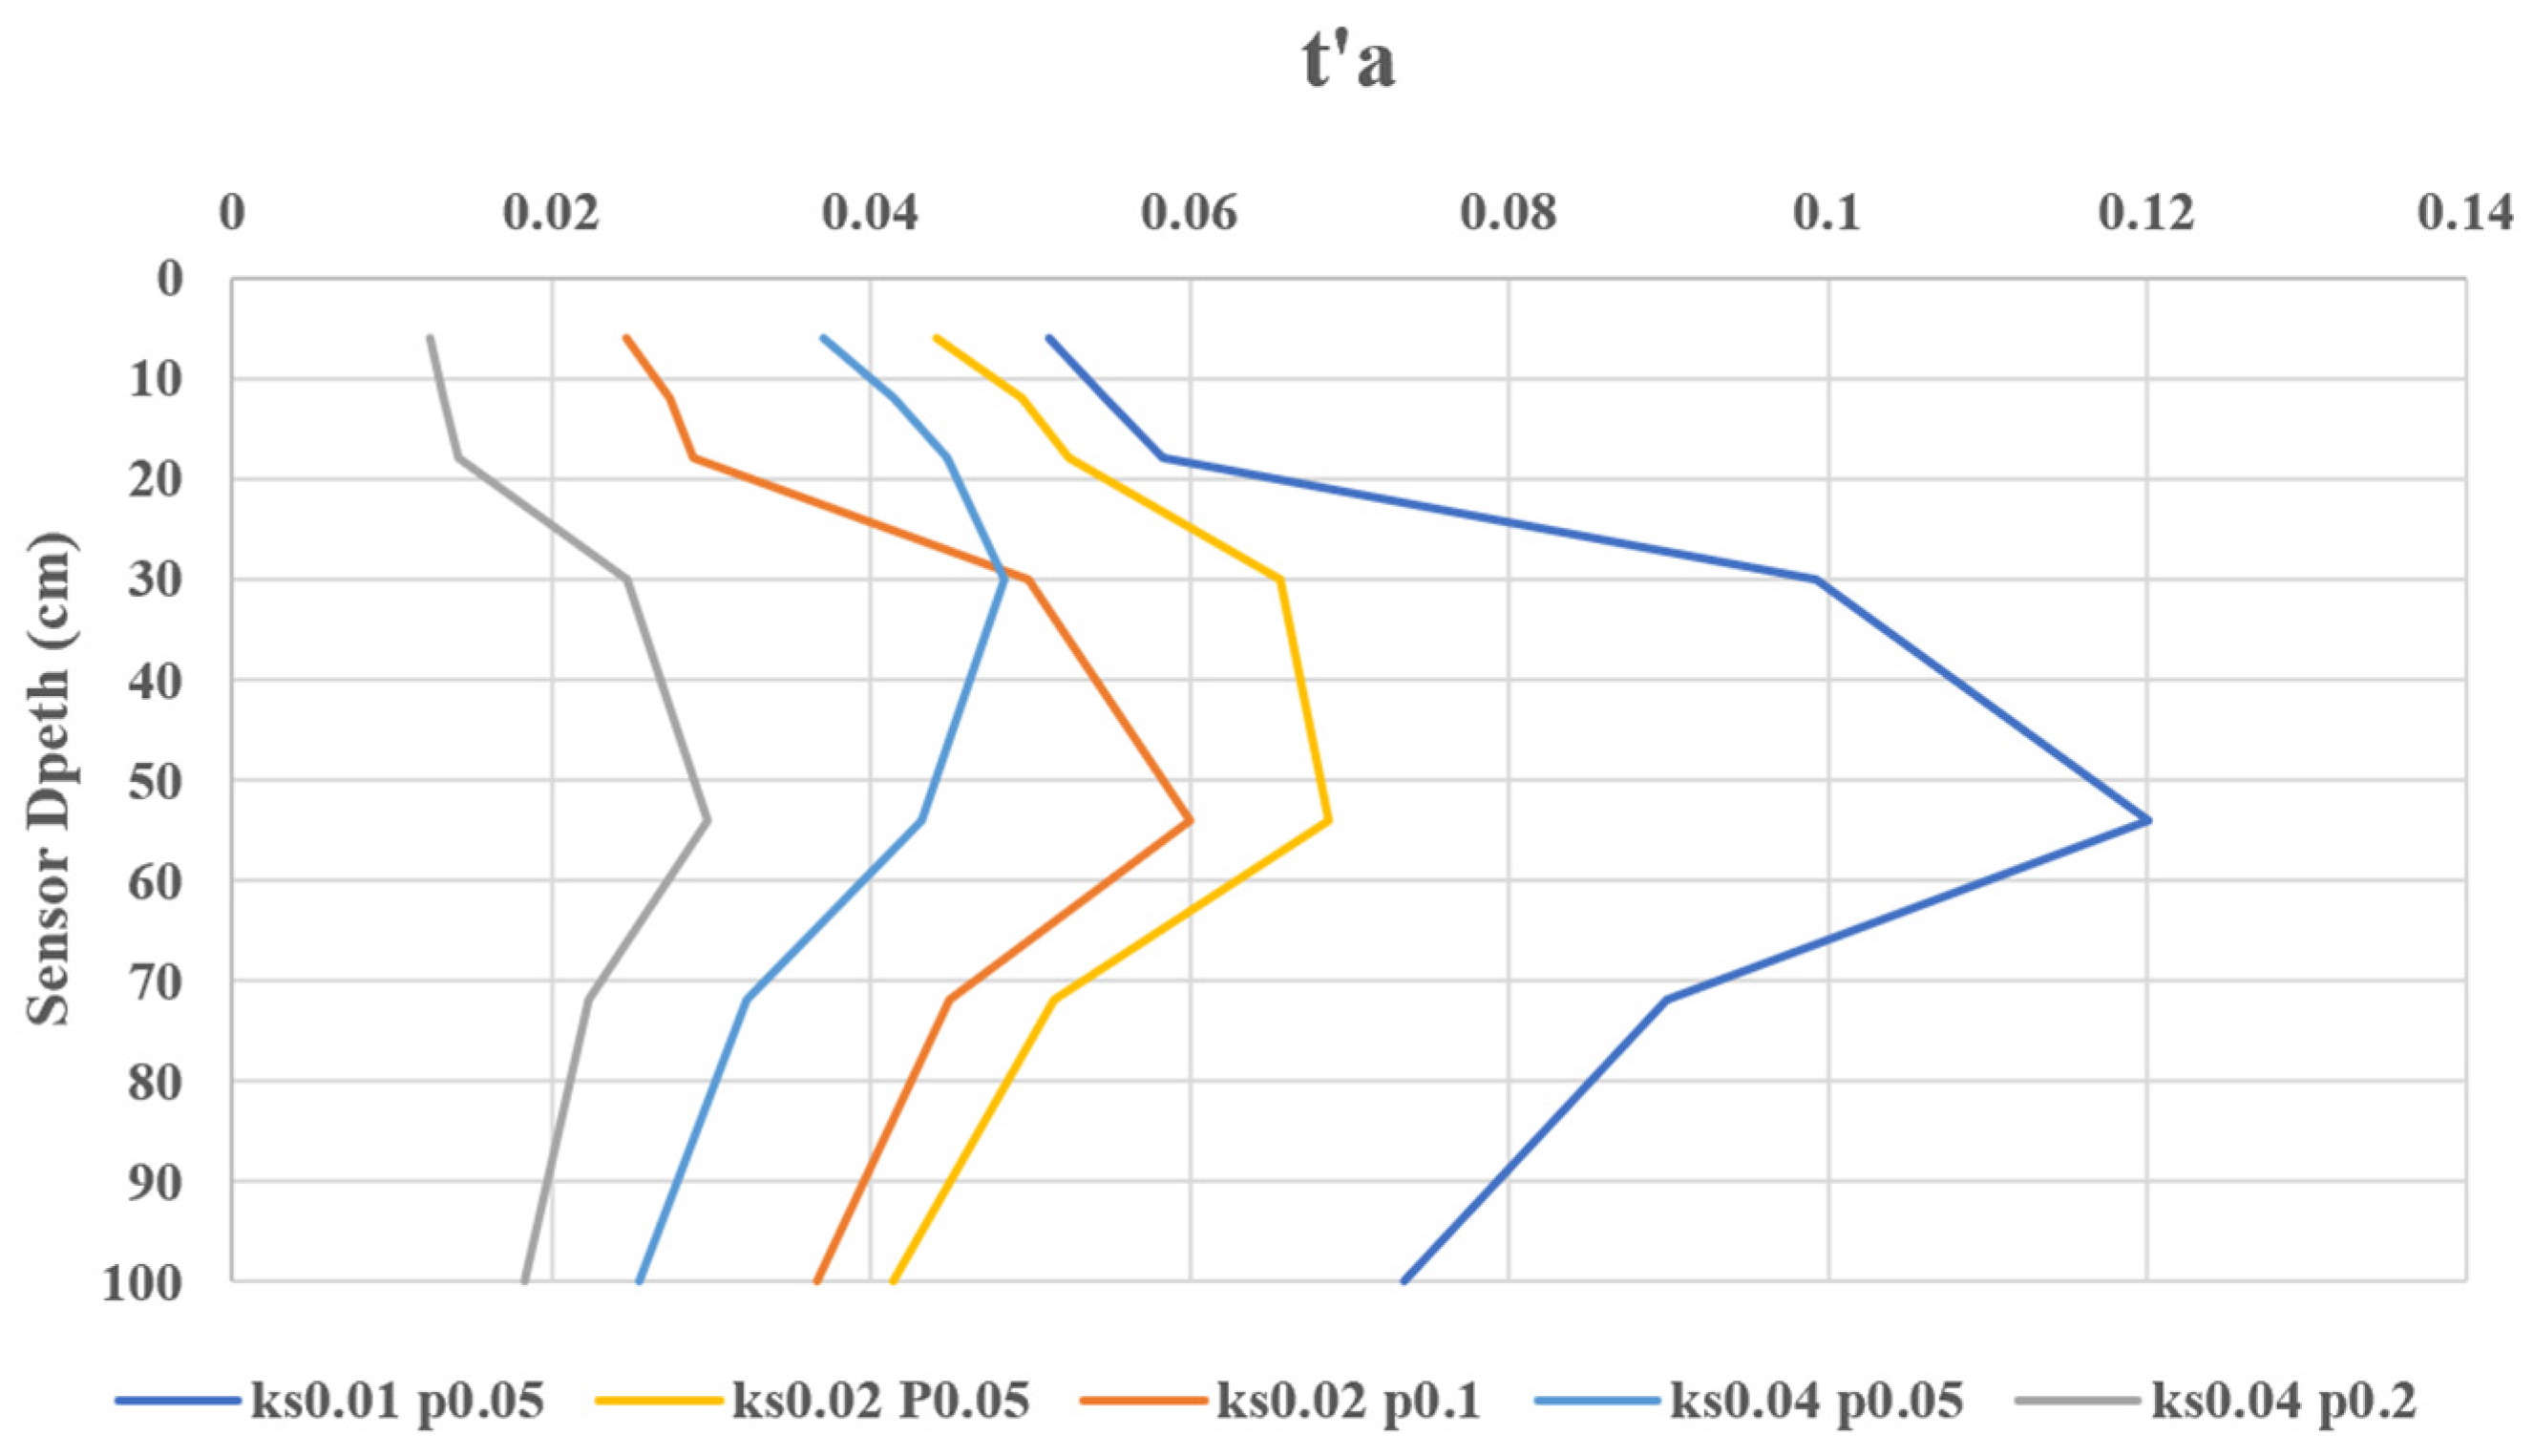
3.3. Arrival Time: t′a
First, all the runs and depths were evaluated for 1% wetting front arrival time,
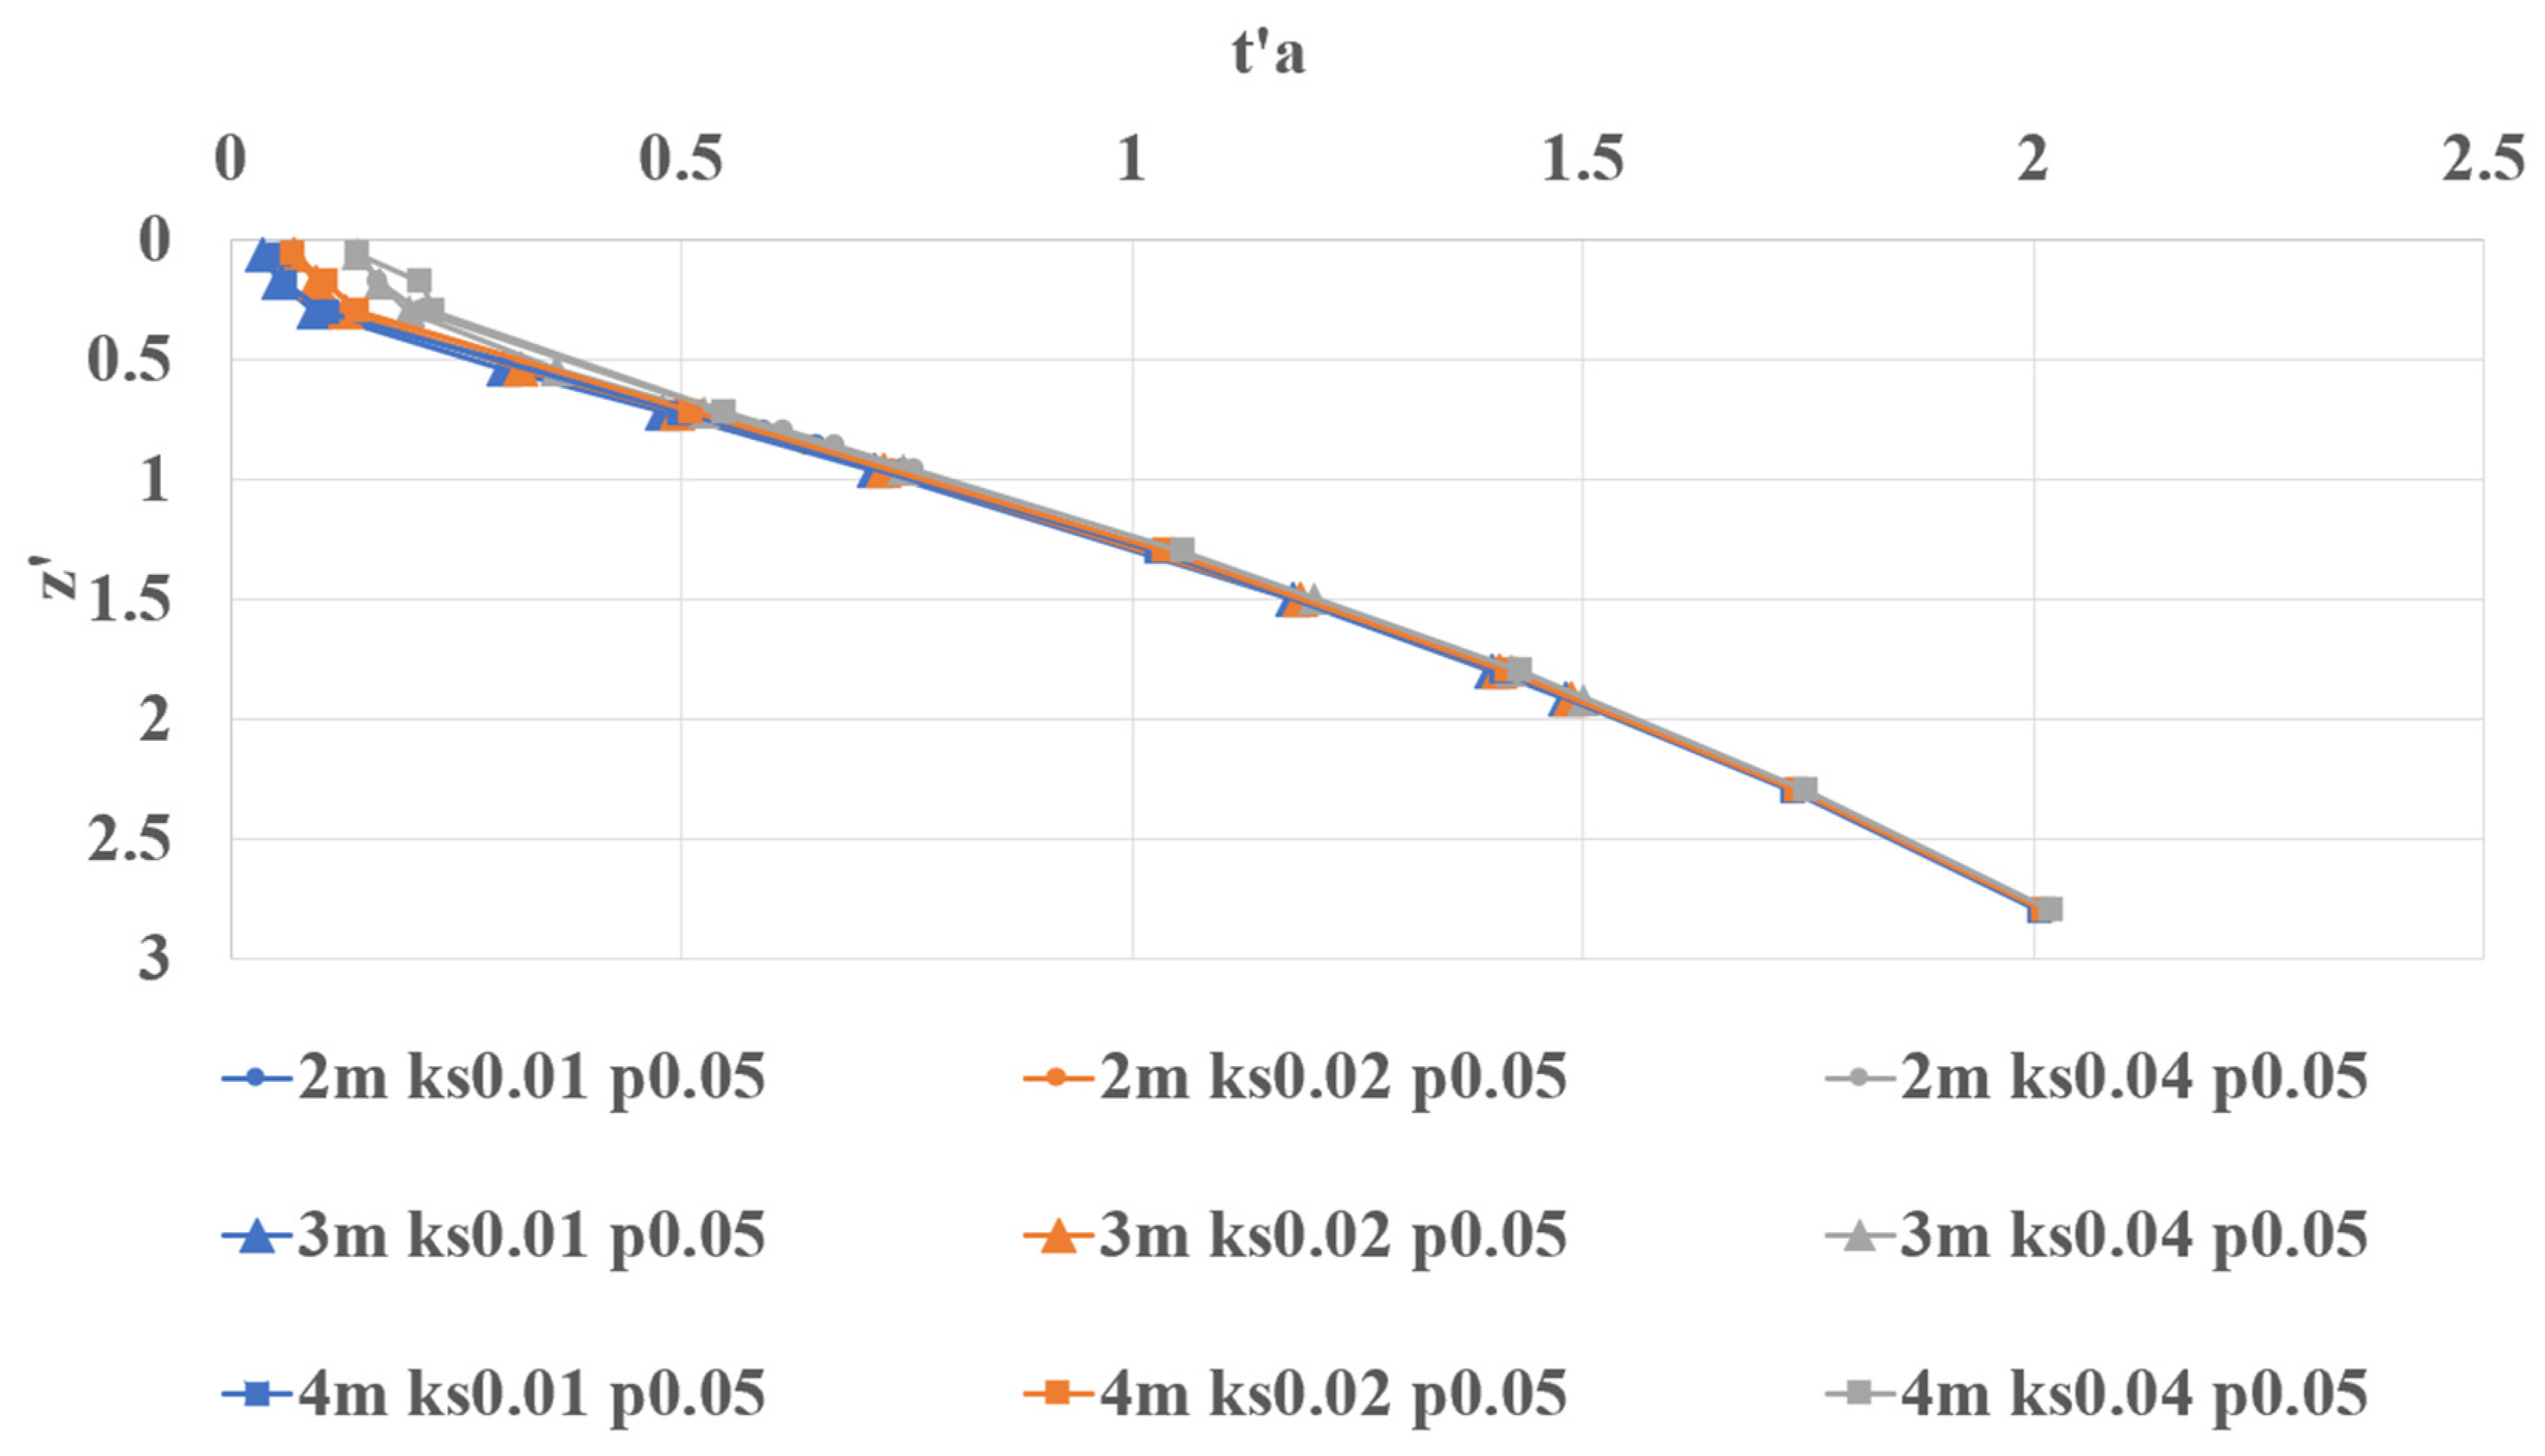
ta. A strong linear relationship between depth and the dimensionless arrival time for all normalized times was observed (
Figure 4). As was somewhat expected, the results suggest that the arrival time is mostly affected by the depth within the soil column and the saturated hydraulic conductivity,
KS. However, the results indicate some non-linear behavior may occur in deeper conditions (observed in the 10 m test). Overall, it is a useful result; the non-dimensionalization renders
t′
a independent of
KS and
d.
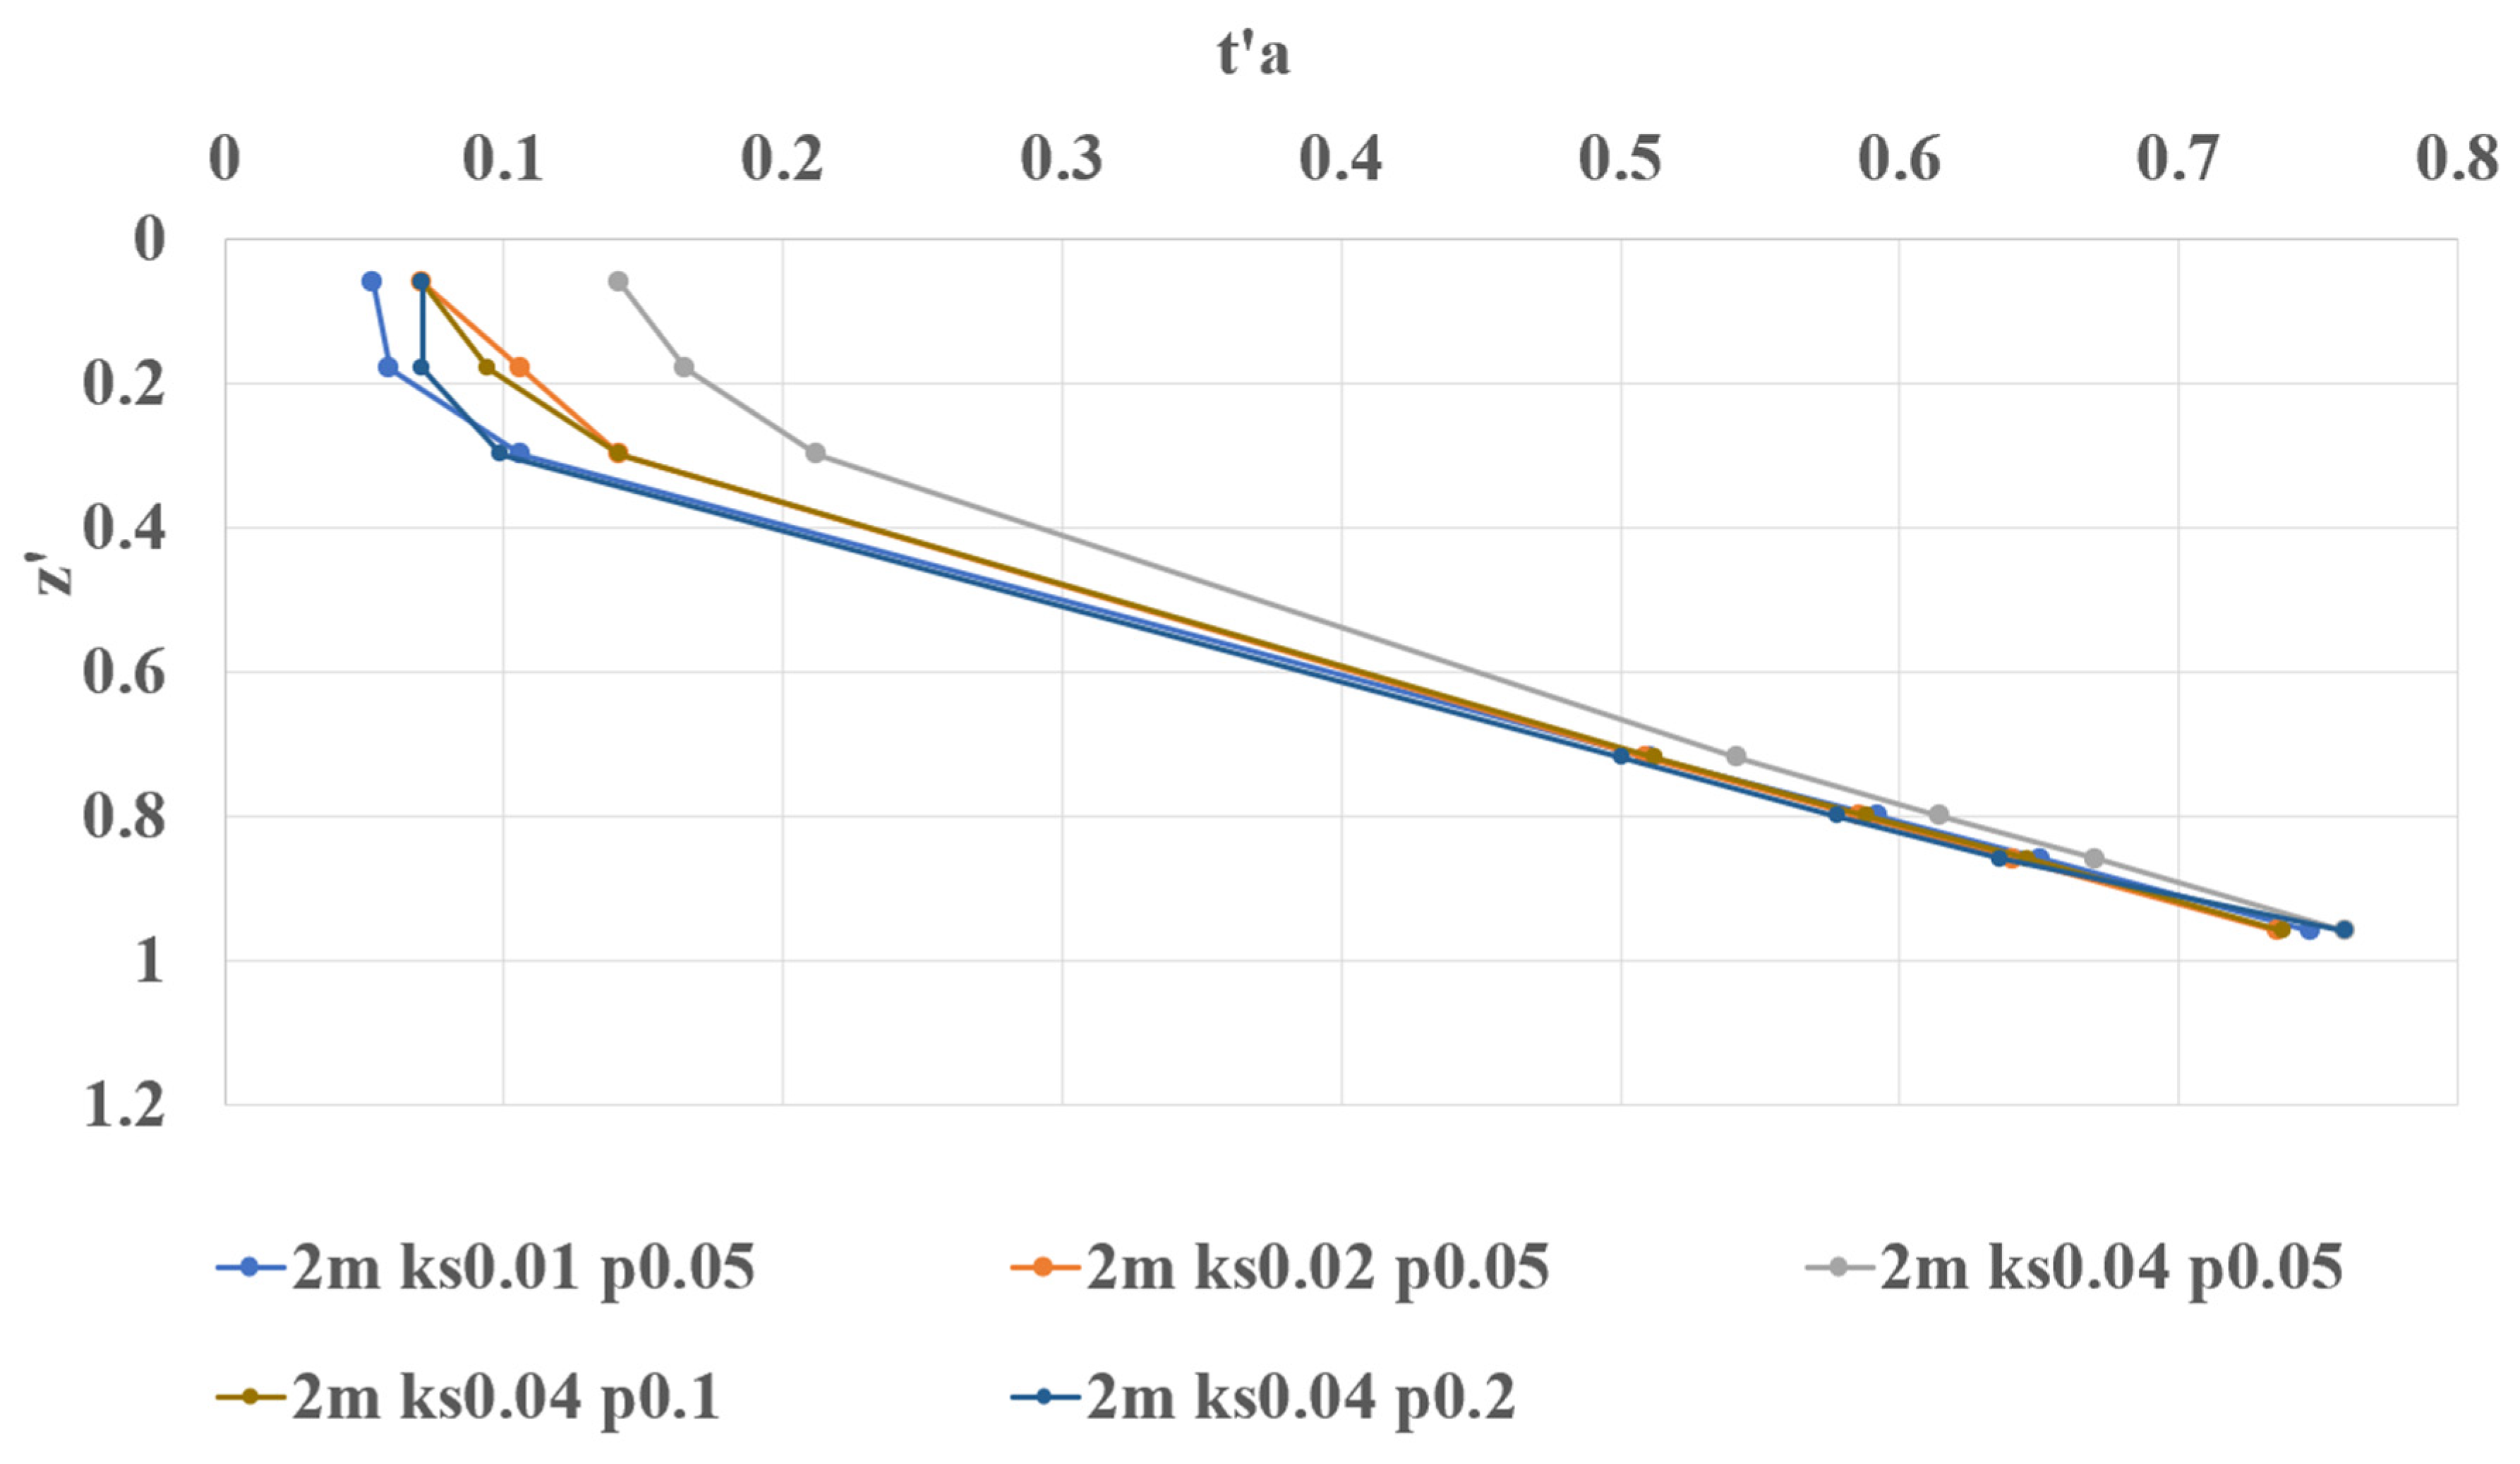
The results from testing various rainfall application periods (also shown in
Figure 5) suggest that the rainfall intensity does not have a strong impact on
t′
a; only small discrepancies were observed and only within the shallowest observation points.
The relationship between
t′
a and
z′ can, thus, be described as practically a linear relation (R² = 0.9954), as:
When extending the soil column to a deep-water condition shown including the 10 m results (
Figure 6a,b), the results indicate that the arrival time and depth are linear in shallow depths (1–4 m) and more non-linear in deeper depths. Thus, below 1–4 m, the relationship of
t′
a and z′ becomes more non-linear and was found to fit with a simple polynomial expression. For deeper water-table depths, the derived polynomial relationship (with R
2 = 0.9935) between
t′
a and
z′ can be represented as:
However, the equation above is only valid for 5 cm of applied rainfall volume. During the investigation for deep water-table conditions, two more rainfall volumes were tested: 10 cm, and 20 cm events. The results from these tests indicate that the timing is also strongly dependent on applied rainfall depth (
Figure 6a). The polynomial relationship (with R² = 0.9983) between
t′
a and
z′ for 10 cm rainfall volume is:
The relationship between
t′
a and
z′ for 10 cm rainfall can thus be described as a practical linear relation (R
2 = 0.9954), as:
The 20 cm polynomial relationship (with R² = 0.9941) can be summarized as:
By interpreting the behavior of the empirical coefficients and plotting against the applied rainfall depth, a strong linear behavior in the slope for the equations’ coefficients was observed. Further exploration was not made, but linear regression yields a simple relationship for the slope terms found above. Thus, a general prediction for different applied rainfall volumes can be made. The simplistic form for
t′
a within shallower (1–4 m) depths is offered as:
where
αa is a linear coefficient that varies by rainfall depth. The rainfall dependence,
αa, is calculated from the dimensionless pulse volume,
P′, (pulse volume divided by the capillary storage (
SCZ)). Because of the lack of the analytical solution of storage from the van Genuchten model, storage is calculated numerically based on the soil parameters of
Table 1 as 23 cm. For the other soil parameters, the capillary storage will likely vary.
For the shallowest DTWT (1 m),
Figure 7 indicates that there is no strong relationship between the
t′
a and depth. It is noted that the observation points are within the capillary zone, which is very reactive with the water table. Thus, equations are developed from the observation points primarily from deeper DTWT conditions (>1 m) and only from observation points above the capillary zone (within the upper vertical gravity region).
To help with the practical interpretation of the results, the following table is provided in dimensional form for the results based on using saturated hydraulic conductivity, with
KS as 0.0212 cm/min. The predictions are calculated from Equations (10), (11) and (13) for the 5, 10, and 20 cm rainfall pulses, respectively. Missing data in Hydrus-1D is indicated by ‘-’ in the table. Thus, there are no corresponding relative error results in the ‘Relative Error’ column.
Table 6 applies to DTWT conditions deeper than 1m. For a DTWT less than 1 m, the arrival time for fluxes would be within a day (due to the immediate proximity of the capillary zone). For example, the prediction of the arrival time for a 5 cm rainfall event at 130 cm below the land surface is 4 days following the rainfall event. Note: RE = absolute error/observed value, unitless.
3.4. Flux Arrival and Water-Table Change
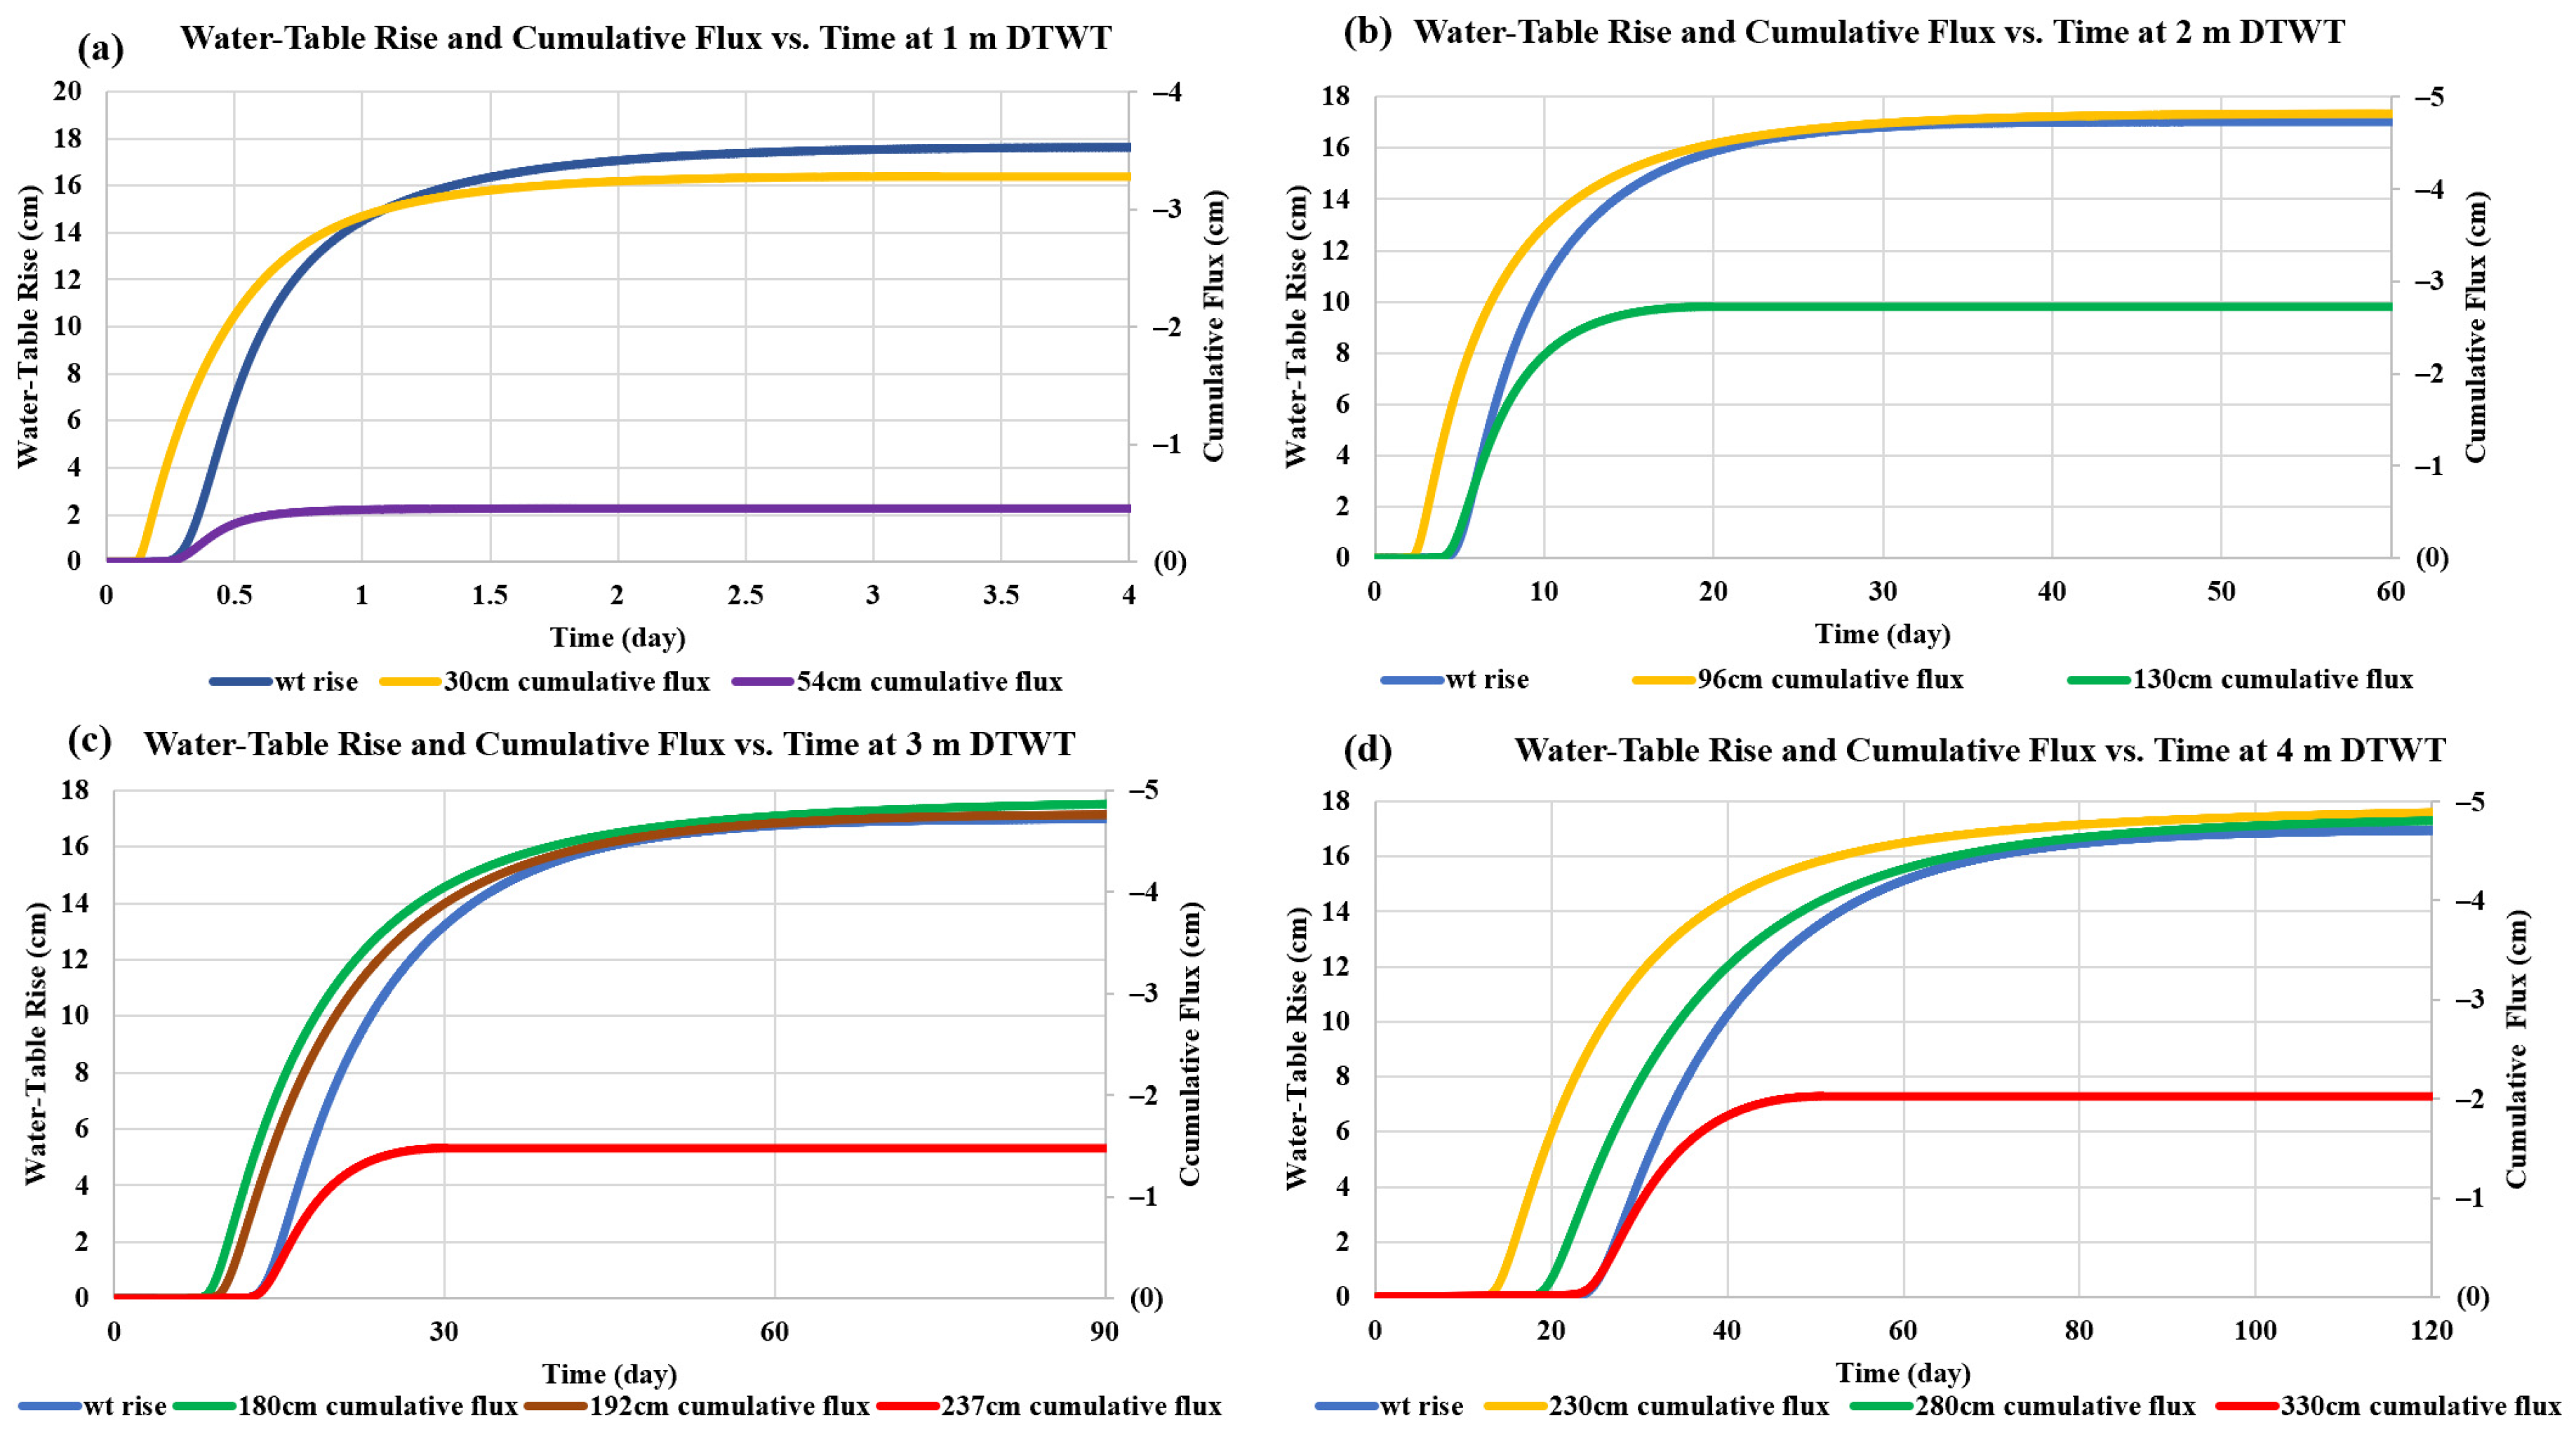
From all runs, an investigation of flux depths and consequential water-table movement was made. Flux observations at various depths indicate that the pulse must reach the approximate middle of the capillary zone to correspond to a direct water-table response. Thus, this is the level at which the pulse becomes water-table recharge. Observations of flux and water-table response, shown in
Figure 8 and
Figure 9, illustrate this behavior. The water table is noted to respond in direct consequence to the flux closest to the midpoint of the capillary zone. This observation would have a direct bearing on more coarsely discretized models of the capillary zone, perhaps proposed for regional models.
3.5. Completion Time t′p
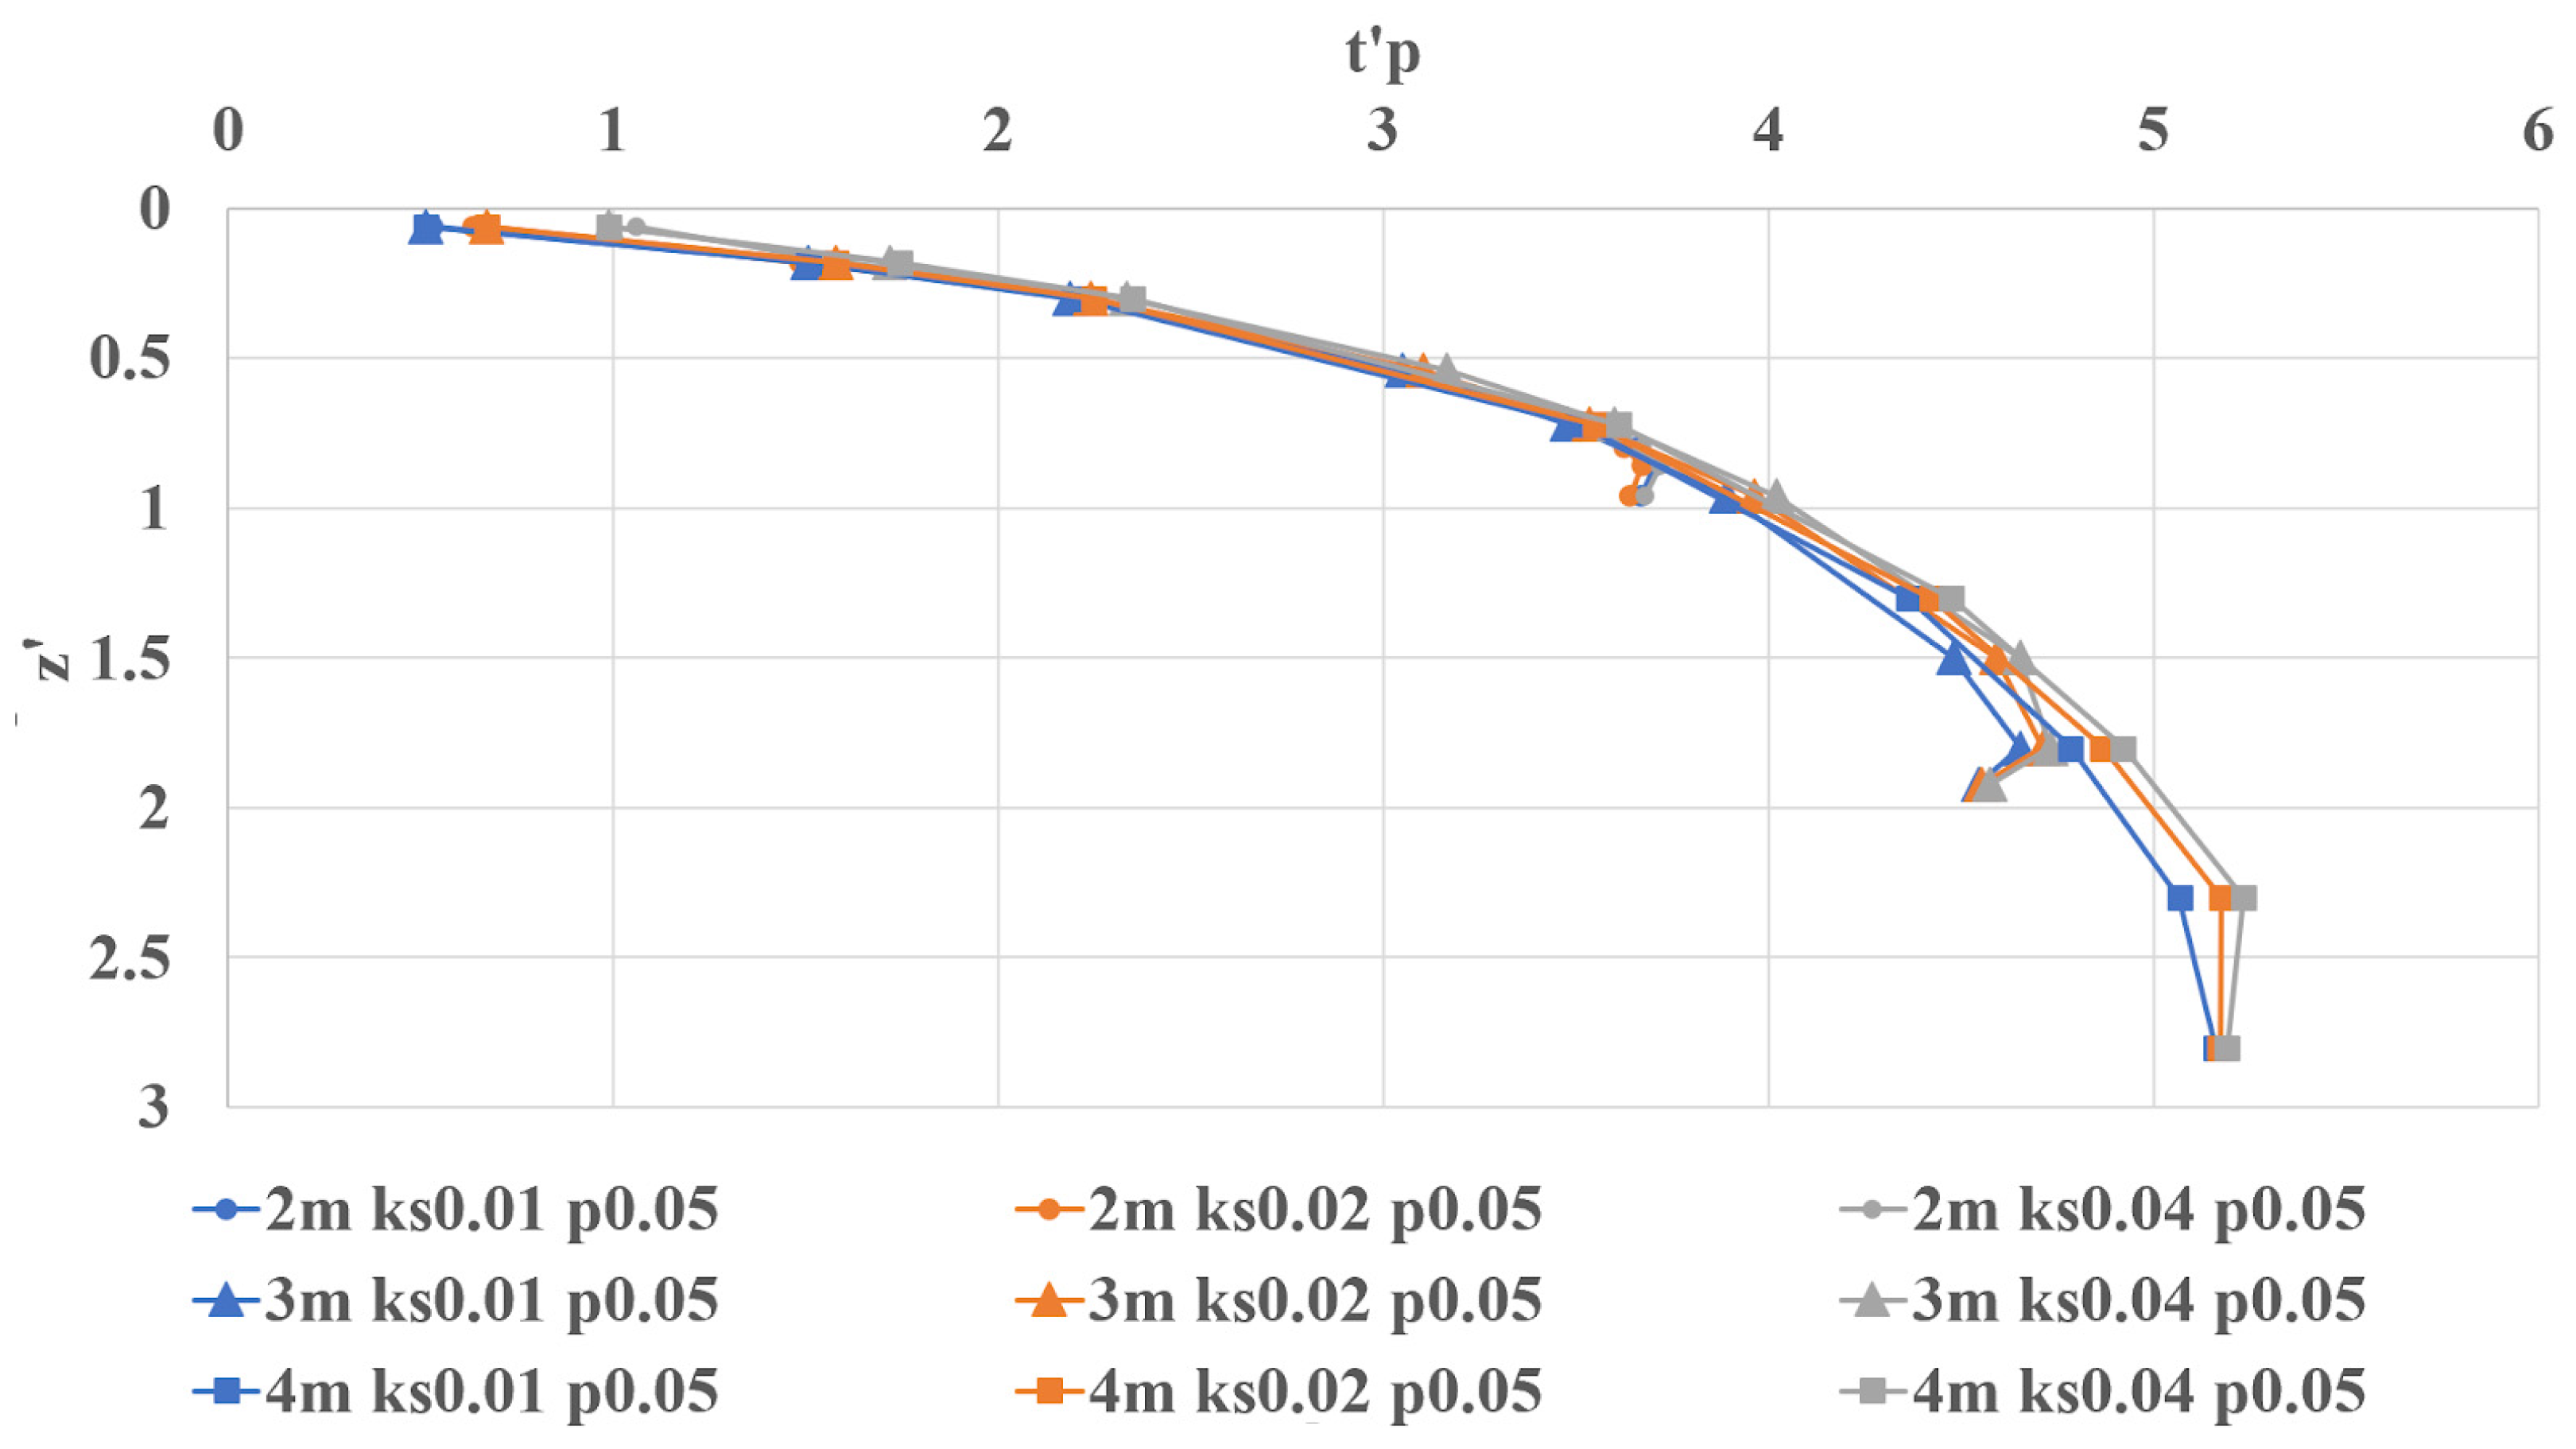
The completion time,
t′
p, is defined as the time for 80% of the flux from the added rainfall to pass a sensor location. Assessments of
t′
p at various sensor depths made for the 2, 3, and 4 m DTWTs are shown in
Figure 10. Observations of normalized time,
t′, and depth, d (cm), indicate a strong exponential relationship between depth and arrival time for all test scenarios. From the different tests at the same DTWT shown in
Figure 11, the completion time shows similar behavior to the
t′
a results; the rainfall intensity does not impact the
t′
p results. Notably, compared to
t′
a, the
t′
p results are closer at the same depth. The resultant fitted
t′
p and
z′ relationship was found to be logarithmic (R² = 0.9727), summarized as:
Observations from
Figure 11 show that, for shallow water-table conditions, the rainfall intensity does not affect the arrival time,
t′
p, significantly and, thus, would be expected to have less effect for deeper water-table conditions. The sharp departure at the deepest sensor is because it has become immersed in a rising 1 m capillary zone for the initial 2 m DTWT. This data point is, therefore, not indicative of the upper vertical zone relationship observed.
Figure 12 again shows the unpredictable timing in the capillary zone.
While rainfall intensity was shown to have a negligible impact on recharge time at deeper DTWT conditions, a strong dependence on rainfall volume was observed to be consistent with the initial arrival results (
Figure 13). Sensitivity to applied volume was observed for all runs but was pronounced for the much deeper water-table condition and is illustrated in the fitted relationships that follow.
The exponential relationship (with R
2 = 0.9818) between
t′
p and z′ for 5 cm rainfall volume can be summarized as:
For 10 cm applied rainfall, the results (R
2 = 0.9914) are:
And, if the rainfall depth is doubled to 20 cm, with R
2 = 0.9836, the relationship between
t′
p and z′ increases proportionately, as
An investigation of the relationships between the coefficients
αa,
αp1, and
αp2 with applied rainfall depth is shown in
Figure 14. The relationship for
αa for predicting arrival time,
ta, with applied rainfall appears to be linear and predictable. The other coefficients,
αp1 and
αp2, shown in Equation (21) and used to predict the bulk recharge time,
tp, were not as well behaved. The scaling coefficient
αp1 does not show any sensitivity to the applied rainfall depth and is perhaps best held constant;
αp2 might show a better relationship with different applied rainfall volumes. However, this result cannot be concluded with only three test results.
Figure 12 indicates that there is no strong relationship between the
t′
p and d for 1 m DTWT, similar to the results for
t′
p. This is because the observation points are within the capillary zone, which is very reactive with the water table.
To help interpret the results, the following table is provided in dimensional form for the results based on using the mid-
KS of 0.0212 cm/min. Predictions are derived from Equations (18)–(20) for 5, 10, and 20 cm rainfall volumes, respectively. Again, values of ‘-’ in the column ‘HYDRUS-1D (day)’ represent no data from the existing model testing, and thus, there are no relative error results correspondingly in the ‘Relative Error’ column. Note that relative error, RE, is defined as the absolute error/HYDRUS value and is unitless.
Table 7 applies to DTWTs deeper than 1 m; for DTWTs less than 1 m, the bulk recharge timing for fluxes would be within 2 days. For example, the prediction of the bulk recharge time for a 5 cm rainfall event at 330 cm below the land surface is 59 days after the rainfall event. This prediction applies only to capillary zones deeper than this depth (>430 cm DTWT).
4. Discussion
With current groundwater and integrated surface/groundwater models (e.g., [
21]), modeling recharge is often oversimplified with single (or minimally) layered soil conceptualization, simplistic algorithms for flux timing (single-layered Green-Ampt infiltration or constant conductivity percolation) models, or even simpler conceptualization by multiplying a fractional multiplier to the precipitation or infiltration volume [
19,
20]. This research illustrates the considerable timescale for wetting fronts and bulk recharge arrival in the highly conductive sandy coastal plain soil prevalent in Florida. With this insight, emphasis is placed on the proper modeling of the timing of soil moisture percolation through the root zone with plant-root ET uptake in order to quantify the net availability (and ultimate magnitude) of the water-table recharge response. Furthermore, for deeper water-table settings, the recharge is a function of combined and overlapping events with considerable time lag that needs to be understood and properly modeled in predictive groundwater models such as MODFLOW [
19]. Fundamental to quantifying groundwater recharge in terms of soil properties and behavior is first understanding and quantifying the “wet equilibrium” conditions of the soil. While there is, as of yet, no clearly defined manner or characteristics to derive pressure conditions for “wet equilibrium” from typical soil-retention properties, this paper does shine a light on its importance and how it behaves for this common soil. And, this threshold is of obvious importance for better modeling the ET root-zone uptake. The simplest conclusion from this finding is that the water table is ultimately recharged from precipitation only if soil moisture reaches above the wet equilibrium moisture profile for the DTWT and only after it reaches into the capillary zone.
The timing and magnitude of groundwater recharge for a given soil type is fundamentally a function of water-table depth, rainfall depth, and hydraulic conductivity, and this is well known. This research identifies a normalized relationship for predicting the arrival and bulk flux times for a variety of rainfall pulse events. A relationship has been identified, presenting a normalized time scale of groundwater recharge in coastal plain soils considering the DTWT (deeper than the capillary zone, 1 m DTWT in Myakka type of soil), rainfall intensity, and saturated hydraulic conductivity. For a DTWT less than 1 m (or capillary zone), the timing mainly depends on the rainfall duration but is very responsive thereafter (minutes to hours and certainly less than 1 day). The timing of arrival flux (1%) has been shown to have a linear relationship for the shallow depths typical of the root zone in coastal plain settings (1–4 m) but transitions to a non-linear (polynomial) relationship for deeper depths. The bulk recharge (80%) was observed to have an exponential but predictable relationship with depth. Both arrival and bulk timings are strongly dependent on the pulse magnitude (but not the timing or duration of the pulse), but predictable and strongly linear correlated to the pulse magnitude. From the results, it was clear that doubling the pulse (above wet equilibrium) halves the time of arrival and bulk recharge. This was a simple and interesting relationship that was not further investigated in this analysis.
The “wet equilibrium” pressure condition above the hydrostatic layer near the water table (−80 cm for this soil) is likely unique for the common coastal plain fine sandy soils investigated, e.g., the Myakka soil tested. However, a preliminary investigation by the authors indicates that all soils investigated showed a similar (but different magnitude) “wet equilibrium”, near constant pressure profiles, that needs to be exceeded before significant timing and magnitude of water-table recharge can occur. Also, the linear near-constant pressure profile assignment to approximate “wet equilibrium” is a simple assumption that certainly begs further investigation. Observations of the apparent similar but non-linear (curved) resultant stable wet pressure profiles are somewhat dependent on DTWT, indicating that more in-depth research on wet equilibrium and a simplistic means to define this stability condition based on soil-retention properties is strongly warranted.
This study also clearly shows that the flux that arrives in the middle of the capillary zone is associated with near-instantaneous water-table response, reflecting the strong hydrostatic pressure in this region. This has implications for more coarsely discretized modeling of percolation to groundwater recharge. For example, this may be useful for regional surface-groundwater integrated models that are too vast to allow HYDRUS-1D-type finely discretized modeling (Richards’ equation solutions) on thousands of hydrologic response units. Interestingly, this relationship is unique and independent from the constitutive HYDRUS-1 parameters and begs for a more formal means of identifying the capillary zone dimension.
The authors acknowledge the results of this paper are somewhat specific to the calibrated Myakka soil studied, but we believe that they are representative of other soils in this environment. Myakka soils are similar in characteristics to many soils found throughout Florida and other coastal plain settings and have been widely studied [
13,
28,
32]. Future work is forthcoming, including testing other coastal plain soils, and the initial results indicate the behavior is very similar. Non-dimensional arrival time, ta, is linear, and bulk recharge time,
tp, follows similar logarithmic behavior but shifted and had slower times, despite having higher Ks values. Clearly, more tests need to be done for these and other soils to help better understand and to more precisely characterize this behavior. There is a particular interest in normalizing the results for the van Genutchen retention variables or other soil parameters, especially for predicting the capillary zone and the hydrostatic layer and/or finding a more explicit way to define the capillary zone characteristics from soil characterization data directly. The work by Pozdniakov et al. [
27] and others may shed some light on this.

