Article

The Spatiotemporal Variation Characteristics and Impacts of Summer Heatwaves, Droughts, and Compound Drought and Heatwave Events in Jiangsu Province, China

1
College of Hydraulic Science and Engineering, Yangzhou University, Yangzhou 225009, China
2
College of Hydrology and Water Resources, Hohai University, Nanjing 210098, China
*
Author to whom correspondence should be addressed.
Water 2024, 16(1), 89; https://doi.org/10.3390/w16010089
Submission received: 20 November 2023 / Revised: 11 December 2023 / Accepted: 22 December 2023 / Published: 26 December 2023

Abstract

:
This study used the “Daily meteorological dataset of basic meteorological elements of China National Surface Weather Station (V3.0)” and applied the absolute threshold method and standardized precipitation evapotranspiration index to identify heatwave events and drought events. This study analyzed the spatiotemporal evolution patterns of three types of summer disaster events, namely, heatwave events, drought events, and compound drought and heatwave events, in Jiangsu Province from 1960 to 2018. Additionally, it investigated and verified the concurrent historical data of the identified years with the most severe occurrence of compound drought and heatwave events and calculated the monthly drought centers and summer accumulations of the standardized precipitation evapotranspiration index (SPEI-3). The results indicate that over the 59 years analyzed, the number of days with a threshold of 35 °C, which were considered hot days, was 503.2, accounting for 9.27% of the total summer days in Jiangsu Province. Both the number of hot days and the frequency of heatwave events showed a clear increasing trend from the northeastern coastal areas to the southwestern regions of Jiangsu Province. The total frequency of drought events at different stations in Jiangsu Province from 1960 to 2018 fell within the range of 50–64. The fitted slope of the frequency of compound drought and heatwave events in Jiangsu Province was −0.021 for the period 1960 to 1989, and 0.079 for the period 1990 to 2018, indicating a higher frequency compared with the preceding 30 years. This trend aligned with the rise in heatwave events experienced in Jiangsu Province in recent years. The frequency and duration of compound drought and heatwave events in Jiangsu Province exhibited an increasing spatial pattern from the southwestern parts to the northeastern parts. This study’s verification established that the identification of compound drought and heatwave events was relatively accurate.

1. Introduction

As global climate warming intensifies, the frequency and intensity of extreme events, such as heatwaves, floods, and droughts, are undergoing important changes [1]. The Intergovernmental Panel on Climate Change (IPCC) Sixth Assessment Report indicates that the intensity and frequency of global heatwaves have increased and their duration has strengthened, and droughts have different trends in different regions. Since the 1950s, there has been an increasing trend of compound events globally [2]. The simultaneous occurrence of multiple extreme events is not a simple iterative relationship but may form a mutually reinforcing positive feedback effect, such as heatwaves and droughts occurring at the same time (i.e., compound drought and heatwave events), where the intensity tends to exceed that of the two separate extreme climate events or the sum of the two separate extreme events [3]. Compound extreme events have severe impacts on food security, ecosystems, water security, and human health [4].
A heatwave is usually defined as the case when the daily maximum temperature is higher than a specific threshold for several consecutive days [5]. There is no unified standard for the selection of thresholds, and the absolute threshold method is generally used [6]. An absolute threshold, which generally takes into account local perennial temperatures and the impact of high temperatures on morbidity rate, is defined in the form of a fixed temperature [7]. The frequency of heatwave events in China has increased dramatically in the 21st century, which has caused serious consequences on the economy, society, agriculture, and health [8]. When a drought event occurs, the onset of a heatwave event can lead to accelerated evapotranspiration, causing soil moisture deficits that further exacerbate the drought. The most commonly used indicator for drought events is the standardized precipitation evapotranspiration index (SPEI). The SPEI is based on the principle of water balance and measures meteorological drought conditions by evaluating the difference between precipitation and potential evapotranspiration. Research showed that the SPEI is applicable to most regions in China, especially in humid areas during the summer season [9]. The research on separate heatwave and drought events has become more mature, based on which a variety of identification methods and rating metrics have been applied to compound drought and heatwave events. Li et al. [10] used a daily scale standardized temperature index (STI), a daily scale drought index, the standardized antecedent precipitation evapotranspiration index (SAPEI), and a joint probability distribution method to clearly identify compound drought and heatwave events during a historical period. Mukherjee and Mishra [11] quantified the spatiotemporal changes in compound drought and heatwave (CDHW) events by integrating the weekly self-calibrated Palmer Drought Severity Index (PDSI) and daily maximum temperatures during the period 1983 to 2016. Mishra et al. [12] characterized CDHW events using the standardized precipitation evapotranspiration index (SPEI [13,14,15]) and air temperature anomalies for the monsoon season. Monsoon seasons with an SPEI less than −1 and temperature anomalies greater than 1 were categorized as concurrent hot and dry extremes to explore the relationship between CDHW and El Niño events. CDHW events are characterized by increased intensity, wider impacts, and longer duration in many regions around the world [11]. The southern, southeastern, and western regions of the United States experienced a notable upward trend in CDHW events from 1960 to 2010. Specifically, there was a greater surge in the frequency of longer and more severe droughts and heatwaves (7-day 95th percentile) compared with shorter and milder occurrences [16]. The extreme CDHW events that occurred in Europe in 2003 resulted in a significant decrease in primary productivity. Furthermore, the anticipated increase in future drought events has the potential to transform temperate ecosystems into carbon sources [17]. The number of consecutive CDHW events in Australia has been increasing for 150 years, which appears to be more related to the temperature than rainfall [18]. Heatwaves and drought events in Portugal have tended to be frequent and intense in the past 20 years, and temperature changes may have an impact on drought events [19]. The CDHE events in the Chinese mainland have been continuously strengthened in the past half-century [20], becoming more frequent, lasting, and extreme in eastern [21,22], southwestern, and northwestern [23] China.
Jiangsu Province is situated in the eastern part of China, within the middle and lower reaches of the Yangtze River and the lower reaches of the Huai River. Jiangsu Province exhibits several noteworthy characteristics. First, it possesses a significant population density and boasts a relatively advanced urbanization level, placing it in a leading position in terms of social development within China. Second, the agricultural sector, fishery food supply, and shipping industry have all achieved significant development. However, these commendable traits also make the province vulnerable to substantial damage caused by the adverse effects of high temperatures and droughts [24]. Consequently, both the livelihoods of its people and the agricultural and industrial sectors endure significant harm. In 2013, a significant heatwave event occurred nationwide [25], with the eastern region of China being particularly affected. The China Center for Disease Control and Prevention reported that during the summer of 2013, there were at least 5758 cases of heat-related illnesses, primarily concentrated in the middle and lower reaches of the Yangtze River. From July to mid-August 2013, Jiangsu Province experienced an unusual and prolonged period of high temperatures that had not been seen since 1961 [8,26]. The overall characteristics of this period were early onset, extended duration, wide geographical impact, and high intensity. From mid-July to early September, most areas of Jiangsu Province received below-average rainfall, resulting in a significant evaporation rate in agricultural fields and leading to water shortages or drought conditions in some areas. The persistent high temperatures resulted in a significant increase in heatstroke cases, as well as setting a new record for peak electricity demand. The cities of Xuzhou, Lianyungang, Suqian, and 12 counties (districts) in Jiangsu Province were severely influenced, with 4.751 million people affected, 356.9 thousand hectares of crops damaged, and a direct economic loss of USD 135.6 million [27]. Therefore, a comprehensive study of the distribution, variations, and development trends of combined high-temperature and drought events in Jiangsu Province is crucial for effective intervention, disaster risk assessment, and management. This research is of significant importance for reducing drought, mitigating disasters, and effectively adapting to climate change in the region.
This article is based on years of meteorological data series, such as precipitation and temperature. Heatwave events were identified using the absolute threshold method, while drought events were identified using the standardized precipitation evapotranspiration index (SPEI). The intersection of these two events is defined as CDHW events. The temporal and spatial patterns of three types of disaster events from June to August from 1960 to 2018 were examined. Lastly, data retrieval and verification were performed for the years that exhibited the most severe instances of CDHW events.

2. Study Area and Data
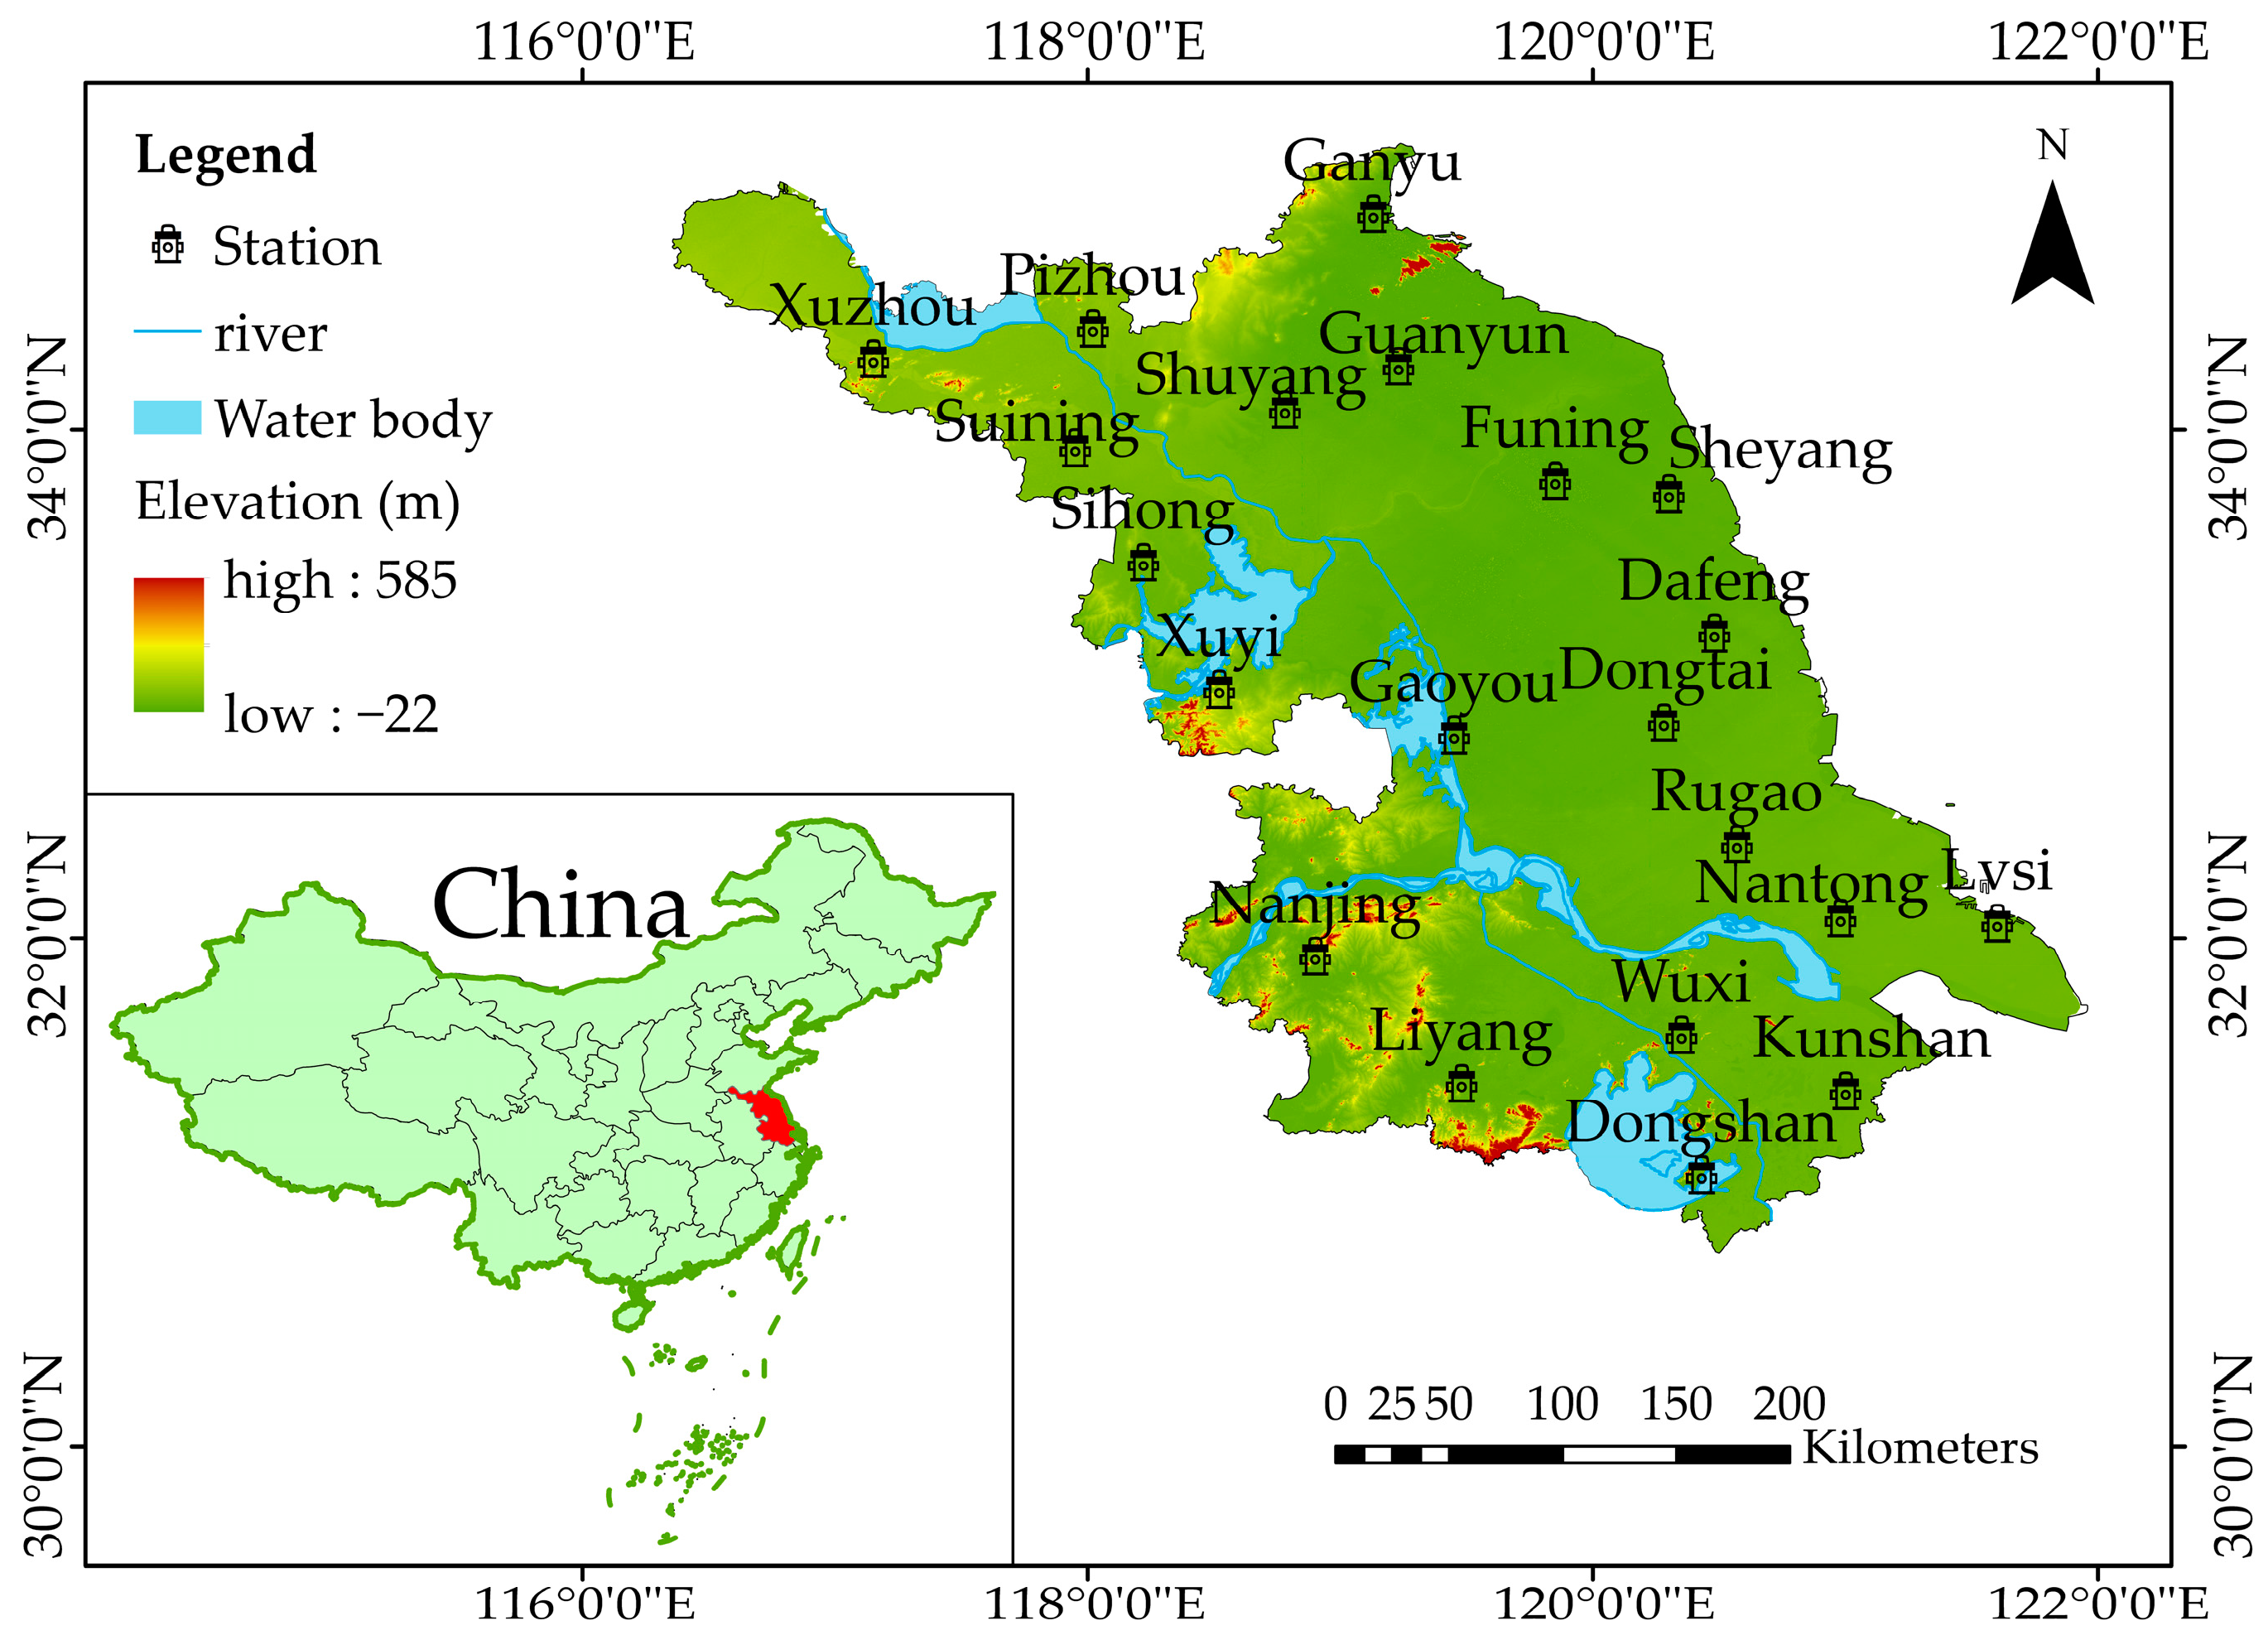
2.1. Area

Jiangsu Province is situated in the middle and lower reaches of the Yangtze River and the lower reaches of the Huai River, spanning between 116°18′–121°57′ east longitude and 30°45′–35°20′ north latitude. It shares its eastern border with the Yellow Sea, while its northern, western, and southern boundaries adjoin the provinces and municipalities of Shandong, Anhui, Zhejiang, and Shanghai. The provincial land boundary measures 3383 km, with a coastline extending 954 km. Jiangsu Province experiences a subtropical humid monsoon climate and is characterized by predominantly flat terrain, and the majority of the region lies at an elevation of 50 m or below, with low hills concentrated in the southwest. These distinctive monsoon patterns and intricate climatic features render the province susceptible to natural disasters. Given its unique climate and geographic conditions, occurrences of high temperatures and drought disasters are frequent.

2.2. Data

This study analyzed the high temperature and drought in Jiangsu Province using the “Daily meteorological dataset of basic meteorological elements of China National Surface Weather Station (V3.0)” obtained from the National Meteorological Information Center of the China Meteorological Administration (http://data.cma.cn, accessed on 10 June 2019). The data included daily precipitation (mm), maximum temperature (°C), minimum temperature (°C), average temperature (°C), wind speed (m/s), sunshine hours (h), and relative humidity (%) from 21 stations in Jiangsu Province from 1960 to 2018. The study area and selected meteorological station distribution can be seen in Figure 1. Trace precipitation was defined as 0.5 mm and missing values were filled in using interpolation with data from neighboring meteorological stations. Considering that the period from June to August is when high-temperature events are most concentrated and from June to October is the most severe drought period in the Yangtze River Basin, this study focused primarily on the characteristics of the heatwave, drought, and their compound events in Jiangsu Province during the summer season (June to August) and compared them with the perennial conditions.

3. Methods

3.1. Definition of Heatwave and Drought Events

There is currently no unified standard for defining heatwave events in research. This study adopted the absolute threshold method to define a hot-day event as one with a maximum temperature of 35 °C or higher by integrating relevant studies from the China Meteorological Administration and Jiangsu Province [28,29,30]. A heatwave event is defined as three consecutive days with a maximum temperature of 35 °C or higher. Meteorological drought is generally the cause of other types of drought, and thus, this article used meteorological drought to characterize drought events. The standardized precipitation evapotranspiration index (SPEI) is a comprehensive index that considers precipitation, evaporation, and transpiration, enabling a reasonable evaluation of drought across various time scales. Previous studies commonly relied on the standardized precipitation index (SPI), which only considers precipitation and disregards the influence of the water balance and temperature, making it unable to reflect the impact of temperature on drought trend changes. Unlike the SPI, the SPEI incorporates the difference between precipitation and evapotranspiration and provides a more objective description of surface moisture conditions. Moreover, the SPEI shares the advantage of SPI in terms of multi-scale and spatial comparisons, making it suitable for analyzing drought characteristics under the influence of climate warming [31]. Consequently, this study utilized the SPEI to represent meteorological drought events, and the specific calculation steps are outlined as follows [13,14,15].
(1) Calculate the daily potential evapotranspiration (PET) using the Penman–Monteith model recommended by FAO-56 (1998) [32], as shown in Equation (1):
PET = 0.408 Δ R n G + γ 900 T + 273 U 2 e a e d Δ + γ 1 + 0.34 U 2
In this equation: PET is the daily potential evapotranspiration, in mm; Δ is the slope of temperature change with saturated water vapor pressure, in kPa/°C; U2 is the wind speed at a height of 2 m above the ground, in m/s; ea is the saturated water vapor pressure, in kPa; ed is the actual water vapor pressure, in kPa; T is the average temperature, in °C; γ is the psychrometric constant, in kPa/°C; Rn is the net radiation reaching the surface, in MJ/(m2 d); and G is the soil heat flux density, in MJ/(m2 d).
(2) Calculate the difference between monthly precipitation and evapotranspiration, as shown in Equation (2):
D i = P i P E T i
In this equation: Di is the difference between precipitation and evapotranspiration, Pi is monthly precipitation, and PETi is monthly evapotranspiration.
The calculated D values are aggregated at different time scales:
D n k = t = 0 k 1 P i PET i ,   n     k
In this equation: k (months) is the timescale of the aggregation and n is the calculation month.
(3) Normalize the Di data series and calculate the corresponding SPEI index for each value. Since the original data series Di may contain negative values, the SPEI index adopts a 3-parameter log–logistic probability distribution. The cumulative function of the log–logistic probability distribution is calculated according to Equation (4), as shown below:
F x = 1 + α x γ β 1
In this equation: parameters α, β, and γ are obtained by fitting using the method of linear matrices.
(4) The standardization process of cumulative probability density is shown in Equations (5)–(7):
P = 1 F x
When the cumulative probability P ≤ 0.5:
w = 2 ln P
SPEI = w c 0 + c 1 w + c 2 w 2 1 + d 1 w + d 2 w 2 + d 3 w 3
In this equation, c0 = 2.515517, c1 = 0.802853, c2 = 0.010328, d1 = 1.432788, d2 = 0.189269, and d3 = 0.001308. If P > 0.5, then P is replaced by 1 − P and the sign of the resultant SPEI is reversed.
Table 1 displays the classification of the SPEI drought index. A drought event is considered to have occurred in a given month if the calculated monthly SPEI-3 is less than or equal to −0.5.

3.2. Definition of Compound Drought and Heatwave Events

A compound drought and heatwave event is defined as a situation in which a heatwave event (35 °C, at least three continuous days) and a drought event (SPEI < −0.5) occur at the same time.

3.3. Trend Analysis Method

The nonparametric Mann–Kendall (MK) test is commonly used to assess the trend of hydrological series. MK test analysis is not influenced by outliers and does not require a specific distribution, making it capable of reflecting the degree of change in time series trends effectively. This study adopted MK test estimation to analyze the interannual variation in regional climate indices. The specific principle is as follows [33].
For any given sequence Xt(t = 1, 2, …, n), where n is the length of the sequence, the statistic S can be defined as shown in Equation (8):
S = k = 1 n = 1 j = k + 1 n sgn ( X j X k )
In this equation: Xj and Xk are the annual data of the corresponding time series, n is the length of the time series, and sgn(XjXk) is the sign function.
Construct the standardized test statistic Z as shown in Equation (9):
Z = S 1 V a r S , S > 0 0 , S = 0 S + 1 V a r S , S < 0
Z follows a standard normal distribution. When Z > 0, there is an upward trend; when Z < 0, there is a downward trend. For a given significance level α, if |Z| ≥ Z1−α/2, it indicates that the time series has a significant upward or downward trend.

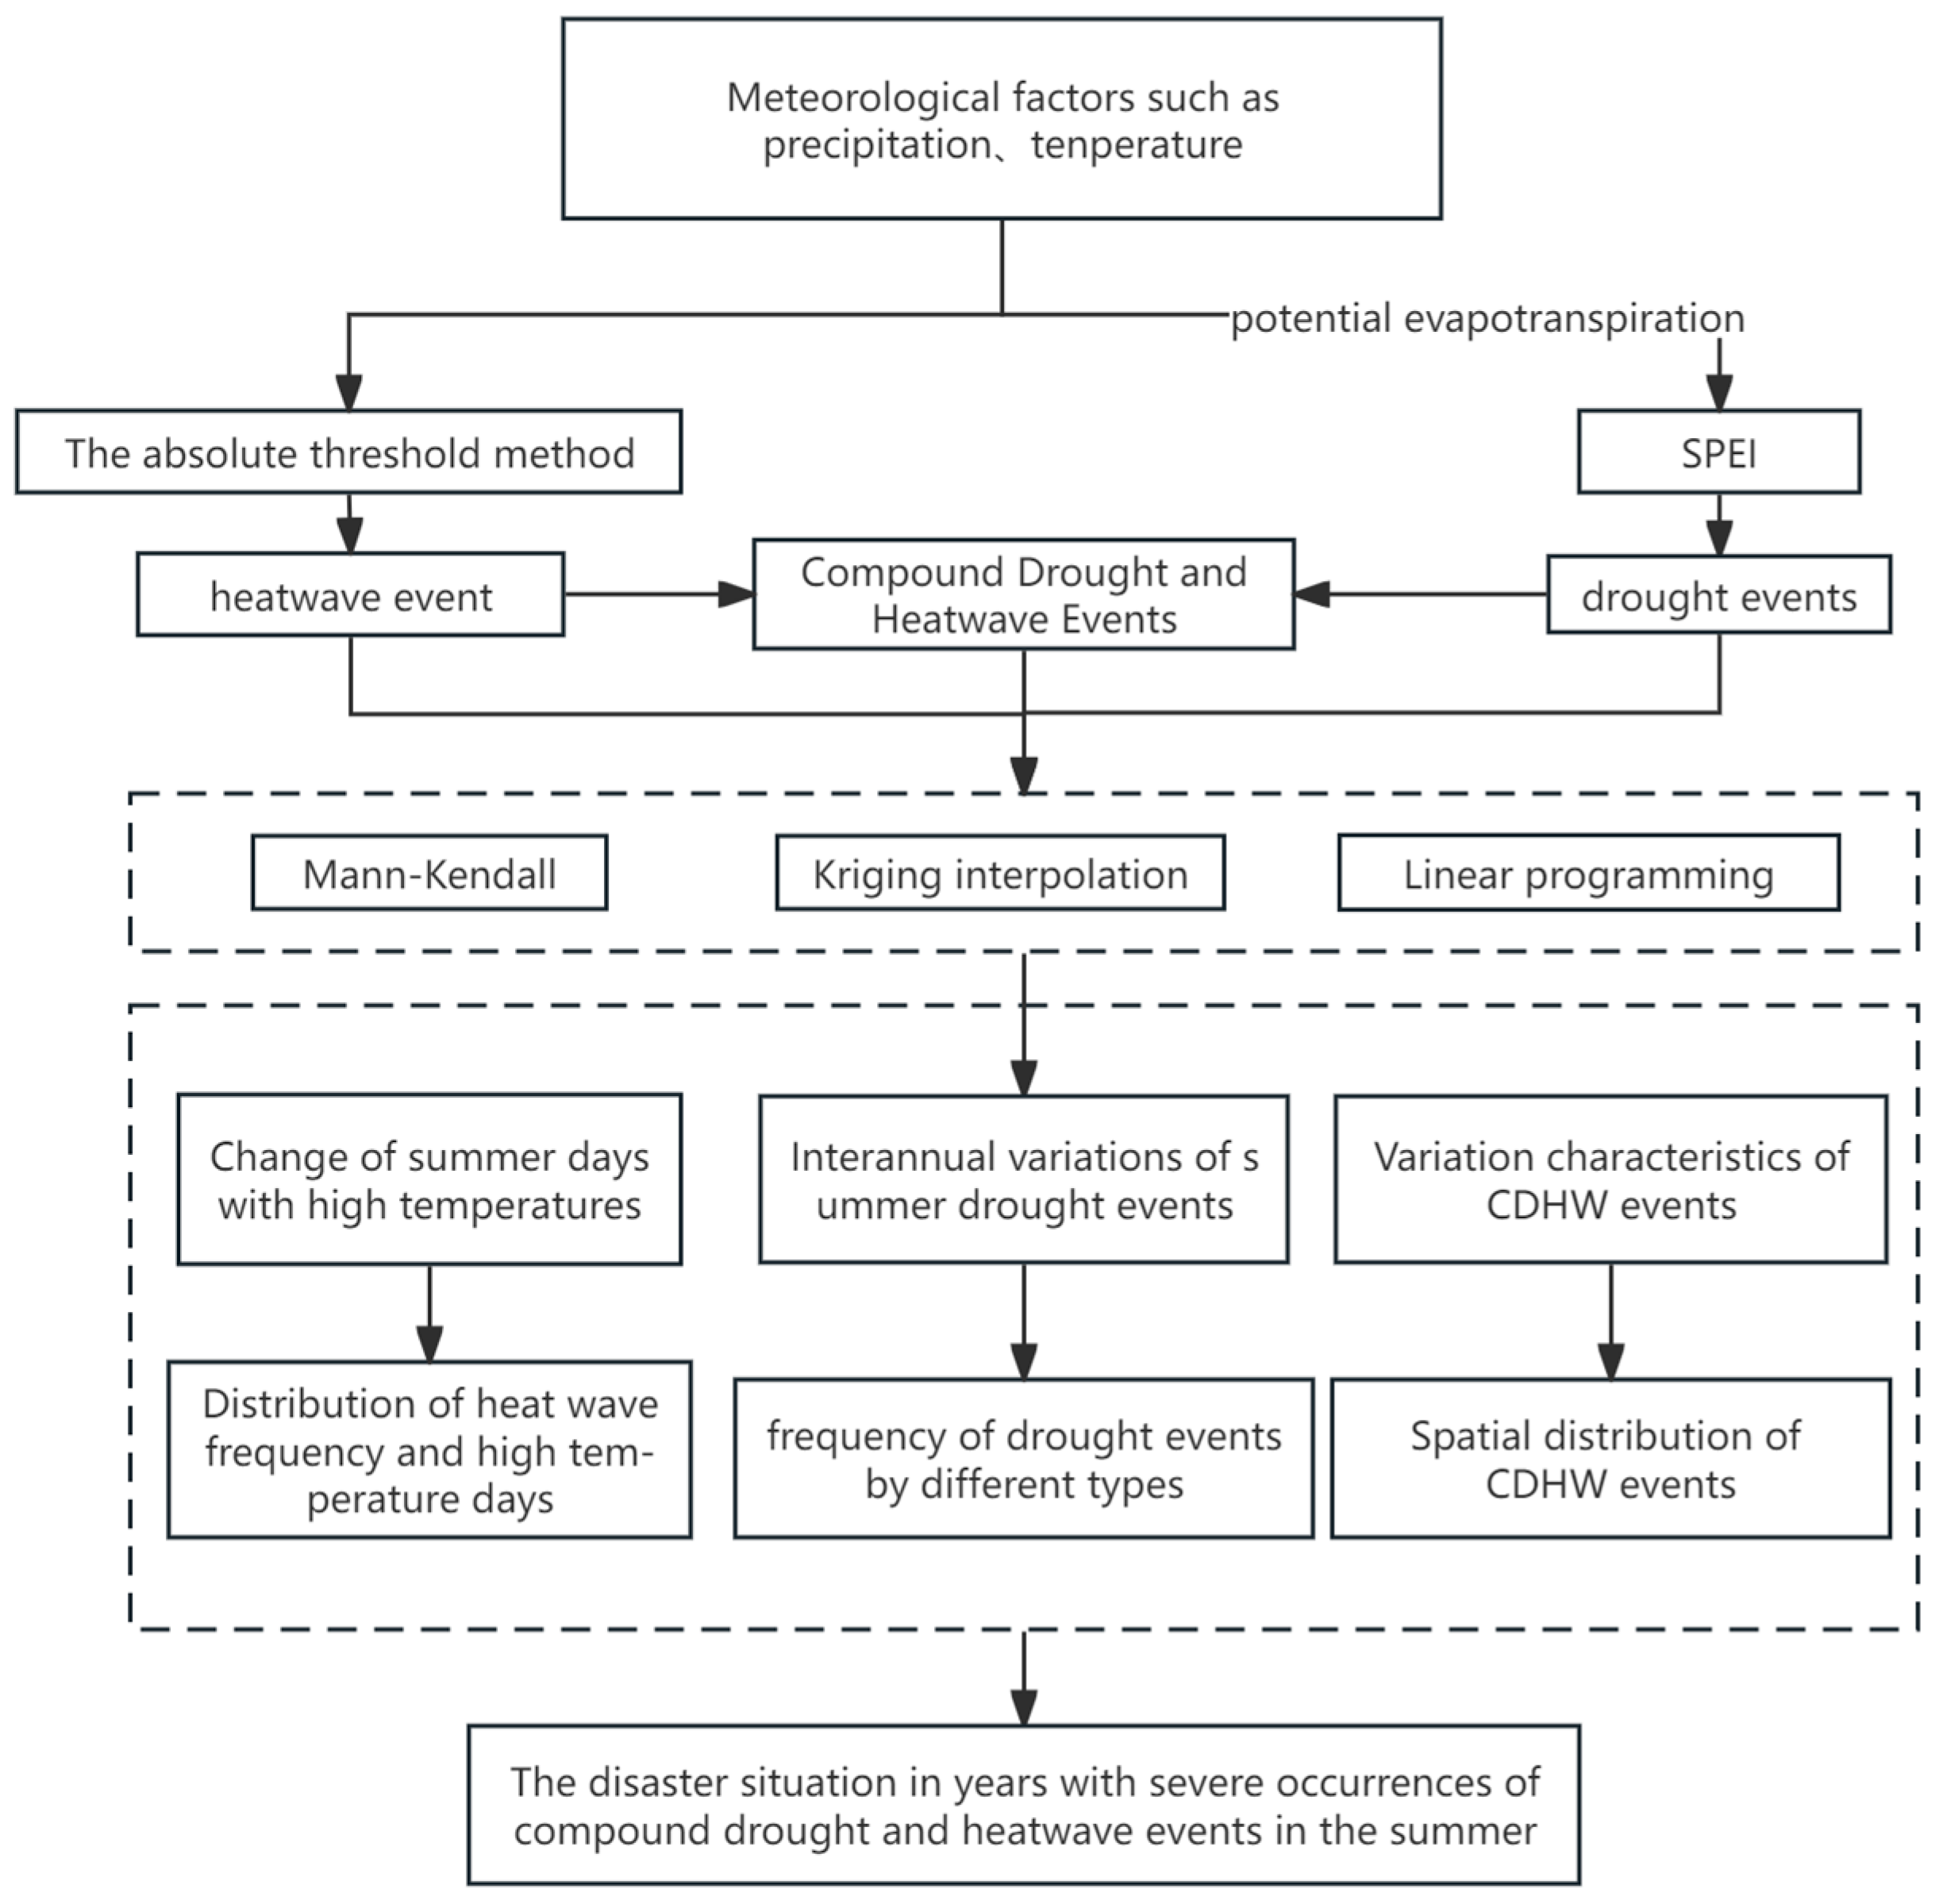
3.4. Technology Road Map

To better illustrate the idea of this study, the technology road map is shown in Figure 2.

4. Results and Discussion

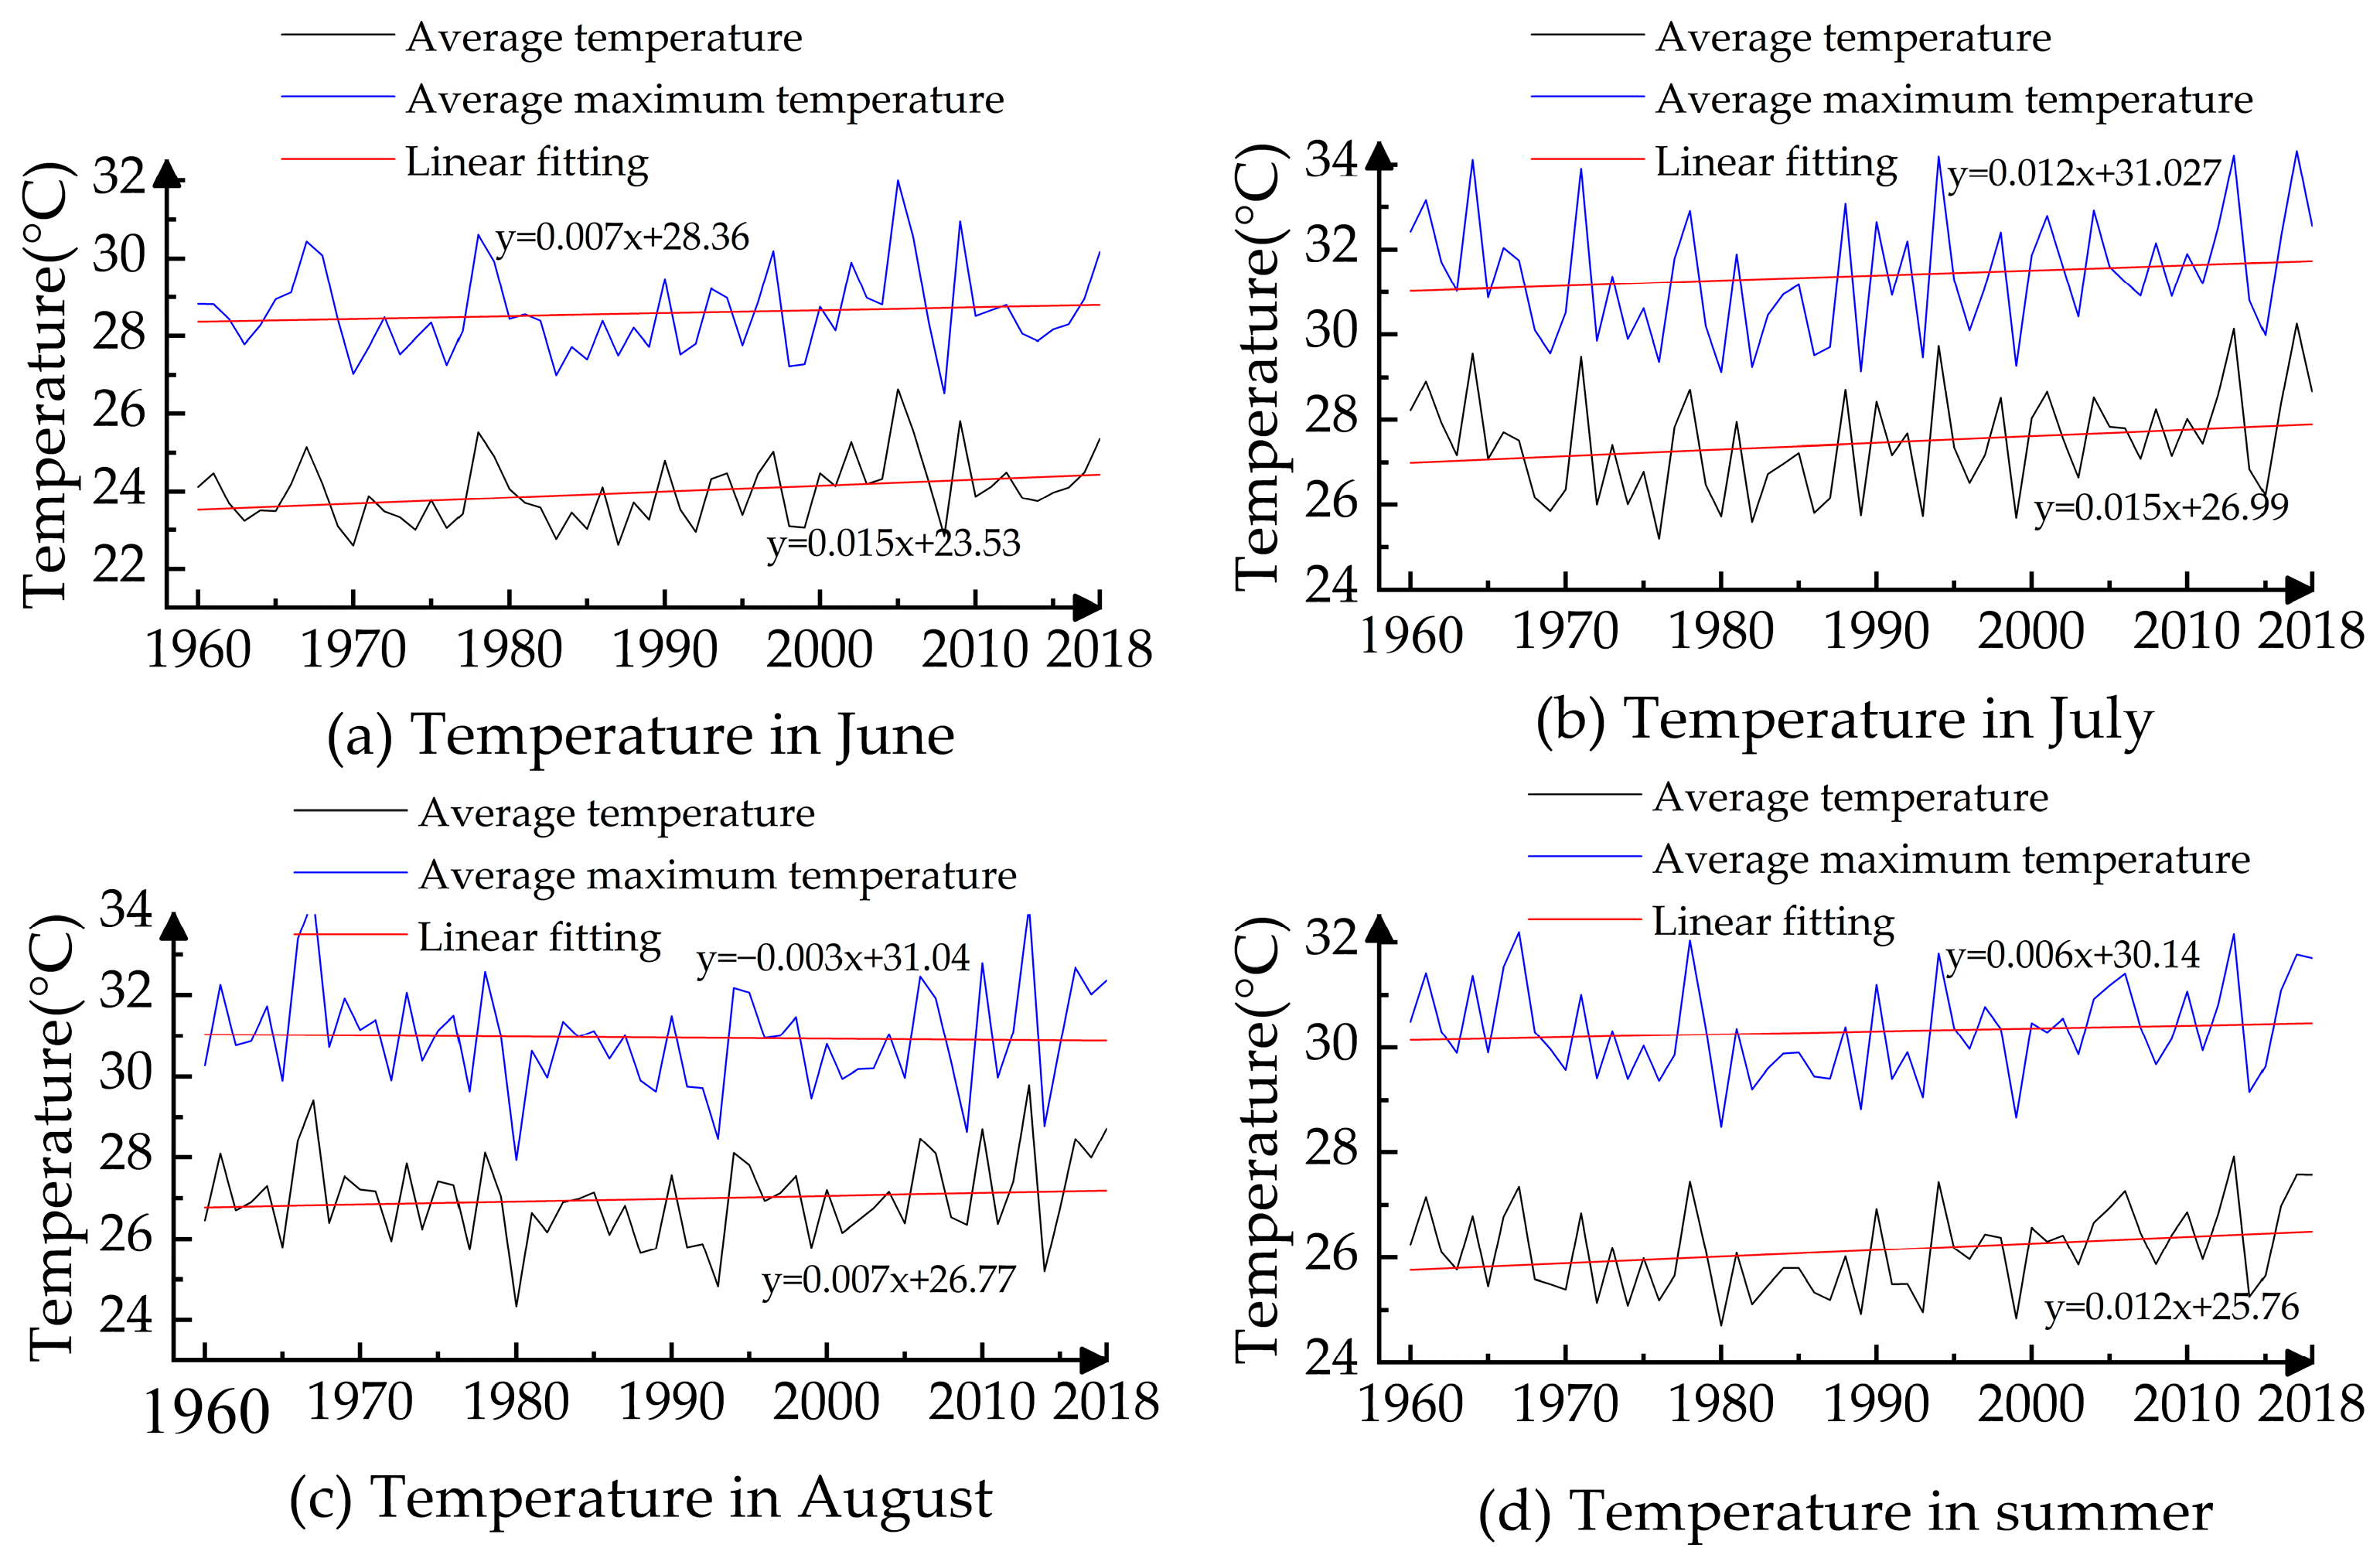
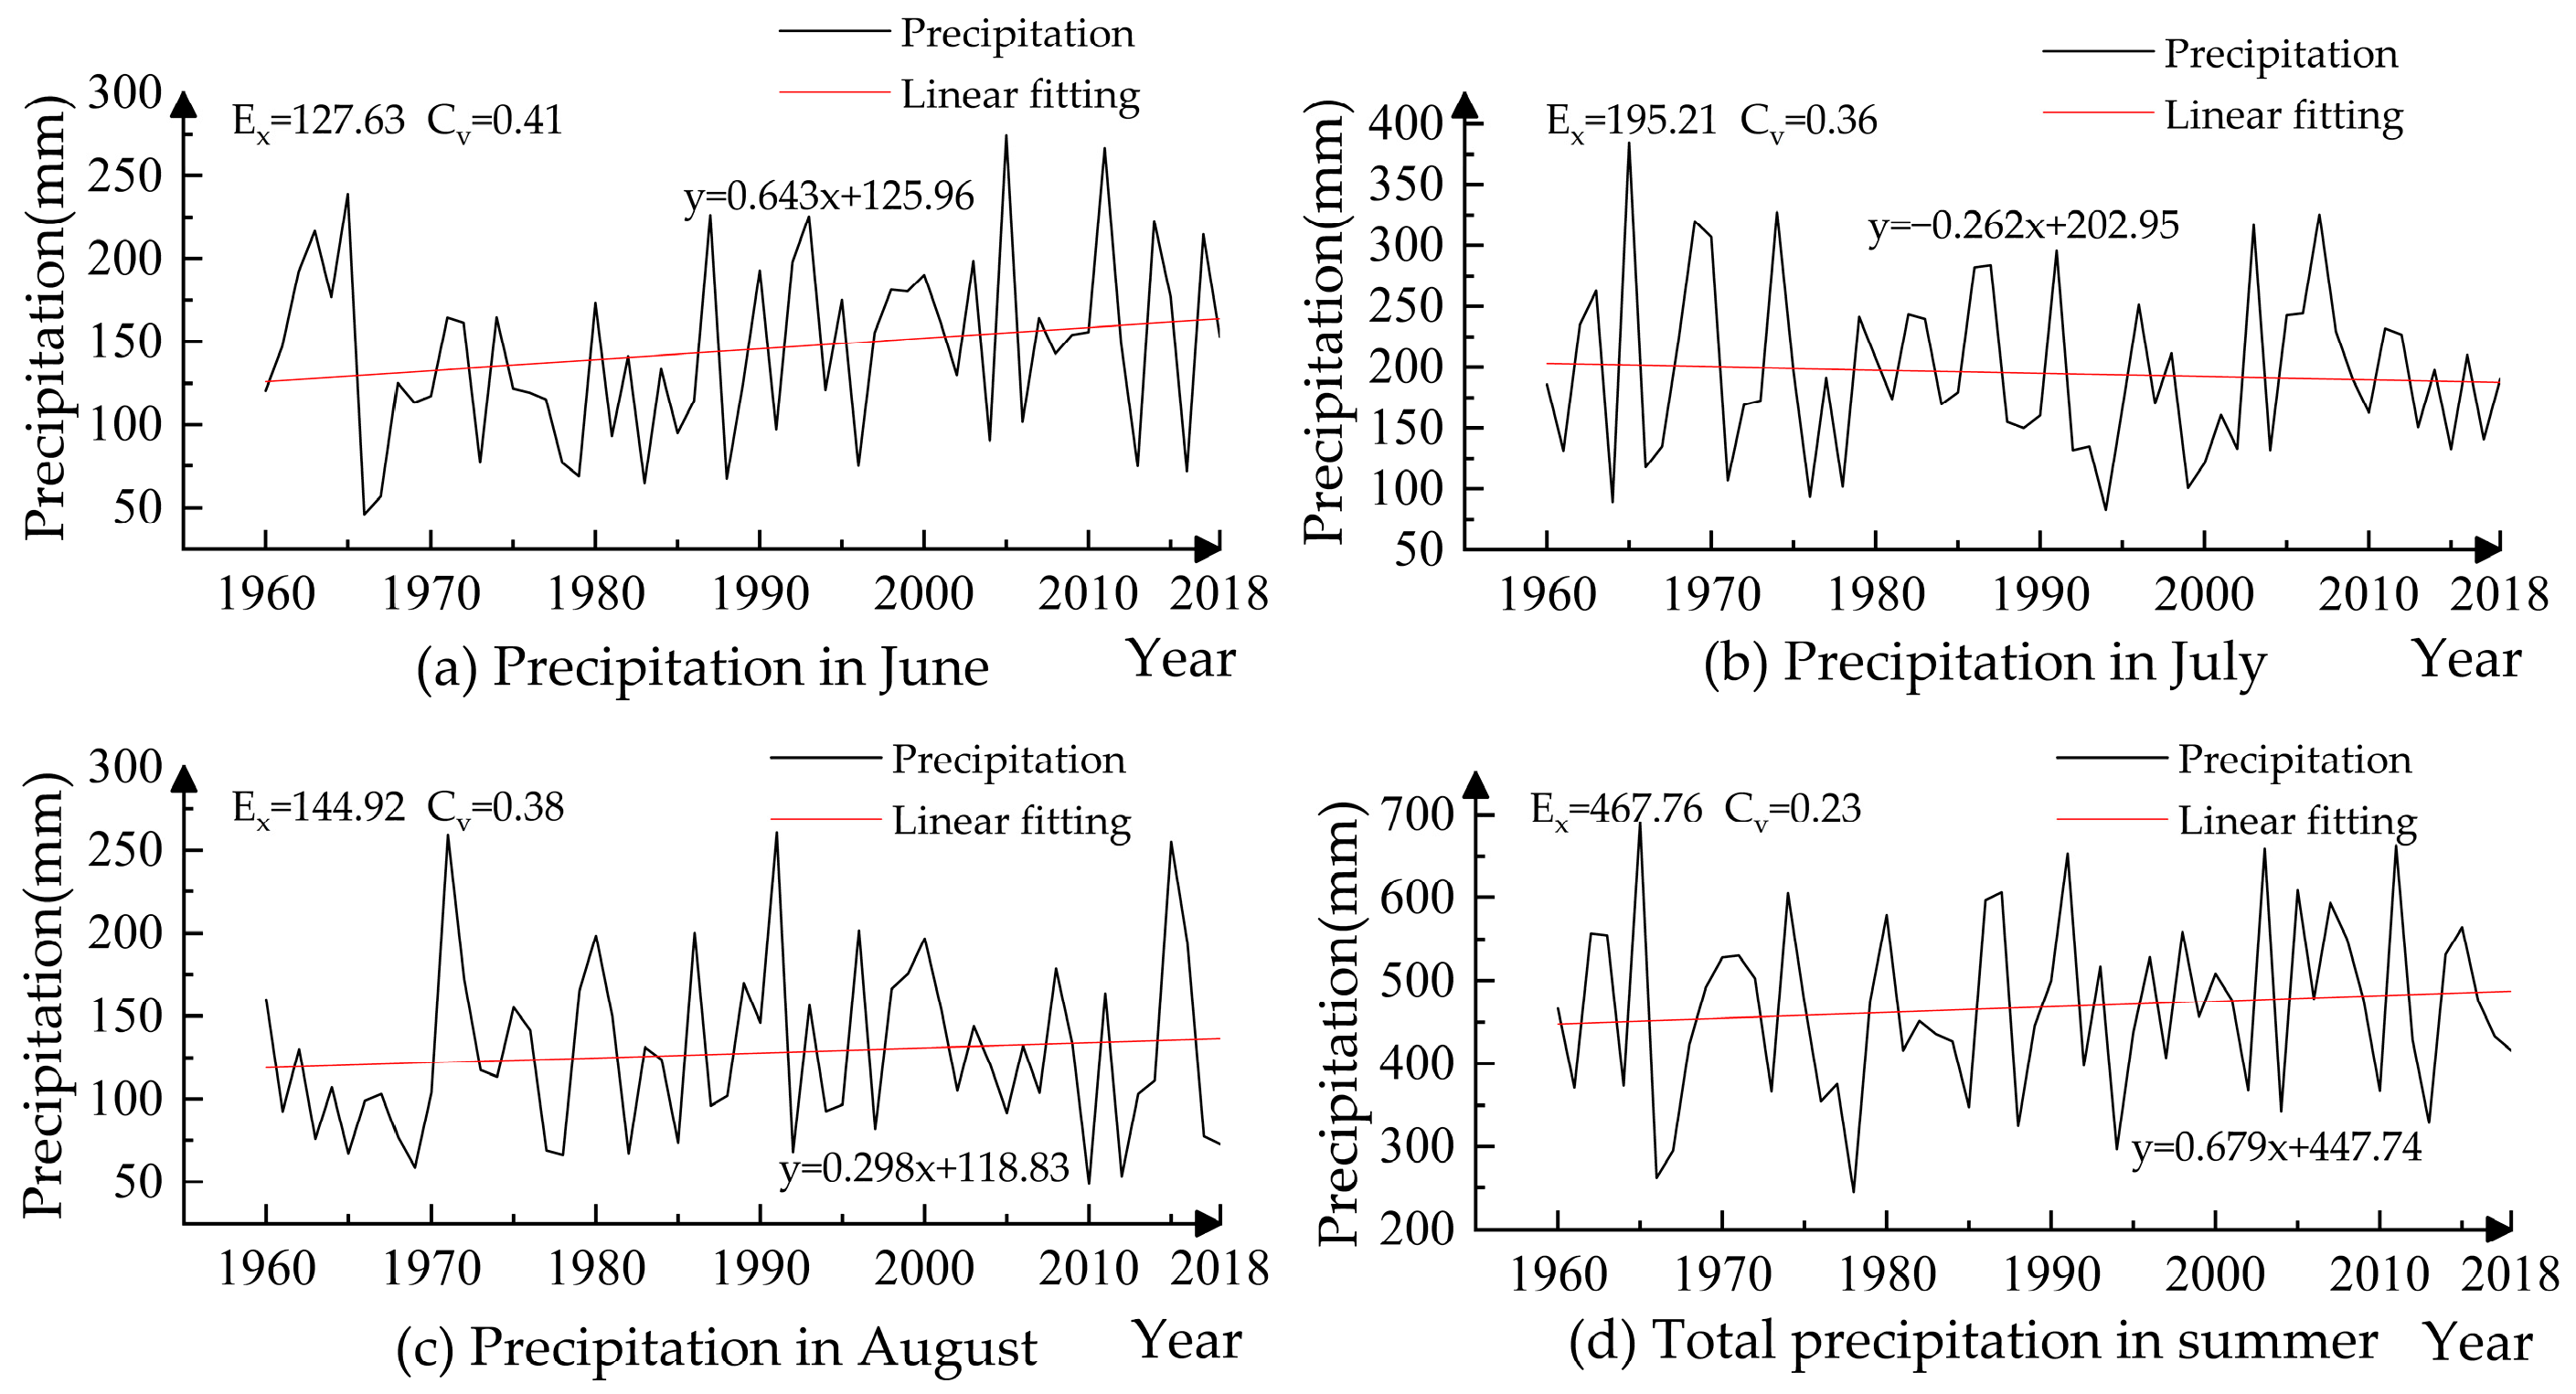
4.1. Spatial and Temporal Variations in Summer Temperature and Precipitation in Jiangsu Province

The average summer temperature curve and the average maximum temperature curve in Jiangsu Province from 1960 to 2018 are shown in Figure 3. Figure 3 indicates that the variations in average summer temperature and maximum temperature from June to August in the Jiangsu region were generally consistent over the 60 years analyzed, except for a decreasing trend in the interannual variability of the average maximum temperature in August. The trends for June, July, and the overall change showed an increasing trend. The linear trend rate of the average maximum temperature in summer was 0.06 °C/10 a. Between 1967 and 1974, the average temperature showed a decreasing trend, especially in the mid-1970s. From 1978 to 1992, the temperature gradually began to rise again, with slightly cooler temperatures in the early 1980s. In the 1990s, there was a slight decline, followed by a rise after the mid-1990s, and a trend of first decreasing and then increasing since the 2010s. The average temperature and maximum temperature of each city reached their lowest values in 1980 and showed an increasing trend over the last 35 years analyzed. The highest annual average temperatures in summer were recorded in 1967, 1978, 1994, and 2018, while the lowest were in 1980 and 1999.
The variation curve and trend line of the precipitation during June, July, August, and the entire summer from 1960 to 2018 in Jiangsu Province are presented in Figure 4. We examined the mean value (Ex) and coefficient of variation (Cv) obtained by fitting the Pearson type III frequency curve to the precipitation data. Our findings indicate that there was an increasing trend in precipitation during June, August, and the summer season as a whole in the Jiangsu region, with increases of 6.43 mm/10 a, 2.98 mm/10 a, and 6.79 mm/10 a, respectively. However, the July precipitation showed a decreasing trend, with a decrease of 3.63 mm/10 a. Over the 60 years analyzed, there was a gradual decrease in the July precipitation, while June and August experienced a gradual increase. Among the three summer months, July received the highest average precipitation of 195.21 mm. The interannual variability of summer precipitation in Jiangsu Province was substantial, with June exhibiting the highest Cv value and the most pronounced interannual variation from 1960 to 2018. On the other hand, the Cv value for the entire summer precipitation was the smallest, and its interannual variation from 1960 to 2018 was relatively small compared with the monthly precipitation fluctuations.

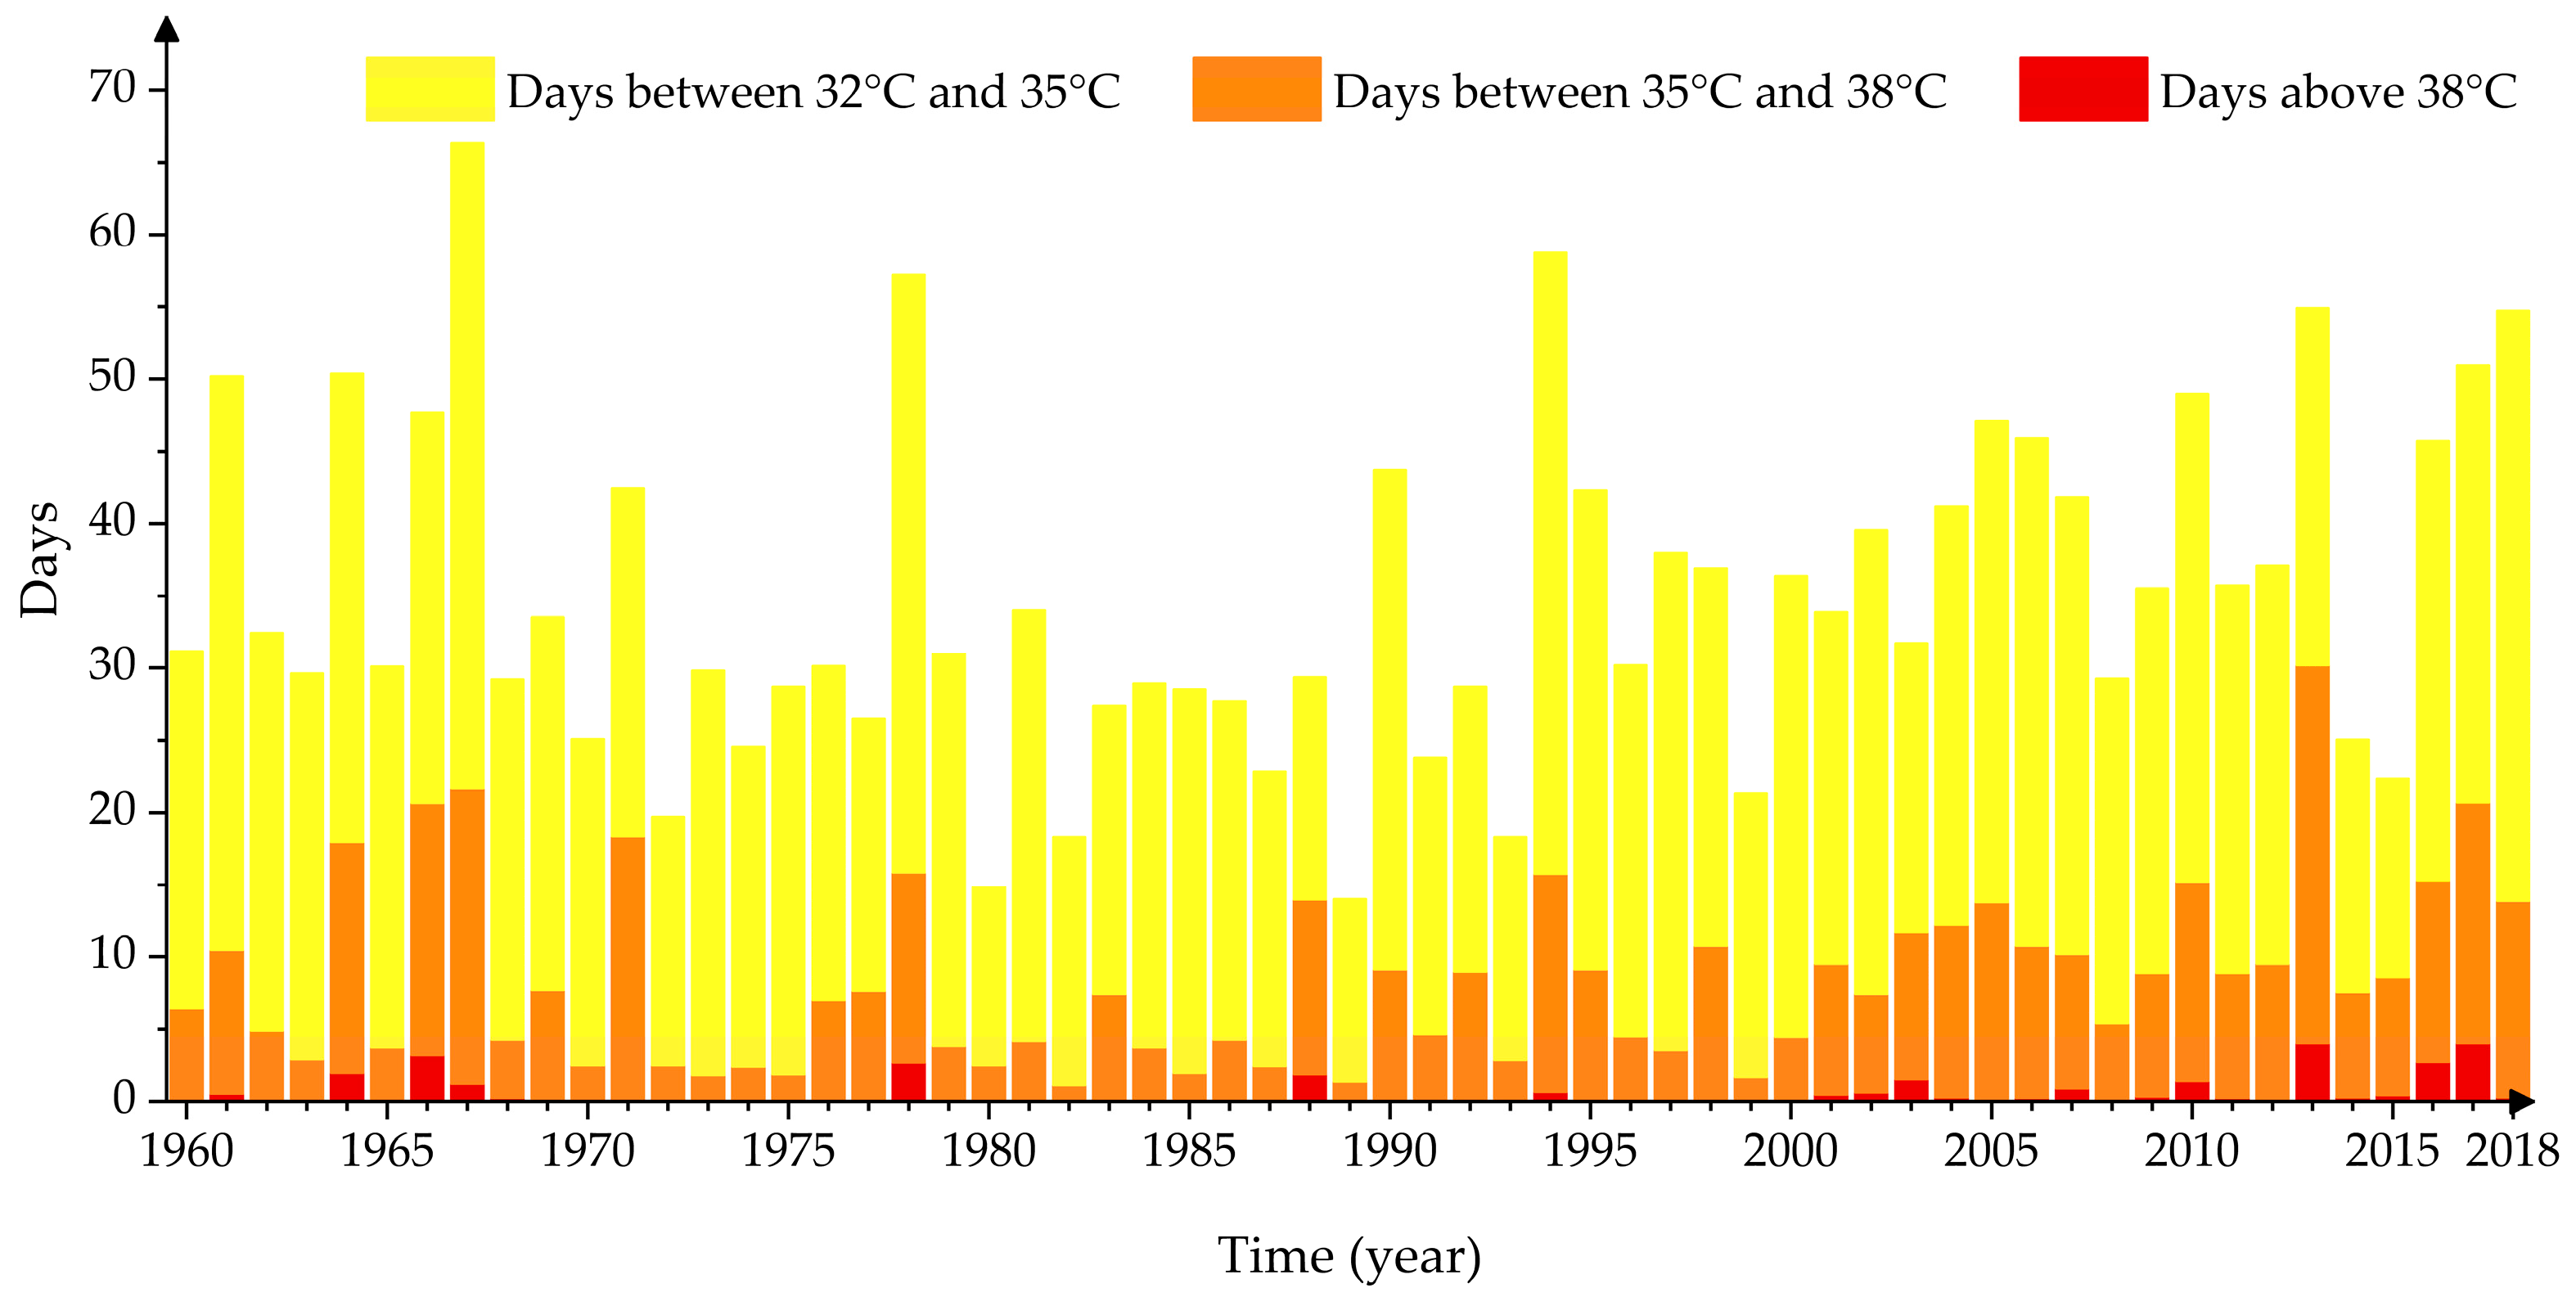
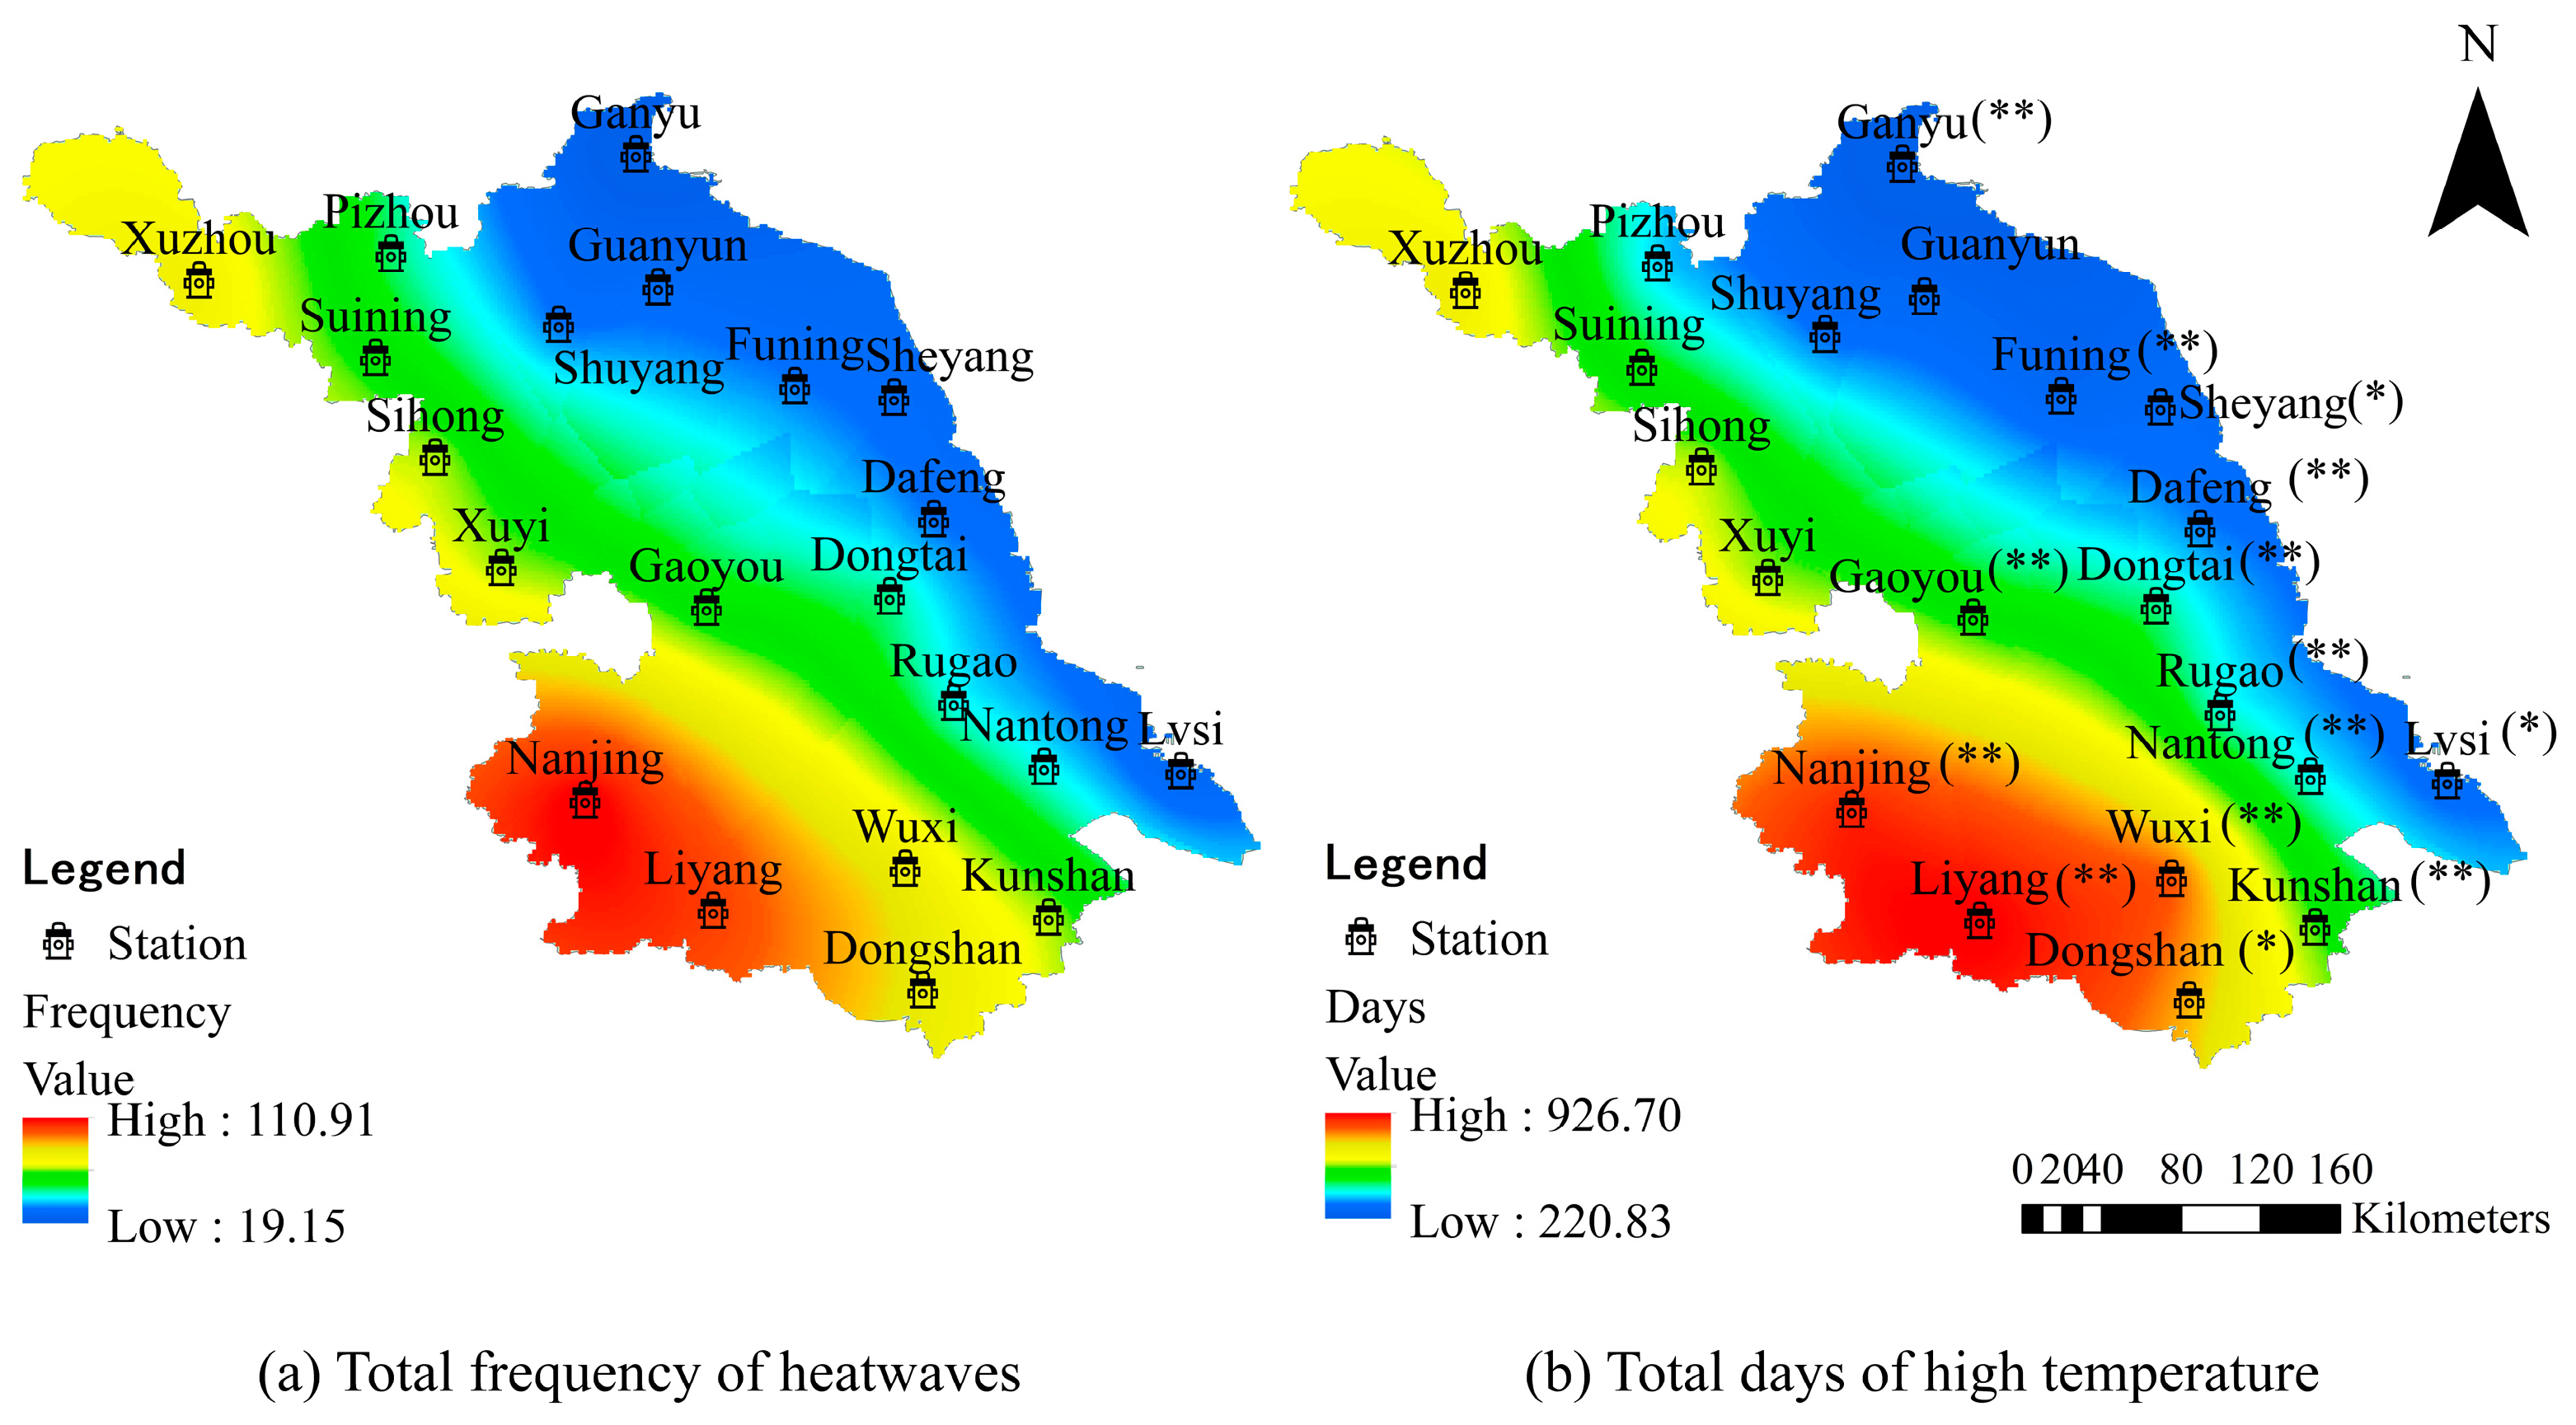
4.2. Spatial and Temporal Variations in Summer Heatwaves in Jiangsu Province

In addition to the absolute threshold of 35 °C, other thresholds are also widely used in the study of heatwave events. An analysis was conducted on the adaptability of three high-temperature thresholds, namely, 32 °C, 35 °C, and 38 °C, in Jiangsu Province [7,34]. The cumulative chart of average high-temperature days in Jiangsu Province during the summer season is shown in Figure 5. The proportion of high-temperature days with maximum temperatures exceeding 38 °C was the lowest, with an average of more than 1 day per year in every ten years. During the periods from 1960 to 1969 and from 2010 to 2018, there were three years in each period with high-temperature days with maximum temperatures exceeding 38 °C for more than 1 day, especially in the period from 2010 to 2018, where there were two years (2013 and 2017) with an average of 4 days, indicating a recent increase in the number and frequency of such days. The number of high-temperature days with maximum temperatures exceeding 35 °C showed a significant increasing trend from 2000 to 2018, with a sudden change occurring in 2013, reaching 30 days. Over the past 59 years, the number of high-temperature days with a threshold of 35 °C was 503.2 days, accounting for 9.27% of the total summer days in Jiangsu Province. The years with a high number of high-temperature days with temperatures exceeding 32 °C were 1967, 1978, 1994, 2013, and 2016, while the lowest number occurred in the summers of 1980 and 1989. The number of days exceeding 35 °C passed the significance level test of α = 0.1.
Temperature data for June, July, and August from the period 1960 to 2018 were selected for the analysis of the high-temperature process. The statistics of the number of high-temperature days and heatwave frequency for each station over the 60 years analyzed are shown in Figure 6. The seven stations with the highest numbers of high-temperature days were Liyang (927 days), Nanjing (890 days), Wuxi (827 days), Dongshan (758 days), Xuzhou (676 days), Sihong (601 days), and Xuyi (581 days). The seven stations with the highest heatwave frequencies were Nanjing (111 times), Liyang (100 times), Dongshan (81 times), Wuxi (80 times), Xuzhou (77 times), Sihong (67 times), and Kunshan (67 times). These seven stations with the most high-temperature days and highest heatwave frequencies were all located in the inland regions. According to the statistics, the annual average number of high-temperature days in the southern Jiangsu region was 13.43, and the annual average heatwave frequency was 1.49. The seven stations with fewer annual average high-temperature days and heatwave frequency were Dafeng, Shuyang, Sheyang, Lvsi, Guanyun, Funing, and Ganyu, which are concentrated in the northeastern coastal area. There were significant regional differences in the distribution of annual average high-temperature days among cities in the province. The number of high-temperature days and frequency increased significantly from the northeastern coastal area to the southern Jiangsu region in the southwest. This indicates that the spatial variation in high temperatures in Jiangsu Province during summer was not only influenced by latitude but also significantly affected by the location of land and sea. Jiangsu Province was dominated by the southeast monsoon in summer, with small temperature differences in the eastern coastal region and a lower probability of heatwave events compared with inland areas. In addition, the low mountains and hills in the southwestern region had higher temperatures than other plain areas. A significance level test was conducted for the number of high-temperature days at each station from 1960 to 2018. Except for several stations in the northwestern part of the province, the number of high-temperature days showed a significant increasing trend each year for the other stations. Among the 21 stations, 14 stations passed the significance level test of α = 0.1, and 11 stations passed the test at α = 0.05.

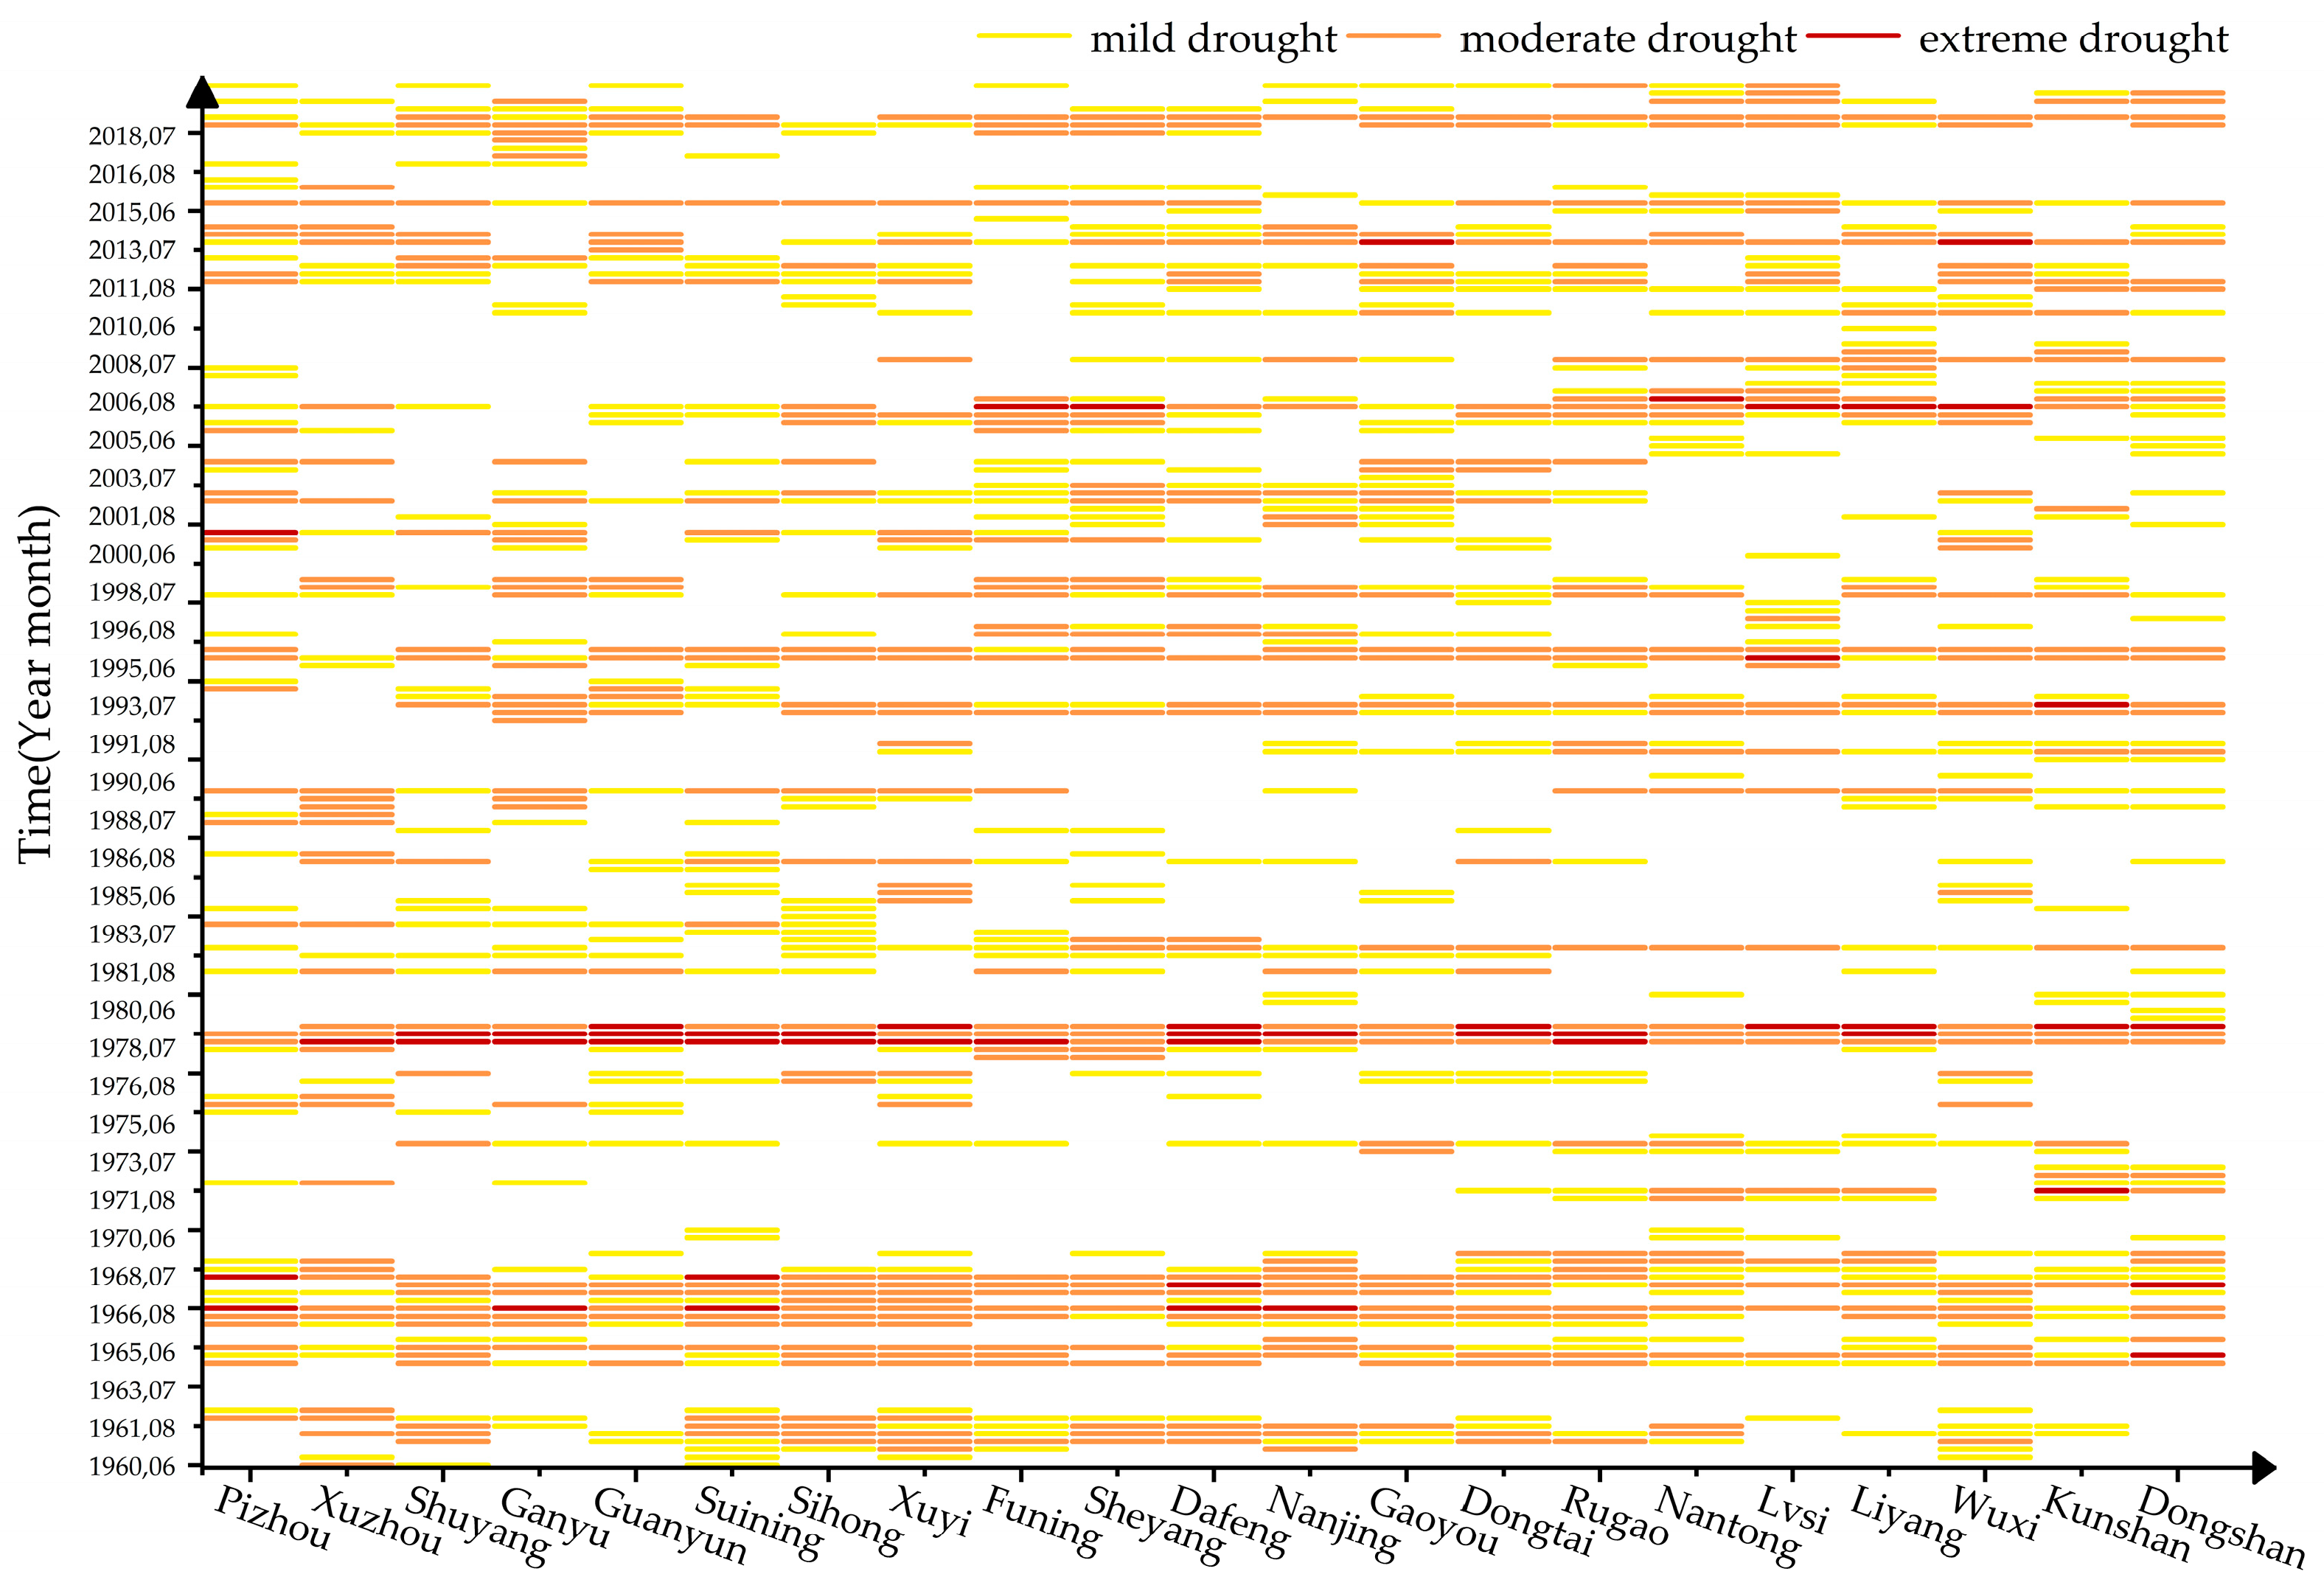
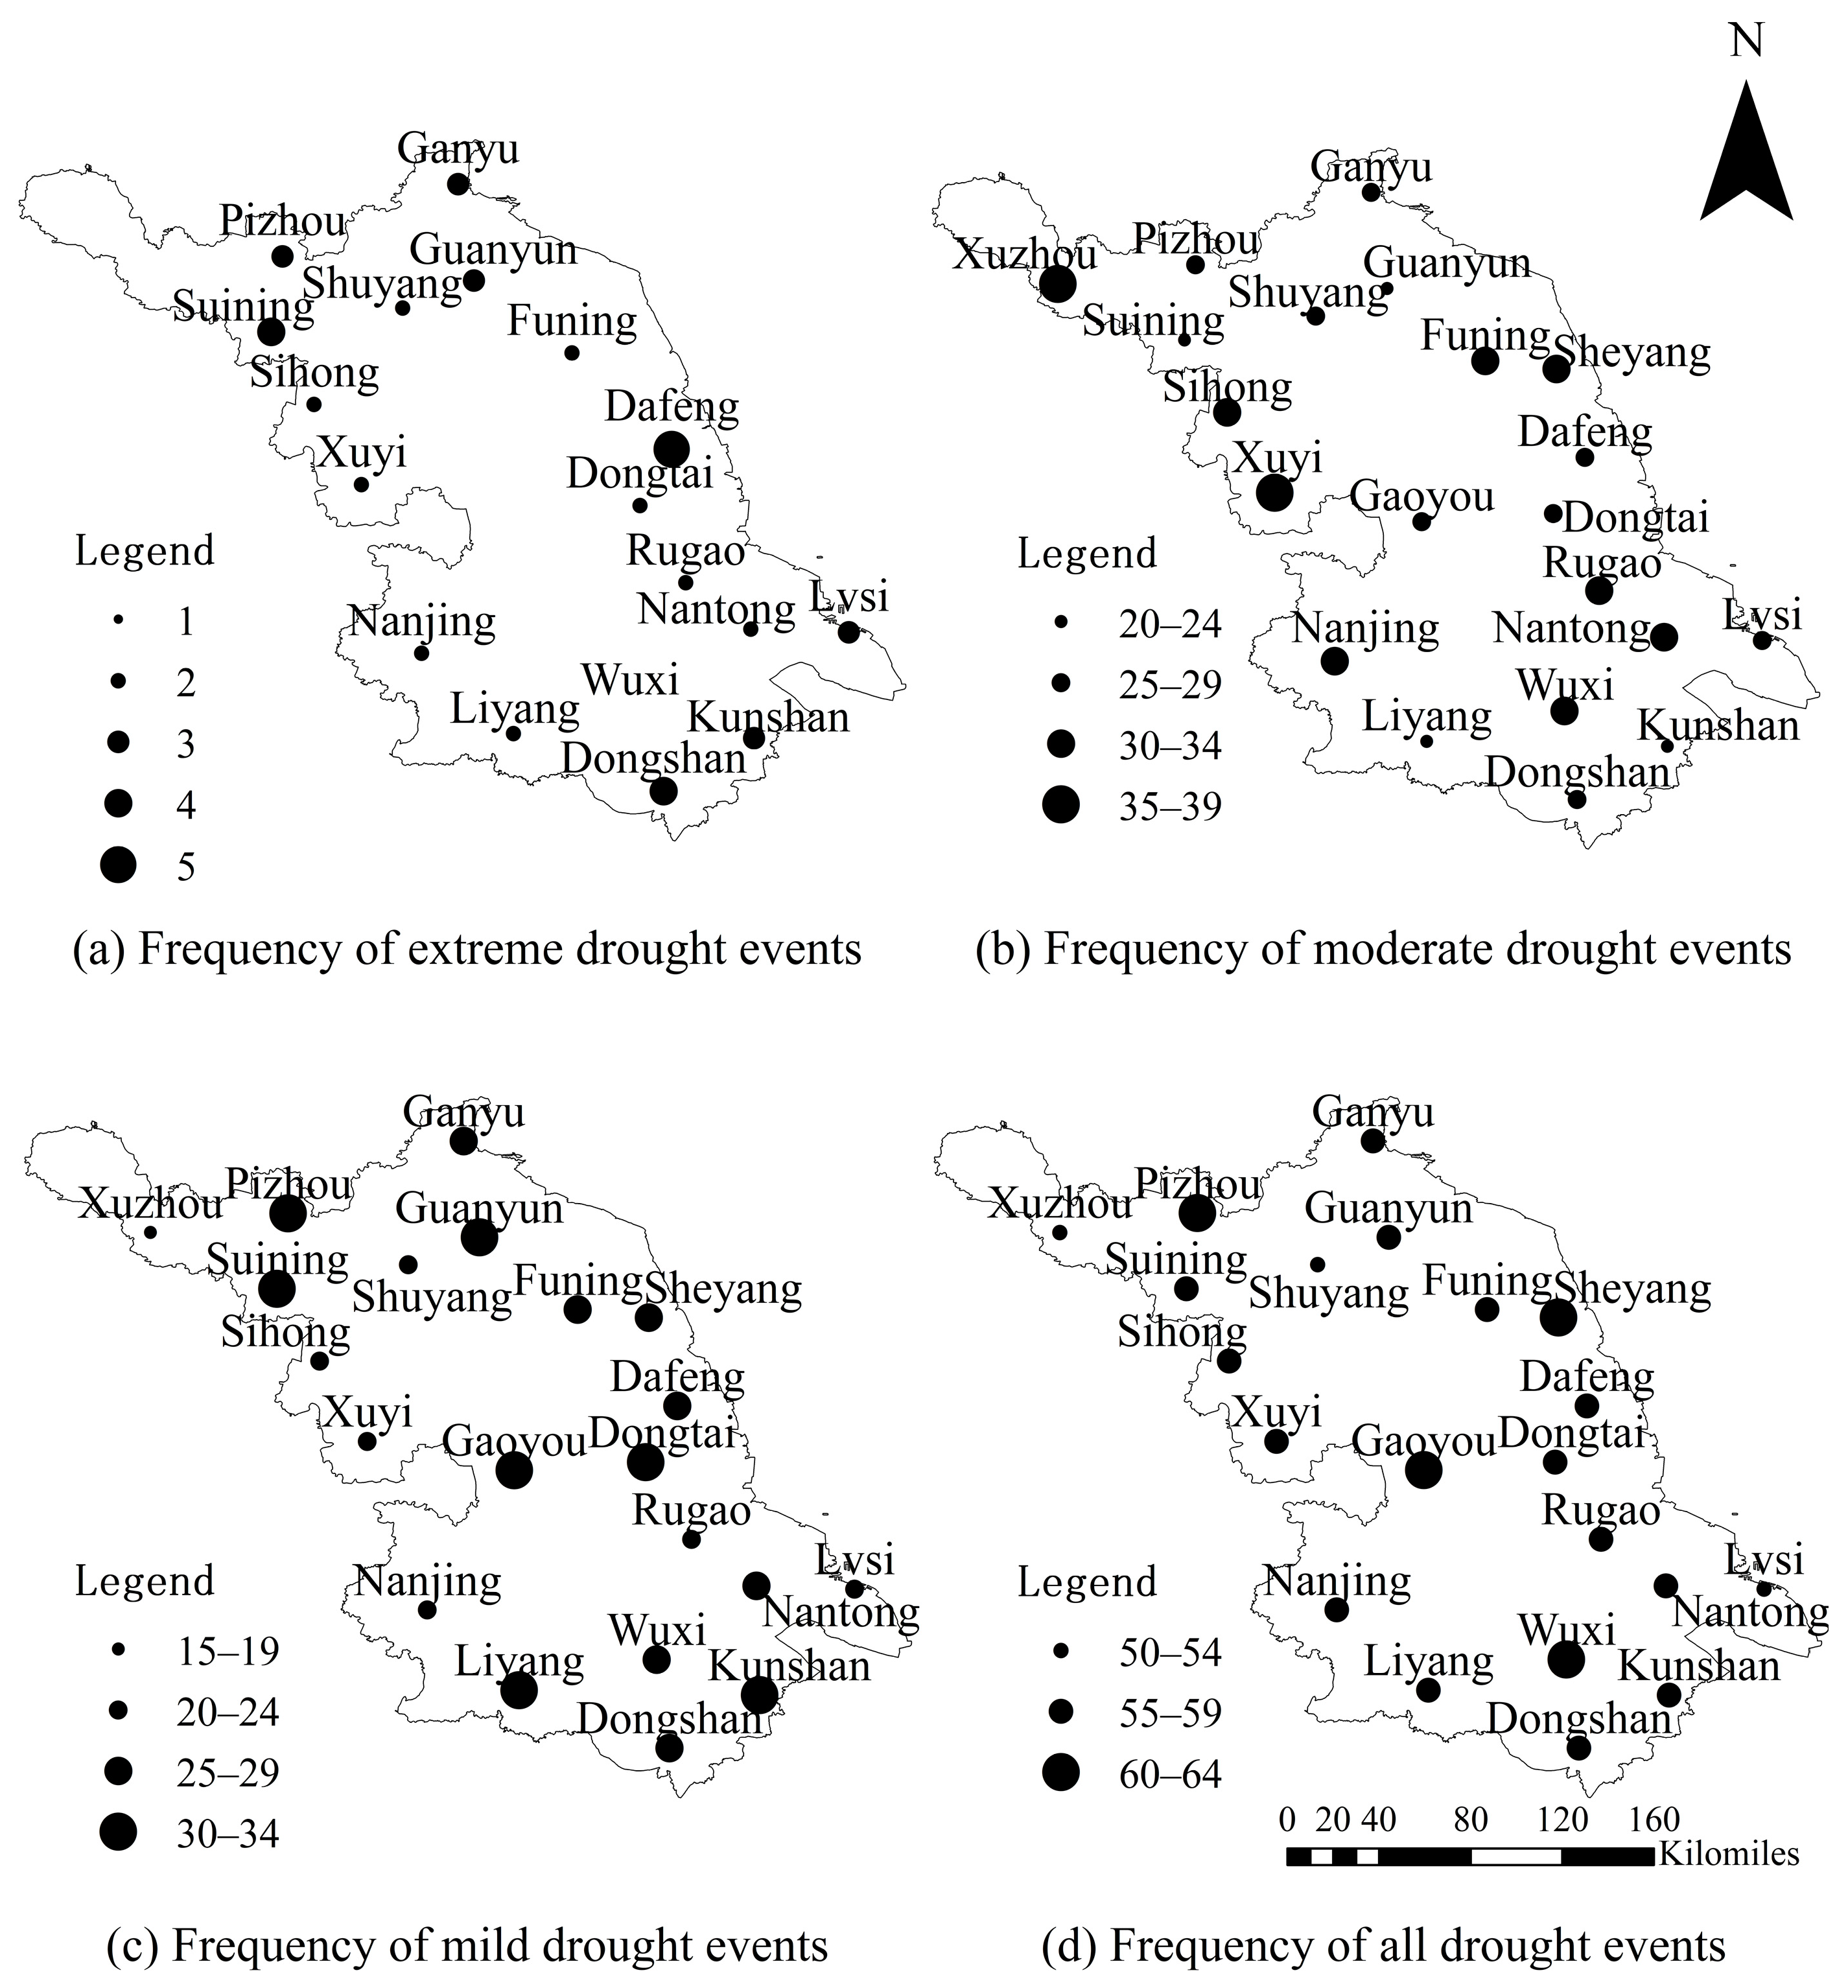
4.3. The Temporal and Spatial Variation Characteristics of Summer Drought in Jiangsu Province

The standardized precipitation evapotranspiration index with a three-month time scale (SPEI-3) was used to calculate the drought index, and the severity of the drought was classified based on the criteria outlined in Table 1. In Figure 7, the occurrence of three types of drought events in the Jiangsu region was depicted at 21 stations over the 60 years analyzed, specifically during the summer months of June, July, and August. The figure reveals a consistent trend of drought in certain summer months across meteorological stations in Jiangsu Province, despite variations in drought severity. Notably, drought events were observed at most stations within the province in July and August of 1964, the summers of 1966 and 1978, June and July of 1994, June of 2005, June of 2012, August of 2013, and June of 2017. Over the 60 years analyzed, the frequency of extreme drought events in the province was relatively low, with the majority occurring during the summer of 1978. The occurrence frequencies of mild and moderate drought events showed an increasing trend from 1969 to 2018, with similar frequencies for both types of drought events. The frequencies of drought events occurring during the three summer months in Jiangsu Province were relatively even. The total number of months that experienced drought events accounted for over one-third of the study period, indicating that summer drought events in Jiangsu Province were common.
The occurrence frequency of different levels of drought events in Jiangsu Province over the past 59 years in the spatial domain is shown in Figure 8. The frequencies of the same type of drought events occurring at each station in Jiangsu Province from 1960 to 2018 were similar. The frequency of extreme drought events at all stations did not exceed 5. The majority of stations had a frequency of moderate and mild drought events in the range of 20–34. The number of stations with a frequency of drought events in the range of 55–59 accounted for two-thirds of all stations. Comparing the severity of summer drought events within the province, the Xuyi and Xuzhou stations exhibited approximately double the frequency of moderate drought events compared with mild drought events. Conversely, the Pizhou, Guanyun, Liyang, Kunshan, and Suning stations had a higher frequency of mild drought events compared with moderate drought events. With similar overall frequencies of drought events at each station, it can be inferred that the severity of summer drought events was more pronounced at the Xuyi and Xuzhou stations than at the Pizhou, Guanyun, Liyang, Kunshan, and Suning stations. The ratio of moderate drought events to mild drought events at the other 14 stations ranged from 0.8 to 1.3, with little difference. Therefore, the severity of the summer drought was similar. The occurrence frequency of summer drought events in Jiangsu Province displayed a relatively even spatial distribution.

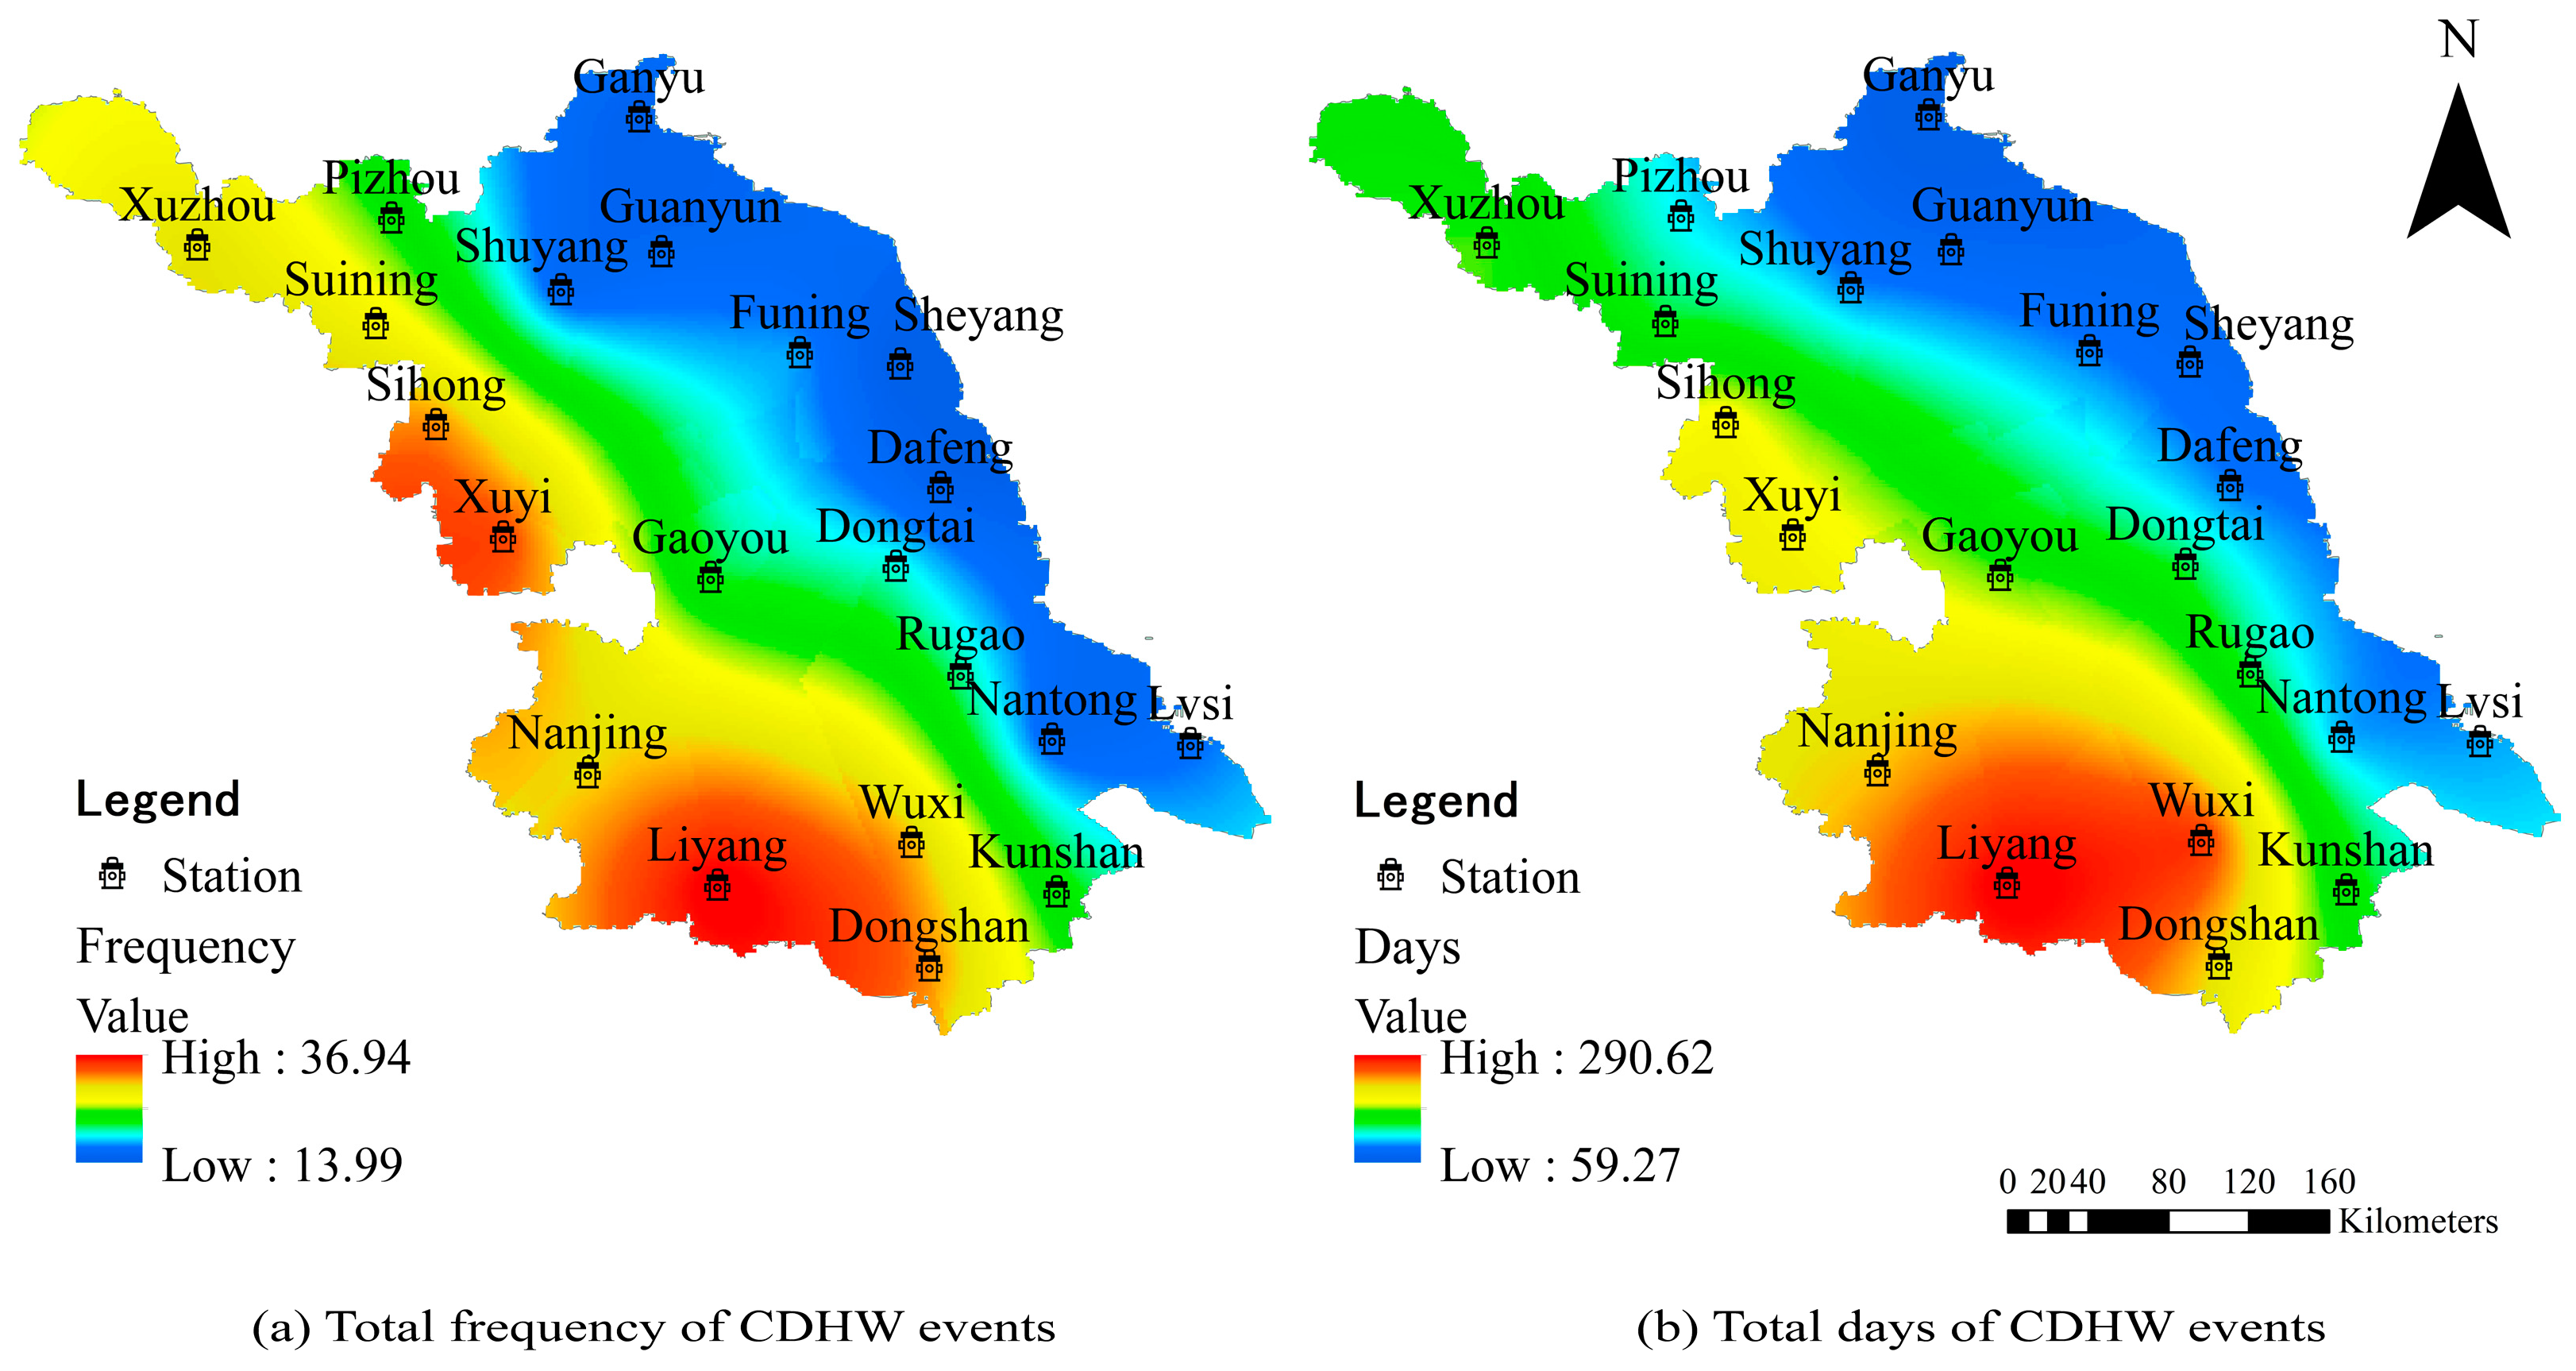
4.4. Spatial and Temporal Variations in Summer Compound Drought and Heatwave ESvents in Jiangsu Province

The changing characteristics of compound drought and heatwave (CDHW) events in Jiangsu Province are depicted in Figure 9 based on the annual statistics. Through an analysis of the interannual variation trend of such events from 1960 to 2018, it was observed that the average frequency fluctuated between 0 and 2.5 occurrences per year over the six decades analyzed. Most years had an average frequency of less than 1, suggesting that not all stations experienced CDHW events each year. Notably, in 2006, the Liyang station witnessed five instances of CDHW events, whereas other stations in the province did not experience such incidents. The average duration of these events ranged from 0 to 17 days, with the longest average duration occurring in 1966 lasting for 17 days. Moreover, CDHW events were more frequent during the summer between 1990 and 2018 compared with the preceding 30 years. This finding aligns with the increasing trend in the frequency of heatwave and drought events observed in recent years in Jiangsu Province. It indicates that a CDHW event is an intersection of heatwave and drought, and their variation is influenced by changes in both factors. The MK trend test did not reveal any statistically significant changes in the time series of CDHW events displayed in Figure 8.
The spatial distribution of CDHW events during summer in Jiangsu Province is illustrated in Figure 10. Over the six decades analyzed, significant variations in the frequency and duration of these compound events across Jiangsu Province were observed. The regions with the highest occurrence were concentrated in the southeast of the province. The longest recorded event took place from 8 July to 17 August in 2013 at the Wuxi station, lasting for 41 days. The second-longest event occurred in Nanjing and Liyang in 1966, spanning 27 days. Conversely, the regions with the lowest occurrence were mainly situated in the eastern coastal area. The frequency and duration of these CDHW events displayed an increasing trend from the southwest to the northeast, consistent with the overall spatial distribution of heatwave events and high-temperature days in Jiangsu Province. It is worth noting that drought events play a significant role in the occurrence of CDHW events. According to statistics, the total frequency of CDHW events that occurred under mild drought conditions at all sites was 180, while the total frequency of CDHW events that occurred under moderate drought conditions was 280, which was significantly higher than the former.

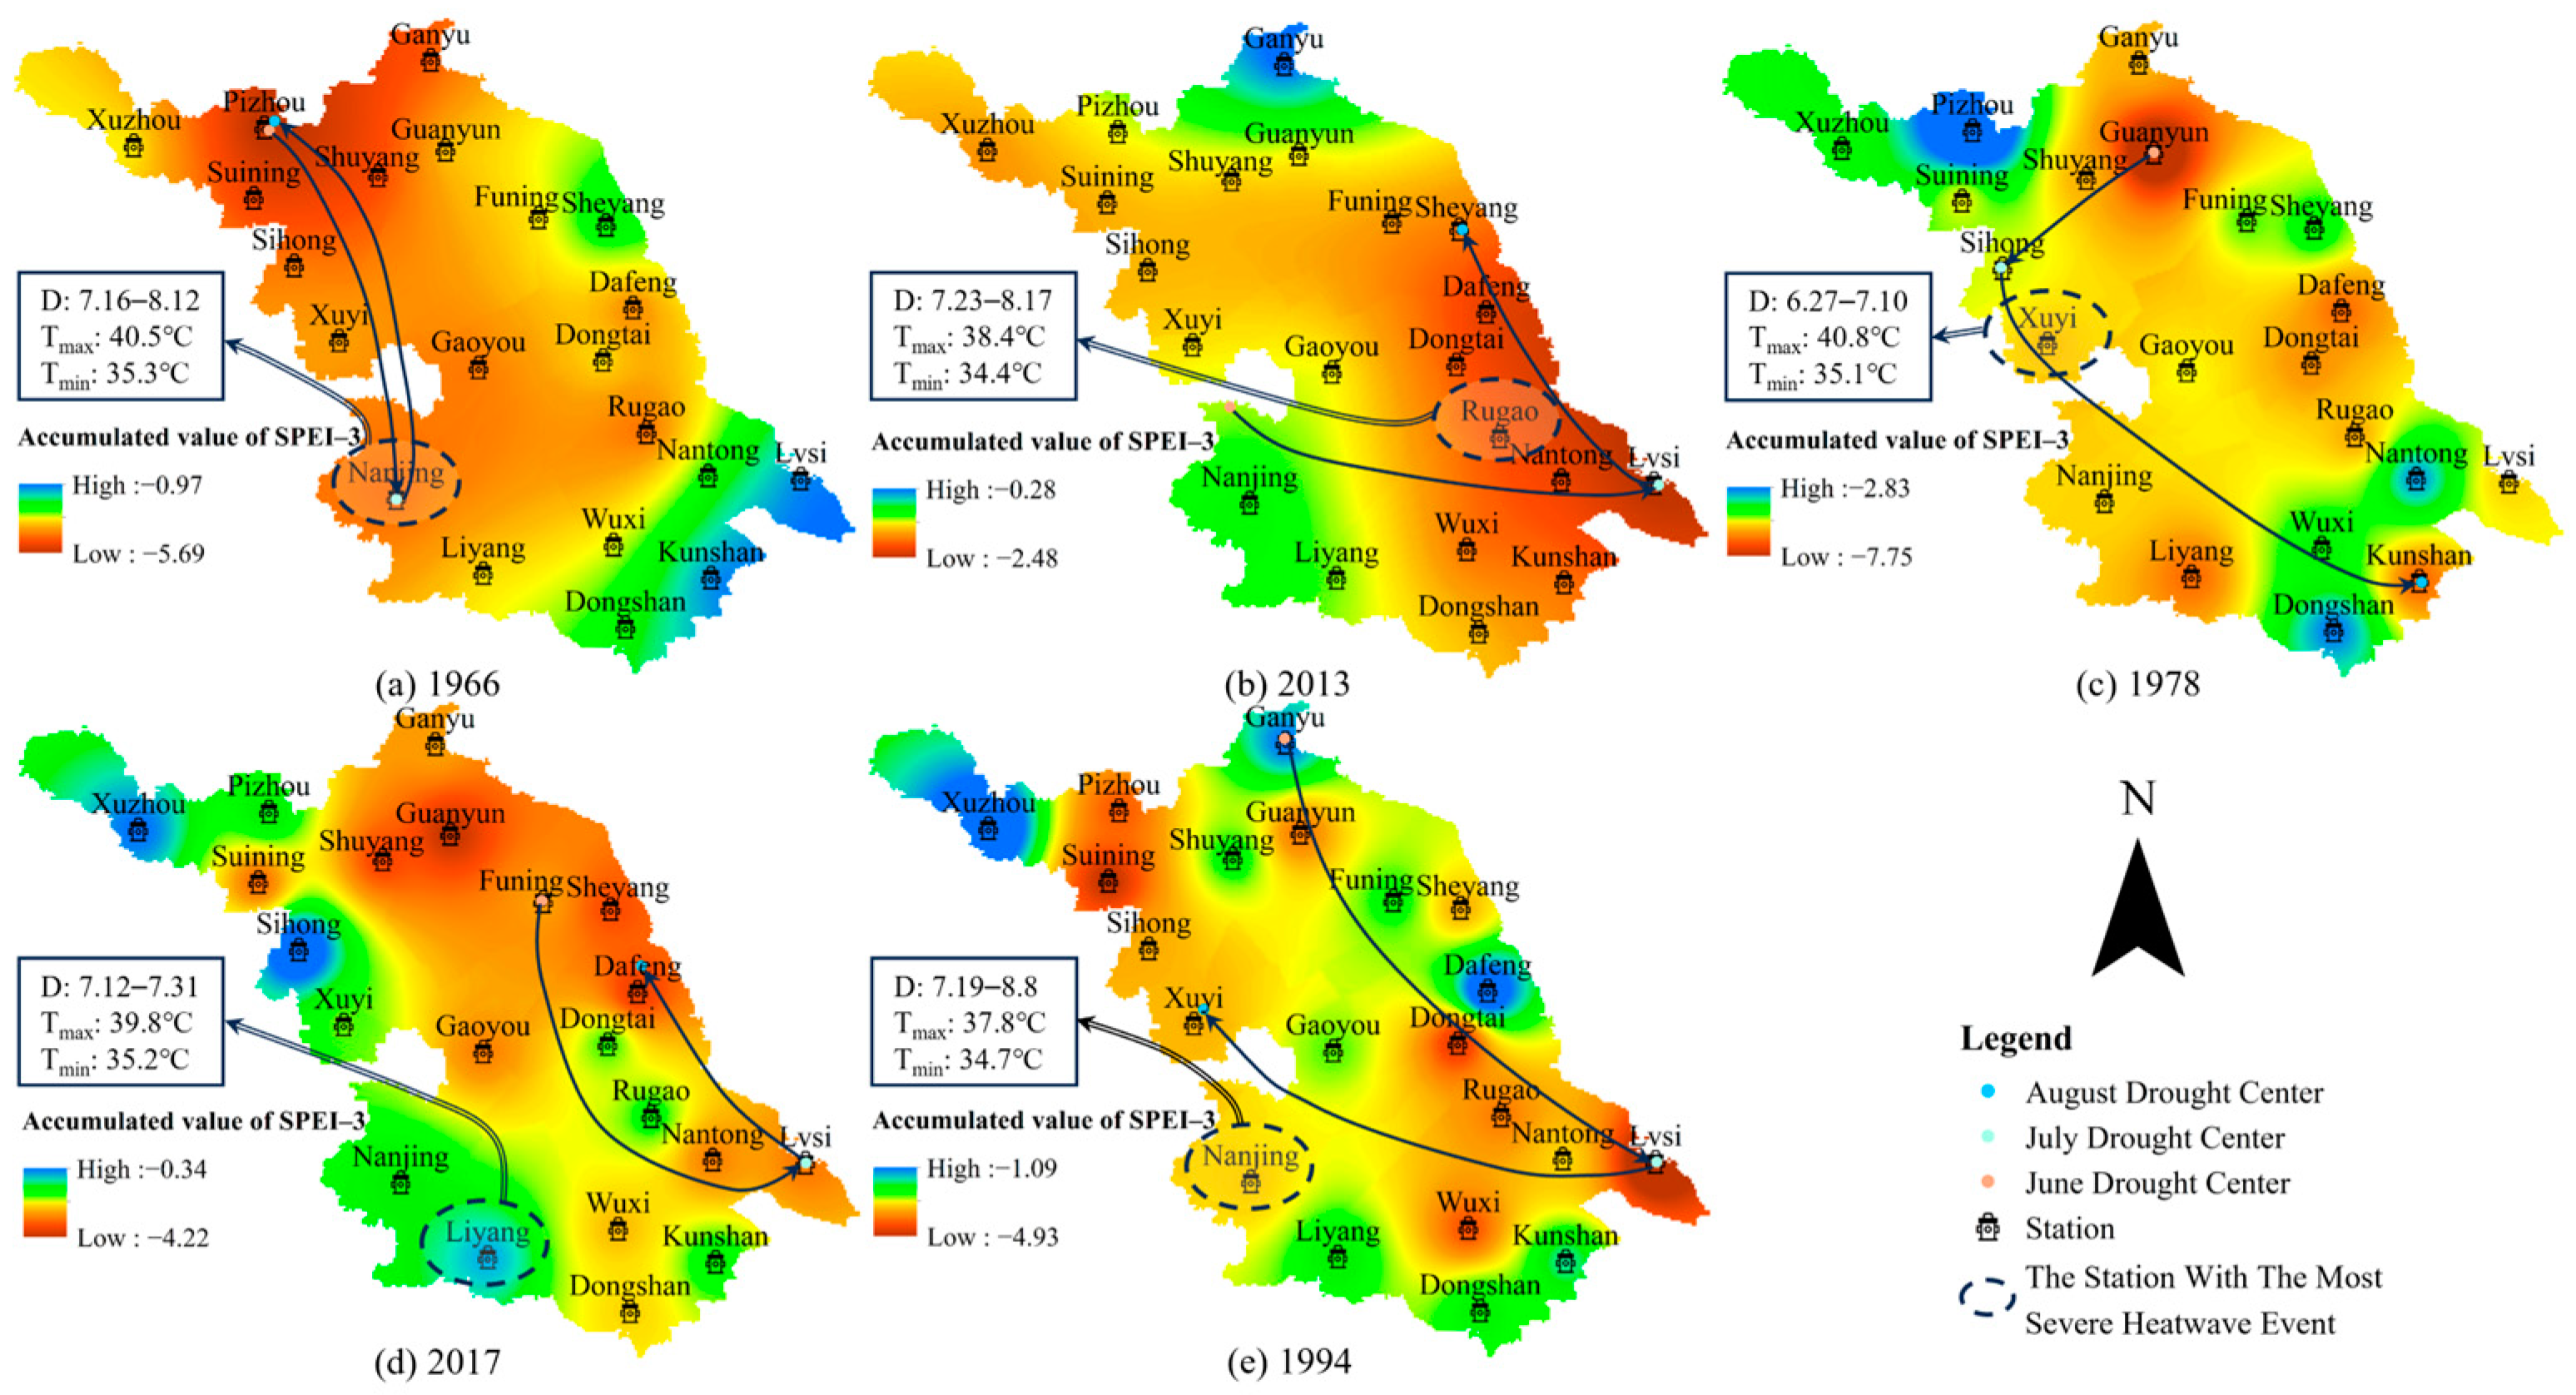
4.5. The Disaster Situation in Years with Severe Occurrences of Compound Drought and Heatwave Events in the Summer in Jiangsu Province

The top five years with the highest frequency of occurrence and longest duration of CDHW events in Jiangsu Province from 1960 to 2018 were selected for in-depth discussion based on the calculation results. This selection was guided by Figure 8. The severe years of CDHW events were compiled and are presented in Table 2. These results were further verified by conducting thorough searches in the China Meteorological Disasters Yearbook, local statistical yearbooks, and reliable media reports.
The summer of 1966 experienced a gradual increase in temperature each month, with the highest average temperature occurring in August, reaching 33.4 °C. Throughout the entire summer, there was a notable drought, particularly in July and August. In July 2013, there was a remarkable rise of 6 °C in the average highest temperature compared with June, resulting in a temperature of 34.22 °C [35]. The average highest temperature in August remained consistent with that of July, making it the highest among the summer data collected over five years. The drought severity notably intensified in August, reaching a moderate level across the entire province. In 1978, the highest average summer temperature exceeded 30 °C across the province, alongside a standardized precipitation evaporation index of approximately-2. During this period, heatwave and drought conditions were particularly severe. In both June and July of 2017, the standardized precipitation evapotranspiration index (SPEI) values were low, falling below −1. Specifically, July recorded the highest average temperature for the entire summer, reaching 34.33 °C [36]. In 1994, both July and August experienced moderate drought province-wide, with temperatures exceeding 32 °C. These five years demonstrated a higher frequency and longer duration of CDHW events.
In the five years of research in Jiangsu Province, the month with the most severe occurrence of CDHW events was the month with the highest level of drought severity and highest average monthly temperature. The most severe month for CDHW events and the second-most severe month always occurred consecutively. The continuity in the time scale of heatwave events and drought events was reflected in the timing of CDHW events.
We identified the 5 years with the most severe compound drought and heatwave events: 1966, 2013, 1978, 2017, and 1994. We then calculated the monthly drought center and summer accumulated SPEI-3 values and plotted them. The characteristics of the most severe compound drought and heatwave events in Jiangsu Province and the drought conditions during the summer of that year are shown in Figure 11. Comparing Figure 11a–e, the drought was most severe in 1987, while the drought in 2013 was relatively mild. Drought events in all five years were widespread and had a significant impact. The compound heat and drought events in 1966, 2013, 1978, and 1994 occurred near the drought center. In July 2017, the Liyang Station experienced a 20-day heatwave event, and there was moderate drought during the same period. Therefore, it was identified as the most severe station. However, Liyang experienced a transition from drought to flooding in August, and thus, the accumulated SPEI-3 value was not high.

5. Discussion

This study analyzed the spatio-temporal characteristics of heatwaves, droughts, and compound drought and heatwave events in Jiangsu Province over the 60 years analyzed based on the absolute threshold method and SPEI index. Heatwave events at most sites in Jiangsu Province showed a significant increasing trend, and there was a large regional difference in the annual average number of high-temperature days in Jiangsu Province, with the number and frequency of high-temperature days showing a clear increasing trend from the northeastern coastal regions to the southwestern part of the province, namely, the Sunan area. This indicates that in addition to the influence of latitude [37], the spatial variation in summer temperatures in Jiangsu was significantly influenced by both the location relative to the sea and the terrain. Jiangsu Province was predominantly influenced by the southeastern monsoon in summer, with smaller temperature differences in the eastern coastal areas, which led to a lower probability of high-temperature events compared with inland areas. At the same location, hill temperatures were generally higher than in the plains during spring and summer [38]. As the hills in Jiangsu are concentrated in the southeastern part of the province, the summer temperatures there were the highest. Although there was a yearly increasing trend in summer temperatures, there was also a trend toward increased precipitation over the 60 years analyzed, which means that the inter-annual variation in drought events was not obvious. From 1990 to 2018, compound drought and heatwave events occurred more frequently in the summers of Jiangsu than in the preceding 30 years, which was consistent with the observed trend of increasing frequency of high-temperature events in the province in recent years. In recent years, the compound drought and heatwave events in most regions of China, much like the interannual variation trend in Jiangsu Province, also showed an increasing trend, particularly in the Northeast and North China regions where the changes were more pronounced. The occurrence range of compound drought and heatwave events also expanded further in regions such as South China and Southwest China [39].
According to the duration of the heatwave events, the drought events corresponding to the top 5 severe years of compound heat and drought events had a wide range and significant impact. In addition, except for the year 2017, all the compound heat and drought events occurred near the drought center, indicating a correlation between heatwave events and drought events [40]. This further confirmed the reliability of the drought event selection in this study. The research on compound drought and heatwave events on the one hand reflected the consistent characteristics between heatwave events and high-temperature events, and on the other hand, it compensated for the insufficiency that the risk of composite disaster events was underestimated by the simple superposition of single disaster events.
Due to the lack of data, this study was not able to explore the compound drought and heatwave events on a larger scale. This paper preliminarily discusses the spatial and temporal distribution characteristics and the interannual variation trend of compound drought and heatwave events in Jiangsu Province, and the mechanism and causes of their occurrence need further research.

6. Conclusions

Based on measurements of precipitation, temperature, and other meteorological variables collected from 21 meteorological stations in Jiangsu Province during the summer seasons from 1960 to 2018, this study employed the absolute threshold method to identify heatwaves and the standardized precipitation evapotranspiration index to analyze drought processes. This study examined the spatial and temporal trends in the evolution of heatwaves and droughts. Furthermore, it investigated the distribution characteristics of concurrent heatwave and drought events in Jiangsu Province, leading to the following conclusions:
(1)
The average annual maximum temperature in Jiangsu Province showed an increasing trend from 1960 to 2018. The number of days with a temperature above 35 °C also significantly increased. There were significant spatial variations in the annual average number of hot days across the entire province, with both the number of hot days and the frequency of heatwaves exhibiting a clear increasing trend from the northeastern coastal region to the southwestern region of Jiangsu Province.
(2)
The frequency of extreme droughts in the province was relatively low over the 60 years analyzed and was mainly concentrated in the summer of 1978 and from 1969 to 2018. The occurrences of mild and moderate drought events showed an increasing trend over time. The SPEI identified a total of more than one-third of the study period as months with drought events. The frequencies of drought events at various stations in Jiangsu Province were similar, with no significant spatial differences.
(3)
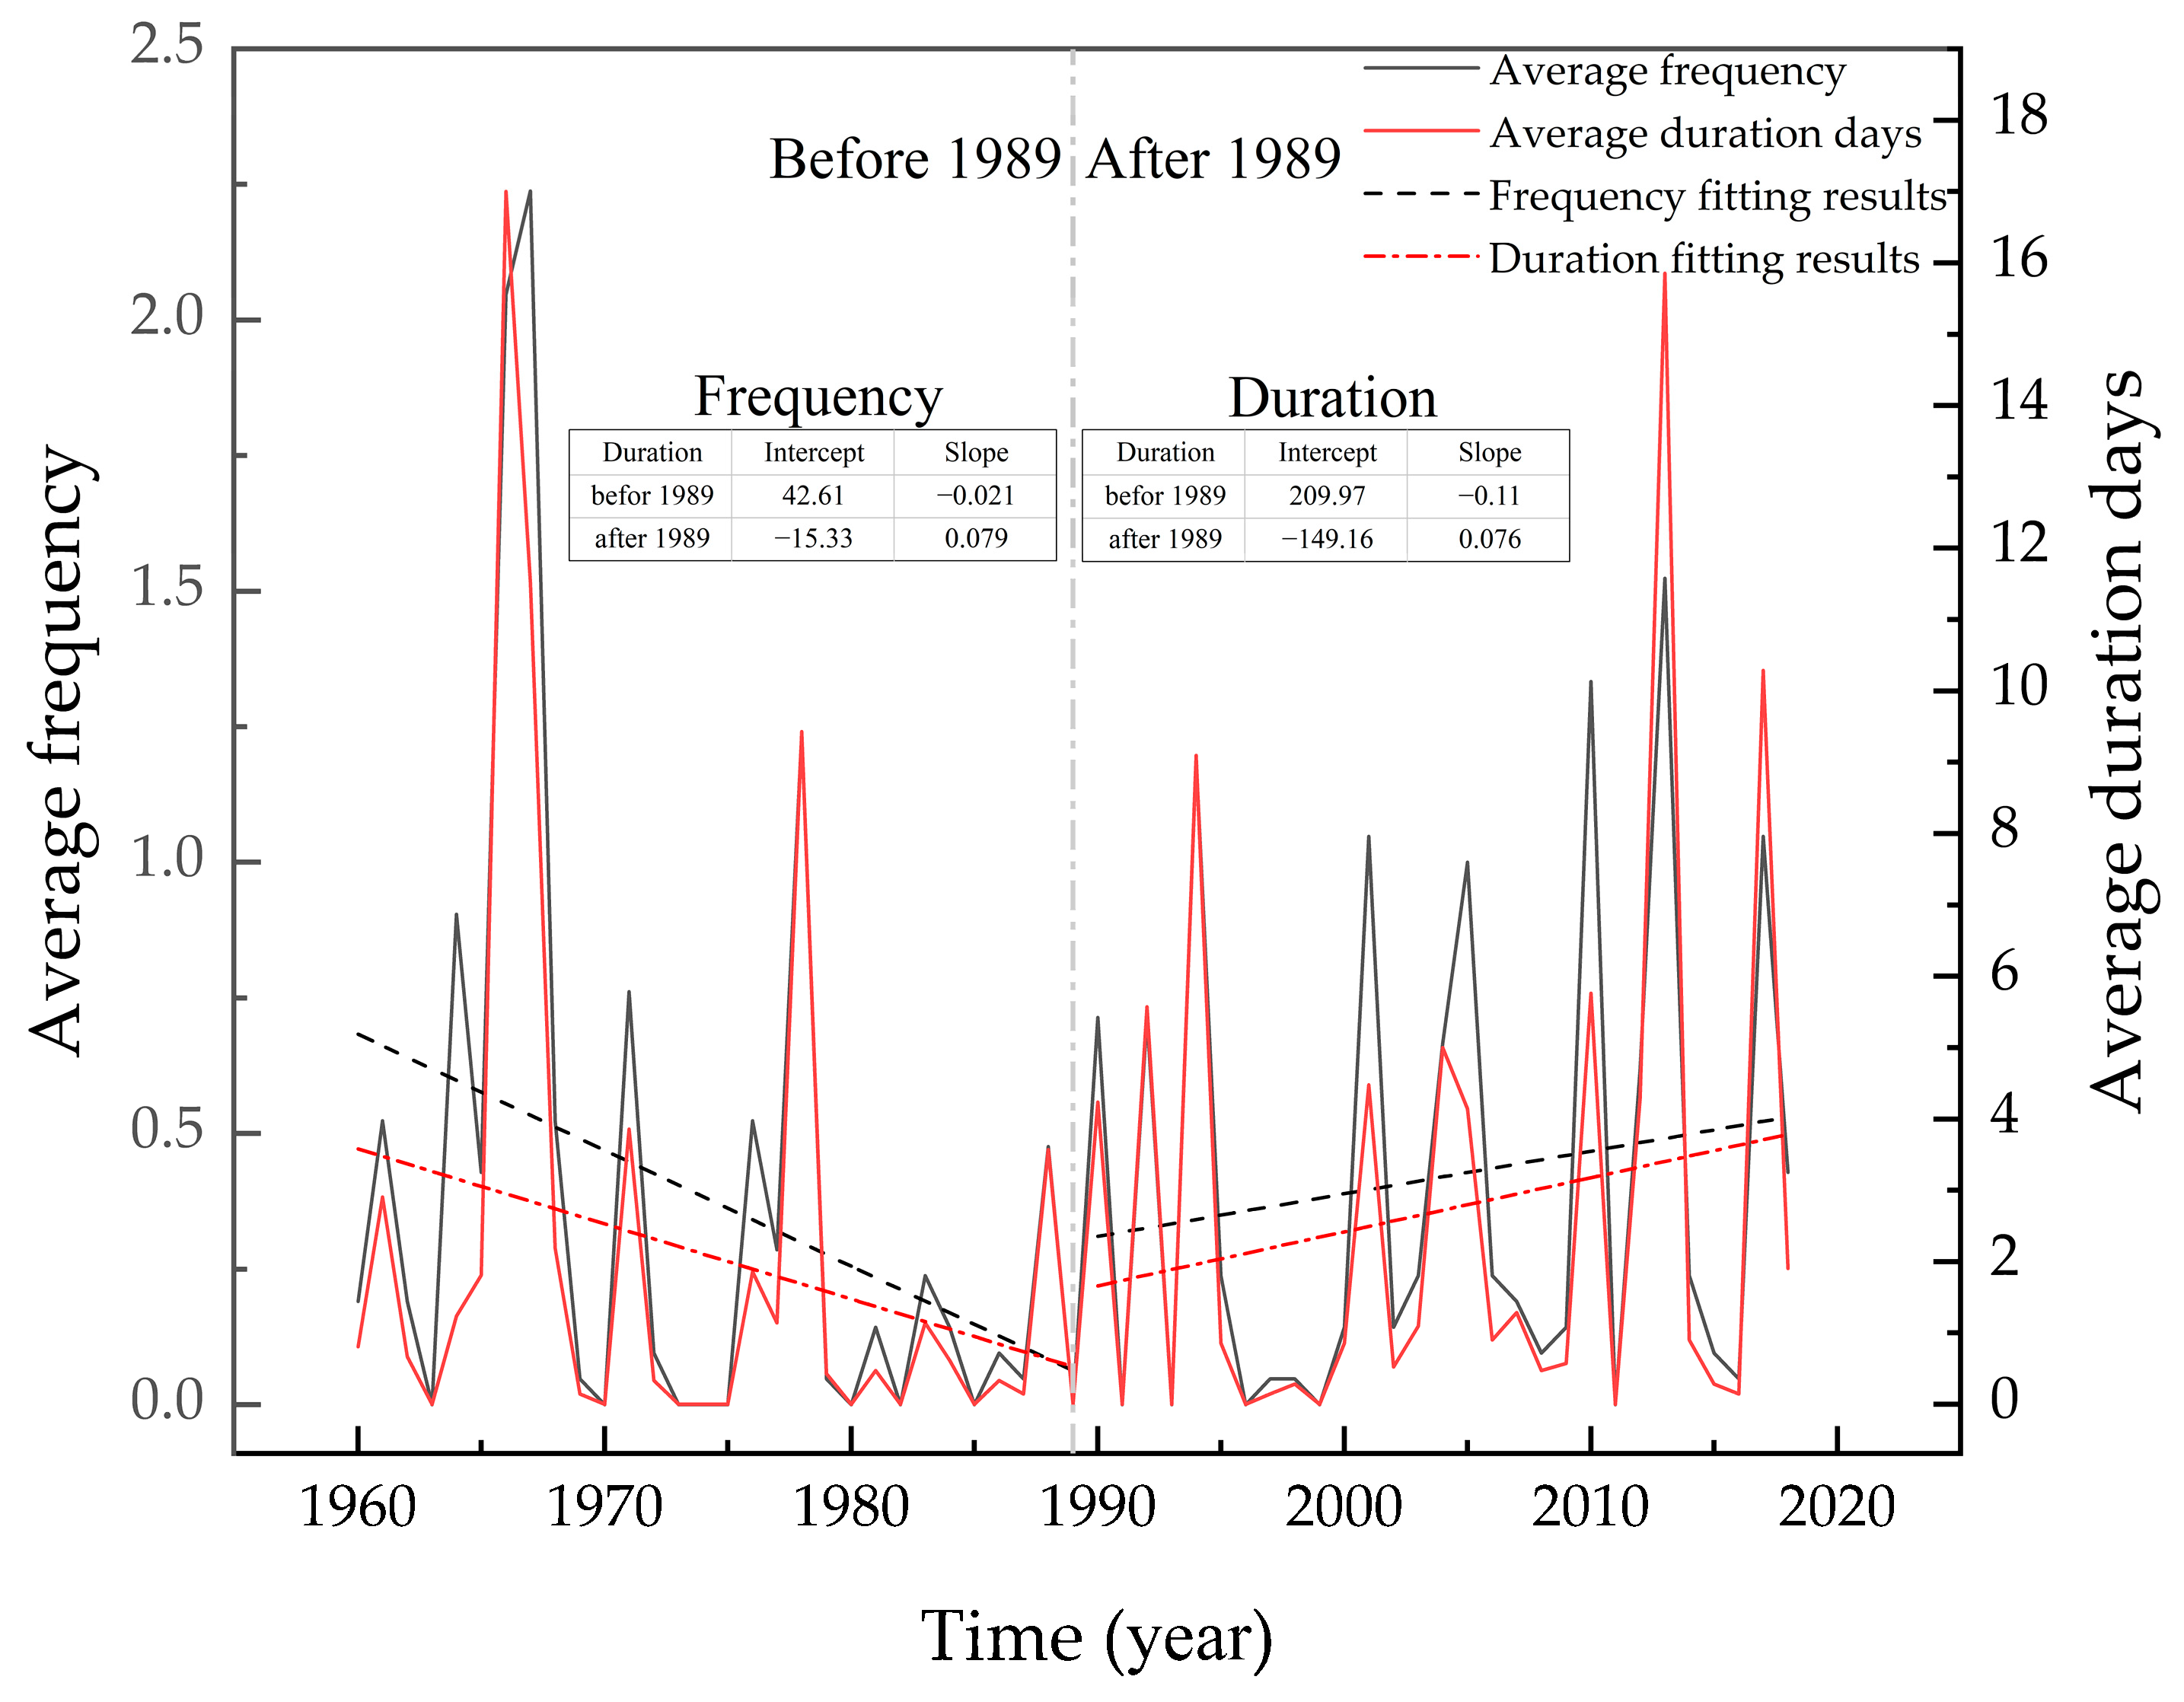
The frequency of summer CDHW events in Jiangsu Province increased significantly from 1990 to 2018 compared with the previous 30 years. There was a clear trend of increasing frequency and duration of these CDHW events from the southwest to the northeast in the province, which aligned with the overall spatial distribution characteristics of heatwave events and high-temperature days. Moreover, it was found that the total frequency of CDHW events was higher under moderate drought conditions compared with mild drought conditions.
This study mainly considered the spatiotemporal variation patterns of heatwave events, drought events, and compound drought and heatwave events in Jiangsu Province from 1960 to 2018 and carried out disaster statistical analysis for the five years with the most severe compound drought and heatwave events. Future work hopes to further study the causes of these three types of disaster events so that relevant departments can assess the severity of conditions leading to disasters through compound hot–dry events and carry out risk avoidance.

Author Contributions

Conceptualization, methodology and analysis, W.W. and J.W.; data collection, figure creation and writing, W.W. and J.S.; historical disaster investigation and statistics, B.W. and H.L. All authors have read and agreed to the published version of the manuscript.

Funding

This research was supported by the Priority Academic Program Development of Jiangsu Higher Education Institutions (PAPD), the Graduate Research and Innovation Projects of Jiangsu Province (No.KYCX23_3547), and the Science and Technology Innovation Fund of Yangzhou University (No.135030607).

Data Availability Statement

The data used during the study appear in the submitted article.

Conflicts of Interest

The authors declare no conflict of interest.

References

  1. AghaKouchak, A.; Chiang, F.; Huning, L.S.; Love, C.A.; Mallakpour, I.; Mazdiyasni, O.; Moftakhari, H.; Papalexiou, S.M.; Ragno, E.; Sadegh, M. Climate extremes and compound hazards in a warming world. Annu. Rev. Earth Planet. Sci. 2020, 48, 519–548. [Google Scholar] [CrossRef]
  2. Ridder, N.N.; Ukkola, A.M.; Pitman, A.J.; Perkins-Kirkpatrick, S.E. Increased occurrence of high impact compound events under climate change. NPJ Clim. Atmos. Sci. 2022, 5, 3. [Google Scholar] [CrossRef]
  3. Zscheischler, J.; Westra, S.; van den Hurk, B.J.J.M.; Seneviratne, S.I.; Ward, P.J.; Pitman, A.; AghaKouchak, A.; Bresch, D.N.; Leonard, M.; Wahl, T. Future climate risk from compound events. Nat. Clim. Chang. 2018, 8, 469–477. [Google Scholar] [CrossRef]
  4. McMichael, A.J.; Woodruff, R.E.; Hales, S. Climate change and human health: Present and future risks. Lancet 2006, 367, 859–869. [Google Scholar] [CrossRef]
  5. Meehl, G.A.; Tebaldi, C. More intense, more frequent, and longer lasting heat waves in the 21st century. Science 2004, 305, 994–997. [Google Scholar] [CrossRef] [PubMed]
  6. Wang, W.; Zhou, W.; Li, X.; Wang, X.; Wang, D. Synoptic-scale characteristics and atmospheric controls of summer heat waves in China. Clim. Dyn. 2016, 46, 2923–2941. [Google Scholar] [CrossRef]
  7. Xu, Z.; FitzGerald, G.; Guo, Y.; Jalaludin, B.; Tong, S.L. Impact of heatwave on mortality under different heatwave definitions: A systematic review and meta-analysis. Environ. Int. 2016, 89–90, 193–203. [Google Scholar] [CrossRef]
  8. Sun, Y.; Zhang, X.; Zwiers, F.W.; Song, L.; Wan, H.; Hu, T.; Yin, H.; Ren, G. Rapid increase in the risk of extreme summer heat in Eastern China. Nat. Clim. Chang. 2014, 4, 1082–1085. [Google Scholar] [CrossRef]
  9. Li, Y.; Li, Y. Advances in Adaptability of Meteorological Drought Indices in China. J. Arid. Meteorol. 2017, 35, 709–723, (In Chinese with English abstract). [Google Scholar]
  10. Li, J.; Wang, Z.; Wu, X.; Zscheischler, J.; Guo, S.; Chen, X. A standardized index for assessing sub-monthly compound dry and hot conditions with application in China. Hydrol. Earth Syst. Sci. 2021, 25, 1587–1601. [Google Scholar] [CrossRef]
  11. Mukherjee, S.; Mishra, K.A. Increase in Compound Drought and Heatwaves in a Warming World. Geophys. Res. Lett. 2021, 48, e2020GL090617. [Google Scholar] [CrossRef]
  12. Mishra, V.; Thirumalai, K.; Singh, D.; Aadhar, S. Future exacerbation of hot and dry summer monsoon extremes in India. NPJ Clim. Atmos. Sci. 2020, 3, 10. [Google Scholar] [CrossRef]
  13. Vicente-Serrano, S.M.; Beguería, S.; López-Moreno, J.I. A multiscalar drought index sensitive to global warming: The standardized precipitation evapotranspiration index. J. Clim. 2010, 23, 1696–1718. [Google Scholar] [CrossRef]
  14. Beguería, S.; Vicente-Serrano, S.M.; Reig, F.; Latorre, B. Standardized Precipitation Evapotranspiration Index (SPEI) revisited: Parameter fitting, evapotranspiration models, kernel weighting, tools, datasets and drought monitoring. Int. J. Climatol. 2014, 34, 3001–3023. [Google Scholar] [CrossRef]
  15. Wang, J.; Lin, H.; Huang, J.; Jiang, C.; Xie, Y.; Zhou, M. Variations of drought tendency, frequency, and characteristics and their responses to climate change under CMIP5 RCP scenarios in Huai River Basin, China. Water 2019, 11, 2174. [Google Scholar] [CrossRef]
  16. Mazdiyasni, O.; AghaKouchak, A. Substantial increase in concurrent droughts and heatwaves in the United States. Proc. Natl. Acad. Sci. USA 2015, 112, 11484–11489. [Google Scholar] [CrossRef] [PubMed]
  17. Ciais, P.; Reichstein, M.; Viovy, N.; Granier, A.; Ogée, J.; Allard, V.; Aubinet, M.; Buchmann, N.; Bernhofer, C.; Carrara, A.; et al. Europe-wide reduction in primary productivity caused by the heat and drought in 2003. Nature 2005, 437, 529–533. [Google Scholar] [CrossRef]
  18. Kirono, D.G.C.; Hennessy, K.J.; Grose, M.R. Increasing risk of months with low rainfall and high temperature in southeast Australia for the past 150 years. Clim. Risk Manag. 2017, 16, 10–21. [Google Scholar] [CrossRef]
  19. Espinosa, L.A.; Portela, M.M.; Matos, J.P.; Gharbia, S. Climate Change Trends in a European Coastal Metropolitan Area: Rainfall, Temperature, and Extreme Events (1864–2021). Atmosphere 2022, 13, 1995. [Google Scholar] [CrossRef]
  20. Zhao, L.; Li, X.; Zhang, Z.; Yuan, M.; Sun, S.; Qu, S.; Hou, M.; Lu, D.; Zhou, Y.; Lin, A. Develope a novel framework to re-examine half a century of compound drought and heatwave events in mainland China. Sci. Total Environ. 2023, 874, 162366. [Google Scholar] [CrossRef]
  21. Liu, M.; Yin, Y.; Wang, X.; Ma, X.; Chen, Y.; Chen, W. More frequent, long-lasting, extreme and postponed compound drought and hot events in eastern China. J. Hydrol. 2022, 614, 128499. [Google Scholar] [CrossRef]
  22. Kong, Q.; Guerreiro, S.B.; Blenkinsop, S.; Li, X.; Fowler, H.J. Increases in summertime concurrent drought and heatwave in Eastern China. Weather Clim. Extrem. 2020, 28, 100242. [Google Scholar] [CrossRef]
  23. Yu, R.; Zhai, P. More frequent and widespread persistent compound drought and heat event observed in China. Sci. Rep. 2020, 10, 14576. [Google Scholar] [CrossRef] [PubMed]
  24. Mei, M.; Gao, G.; Li, Y.; Wang, G.; Dai, T.; Chen, Y. Change characteristics in compound high temperature and drought extreme events over Yangtze River Basin from 1961 to 2022. Yangtze River 2023, 54, 12–20, (In Chinese with English abstract). [Google Scholar]
  25. Gu, S.; Huang, C.; Bai, L.; Chu, C.; Liu, Q. Heat-related illness in China, summer of 2013. Int. J. Biometeorol. 2016, 60, 131–137. [Google Scholar] [CrossRef] [PubMed]
  26. Chen, K.; Horton, R.M.; Bader, D.A.; Lesk, C.; Jiang, L.; Jones, B.; Zhou, L.; Chen, X.; Bi, J.; Kinney, P.L. Impact of climate change on heat-related mortality in Jiangsu Province, China. Environ. Pollut. 2017, 224, 317–325. [Google Scholar] [CrossRef] [PubMed]
  27. Gong, Y.; Hu, N.; Liu, G.; Wu, M. Research on seasonal drought characteristics and its dynamic drought risk assessment of five cities in northern Jiangsu Province. Agric. Res. Arid Areas 2016, 34, 275–281, (In Chinese with English abstract). [Google Scholar]
  28. You, Q.; Jiang, Z.; Kong, L.; Wu, Z.; Bao, Y.; Kang, S.; Pepin, N. A comparison of heat wave climatologies and trends in China based on multiple definitions. Clim. Dyn. 2017, 48, 3975–3989. [Google Scholar] [CrossRef]
  29. Yang, J.; Yin, P.; Sun, J.; Wang, B.; Zhou, M.; Li, M.; Tong, S.; Meng, B.; Guo, Y.; Liu, Q. Heatwave and mortality in 31 major Chinese cities: Definition, vulnerability and implications. Sci. Total Environ. 2019, 649, 695–702. [Google Scholar] [CrossRef]
  30. Liu, T.; Zhu, X.; Sun, S.; Zhang, S.; Guo, R.; Xu, K. Impact of threshold selection on the spatiotemporal change characteristics of high temperature. Sci. Geogr. Sin. 2023, 43, 726–736, (In Chinese with English abstract). [Google Scholar]
  31. Tirivarombo, S.; Osupile, D.; Eliasson, P. Drought monitoring and analysis: Standardised precipitation evapotranspiration index (SPEI) and standardised precipitation index (SPI). Phys. Chem. Earth 2018, 106, 1–10. [Google Scholar] [CrossRef]
  32. Allen, R.; Pereira, L.; Raes, D.; Smith, M. Crop Evapotranspiration-Guidelines for Computing Crop Water Requirements-FAO Irrigation and Drainage Paper 56; FAO: Rome, Italy, 1998; Volume 300, p. D05109. [Google Scholar]
  33. Hamed, K.H. Trend detection in hydrologic data: The Mann–Kendall trend test under the scaling hypothesis. J. Hydrol. 2008, 349, 350–363. [Google Scholar] [CrossRef]
  34. Perkins, E.S. A review on the scientific understanding of heatwaves—Their measurement, driving mechanisms, and changes at the global scale. Atmos. Res. 2015, 164–165, 242–267. [Google Scholar] [CrossRef]
  35. Xia, J.; Tu, K.; Yan, Z.; Qi, Y. The super-heat wave in eastern China during July–August 2013, a perspective of climate change. Int. J. Climatol. 2016, 36, 1291–1298. [Google Scholar] [CrossRef]
  36. Zhou, C.; Wang, K.; Qi, D.; Tan, J. Attribution of a record-breaking heatwave event in summer 2017 over the Yangtze River delta. Bull. Am. Meteorol. Soc. 2019, 100, S97–S103. [Google Scholar] [CrossRef]
  37. Fischer, E.; Schär, C. Consistent geographical patterns of changes in high-impact European heatwaves. Nat. Geosci. 2010, 3, 398–403. [Google Scholar] [CrossRef]
  38. Wang, F.; Wang, Y. Potential role of local contributions to record-breaking high-temperature event in Xiamen, China. Weather Clim. Extrem. 2021, 33, 100338. [Google Scholar] [CrossRef]
  39. Liao, G.; Zhu, Y.; Wu, G.; Wang, W.; Liu, Y.; Zhu, L. Evolution Characteristics of Droughts and Heat Waves in China during the Past 60 Years. J. Yangtze River Sci. Res. Inst. 2023, 40, 169–176, (In Chinese with English abstract). [Google Scholar]
  40. Sutanto, J.; Vitolo, C.; Napoli, D.; D’Andrea, M.; Van Lanen, H. Heatwaves, droughts, and fires: Exploring compound and cascading dry hazards at the pan-European scale. Environ. Int. 2020, 134, 105276. [Google Scholar] [CrossRef]
Figure 1. Location of Jiangsu Province and selected meteorological stations.
Water 16 00089 g001
Figure 2. Technology road map of this study.
Water 16 00089 g002
Figure 3. Characteristic changes in summer temperatures in Jiangsu Province from 1960 to 2018.
Water 16 00089 g003
Figure 4. Variation curve of summer precipitation in Jiangsu Province from 1960 to 2018.
Water 16 00089 g004
Figure 5. Change in summer days with high temperatures in the Jiangsu region from 1960 to 2018.
Water 16 00089 g005
Figure 6. Distribution of heatwave frequency and high-temperature days at various stations in Jiangsu Province. Notes: * indicates that the site has passed the significance level test of α = 0.1 and ** indicates that the site has passed the significance level test of α = 0.05.
Water 16 00089 g006
Figure 7. Interannual variations in summer drought events in Jiangsu Province from 1960 to 2018. Notes: red-brown represents extreme drought occurring in the month, orange represents moderate drought occurring in the month, and yellow represents mild drought occurring in the month.
Water 16 00089 g007
Figure 8. Total frequency of drought events by different types in Jiangsu Province.
Water 16 00089 g008
Figure 9. Variation characteristics of CDHW events in Jiangsu Province from 1960 to 2018.
Water 16 00089 g009
Figure 10. Spatial distribution of summer CDHW events in Jiangsu Province.
Water 16 00089 g010
Figure 11. The distribution of SPEI accumulation intensity and drought trajectory in Jiangsu Province in 1966, 2013, 1978, 2017, and 1994.
Water 16 00089 g011
Table 1. Classification of drought levels based on SPEI.
Drought LevelsExtreme DroughtModerate DroughtMild DroughtNormal
SPEI(−∞, −2.0](−2.0, −1.0](−1.0, −0.5](−0.5, 0]
Table 2. Years with severe compound drought and heatwave events.
YearFrequency and Duration
(Times/Days)
MonthAverage Maximum Temperature
(°C)
SPEIThe Most Severe Station and Its DurationSituation
19662.05/17.00June29.13−0.73Nanjing
7.16–8.12
28 days
During July and August, there was a prolonged heatwave that lasted over a month, with the highest temperature reaching 41 °C and surface temperatures ranging from 50 to 60 °C. The Yangtze River experienced its lowest water level in 26 years. In the Jianghuai region, the total affected area reached 711,300 hectares, with 210,700 hectares being seriously affected.
July (○)32.05−1.26
August (√)33.40−1.66
Average29.13−1.22
20131.52/15.86June28.07−0.12Rugao
7.23–8.17
26 days
In most parts of Jiangsu Province, the precipitation was below average. The hot and dry weather led to high evaporation rates in farmlands, resulting in soil moisture deficiency or drought conditions in some areas. The drought affected a total of 2.834 million people, with 223,000 hectares of crops damaged and a direct economic loss of USD 152 million.
July (○)34.22−0.20
August (√)34.19−1.13
Average32.16−0.48
19781.24/9.43June (○)30.61−1.99Xuyi
6.27–7.10
14 days
The total affected area of the province reached a maximum of 3,868,000 hectares, with a disaster-stricken area of 889,300 hectares. The annual inflow volume of water into Hongze Lake decreased to 3.048 billion cubic meters, only one-tenth of the normal annual level. The lowest water level of Hongze Lake was 10.27 m (the dead water level is 11.3 m). The groundwater level was 2 to 4 m lower than usual. The drought area in the Yangtze River basin was 9,417,000 hectares, with a drought rate of 25.6% and a disaster rate of 15.7%.
July (√)32.91−1.89
August32.58−1.82
Average32.03−1.90
20171.05/10.29June28.95−1.20Liyang
7.12–7.31
20 days
Electricity consumption in Jiangsu Province reached a record high in Jiangsu Province. The number of people affected by the disaster reached 1.253 million, with a total affected area of agricultural crops reaching 6283 hectares.
July (√)34.33−1.22
August (○)32.01−0.26
Average31.76−0.89
19941.19/9.10June28.99−0.31Nanjing
7.22–8.8
18 days
The total affected area in the province was 253,330 hectares, of which the severely drought-stricken area was 1,200,000 hectares. The overall direct economic losses amounted to USD 1.13 billion. There were 3.4 million people and over 1.8 million heads of large livestock facing difficulties in accessing drinking water in the province. Shipping was also greatly affected. The water level in Lake Tai dropped to 2.82 m, and the flow rate in the main stream of the Yangtze River was 10,000 cubic meters per second less than the average for the same period.
July (√)34.19−1.52
August (○)32.18−1.33
Average31.79−1.05
Notes: (√) represents the month with the most occurrences of CDHW events and (○) represents the month with the second-most occurrences of CDHW events.
Disclaimer/Publisher’s Note: The statements, opinions and data contained in all publications are solely those of the individual author(s) and contributor(s) and not of MDPI and/or the editor(s). MDPI and/or the editor(s) disclaim responsibility for any injury to people or property resulting from any ideas, methods, instructions or products referred to in the content.

