Article

Modeling Spring Maize Grain Filling under Film Mulching and Nitrogen Application in a Cold and Arid Environment

1
College of Agronomy and Agricultural Engineering, Liaocheng University, Liaocheng 252059, China
2
College of Water Conservancy and Hydropower Engineering, Gansu Agricultural University, Lanzhou 730070, China
3
Yimin Irrigation Experimental Station, Zhangye 734500, China
*
Author to whom correspondence should be addressed.
These authors contributed equally to this work and are co-first authors.
Water 2024, 16(1), 88; https://doi.org/10.3390/w16010088
Submission received: 18 October 2023 / Revised: 18 December 2023 / Accepted: 19 December 2023 / Published: 25 December 2023

Abstract

:
The grain-filling process is a key stage in ensuring a high yield of maize. Nitrogen is one of the nutrient elements most essential for maize, especially in cold and arid areas. To evaluate the effects of plastic-film mulching and nitrogen application on the maize grain-filling process, the impact of different plastic-film mulching (degradable plastic film, J; common plastic-film mulching, P) and nitrogen fertilizer levels (0 kg·ha−1, N0; 160 kg·ha−1, N1; 320 kg·ha−1, N2; 480 kg·ha−1, N3) on maize grain-filling characteristic parameters and final 100-kernel weight were tested in 2021 and 2022. The results showed that the interaction between film mulching and nitrogen application significantly (p < 0.05) affected the filling characteristic parameters and final 100-kernel weight of maize. The final 100-kernel weight was highest at the N2 nitrogen application level, which was 7.69–38.13% higher under degradable plastic-film mulching and 3.17–38.06% higher under common plastic-film mulching than at other levels. The nitrogen application level significantly (p < 0.05) increased grain-filling duration and rate. The duration time in reaching the maximum grain-filling rate under the N2 nitrogen application level was around 1.1967–5.7835 d under degradable plastic-film mulching and 2.8688–8.1704 d under the common plastic-film mulching, with the maximum and average grain-filling rate increased by 0.0595–0.2063 g·d−1 and 0.0447–0.1423 g·d−1 under degradable film mulching and 0.1418–0.3058 g·d−1 and 0.1082–0.2125 g·d−1 under common film mulching, respectively. The nitrogen application levels of N2 and N3 under two plastic-film mulching methods prolonged the duration of the rapid and slow increase period of grain filling and increased the grain-filling rate and the average rate. The average grain-filling rate at the N2 level increased by 0.0469–0.1759 g·d−1 and 0.0090–0.0454 g·d−1 under degradable film mulching and 0.1113–0.2581 g·d−1 and 0.0203–0.0648 g·d−1 under common film mulching, respectively. Therefore, common plastic film mainly prolonged the duration of the gradual increase period of grain filling and increased the grain-filling rate; meanwhile, the effect of degraded plastic film on the grain-filling rate increase and prolonging of the grain-filling duration was gradually highlighted during the rapid and the slow period of increase. In addition, the 320 kg·ha−1 of nitrogen application level under both common plastic-film mulching and degradable-film mulching was more conducive to prolonging the grain-filling duration of maize, which increased the grain-filling rate and 100-kernel weight, laying a foundation for a high yield of maize.

1. Introduction

Since the popularization and application of plastic-film mulching technology, it has been widely used in crop production, and the effect on increasing production and income is remarkable [1,2]. Plastic-film mulching can reduce surface soil–air–water exchange, improve crop water status [3], increase ground temperature [4], promote stable and early maturity of crops [5], prevent farmland soil erosion [6], improve nitrogen transformation and utilization [7], control soil salinity [8], and inhibit weed growth; it can thus help in addressing the problem of the low productivity of farmland in arid areas. It has become an important agronomic measure for agricultural production in arid areas. With large-scale production and use of plastic film, the quality of which is not guaranteed, the problem of plastic film or microplastic residues is increasingly prominent. The residual plastic film in tillage will change the physical structure of the soil, destroy soil aggregates [9], hinder the gas exchange between soil and atmosphere [10,11], affect the absorption of nutrients by crop roots and the movement of soil water and fertilizer [9,12], and bring serious pollution to the farmland ecological environment. In recent years, to address the problem of plastic-film residue, various environmental protection plastic films have been introduced. Degradable plastic film is considered to be an effective way of reducing the pollution of farmland residual film, because it can avoid the environmental pollution caused by ordinary polyethylene film and can reduce residual film [13,14,15,16]; its application has attracted much attention. Studies have shown that the degradation membrane will degrade into C2O and H2O under natural conditions and that the levels of degradation residue are low over time, which is less harmful to the environment [17]. At the same time, the effect of degradable film on increasing soil temperature, soil moisture, and crop yield was similar to that of ordinary film, and the difference was not significant [18]. Compared with ordinary plastic film, degradable plastic film has a positive effect on soil enzyme activity and microbial quantity; it forms a good soil structure [19,20] and is also conducive to natural rainfall infiltration, which can eliminate the harm of residual film.
Nitrogen fertilizer plays an irreplaceable role in ensuring the stable production of grain yield [21]. In particular, maize has the largest demand for nitrogen, which has a significant effect on the growth and physiology of maize [22,23]. The nitrogen content in the soil is relatively low, so it is necessary to apply nitrogen fertilizer to meet the growing needs of maize and to enhance drought resistance [24] to obtain a high yield. Relevant studies have shown that the combination of plastic-film mulching and nitrogen application can significantly increase crop yield and water use efficiency, affect soil enzyme activity, microbial community composition, and the soil nitrogen pool, and effectively increase soil microbial nitrogen and particulate organic nitrogen content, which is conducive to the sustainable development of farming systems [25,26]. However, crop yield did not increase with the increase in nitrogen fertilizer application, but instead reduced fertilizer use efficiency and caused a series of environmental pollution problems [27,28,29]. Guo et al. [30] showed that excessive nitrogen application would reduce crop yield and increase the risk of nitrate leaching. Hamani et al. [31] suggested that excessive nitrogen application would reduce the photosynthetic performance of wheat and increase the emission capacity of CO2 and N2O. Therefore, maintaining crop yield is not necessarily better with higher nitrogen fertilizer usage. Suitable nitrogen fertilizer can regulate crop growth and development, improve photosynthetic performance, and achieve high quality and a high yield of crops [32].
Grain filling is the most important stage in the process of maize growth and development. The grain-filling rate and filling time will affect the filling degree of the maize grain storage capacity and will also determine the quality and yield of maize [33]. Management measures such as nitrogen application will closely affect the development of corn grains, which in turn affects the formation of 100-grain quality. Reasonable nitrogen fertilizer application can affect the grain-filling process of corn, promote ear development, increase grain weight, and ultimately improve 100-grain quality and yield. At present, research into the process of maize grain filling mainly focuses on high temperature and drought stress [34], plant hormones [35], nitrogen fertilizer management [36], and maize varieties [37]. However, there is little research on the dynamic changes in maize grain filling when different plastic-film mulching and nitrogen application levels are combined, and logistic models [27,33] are often used for the fitting analysis of the maize grain-filling process. The logistic model is a special form of the Richards model (N = 1), which lacks plasticity and has difficulties in the biological interpretation of model parameters. The Richards model has one more parameter N, and the shape of the curve is determined by N, which is more suitable for describing the dynamic process of maize grain filling [38].
In this study, maize was used as the research object, and a combination of degradable film, plastic-film mulching, and nitrogen application level was established. The Richards model was used to fit the dynamic change process of maize grain filling. Therefore, the objectives of this study were to determine: (1) the regulation effect of different combinations of plastic-film mulching and nitrogen application level on maize grain-filling characteristics and (2) the influence of different combinations of plastic-film mulching and nitrogen application level on the maize grain-filling process and the final 100-kernel weight.

2. Materials and Methods

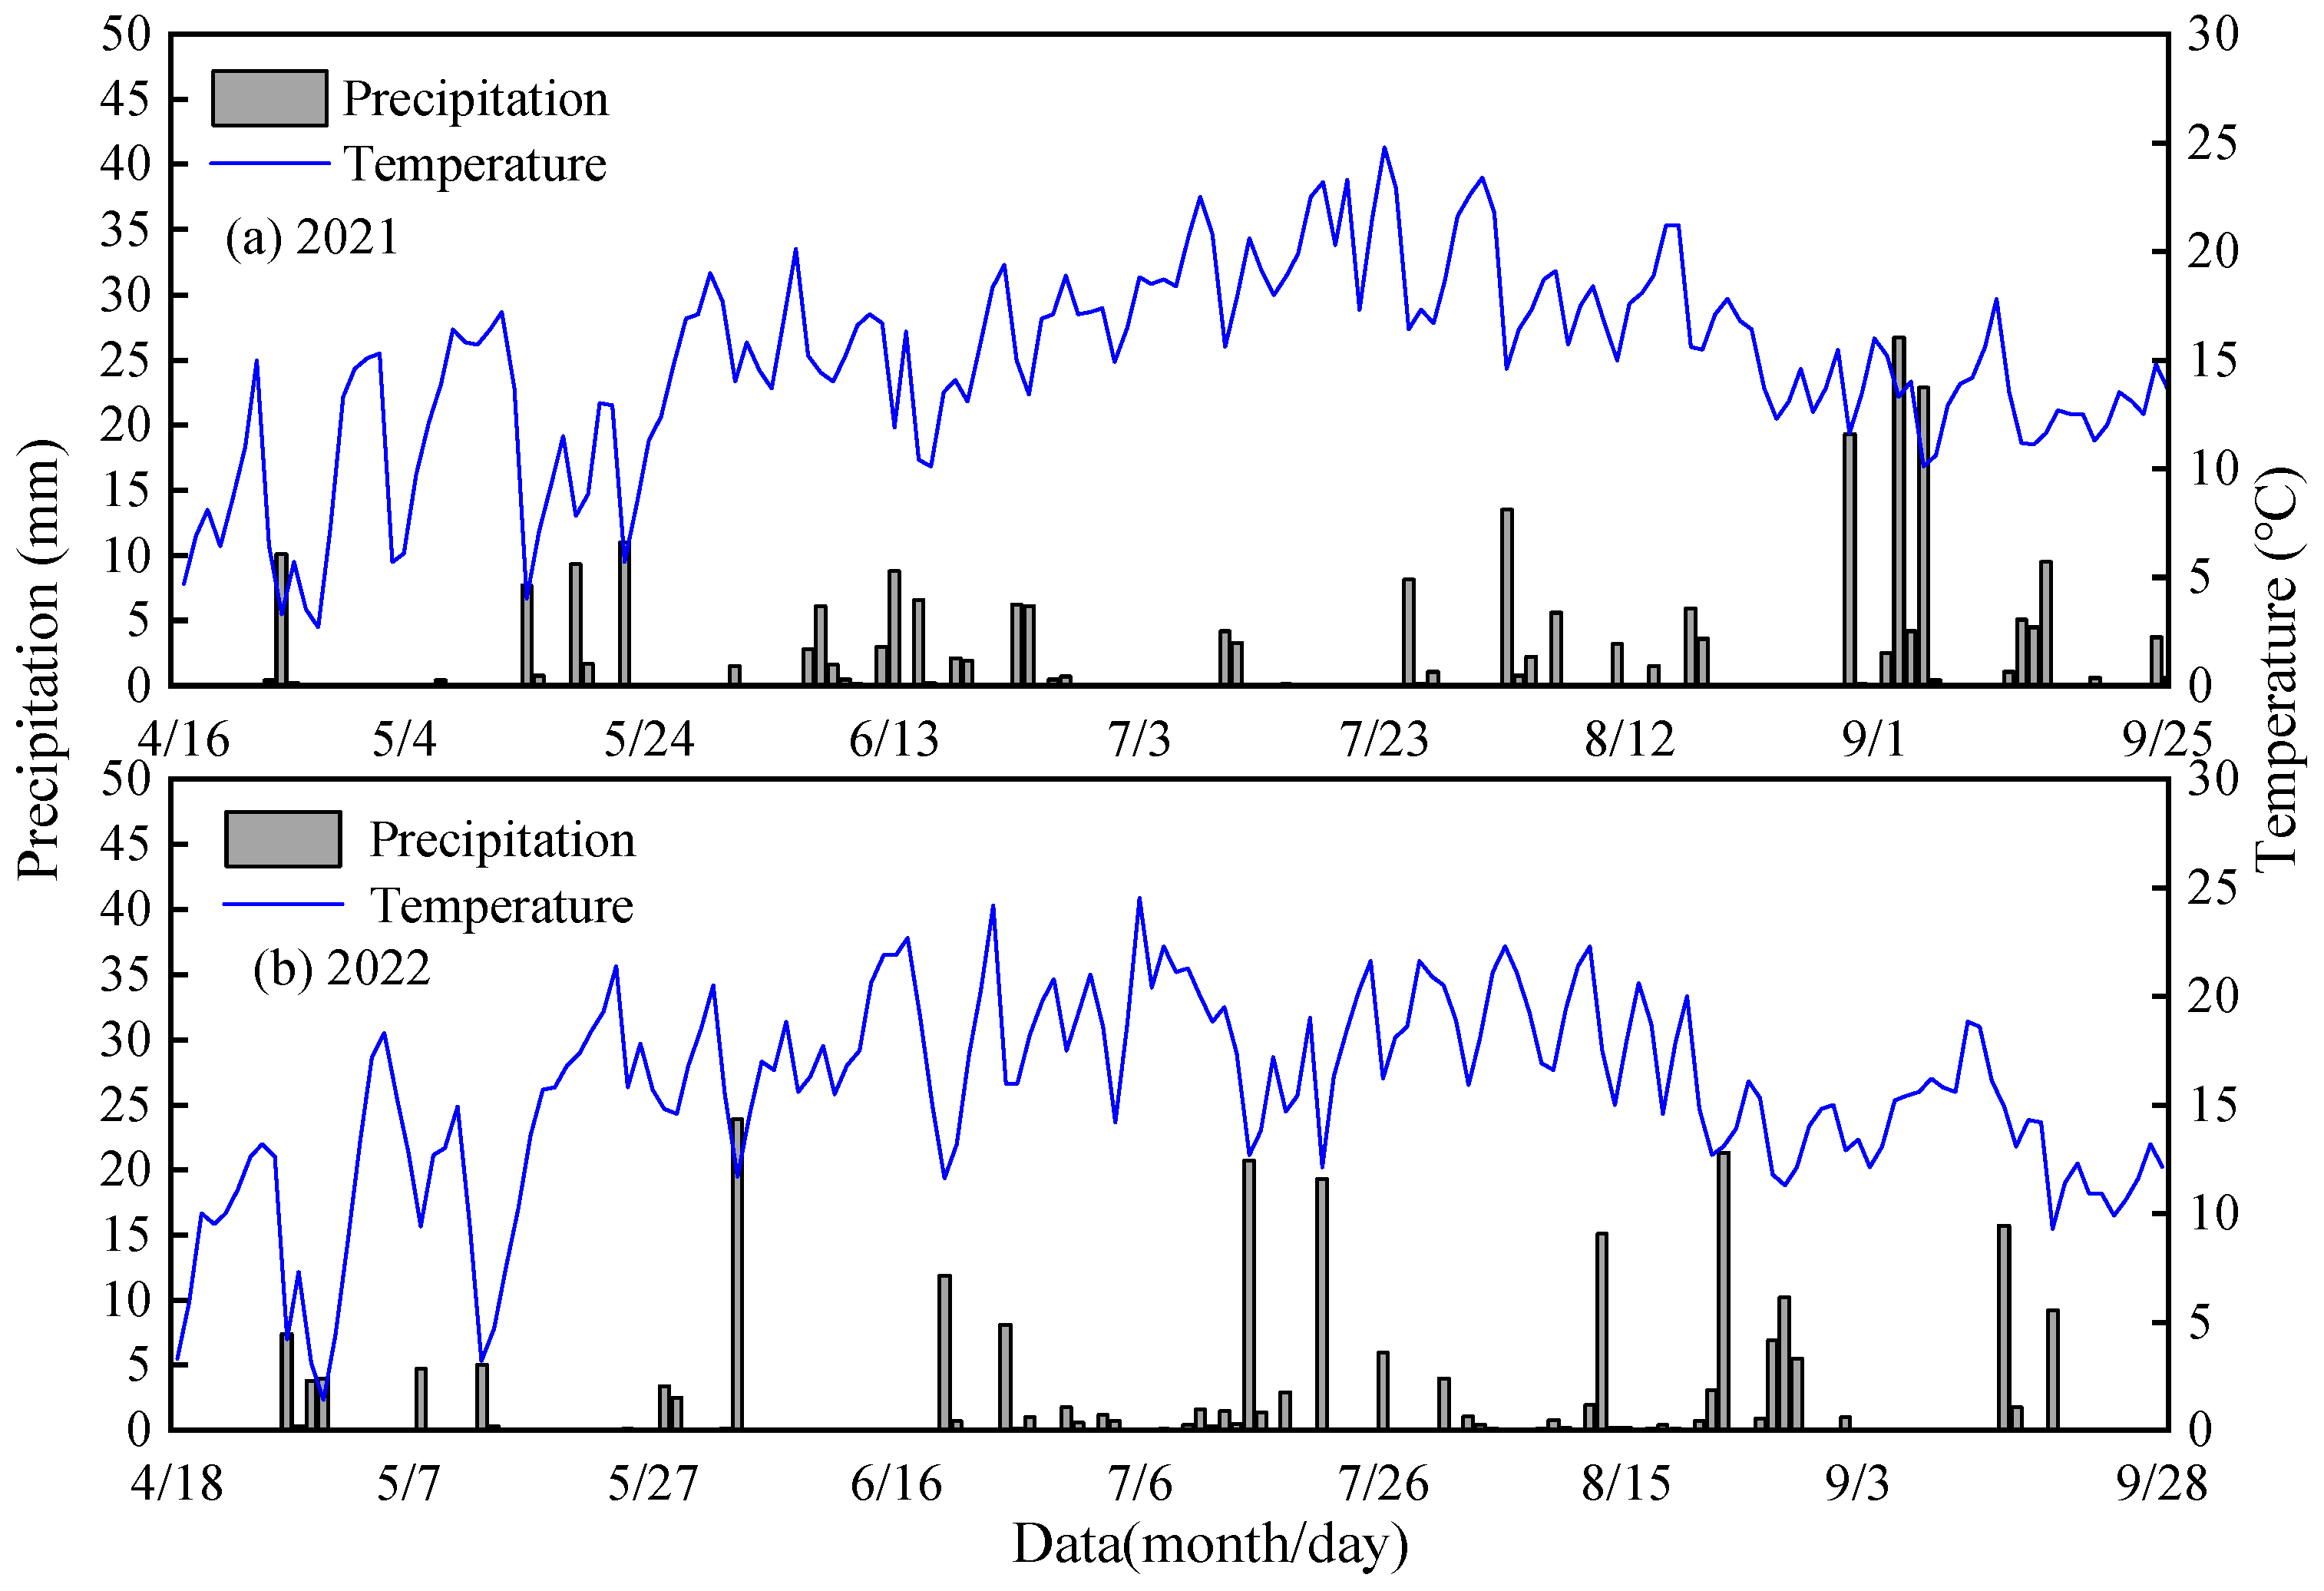
2.1. Site Description

The experiment was conducted at Yimin Irrigation Experimental Station of Minle County, the middle Hexi Corridor, Gansu Province of China, from April 2021 to October 2022. The area is located at 100°43′ E, 38°39′ N, with an altitude of 1970 m, belonging to a temperate continental climate. The average annual precipitation is about 200 mm, the evaporation is 1680–2270 mm, the average sunshine hours are 2592–2997 h, the average yearly temperature is 7.6 °C, and the frost-free period is about 109–174 d. The test soil is light loam. The maximum water-holding capacity of the topsoil is 24%, and the soil bulk density is 1.46 g·cm−3. The pH of 0–20 cm soil was 7.2, the content of organic matter was 12.6 g·kg−1, and the contents of available phosphorus, available potassium, and alkali-hydrolyzable nitrogen were 15.8 mg·g−1, 192.1 mg·kg−1, and 57.5 mg·kg−1, respectively. The average temperature and rainfall during the experimental period are shown in Figure 1.

2.2. Experimental Design

The test variety of maize was “Wannuo 2000”. Experiment design film mulching nitrogen treatment. Two kinds of plastic-film mulching: ordinary plastic film (thickness 0.01 mm, width 1.2 m) (P), degradable plastic film (thickness 0.008 mm, width 70 cm) (J), and four nitrogen application levels: 0, 160, 320, 480 kg·ha−1, respectively, recorded as N0, N1, N2, and N3. There were 8 treatments in the experiment, and each treatment was repeated 3 times, a total of 18 plots, and the plot area was 28 m2 (2 m × 14 m); the field test plots were arranged in random blocks. The planting method was equal row spacing planting, plant spacing 35 cm, row spacing 40 cm, planting density 74,000 plants per hectare. The plants were planted on 16 April 2021 and harvested on 25 September 2021, and those planted on 18 April 2022, were harvested on 28 September 2022. Each treatment and check was rotary tillage and leveling the soil before sowing. The amount of phosphorus fertilizer (P2O5) and potassium fertilizer (K2O) was the same, 120 and 80 kg·ha−1, respectively, and all were applied as base fertilizers. Nitrogen fertilizer was used four times at different growth stages, namely, 20% basal fertilizer, 30% jointing stage, 30% tasseling stage, and 20% filling stage. The drip irrigation fertilization mode adopts a mode that can efficiently utilize fertilizer resources and avoid emitter clogging; fertilization is performed in the first 3/4 times, and the last 1/4 times is rinsed with drip irrigation water.

2.3. Determination of Maize Grain-Filling Process

The maize plants in each plot were selected at maize silking. Sampling began on the 6th day after flowering and pollinating of maize, and then 3 plants were randomly selected every 6 days. A total of 6 samples were taken (36 days after flowering). Maize grains were stripped from the cob to remove non-complete grains. Then, mix the seeds evenly and randomly count 100 seeds. They were placed in an oven at 105 °C for 30 min to kill them and then dried to constant weight at 75 °C. The dry weight of the seeds was measured using a balance with an accuracy of 0.0001.

2.4. Model Description

2.4.1. Model Fitting

Taking flowering time t as the independent variable (flowering day t0) and 100-kernel weight (W) measured each time as a dependent variable, the Richards equation fitting was carried out according to Wang et al. [39] as shown in (Equation (1)):
W = A / 1 + B e K t 1 / N
where B, K, and N are model parameters; A is the final 100-grain mass (g).

2.4.2. Grain-Filling Rate

The first order derivative of the Richards equation yields the grain-filling rate equation V = KW [1 − (W/A)N]/N, yielding grain-filling parameters shown in Equations (2)–(6) [39].
a.
Initial growth power.
R 0 = K / N
b.
Growth increment at maximum grain filling rate (g).
W max = A / 1 + N 1 / N
c.
Maximal grain filling rate.
V max = K W max 1 W max / A N N
d.
Time to reach maximum grain filling rate.
T max = l n B / N / K
e.
Mean grain-filling rate.
V = A K / 2 + N + 2

2.4.3. Grain-Filling Stage

The grain-filling process is divided into a gradual increase period, rapid increase period, and slow increase period, and the second order derivative of the grain filling rate equation concerning t and another zero can be obtained for the grain filling time at the two inflection points of the grain filling rate equation, resulting in the grain filling parameters of each stage as shown in Equations (7)–(9) [40]:
t 1 = l n N 2 + 3 N + N N 2 + 6 N + 5 2 B / K
t 2 = l n N 2 + 3 N N N 2 + 6 N + 5 2 B / K
Assuming that 99% A is the actual final grain-filling period (t3), then
t 3 = l n 100 99 N 1 B / K
Therefore, the grain-filling gradual increase period is that the grain-filling time is less than t1, the rapid increase period is t1–t2, and the slow increase period is t2–t3. The duration of each stage is T1 = t1–t0, T2 = t2–t1, and T3 = t3–t2, and the average grain filling rate and grain filling contribution rate are (V1), (V2), (V3) and (P1), (P2), and (P3).

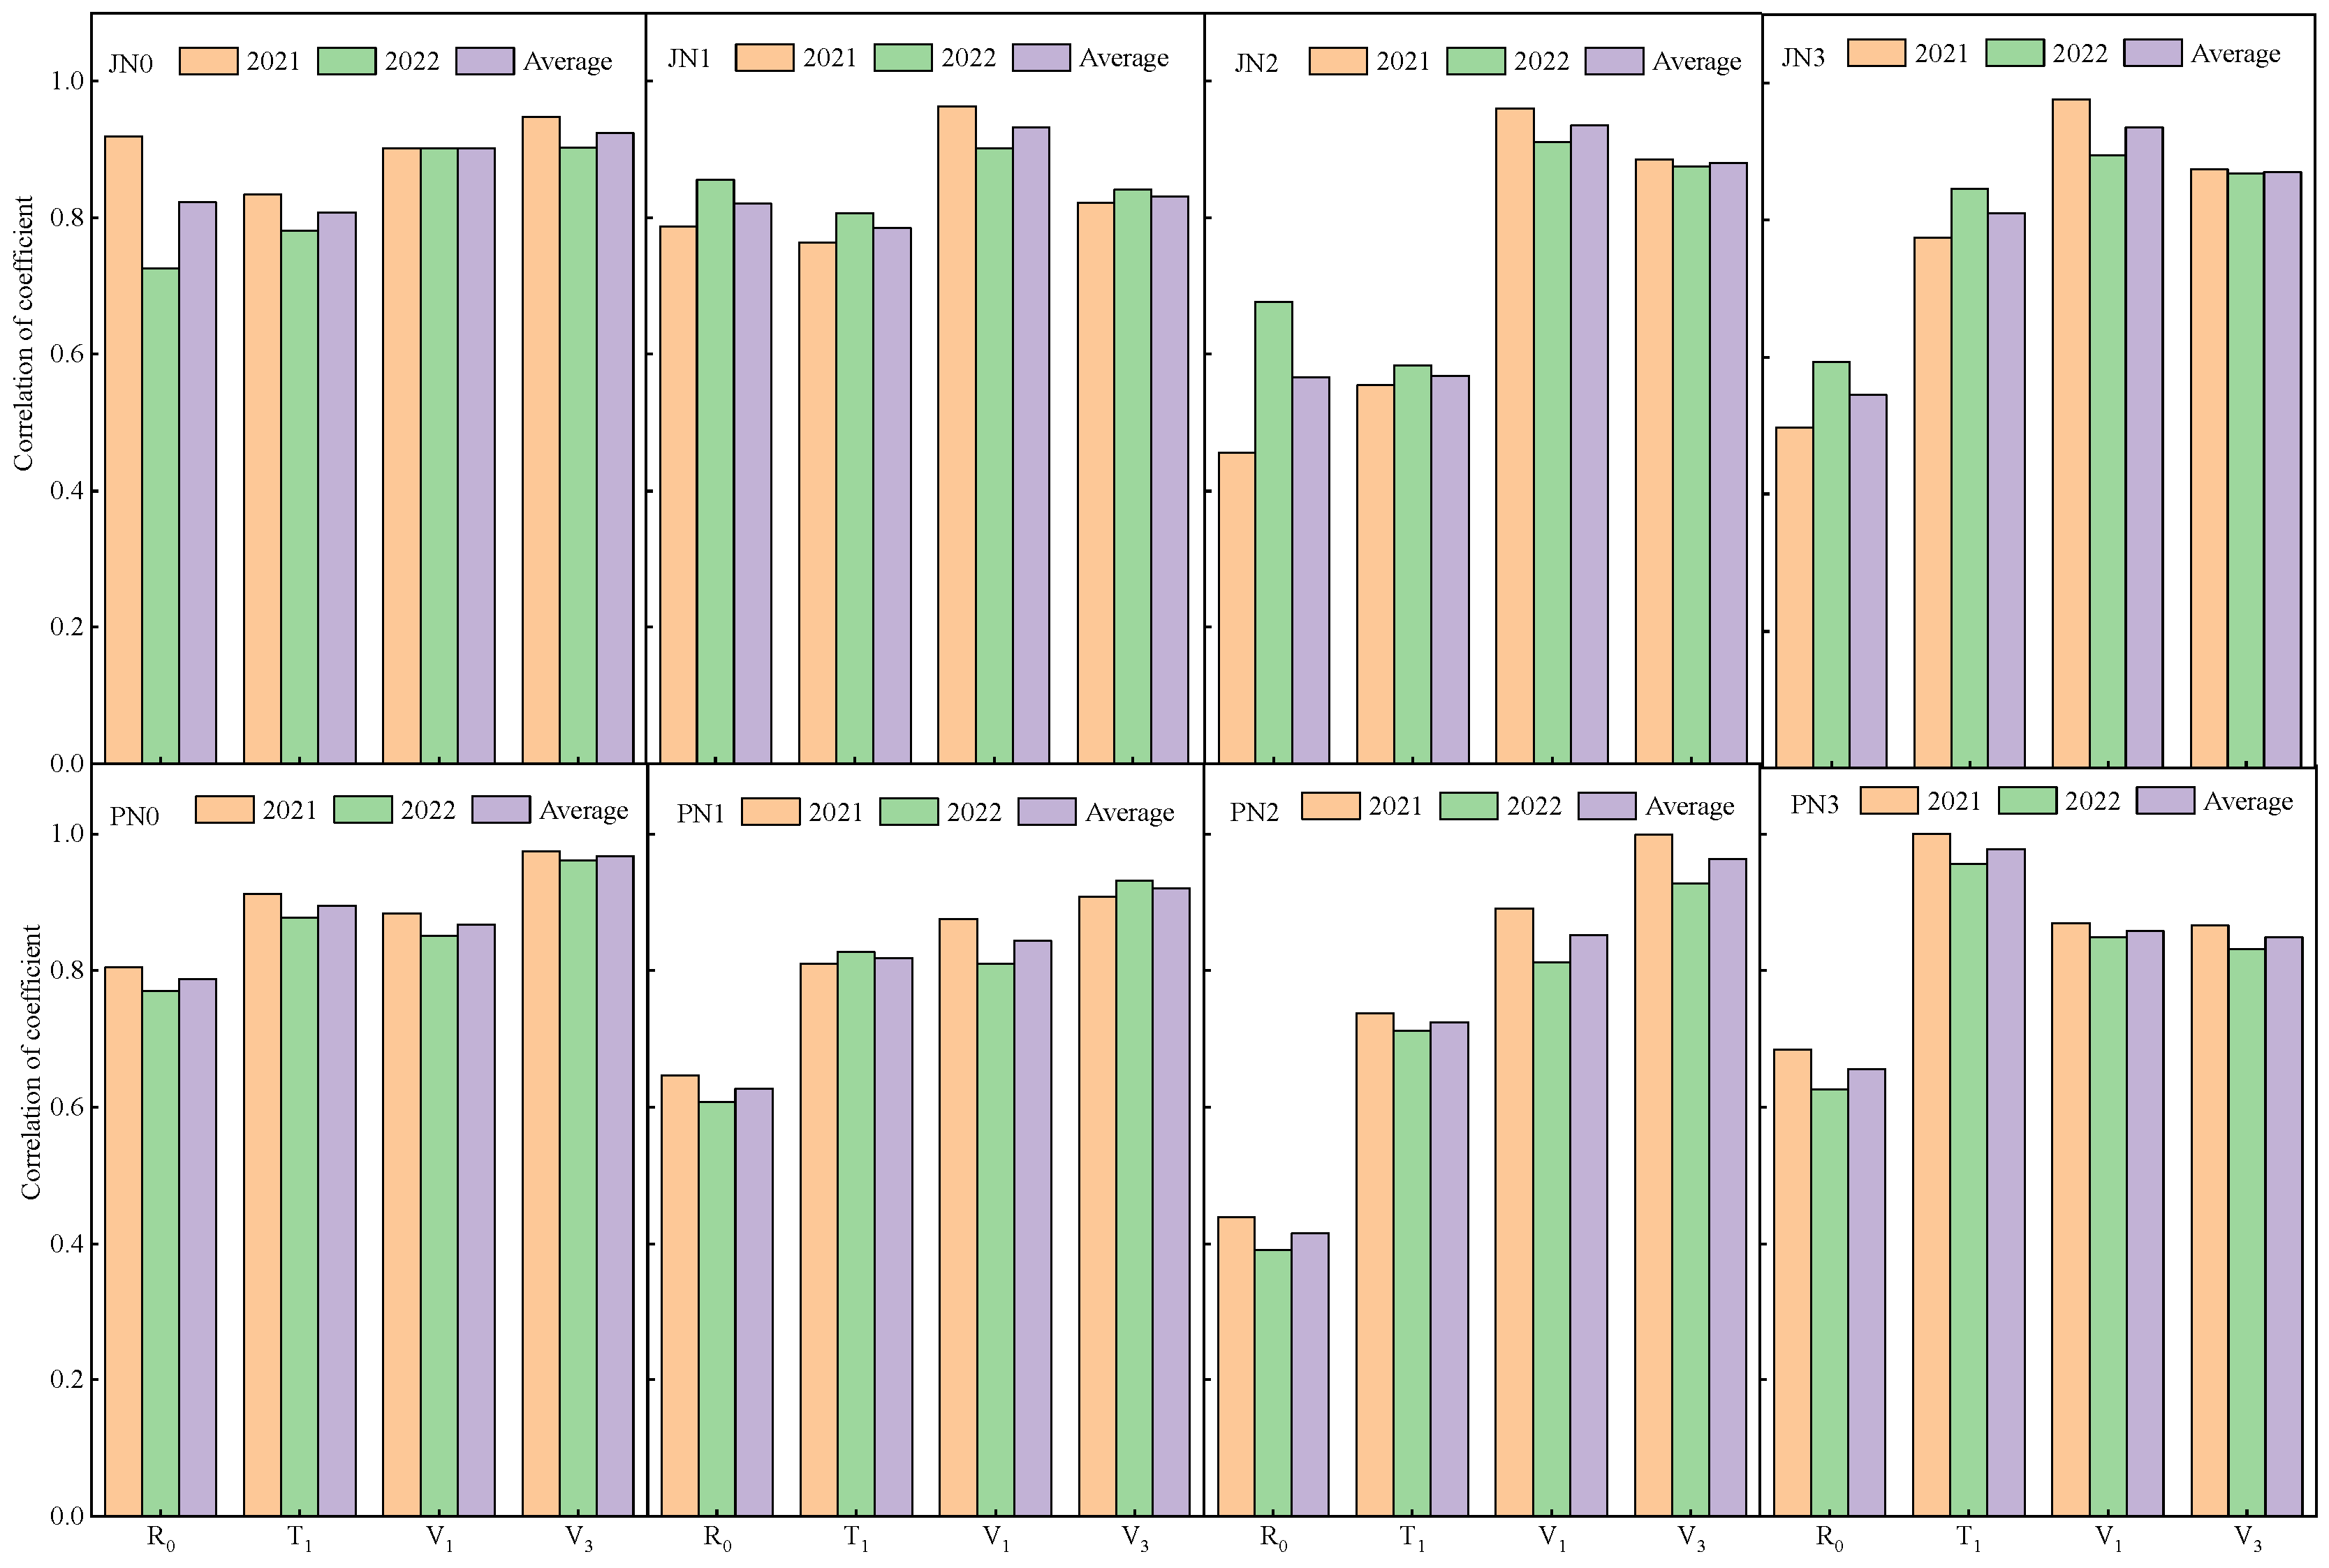
2.4.4. Gray Relational System Correlation Analysis

The 100-kernel weight and grain-filling process parameters of maize constitute a gray system. Using the 100-grain quality as the reference series (X0) and the seed-filling parameters as the comparison series (Xi), the relative variation in the 100-grain quality and filling parameters can be clarified by the gray correlation system analysis. The gray correlation coefficient of each parameter is shown in Equation (10) [39]:
ξ i ( k ) = Δ X m i n + ρ Δ X max / Δ X i ( k ) + ρ Δ X m a x
where ΔXmin = minimink∣X0(k) − Xi(k)∣ is the bipolar minimum of the difference between the absolute values of the reference and comparison series; ΔXmax = maximaxk∣X0(k) − Xi(k)∣ is the bipolar maximum of the difference between the absolute values of the reference and comparison series; ΔXi(k) = ∣X0(k) − Xi(k)∣ is the absolute difference between the points on the curve of the comparison series X0 and the points on the curve of the reference series Xi; ρ is the resolution coefficient (ρ = 0.5).

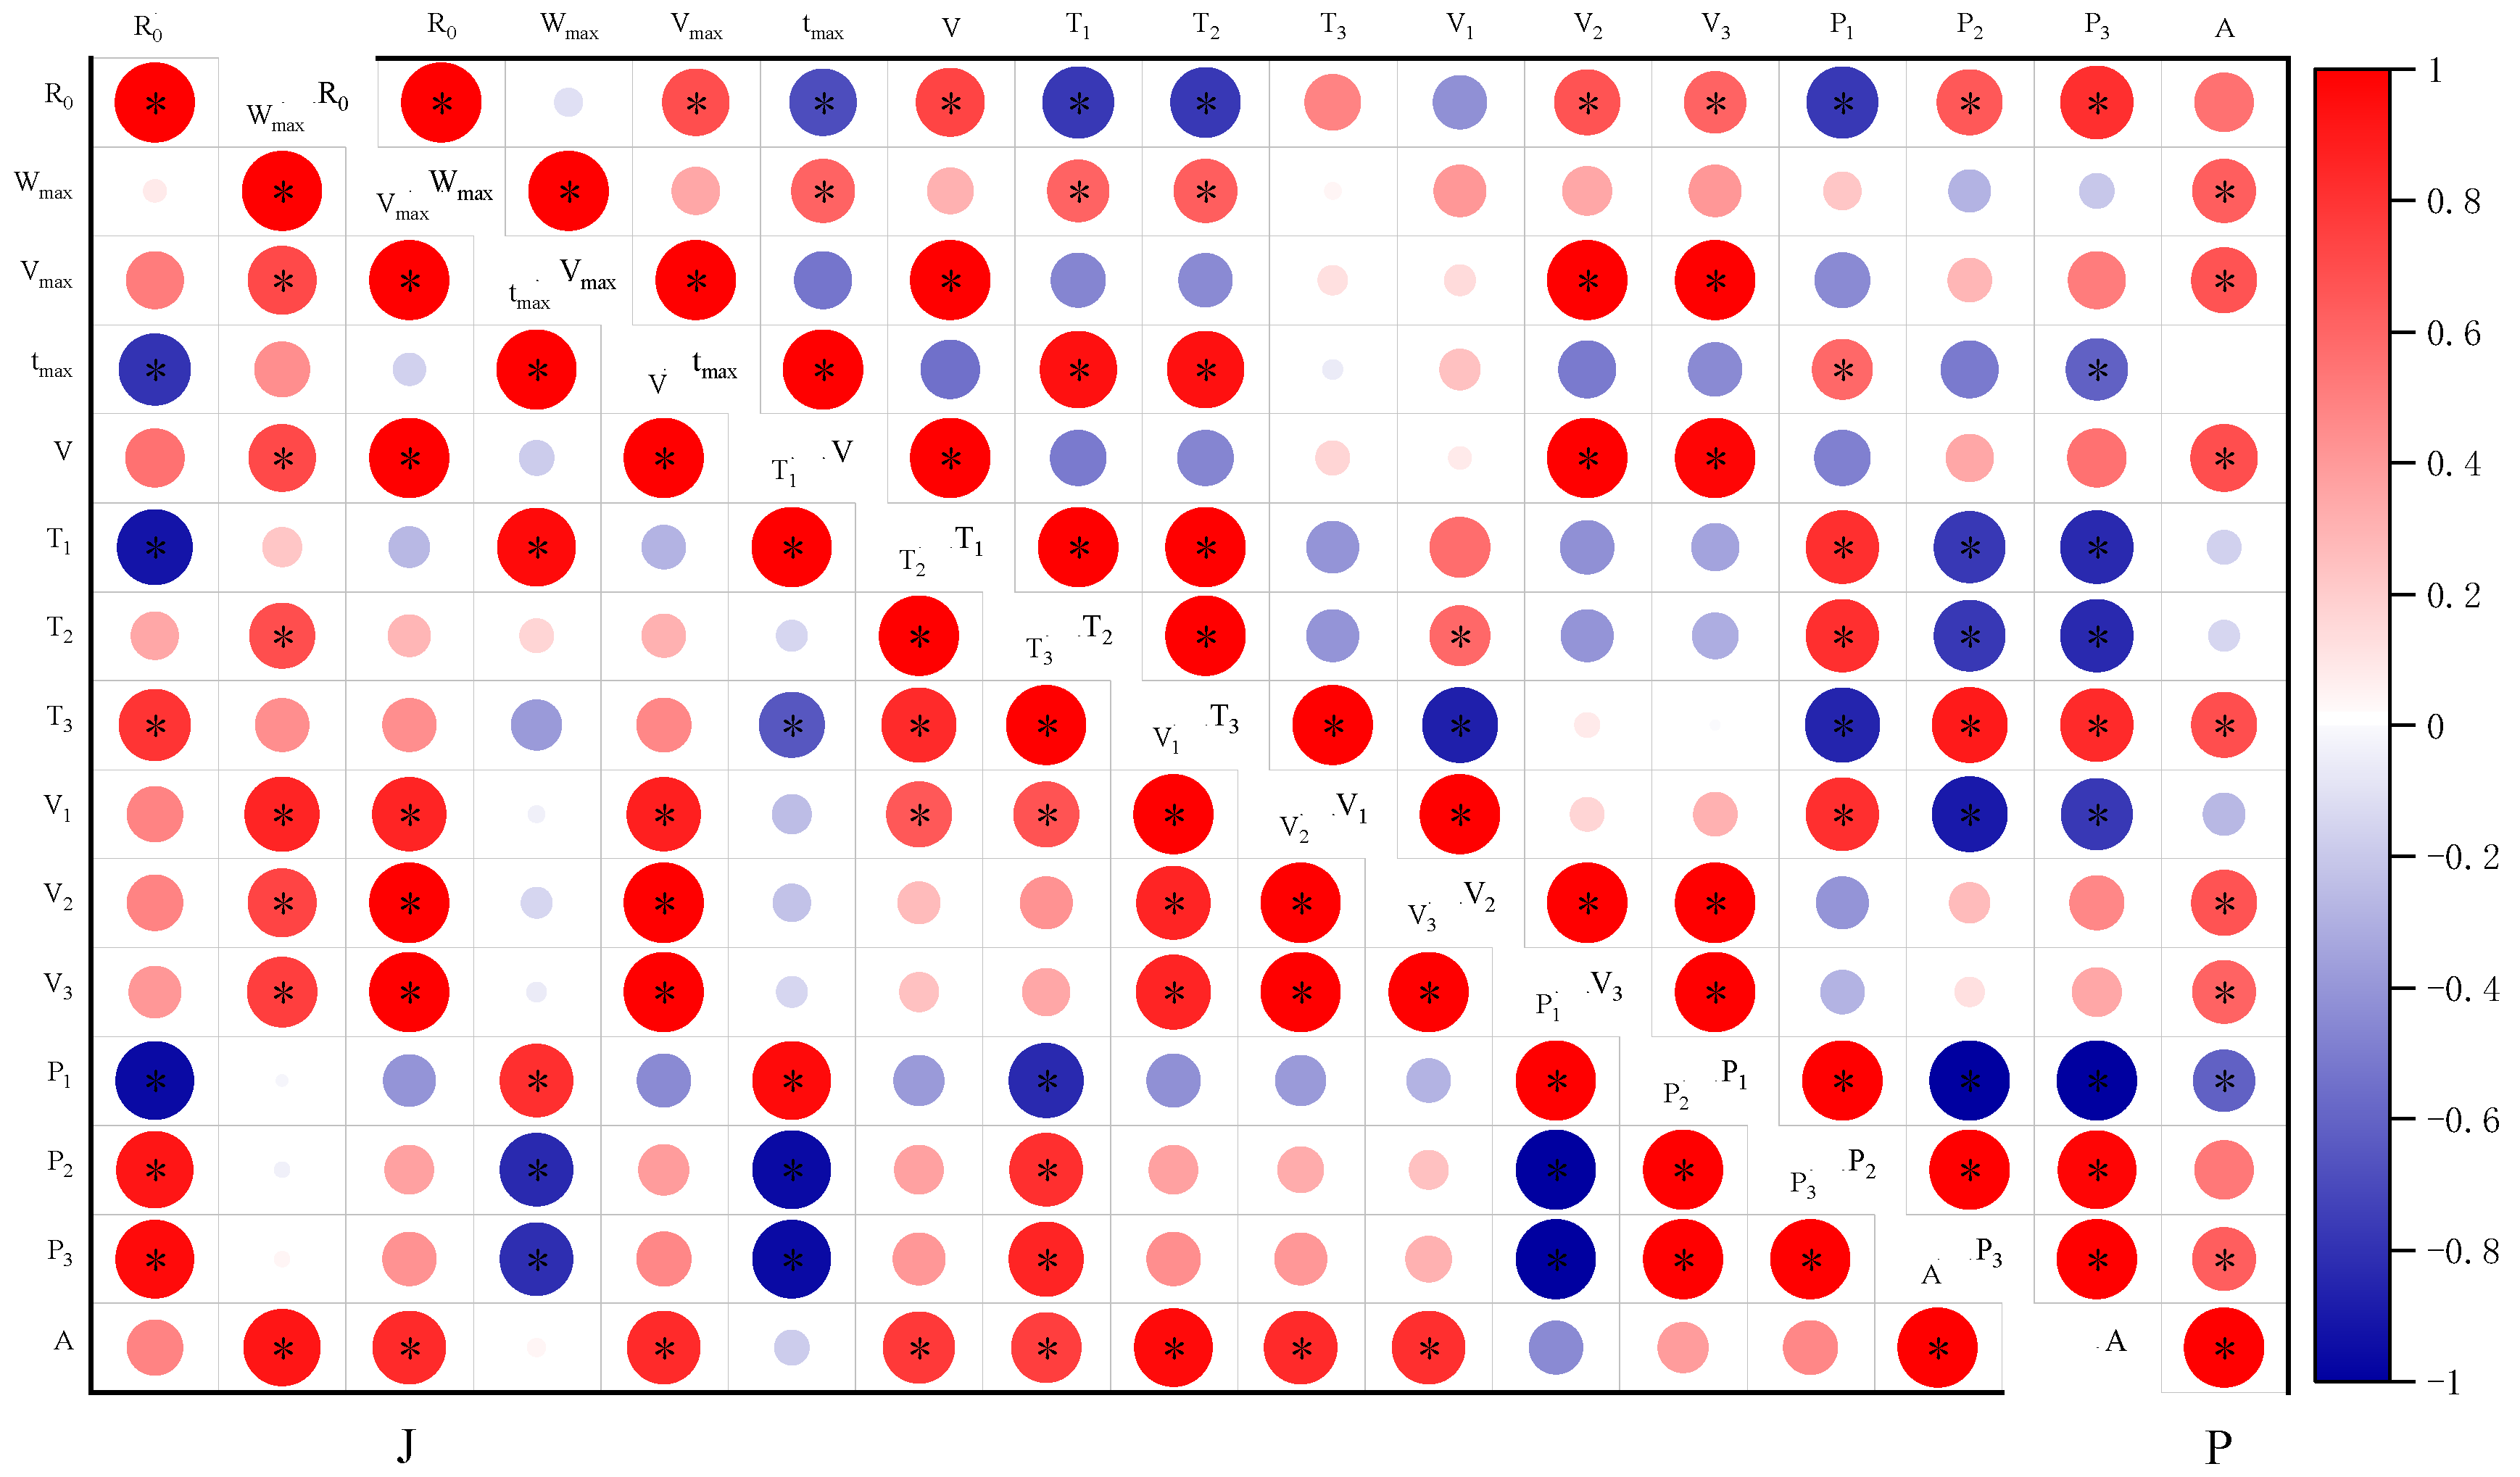
2.4.5. Path Analysis

To reflect the direct and indirect effects of the characteristic parameters of seed grain filling on the quality of 100 grains, a flux analysis of the grain-filling parameters was performed [41].

2.5. Statistical Analysis

Data were processed in Excel, significance and through-diameter analyses were performed using SPSS 26.0 version. The Richards equation was fitted by Nonlinear fit in Origin 2018 software and plotted by Origin 2021.

3. Results

3.1. Yield Components

There was no significant effect of mulching on maize yield components (the effect of mulching on maize ear quality reached a considerable level (p < 0.05) in 2022), and there were significant (p < 0.05) and highly effective (p < 0.01) effects of nitrogen fertilizer on maize yield components (Table 1). At the same level of nitrogen application, degradable film and ground cover had no significant impact on the yield components of maize. Nitrogen fertilizer is the main factor affecting the formation of maize ear, from N0 to N1, the ear length, ear diameter, kernels, and ear weight increased by 9.20%, 5.97%, 7.14%, 14.91% (J), and 7.68%, 6.04%, 8.75%, 14.32% (P), respectively. From N1 to N2, the nitrogen application levels increased by 12.08%, 10.27%, 16.67%, 14.99% (J) and 10.45%, 9.83%, 14.59%, 12.52% (P), respectively. Nitrogen fertilizer can significantly improve the structure of corn ears, and the degradable film with nitrogen fertilizer increase effect is better than ordinary film. From N2 to N3 nitrogen application levels, ear length, ear diameter, kernels, and cob mass were reduced by 5.51, 1.44, 7.50, 3.01% (J), and 5.47, 3.46, 7.49, and 2.44% (P), respectively, and high nitrogen levels inhibited maize cob formation and affected maize cob structure.

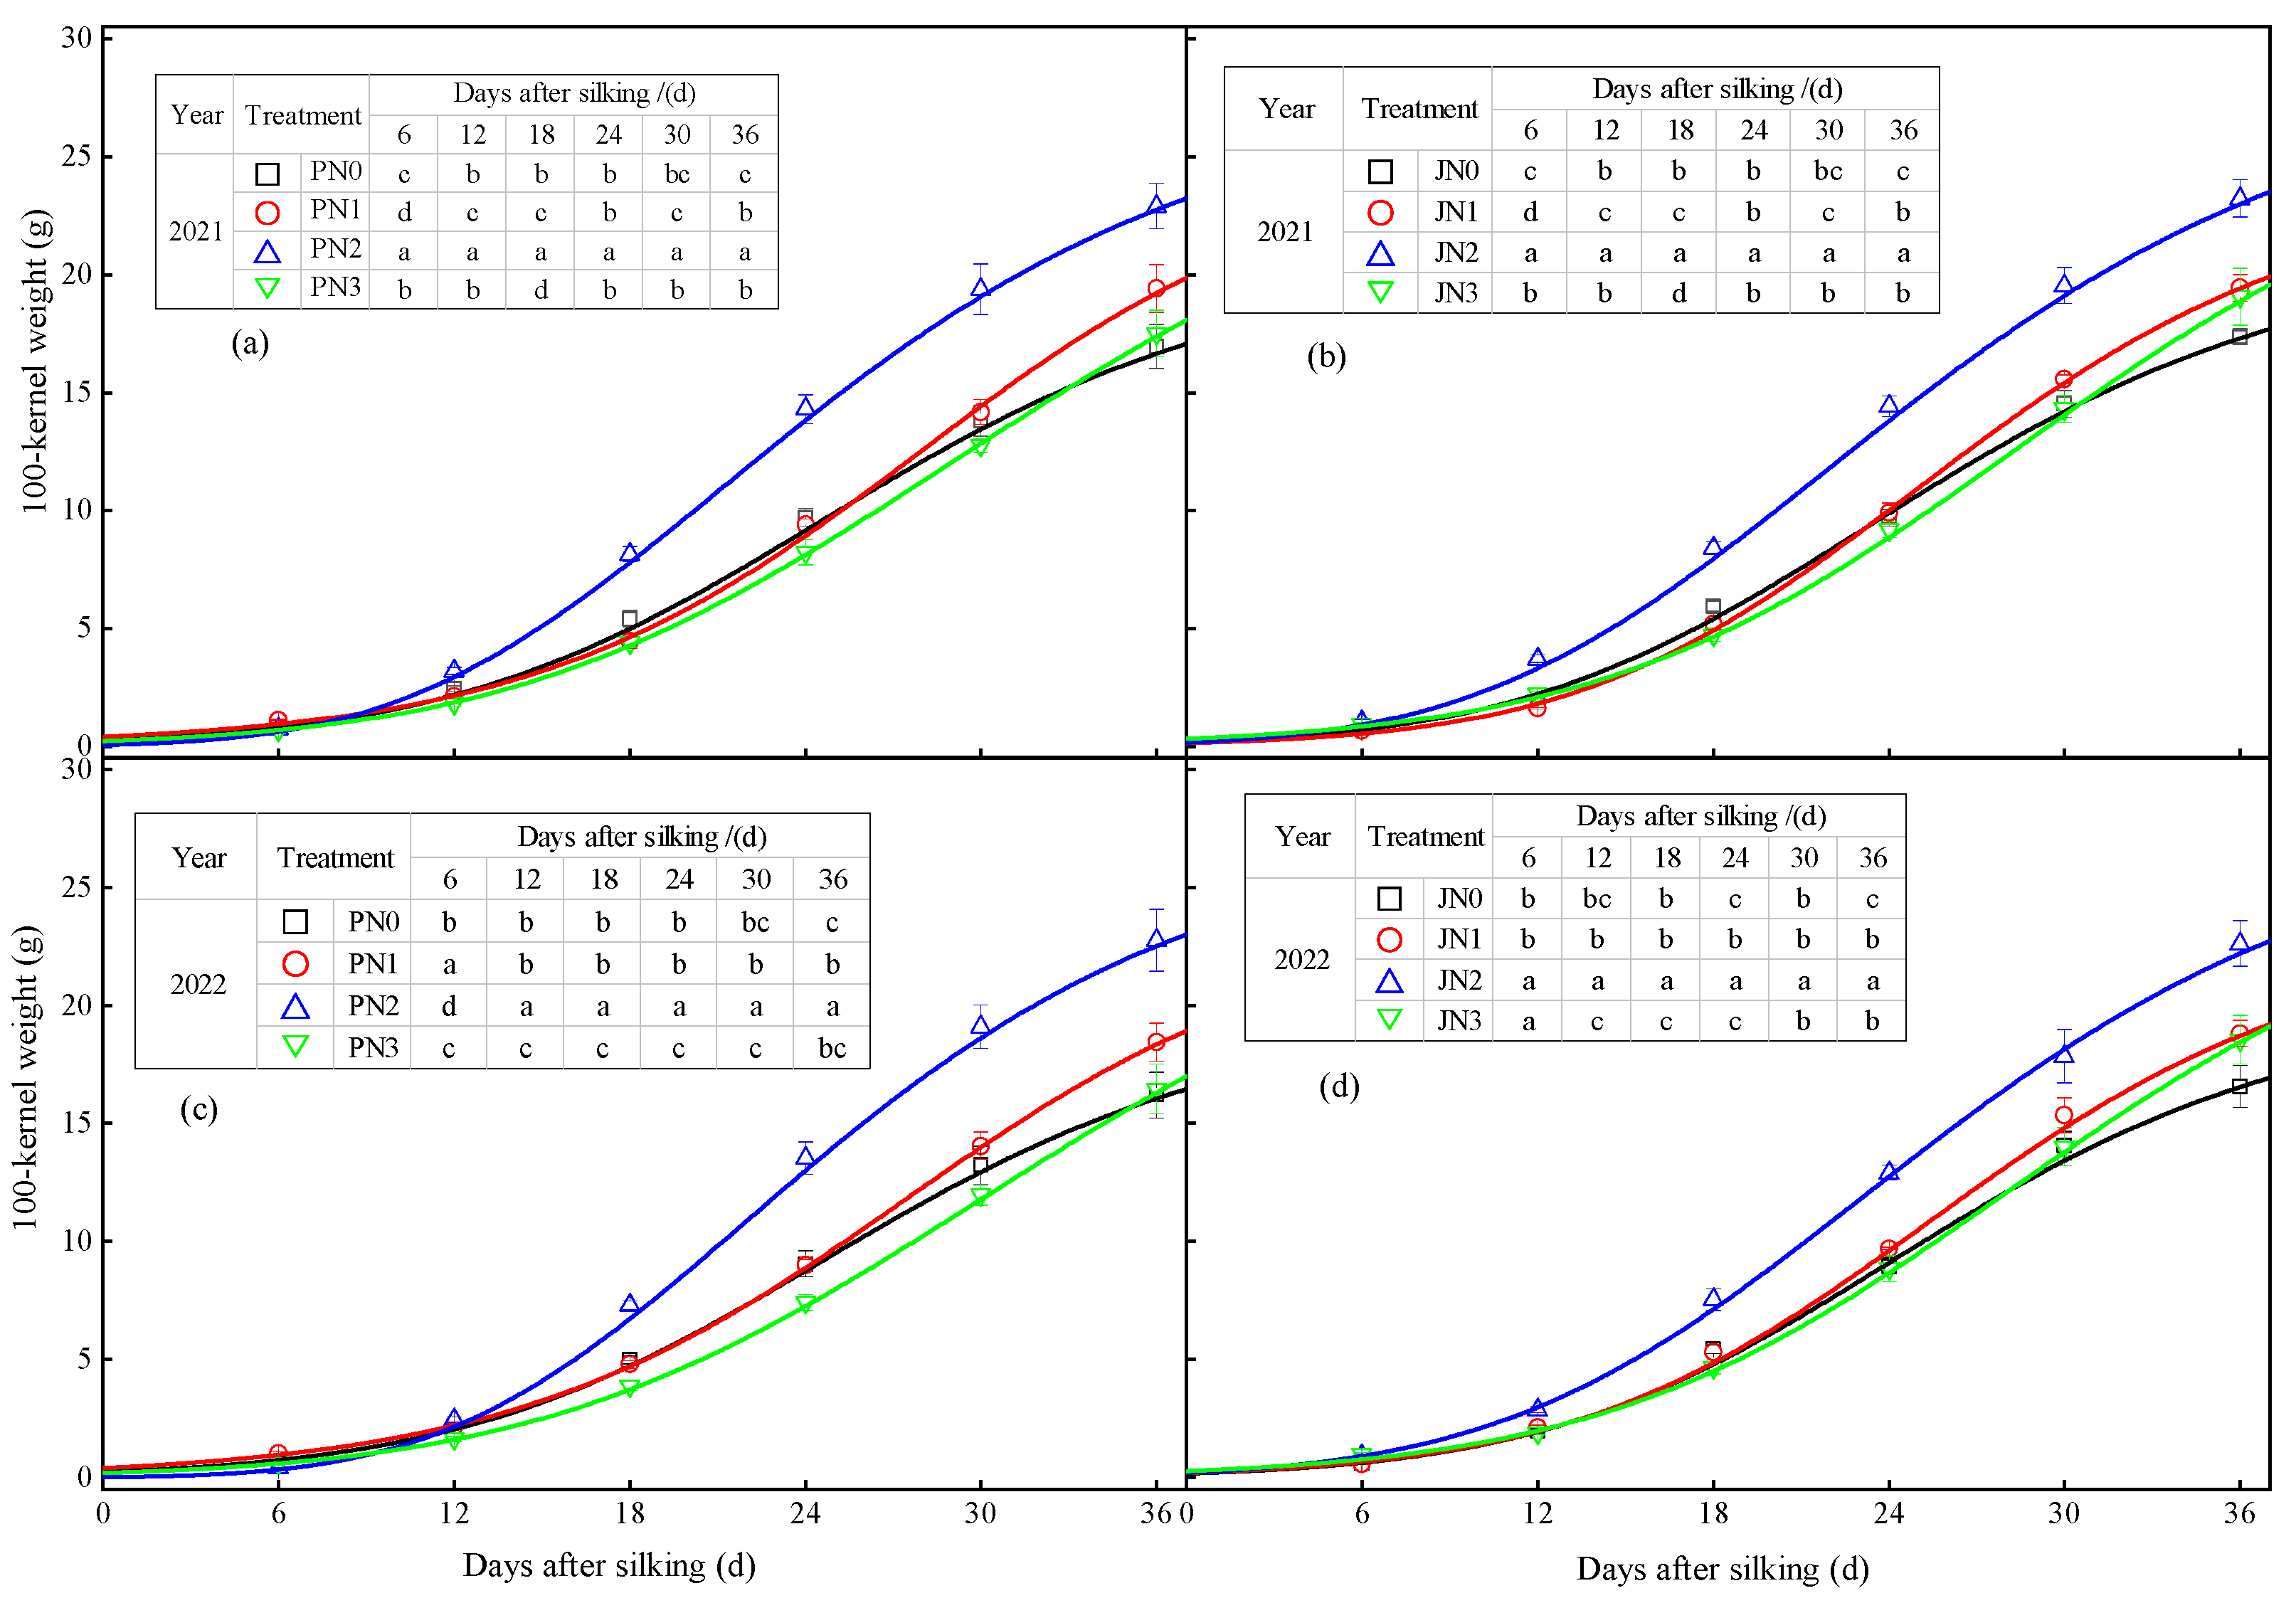
3.2. The 100-Kernel Weight

The effect of nitrogen application on the 100-kernel weight reached an extremely significant level (p < 0.01), and the impact of mulching on the 100-kernel weight reached a significant level (p < 0.05; Table 2). The interaction between mulching and nitrogen application had no significant effect on the 100-kernel weight (Table 3). There was no significant difference in the 100-kernel weight between the J and P treatment under the same nitrogen application level. Still, the J treatment could promote the rise in the 100-kernel weight under N0 and N2, and the P treatment could boost the increase in the 100-kernel weight under N1 and N3. The 100-grain mass of N0 treatment under the same cover was significantly (p < 0.05) lower than that of N application treatment, decreasing by 13.84%, 38.17%, 28.28% (J) and 19.64%, 38.08%, 33.81% (P) compared with N1, N2 and N3, respectively. The 100-grain mass of N3 treatment was lower than that of N2 as the level of N application increased. Proper nitrogen application can significantly improve the 100-kernel weight of maize grains, while the 100-kernel weight decreases after excessive nitrogen application.

3.3. Grain-Filling Model

The Richards model was used to simulate the dynamic process of maize grain quality growth. The obtained equation parameters A, B, K, N, and determination coefficient R2 are shown in Table 2. It can be seen that the determination coefficient of each treatment was above 0.99, and the fitting effect was good, indicating that the Richards model in the cold irrigation area can better simulate the dynamic process of maize grain filling.
The dynamic process of maize grain quality growth fitted by the Richards model is shown in Figure 2. Combining the analysis of Table 2 and Figure 2, it can be seen that the seed mass growth curve of each nitrogen application treatment under degradable film and mulch showed a “slow-fast-slow” change. The growth rate curve was biased to the left for all treatments, with N values less than 1 for the degraded membrane cover. Under plastic-film mulching, the N value of N1 nitrogen application treatment was more significant than 1, and the growth rate curve was biased to the right. The N values of other treatments were less than 1, and the growth rate curve was limited to the left.

3.4. Characteristic Parameters during Maize Grain Filling

The characteristic parameters of maize grain filling calculated by the Richards model are shown in Table 4. Film mulching had no significant effect on the initial growth potential (R0), and the impact on other filling characteristic parameters reached p < 0.05. The effect of nitrogen application and the interaction between mulching and nitrogen application on the whole filling typical parameters reached p < 0.01 level.
The initial growth potential (R0) reflects the growth potential of the ovary. The larger the (R0), the faster the endosperm cell division and the earlier the filling start time. The two-year average (R0) of J and P treatment under different nitrogen application levels were 0.1779–0.4227 and 0.1459–0.9454, respectively. Under N0 and N1 nitrogen application levels, the J treatment was higher than the P treatment. With the increase in nitrogen application rate to N2 and N3 levels, the P treatment was more elevated than the J treatment. Growth (Wmax) at the maximum filling rate was higher in the P treatment than in the J treatment under N0 and N1 nitrogen application, and the opposite was true under N2 and N3. Under N0, N1, and N3 levels, the maximum filling rate (Vmax) and the average filling rate (V) of the J treatment were 0.0172–0.0824 g·d−1 and 0.0181–0.0527 g·d−1 higher than those of the P treatment, respectively, and the time to reach the maximum filling rate was 0.6301–2.7647 d earlier than that of the P treatment. Still, under the N2 nitrogen application level, it was the opposite, which was 0.0650 g·d−1, 0.0454 g·d−1, and 1.0419 d later than that of the P treatment, respectively. From the perspective of the nitrogen application level, the initial growth potential of N2 treatment was the strongest, the time to reach the maximum filling rate was the earliest, the maximum filling rate and the average filling rate were the largest, 0.6841, 21.5515 d, 1.0107 g·d−1 and 0.6857 g·d−1, respectively. The time to reach the maximum grain-filling rate of N1 and N3 treatments was later than that of the N0 treatment, indicating that nitrogen application under mulching measures delayed the time to reach the maximum grain-filling rate of maize, with a maximum delay of 4.9442 d, but appropriate nitrogen application can advance the time to reach the maximum grain filling rate. The maximum filling rate and average filling rate of the N1 and N3 treatments were significantly (p < 0.05) higher than those of the N0 treatment, indicating that nitrogen application had a more significant impact on the filling rate. It can be seen that film mulching combined with nitrogen application can effectively regulate some filling characteristic parameters of maize, optimize the grain-filling process, and ultimately improve the 100-grain quality.

3.5. Parameters at Each Plant Growth Stage

The effects of mulching in different years on the parameters of each stage of the filling stage were other levels (the effects on (T1), (V2), (P2), and (V3) in 2021 reached p < 0.01 level), and the effects on (P1) reached p < 0.05 level; in 2022, the effects on (T1), (V1), (V2) reached p < 0.01 level, the impact on (V3) reached p < 0.05 level), the effect of nitrogen application reached the p < 0.01 level and the effect of mulching and nitrogen application interaction reached p < 0.01 level (the impact on (T3) reached p < 0.05 level in 2022) (Table 5).
Comprehensive analysis of two-year data showed that the N2 treatment significantly (p < 0.05) shortened the duration of the gradual filling period (T1) and the contribution rate (P1). Under N0 and N1, nitrogen application levels (T1), (V1), and (P1) of the P treatment were higher than the J treatment, while N2 and N3 treatments were the opposite. The grain-filling contribution rate, grain-filling duration and grain-filling rate of J and P treatments were the same in the rapid increase period and the slow increase period of grain filling. The grain-filling contribution rate was the largest in N2, the grain-filling duration was the shortest in N1, followed by N0, and the grain-filling rate was N2, N1, N3, and N0. During the rapid increase period of filling, the filling duration of the P treatment was shorter than that of the J treatment under the N2 nitrogen application level. The filling duration and filling contribution rate of the J treatment were significantly (p < 0.05) lower than those of the P treatment under the N3 nitrogen application level. During the slow increase period of grain filling, the grain-filling duration of the J treatment was significantly (p < 0.05) shorter than that of the P treatment under the N3 nitrogen application level. Under N0 and N3, the filling rate of the J treatment was higher than that of the P treatment, while N2 was the opposite. It can be seen that compared with the degradable film, plastic-film mulching mainly prolonged the filling duration, increased the filling rate and filling contribution rate during the gradual increase period of filling, and was more evident under N0 and N1 nitrogen application levels. With the passage of the grain-filling process, the effect of degrading film on prolonging the grain-filling duration and increasing the grain-filling rate gradually became prominent. The nitrogen application level mainly affected the rapid increase period and slow increase period of grain filling. The appropriate nitrogen application level was beneficial for prolonging the filling duration, and increasing the filling rate and filling contribution rate, but too high a level will produce negative effects. In addition, the contribution rate of grain filling in each stage of the J and P treatment was consistent, from large to small, the contribution rate of the rapid increase period, slow increase period, and gradual increase period, indicating that the contribution of the rapid increase period to grain formation was the largest, followed by slow increase period, the contribution of the gradual increase period to grain formation was the smallest.

3.6. Correlation Analysis between Grain-Filling Parameters and 100-Kernel Weight

According to Figure 3, there are four prominent grain filling parameters and 100-grain mass from a gray system. By comparing the correlation coefficients, it can be seen that the parameter with the highest correlation coefficient under N1, N2, and N3 nitrogen application levels in the J treatment was (V1). The order of correlation between grain-filling parameters and 100-grain quality was the same for N2 and N3 nitrogen application levels. The parameter with the highest correlation coefficient under the N0 nitrogen application level was (V3). The highest correlation coefficient parameter under N0, N1, and N2 nitrogen application levels in the P treatment was (V3), and the correlation order between grain-filling parameters and 100-kernel weight under N1 and N2 nitrogen application levels was consistent. The highest correlation coefficient parameter under the N3 nitrogen application level was (T1). In J and P treatments, (V1) and (V3) had the closest relationship with the 100-kernel weight under N1 and N2 nitrogen application levels. It can be seen that the grain-filling rate in the gradual and slow increase period was most closely related to the 100-kernel weight of maize.

3.7. Correlation and Path Analysis between Grain-Filling Parameters and 100-Kernel Weight

The correlation between grain-filling parameters and 100-kernel weight (A) under different mulching methods is shown in Figure 4. The 100-kernel weight of the J treatment was most closely related to (Wmax), (Vmax), (V), (T2), (T3), (V1), (V2) and (V3), while the 100-kernel weight of the P treatment was most closely related to (Wmax), (Vmax), (V), (T3), (V2), (V3) and (P3). The direct path coefficient (V3) (PV3 = 0.703) had the most significant impact on 100-kernel weight in the P treatment, followed by (T1), (R0) and (V1) which mainly affected the 100-kernel weight production through (V3), and (V1) mainly affected the 100-kernel weight through (T1) (Table 6); in addition, (P1) had a negative effect on 100-kernel weight (Figure 4). The direct path coefficient (V3) (PV3 = 0.596) had the most significant impact on the 100-kernel weight in the J treatment, followed by (V1). (R0) and (V1) mainly affected the 100-kernel weight production through (V3), and (R0) and (V3) mainly affected the 100-kernel weight production through (V1) (Table 6). It indicated that prolonging grain-filling time and increasing grain-filling rate played an essential role in increasing 100-kernel weight during the grain filling of maize.

4. Discussion

4.1. Effects of Plastic-Film Mulching and Nitrogen Application on Grain-Filling Characteristic Parameters of Spring Maize

The process of grain filling is the transfer of photosynthetically assimilated substances to the grain, which determines the final grain weight, yield, and quality of cereal crops such as maize [42,43]. Appropriate nitrogen application measures are conducive to increasing maize mid- to late-stage grouting rates, increasing average and maximum grouting rates, and ultimately growing thousand-kernel mass and increasing maize yield [42,44]. The results of this study showed that under the two kinds of plastic-film mulching, with the increase in nitrogen application rate, the time for maize to reach the maximum grain-filling rate was delayed, the maximum grain-filling rate and the average grain-filling rate were increased, and the final 100-grain weight was increased. Under 320 kg·ha−1 nitrogen application level, the time to reach the maximum grain-filling rate was the shortest, and the maximum grain-filling rate, average grain-filling rate, and 100-grain weight were the largest. The results of this experiment indicated that the increase in N application level not only delayed the time to reach the maximum grouting rate of maize but also shortened the time to reach the maximum grouting rate with the appropriate N application rate. Wei et al. [45] showed that increased nitrogen application delayed the time for maize kernels to reach the maximum rate of filling and that the appropriate level of nitrogen application shortened the time for grains to achieve the maximum speed of filling in the middle part of the maize cob. Fang et al. [27] also proved that implementing nitrogen could regulate the time for maize to reach the maximum filling rate. The conclusions of the present study were similar to the results of the above studies [27,45]. Still, due to the nitrogen fertilizer management mode, the environment of the experimental area, maize varieties, and other factors caused by the prolonged filling rate time varied. However, as N application continued to increase beyond the optimal N application threshold, it instead delayed the time to reach the maximum grouting rate, reduced the maximum and average grouting rate of maize, and was detrimental to the transfer of plant dry-matter to the kernel, reducing yield.
The final quality of maize grain is closely related to the storage potential formed by early development [46]. The combination of plastic-film mulching and nitrogen fertilizer can affect the division of maize endosperm cells through initial growth potential, regulate the time when grains enter the filling stage, and thus affect the time to reach the maximum filling rate and the filling rate. This study found that when 320 kg·ha−1 nitrogen fertilizer was applied under two kinds of plastic-film mulching, the initial growth potential was the highest, the time to reach the maximum grain-filling rate was the earliest, the maximum grain-filling rate and average grain-filling rate were increased, and the 100-grain weight of maize was also the largest at the end of grain filling. Although the initial growth potential of no nitrogen application was higher than that of nitrogen application 160 kg·ha−1, the time to reach the maximum filling rate was earlier. However, the growth increment, maximum filling rate, and average filling rate at the maximum filling rate without nitrogen application were less than 160 kg·ha−1 of nitrogen application, and the 100-grain weight was relatively low at the end of filling. Excessive N application was also detrimental to the improvement of grouting parameters. When N was applied at 480 kg·ha−1, the starting growth potential of maize was smaller than that of 320 kg·ha−1, the time to reach the maximum grouting rate was late, and the maximum grouting rate, the average grouting rate, and the quality of one hundred kernels at the end of the grouting were also relatively low. This experiment’s conclusions are consistent with the results of Li et al. [47], which indicated that increased initial growth potential would contribute to an earlier time of maximum grouting rate and increase the maximum and average grouting rates.

4.2. Effects of Plastic-Film Mulching and Nitrogen Application on Parameters of Filling Stage of Spring Maize

The formation of corn yield mainly depends on the critical growth and development process of grain filling. The grouting process is susceptible to environmental factors such as water content, soil nutrient status, environmental temperature, and nitrogen application rate [44,48]. The study of Lía B [49] and Gasura et al. [50] showed that the grain-filling duration significantly correlated with the grain yield of maize; the grain yield increased dramatically with the grain-filling rate and grain-filling duration. In this study, the duration of the maize gradual increase period under traditional plastic film or degradable film mulching was the shortest under a nitrogen application rate of 320 kg·ha−1, followed by no nitrogen application. But when no nitrogen was applied, and the nitrogen application rate was 160 kg·ha−1, the gradual increase period of corn under degradable plastic film coverage was shorter than that under conventional plastic-film coverage. There was no significant difference in the duration of the gradual increase period between the two types of plastic film under nitrogen application levels of 320 and 480 kg·ha−1. Under two types of plastic-film coverage, the duration of grouting during the rapid and slow increase period showed the same trend, with the shortest time at a nitrogen application rate of 160 kg·ha−1, followed by no nitrogen application. During the rapid growth period, the filling duration of corn covered with conventional plastic film was significantly shorter than that covered with degradable film at a nitrogen application rate of 320 kg·ha−1, while the opposite was confirmed at a nitrogen application rate of 480 kg·ha−1. In this study, the duration of the three stages of the filling process of each treatment showed a slow increase period, a rapid increase period, and a gradual increase period, which was consistent with the results of Guo et al. [37]. At the same time, the results confirmed that increasing the amount of nitrogen application can increase the filling rate of maize grain-filling stage, and the average filling rate of each step from large to small is (V2), (V1), and (V3), which was similar to the conclusions of Li et al. [51]. Conventional plastic film prolonged the duration of maize grain filling and increased the grain-filling rate. Due to the gradual degradation of degradable plastic film in the late growth stage, cracks were generated, which improved soil aeration and coordinated soil water and heat balance. Therefore, with the passage of the grain-filling period, the advantages of degradable plastic film in prolonging maize grain-filling duration and increasing grain-filling rate gradually became prominent.

5. Conclusions

This study showed that while degradable plastic film increased the average filling rate and prolonged the filling duration during the rapid and slow increase periods, ordinary plastic film increased the filling rate and extended the filling time during the gradual increase period. The ordinary plastic film and degradable plastic film at 320 kg·ha−1 nitrogen application level of maize started the filling stage earlier, increased the maximum filling rate and average filling rate, shortened the gradual increase period of filling, and prolonged the rapid increase period and slow increase period of filling. Improving the ear structure of maize and increasing the 100-grain weight of maize grains is beneficial. It demonstrates the best combination of film mulching and nitrogen application levels.

Author Contributions

Data curation, T.C. and C.Z.; formal analysis, T.C., X.C. and L.L.; funding acquisition, H.Z.; writing—original draft, T.C.; supervision, H.Z., S.Y. and A.T.; writing—review and editing, T.C., H.Z. and F.L. All authors have read and agreed to the published version of the manuscript.

Funding

This work was supported by the National Natural Science Foundation of China (No. 52269008, 51669001), the Industrial Support Plan Project of Gansu Provincial Department of Education (No. 2022CYZC−51), the Key Research and Planning Projects of Gansu Province (No. 18YF1NA073), and the Open Project of Liaocheng University Landscape Architecture Discipline (No. 31946221236).

Data Availability Statement

The datasets used and/or analyzed during the current study are available from the corresponding author upon reasonable request and the approval of the data owner.

Acknowledgments

We thank everyone who helped during the manuscript writing. We also thank the reviewers for their useful comments and suggestions.

Conflicts of Interest

The authors declare no conflicts of interest.

References

  1. Cai, W.; Gu, X.; Du, Y.; Chang, T.; Lu, S.; Zheng, X.; Bai, D.; Song, H.; Sun, S.; Cai, H. Effects of mulching on water saving, yield increase and emission reduction for maize in China. Agric. Water Manag. 2022, 274, 107954. [Google Scholar] [CrossRef]
  2. Li, F.; Zhang, G.; Chen, J.; Song, Y.; Geng, Z.; Li, K.; Siddique, K. Straw mulching for enhanced water use efficiency and economic returns from soybean fields in the Loess Plateau China. Sci. Rep. 2022, 12, 17111. [Google Scholar] [CrossRef] [PubMed]
  3. Zhu, G.; Yong, L.; Zhang, Z.; Sun, Z.; Wan, Q.; Xu, Y.; Ma, H.; Sang, L.; Liu, Y.; Wang, L.; et al. Effects of plastic mulch on soil water migration in arid oasis farmland: Evidence of stable isotopes. Catena 2021, 207, 105580. [Google Scholar] [CrossRef]
  4. Rao, S.; Singh, P.; Gonsalves, T. Black plastic mulch affects soil temperature and yield of sweet potato under short season temperate climates. J. Veg. Sci. 2023, 29, 72–83. [Google Scholar] [CrossRef]
  5. Zhang, B.; Hu, H.; Guo, Z.; Gong, S.; Shen, S.; Liao, S.; Wang, X.; Zhou, S.; Zhang, Z. Plastic-film-side seeding, as an alternative to traditional film mulching, improves yield stability and income in maize production in semi-arid regions. J. Integr. Agric. 2023, 22, 1021–1034. [Google Scholar] [CrossRef]
  6. Blaise, D.; Manikandan, A.; Desouza, N.; Bhargavi, B.; Somasundaram, J. Intercropping and mulching in rain-dependent cotton can improve soil structure and reduce erosion. Environ. Adv. 2021, 4, 100068. [Google Scholar] [CrossRef]
  7. Quan, H.; Wu, L.; Ding, D.; Yang, Z.; Wang, N.; Chen, G.; Li, C.; Dong, Q.; Feng, H.; Zhang, T.; et al. Interaction between soil water and fertilizer utilization on maize under plastic mulching in an arid irrigation region of China. Agric. Water Manag. 2022, 265, 107494. [Google Scholar] [CrossRef]
  8. Ramón, A.; Eva, T.; Ignacio, C. Effectiveness of inorganic and organic mulching for soil salinity and sodicity control in a grapevine orchard drip-irrigated with moderately saline waters. Span. J. Agric. Res. 2014, 12, 501–508. [Google Scholar]
  9. Jiang, X.; Liu, W.; Wang, E.; Zhou, T.; Pei, X. Residual plastic mulch fragments effects on soil physical properties and water flow behavior in the Minqin Oasis, northwestern China. Soil Tillage Res. 2017, 166, 100–107. [Google Scholar] [CrossRef]
  10. Marion, B.; Jessica, R.; Douglas, G.; Debra, A.; Thomas, L.; Carol, M. Policy considerations for limiting unintended residual plastic in agricultural soils. Environ. Sci. Policy 2017, 69, 81–84. [Google Scholar]
  11. Zacharias, S.; Claudia, W.; Miriam, S.; Christian, B.; Jan, D.; Josephine, T.; Katherine, M.; Oliver, F.; Gabriele, E. Plastic mulching in agriculture. Trading short-term agronomic benefits for long-term soil degradation? Sci. Total Environ. 2016, 550, 690–705. [Google Scholar]
  12. Jin, X.; An, T.; Gall, A.; Li, S.; Sun, L.; Pei, J.; Gao, X.; He, X.; Fu, S.; Ding, X.; et al. Long-term plastic film mulching and fertilization treatments changed the annual distribution of residual maize straw C in soil aggregates under field conditions: Characterization by 13C tracing. J. Soils Sediments 2018, 18, 169–178. [Google Scholar] [CrossRef]
  13. Huang, Y.; Liu, Q.; Jia, W.; Yan, C.; Wang, J. Agricultural plastic mulching as a source of microplastics in the terrestrial environment. Environ. Pollut. 2020, 260, 114096. [Google Scholar] [CrossRef] [PubMed]
  14. Qi, R.; Jones, D.; Li, Z.; Liu, Q.; Yan, C. Behavior of microplastics and plastic film residues in the soil environment: A critical review. Sci. Total Environ. 2020, 703, 134722. [Google Scholar] [CrossRef] [PubMed]
  15. Qi, Y.; Ossowicki, A.; Yang, X.; Esperanza, L.; Francisco, D.; Violette, G.; Paolina, G. Effects of plastic mulch film residues on wheat rhizosphere and soil properties. J. Hazard. Mater. 2020, 387, 121711. [Google Scholar] [CrossRef] [PubMed]
  16. Zhang, J.; Ren, S.; Xu, W.; Liang, C.; Li, J.; Zhang, H.; Li, Y.; Liu, X.; Jones, D.; Chadwick, D.; et al. Effects of plastic residues and microplastics on soil ecosystems: A global meta-analysis. J. Hazard. Mater. 2022, 435, 129065. [Google Scholar] [CrossRef] [PubMed]
  17. Marta, M.; Sara, G.; Jaime, V.; Juan, A.; Carmen, M. Deterioration pattern of six biodegradable, potentially low-environmental impact mulches in field conditions. J. Environ. Manag. 2017, 200, 490–501. [Google Scholar]
  18. Zhao, Y.; Zhang, F.; Li, L.; Yang, X.; Zhang, F.; Zhao, W.; He, Q. Substitution Experiment of Biodegradable Paper Mulching Film and White Plastic Mulching Film in Hexi Oasis Irrigation Area. Coatings 2022, 12, 1225. [Google Scholar] [CrossRef]
  19. Huang, F.; Liu, Z.; Mou, H.; Zhang, P.; Jia, Z. Effects of different long-term farmland mulching practices on the loessial soil fungal community in a semiarid region of China. Appl. Soil Ecol. 2019, 137, 111–119. [Google Scholar] [CrossRef]
  20. Chen, N.; Li, X.; Shi, H.; Hu, Q.; Zhang, Y.; Leng, X. Effect of biodegradable film mulching on crop yield, soil microbial and enzymatic activities, and optimal levels of irrigation and nitrogen fertilizer for the Zea mays crops in arid region. Sci. Total Environ. 2021, 776, 145970. [Google Scholar] [CrossRef]
  21. Gao, F.; Li, B.; Ren, B.; Zhao, B.; Liu, P.; Zhang, J. Achieve simultaneous increase in straw resources efficiency and nitrogen efficiency under crop yield stabilization—A case study of NCP in China for up to 8 years. Field Crop. Res. 2022, 278, 108431. [Google Scholar] [CrossRef]
  22. Chi, Y.; Gao, F.; Muhammad, I.; Huang, J.; Zhou, X. Effect of water conditions and nitrogen application on maize growth, carbon accumulation and metabolism of maize plant in subtropical regions. Arch. Agron. Soil Sci. 2023, 69, 693–707. [Google Scholar] [CrossRef]
  23. Yang, M.; Ma, S.; Mei, F.; Li, W.; Wang, T.; Guan, X. Adjusting Nitrogen Application in Accordance with Soil Water Availability Enhances Yield and Water Use by Regulating Physiological Traits of Maize under Drip Fertigation. Phyton 2021, 90, 417–435. [Google Scholar] [CrossRef]
  24. Wang, Y.; Zhang, X.; Chen, J.; Chen, A.; Wang, L.; Guo, X.; Niu, Y.; Liu, S.; Mi, G.; Gao, Q. Reducing basal nitrogen rate to improve maize seedling growth, water and nitrogen use efficiencies under drought stress by optimizing root morphology and distribution. Agric. Water Manag. 2019, 212, 328–337. [Google Scholar] [CrossRef]
  25. Elias, M.; Zhang, Z.; Dong, W.; Wang, S.; Liu, M.; Liu, E.; Mei, X. Plastic Film Mulching Improved Maize Yield, Water Use Efficiency, and N Use Efficiency under Dryland Farming System in Northeast China. Plants 2022, 11, 1710. [Google Scholar]
  26. Wang, X.; Wang, G.; Guo, T.; Xing, Y.; Mo, F.; Wang, H.; Fan, J.; Zhang, F. Effects of plastic mulch and nitrogen fertilizer on the soil microbial community, enzymatic activity and yield performance in a dryland maize cropping system. Eur. J. Soil Sci. 2020, 72, 400–412. [Google Scholar] [CrossRef]
  27. Fang, H.; Gu, X.; Jiang, T.; Yang, J.; Li, Y.; Huang, P.; Chen, P.; Yang, J. An optimized model for simulating grain-filling of maize and regulating nitrogen application rates under different film mulching and nitrogen fertilizer regimes on the Loess Plateau, China. Soil Tillage Res. 2020, 199, 104546. [Google Scholar] [CrossRef]
  28. Du, Y.; Sun, J.; Wang, Z.; Zhang, Q.; Cui, B.; Niu, W. Effect of ridge film mulching and nitrogen application rate on seed quality, oil yield and nitrogen-use efficiency of winter oilseed rape in northwest China. Arch. Agron. Soil Sci. 2022, 68, 1385–1397. [Google Scholar] [CrossRef]
  29. Xie, J.; Shi, X.; Zhang, Y.; Wan, Y.; Hu, Q.; Zhang, Y.; Wang, J.; He, X.; Evgenia, B. Improved nitrogen use efficiency, carbon sequestration and reduced environmental contamination under a gradient of manure application. Soil Tillage Res. 2022, 220, 105386. [Google Scholar] [CrossRef]
  30. Guo, R.; Qian, R.; Han, F.; Abdul, K.; Sadam, H.; Li, Y.; Zhang, P.; Chen, X.; Ren, X. Managing straw and nitrogen fertilizer based on nitrate threshold for balancing nitrogen requirement of maize and nitrate residue. J. Environ. Manag. 2023, 329, 117084. [Google Scholar] [CrossRef]
  31. Hamani, A.; Abubakar, S.; Wang, G.; Kama, R.; Kurihara, T.; Liu, K.; Gao, Y.; Duan, A. Optimized application of combined nitrogen and microbial decomposing inoculants increases wheat (Triticum aestivum L.) physiological growth and mitigates global warming potential under different water regimes. Environ. Exp. Bot. 2023, 206, 105170. [Google Scholar] [CrossRef]
  32. Luo, C.; Wang, R.; Li, C.; Zheng, C.; Dou, X. Photosynthetic characteristics, soil nutrients, and their interspecific competitions in an apple–soybean alley cropping system subjected to different drip fertilizer regimes on the Loess Plateau, China. Agric. Water Manag. 2023, 275, 108001. [Google Scholar] [CrossRef]
  33. Li, C.; Wang, Q.; Wang, N.; Luo, X.; Li, Y.; Zhang, T.; Feng, H.; Dong, Q. Effects of different plastic film mulching on soil hydrothermal conditions and grain-filling process in an arid irrigation district. Sci. Total Environ. 2021, 795, 148886. [Google Scholar] [CrossRef] [PubMed]
  34. Qi, Y.; Zhang, Q.; Hu, S.; Wang, R.; Wang, H.; Zhang, K.; Zhao, H.; Ren, S.; Yang, Y.; Zhao, F.; et al. Effects of High Temperature and Drought Stresses on Growth and Yield of Summer Maize during Grain Filling in North China. Agriculture 2022, 12, 1948. [Google Scholar] [CrossRef]
  35. Hussain, M.; Wang, Z.; Mo, Y.; Huang, G.; Kaousar, R.; Tan, W. Influence of Exogenous 28-Homobrassinolide Optimized Dosage and EDAH Application on Hormone Status, Grain Filling, and Maize Production. Processes 2022, 10, 1118. [Google Scholar] [CrossRef]
  36. Deng, T.; Wang, J.; Gao, Z.; Shen, S.; Liang, X.; Zhao, X.; Chen, X.; Wu, G.; Wang, X.; Zhou, S. Late Split-Application with Reduced Nitrogen Fertilizer Increases Yield by Mediating Source–Sink Relations during the Grain Filling Stage in Summer Maize. Plants 2023, 12, 625. [Google Scholar] [CrossRef] [PubMed]
  37. Gao, X.; Li, Y.; Yang, M.; Li, C.; Song, Y.; Wang, T.; Li, Y.; Shi, Y. Changes in grain-filling characteristics of single-cross maize hybrids released in China from 1964 to 2014. J. Integr. Agric. 2023, 22, 691–700. [Google Scholar] [CrossRef]
  38. Fu, J.; He, Z.; Jia, B.; Liu, Z.; Li, Z.; Liu, H.; Liu, G. Simulation of maize grain filling process under nitrogen drip irrigation. Soil Fertil. Sci. China 2020, 288, 157–164. [Google Scholar]
  39. Wang, Y.; Song, Y.; Zhang, Y.; Kong, D.; Zhao, Q.; Lin, J.; Huang, K. Characteristics of starch synthesis and grain filling of common buckwheat. J. Cereal Sci. 2017, 73, 116–121. [Google Scholar] [CrossRef]
  40. Wen, T.; Jia, Y.; Du, X.; You, J.; Yin, X.; Wen, Z.; Yang, W.; Shi, H.; Gao, H.; Zhu, J.; et al. Response of super and inferior grain filling characteristics in rice to exogenous plant growth regulators based on Richards equation. J. Nanjing Agric. Univ. 2022, 45, 1107–1116. [Google Scholar]
  41. Du, S.; Qiao, Y.; Li, W.; Chen, H.; Zhao, Z.; Zhang, X.; Cao, C. Effects of sowing date and rate on grain filling characteristics of winter wheat under chilling injury. Chin. J. Eco-Agric. 2014, 22, 551–559. [Google Scholar]
  42. Yue, K.; Li, L.; Xie, J.; Wang, L.; Liu, Y.; Anwar, S. Tillage and nitrogen supply affects maize yield by regulating photosynthetic capacity, hormonal changes and grain filling in the Loess Plateau. Soil Tillage Res. 2022, 218, 105317. [Google Scholar] [CrossRef]
  43. Ren, H.; Jiang, Y.; Zhao, M.; Qi, H.; Li, C. Nitrogen Supply Regulates Vascular Bundle Structure and Matter Transport Characteristics of Spring Maize Under High Plant Density. Front. Plant Sci. 2021, 11, 602739. [Google Scholar] [CrossRef] [PubMed]
  44. Yu, N.; Zhang, J.; Liu, P.; Zhao, B.; Ren, B. Integrated agronomic practices management improved grain formation and regulated endogenous hormone balance in summer maize (Zea mays L.). J. Integr. Agric. 2020, 19, 1768–1776. [Google Scholar] [CrossRef]
  45. Wei, S.; Wang, X.; Li, G.; Qin, Y.; Jiang, D.; Dong, S. Plant Density and Nitrogen Supply Affect the Grain-Filling Parameters of Maize Kernels Located in Different Ear Positions. Front. Plant Sci. 2019, 10, 180. [Google Scholar] [CrossRef] [PubMed]
  46. Commuri, P.; Jones, R. Ultrastructural characterization of maize (Zea mays L.) kernels exposed to high temperature during endosperm cell division. Plant Cell Environ. 2010, 22, 375–385. [Google Scholar] [CrossRef]
  47. Li, X.; Li, Y.; Zou, Q.; Ding, W. Effects of Combined Application of Slow-release Fertilizer on the Filling Characteristics of Summer Maize. Water Sav. Irrig. 2022, 324, 84–90+101. [Google Scholar]
  48. Li, A.; Zhang, J.; Cui, X.; Zhao, L.; Liu, J.; Hu, T. Nitrogen fertilizer synergist in urea under irrigation for high yield of summer maize at the filling stag. Trans. CSAE 2023, 39, 99–110. [Google Scholar]
  49. Pico, L.; Vyn, T. Dry Matter Gains in Maize Kernels Are Dependent on Their Nitrogen Accumulation Rates and Duration during Grain Filling. Plants 2021, 10, 1222. [Google Scholar] [CrossRef]
  50. Gasura, E.; Setimela, P.; Edema, R.; Gibson, P.; Okori, P.; Tarekegne, A. Exploiting Grain-Filling Rate and Effective Grain-Filling Duration to Improve Grain Yield of Early-Maturing Maize. Crop Sci. 2013, 53, 2295–2303. [Google Scholar] [CrossRef]
  51. Li, Q.; Du, L.; Feng, D.; Ren, Y.; Li, Z.; Kong, F.; Yuan, J. Grain-filling characteristics and yield differences of maize cultivars with contrasting nitrogen efficiencies. Crop J. 2020, 8, 990–1001. [Google Scholar] [CrossRef]
Figure 1. Rainfall and average temperature during the 2021 and 2022 experimental periods.
Water 16 00088 g001
Figure 2. The Richards equation fitting curve of maize grain filling under different mulching and nitrogen application levels (2021 and 2022). Note: (a,c) plastic-film mulching treatment; (b,d) degradation film-covering treatment.
Water 16 00088 g002
Figure 3. Correlation coefficient diagram under different treatments (2021 and 2022).
Water 16 00088 g003
Figure 4. Correlation between grain-filling parameters and 100-kernel weight under different treatments. Note: * represents the difference level at p < 0.05.
Water 16 00088 g004
Table 1. Effects of mulching and nitrogen application on yield components of maize.
YearTreatmentEar Length (cm)Ear Diameter (mm)KernelsEar Weight (g)
2021JN016.8 ± 0.66 c45.86 ± 1.82 b476 ± 10.69 d184.66 ± 5.18 c
JN118.4 ± 0.71 bc47.61 ± 1.81 ab504 ± 13.12 cd211.66 ± 10.23 bc
JN220.2 ± 0.63 ab51.36 ± 2.07 ab574 ± 9.87 ab240.00 ± 9.68 ab
JN319.3 ± 0.51 ab50.73 ± 1.08 ab532 ± 17.47 bc234.55 ± 11.89 ab
PN017.2 ± 0.33 c46.95 ± 2.06 b480 ± 13.01 d198.57 ± 5.27 c
PN118.6 ± 0.55 bc48.81 ± 1.51 ab518 ± 17.24 cd226.57 ± 8.18 ab
PN220.5 ± 0.26 a52.91 ± 1.30 a588 ± 15.01 a248.57 ± 7.09 a
PN319.3 ± 0.74 ab50.37 ± 1.75 ab544 ± 9.87 bc245.30 ± 10.17 a
F testF0.317 ns0.519 ns1.310 ns3.768 ns
N12.297 **4.383 *20.542 **15.072 **
F × N0.045 ns0.122 ns0.061 ns0.055 ns
2022JN015.8 ± 0.45 d40.18 ± 1.00 d420 ± 11.14 f167.64 ± 7.60 e
JN117.2 ± 0.46 bcd43.56 ± 1.24 cd456 ± 16.17 ef193.16 ± 5.37 cd
JN219.7 ± 0.65 a49.18 ± 1.46 ab546 ± 15.28 ab225.52 ± 8.74 ab
JN318.4 ± 0.57 ab48.36 ± 1.20 ab504 ± 10.82 cd216.95 ± 8.16 abc
PN016.6 ± 0.60 cd42.07 ± 1.05 cd434 ± 14.19 f180.97 ± 8.88 de
PN117.8 ± 0.54 bc45.59 ± 1.28 bc476 ± 8.08 de207.34 ± 5.11 bc
PN219.7 ± 0.31 a50.77 ± 1.10 a560 ± 16.77 a239.68 ± 7.26 a
PN318.7 ± 0.62 ab49.72 ± 1.73 a518 ± 11.72 bc231.02 ± 11.22 ab
F testF1.166 ns3.632 ns2.705 ns6.054 *
N14.436 **20.777 **33.602 **21.360 **
F × N0.198 ns0.028 ns0.025 ns0.001 ns
Note: ns indicates no significant difference; * represents the difference level at p < 0.05; ** represents the difference level at p < 0.01, The same column of numbers with different letters indicates significant differences at the p < 0.05 level.
Table 2. The Richards model parameters of maize under different treatments.
YearTreatmentABKNR2
2021JN021.07 d8.2209 bc0.1233 bc0.4688 c0.9966
JN123.84 c16.2059 b0.1361 b0.5538 bc0.9982
JN228.76 a2.0937 c0.1036 e0.2184 d0.9975
JN326.85 b19.8775 b0.1190 cd0.6862 b0.9948
PN020.45 d15.9095 b0.1307 bc0.6526 b0.9948
PN124.61 c84.5079 a0.1560 a1.0821 a0.9949
PN227.92 ab1.2074 c0.1055 de0.1302 d0.9956
PN327.37 b7.1372 bc0.0967 e0.4370 c0.9955
2022JN020.05 d13.8132 bcde0.1327 ab0.5720 bc0.9933
JN122.95 c24.4889 b0.1413 a0.6905 b0.9969
JN228.03 a4.2791 de0.1096 cd0.3409 d0.9942
JN325.89 b19.2472 bc0.1203 bc0.6660 b0.9942
PN019.71 d16.8316 bcd0.1323 ab0.6566 b0.9931
PN123.45 c58.3346 a0.1483 a1.0071 a0.9970
PN227.52 a1.7116 e0.1132 cd0.1429 e0.9949
PN326.37 b9.3674 cde0.0996 d0.4801 cd0.9948
Note: After the same column of numbers, different letters show significant differences (p < 0.05), the same as below.
Table 3. Analysis of variance (p-value) of model parameters for different treatments.
Treatment20212022
ABKNABKN
Fp < 0.05p < 0.01p > 0.05p < 0.05p < 0.05p > 0.05p > 0.05p > 0.05
Np < 0.01p < 0.01p < 0.01p < 0.01p < 0.01p < 0.01p < 0.01p < 0.01
F × Np > 0.05p < 0.01p < 0.01p < 0.01p > 0.05p < 0.01p > 0.05p < 0.01
Table 4. Effects of mulching and nitrogen application on grain-filling characteristic parameters of maize.
YearTreatmentR0Wmax (g)Vmax (g·d−1)Tmax (d)V (g·d−1)
2021JN00.2660 bc9.2716 g0.7781 f22.9945 e0.5255 g
JN10.2464 bc10.7564 e0.9419 c24.7335 c0.6350 c
JN20.5198 b11.6248 c0.9879 b21.2223 f0.6702 b
JN30.1744 bc12.5256 a0.8832 d27.9679 b0.5936 e
PN00.2059 bc9.4461 f0.7464 g23.7066 d0.5019 h
PN10.1443 c12.4916 a0.9357 c27.8546 b0.6224 d
PN20.9585 a10.8987 d1.0168 a20.6870 g0.6905 a
PN30.2218 bc11.9348 b0.8030 e28.8146 a0.5427 f
F testF1.159 ns24.604 **36.485 **735.078 **61.790 **
N12.441 **1720.615 **819.132 **7305.257 **1165.034 **
F × N2.687 ns357.5 **38.649 **397.004 **48.186 **
2022JN00.2368 b9.0770 e0.7657 f23.5439 f0.5159 f
JN10.2069 b10.7174 d0.8952 c24.8379 d0.6016 c
JN20.3257 b11.8500 b0.9684 b22.9227 g0.6557 b
JN30.1814 b12.0211 a0.8676 d27.7440 b0.5833 d
PN00.2035 b9.1268 e0.7283 g24.0921 e0.4898 g
PN10.1475 b11.7357 bc0.8671 d27.2463 c0.5779 d
PN20.9323 a10.7968 d1.0695 a21.3741 h0.7262 a
PN30.2089 b11.6448 c0.7830 e29.5873 a0.5287 e
F testF4.323 ns6.078 *10.590 **267.399 **16.105 **
N11.062 **1088.563 **928.594 **3229.572 **1402.091 **
F × N5.904 **140.065 **111.705 **312.109 **165.747 **
Note: ns indicates no significant difference; * represents the difference level at p < 0.05; ** represents the difference level at p < 0.01, The same column of numbers with different letters indicates significant differences at the p < 0.05 level.
Table 5. Effects of different treatments on grain filling duration, grain-filling rate and grain-filling contribution rate of maize.
YearTreatmentGradual Increase PeriodRapid Increase PeriodSlow Increase Period
T1
(d)
V1
(g·d−1)
P1T2
(d)
V2
(g·d−1)
P2T3
(d)
V3
(g·d−1)
P3
2021JN013.6736 e0.2220 d0.1457 c18.6417 cd0.6777 f0.6055 b28.0583 b0.1851 de0.2487 b
JN116.0782 c0.2313 cd0.1576 bc17.3106 d0.8215 c0.6024 bc25.1564 b0.2253 b0.2400 bc
JN211.0230 f0.2796 a0.1087 d20.3986 b0.8560 b0.6129 a34.3933 a0.2309 ab0.2784 a
JN317.6831 b0.2626 b0.1751 b20.5696 b0.7717 d0.5970 c28.4869 b0.2130 c0.2280 c
PN014.4023 d0.2383 c0.1704 b18.6085 cd0.6518 g0.5982 c26.2052 b0.1797 e0.2314 c
PN119.2577 a0.2816 a0.2227 a17.1938 d0.8211 c0.5794 d20.8855 c0.2309 ab0.1979 d
PN211.0191 f0.2374 c0.0949 d19.3358 bc0.8791 a0.6147 a34.0464 a0.2361 a0.2905 a
PN317.0560 b0.2244 cd0.1413 c23.5173 a0.6990 e0.6067 b35.8250 a0.1906 d0.2520 b
F testF25.037 **1.186 ns4.655 *1.640 ns26.823 **12.372 **0.055 ns10.168 **2.603 ns
N366.649 **17.224 **56.688 **36.078 **604.133 **49.668 **29.577 **315.356 **57.550 **
F × N25.952 **49.804 **20.018 **6.600 **31.149 **27.797 **7.305 **24.005 **16.841 **
2022JN014.5999 d0.2166 c0.1598 bc17.8880 c0.6679 e0.6015 cd25.8950 cd0.1834 e0.2386 cd
JN116.1637 c0.2462 b0.1755 b17.3485 c0.7822 c0.5967 d24.0136 d0.2160 c0.2277 d
JN212.8649 e0.2743 a0.1273 d20.1155 b0.8414 b0.6098 ab31.9647 ab0.2284 b0.2629 b
JN317.6321 b0.2504 b0.1725 b20.2239 b0.7578 d0.5978 d28.1966 bc0.2090 d0.2297 d
PN014.9112 d0.2235 c0.1711 b18.3616 c0.6361 f0.5982 d25.7241 cd0.1754 f0.2307 d
PN118.3472 a0.2709 a0.2142 a17.7982 c0.7603 d0.5829 e22.1208 d0.2131 cd0.2029 e
PN212.3209 e0.2136 c0.0969 e18.1065 c0.9249 a0.6145 a31.6848 ab0.2486 a0.2887 a
PN318.0025 ab0.2134 c0.1474 cd23.1696 a0.6821 e0.6051 bc34.7078 a0.1864 e0.2475 c
F testF13.727 **32.962 **0.077 ns1.781 ns9.582 **0.826 ns1.364 ns5.917 *0.588 ns
N236.601 **32.617 **47.528 **28.910 **687.790 **39.971 **23.316 **337.909 **49.305 **
F × N13.421 **46.210 **10.688 **8.852 **82.415 **10.829 **4.371 *42.318 **10.521 **
Note: ns indicates no significant difference; * represents the difference level at p < 0.05; ** represents the difference level at p < 0.01. The same column of numbers with different letters indicates significant differences at the p < 0.05 level.
Table 6. Path analysis of grain-filling parameters and 100-kernel weight under different treatments.
TreatmentParameterCorrelation CoefficientDirect Path CoefficientIndirect Path Coefficient
R0→AT1→AV1→AV3→A
JR00.4870.040 −0.02520.03120.2426
T1−0.1950.028−0.0360 −0.0165−0.0852
V10.9500.0650.0134−0.0071 0.5006
V30.8050.5960.0265−0.00930.0546
PR00.5480.025 −0.3081−0.06540.4232
T1−0.1720.397−0.0194 0.0865−0.2404
V1−0.2780.152−0.17070.2259 0.2130
V30.6140.7030.0915−0.05200.0461
Disclaimer/Publisher’s Note: The statements, opinions and data contained in all publications are solely those of the individual author(s) and contributor(s) and not of MDPI and/or the editor(s). MDPI and/or the editor(s) disclaim responsibility for any injury to people or property resulting from any ideas, methods, instructions or products referred to in the content.

