1. Introduction
Water exists as two primary sources, i.e., groundwater and surface water. Out of the present 2.5% of the earth’s freshwater resources, 30% reflects groundwater [
1]. However, anthropogenic activities combined with natural factors frequently cause groundwater quality to deteriorate. Nevertheless, the key drivers of groundwater quality degradation are recognized as industrialization, population growth, and inadequate waste management practices [
2]. Pakistan is the fourth largest groundwater consumer in the world, and more than half of the country’s overall crop water requirements are met by this finite source [
3].
According to the National Bureau of Statistics of Pakistan, nearly half of the population has access to safe water, while only 26.1% satisfy international drinking water standards [
4]. Punjab is the most populated province of Pakistan. The population of Punjab increased from 20 million in 1951 to more than 110 million in 2017 [
5]. Rapid urbanization, industrialization, unplanned consumption of groundwater, and lifestyle changes are increasing water demand [
6]. Furthermore, about 90% of the Punjab household population relies on groundwater reserves for daily water demands.
Water quality is one of the most critical challenges in managing water resources [
7]. The unconfined aquifers of the Punjab province are gradually contaminated through leaks from the sewerage system, dumping of untreated effluents, and leachate from landfill sites. The unconfined alluvial aquifers in the study area are increasingly threatened by contamination from untreated municipal and industrial wastewater discharges, leachate infiltration, and agricultural runoff containing fertilizers and pesticides. A review of the Punjab region highlighted the rapid urban expansion, industrialization, and population pressures as key factors underlying water pollution risks to vulnerable aquifer zones tapped for irrigation and potable use [
8]. Recent modeling studies have shown elevated groundwater nitrate levels in rural Punjab districts, indicating the impacts of fertilizer application for intensive cropping patterns [
9]. Moreover, abstractions from the aquifer are rising at a rapid rate to meet the ever-increasing water demands due to reduced surface water availability [
10]. The WQI serves as an indicator of the waterbody’s condition [
11] and is commonly employed to encapsulate the intricate interplay of factors influencing water quality, encompassing a diverse array of parametric measures [
12]. Indeed, establishing WQI is an essential step in water resource management and has gained worldwide importance as a tool for measuring the water quality of aquatic bodies. Various multicriteria decision-making techniques have been applied to evaluate the effects of different alternatives on water. For example, ref. [
13] employed the WQI to evaluate water quality in distinct stages, employing two multicriteria decision-making (MCDM) methods: (1) AHP and (2) assessing attractiveness using a categorically based evaluation methodology. Drinking water quality and suitability for potable use are major concerns for the region’s groundwater reserves, which are tapped extensively to meet municipal demands.
Sutadian et al. [
14] highlighted the significance of the precise determination of weights for different water quality indicators in formulating the WQI. Previous studies have employed various methods to calculate the weights for water quality indicators; for instance, ref. [
15] stated that the AHP method has the capability to manage all sorts of water resources based on social, economic, and environmental criteria. In addition, the efficacy of the indicator weights calculation process may be increased by combining the AHP with other procedures. Reference [
16] stated that the AHP method is the most reliable tool for assigning the ranks as it is based on the universally accepted Saaty’s scale. Moreover, it indicated that the AHP method is a better choice in determining the relative importance of objectives, sub-objectives, and alternatives in selecting the best irrigation methods. Refs. [
17,
18] employed GIS and MCDA to generate the groundwater quality index in which the AHP was utilized to determine the weights of numerous criteria and their classes.
Ref. [
19] utilized the National Sanitation Foundation Water Quality Index (NSFWQI) in an environment suitable for irrigation. Researchers globally have applied the water quality index to assess groundwater quality in various regions, such as Dier al-Balah, Palestine. Ref. [
20], Sereflikochisar Basin of Turkey [
21], Telangana State, South India [
22], the Coastal Zones of Srikakulam, India, ref. [
23], Iraqi city of Karbala [
24], Iran’s Lenjanat plain aquifer ([
25], Ranchi, Jharkhand, India [
26].
Previous studies on groundwater quality assessment in Pakistan have investigated a limited set of parameters, mostly focused on major cities, including Lahore [
27], Rawalpindi and Islamabad [
28], Lower Jhelum Canal [
29], and the industrialized city of Faisalabad [
30] using the integrated geospatial and water quality index approaches in Pakistan. While providing important insights into groundwater pollution sources in urban areas, the water quality evaluations have been constrained to a few heavy metals and microbiological parameters. A comprehensive analysis incorporating a broader range of quality indicators across rural and urban areas at the provincial scale has been lacking.
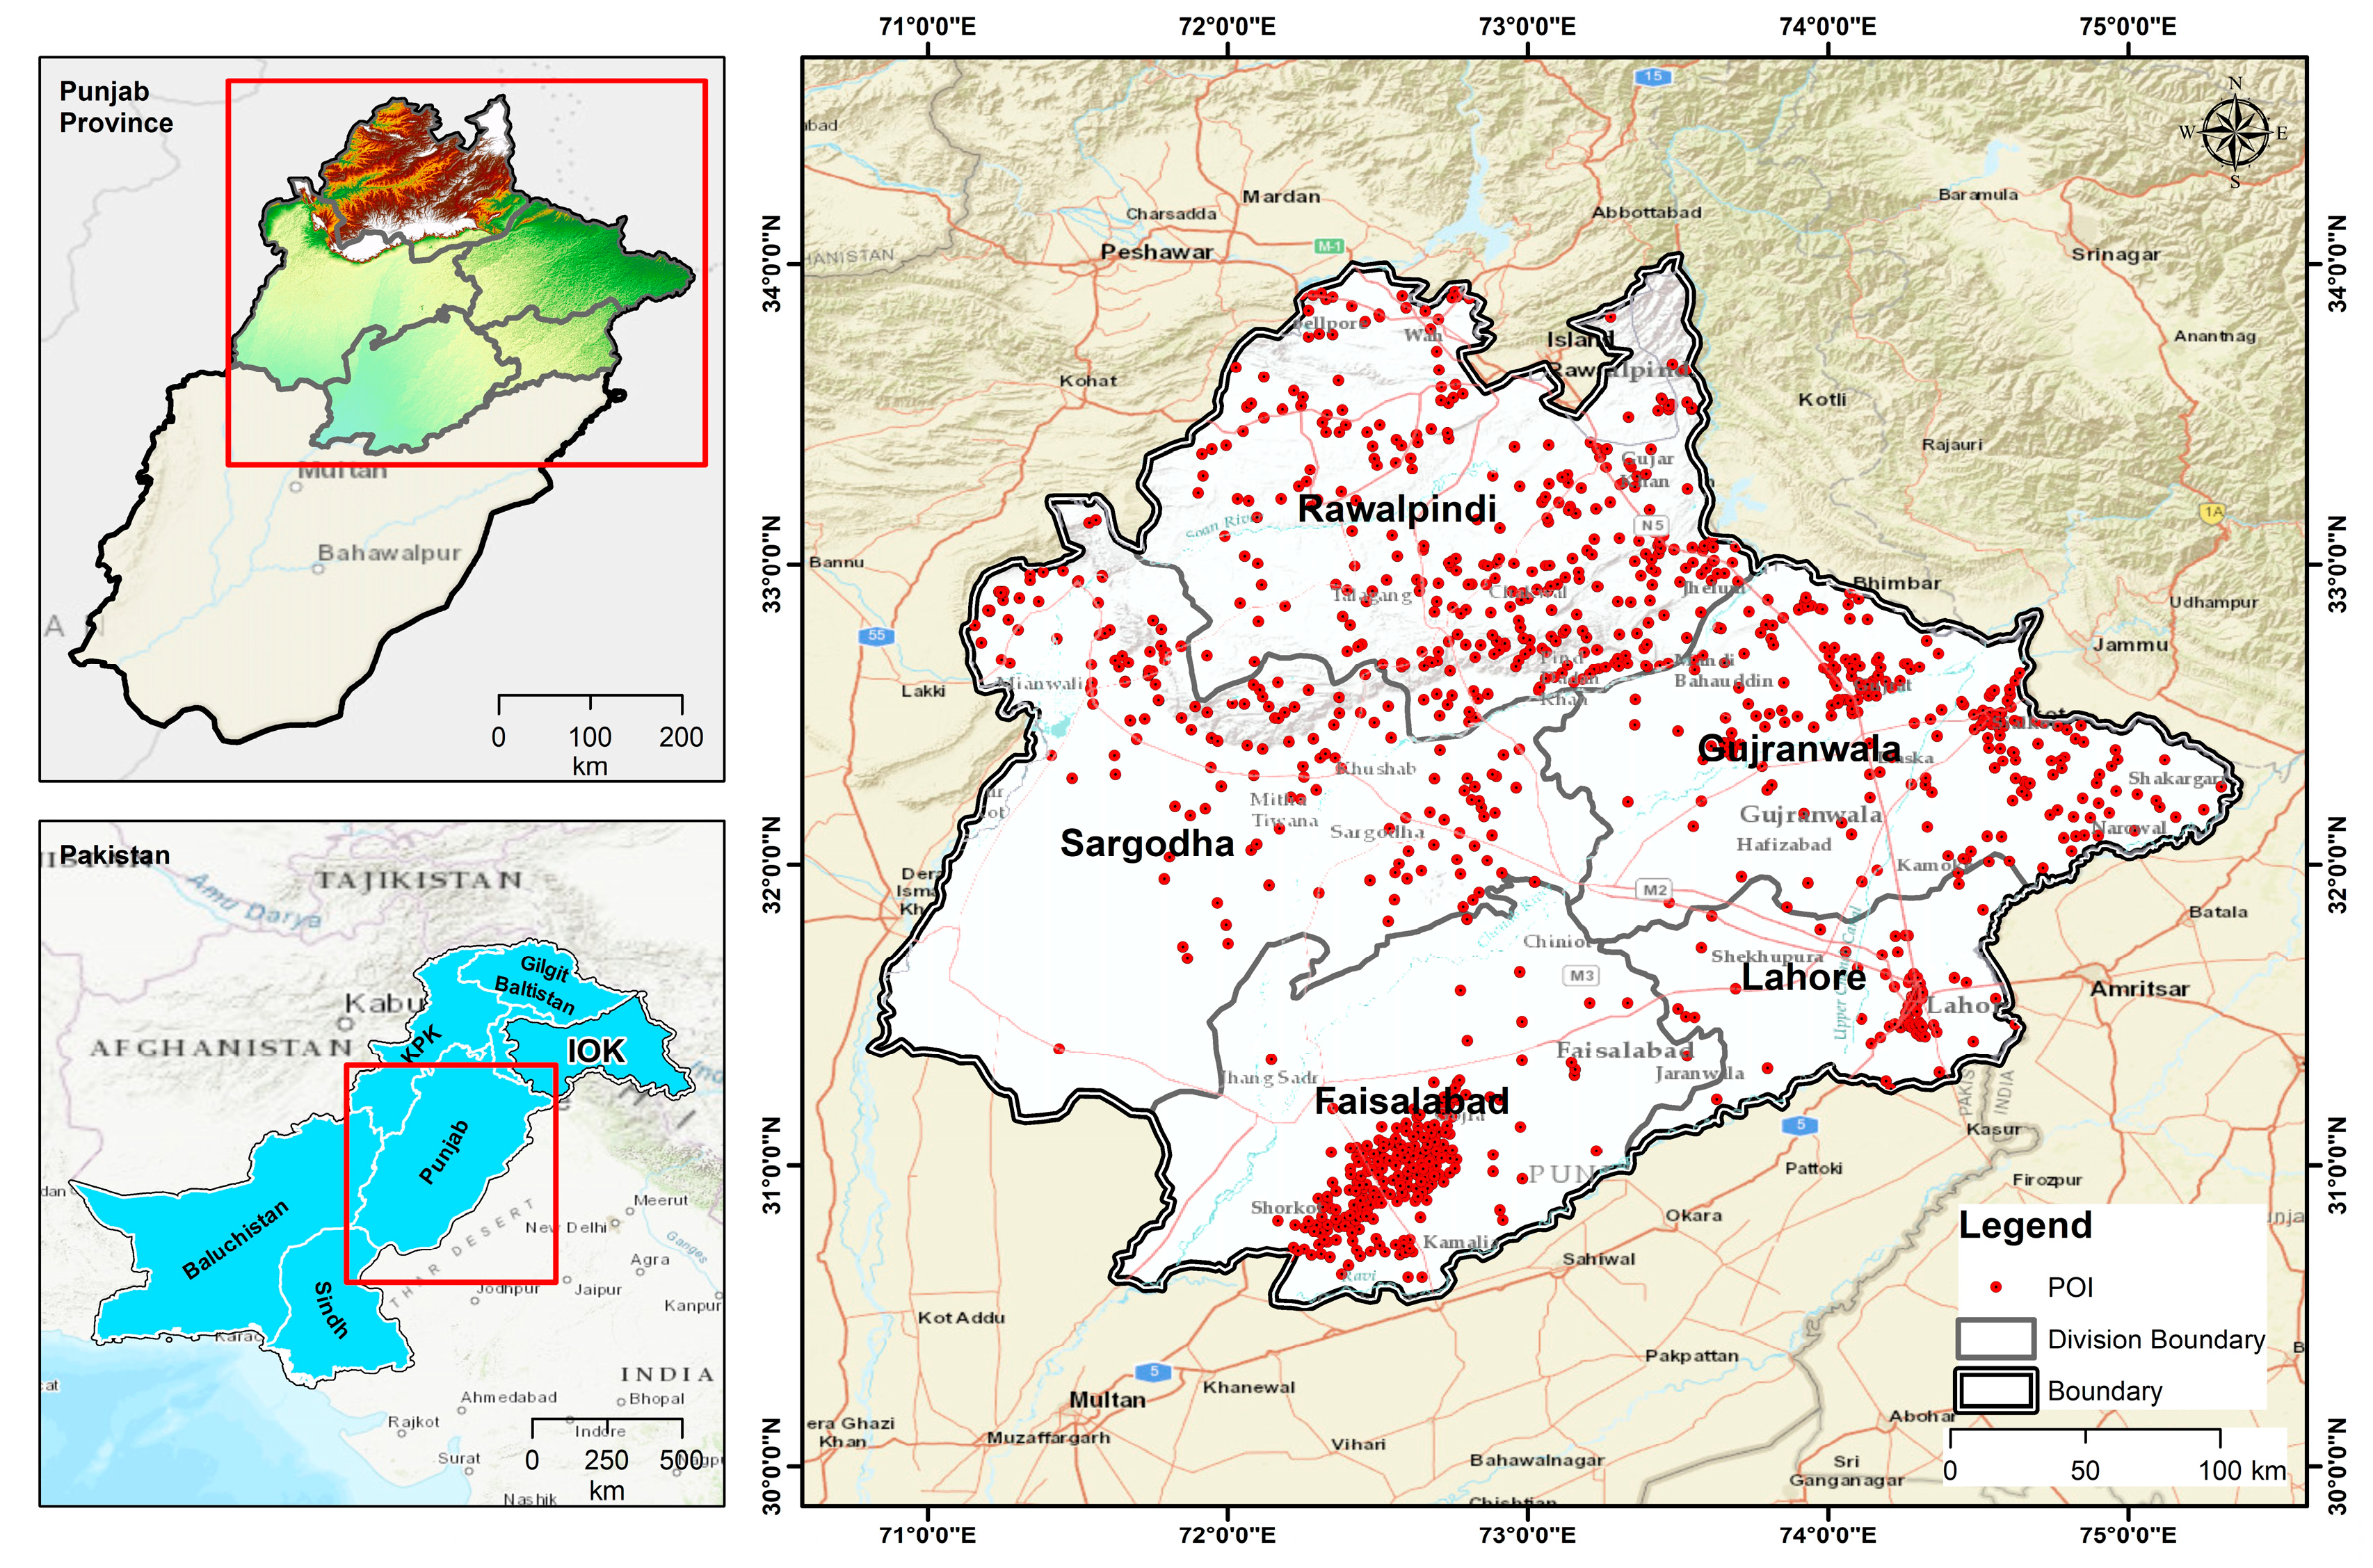
This study aims to address this gap by evaluating the groundwater quality status in Punjab province through an integrated modeling approach utilizing a more expansive set of 24 physicochemical and microbiological parameters. The parameters were measured at over 1094 sampling sites across five divisions—Lahore, Rawalpindi, Sargodha, Faisalabad, and Gujranwala—encompassing both rural and urban areas. The larger spatial scale spanning the entire populous Punjab region provides new insights into groundwater pollution patterns across hydrogeological zones and land use categories.
The integrated water quality indexing and geospatial techniques applied to the extensive provincial water quality dataset also represent a novel contribution to delineating groundwater quality zones and identifying priority areas for mitigation strategies. The study develops an AHP-based weighted water quality index considering the suitability of drinking and irrigation usage. The indexed groundwater quality layers are then analyzed in conjunction with land use, depth to water table, groundwater recharge, and other factors to holistically characterize the key drivers of groundwater pollution at the Punjab scale. Moreover, different management scenarios were developed by altering the current wastewater treatment methods and evaluating the impact of various water quality indicators on WQI to improve groundwater quality.
2. Methodology
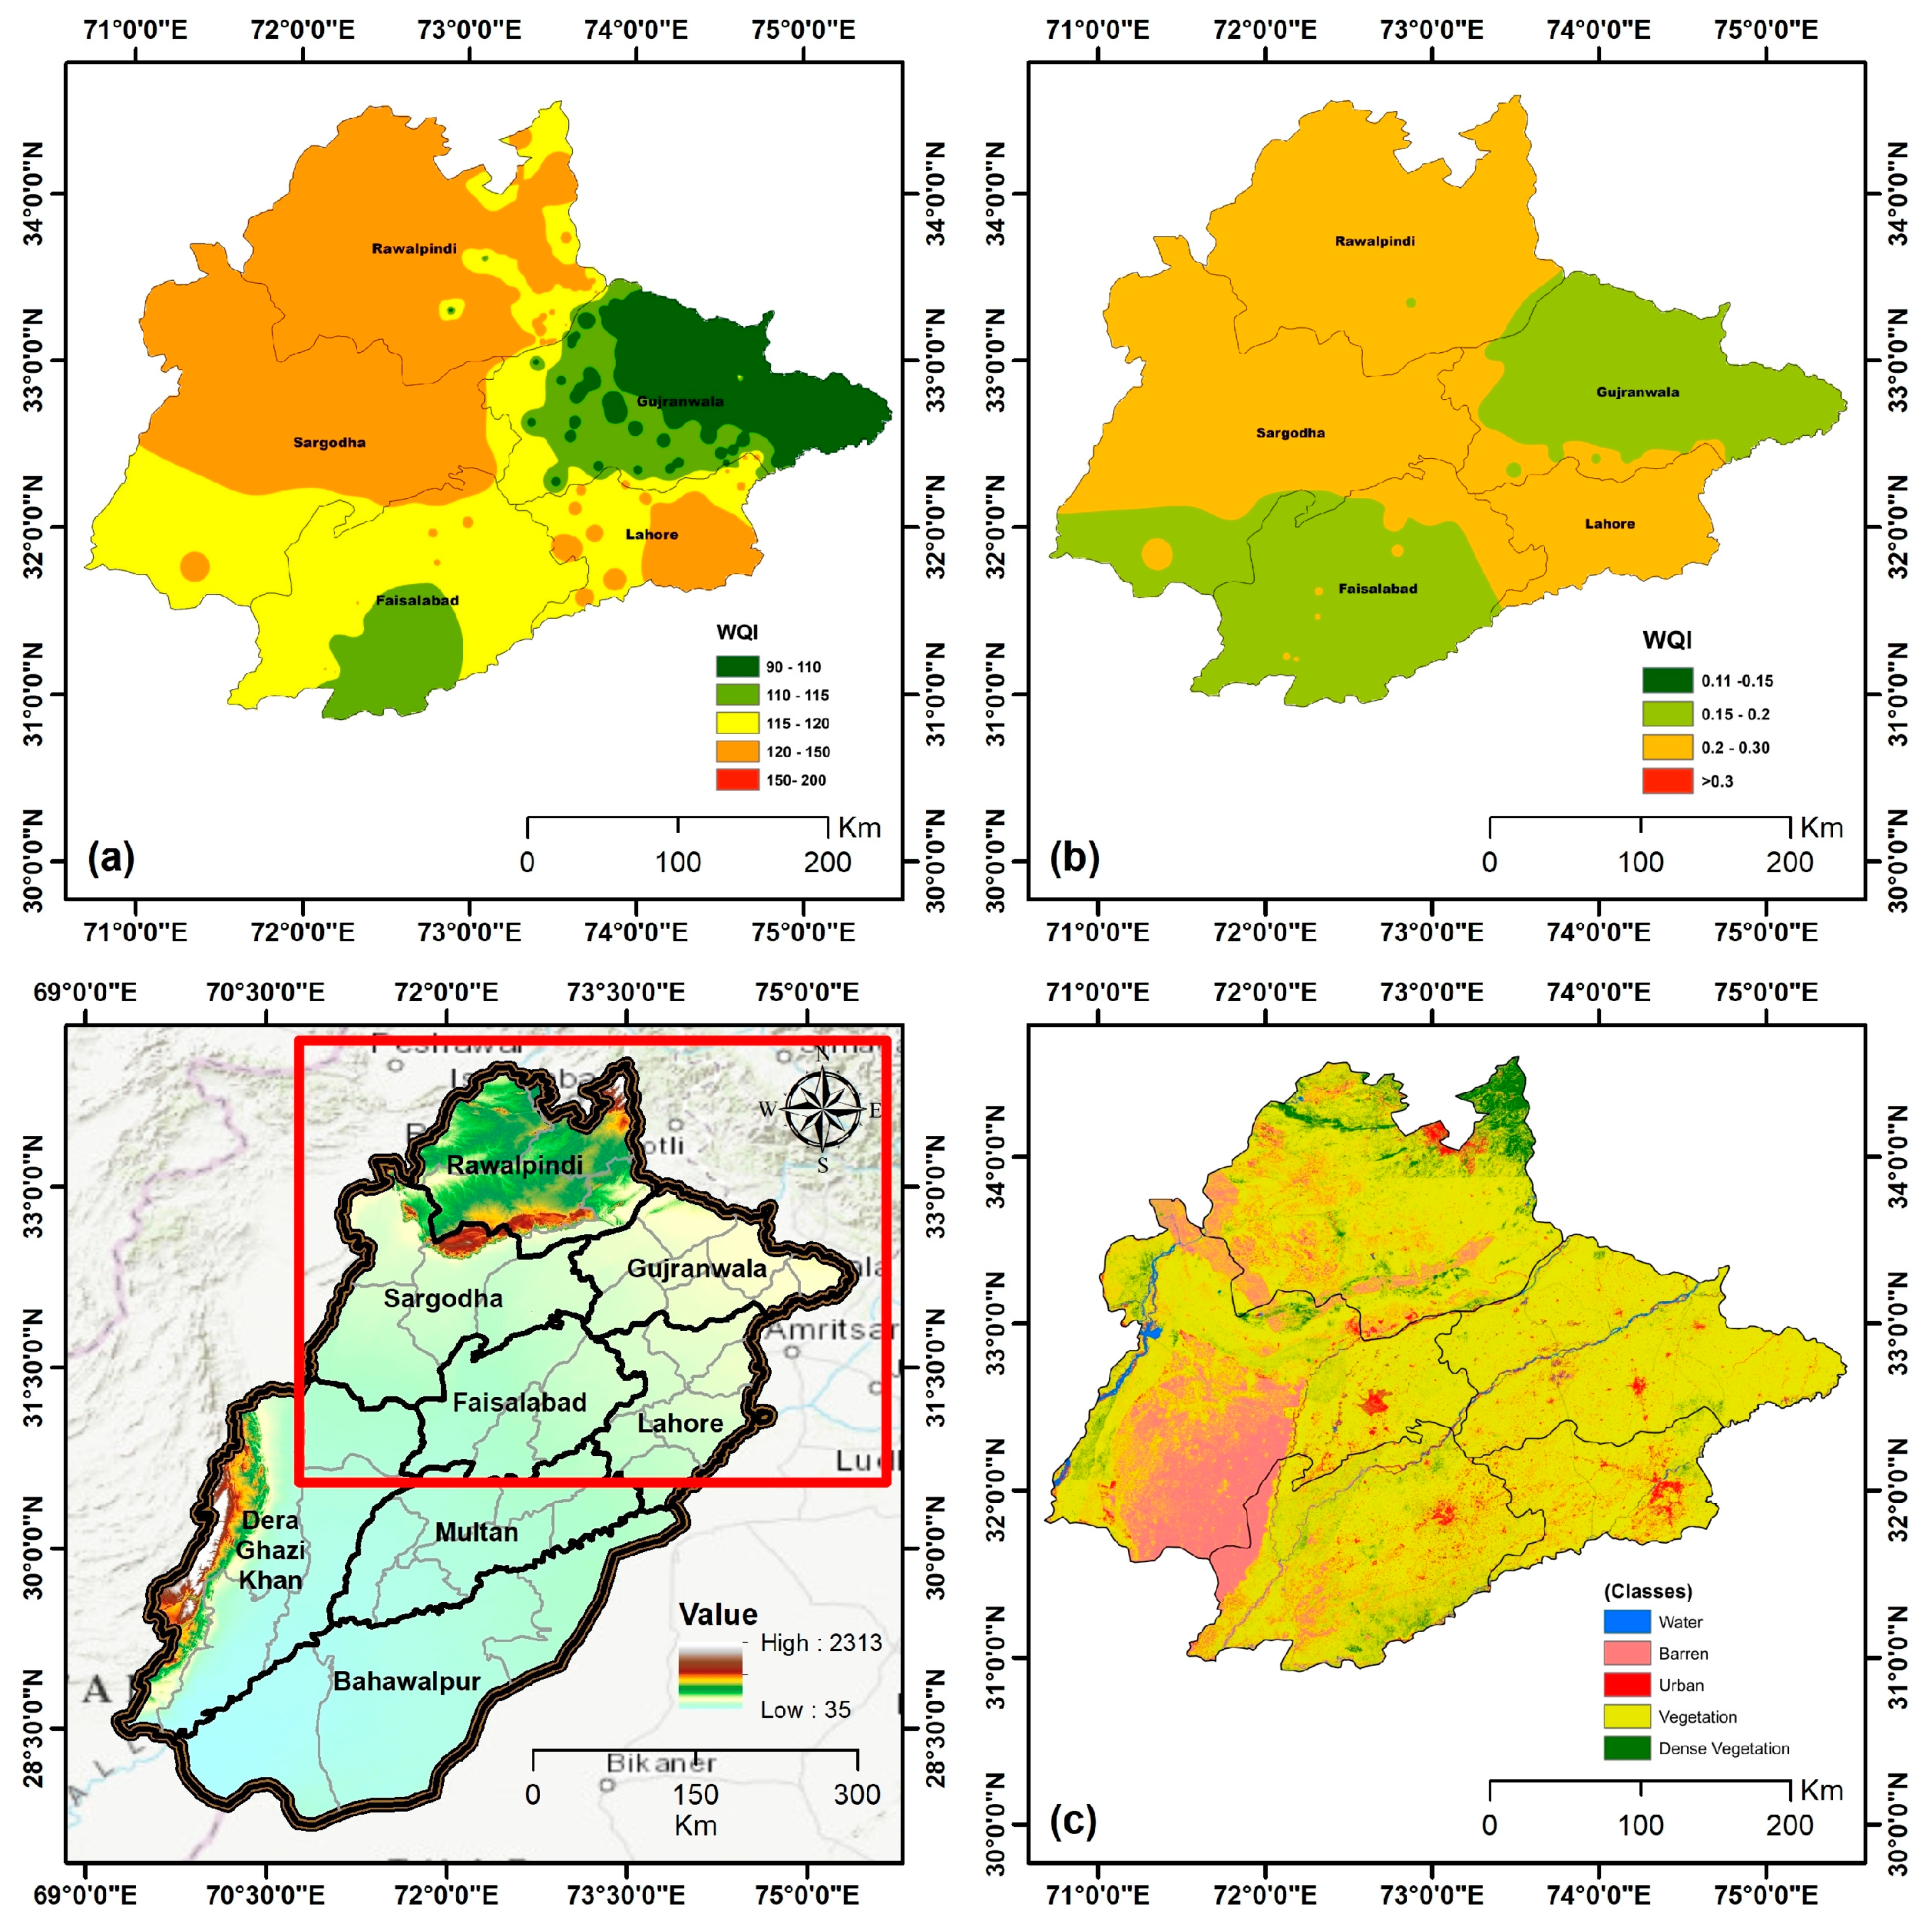
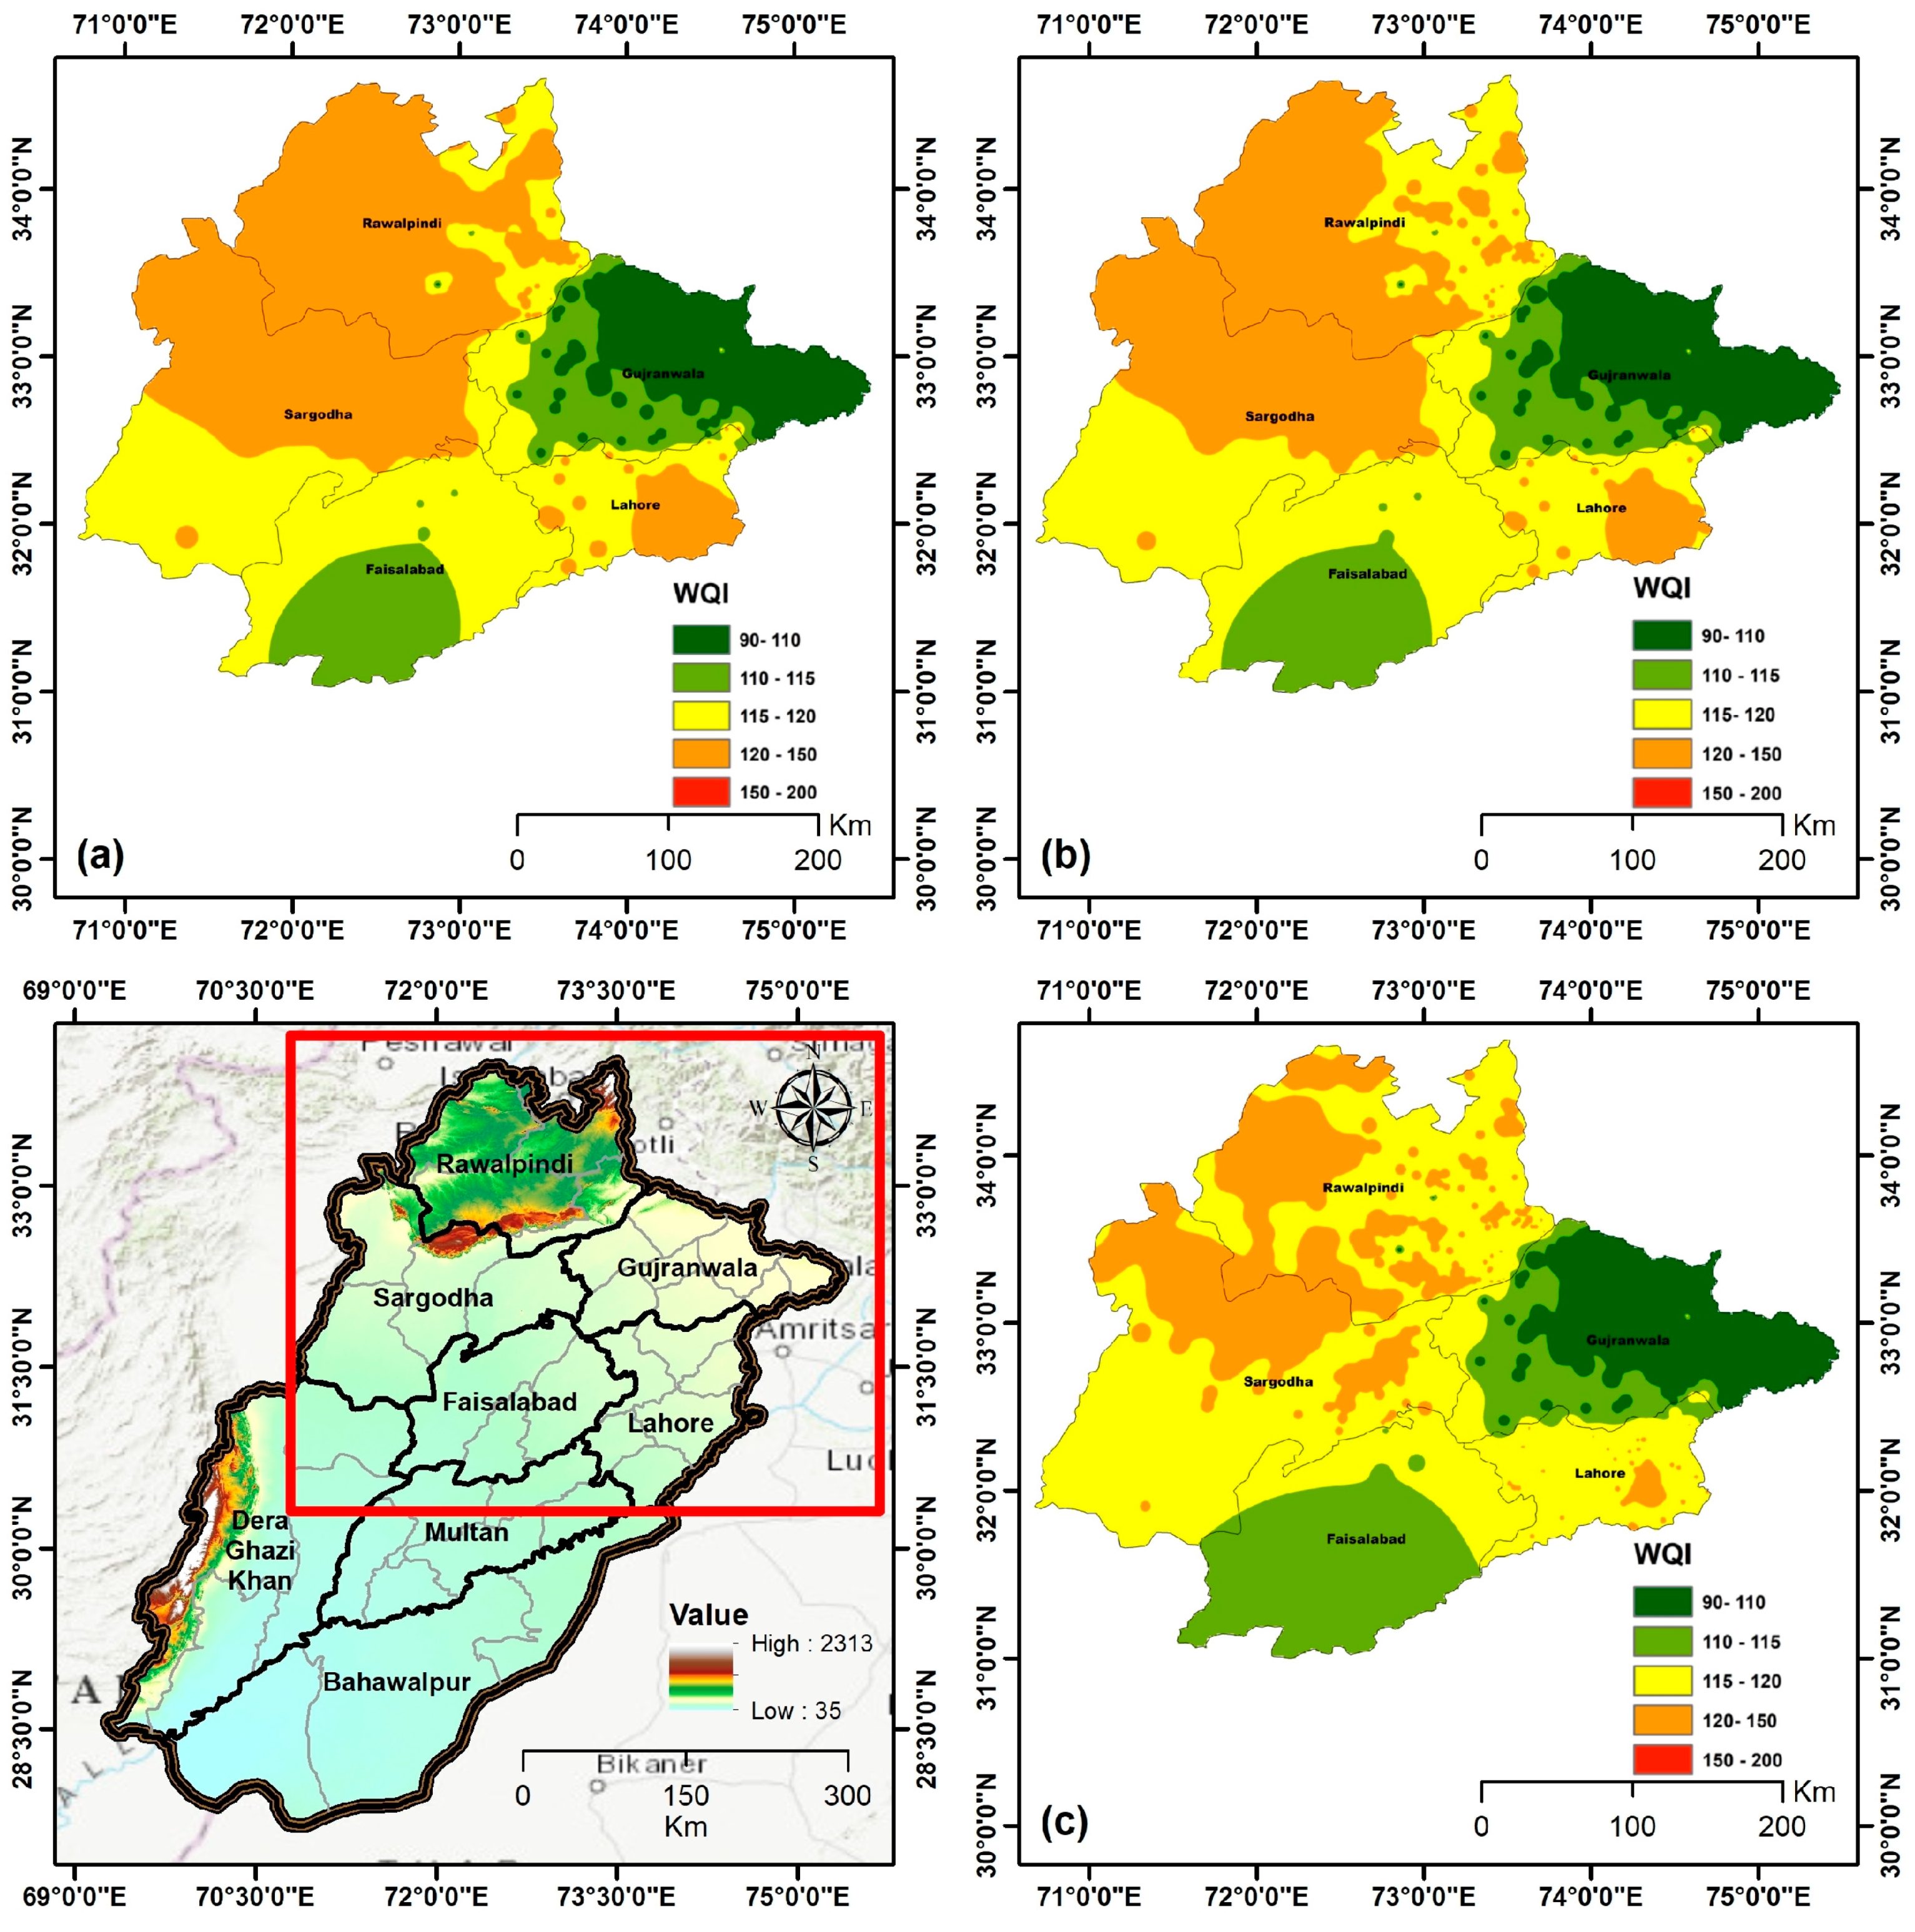
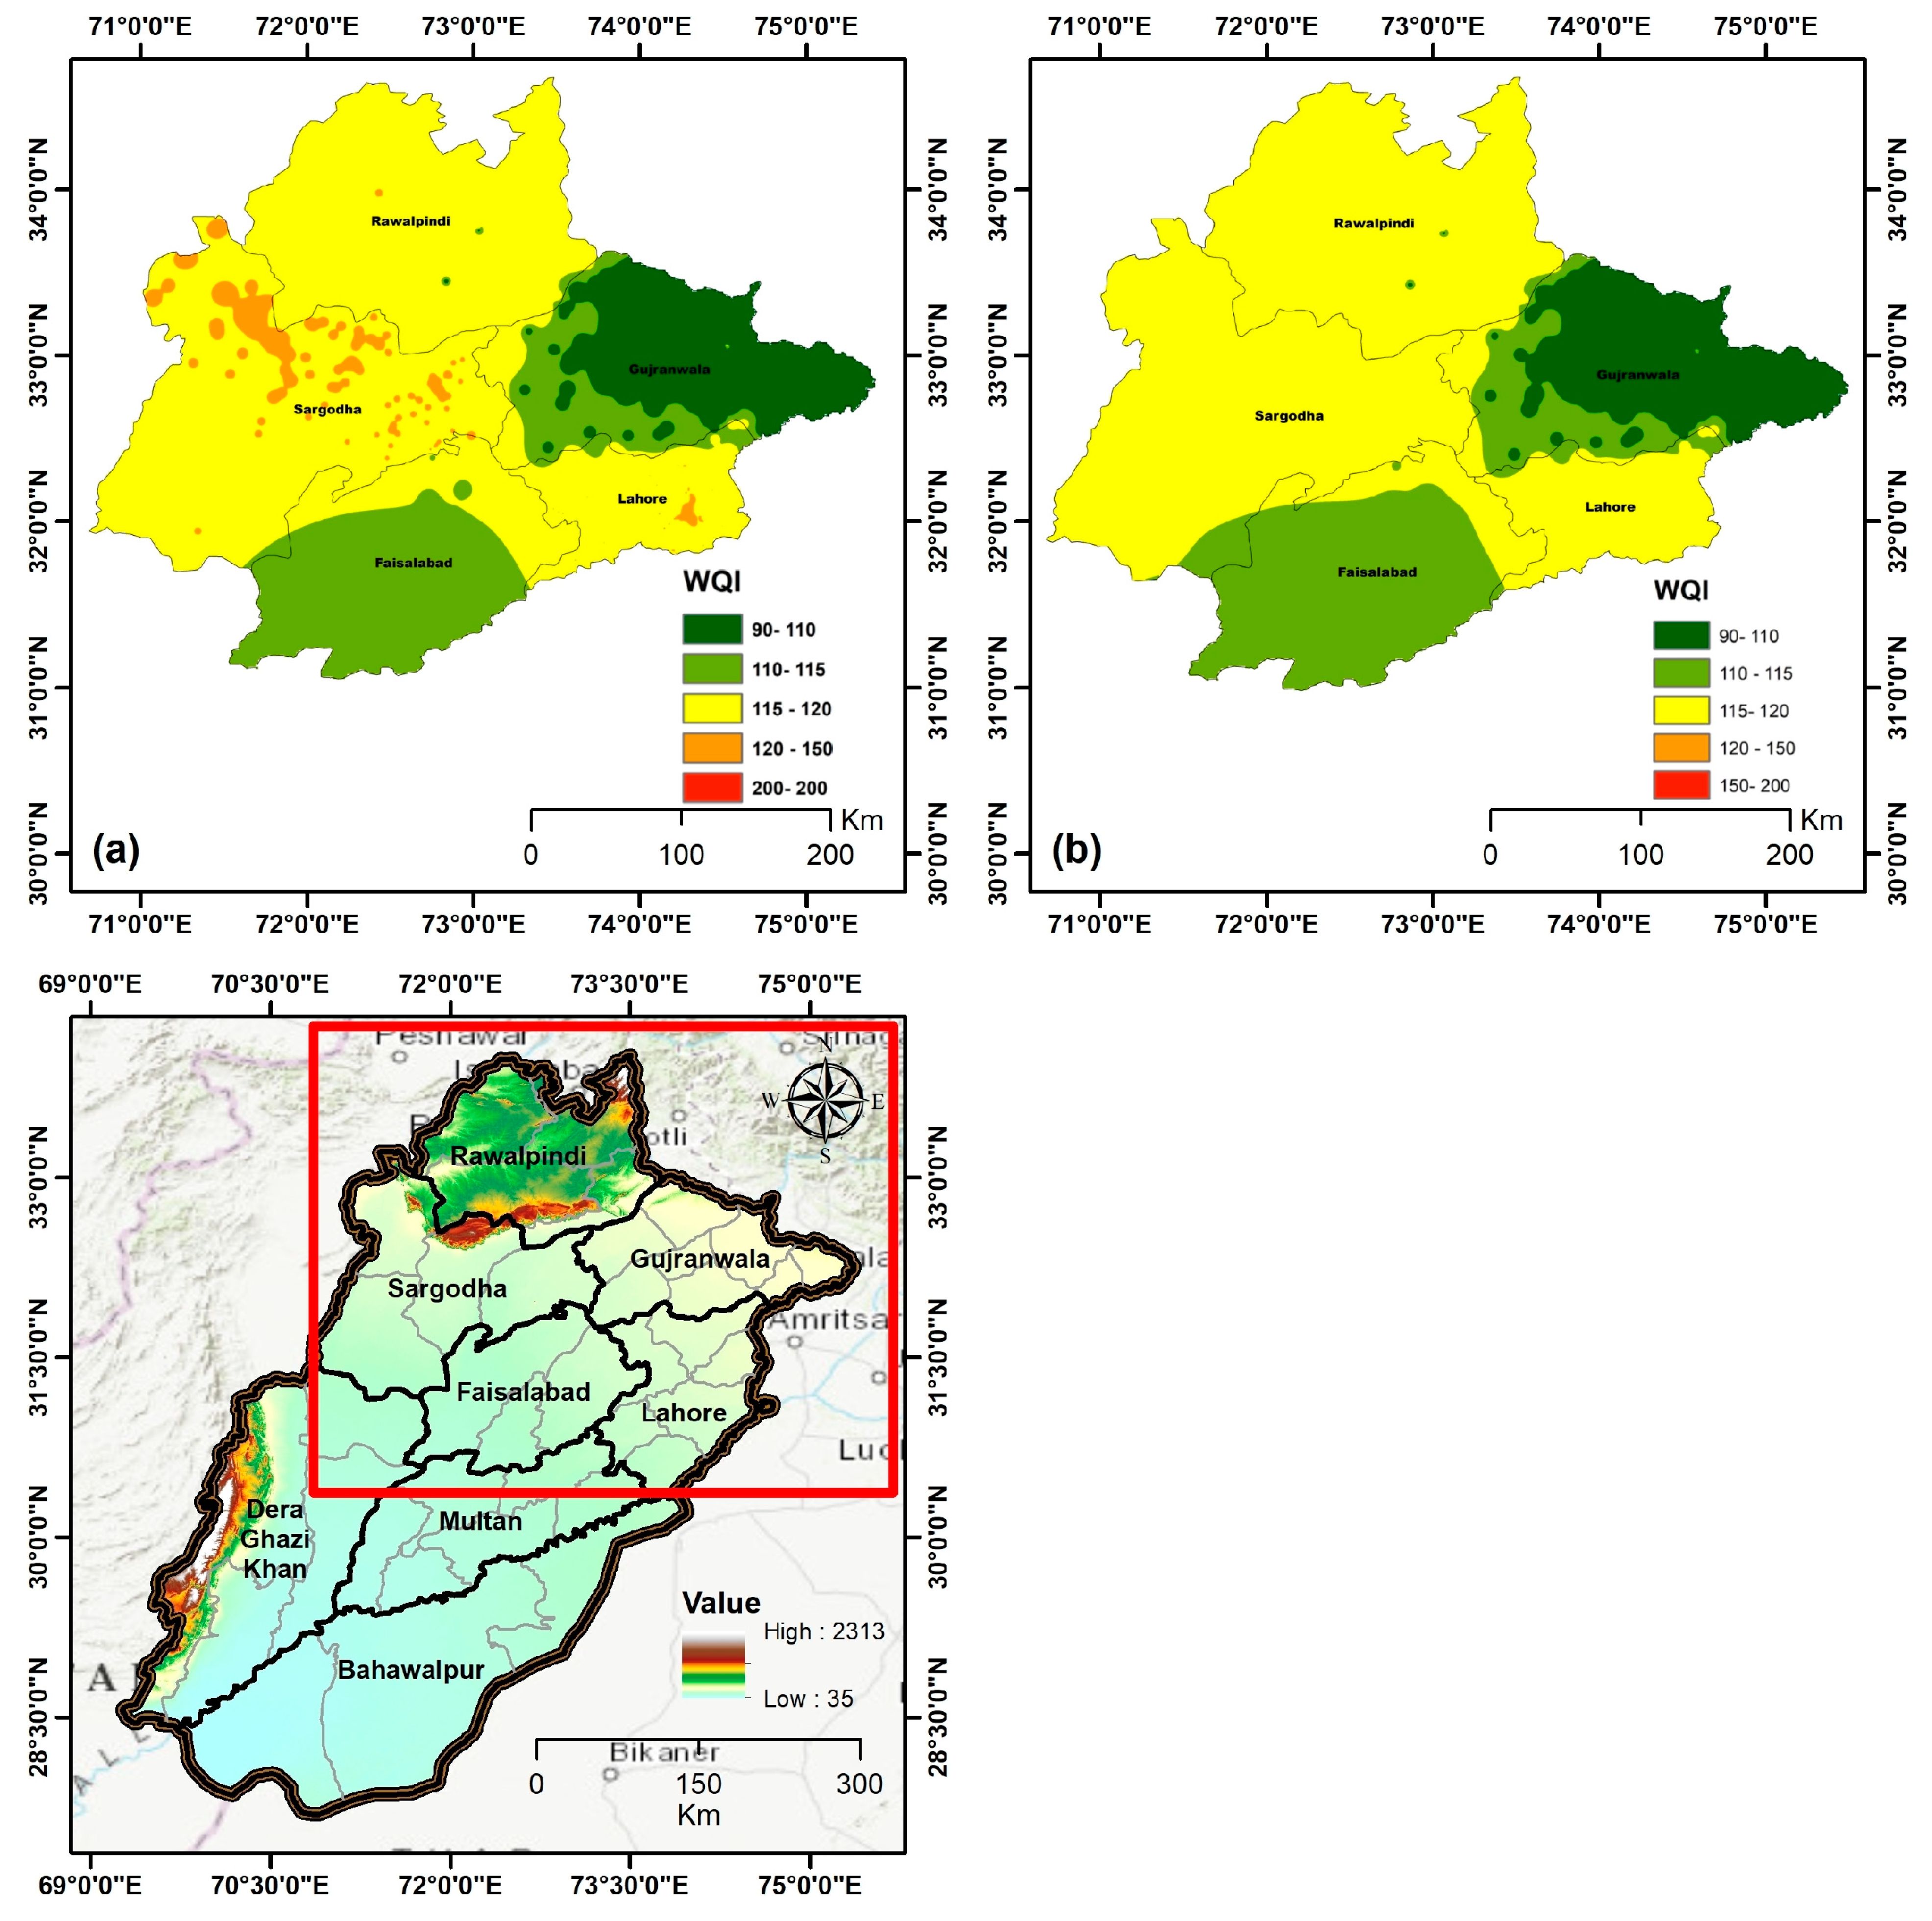
2.1. Study Area
The study area, Punjab province, situated in the semiarid lowlands zone, is the most populous province of Pakistan, with a population exceeding 110 million. The study area is comprised of an alluvial plain structured by the Indus River, with its major tributaries flowing into the southern part. The main rivers, i.e., River Ravi and River Sutlej, mostly recharged the groundwater aquifer. The soil composition of the Punjab plains is predominantly alluvial deposits originating from the Indus River system. The province has a semiarid, subtropical climate with mean annual minimum and maximum temperatures of 18.2 °C and 31.9 °C, respectively. It is characterized by chilly winters and hot summers. Rainfall distribution in the study region is uneven, with the monsoon season contributing 50–75% of the total rainfall, primarily influenced by monsoon winds. Groundwater is a major contributor to meeting water supply demands. From 1976 to 2012, the irrigation dependency on groundwater doubled as most of the groundwater withdrawals for irrigation purposes occurred in Punjab, in the canal command areas, with 70% of private tube wells and others being dependent on groundwater-based irrigation.
Key industries relevant to groundwater pollution include textiles, tanneries, pulp and paper, fertilizer, metal smelting, and automobile manufacturing clustered around urban centers. The unconfined alluvial aquifers of central and upper Punjab, which are tapped heavily for irrigation and domestic usage, are thus under constant risk of contamination from urban, industrial, and agricultural sources. Pakistan’s major cities mainly rely on groundwater for their domestic purposes, as 70% of the drinking water for the total population of the country has been sourced from groundwater. The ever-increasing domestic and agricultural water demands due to urbanization and population growth have put constant pressure on the groundwater reserves, resulting in over-abstraction. This situation causes water levels to decline and negatively affects groundwater quality for any purpose [
31]. Hence, conducting a comprehensive study is imperative to evaluate the groundwater quality for both drinking and irrigation purposes, as shown in
Figure 1.
2.2. Overall Research Framework
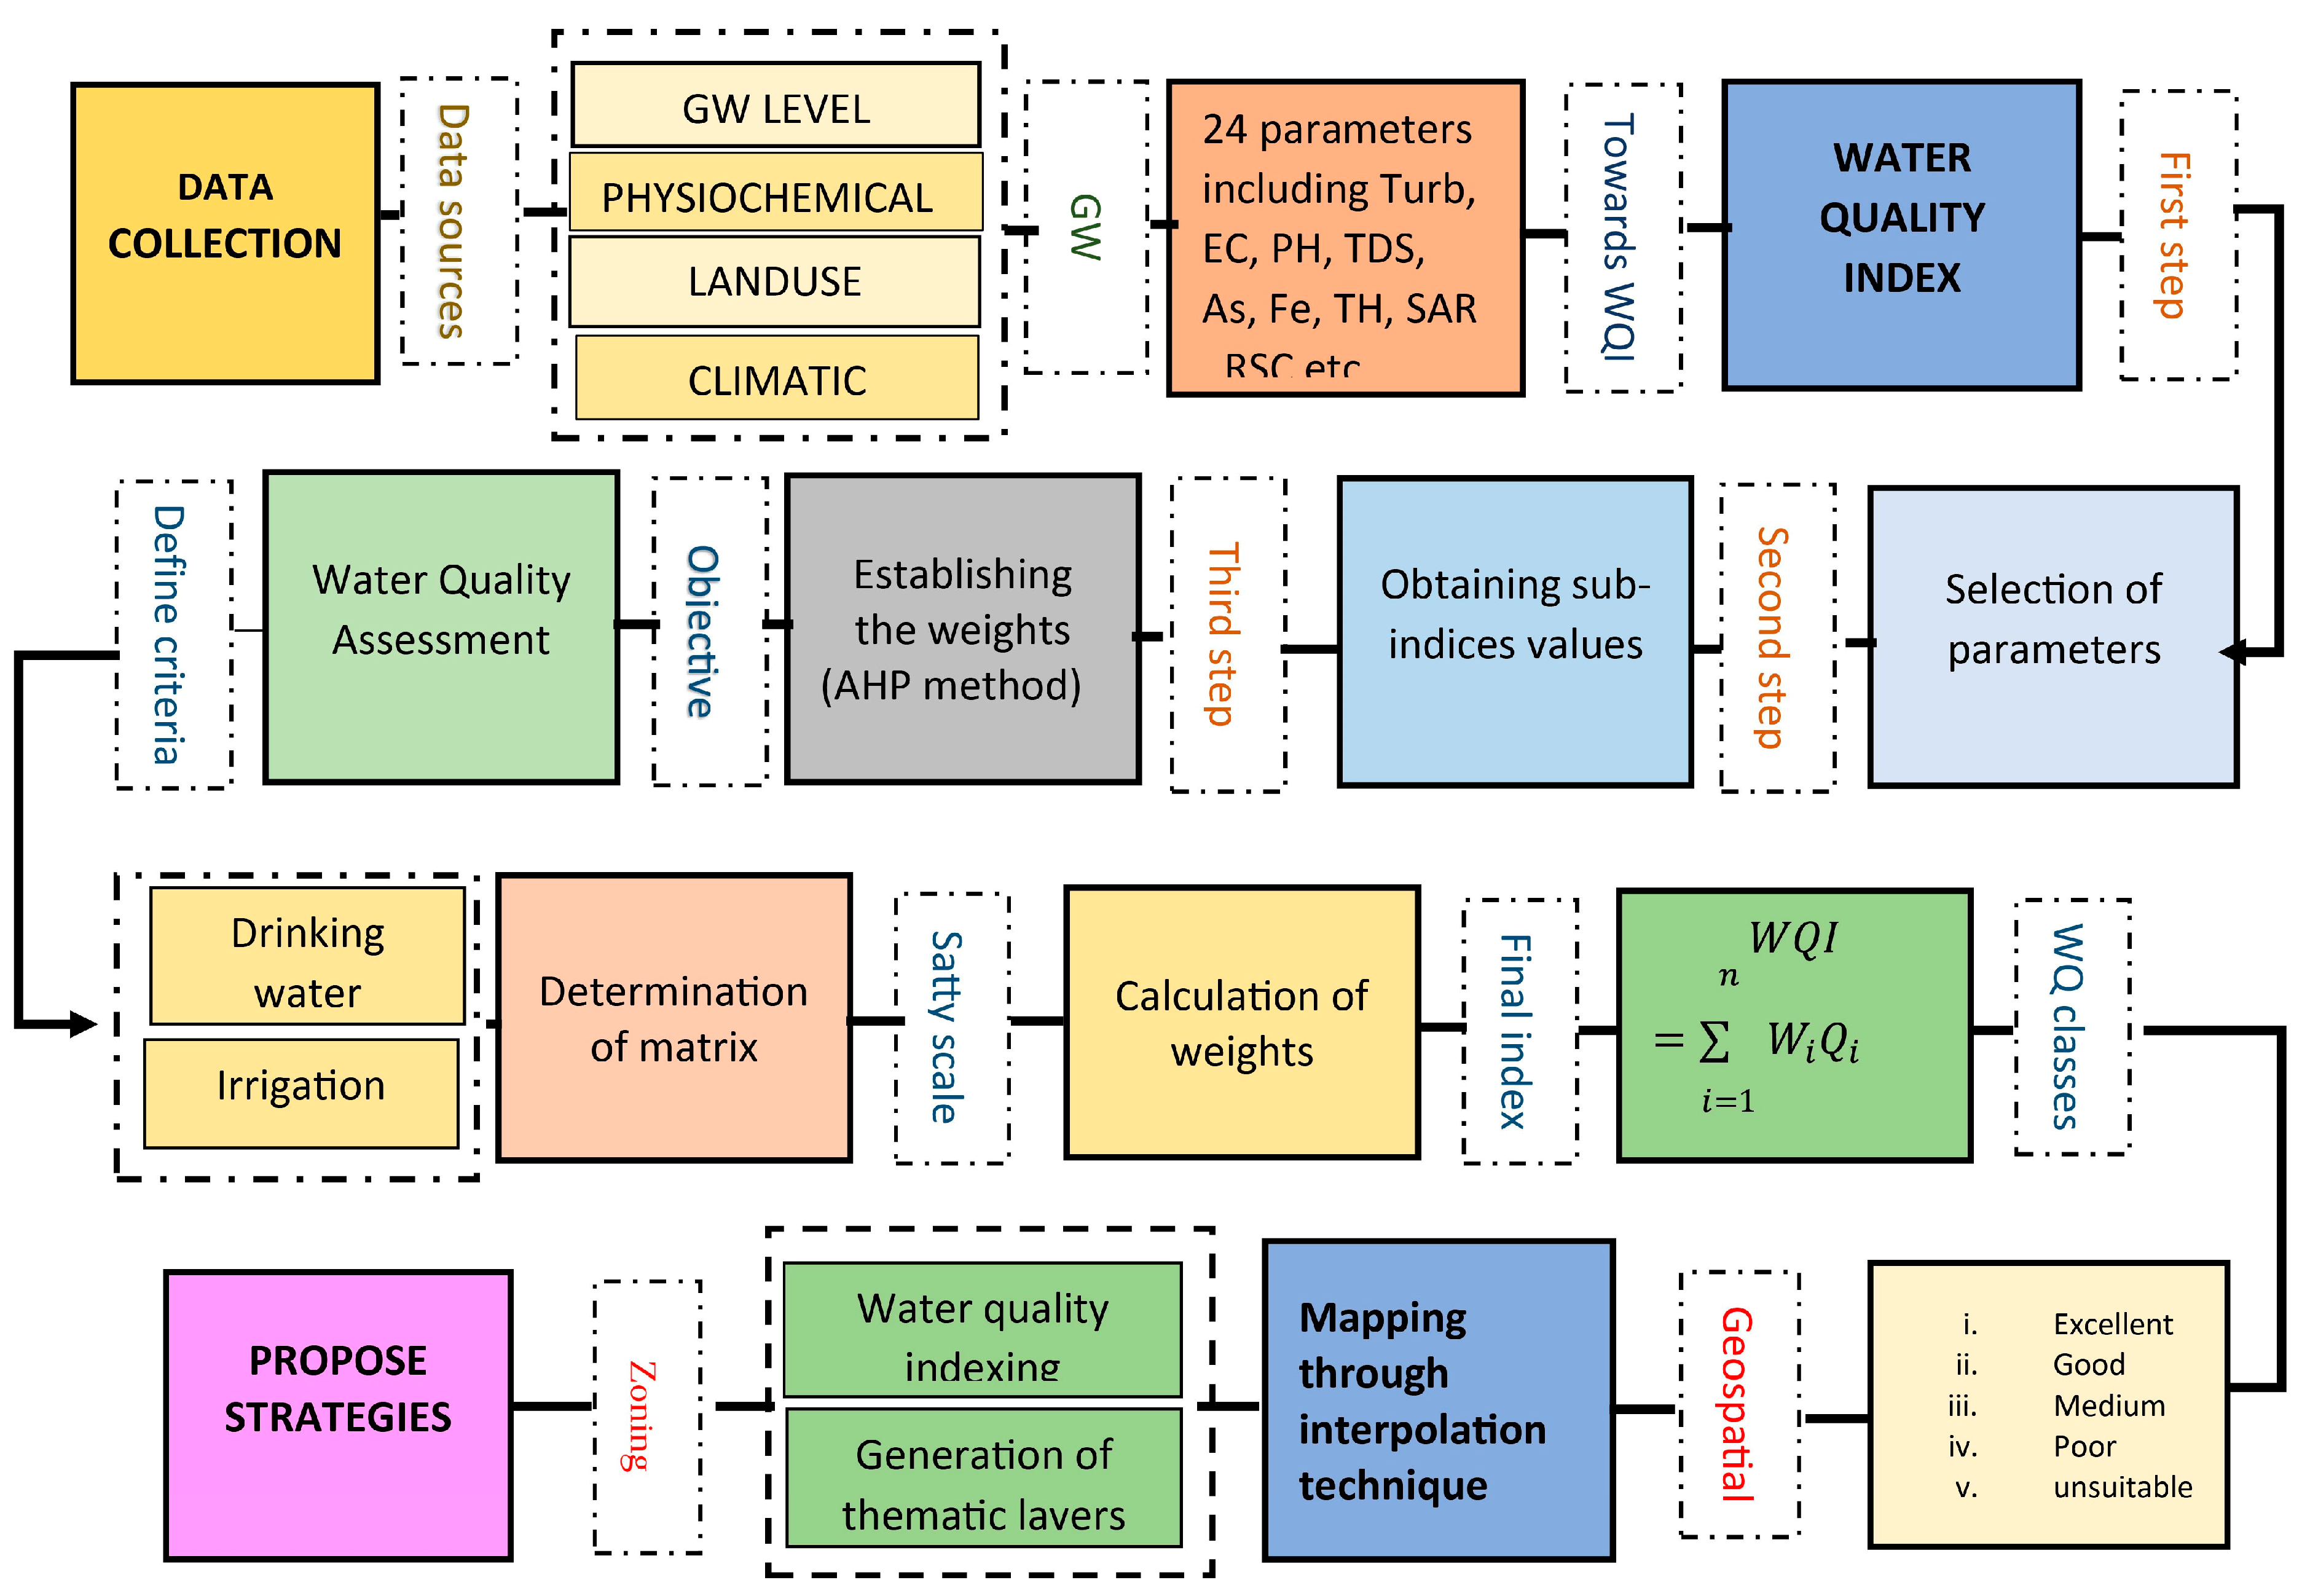
The foundational research framework for this study is illustrated in
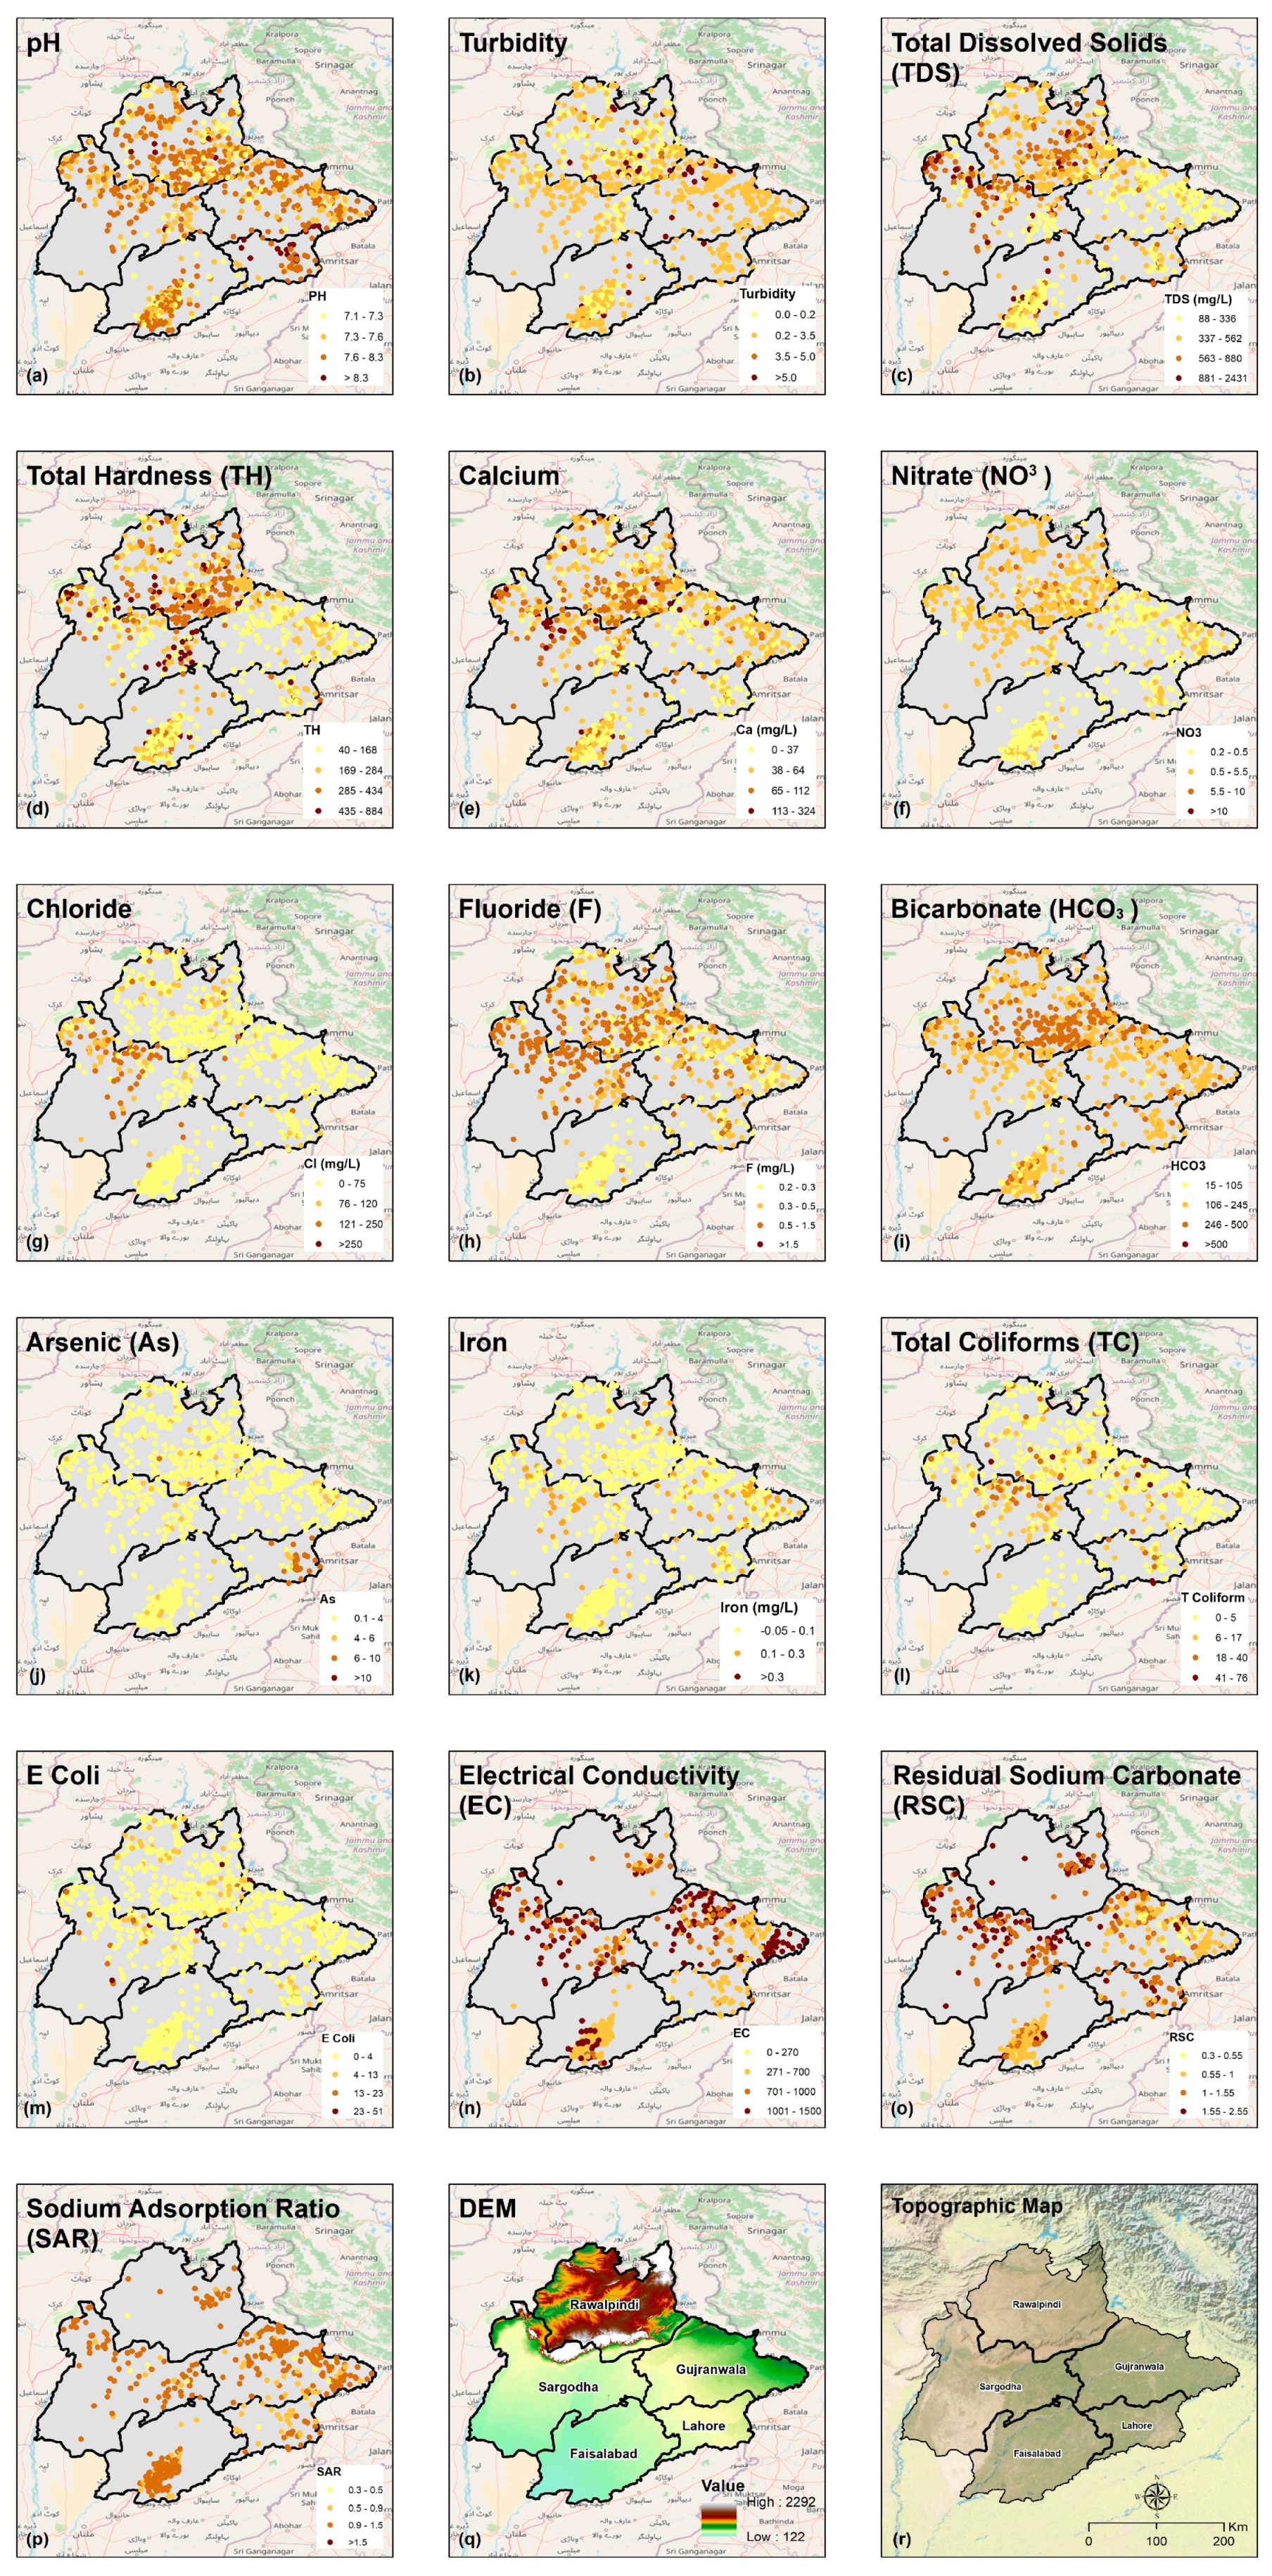
Figure 2. A comprehensive dataset of 1094 groundwater samples was gathered from monitoring wells spread across the Punjab province study area. These sites were strategically located within the five divisions of Lahore, Rawalpindi, Sargodha, Faisalabad, and Gujranwala. Physicochemical parameters such as pH, chloride (Cl
−), fluoride (F
−), iron (Fe
−), nitrate (NO
3), nitrite (NO
2), arsenic (As), total hardness, bicarbonate (HCO
3−), calcium (Ca
+2), magnesium (Mg
+2), color, taste, turbidity, and total dissolved solids (TDS), along with microbiological parameters including total coliforms, fecal coliforms, and Escherichia coli, and irrigation parameters such as electrical conductivity (EC), residual sodium carbonates (RSC), and sodium adsorption ratio (SAR), were sourced from the Water and Sanitation Agency (WASA), Urban Unit Department, and Punjab Irrigation Department. Additionally, data on depth to the water table and precipitation were collected and incorporated into the water quality index (WQI) calculations. Furthermore, satellite imagery from Sentinel-2A MSI (multispectral instrument) captured in 2018 was obtained from USGS, interpreted, and used to identify land use through supervised classification. The unconfined alluvial aquifers in the study area are part of an interconnected groundwater system underlying the fertile Punjab plains. As discussed in [
32,
33], these aquifers are primarily composed of Quaternary alluvium comprised of alternating layers of sand, silt, and clay recharged by the region’s canal network and major river tributaries. Groundwater also occurs under semi-confined conditions in some zones within Tertiary and Cretaceous sedimentary formations below the shallow alluvial deposits.
The calculation of the groundwater quality index involved a systematic four-step process: (1) parameter selection, (2) transformation into sub-indices, (3) determination of weights, and (4) aggregation of sub-indices to derive the final index value. The analytical hierarchy process (AHP) was employed to establish weights for the selected parameters. In the AHP methodology, pairwise comparisons of water quality parameters were fundamental. Priorities for the primary criteria (i.e., drinking and irrigation) were set side by side in a pairwise matrix, determined by their relative importance using the Saaty scale. The resulting index was categorized into distinct classes. Following the computation of indices for drinking and irrigation purposes, these values were interpolated to delineate various zones within the study area. Identification of quality zones facilitated the proposition of diverse management strategies aimed at ameliorating groundwater quality and sustaining overall groundwater conditions for developmental sustainability, as shown in
Figure 2. The foundational research framework for this study is illustrated in
Figure 2. A comprehensive dataset of 1094 groundwater samples was gathered from monitoring wells spread across the Punjab province study area. These sites were strategically located within the five divisions of Lahore, Rawalpindi, Sargodha, Faisalabad, and Gujranwala.
2.3. Water Quality Index (WQI)
The fundamental necessity for the WQI development lies in the precise definition of the qualitative status of groundwater resources within the study area. This aspect is deemed crucial in the effective management and regulation of groundwater for diverse purposes [
34]. The WQI reflects the status of the groundwater environment at any time and assists in developing management strategies for sustainable development. Indeed, establishing the WQI is an important step in groundwater resources management and has grown in importance as a tool for analyzing water quality all over the world. A water quality index is a unitless numerical representation that consolidates a chosen set of parameters into a singular measure, providing an indication of the overall quality of a water body.
The present study incorporates the various physical, chemical, heavy metals, and microbiological parameters in the computation of the groundwater quality index. Although all WQIs have a similar overall structure, the development of an index had two primary goals. These aims can range from broad water quality assessments to specific applications. Many indices were devised following Horton’s [
35], but despite these efforts, a widely accepted way of producing water quality indices has yet to be developed. The four typical phases used to compute the WQI have been discussed in the subsequent section.
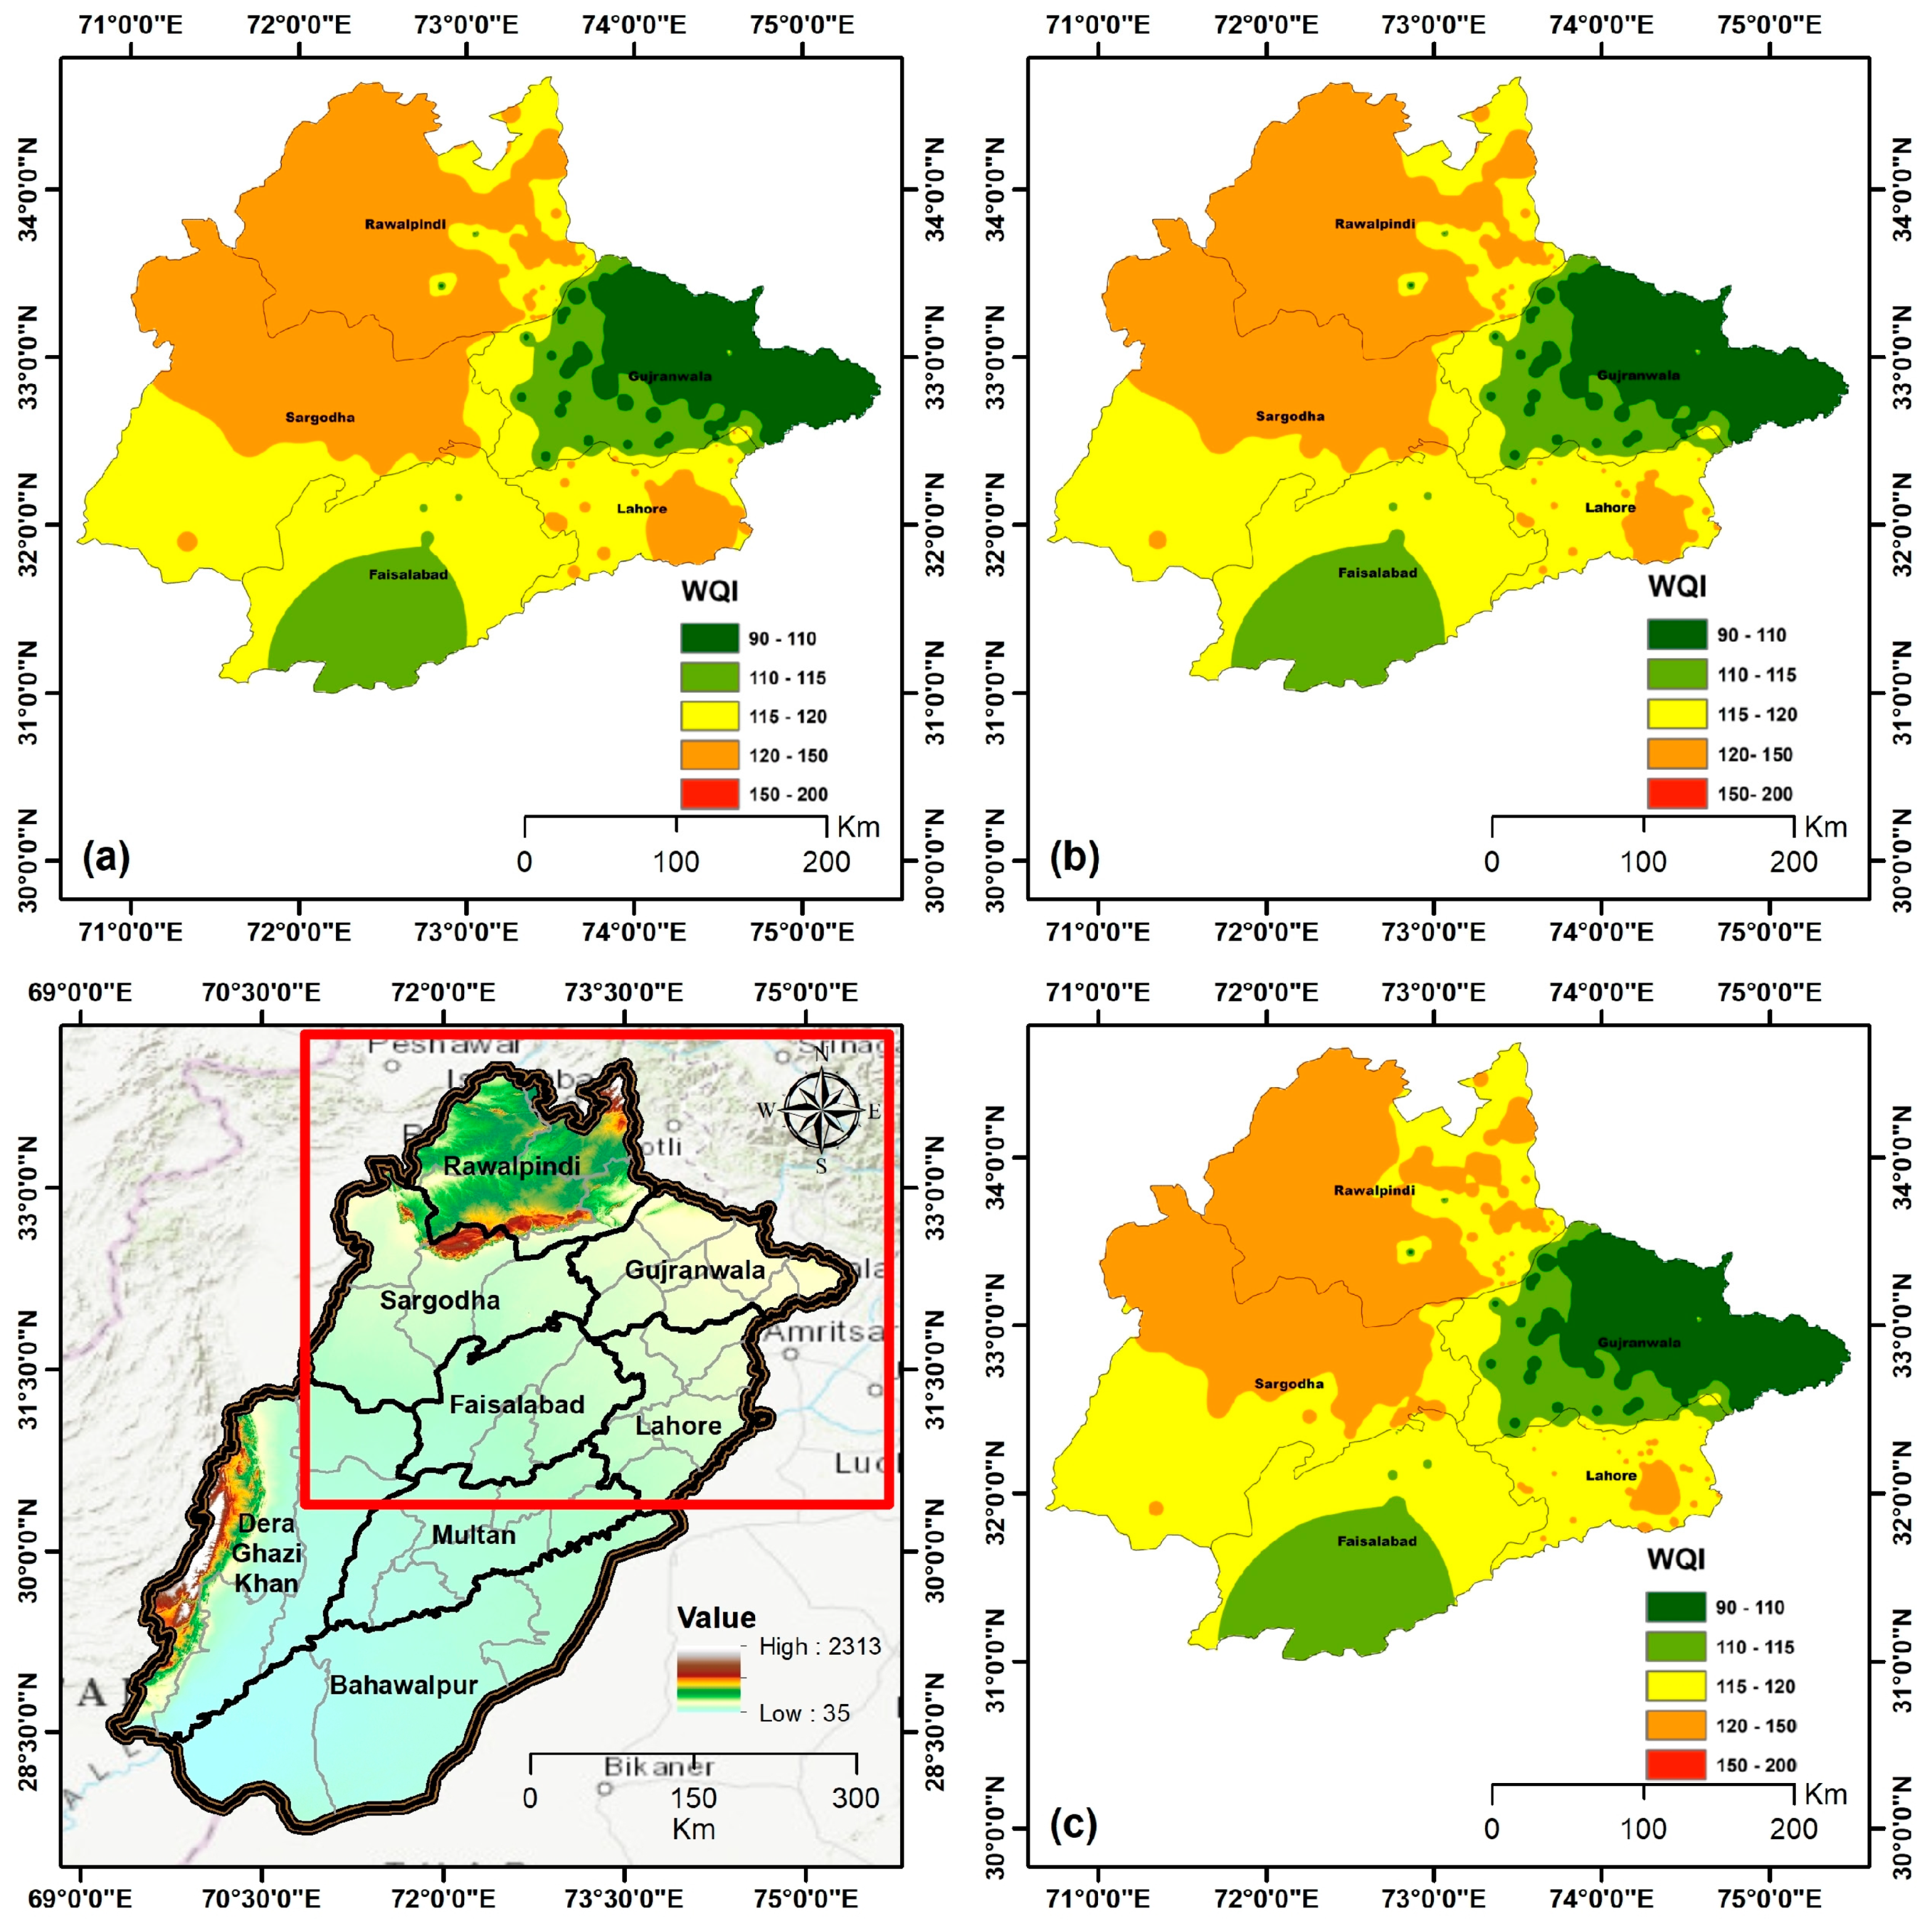
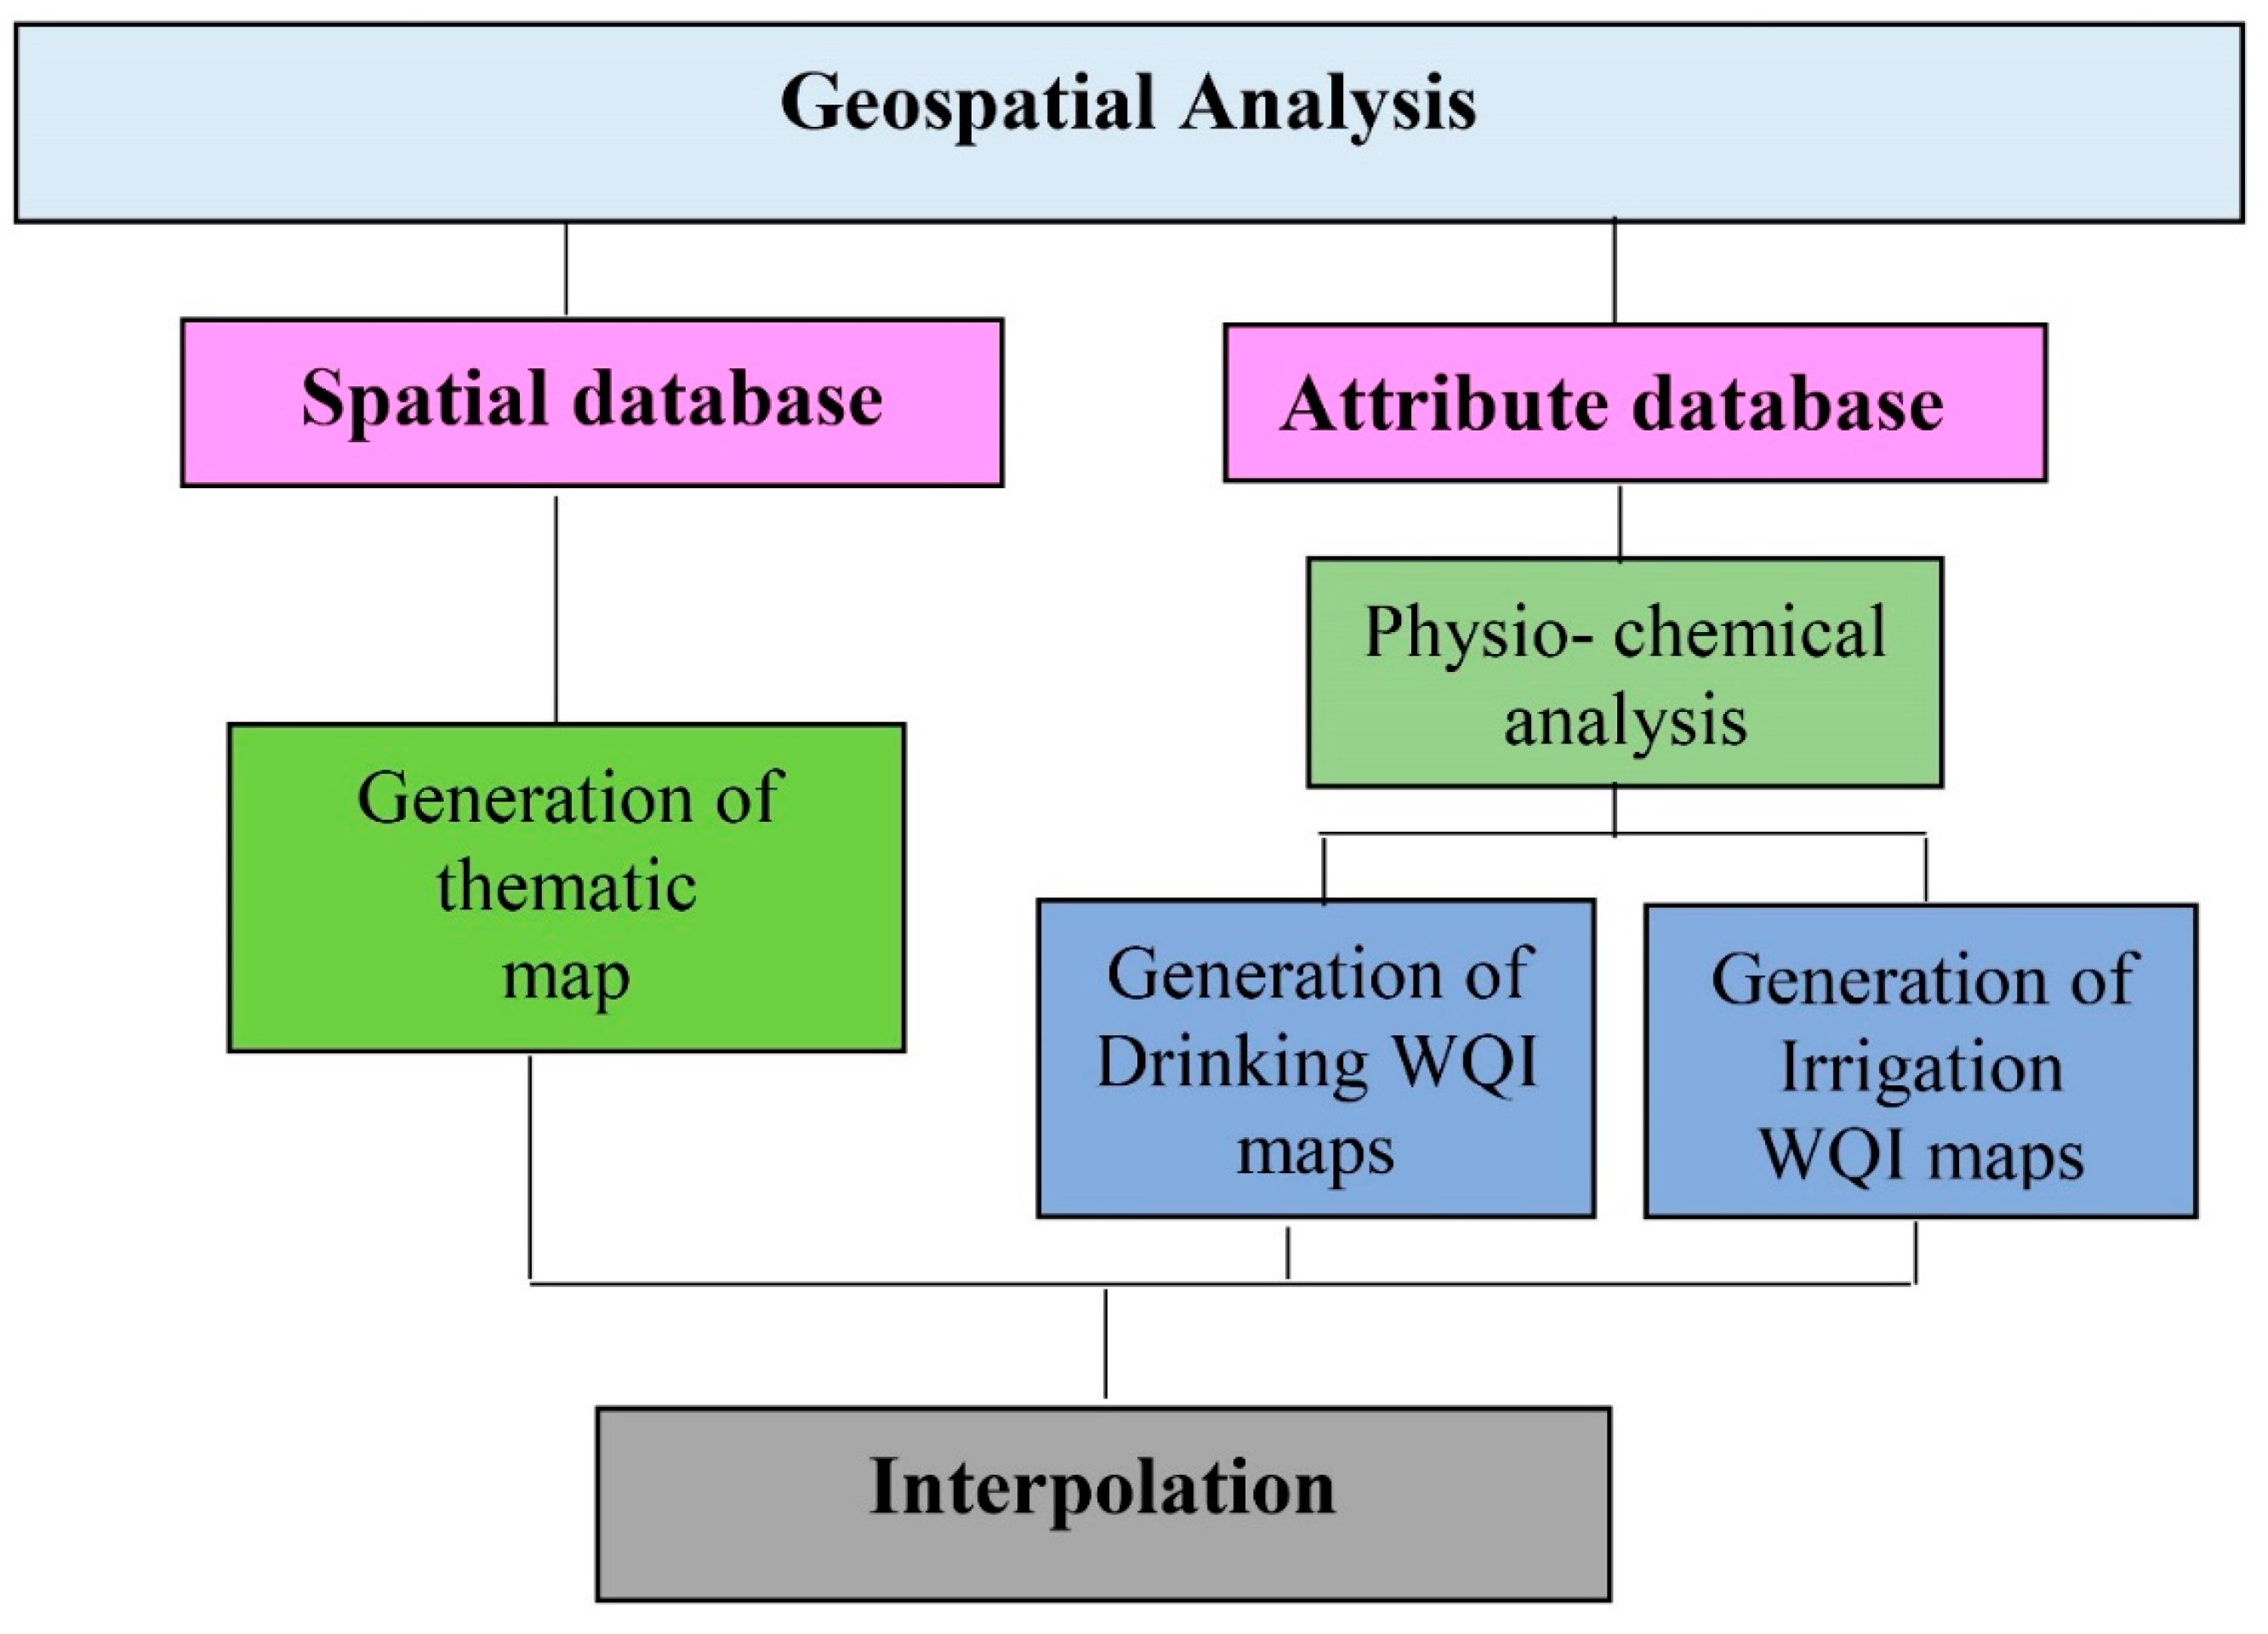
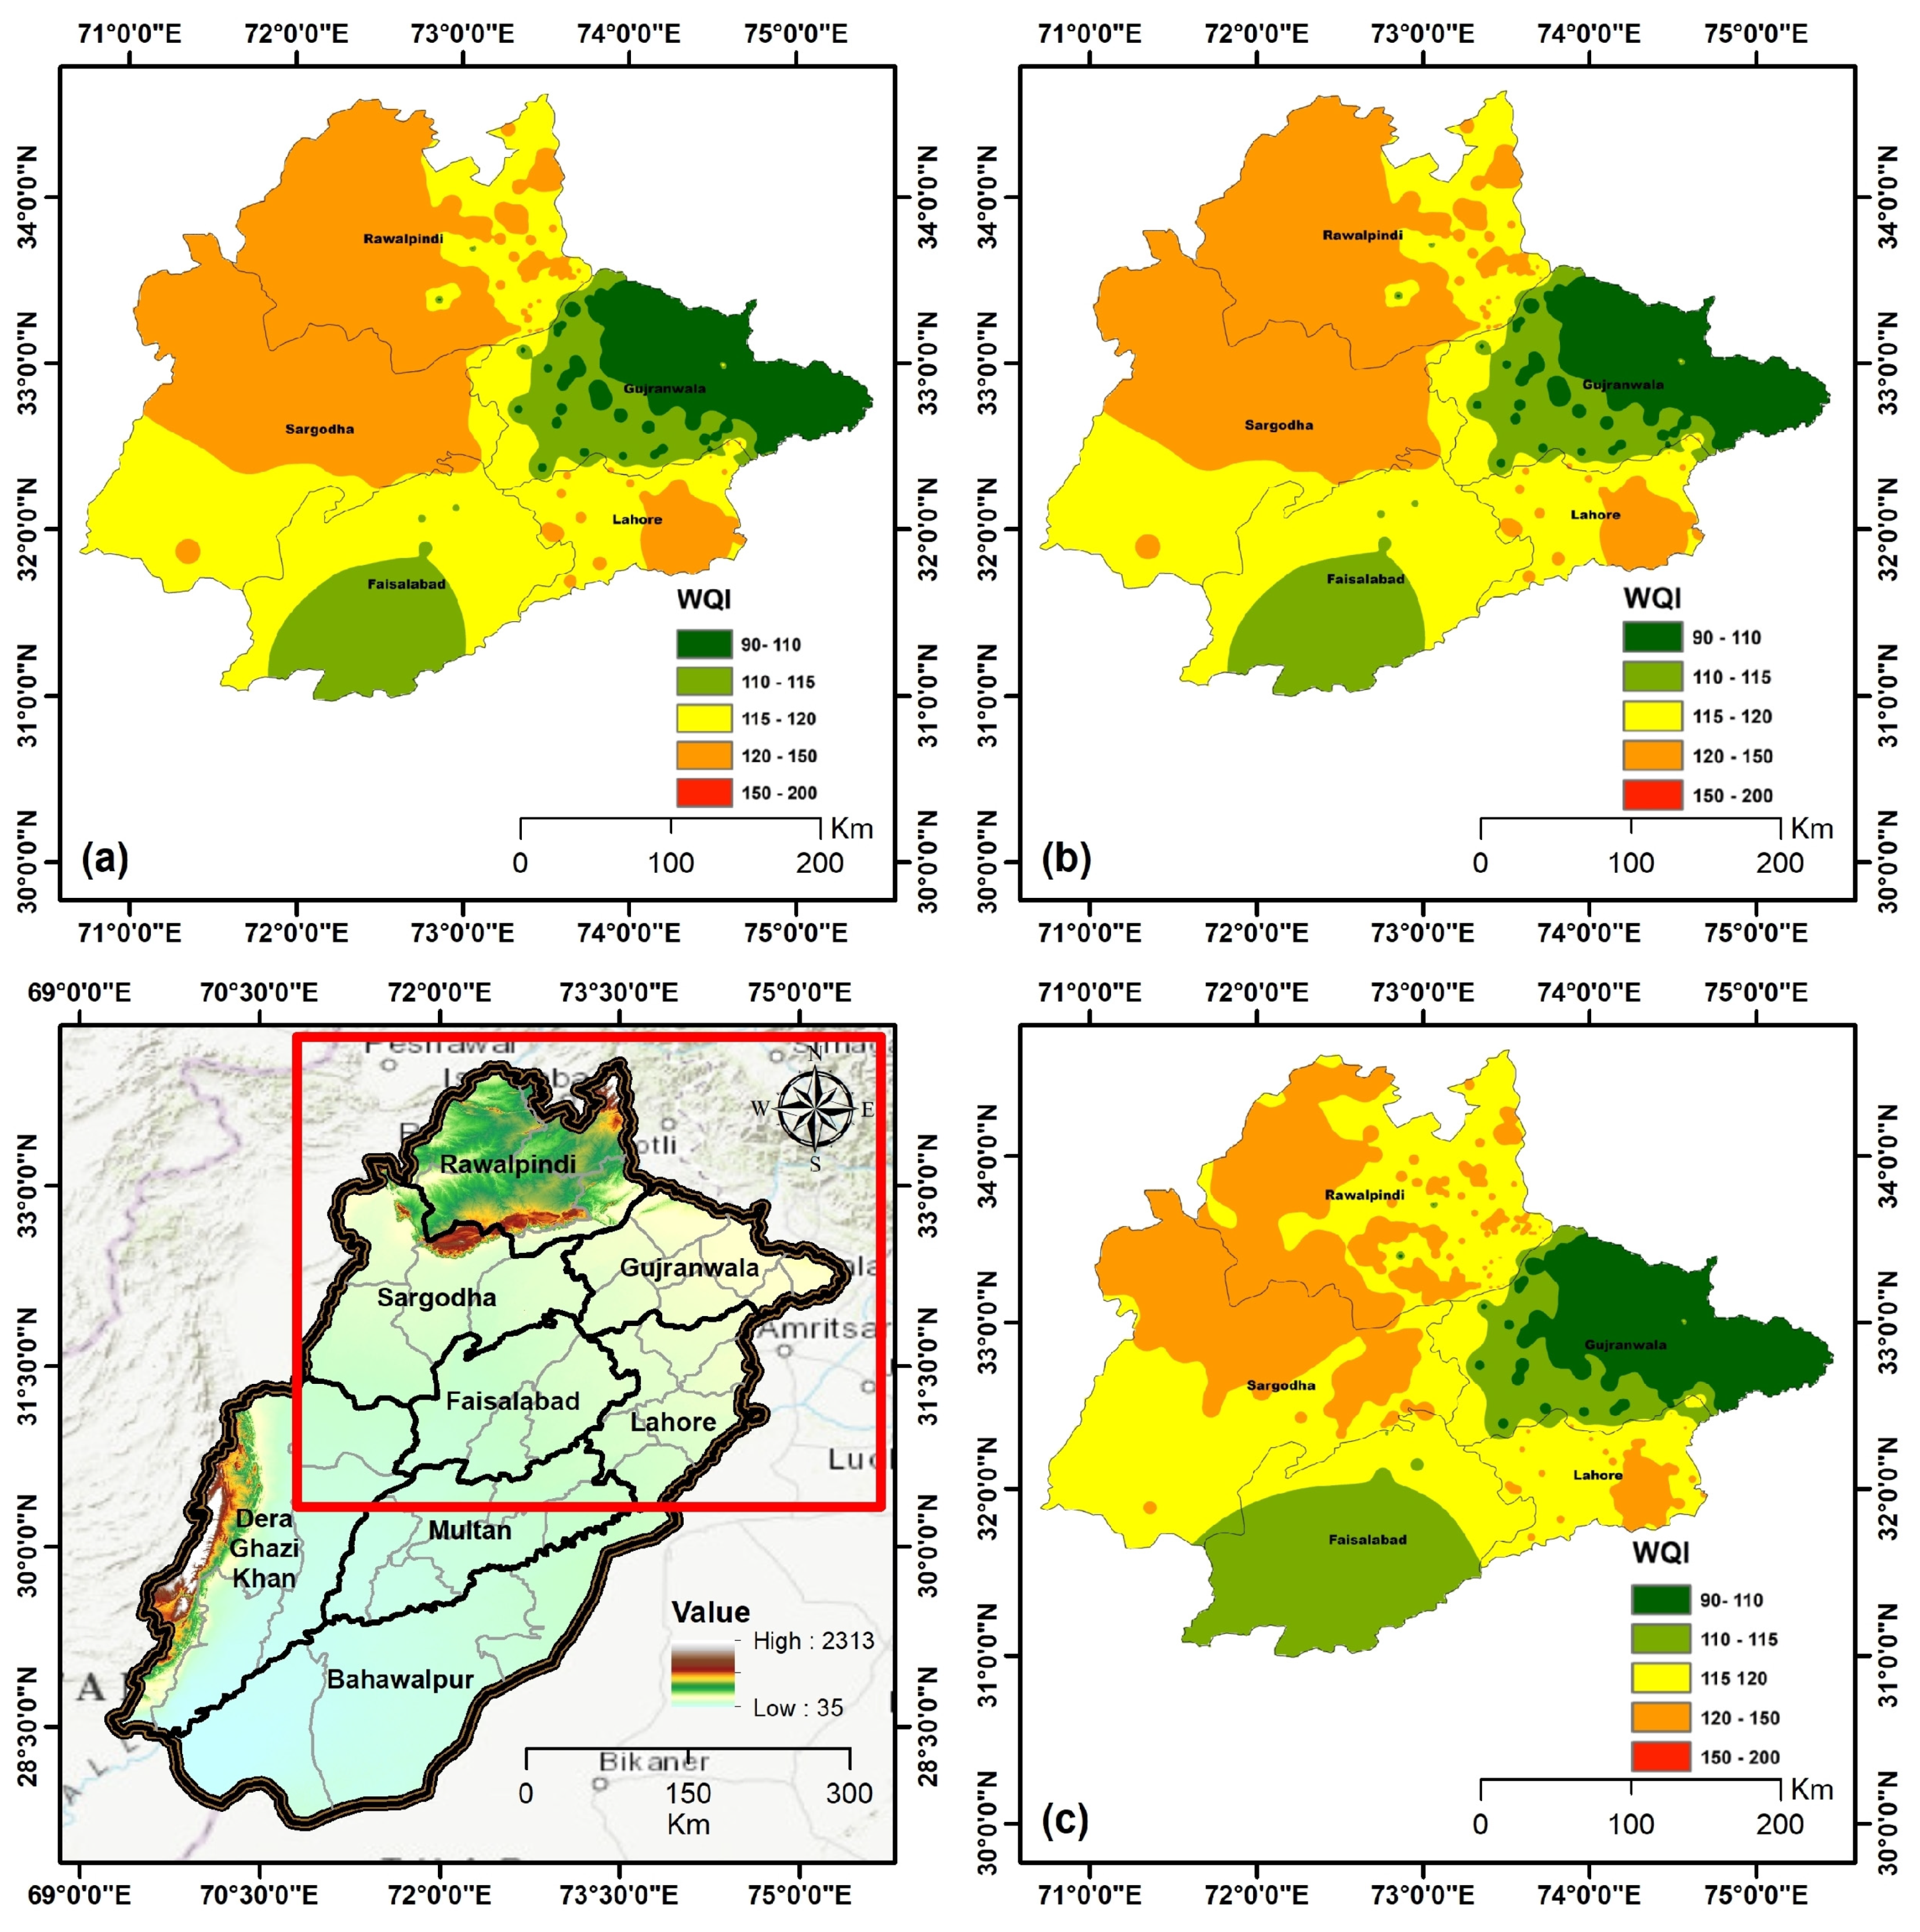
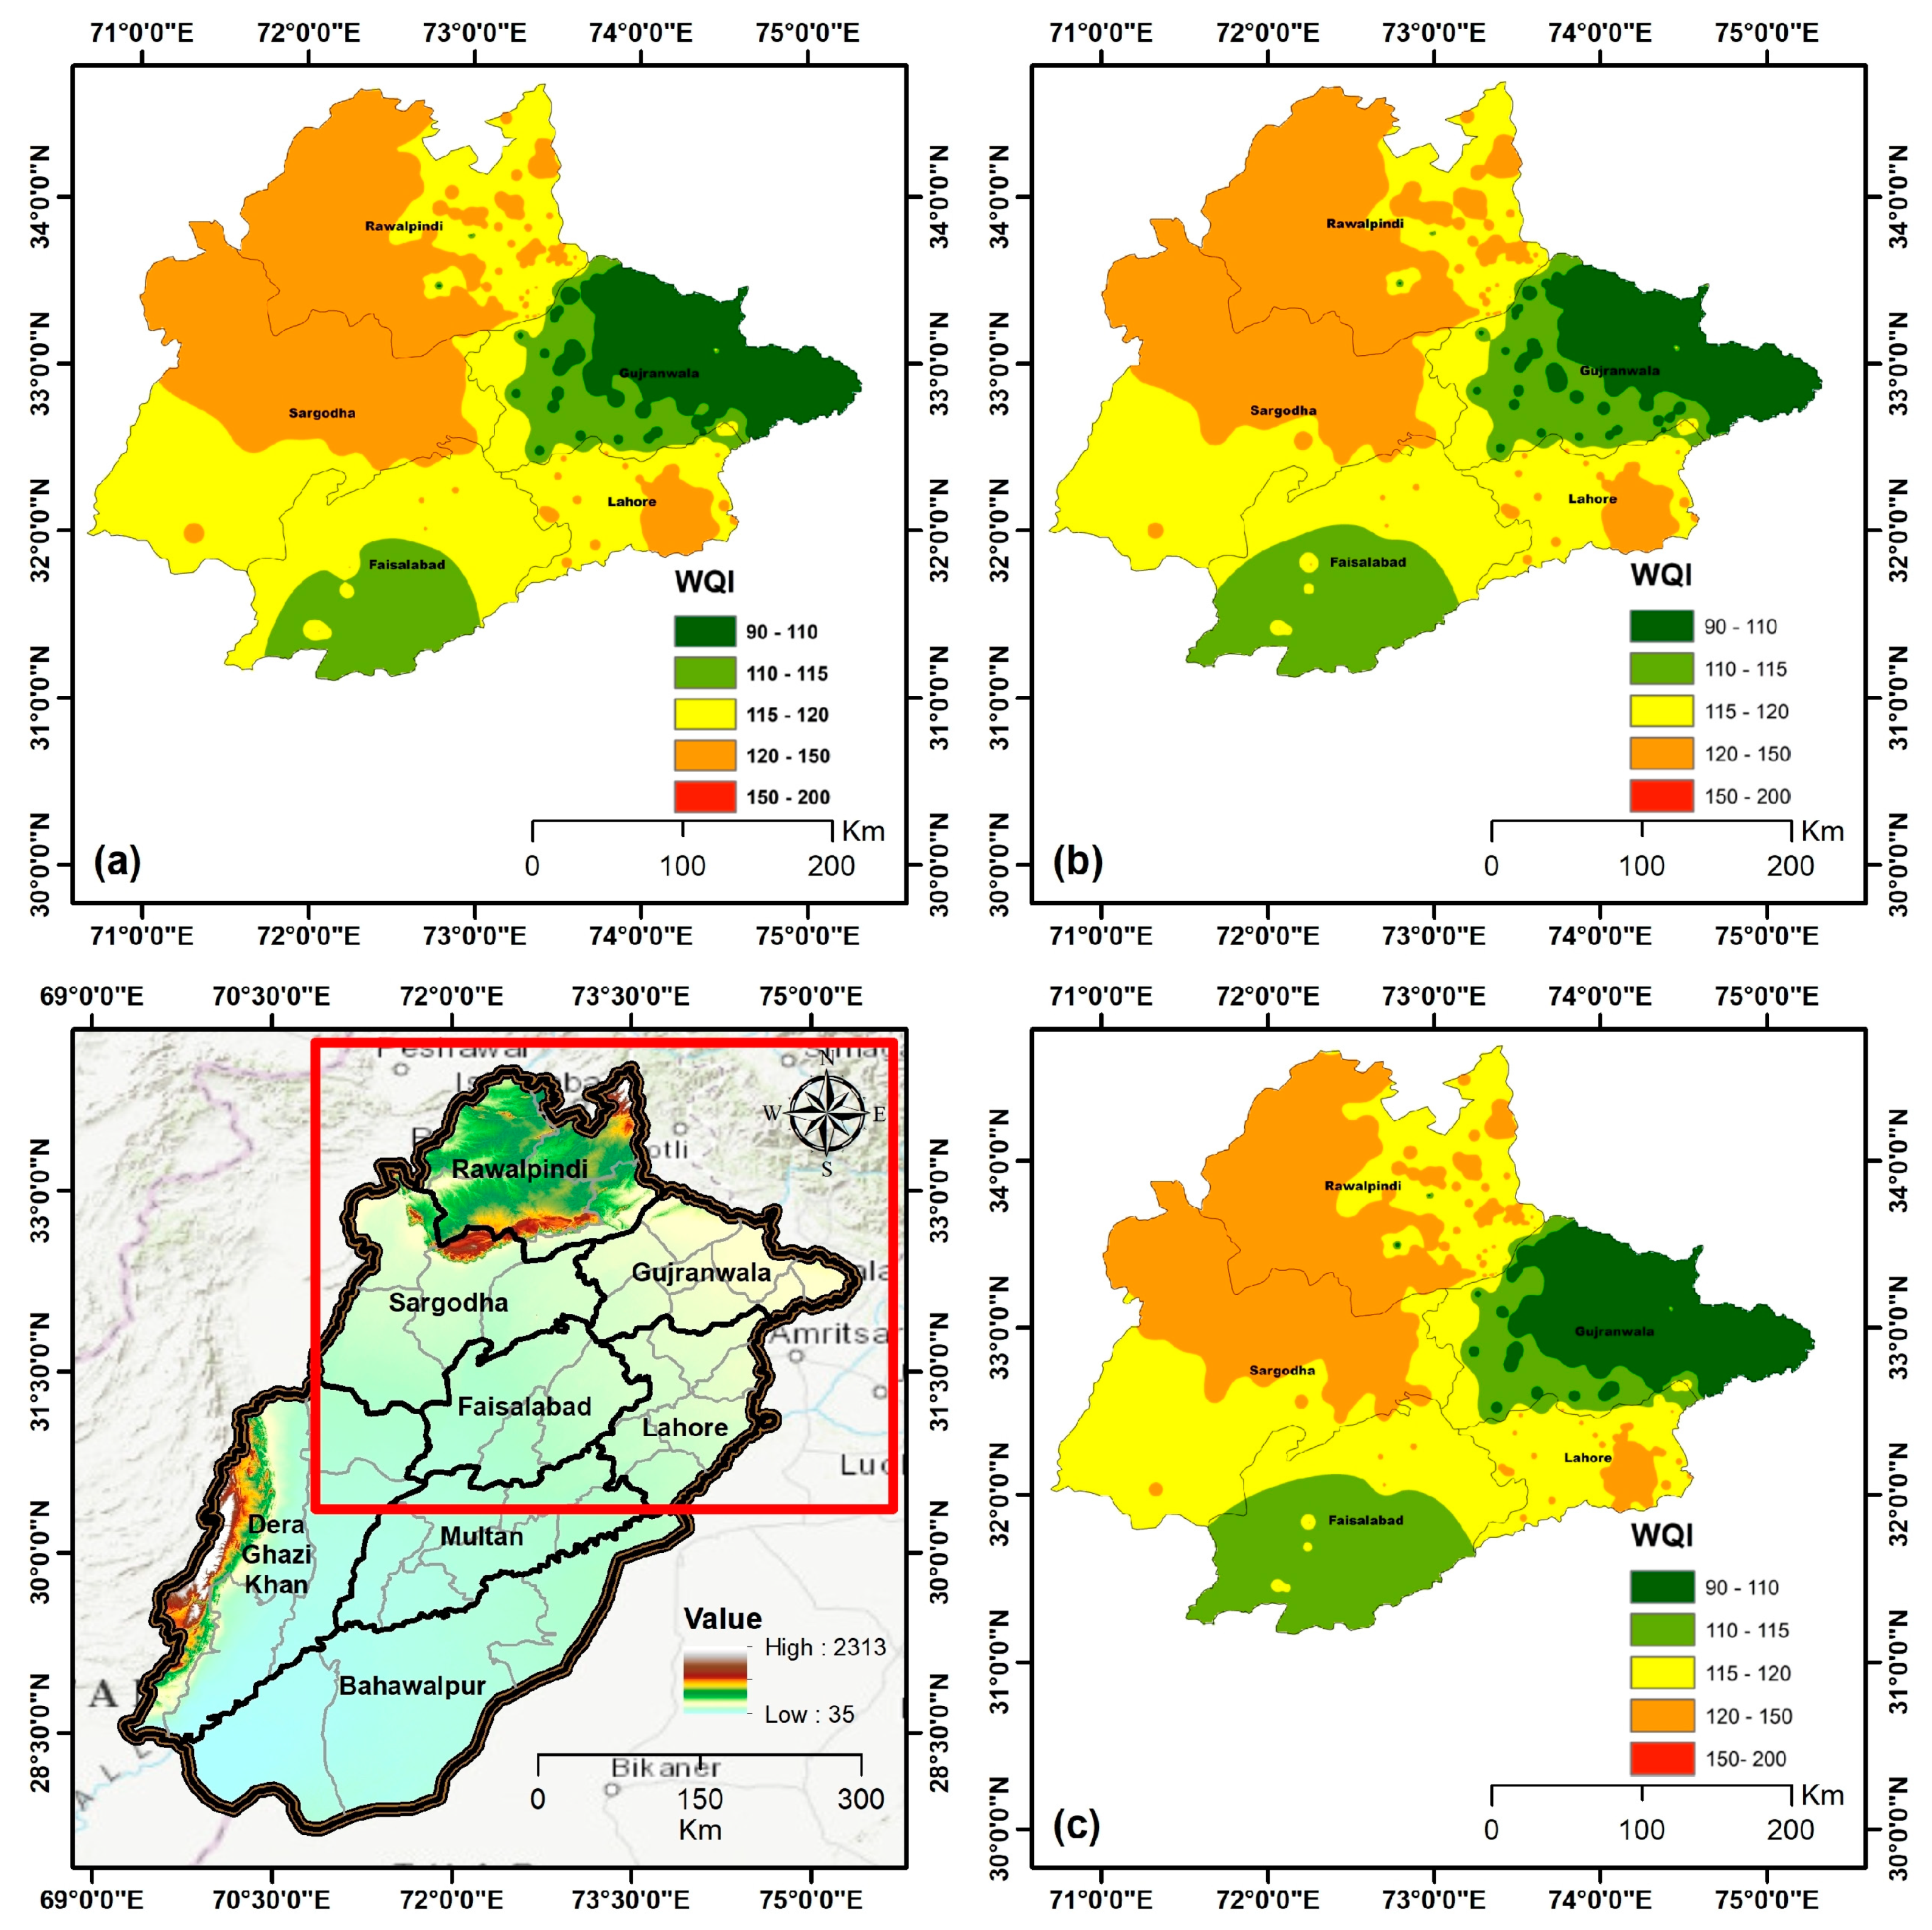
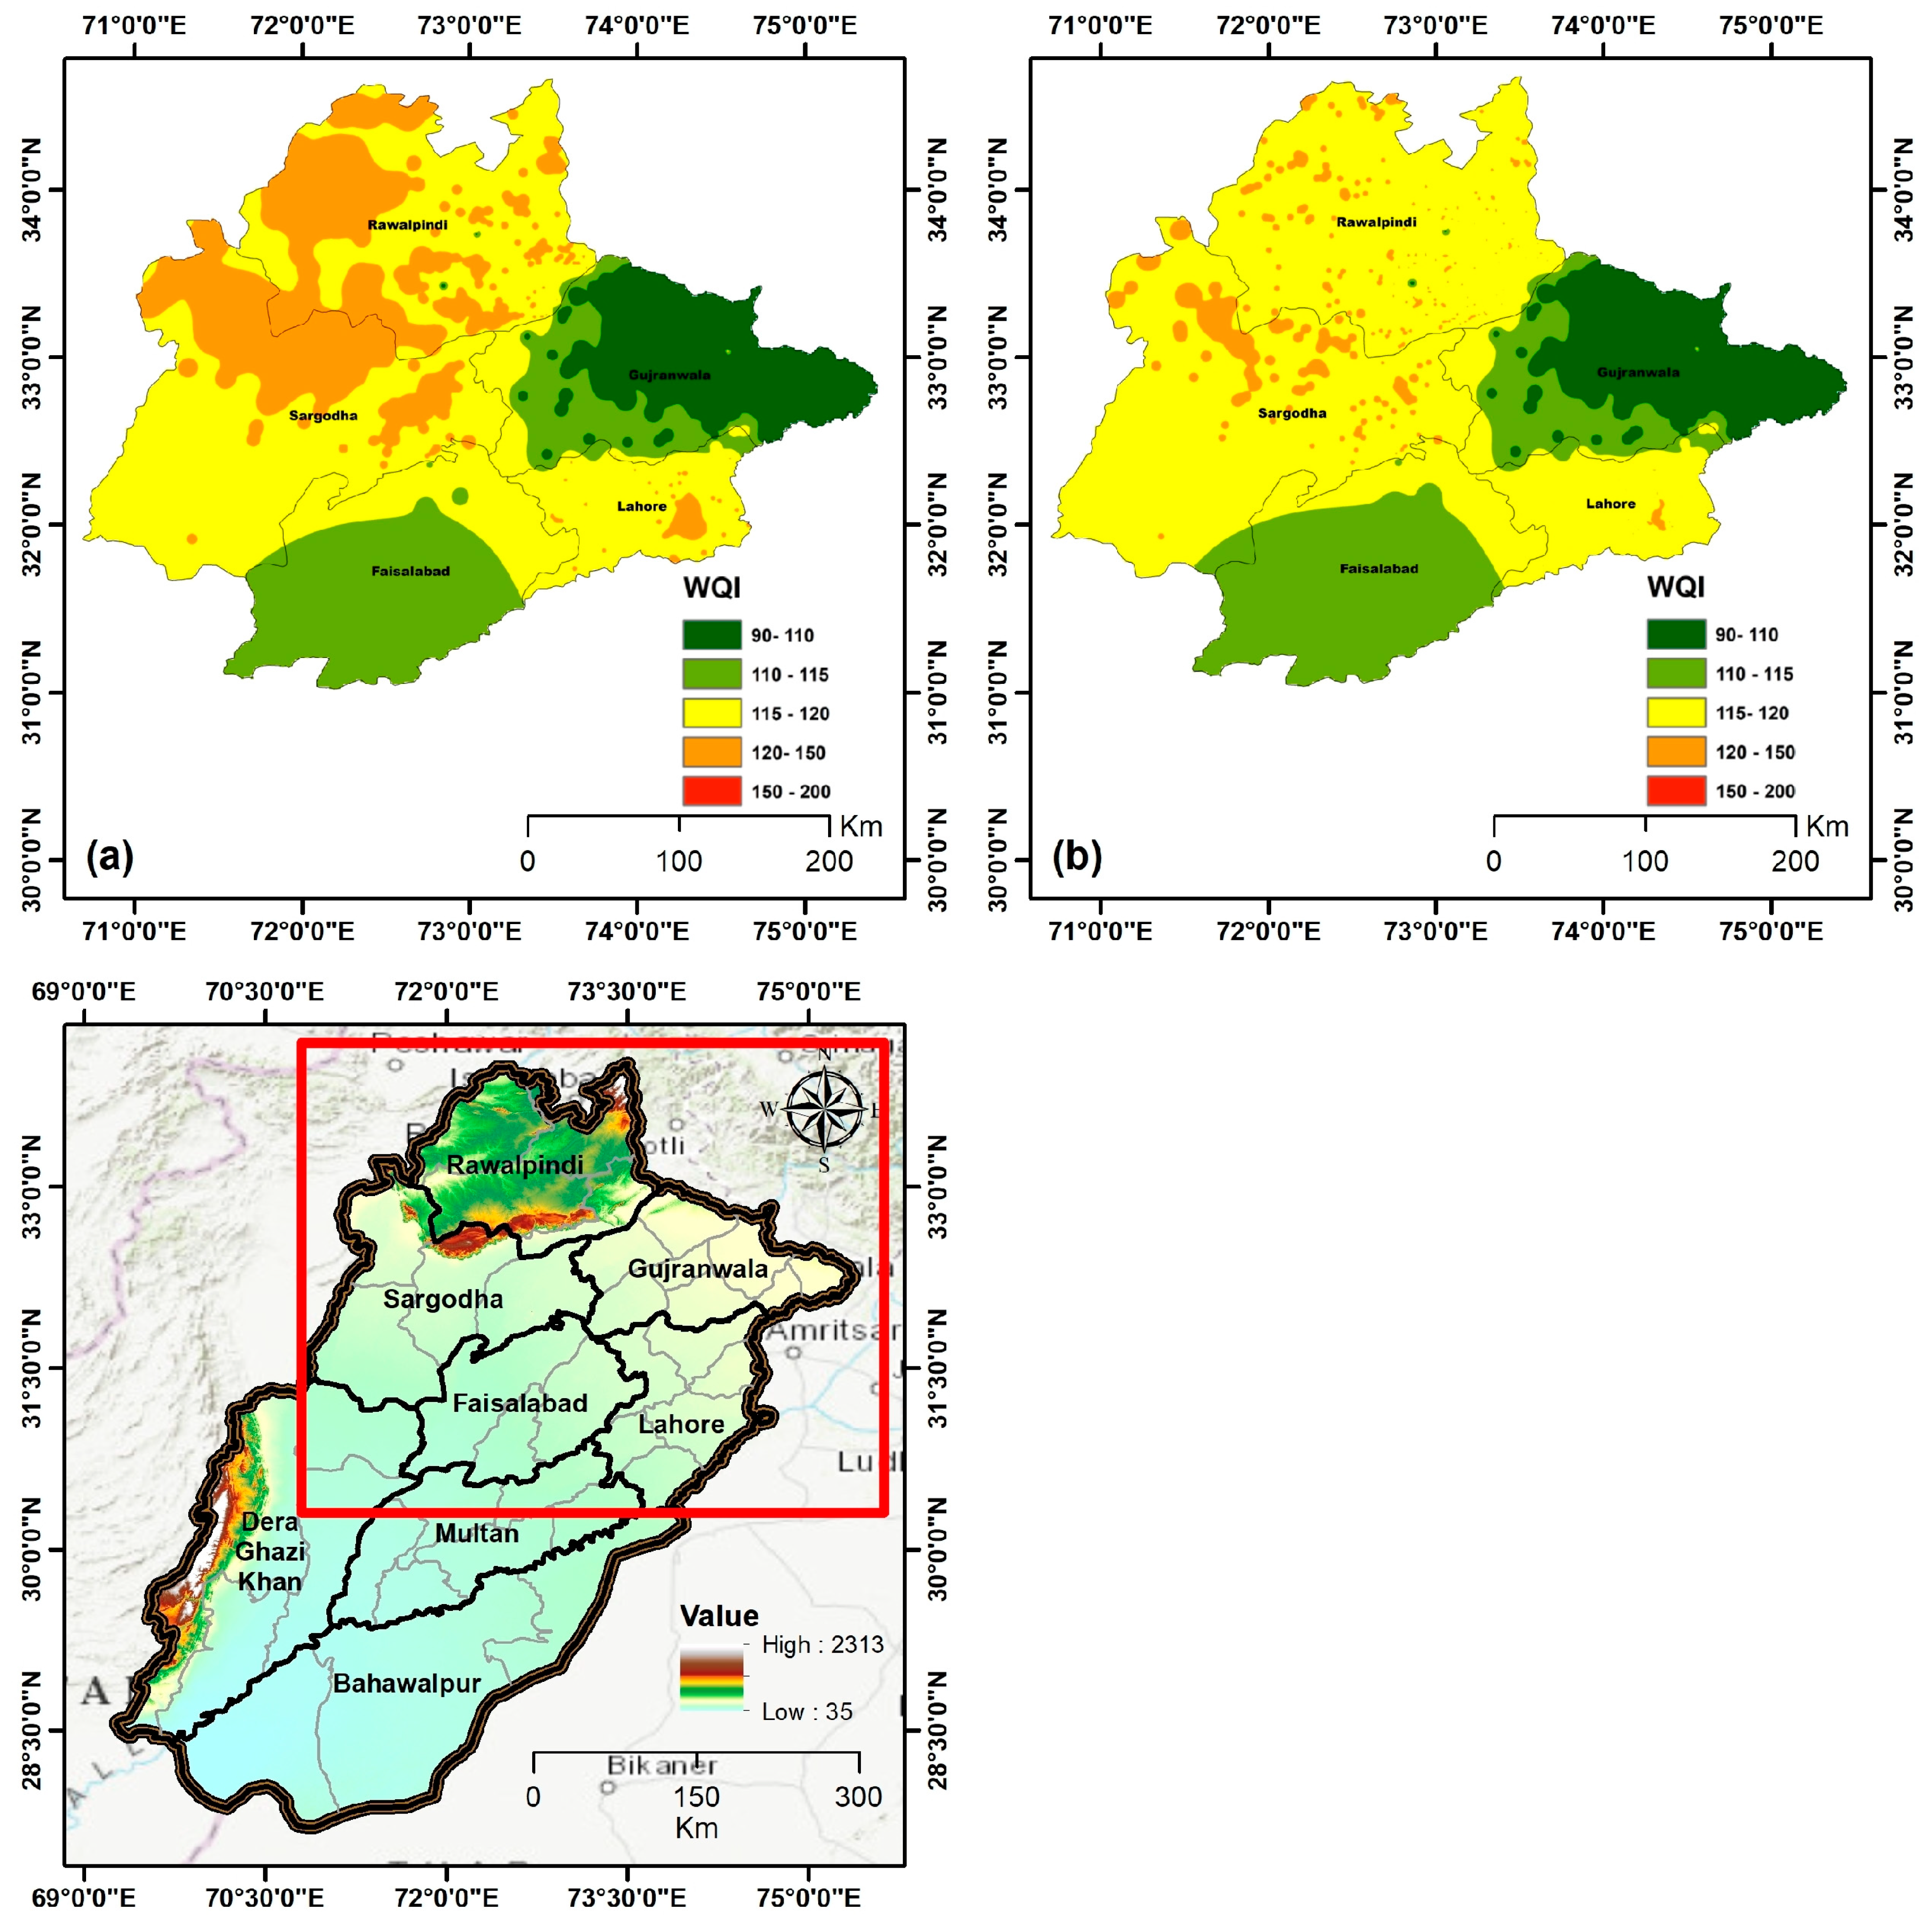
Spatial interpolation techniques were applied in ArcGIS 10.6 to create continuous surfaces of the groundwater quality index layers for drinking and irrigation suitability. The IDW interpolation method was employed, relying on the recorded index values. The IDW calculates cell values by applying a linearly weighted blend of a designated set of sample points, where the weight is determined by the inverse distance. The geostatistical analyst extension was utilized for processing the resulting surface. The risk maps were classified into zones representing groundwater quality suitability levels for drinking and irrigation uses. Additionally, the LULC map was developed from Sentinel-2 satellite imagery. The images were preprocessed and atmospherically corrected, and the NDVI index was derived using ArcGIS. A supervised classification was performed to categorize the land use classes.
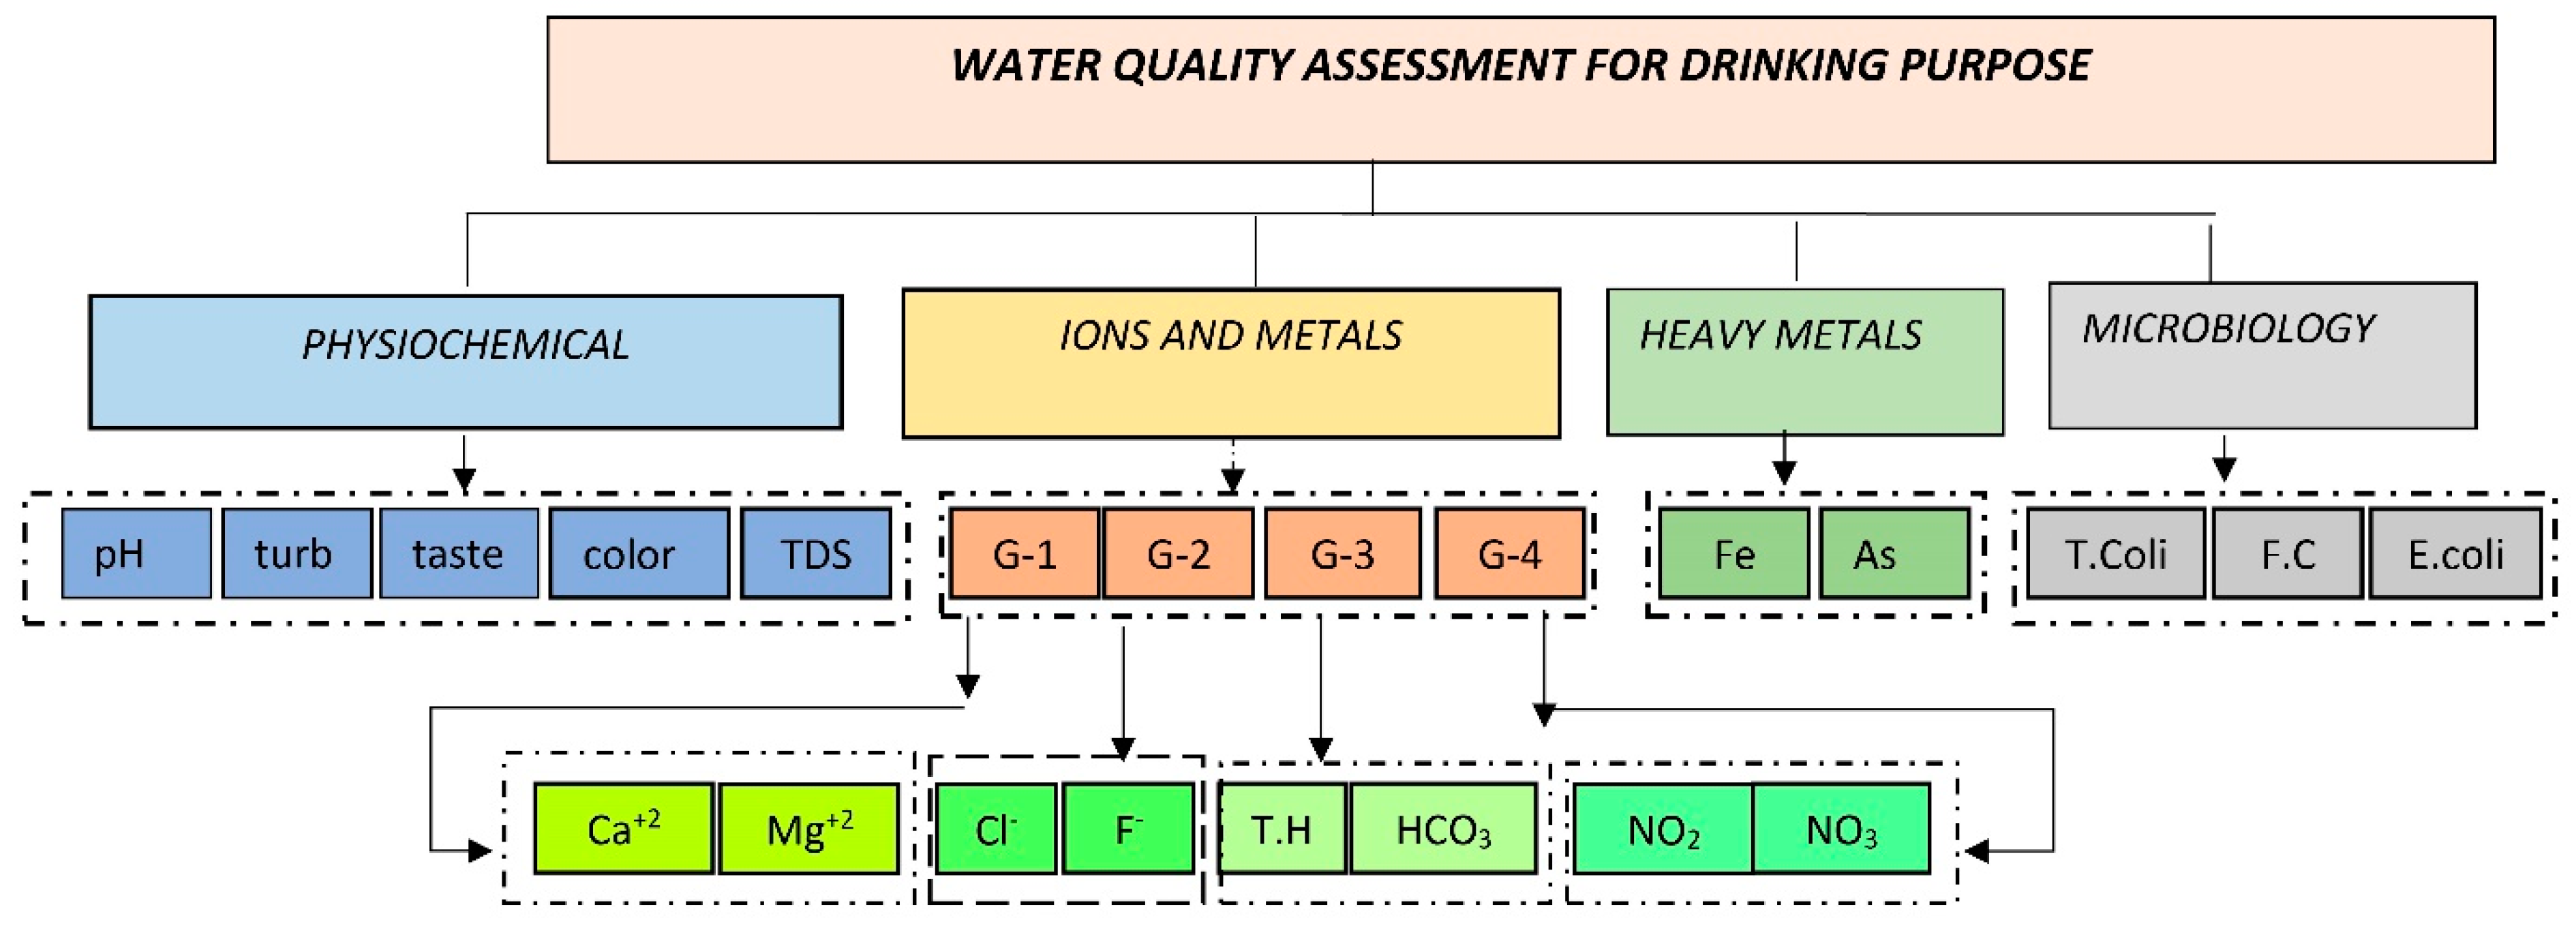
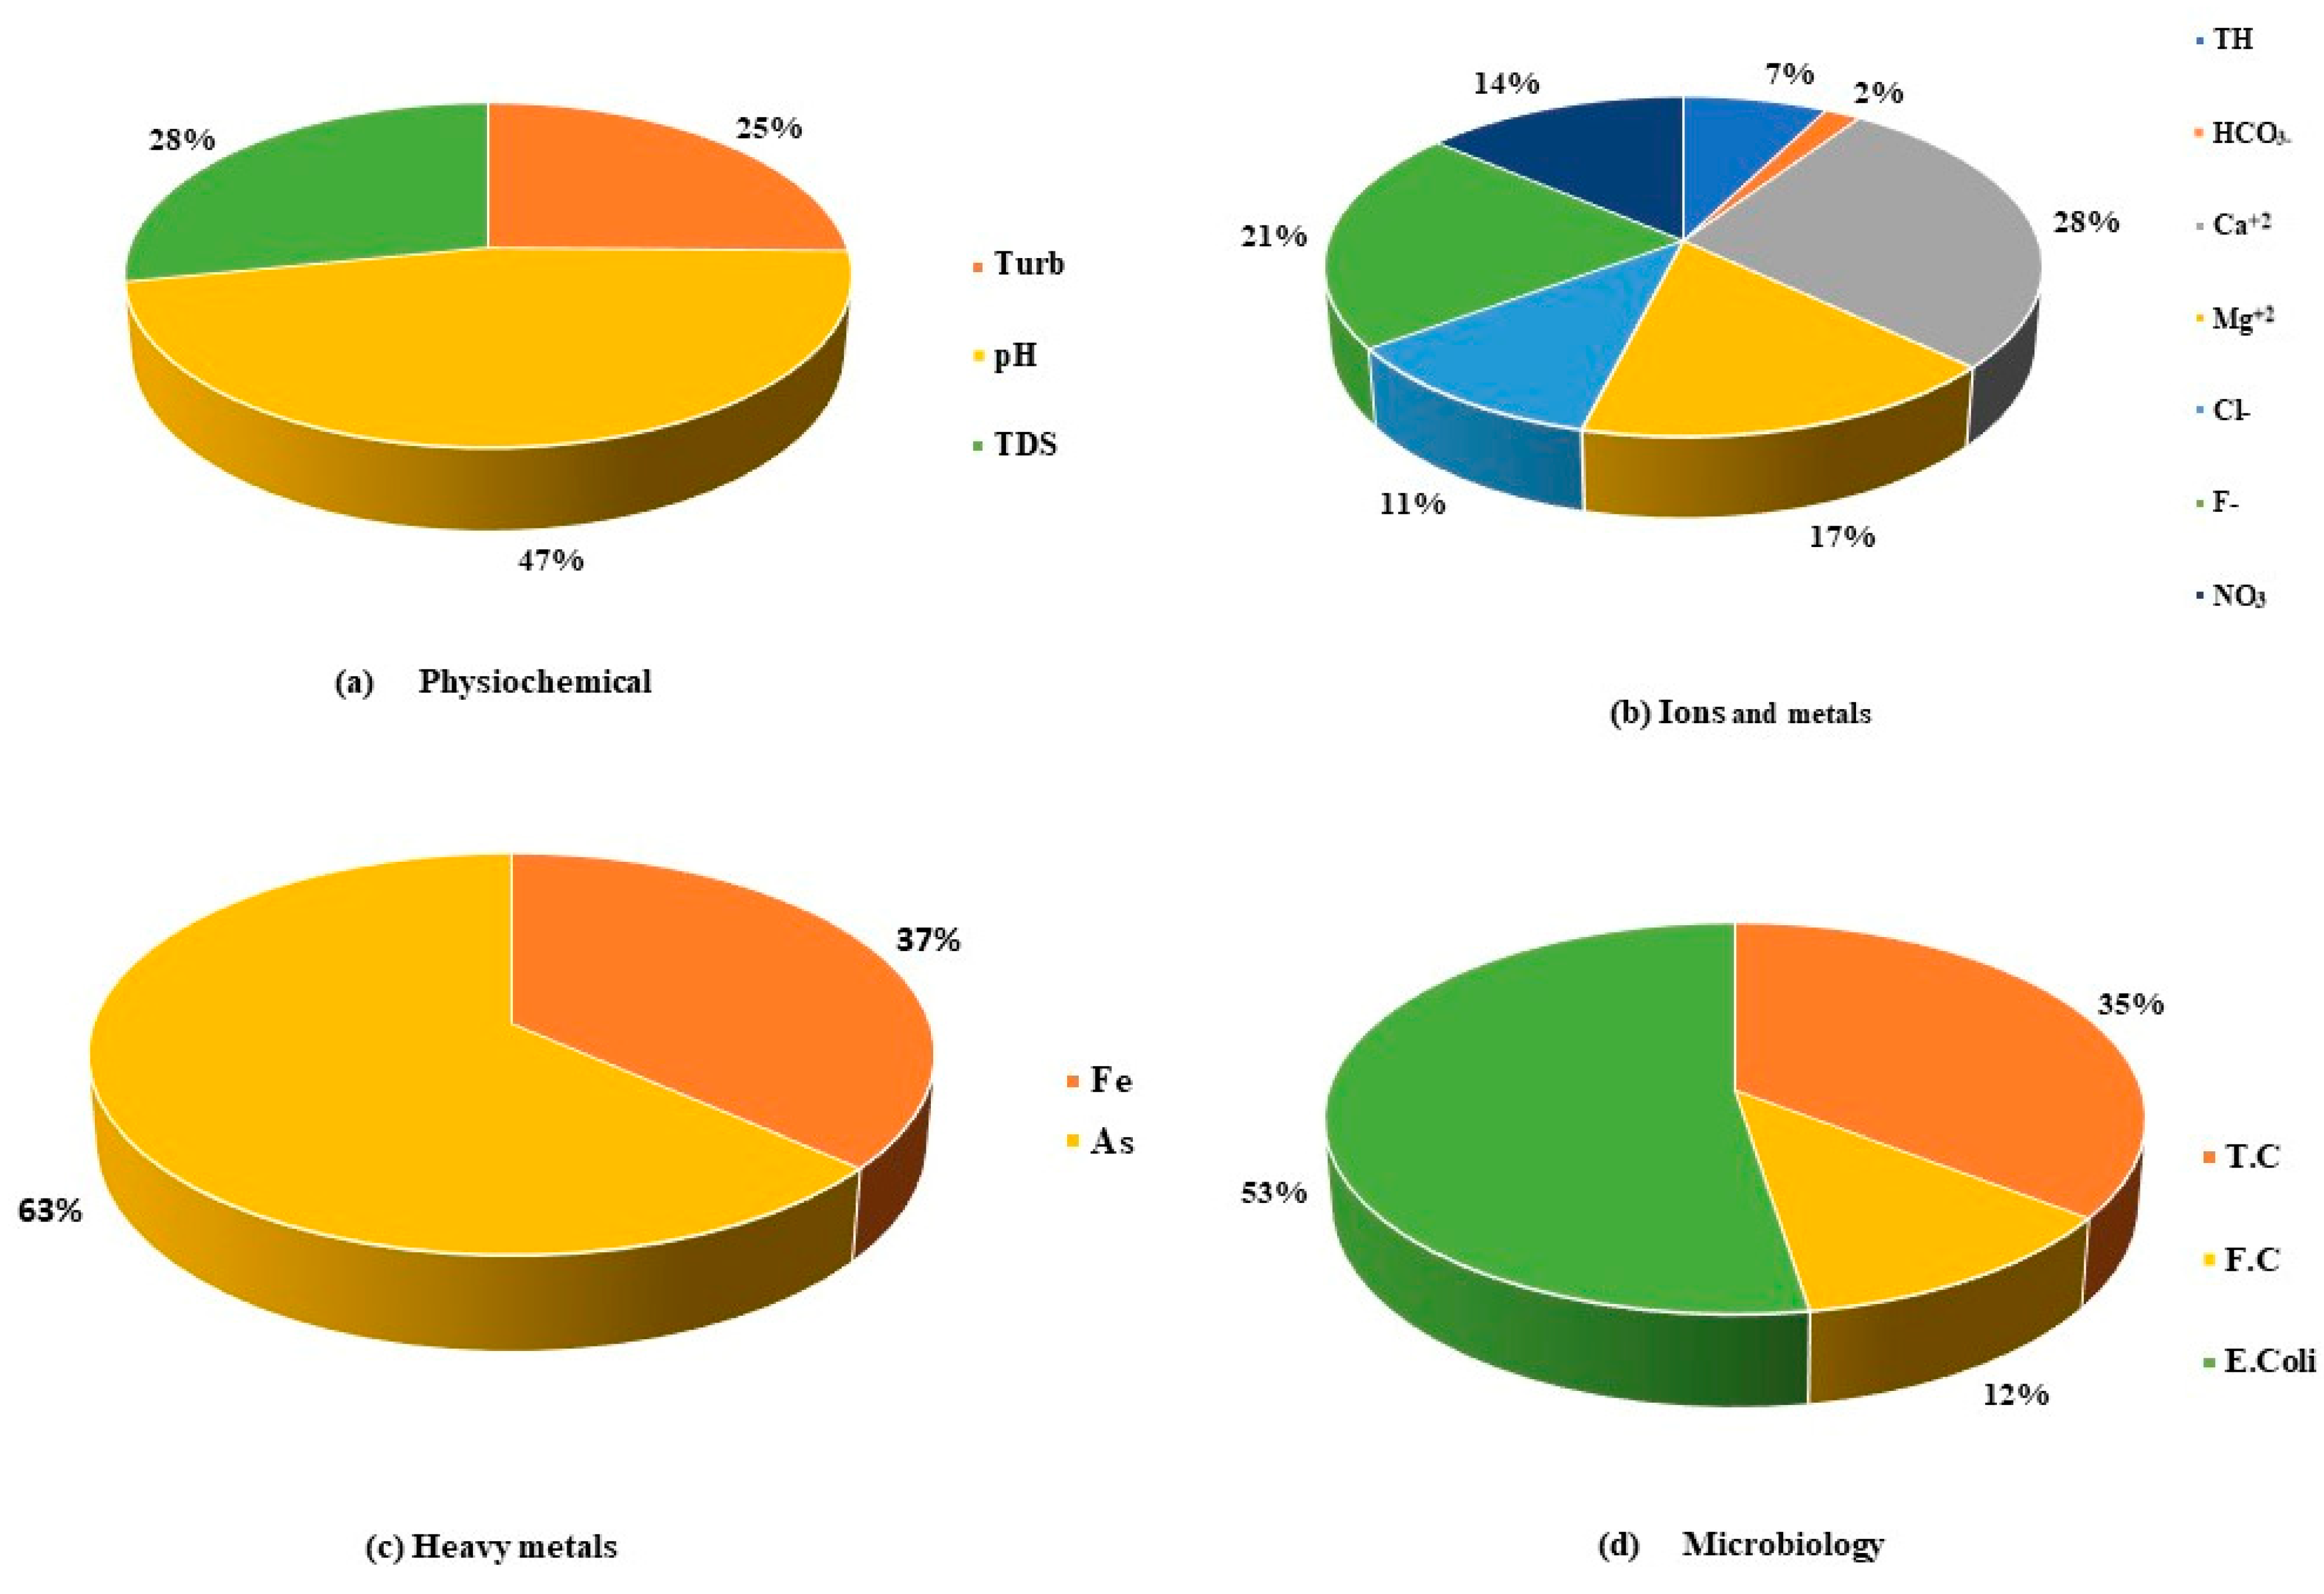
2.3.1. Selection of the Parameters
For calculating the index, selecting the water quality parameters is the primary and most important step. The parameters (i.e., physical, chemical, microbiological, and heavy metals) that greatly influence the groundwater quality are selected and shown in the
Figure 3. The groundwater quality parameters were selected based on the review of the literature [
36], data available [
37], and parameter redundancy [
38] to reflect the overall status of water quality.
2.3.2. Transformation to Sub-Indices
The parameters possess distinct units, and this phase involves transforming the water quality parameters into a standardized scale. For example, ammonia nitrogen is measured in mg/L, but turbidity is measured in NTU. Most WQIs can only be aggregated when the parameters have the same standard scales. Hence, normalizing to establish sub-indices is obligatory. The selected parameters (indicators) are classified into positive and negative indicators. Positive indicators are higher and better, and negative ones worsen the water quality [
39]. The ideal situation comprises higher positive indicators and smaller negative indicator values.
The parameters are normalized using the following equations.
For the positive indicators,
For the negative indicators,
Here, Ri denotes the sub-index of the study region I, xi is the actual value of the indicator in region I, while xmin and xmax represent the minimum and maximum values in the dataset, respectively.
2.3.3. Determination of the Weights
Different weights were assigned to selected parameters based on their relative importance, and their impact on the final index value was assessed. The assigned weights can either be equal or vary. In cases where all index parameters are considered equally important, weights are assigned equally. However, if certain parameters are deemed more significant than others, varying weights are applied. This study employed the analytical hierarchy process (AHP) to calculate and assign weights to different parameters.
2.3.4. Expert Survey Limitations
While the AHP methodology using expert input provides a robust framework for assigning criteria weights, some biases may have inadvertently influenced responses. Academic experts may have fixated more on heavy metals and toxins due to their research priorities, while water management practitioners are inclined towards indicators of operational relevance. The specific backgrounds of experts can skew perceptions of parameter importance based on narrow specializations. Additionally, the sample size of 25 experts limits broad representativeness. Expanding and diversifying the expert panel in future assessments could help mitigate potential biases and restrictions in the current findings. Standard statistical tests should also be applied to ascertain the level of randomness and reliability of responses. Addressing these biases and sampling limitations would enhance the objectivity of criteria weighting outputs.
2.4. Analytical Hierarchy Process (AHP)
The AHP is a robust and valuable tool for addressing the qualitative and quantitative multicriteria aspects inherent in decision-making. This method adopts a subjective approach, assigning weights through pairwise comparisons between various criteria, as guided by policies proposed by [
40]. The hierarchical process commences with establishing a goal derived from the research objectives concerning water quality assessment. This is contingent upon the criterion or criteria, such as drinking and irrigation, followed by the identification of alternatives, encompassing physical, chemical, heavy metals, and microbiological parameters. The AHP unfolds in three stages: parameter selection, subsequent construction of pairwise comparisons, and calculation of the corresponding weights.
For generating a pairwise matrix, the researcher must establish the priorities for the main criteria (drinking, irrigation) by setting them side by side on their relative importance. The structured questionnaire was crafted employing the widely recognized Saaty scale, utilizing a scale ranging from 1 to 9 points to assess the relative importance of parameters in relation to each other. The Saaty scale provides a standardized methodology for eliciting expert judgments on the importance of criteria through pairwise comparisons, allowing priorities and weights to be derived mathematically. This scale is highly recommended for its universal acceptance, offering a comprehensive range of options to discern the relative importance among parameters.
For each query, indicate the response that most accurately reflects your perception of the importance of water-quality parameters for drinking purposes. Utilize the 1–9-point scale for the comparative analysis shown in
Table 1 [
41].
The AHP questionnaire was distributed to 25 experts consisting of 15 university professors from the departments of environmental science, geology, and hydrogeology and 10 water management professionals from government agencies. This sample of respondents was selected to provide perspectives from both academic and practical water quality management domains. The experts had an average of 12 years of experience related to groundwater research or management in the region. By incorporating input from both scientific experts and water practitioners, the aim was to derive balanced criteria weights that reflect technical groundwater quality considerations as well as applied management needs.
Responses were transported matrices, and the relative importance of the parameters for two criteria, drinking and irrigation, were noted. These responses were computed to calculate the weights of individual parameters. All the respondents give more importance to the As, fecal coliforms, total coliforms, TDS, and Iron. In some exceptions, the researchers assigned more weights to nitrate, E. coli, and chloride. All other parameters were assigned relatively the same importance. The higher weights were assigned to the heavy metals since heavy metal contamination is increasing exponentially in urbanized areas.
2.4.1. Construction of Pairwise Matrix
Judgments made by the respondents were then transformed into numerical values. Here, we compared the different parameters as ‘n,’ the number of parameters in pairs according to the relative importance assigned by the respondents. Denote the parameters by ‘
P1,
P2 …
PN’ and their weights by
p1,
p2 …
pN. of matrix A [
40]. The matrix’s diagonal members are all uniformly set to one. As a result, as the equation below shows, the lower triangular values were automatically calculated from the upper triangular component of the matrix replies shown in
Table 2.
Weight calculation (by eigenvector)
The weights are generally elicited using matrix algebra to find the primary eigenvector
w = (
w1,
w2 …
wN) from matrix
P where
wi > 0.
when a matrix is normalized, the primary eigenvector for
wi = 1 becomes a priority vector for that matrix (i.e., weights) (Saaty, 1980).
According to (Saaty, 1980), the primary eigenvector of P is the desired eigenvector. The following equation can be used to calculate the priority vector
w.
where Δ
Max is the matrix A’s most significant eigenvalue, and w is the corresponding eigenvector.
The weights of individual parameters were estimated across all hierarchy levels using the eigenvalue method [
42].
2.4.2. Calculation of the WQI
At this stage, the indices of various parameter groups underwent aggregation through mathematical procedures. These calculations produced a sub-index value based on the assigned weights to specific parameters, ultimately determining the overall water quality status. The aggregation process employed the additive method to establish the water quality index. The final index value was computed using the following equation [
43].
where
n represents the number of parameters selected,
Wi is the weightage of individual parameters, and
Qi depicts the measured value or experimental laboratory value of the parameters.
4. Discussion
This study comprehensively evaluated groundwater quality across the Punjab province by analyzing 24 key parameters at over 1094 sampling sites. The computed groundwater quality indices revealed discernible spatial patterns, with distinct problem areas in major urban centers and industrial zones.
Comparison of groundwater quality: The groundwater quality trends observed in this study, including severe microbiological and heavy metal contamination in the major urban centers of Lahore and Rawalpindi, along with high nutrient levels in agricultural areas, align with findings from previous localized assessments. For instance, a 2018 Lahore study reported 25% of groundwater samples having arsenic concentrations above WHO thresholds along with 31% showing coliform counts exceeding drinking water standards [
83]. Similar or higher proportions of samples over limits were witnessed in the present statewide analysis. Likewise, 21% of samples in Rawalpindi were found to have
E. coli contamination beyond permissible guidelines [
84,
85] as compared to 19% overall across the Punjab provinces. While providing statewide confirmation, the current results build upon these localized investigations on groundwater pollution sources and health hazards in key districts. The wider analytical frame, encompassing rural, urban, and industrial terrain, allows additional identification of regional patterns related to land use, hydrogeology, population clusters, and sanitation infrastructure. The widespread degradation of drinking and irrigation water quality revealed across Punjab mirrors groundwater management challenges confronted by urbanizing developing countries globally. As populations and economies grow, balancing water demand with sustainable use and conservation of subsurface reservoirs becomes imperative [
86]. However, governance capacities rarely keep pace, resulting in uncontrolled extraction, inadequate sanitation infrastructure, and rampant contamination [
87].
Correlation between LULC and groundwater pollution: The study reveals discernible associations between zones of intense urbanization and industrialization and severe deterioration in groundwater quality across key metrics. Microbiological and heavy metal contamination was pronounced in major cities like Lahore, Rawalpindi, and Sargodha, with high population densities, industrial growth, and the discharge of untreated wastes into hydrological bodies. In contrast, rural regions with agrarian land use showed heightened levels of fertilizer-derived nitrates and salts, indicative of agricultural runoff impacts. The composite LULC map illustrates the geographical overlap between urban built-up areas and pollution hotspots for both drinking and irrigation suitability indices. This correlation arises from multiple facets of anthropogenic activity. Unplanned urban expansion and industrialization increase concrete cover, hindering aquifer recharge while simultaneously elevating contamination loads from residential sewage, industrial effluents, and vehicular emissions. Groundwater over-extraction to satisfy municipal and industrial demands also compounds quality degradation [
88]. Meanwhile, intensive fertilizer and pesticide use in croplands infiltrate subsurface reservoirs. An integrated management approach addressing pollution generation patterns from settlements, industries, and croplands in conjunction with groundwater conservation is imperative to restore and preserve quality. Punjab epitomizes this imbalance, with burgeoning pollution from industrial effluents, sewage discharges, agricultural runoff, and municipal wastes intensified by over-abstraction, as echoed in assessments across India, Bangladesh, and Africa [
89]. Appropriate regulatory and technological interventions are urgently warranted. Our findings reiterate the need for discharge guidelines, real-time monitoring systems, and nature-based remediation [
90], prioritizing key micropollutants and hotspots through a localized risk management approach [
91].
Management scenarios effectiveness: The study formulates various pollution control and remediation scenarios encompassing upgrades to wastewater treatment, regulation of contaminant sources, and groundwater replenishment. The scenario analysis reveals that tertiary treatment of municipal wastewater, incorporating processes like filtration, disinfection, and nutrient removal, offers the highest rehabilitation potential, possibly restoring groundwater quality in 41% of the study region. Secondary treatment with sedimentation, biological digestion, and chlorination also indicates significant improvements by directly tackling microbial risks. However, the scope of these infrastructural interventions remains limited, given the distributed nature of contaminant generation. At least 27% of the study area requires targeted action to address microbiological risks through real-time water quality monitoring, separating distribution infrastructure from sewage lines, and managing aquifer recharge. The scenario testing provides a decision support foundation, illustrating that while centralized treatment plants will greatly assist quality restoration, localized precautions, onsite sanitation systems, and controlled agricultural application of agrochemicals are equally critical to containing the decline in quality. An adaptive strategy entailing wastewater upgrading along with rigorous contamination source oversight is essential for preserving groundwater usability.
Health risks: The heavy metal, nutrient, and microbiological contaminants detected across Punjab pose varying environmental and health consequences, underscoring the need for a risk-based mitigation approach. Microbiological pollution is the most widespread and alarming, given the acute gastrointestinal and longer-term effects linked to pathogens like
E. coli and coliforms. With over a quarter of samples contravening WHO guidelines, addressing fecal contamination through water treatment and purified supply chains is an urgent priority. Likewise, heavy metal poisoning via arsenic and iron can prompt severe illnesses, from cardiovascular impacts to neurological disorders and cancers. While less pervasive currently, the high toxicity warrants stringent industrial regulation and monitoring. Excess nitrates and salts exhibit relatively lower health hazards but impede water potability and utility over time, meriting agricultural runoff control. A tiered strategy simultaneously tackling microbial risks, industrial metals, and non-point ions is essential, prioritizing actions based on the distinct public health threats. Monitoring must expand in high-risk urban and rural zones along with proactive mitigation where contamination already imperils water usability for drinking and irrigation. If business-as-usual resource depletion and contamination continue, over 50% of Punjab may have unusable groundwater by 2040, presenting risks to food security and public health. However, prospects exist for science-informed management to avoid the “tragedy of the groundwater commons” [
92]. Structured governmental coordination, community participation, and adaptive policies on extraction limits, water pricing, and agricultural inputs can help balance utilization with sustainability [
93].
Policy implications: The study exposes alarming groundwater quality deterioration trends, with under half of the areas analyzed as suitable for drinking without treatment. This decline directly threatens public health and agriculture, given the extensive dependence on subsurface reservoirs. Immediate policy interventions are vital to conserve current usability and prevent further damage. Stringent wastewater discharge guidelines need coupling with monitoring systems and pollution taxation. Simultaneously, groundwater extraction regulations can ease abstraction pressures alongside recharge enhancement programs. Agrochemical rules to moderate fertilizer and pesticide usage will mitigate a key diffuse source. Zonal delineation of groundwater pollution warrants tailored actions like prioritizing sewage infrastructure in microbial hotspots. Economic incentives and public education to reduce water demand and properly dispose of waste are equally important. Ultimately, an integrated policy mix addressing extraction, recharge, and multi-sectoral contamination while aligning stakeholders through incentives and awareness is essential to uphold long-term groundwater adequacy across residential, ecological, and livelihood needs. The study provides an evidentiary base to trigger the urgent adoption of science-based groundwater governance [
94]. Specifically, two priority actions emerge from the study. Firstly, widespread water quality monitoring for microbiological and heavy metal hazards, given their acute health impacts. Secondly, aggressive centralized and decentralized wastewater treatment expansions to tackle industrial and municipal contamination. These measures, combined with conservation incentives, can restrict a further decline in this critical hidden resource [
95].
Microbiological contamination emerged as the predominant issue, accounting for over a quarter of samples exceeding the WHO thresholds for total coliforms and E. coli. The contamination hotspots aligned closely with major cities like Lahore, Rawalpindi, and Sargodha, which have high population densities and discharge large volumes of untreated municipal wastewater into water bodies. Leakages from aging water supply and sewerage infrastructure likely contribute to the microbial pollution of groundwater reserves. Rural areas also exhibited fecal contamination, potentially due to onsite sanitation systems like pit latrines and septic tanks.
Heavy metals, especially arsenic, were found to be problematic in the Lahore division, indicative of industrial pollution from sectors like textiles, chemicals, and metal processing. The heavy metal contamination poses severe health risks and should be urgently addressed. Sargodha and Faisalabad divisions had localized traces of arsenic and iron contamination.
Ions and salts like nitrates, fluoride, and chloride exceeded thresholds mainly in the Sargodha division. Elevated nitrate concentrations imply the impacts of fertilizer runoff from intensive agriculture. Fluoride levels were also the highest in Sargodha, possibly due to fluoride-bearing geological formations. The broad spatial patterns suggest that microbiological and heavy metal pollution is most severe in urban-industrial zones, while ions and salts impact groundwater quality in rural agricultural areas.
The study revealed that areas with deeper groundwater tables and greater recharge from precipitation or surface water tended to have lower contamination levels. However, water quality is deteriorating in zones with heavy withdrawals for irrigation and potable supplies. As Punjab’s population grows, groundwater abstraction can be expected to increase, exacerbating quality issues [
96].
Mitigation strategies should prioritize upgrading wastewater treatment, regulating industrial discharges, and reducing fertilizer application. The scenario analysis indicated that the tertiary treatment of municipal wastewater could potentially rehabilitate 41% of the study area. Secondary treatment also showed significant improvements. However, 27% of the region requires measures to address microbiological contamination, such as regular water quality monitoring and separating water lines from sewage systems.
Overall, the study provided a robust baseline assessment of groundwater quality at the provincial scale, identifying priority areas and contamination sources. The results can guide the formulation and spatial targeting of groundwater management policies for safeguarding this vital but threatened resource. Monitoring of quality parameters needs to expand in conjunction with the stronger enforcement of water pollution regulations. Public awareness campaigns on water conservation and pollution impacts are also essential. An integrated approach combining supply augmentation, demand management, and water quality protection is imperative for the sustainability of groundwater reserves across Punjab [
97].
5. Conclusions
This study conducted an integrated assessment of groundwater quality across the Punjab province, Pakistan, by analyzing 24 key parameters at over 1094 sampling sites. The analytical hierarchy process was employed to determine weights for the selected indicators, which were aggregated into a weighted WQI. The computed WQI layers were classified to delineate groundwater quality zones for drinking and irrigation suitability.
The results revealed that 27% of samples exceeded WHO thresholds for total coliforms, indicating widespread microbiological contamination attributed to untreated wastewater discharges in urban areas. Heavy metals, especially arsenic, emerged as a significant concern in the Lahore division. Elevated levels of ions and salts like nitrates and fluoride exceeded limits primarily in the Sargodha division, likely due to fertilizer runoff.
Overall, the WQI analysis found that 38.54% of the study area fell in the “bad” category, requiring treatment before potable use. Only 11.53% was classified as “good” quality. For irrigation, most of the region was classified as “permissible”, but 30.82% was designated “good”. The assessment showed deteriorating trends in groundwater quality, particularly near major cities. The computed groundwater quality indices revealed discernible spatial patterns, with distinct problem areas where drinking water standards were exceeded, posing risks for public health if supply is untreated. Targeted policies and treatment strategies focused on ensuring drinking water safety are critically needed to manage current quality issues documented across both urban and rural zones.
The scenario analysis indicated that upgrading wastewater treatment could potentially rehabilitate 41% of the study area if tertiary treatment is applied. Secondary treatment also showed improvements. However, targeted measures are essential to address microbiological contamination in 27% of the region.
The study provided a robust baseline evaluation of groundwater quality at the crucial provincial scale. The results can guide evidence-based policies for groundwater monitoring and pollution control. Integrated management encompassing water conservation, treatment upgrades, and stronger regulation is imperative to safeguard groundwater reserves. The methodology and findings furnish vital insights for assessing and preserving groundwater quality in other developing regions confronted with rapid urbanization and environmental degradation.


