Abstract
Identifying potential sources of suspended sediment (SS) in headwater catchments is crucial for water quality management. To differentiate these potential SS sources, we investigated the distribution of two fallout radionuclides (FRNs), 137Cs and 210Pbex, using gamma spectrometry along with soil organic matter (SOM) analysis in a headwater catchment with five potential SS sources: cultivated land, non-harvested forest floor, eroded hillslope, harvested forest floor, and stream bank. The 137Cs and 210Pbex concentrations and the SOM content were considerably higher in the harvested forest floor materials than in the other four potential SS source materials. FRN concentrations revealed distinct properties according to the type of potential SS sources. Specifically, the combination of FRNs (with the effect of SOM content removed) associated with the mineral fraction and SOM showed distinguishable differences among the potential SS sources, except for no difference between cultivated land and eroded hillslope. Therefore, SOM and FRNs, or their combination, can be effective indices to differentiate or trace potential SS sources on various land use/land cover types within a catchment. Further field tests will allow the tracing techniques that bind FRNs with SOM to contribute to understanding SS transport from non-point sources within a catchment.
1. Introduction
Sediment transport in headwater catchments primarily involves suspended loads consisting of clay, silt, and sand particles suspended in water owing to turbulence, in contrast to bedload, which involves rolling, sliding, and bouncing of larger particles along the streambed [1,2]. For most streams, suspended sediment (SS) consists of fine sand, silt-sized, and clay-sized particles with diameters ≤ 0.2 mm [2]. The suspended load comprises a major portion of the total sediment load in most water systems [3] and significantly influences physical and biological processes within catchments from upstream to downstream [2]. Consequently, changes in land use leading to increased SS loads or concentrations [4,5] have long been a dominant concern in water quality and aquatic [6,7] management of catchments. Several studies have explained that accelerated SS load input into downstream water can impair drinking water quality by exceeding turbidity guidelines [8,9], cause heavy siltation of fish spawning habitats [10,11], and reduce channel capacity, affecting flood risk [12] and inundating offshore corals [13]. Thus, understanding the links between catchment characteristics, including land use and SS dynamics, is essential for effective water quality management at the catchment scale.
63.1% of the total land area in South Korea is covered by steep-slope forests [14], and headwater streams (i.e., first- to third-order streams) account for 88.9% of the total river channel length nationwide [15]. Gomi et al. [2] reported that the SS dynamics in headwater streams play a significant role in water quality management. Despite the importance of freshwater supply, highland agriculture, which may have induced increases in SS, has concentrated in headwater streams [16,17]. Additionally, the amount of SS originating from non-point sources in highland agriculture or mountainous areas is discharged during the East Asian summer monsoon, which accounts for 60–70% of the annual precipitation in South Korea [18,19]. For these reasons, South Korea has been classified as a nation with very high water erosion vulnerability [20,21]. Moreover, intensive highland agriculture on steep slopes can cause severe soil erosion, resulting in downstream water quality impairment [22,23,24]. However, water resource management policies for turbidity reduction are concentrated downstream of the catchments [25]. To protect and manage water quality, we must provide information on SS originating in non-point sources within a catchment.
Information on SS sources is essential for interpreting the SS dynamics and constructing a sediment budget in a catchment [26,27]. Walling [28] noted that identifying SS sources is a key parameter for designing effective sediment management and control strategies. According to several studies [2,29,30], SS in streams is derived from sources both external (e.g., bank erosion, mass movement, roads and trails, and surface erosion on slopes) and internal (e.g., storage within the channel system from perennial and ephemeral reaches) to the stream channel. Gomi et al. [2] and Collins et al. [30] also explained that source types and spatial distributions differ according to catchment dynamics (i.e., man-made and/or natural disturbance, land use change) in a given catchment.
Techniques using fallout radionuclides (FRNs) such as caesium-137 (137Cs), lead-210 (210Pb), and beryllium-7 (7Be) have recently been used to identify SS sources within catchments in many regions [31,32,33,34]. In particular, 137Cs and excess 210Pb (210Pbex) have been more widely used for identifying SS sources [31,35,36] as 7Be has a very short half-life (t0.5 = 53 days) compared with 137Cs (t0.5 = 30 years) and 210Pbex (t0.5 = 22 years) [37]. FRNs can allocate the amount of SS contributed by each source via physical or biogeochemical properties [38,39]. Several researchers have explained that this method can determine soil and sediment redistribution dynamics within agricultural [40,41] and forested [31,36,42] catchments. Moreover, FRNs have been used to complement conventional methods for assessing SS movement and tracing SS sources within catchments [31,32,35]. The FRNs of SS sources can vary among catchments depending on a number of spatial characteristics, such as land use and management practices, geology of the parent material, and geomorphologic history [43,44]. Owing to these characteristics, research on reliable tools for evaluating dominant SS sources has led to the development of nuclear techniques based on FRNs [45].
Understanding the distribution and properties of FRNs is necessary for the field application of the tracing technique using FRNs. However, several domestic studies have been conducted in only a few geographical areas [36,46,47], and hence, FRN-based tracing techniques have been poorly understood in South Korea. The objectives of this study were (1) to analyze the distribution of FRNs (137Cs and 210Pbex) concentrations along with soil organic matter (SOM) content in potential SS sources across various land use/land cover types within a small headwater catchment and (2) to differentiate these potential SS sources based on differences in FRN concentration and SOM content.
2. Materials and Methods
2.1. Study Area
The investigated catchment (0.15 km2) is located in the Chuncheon-si of mid-eastern Korea (37°55′ N, 127°47′ E) (Figure 1). Chuncheon-si, situated in the upper region of both the capital Seoul and the Han River, holds important multiregional water sources [16], including the Lake Soyang, Gongjicheon, and Uiam dam watersheds. Certain areas within Chuncheon-si contribute a significant amount of SS to the Lake Soyang, Gongjicheon, and Uiam dam watersheds (Figure 2a,b) [16,48,49]. The continuous expansion of agricultural activities in upstream areas of the Lake Soyang watershed has led to sediment and nutrient export from highland agricultural fields, causing serious water quality problems for Lake Soyang [50]. Hence, the management of headwater catchment, including various non-point sources, has been recognized as an important regional task to protect water quality and the aquatic ecosystem of a lowland river [50].
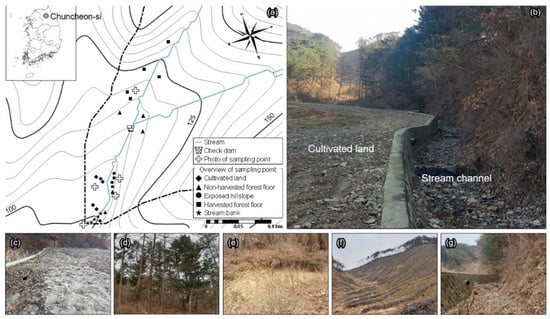
Figure 1.
Location and field photos of the study site. (a) Location map with sampling points and (b) upstream view from the outlet. Potential sources of suspended sediment (SS) at this study site: (c) cultivated land, (d) non-harvested forest floor, (e) exposed hillslope, (f) harvested forest floor, and (g) stream bank. Photos in (c–g) also show overview of sampling points for potential sources of SS.
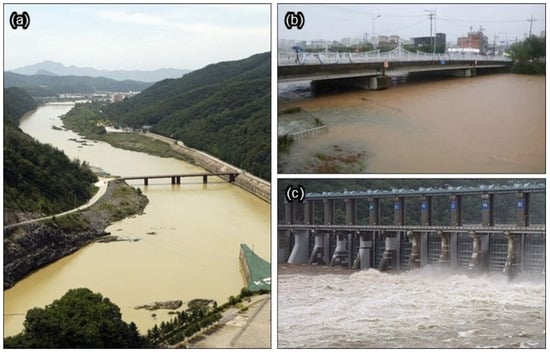
Figure 2.
Views of turbid water occurrence due to suspended sediment transport during East Asian summer monsoon in (a) Lake Soyang [51], (b) Gongjicheon [52], and (c) Uiam dam [53] watersheds in Chuncheon-si, South Korea.
The Chuncheon climate station (Automated Synoptic Observing System, ASOS) recorded an average annual precipitation of 1367.3 mm with a standard deviation of 330.0 mm from 2001 to 2020, with 63.1% concentrated during the East Asian summer monsoon. The mean annual temperature is 11.6 °C with a standard deviation of 0.5 °C. The catchment ranges from 100.0 to 147.5 m above sea level, and the underlying geology consists of garnet–biotite gneiss. The stream channels are 0.3 km long and 3.2 m wide and have a 0.15 m/m slope (Figure 1a,b). The catchment is occupied by forests (64.7%), harvested areas (34.3%), and cultivated land (1.0%) (Figure 1c–g). The partial harvesting was conducted in 2017 (Figure 1f). Of the forest area, 68.7% is covered by coniferous trees (Pinus densiflora, Pinus koraiensis, Pinus parviflora, Pinus pumila, Pinus strobus, Larix gmelinii, and Larix kaempferi), 4.1% by deciduous broad-leaved trees (Quercus variabilis), and 27.2% by mixed forest.
2.2. Soil Sampling and Pretreatment
Soil sampling was conducted to obtain representative samples from each of five potential SS sources (i.e., five samples for each SS source type) in the catchment. Using a soil core sampler (stainless steel; 5 cm diameter; 5 cm length), the surface material (<5 cm depth) was sampled from the cultivated land (n = 5), non-harvested forest floor (n = 5), eroded hillslope (n = 5), harvested forest floor (n = 5), and stream bank (n = 5) over two days on 26 November and 8 December 2020. The depth of nuclide penetration in cultivated soil can be assumed to be equal to the depth of plowing (for example, 20 cm) [54]. In other words, the tillage of cultivated land is assumed to mix soil uniformly to a certain depth, resulting in a uniform distribution of radioactive nuclides throughout the soil. The soil in the cultivated land of the study site is tilled once a year, such as with rotary tillage to a depth of 0–12 cm or deep rotary tillage to a depth of 0–25 cm. However, the sampling was conducted before tilling, assuming that most of the radioactivity is concentrated near the surface during plant growth [55], so the sampling depth of the cultivated soil was set to the surface.
The collected soil samples were oven-dried at 105 °C for 24 h, weighed, disaggregated, and passed through a 2 mm open sieve by referring to the procedures of Mizugaki et al. [31] and Anh et al. [56]. Each soil sample (<2 mm) was placed in a polycon container (5 cm diameter; 2.5 cm length) to determine the FRNs (i.e., 137Cs, and 210Pbex) in this study.
2.3. Radiometric Analysis for FRNs
The 137Cs and 210Pbex contents were analyzed using gamma spectrometry. The 210Pbex activities were determined from the difference between the total and supported 210Pb activities as follows [57,58]:
where 210Pbex represents unsupported (excess) lead-210 (210Pbex), which is determined from the difference between the total (210Pbtotal) and supported 210Pb activities. Assuming equilibrium between the 226Ra and 222Rn in the soil samples, the supported 210Pb activity can be calculated from the activity of its short-lived daughter product 214Pb (half-life of 27 min), which is derived from 222Rn in the 238U decay series [31,57,58].
For FRN analysis, the gamma activity of each sediment sample was measured for 40,000 s. Gamma-ray emissions at 661.6 keV (137Cs), 46.5 keV (210Pb), and 351.9 keV (214Pb) energies were measured using a Broad Energy High-purity Germanium detector system (BEGe) (BE3825, Canberra, GA, USA), coupled to a preamplifier (iPA-SL10, Canberra, GA, USA) (PSC822, Canberra-Eurisys, GA, USA), and a multichannel analyzer (DSA-LX, Canberra, GA, USA). Energy and efficiency calibrations of the detector were performed using standard and background samples.
It is known that FRNs can be adsorbed by both mineral and organic fractions of surface soil [31,59,60]. In this context, FRNs may be associated with potential source materials depending on SOM. Therefore, we calculated FRN activity associated with the mineral fraction (Cm) to remove the effect of organic matter on 137Cs or 210Pbex, according to Mizugaki et al. [31]:
where Ctotal represents the total FRN activity concentration associated with the material, and Com is the FRN activity concentration associated with the organic fraction, following the procedure of Mizugaki et al. [31]. SOM is the organic matter of the potential SS source material in cultivated land, non-harvested forest floor, eroded hillslope, harvested forest floor, and stream bank. The Com values for FRN activity were not detectable and were assumed to be zero for all source materials as in previous studies [31,36].
2.4. SOM Analysis
Dried soil samples (<2 mm) were analyzed for soil organic carbon (SOC) using an elemental analyzer (Vario MAX CN; Elementar Analysensysteme, Langenselbold, Germany). Subsequently, SOM was calculated by multiplying the percentage of SOC by 1.724 [61].
2.5. Statistical Analysis
All data were analyzed using a non-parametric equivalent of one–way analysis of variance (ANOVA) (Kruskal–Wallis test) for comparisons, with significance values adjusted by multiple tests for pairwise post hoc analysis. For some of the variables, the correlation between two variables was analyzed using the Spearman coefficient (r). All statistical analyses were performed using Statistical Package for Social Sciences (SPSS) version 24 (IBM SPSS Statistics, IBM Corporation, New York, NY, USA).
3. Results and Discussion
3.1. Characteristics of FRNs and SOM for Potential SS Sources
Table 1 illustrates the SOM values and FRN characteristics for each sample from potential SS sources (cultivated land, non-harvested forest floor, eroded hillslope, harvested forest floor, and stream bank). SOM (%) ranged from 0.69 to 1.61 for cultivated land, from 2.89 to 8.62 for non-harvested floor, from 0.48 to 2.98 for eroded hillslope, from 5.96 to 11.09 for harvested forest floor, and from 2.75 to 5.05 for stream bank. In terms of FRN concentration, 137Cs (Bq/kg) ranged from 1.8 to 5.8 for cultivated land, from 8.6 to 44.0 for non-harvested floor, from 0.7 to 3.6 for eroded hillslope, from 16.8 to 89.3 for harvested forest floor, and from 1.5 to 22.3 for stream bank. 210Pbex (Bq/kg) ranged from 168.4 to 221.2 for cultivated land, from 222.9 to 741.4 for non-harvested floor, from 58.8 to 165.0 for eroded hillslope, from 659.9 to 1464.3 for harvested forest floor, and from 154.3 to 591.4 for stream bank.

Table 1.
Summary of sampled soil and FRN characteristics in potential SS sources in this study.
Among the potential SS sources, the mean value of SOM was highest in the harvested forest floor and lowest in cultivated land (Figure 3). The mean value of FRN concentration was highest in the harvested forest floor and lowest in the eroded hillslope (Figure 3 and Figure 4a). In particular, the difference between harvested forest floor and cultivated land or eroded hillslope for SOM (Figure 3a) and the difference between harvested forest floor or non-harvested forest floor and eroded hillslopes were significant for FRNs (Figure 3b,c) according to the statistical analysis (p < 0.05).
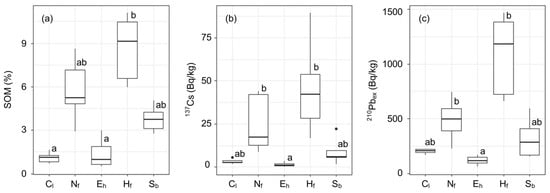
Figure 3.
Comparison of differences in (a) SOM, (b) 137Cs, and (c) 210Pbex concentrations among the potential SS sources. Cl: cultivated land, Nf: non-harvested forest floor, Eh: eroded hillslope, Hf: harvested forest floor, Sb: stream bank. The upper and lower hinges correspond to the first and third quartiles (the 25th and 75th percentiles). The whiskers extend from the hinges to the highest and lowest values that are within 1.5 (the interquartile range). Values beyond the end of the whiskers are outliers and plotted as points. Different letters indicate statistical significance (Bonferroni’s post hoc tests after one-way ANOVA and Mann–Whitney U).
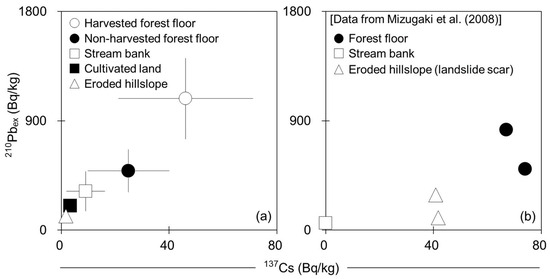
Figure 4.
FRN concentrations associated with the potential SS source materials in (a) this study and (b) the previous study [31]. The error bar in (a) indicates the standard deviation. (b) was plotted using the approximate median values calculated by the authors.
The results of this study (Figure 4a) were similar to those of Mizaugaki et al. [31], who found that 137Cs and 210Pbex activities were much higher in forest floors than in other potential SS sources, including stream banks and landslide scars (Figure 4b). Figure 5 presents a comparison of the 137Cs values analyzed in this study with the results of other domestic studies. Although there are no reference data on the 210Pbex concentration in other domestic studies [36,46], it is expected to exhibit a similar pattern to the 137Cs concentrations of potential SS sources. Harvested and non-harvested forest floors exhibited high concentrations, whereas eroded hillslopes, forest roads, and channel banks exhibited low concentrations owing to subsurface material exposure on the surface areas, as observed in the Woldong catchment [36] and Yeongsan River [46] (Figure 5).
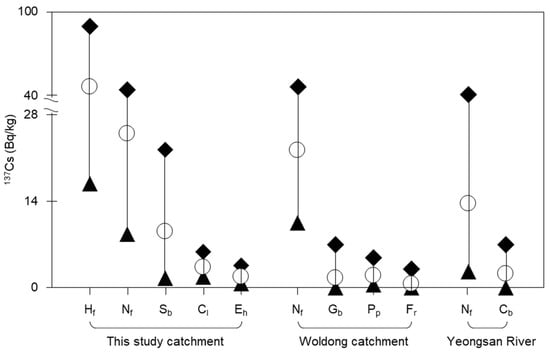
Figure 5.
Maximum (◆), minimum (▲), and mean (◯) values of 137Cs concentration in the potential SS source materials for difference between this study catchment and both Woldong catchment [36] and Yeongsan River [46]. The sources are Hf (harvested forest floor), Nf (non-harvested forest floor), Sb (stream bank), Cl (cultivated land), Eh (eroded hillslope), Gb (gully bank), Pp (paddy plain), Fr (forest road), and Cb (channel bank).
The FRN concentrations can vary depending on the degree of surface soil disturbance. Kato et al. [62] reported that 80% of deposited FRNs were found in the upper 2 cm of the soil layer. He and Walling [59] reported that if erosion occurs, sediment is transported from surfaces containing higher levels of FRNs. Generally, it has been reported that undisturbed surface soil on the forest floor showed significantly high values of 137Cs and 210Pbex activities [31,63], but with high variability due to spatial variations in fallout, throughfall, and soil conditions [31,64,65], and erosion–deposition affected by surface runoff [66]. In particular, forest clear-cutting can significantly contribute to the high inputs of FRNs to surface soils due to the decomposition of logging residue (e.g., needles and lichens) [67,68] and increases in continuous FRN fallout caused by decreases in interception loss by the forest canopy [69,70].
Subsurface material exposed to the surface may exhibit significantly low FRN concentrations. Wallbrink and Murray [71] and Mizugaki et al. [31] indicated that the low activities of FRN concentrations observed in the materials of SS sources suggest the loss of surface materials by erosion. These studies support the low FRN concentrations observed in the materials of eroded hillslopes and stream banks in this study (Figure 3 and Figure 4). Here, the reason for higher FRN concentrations in the stream bank than in eroded hillslope can be explained by the difference in vegetation presence (Figure 1e,g). In the study site, the stream bank was partially covered by vegetation and shrubs, which can trap sediment transported from adjacent hillslopes by surface erosion [31]. Therefore, this suggests that the presence of vegetation can influence the redistribution of FRN concentration. Low levels of FRN concentration in cultivated land materials are due to human disturbances such as soil reconditioning [36] and severe erosion of disturbed soil [72].
Additionally, differences in SOM among the potential SS sources can be explained by the reasons mentioned above for FRN concentration since FRNs are adsorbed by soil minerals and organic matter [31,59,60]. For the potential SS source materials in this study (Table 1), SOM also demonstrated a significant positive correlation with 137Cs (r = 0.84, p < 0.001) and 210Pbex (r = 0.84, p < 0.001), indicating their adsorption.
3.2. Differentiating the Potential SS Sources by Binding FRNs and SOM
As mentioned above, the results of this study show that the FRN concentration was related to SOM content (Table 1, Figure 3), similar to previous studies’ findings [35,41]. These indicate that FRN concentrations may be largely dependent on SOM content.
Consequently, after removing the effect of SOM content on FRN concentration, the results for the combination of SOM and 137Cs and 210Pbex associated with Cm are shown in Figure 6. The mean concentration of 137Cs associated with Cm exhibited the highest value in the harvested forest floor (51.0 ± 28.3 Bq/kg) and the lowest value in the eroded hillslope (1.8 ± 1.1 Bq/kg) (Figure 6a). The mean concentration of 210Pbex associated with Cm exhibited the highest value in the harvested forest floor (1194.6 ± 389.6 Bq/kg) and lowest value in the eroded hillslope (117.5 ± 40.1 Bq/kg) (Figure 6b). The combination of both FRNs associated with Cm and SOM showed distinguishable differences among the potential SS sources, except for a similar value between cultivated land and eroded hillslope.
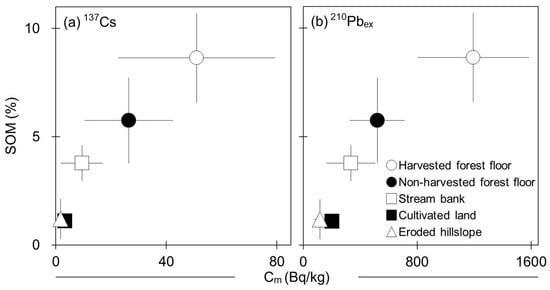
Figure 6.
Relationship between fallout radionuclides activity ((a) 137Cs and (b) 210Pbex) associated with the mineral fraction (Cm) and SOM. The error bar indicates the standard deviation.
Based on the results of this study, we suggest that the combination of FRNs associated with Cm and SOM can be effectively used to differentiate or trace potential SS sources on various land use/land cover types within catchments.
4. Summary and Conclusions
This study analyzed two FRNs, 137Cs and 210Pbex concentrations, and SOM content to differentiate potential SS sources within a headwater catchment in Chuncheon, South Korea. Among the five potential SS sources, the harvested forest floor materials exhibited the highest mean values of SOM content and FRN concentrations, whereas the mean value of SOM content and FRNs concentrations was lowest in the cultivated land and eroded slope materials, respectively. However, there were no statistically significant differences in FRN concentrations and SOM content between some of the potential SS sources.
FRN concentrations revealed distinct properties according to the type of potential SS sources. Furthermore, the combination of the FRNs (with the effects of SOM content removed) associated with Cm and SOM also showed distinguishable differences among the potential SS sources, except for the difference between cultivated land and eroded hillslope.
These results suggest that the potential SS sources on various land use/land cover types within a headwater catchment can be differentiated using SOM and FRNs or their combination. In the future, the combination of FRNs and SOM as source tracers should be tested via field monitoring to assess the results of this study and further understand SS dynamics in the catchment.
Author Contributions
Conceptualization, S.N. and S.K.; methodology, S.N., M.K. and S.K.; analysis and investigation, S.N., K.K., M.K. and S.G.; resources and data curation, S.N., K.K., S.J. and J.L.; writing—original draft preparation, S.N.; writing—review and editing, K.K., J.K.K. and S.K.; supervision, J.K.K. and S.K. All authors have read and agreed to the published version of the manuscript.
Funding
This research was supported by the Korea Ministry of Environment as part of “The SS (Surface Soil conservation and management) projects; 2019002830002” and the R&D Program for Forest Science Technology (Project No. 2021342B10-2323-CD01) of Korea Forest Service (Korea Forestry Promotion Institute).
Data Availability Statement
Data are contained within the article.
Conflicts of Interest
The authors declare no conflicts of interest.
References
- Leopold, L.B.; Wolman, M.G.; Miller, J.P. Fluvial Processes in Geomorphology; W.H. Freeman: San Francisco, CA, USA, 1964; pp. 1–544. [Google Scholar]
- Gomi, T.; Moore, R.D.; Hassan, M.A. Suspended sediment dynamics in small forest streams of the Pacific Northwest. J. Am. Water Resour. Assoc. 2005, 41, 877–898. [Google Scholar] [CrossRef]
- Dunne, T.; Leopold, L.B. Water in Environmental Planning; W.H. Freeman: San Francisco, CA, USA, 1978; pp. 1–818. [Google Scholar]
- Haupt, H.F.; Kidd, W.J. Good logging practices reduce sedimentation in Central Idaho. J. For. 1965, 63, 664–670. [Google Scholar]
- Geronimo, F.K.F.; Maniquiz-Redillas, M.C.; Hong, J.; Kim, L.H. Evaluation on the suspended solids and heavy metals removal mechanisms in bioretention systems. Membr. Water Treat. 2019, 10, 91–97. [Google Scholar]
- Corbett, E.S.; Lynch, J.A.; Sopper, W.E. Timber harvesting practices and water quality in the Eastern United States. J. For. 1978, 76, 484–488. [Google Scholar]
- Campbell, I.C.; Doeg, T.J. Impact of timber harvesting and production on streams: A review. Aust. J. Mar. Freshw. Res. 1989, 40, 519–539. [Google Scholar] [CrossRef]
- Binkley, D.; Brown, T.C. Forest practices as nonpoint sources pollution in North-America. Water Resour. Bull. 1993, 29, 729–740. [Google Scholar] [CrossRef]
- Nisbet, T.R. The role of forest management in controlling diffuse pollution in UK forestry. For. Ecol. Manag. 2001, 143, 215–226. [Google Scholar] [CrossRef]
- Sheridan, W.L.; McNeil, W.J. Some effects of logging on two salmon streams in Alaska. J. For. 1968, 66, 128–133. [Google Scholar]
- Lisle, T.E. Sediment transport and resultant deposition in spawning gravel, North Coastal California. Water Resour. Res. 1989, 25, 1303–1319. [Google Scholar] [CrossRef]
- Nones, M. Dealing with sediment transport in flood risk management. Acta Geophys. 2019, 67, 677–685. [Google Scholar] [CrossRef]
- MacDonald, L.H.; Sampson, R.W.; Anderson, D.M. Runoff and road erosion at the plot and road segment scales, St John, US Virgin Islands. Earth Surf. Process. Landf. 2001, 26, 251–272. [Google Scholar] [CrossRef]
- Korea Forest Service (KFS). Statistical Yearbook of Forestry 2023; Korea Forest Service: Daejeon, Republic of Korea, 2023; pp. 24–25. (In Korean)
- Kim, I.J.; Han, D.H. A Small Stream Management Plan to Protect the Aquatic Ecosystem; Korea Environment Institute: Sejong, Republic of Korea, 2008; pp. 1–149. (In Korean)
- Cho, J.H.; Lee, J.H. Stormwater runoff characteristics and effective management of nonpoint source pollutants from a highland agricultural region in the Lake Soyang watershed. Water 2017, 9, 784. [Google Scholar] [CrossRef]
- Kwon, H.; Lee, J.; Lim, J.; Woo, S.; Kim, J.; Lim, K.; Kim, D.; Hong, E. Characteristics of spatial variability in water quality on stream of Lake Doam watershed. J. Korean Soc. Agric. Eng. 2020, 62, 43–50. (In Korean) [Google Scholar]
- Lee, Y.; Shin, S. Trend analysis of water pollutant at summer rainfall season. J. Environ. Prot. Sci. 2014, 5, 223–231. [Google Scholar] [CrossRef][Green Version]
- Kim, K.; Kim, B.; Eum, J.; Seo, B.; Kim, K.; Kim, B.; Eum, J.; Seo, B.; Shope, C.L.; Peiffer, S. Impacts of land use change and summer monsoon on nutrients and sediment exports from an agricultural catchment. Water 2018, 10, 544. [Google Scholar] [CrossRef]
- United States Department of Agriculture (USDA); Natural Resources Conservation Service (NRCS). National Engineering Handbook: Part 630—Hydrology National Engineering Handbook; US Government Printing Office: Washington, DC, USA, 2004; pp. 1–424.
- Lee, G.; Yu, W.; Jung, K.; APIP. Catchment-scale soil erosion and sediment yield simulation using a spatially distributed erosion model. Environ. Earth Sci. 2013, 70, 33–47. [Google Scholar] [CrossRef]
- Kim, G.; Chung, S.; Lee, C. Water quality of runoff from agricultural-forestry watersheds in the Geum River Basin, Korea. Environ. Monit. Assess. 2007, 134, 441–452. [Google Scholar] [CrossRef]
- Yoon, S.W.; Chung, S.W.; Oh, D.G.; Lee, J.W. Monitoring of non-point source pollutants load from a mixed forest land use. Res. J. Environ. Sci. 2010, 22, 801–805. [Google Scholar] [CrossRef]
- Memon, S.; Paule, M.C.; Lee, B.Y.; Umer, R.; Sukhbaatar, C.; Lee, C.H. Investigation of turbidity and suspended solids behavior in storm water run-off from different land-use sites in South Korea. Desalination Water Treat. 2015, 53, 3088–3095. [Google Scholar] [CrossRef]
- Choi, I.C.; Shin, H.J.; Nguyen, T.T.; Tenhunen, J. Water policy reforms in South Korea: A historical review and ongoing challenges for sustainable water governance and management. Water 2017, 9, 717. [Google Scholar] [CrossRef]
- Dietrich, W.E.; Dunne, T. Sediment budget for a small catchment in a mountainous terrain. Z. Geomorphol. N. F. Suppl. 1978, 29, 191–206. [Google Scholar]
- Walling, D.E.; Collins, A.L.; Sichingabula, H.M.; Leeks, G.J.L. Integrated assessment of catchment sediment budgets. Land Degrad. Dev. 2001, 12, 387–415. [Google Scholar] [CrossRef]
- Walling, D.E. Tracing suspended sediment sources in catchments and river systems. Sci. Total Environ. 2005, 344, 159–184. [Google Scholar] [CrossRef] [PubMed]
- Roberts, R.; Church, M. The sediment budget in severely disturbed watershed, Queen Charlotte Range, British Columbia. Can. J. For. Res. 1986, 16, 1092–1106. [Google Scholar] [CrossRef]
- Collins, A.L.; Walling, D.E.; Leeks, G.J.L. Fingerprinting the origin of fluvial suspended sediment in larger river basins: Combining assessment of spatial provenance and source type. Geogr. Ann. 1997, 79, 239–254. [Google Scholar] [CrossRef]
- Mizugaki, S.; Onda, Y.; Fukuyama, T.; Koga, S.; Asai, H.; Hiramatsu, S. Estimation of suspended sediment sources using 137Cs and 210Pbex in unmanaged Japanese cypress plantation watersheds in southern Japan. Hydrol. Process. 2008, 22, 4519–4531. [Google Scholar] [CrossRef]
- Wallbrink, P.J.; Murray, A.S.; Olley, M.; Olive, J. Determining sources and transit times of suspended sediment in the Murrumbidgee River, New South Wales, Australia, using fallout 137Cs and 210Pb. Water Resour. Res. 1998, 34, 879–887. [Google Scholar] [CrossRef]
- Walling, D.E.; Collins, A.L.; Stroud, R.W. Tracing suspended sediment and particulate phosphorus sources in catchments. J. Hydrol. 2008, 350, 274–289. [Google Scholar] [CrossRef]
- Huang, D.; Du, J.; Moore, J.W.S.; Zhang, J. Particle dynamics of the Changjiang Estuary and adjacent coastal region determined by natural particle-reactive radionuclides (7Be, 210Pb, and 234Th). J. Geophys. Res. Ocean. 2013, 118, 1736–1748. [Google Scholar] [CrossRef]
- Schuller, P.; Walling, D.E.; Iroumé, A.; Quilodrán, C.; Castillo, A.; Navas, A. Using 137Cs and 210Pbex and other sediment source fingerprints to document suspended sediment sources in small forested catchments in south-central Chile. J. Environ. Radioact. 2013, 124, 147–159. [Google Scholar] [CrossRef]
- Kim, J.K.; Onda, Y.; Yang, D.Y.; Kim, M.S. Temporal variations in reservoir sediment sources in a small mountainous catchment in Korea. Earth Surf. Process. Landf. 2013, 38, 1380–1392. [Google Scholar] [CrossRef]
- Blake, W.H.; Walling, D.E.; He, Q. Fallout beryllium-7 as a tracer in soil erosion investigations. Appl. Radiat. Isot. 1999, 51, 599–605. [Google Scholar] [CrossRef] [PubMed]
- Collins, A.; Walling, D. Selecting fingerprint properties for discriminating potential suspended sediment sources in river basins. J. Hydrol. 2002, 261, 218–244. [Google Scholar] [CrossRef]
- Davis, C.M.; Fox, J.F. Sediment fingerprinting: Review of the method and future improvements for allocating nonpoint source pollution. JECE 2009, 135, 490–504. [Google Scholar] [CrossRef]
- Brown, R.B. Agricultural Erosion and Sediment in the Western Willamette Valley as Indicated by the Redistribution of Cesium-137. Ph.D. Thesis, Oregon State University, Corvallis, OR, USA, 21 May 1980. [Google Scholar]
- Yoon, J.H.; Kim, Y.N.; Kim, K.H.; Kirkham, M.B.; Kim, H.S.; Yang, J.E. Use of 137Cs and 210Pbex fallout radionuclides for spatial soil erosion and redistribution assessment on steeply sloping agricultural highlands. J. Mt. Sci. 2021, 18, 2888–2899. [Google Scholar] [CrossRef]
- Nosrati, K.; Haddadchi, A.; Collins, A.L.; Jalali, S.; Zare, M.R. Tracing sediment sources in a mountainous forest catchment under road construction in northern Iran: Comparison of bayesian and frequentist approaches. Environ. Sci. Pollut. Res. 2018, 25, 30979–30997. [Google Scholar] [CrossRef] [PubMed]
- Meliho, M.; Nouira, A.; Benmansour, M.; Boulmane, M.; Khattabi, A.; Mhammdi, N.; Benkdad, A. Assessment of soil erosion rates in a Mediterranean cultivated and uncultivated soils using fallout 137Cs. J. Environ. Radioact. 2019, 208, 106021. [Google Scholar] [CrossRef]
- Gaspar, L.; Lizaga, I.; Navas, A. Spatial distribution of fallout and lithogenic radionuclides controlled by soil carbon and water erosion in an agroforestry South-Pyrenean catchment. Geoderma 2021, 391, 114941. [Google Scholar] [CrossRef]
- Khodadadi, M.; Mabit, L.; Zaman, M.; Porto, P.; Gorji, M. Using 137Cs and 210Pbex measurements to explore the effectiveness of soil conservation measures in semi-arid lands: A case study in the Kouhin region of Iran. J. Soils Sediments 2018, 19, 2103–2113. [Google Scholar] [CrossRef]
- Lim, Y.S.; Kim, J.K.; Kim, J.W.; Hong, S.S. Evaluation of suspended-sediment sources in the Yeongsan River using Cs-137 after major human impacts. Quat. Int. 2014, 344, 64–74. [Google Scholar] [CrossRef]
- Lim, Y.S.; Kim, J.W.; Kim, J.K. Suspended sediment source tracing at the Juksan Weir in the Yeongsan River using composite fingerprints. Quat. Int. 2019, 519, 245–254. [Google Scholar] [CrossRef]
- Park, C.W.; Son, Y.K.; Zhang, Y.S.; Hong, S.Y.; Hyun, B.K.; Song, K.C.; Ha, S.K.; Moon, Y.H. Soil erosion risk assessment in the upper Han River basis using spatial soil erosion map. Korean J. Soil. Sci. Fertil. 2010, 43, 828–836. (In Korean) [Google Scholar]
- Choi, I.; Kim, Y.S.; Lee, G.C.; Choi, J. NOM characteristics and turbidity in-flow in Lake Soyang. J. Korean Soc. Atmos. 2011, 11, 177–185. (In Korean) [Google Scholar]
- Reza, A.; Eum, J.; Jung, S.; Choi, Y.; Owen, J.S.; Kim, B. Export of non-point source suspended sediment, nitrogen, and phosphorus from sloping highland agricultural fields in the East Asian monsoon region. Environ. Monit. Assess. 2016, 188, 692. [Google Scholar] [CrossRef] [PubMed]
- Yonhap News. Available online: https://www.yna.co.kr/view/AKR20110822113200062 (accessed on 22 August 2011).
- msTODAY. Available online: https://www.mstoday.co.kr/news/articleView.html?idxno=49030 (accessed on 3 August 2020).
- Nate News. Available online: https://news.nate.com/view/20180829n33657 (accessed on 29 August 2018).
- International Union of Radioecologists. Handbook of Parameter Values for the Prediction of Radionuclide Transfer in Temperate Environments; International Atomic Energy Agency (IAEA): Vienna, Austria, 1994; pp. 1–74. [Google Scholar]
- Korea Atomic Energy Research Institute (KAERI). Soil-to-Rice Transfer Factors of Long-Lived Radionuclides for Paddy Fields around the Radioactive Waste Disposal Facilities; Korea Atomic Energy Research Institute (KAERI): Daejeon, Republic of Korea, 2009; pp. 1–20. (In Korean) [Google Scholar]
- Anh, P.T.Q.; Gomi, T.; MacDonald, L.H.; Mizugaki, S.; Khoa, P.V.; Furuichi, T. Linkages among land use, macronutrient levels, and soil erosion in northern Vietnam: A plot-scale study. Geoderma 2014, 232–234, 352–362. [Google Scholar] [CrossRef]
- Joshi, S.R. Nondestructive determination of lead-210 and radium-226 in sediments by direct photon analysis. J. Radioanal. Nucl. Chem. 1987, 116, 169–182. [Google Scholar] [CrossRef]
- Murray, A.S.; Marten, R.; Johnston, A.; Martin, P. Analysis for naturally occurring radionuclides at environmental concentrations by gamma spectrometry. J. Radioanal. Nucl. Chem. 1987, 115, 263–288. [Google Scholar] [CrossRef]
- He, Q.; Walling, D.E. Interpreting particle size effects in the adsorption of 137Cs and unsupported 210Pb by mineral soils and sediments. J. Environ. Radioact. 1996, 30, 117–137. [Google Scholar] [CrossRef]
- Wallbrink, P.J.; Roddy, B.P.; Olley, J.M. Quantifying the Redistribution of Soils and Sediments Within A Post-Harvested Forest Coupe Near Bombala, New South Wales, Australia (CSIRO Land and Water Technical Report Series 7/97); CSIRO Land and Water: NSW, Australia, 1997; pp. 1–40. [Google Scholar]
- Nelson, D.W.; Sommers, L.E. Total Carbon, Organic Carbon, and Organic Matter. In Methods of Soil Analysis: Part 2 Chemical and Microbiological Properties, 2nd ed.; Page, A.L., Ed.; American Society for Agronomy: Madison, WI, USA, 1982; pp. 539–579. [Google Scholar]
- Kato, H.; Onda, Y.; Tanaka, Y. Using 137Cs and 210Pbex measurements to estimate soil redistribution rates on semi-arid grassland in Mongolia. Geomorphology 2010, 114, 508–519. [Google Scholar] [CrossRef]
- Ritchie, J.C.; Clebsch, E.E.C.; Rudolph, W.K. Distribution of fallout and natural gamma radionuclides in litter, humus and surface mineral soil layers under natural vegetation in the Great Smoky Mountains, North Carolina-Tennessee. Health Phys. 1970, 18, 479–489. [Google Scholar] [CrossRef]
- García-Oliva, F.; Lugo, R.M.; Maass, J.M. Soil 137Cs activity in a tropical deciduous ecosystem under pasture conversion in Mexico. J. Environ. Radioact. 1995, 26, 37–49. [Google Scholar] [CrossRef]
- Takenaka, C.; Onda, Y.; Hamajima, Y. Distribution of cesium-137 in Japanese forest soils: Correlation with the contents of organic carbon. Sci. Total Environ. 1998, 222, 193–199. [Google Scholar] [CrossRef] [PubMed]
- Chiu, C.Y.; Lai, S.Y.; Lin, Y.M.; Chiang, H.C. Distribution of the radionuclide 137Cs in the soils of a wet mountainous forest in Taiwan. Appl. Radiat. Isot. 1999, 50, 1097–1103. [Google Scholar] [CrossRef]
- Kjøbli, L. Mobility of Metals in Surface Soils from Clear-Cut Sites of Different Age. Master’s Thesis, Norwegian University of Science and Technology, Trondheim, Norway, 1997. (In Norwegian). [Google Scholar]
- Berthelsen, B.O.; Steinnes, E.; Næumann, R. Distribution of 137Cs in surface soils as affected by forest clear-cutting. J. Environ. Radioact. 1999, 42, 39–49. [Google Scholar] [CrossRef]
- Kato, H.; Onda, Y.; Hisadome, K.; Loffredo, N.; Kawamor, A. Temporal changes in radiocesium deposition in various forest stands following the Fukushima Dai-ichi Nuclear Power Plant accident. J. Environ. Radioact. 2017, 166, 449–457. [Google Scholar] [CrossRef] [PubMed]
- Saidin, Z.H.; Levia, D.F.; Kato, H.; Kurihara, M.; Hudson, J.E.; Nanko, K.; Onda, Y. Vertical distribution and transport of radiocsium via branchflow and stemflow through the canopy of cedar and oak stands in the aftermath of the Fukushima Dai-ichi Nuclear Power Plant accident. Sci. Total Environ. 2022, 818, 151698. [Google Scholar] [CrossRef]
- Wallbrink, P.J.; Murray, A.S. Use of fallout radionuclides as indicators of erosion processes. Hydrol. Process. 1993, 7, 297–304. [Google Scholar] [CrossRef]
- Nosrati, K.; Haddadchi, A.; Zare, M.R.; Shirzadi, L. An evaluation of the role of hillslope components and land use in soil erosion using 137Cs inventory and soil organic carbon stock. Geoderma 2015, 243–244, 29–40. [Google Scholar] [CrossRef]
Disclaimer/Publisher’s Note: The statements, opinions and data contained in all publications are solely those of the individual author(s) and contributor(s) and not of MDPI and/or the editor(s). MDPI and/or the editor(s) disclaim responsibility for any injury to people or property resulting from any ideas, methods, instructions or products referred to in the content. |
© 2024 by the authors. Licensee MDPI, Basel, Switzerland. This article is an open access article distributed under the terms and conditions of the Creative Commons Attribution (CC BY) license (https://creativecommons.org/licenses/by/4.0/).