Article

Hydrochemical and Isotopic Characteristics and the Spatiotemporal Differences of Surface Water and Groundwater in the Qaidam Basin, China

1
School of Civil Engineering and Water Resources, Qinghai University, Xining 810016, China
2
State Key Laboratory of Plateau Ecology and Agriculture, Qinghai University, Xining 810016, China
3
Laboratory of Ecological Protection and High Quality Development in the Upper Yellow River, Xining 810016, China
4
Key Laboratory of Water Ecology Remediation and Protection at Headwater Regions of Big Rivers, Ministry of Water Resources, Xining 810016, China
5
State Key Laboratory of Hydroscience and Engineering, Tsinghua University, Beijing 100084, China
*
Author to whom correspondence should be addressed.
Water 2024, 16(1), 169; https://doi.org/10.3390/w16010169
Submission received: 3 November 2023 / Revised: 24 December 2023 / Accepted: 29 December 2023 / Published: 31 December 2023

Abstract

:
In the context of climate change, precipitation and runoff in the arid inland basins of northwest China have undergone significant changes. The Qaidam Basin (QB) is a typical highland arid inland area. Understanding the spatial and temporal variations in surface water and groundwater chemistry and isotopes, as well as their causes, is crucial for future water resource management and ecological protection. Samples of river, lake, and groundwater, as well as others, were collected and tested in five typical watersheds in the summer and winter. The hydrochemistry and isotopic spatiotemporal differences in various water bodies were studied using the significant difference method, water vapor flux models, hydrochemistry, isotopes, and other methods for cause analyses. The results indicate the following: (1) There are differences in hydrochemistry between the southern and northern basins because the southern basin is more influenced by the dissolution of salt rocks and evaporation, whereas the northern basin is mainly affected by carbonate weathering. (2) The enrichment of δD and δ18O in the northern basin gradually increases from west to east, while in the southern basin, it is the opposite. This is because the southern basin receives a larger contribution of water vapor from the mid-latitude westerlies, while the northern basin primarily relies on local evaporation as its water vapor source. (3) Significant differences are observed in the total dissolved solids (TDS) and hydrochemical types of river water and groundwater between the summer and winter due to higher rates of rock weathering and evaporation in the summer. (4) The more pronounced seasonal differences in hydrogen and oxygen stable isotopes in the southern basin are due to higher rates of internal water vapor circulation in the summer. (5) The similarity in characteristics between river water and groundwater is the result of strong exchanges between river water and groundwater from piedmonts to terminals. The spatiotemporal heterogeneity of terminal lakes is attributed to the accumulation of salts and groundwater replenishment from other sources.

1. Introduction

The inland arid basins in northwest China face a scarcity of freshwater resources with respect to uneven spatial and temporal distributions, severe desertification, and fragile ecological environments. Since the 21st century, climate warming has led to increased precipitation in the northwestern arid regions, resulting in varying changes in terrestrial water storage [1]. This has amplified hydrological fluctuations and uncertainties in water resources [2,3].
The Qaidam Basin (QB) is a typical inland plateau basin, and due to its arid climate, the river–lake system is highly susceptible to seasonal changes and precipitation. Climate warming has brought about changes in regional hydrological cycles, resulting in increased precipitation, river discharge and lake areas [4], and expanded land water storage [1,5], while also causing the freshening of resource-based lakes [6]. The spatiotemporal variations in hydrochemistry and isotopes are primarily constrained by factors such as geological structure, lithogenic origins, topography, hydrology, and meteorology, yet the mechanisms underlying their influences remain unclear. Understanding the differences in the hydrochemistry and isotopes of surface water and groundwater is of significant importance for the future management of water resources and the development of salt lakes in the basin.
Due to its unique ecological functions and the value of its salt lake resources, QB has received considerable attention from scholars. They have extensively researched the spatial and temporal distribution of basin runoff changes, river–lake variations, driving mechanisms, and the hydrochemical characteristics of river–lake systems from various perspectives [7,8,9]. In summary, QB has multiple small rivers with short courses and considerable fluctuations in runoff within a year. Except for the rivers that are primarily replenished by groundwater, most rivers exhibit seasonal variations. Originating from the surrounding mountainous areas, these rivers either undergo frequent transformations with groundwater, disappear in the desert, or overflow onto the surface before finally draining into a terminal lake [10]. Therefore, the central part of the basin is predominantly an area without runoffs.
The relationship between surface water and groundwater transformation is mainly controlled by factors such as geological structures and spatial changes with respect to lithology. For instance, the Bayin River infiltrates the aquifer in the alluvial fan plain and undergoes repeated exchanges with groundwater in the alluvial–lacustrine plain [11]. The shallow groundwater of Nomhon River in the mountainous region is obstructed by uplifting structures, causing a shift in flow towards the northwest, while high-pressure artesian water is formed at the axis of the uplifting structure [12]. The groundwater supply from Nalengele River in the front uplift zone differs during wet and dry seasons, resulting in variations in the salinity of the terminal lake [13].
Over the past 20 years, the total area of lakes in the QB has expanded by 82.63%. The most significant changes in lake area occur in the central part of the basin, where some large shallow lakes are disappearing, while the water storage capacity of small and deep lakes is increasing [14]. The driving mechanisms behind these changes in the lake area vary. For instance, the expansion of Sugan Lake is attributed to glacial and snow melt, while fluctuations in the water levels of Xiao Qaidam Lake and Tuosu Lake are caused by increased precipitation [6].
The chemical characteristics of salt lake water in the QB are closely related to their material sources, which primarily include four types: (1) It is believed that the salt content in lakes is a result of long-term weathering, leaching, transportation, dissolution, and precipitation processes caused by continuous contributions from surrounding weathering and leaching, as well as from groundwater and surface water [15]. For example, the source of potassium is attributed to the widespread distribution of potassium-containing rocks around the basin [16]. The brine and salt deposits in the northern and northeastern parts of the Qarhan Salt Lake are influenced by the supply of chloride-type brine springs [17]. (2) In addition to surface chemical weathering materials supplied by river input, there are other sources, such as the Qarhan Salt Lake in the central part of the basin, primarily receiving contributions from oilfield water in the Tertiary strata [18,19] and remnants from the ancient Qaidam Lake [16,20]. (3) The formation of lithium, boron, and potassium deposits mainly results from volcanic–geothermal water [21], as observed in lakes like Qarhan Salt Lake in the central basin, Da Qaidam Lake and Xiao Qaidam Lake in the east, and West Taijnar Lakes and Mahai Lake. (4) In the lakes formed by a series of mountain basins distributed to the north, east, and south of the basin, lake water supplies from the surrounding ancient lake areas or capture are the primary sources of salts [22].
The aforementioned research has mainly explored the changes in basin water resources and the hydrochemical characteristics of salt lakes from the perspectives of water resource transformation, structural control factors, and material sources. Howerer, there is no systematic integration of the inland river–lake system. Given the vast topography of QB, there are spatial and seasonal differences in surface water and groundwater. Various internal and external factors, such as hydrogeology, geology, water–rock interactions, weathering and mineral dissolution, localized precipitation, evaporation rates, and water vapor sources [23], have significantly influenced hydrochemistry and isotopes. Further research is needed to identify these differences and their attributions. This article selected five typical watersheds in the basin; collected and tested precipitation, river water, groundwater, lake water, and brine water samples; and analyzed the spatial and seasonal hydrochemical and H−O isotopic characteristic differences of rivers and lakes. The main reasons for these differences are explored from the perspectives of aquifer lithology, water vapor sources, the mechanisms of hydrochemical influence, the transformation relationship between river water and groundwater, and the sources of salinity in terminal lakes.

2. Materials and Methods

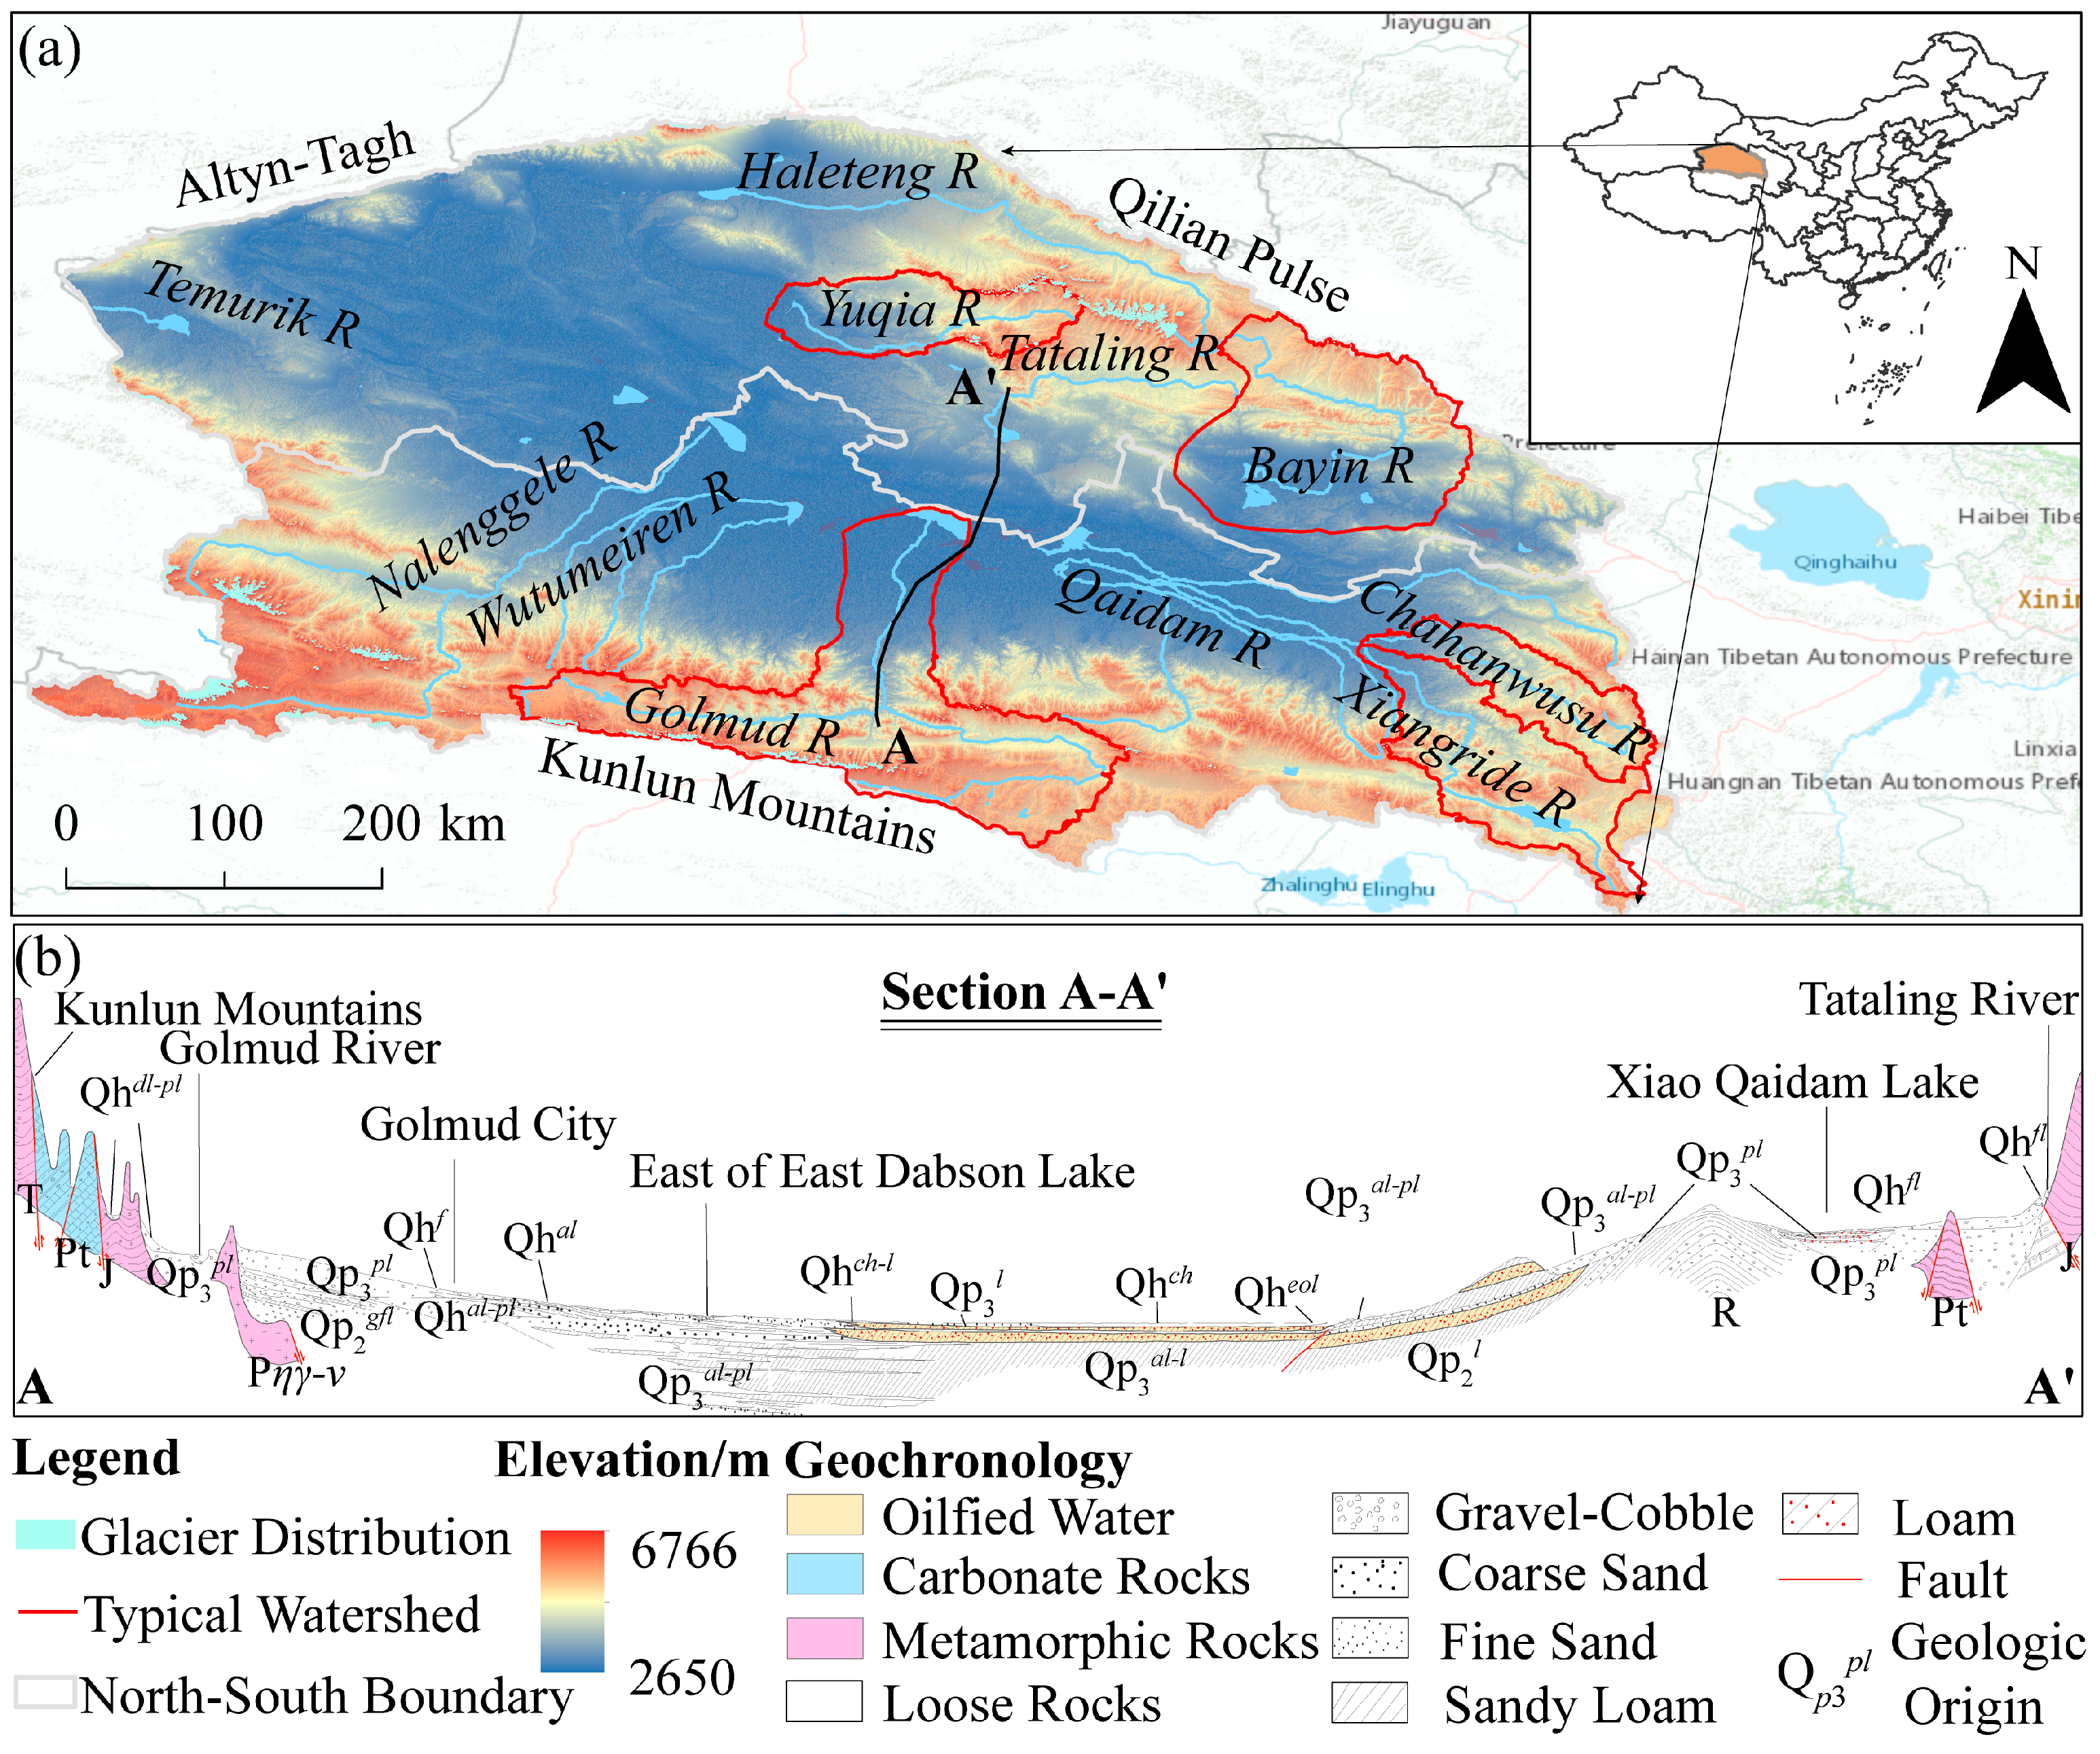
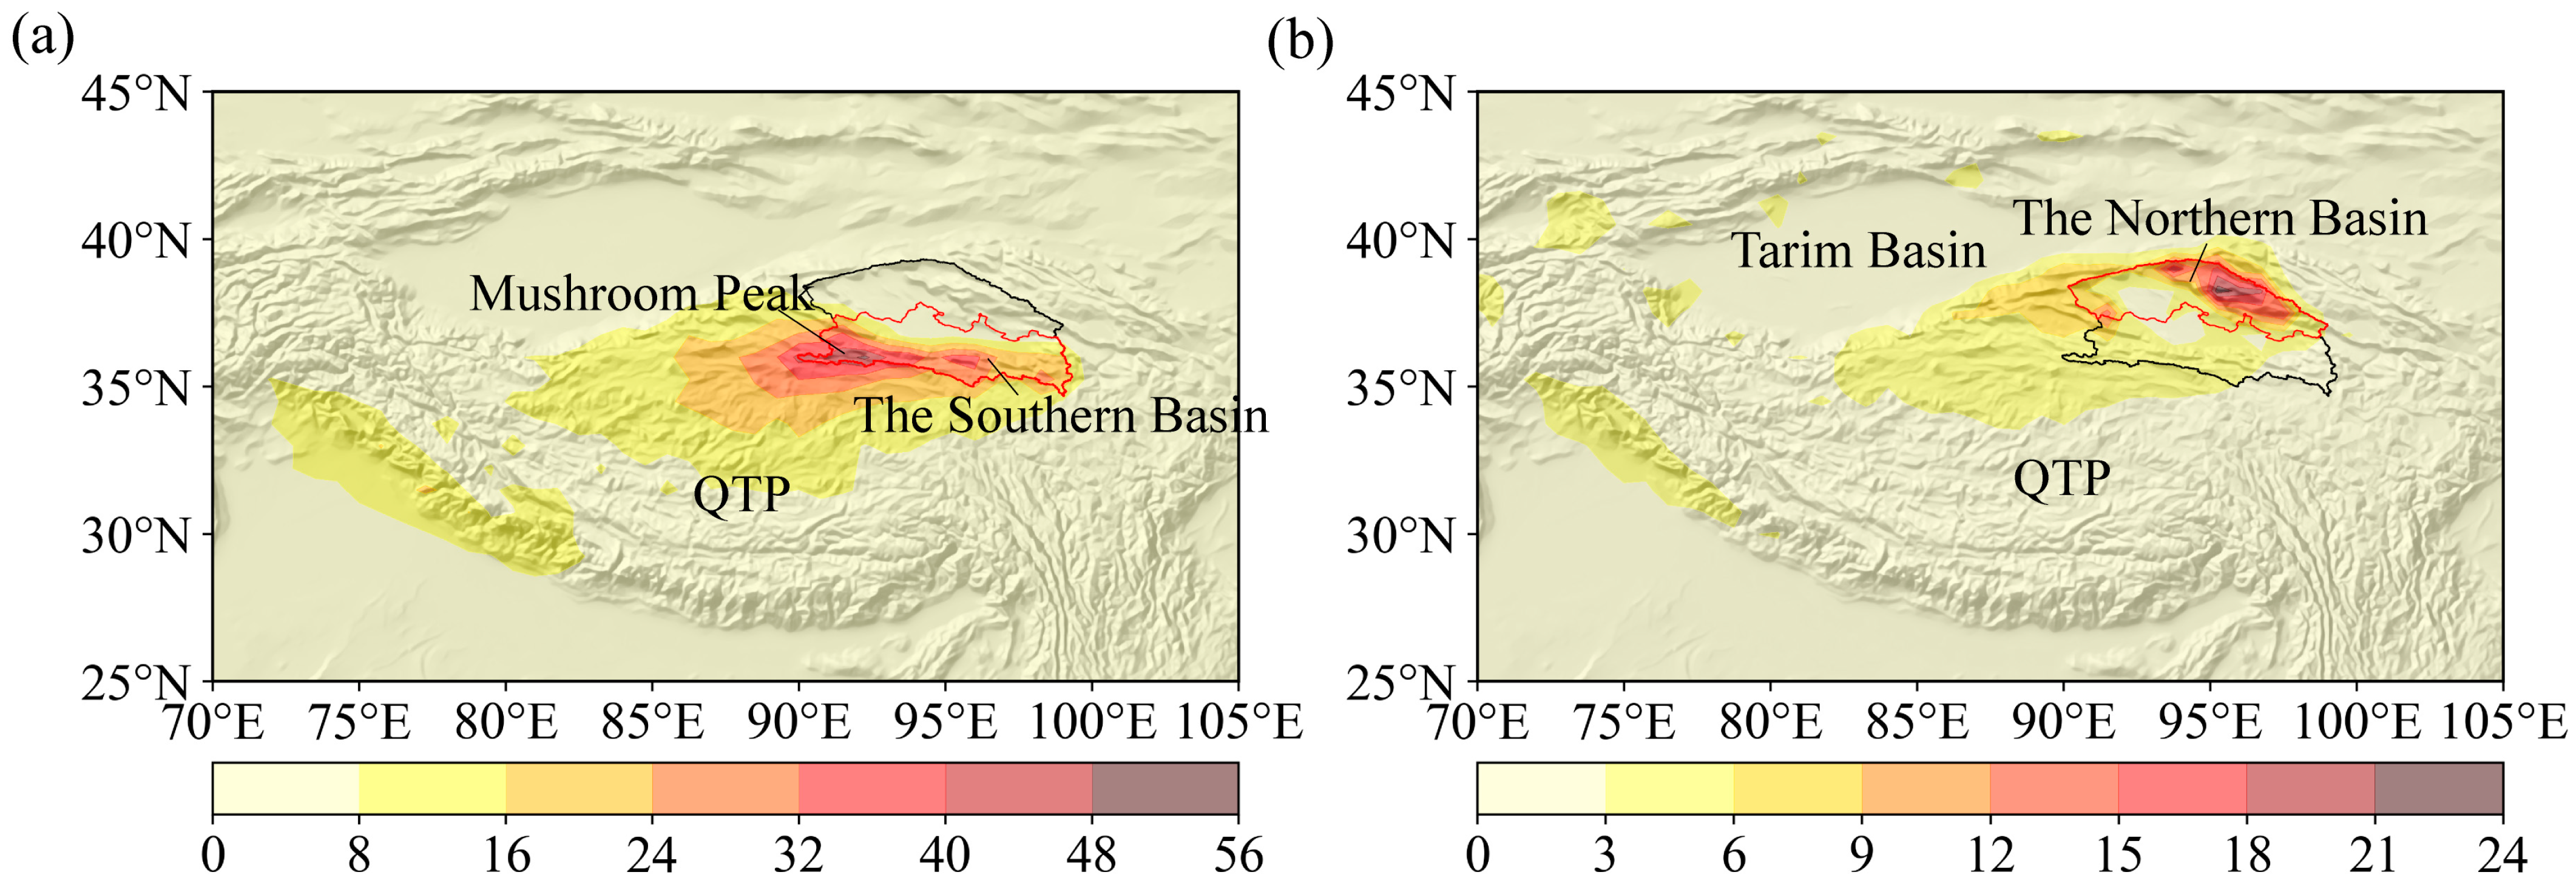
2.1. Regional Overview

The QB is situated in the northeastern part of the Qinghai–Tibet Plateau (QTP), with geographic coordinates approximately ranging from 90°00′ to 99°20′ E and 34°40′ to 39°20′ N. It has low temperatures, significant temperature variations, sparse precipitation, high evaporation rates, and a dry and cold climate. The climate is characterized by dryness and coldness, with significant differences in meteorological elements between the summer and winter seasons. According to the data from the Golmud Meteorological Station, the average temperature from June to August is 15.4 °C, accompanied by a monthly precipitation of 103.5 mm and an evaporation of 3242.1 mm. From December to February of the following year, the average temperature dropped to −8.2 °C, while experiencing monthly precipitation of merely 6.74 mm alongside evaporation of 530.1 mm.
The evolution of the basin is closely related to the formation and development of the QTP. This is a Cenozoic rift basin, and its overall structure is characterized by the compression and collision of the East Kunlun Mountains and Qilian Mountains, with the Altun Mountains thrusting southeastward. The uplifted peripheral mountains and subsiding basins have formed a distinct structural pattern. The surrounding mountain areas are dominated by Paleogene strata, while the basin and its margins are mainly composed of Paleogene to Neogene strata, with Quaternary deposits primarily distributed in the central basin and wide intermontane valleys. From the southern and northern mountain areas to the center of the basin, the topography transitions from high to low. The southern and northern landforms exhibit symmetrical patterns, and the aquifers display zonation. The area in front of the mountains has a single unconfined aquifer, gradually transitioning to multi-layer confined aquifers as it approaches the terminal lakes. The grain size of sediments changes from coarse gravel to fine sand, and there are significant geological differences between the south and north of the QB.
The basin has a total of 79 rivers, most of which are seasonal rivers with abundant water during the warm season that dry up during the cold season. The hydrological pattern is characterized by rivers flowing from the surrounding mountains towards the center of the basin, where central lakes with varying salinity levels are developed. Based on geological conditions and watershed factors, the research area can be divided into southern and northern basin watersheds. The southern basin mainly includes the Nalengle River, Wutumeiren, Golmud River, and Qaidam River (including the Nomhon River, Chahanwusu River, Xiangride River, etc.), while the northern basin primarily includes Temurik River, Yukha River, Haleteng River, Tataling River, Bayin River, and other watersheds (see Figure 1).

2.2. Research Methods

Based on the comprehensive watershed scale (area, river length, annual runoff, etc.), supply characteristics, and downstream water use types, and using the hierarchical clustering method [24], 44 rivers with a watershed area greater than 200 km2 were classified into five categories. The typical rivers from different orientations in the basin have been selected for comparative studies [25].
The analysis of physicochemical parameters and the hydrogen and oxygen isotope (H−O isotope) characteristics of different water bodies in different basins and seasons was conducted using significant difference testing methods, such as analysis of variance (ANOVA) [26] and non-parametric testing methods [27]. The Piper ternary diagram [28] is used to compare hydrochemical types. The differences in internal and external factors within the basin were analyzed spatially, examining the geological lithology and genesis relative to an understanding of the reasons for differences in water chemistry among the watersheds. Based on the ERA-5 reanalysis dataset and utilizing the Water Accounting Model (WAM)-2Layer water vapor flux statistical model [29], the analysis of deuterium excess (d-excess) [30] was combined to examine the water vapor sources for precipitation in the southern and northern basin watersheds, revealing spatial differences. The Gibbs model [31] was used to analyze the influence mechanisms of water chemistry in summer and winter seasons. The water vapor flux statistical model results are employed to analyze the internal recycling rate of precipitation to identify the reasons for seasonal differences. Finally, hydrochemistry and isotopic methods were employed to investigate the surface water–groundwater interaction and interpret the sources of salinity in the terminal lake; the objective was to analyze the reasons for the differentiation among river water, groundwater, and lake water along the course.
The Water Accounting Model (WAM) uses an area mark in a given atmospheric Euler field to track or backtrack moisture movement, and then calculate the water vapor sources of precipitation (WSoP) or reprecipitation of evapotranspiration (RPoET). It can also determine the regional recycling ratio, which is the proportion of locally evaporated water vapor that condenses to form precipitation to the total precipitation [32,33]. The WAM-2Layer model is an improved version designed to reduce errors caused by vertical wind shear. Unlike the Lagrangian method [34], the WAM tracking method can pinpoint the specific source of water vapor evaporation. In arid regions with low precipitation frequency, a few major precipitation events may contribute significantly to the total precipitation. There may be substantial differences in water vapor transport pathways during precipitation and non-precipitation periods, resulting in different water vapor sources [35]. Therefore, we utilize the WAM-2Layer model to calculate the differences in water vapor sources between the southern and northern parts of the QB, and also consider the water vapor recycling ratio to compare seasonal variations.

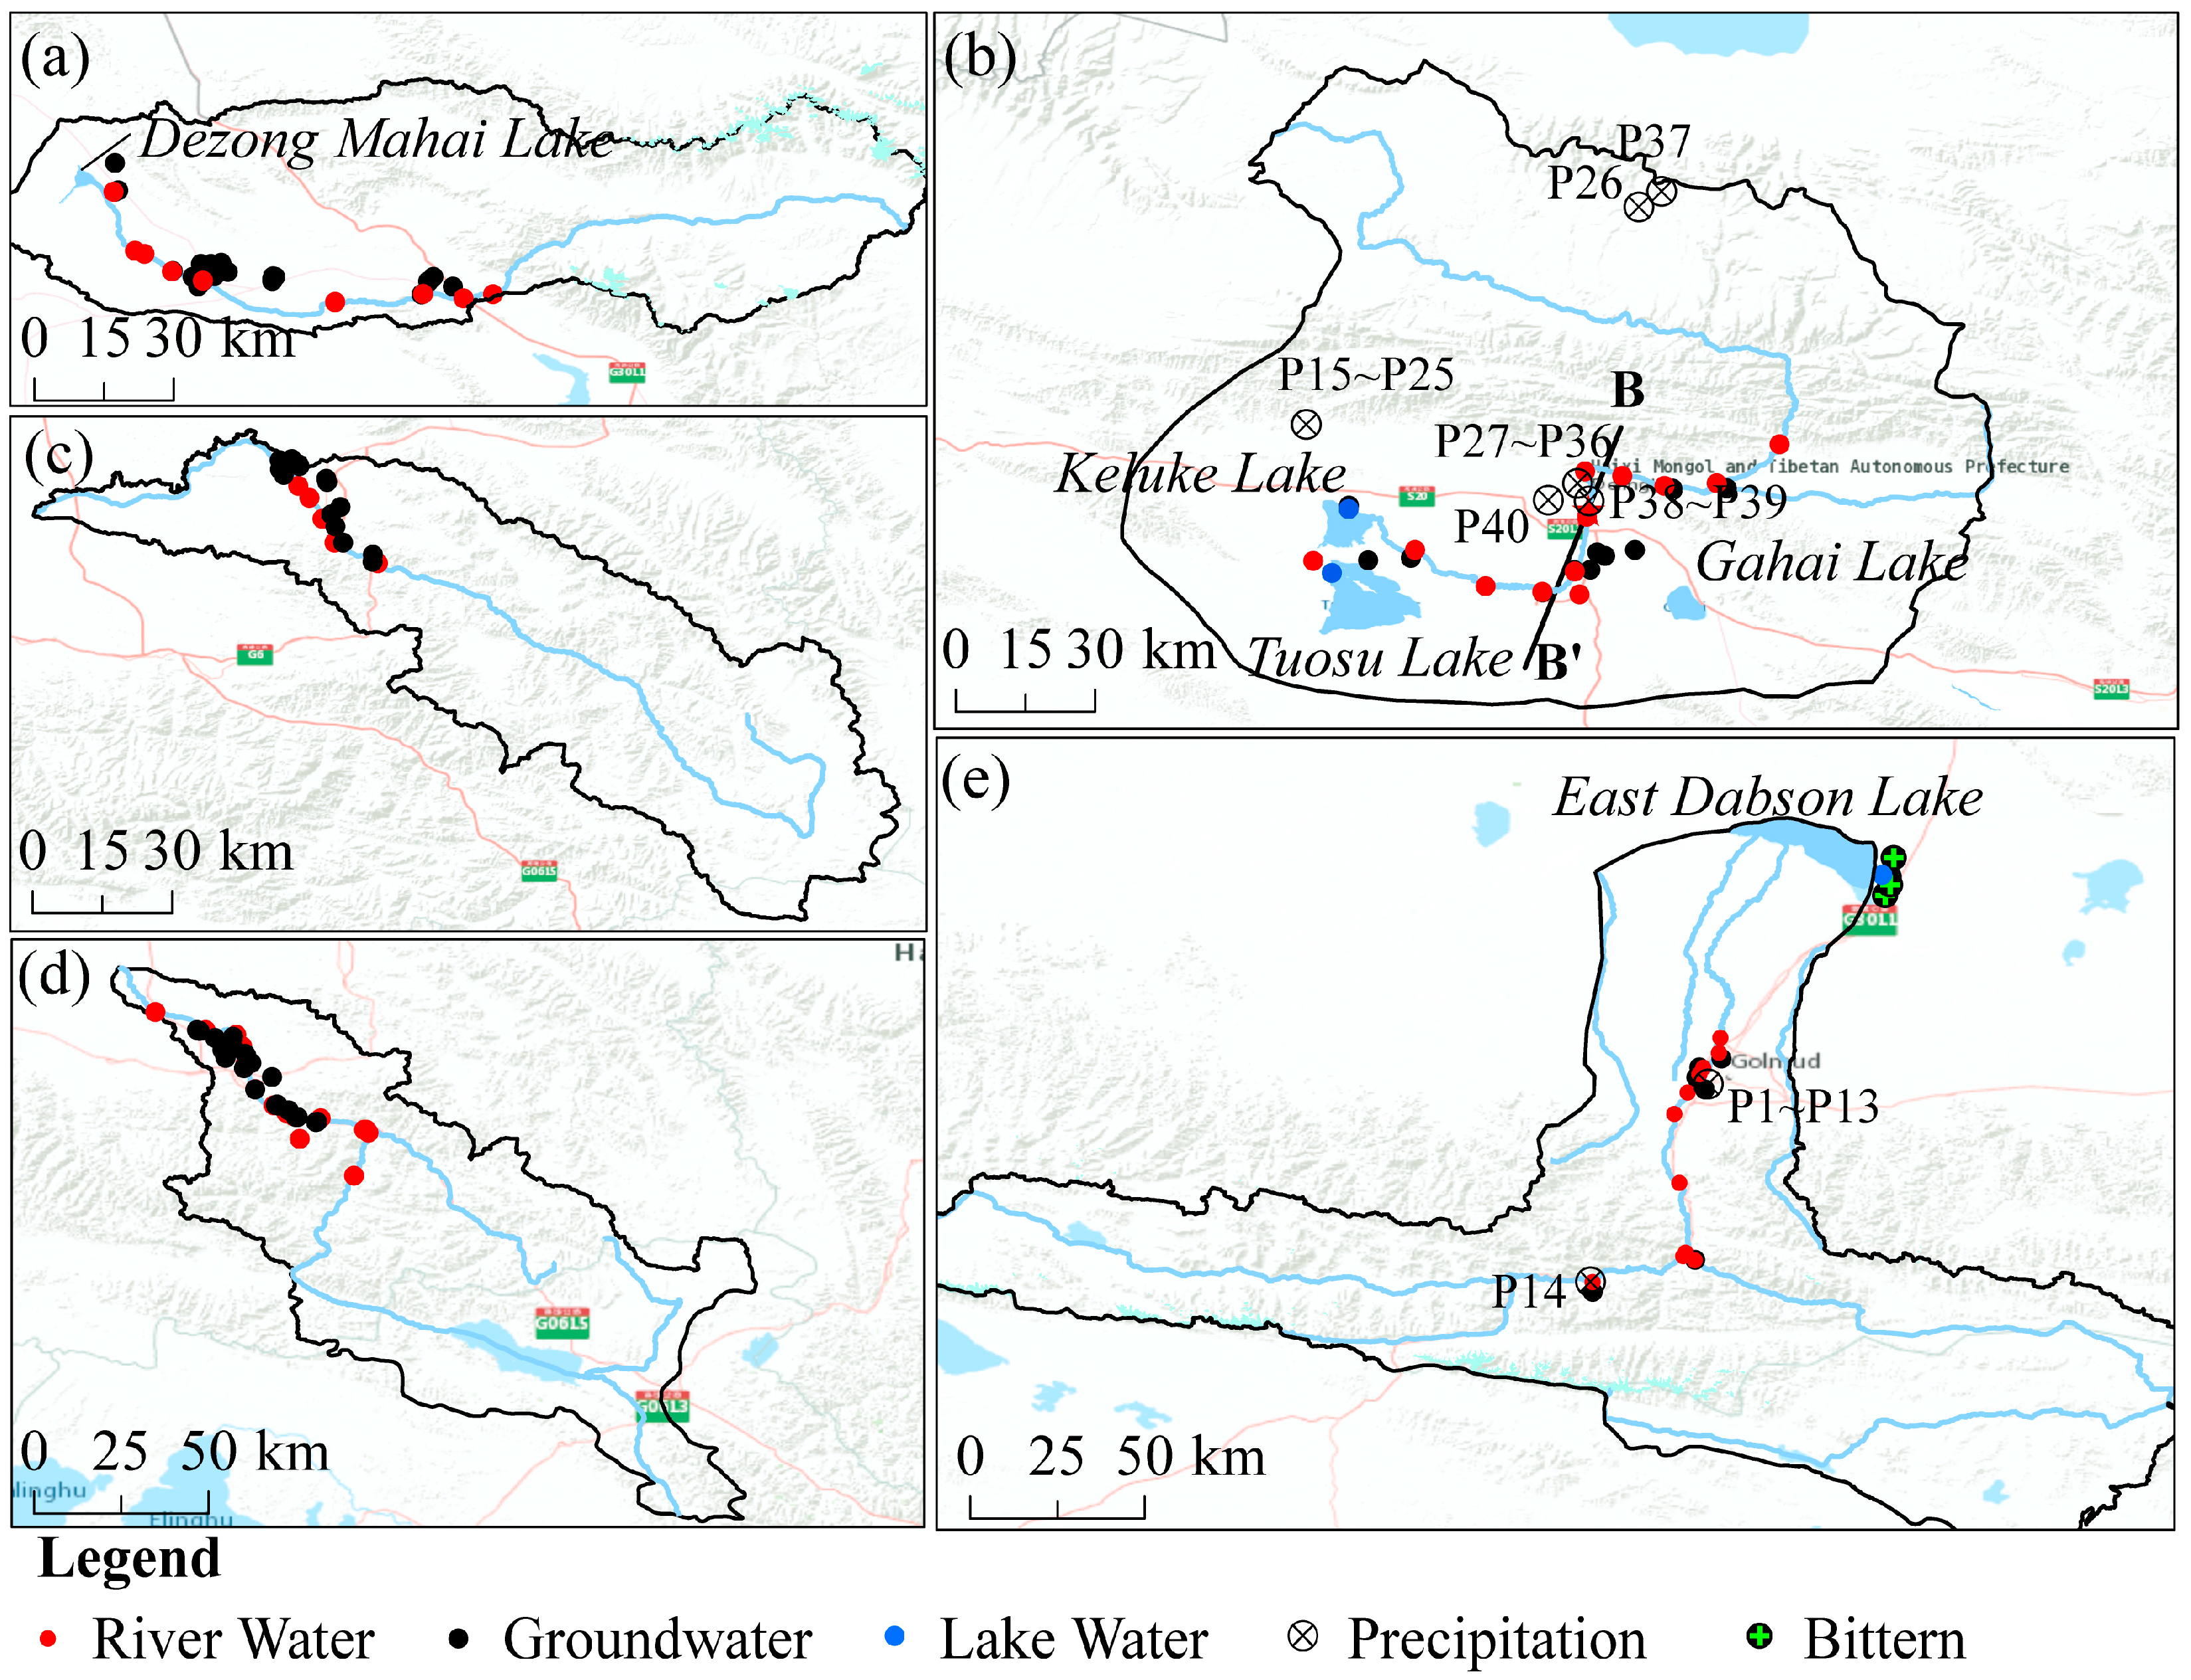
2.3. Sampling and Testing

Sample collection was conducted during the summer (July–August 2019) and winter (December 2019–January 2020) seasons. In summer, 63 river water samples, 3 lake water samples, 119 groundwater samples, 2 precipitation samples, and 4 brine samples were collected at the locations indicated in Figure 2. In winter, samples were collected from the Bayin River and Golmud River basins, totaling 48 samples (including 25 surface water, 18 groundwater, 3 lake water, 1 brine, and 1 precipitation sample).
Prior to sampling, a multi-parameter water quality monitor (EXO SY1 USA) was used for the on-site measurement of water temperature (WT), salinity (SAL), total dissolved solids (TDS), and hydrogen ion concentration index (pH). SAL was calculated based on conductivity and temperature measurements, with a measurement range of 0 to 70 ppt and a resolution of 0.01 ppt. Anions (Cl (≤100 mg·L−1), NO3, SO42−, Br and F) were determined using an ion chromatograph (ICS5000+, Thermo Fisher Scientific, Waltham, MA, USA), while cations (Mg2+, Ca2+, Na+, K+, Al3+, and Fe2+) were measured using an inductively coupled plasma mass spectrometer (ICAP6300, Thermo Fisher Scientific, Waltham, MA, USA). CO32−, HCO3, and Cl (>100 mg·L−1) were determined using acid titration methods. H−O isotopes (δD and δ18O) were analyzed using a liquid water isotope analyzer (GLA431-TIWA, ABB, Quebec, QC, Canada). For brine, lake water, and river water with high salinity, as well as groundwater, an LI-2100 (LICA United Technology Limited, Beijing, China) fully automated vacuum extraction system was used for pre-extraction before conducting the tests.
To investigate the sources of atmospheric moisture, we downloaded the ERA-5 reanalysis dataset from the European Centre for Medium-Range Weather Forecasts (https://www.ecmwf.int/en/forecasts/datasets/reanalysis-datasets/era5, accessed on 1 August 2022). Precipitation H−O isotope data were collected with supplementation from the literature, as shown in Appendix A (Table A1).

3. Results

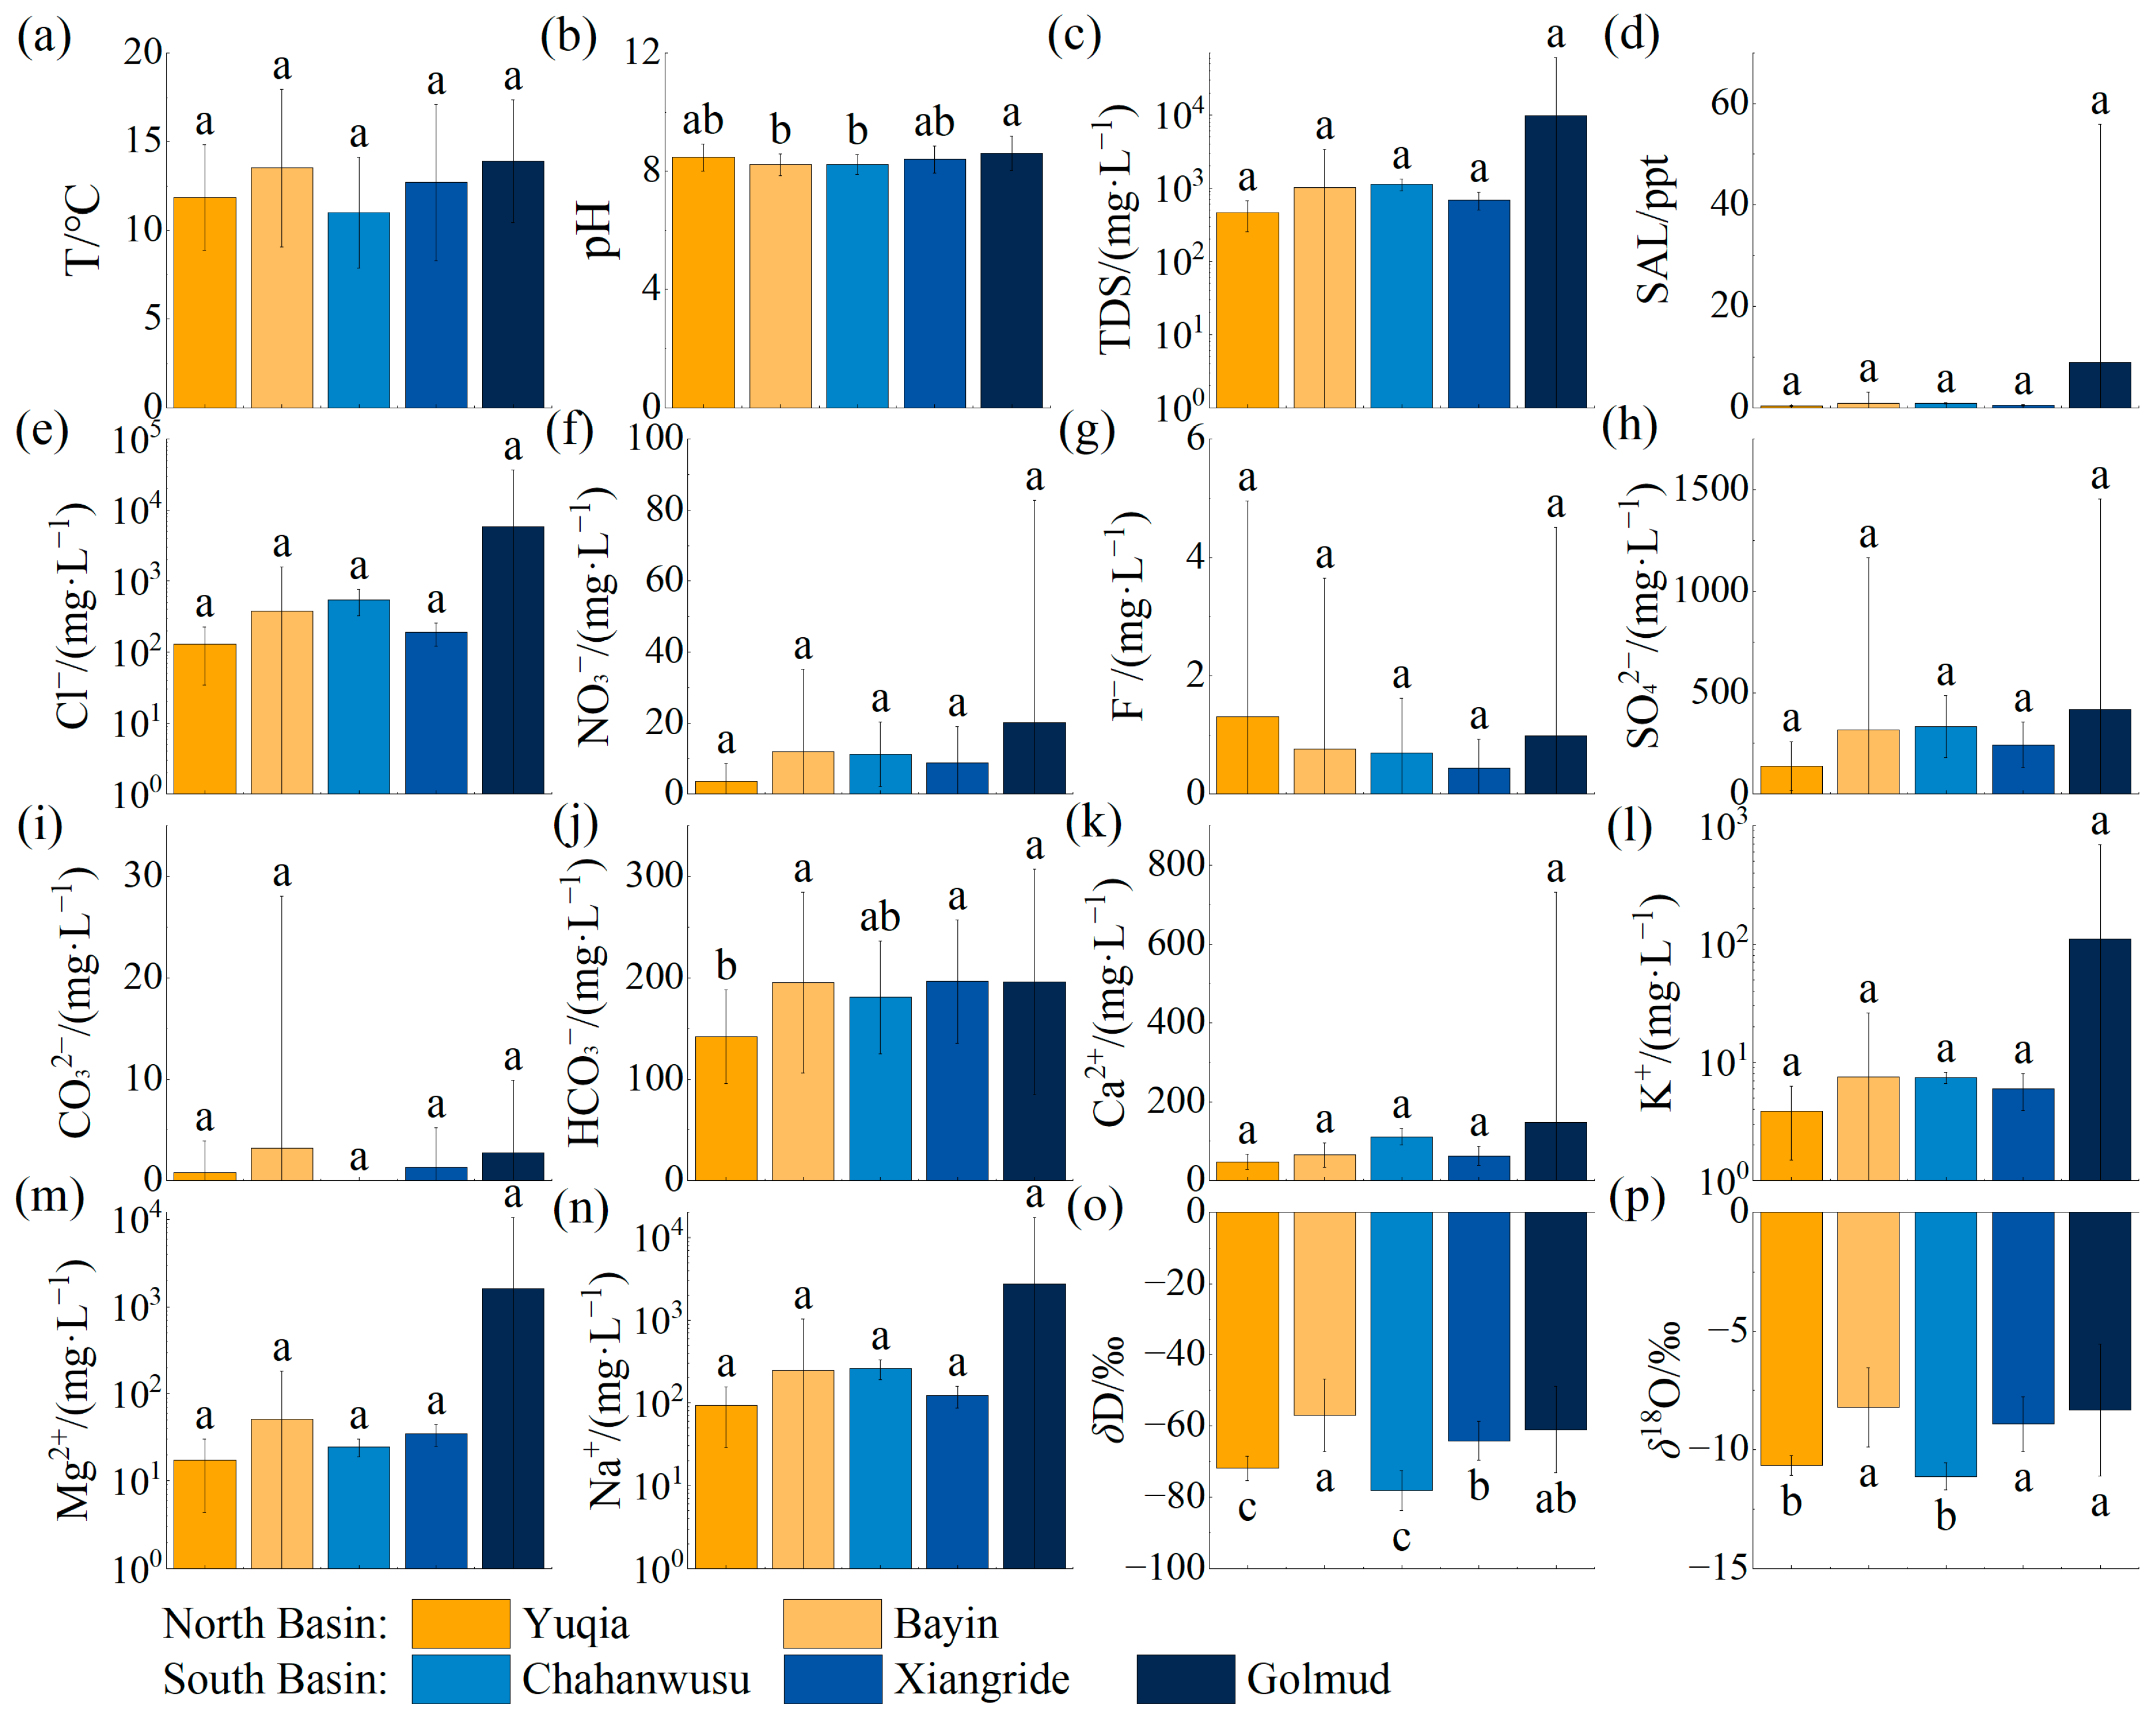
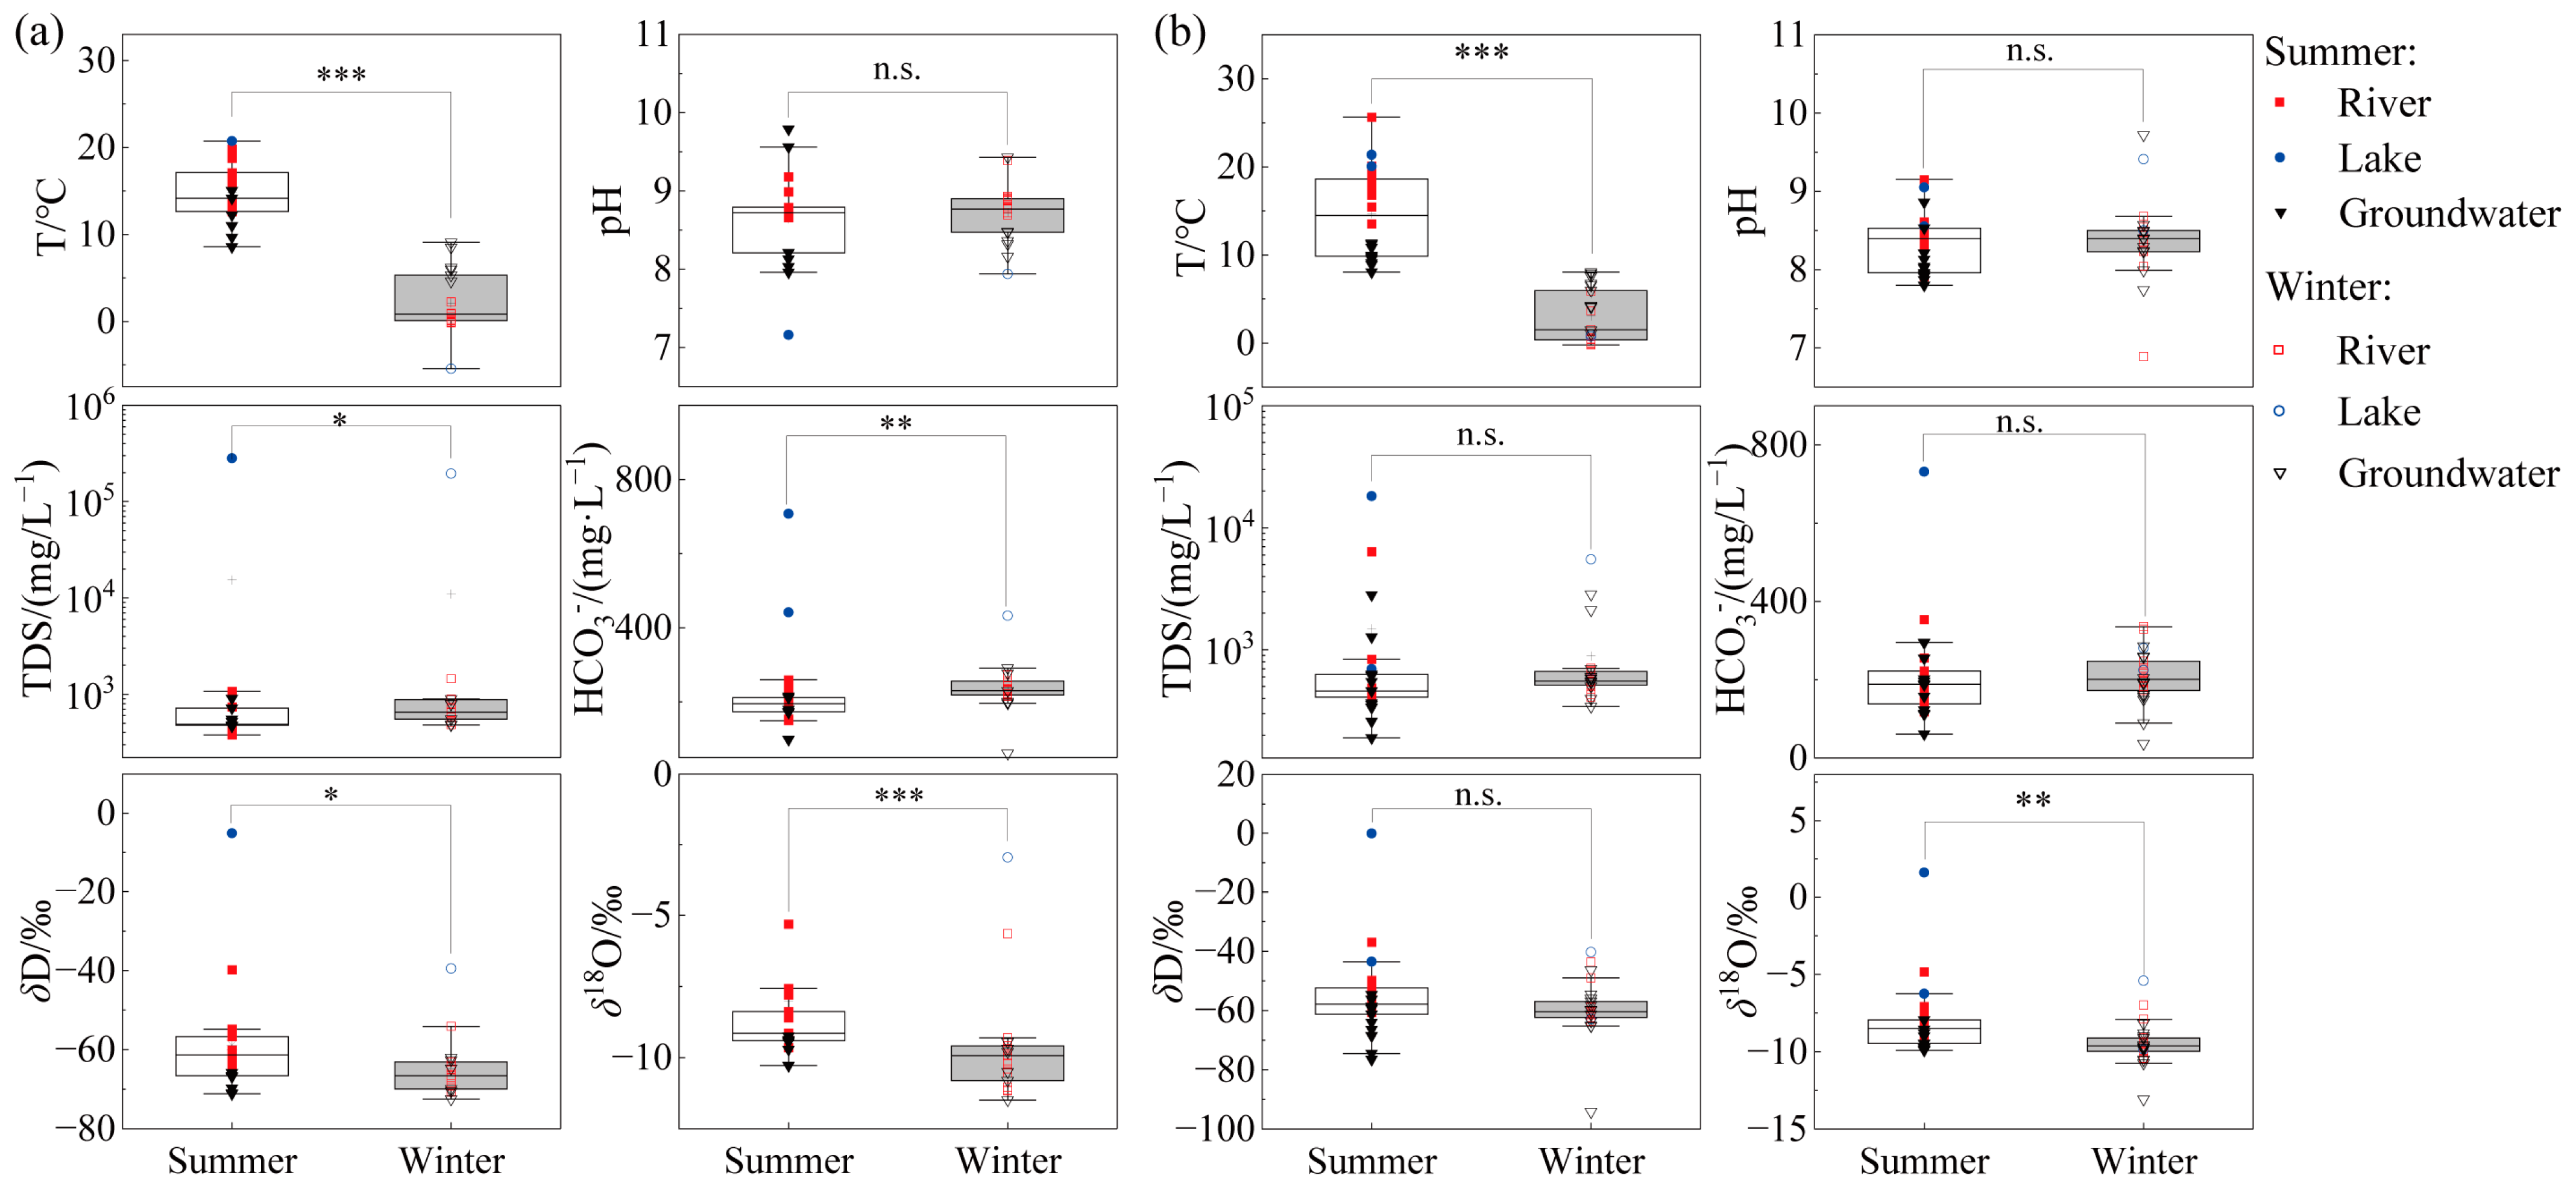
3.1. Summer Indicators

The physicochemical, hydrochemical and isotopic characteristics of surface water and groundwater in the QB during the summer are presented in Appendix A Table A2 and Figure 3.
In summer, the water temperature of water bodies varies from 4.0 °C to 25.6 °C with the mean value (±SD) of 12.8 ± 4.0 °C. Surface water and groundwater tend towards being alkaline; the pH value is 8.4 ± 0.5, SAL is 2.0 ± 19.1 ppt, and TDS is 2324.4 ± 20,630.6 mg/L, with the main ionic components being Cl, SO42−, HCO3, Na, Ca, and Mg. The δD value is −64.2 ± 11.1‰, and the δ18O value is −9.2 ± 2.0‰. When comparing the five watersheds, the TDS levels are arranged from highest to lowest as follows: Golmud River, Chahanwusu River, Bayin River, Xiangride River, and Yuqia River, with Golmud River primarily having high ion concentrations due to lake water influence.
Based on significant difference analysis [26] (Figure 3), it can be observed that for most physical and chemical parameters, there are no significant differences within the α ≤ 0.05 range. However, significant differences exist in pH values between the Golmud River, Chahanwusu River, and Xiangride River. HCO3 levels show significant differences between the Yuqia River and the Bayin River, Xiangride River, and Golmud River. The high concentration of SO42− in groundwater in parts of the Bayin and Golmud River basins is due to the greater impacts of human activities in these areas. H−O isotopes show significant differences: δD values exhibit significant differences between the Bayin River and the Xiangride River, as well as the Yuqia River and Chahanwusu River. The δ18O values show significant differences between the Yuqia River, Chahanwusu River, and the other three rivers.
Spatially, significant variations are observed only in pH, HCO3, and H−O isotopes among the various watersheds.

3.2. Winter Indicators

Based on the analysis above, it is evident that there exist significant disparities in water characteristics between the southern and northern basins, demonstrating a latitudinal zonality. Therefore, the watersheds of the Golmud River in the south and the Bayin River in the north are selected to analyze seasonal differences. Appendix A Table A3 presents the physicochemical characteristics and hydrochemical and isotopic statistics of winter water bodies. Four physicochemical characteristics and H−O stable isotopes were selected for the analysis of significant difference. Because the data do not conform to a normal distribution, the Mann–Whitney U non-parametric test method [27] was employed for the analysis of significant differences (Figure 4).
In winter, the water temperature in Golmud River ranges from −5.5 to 9.0 °C (with an average of 2.1 ± 3.6 °C), and in Bayin River, it ranges from −0.2 to 8.0 °C (with an average of 11.0 ± 7.2 °C), which is more stable compared to summer. In the Golmud River basin during winter, the TDS ranges from 479.2 to 195,635.7 mg/L (with an average of 10,966.5 ± 44,720.2 mg/L), and the salinity is 9.8 ± 40.2 ppt, which is higher than in summer. In the Bayin River basin, the TDS ranges from 344.1 to 5508.9 mg/L (with an average of 888.2 ± 1087.8 mg/L), and the salinity is 0.6 ± 1.0 ppt, which is lower than in summer. When comparing different water types, it is observed that the pH of lake water in the Golmud River basin (ranging from 7.2 to 7.9) is lower than that of river water and groundwater, while the pH of lake water in the Bayin River is higher (ranging from 9.1 to 9.4 for Tuosu Lake and 8.5 to 8.6 for Keluke Lake, with an average of 8.3 for river and lake water in both summer and winter). The TDS in all three lake water samples is high, especially in East Dabson Lake, where the TDS reaches as high as 1.2 × 10⁵ mg/L. Lake water has high TDS and a wide range of variation, with the enrichment of Na, K, and Mg, and the dominant anions are Cl and SO42−.
During the summer and winter seasons, significant differences are observed in the TDS of the Golmud River (p ≤ 0.05), as well as in SAL and HCO3 concentrations (p ≤ 0.01). The differences in δD are also significant (p ≤ 0.05), while the differences in δ18O are extremely significant. On the other hand, there are no significant differences in TDS, HCO3 concentration, SAL, and δD in the Bayin River. In terms of isotope comparison, significant differences are observed in δD, while extremely significant differences are observed in δ18O in the Golmud River. In the Bayin River, significant differences are observed in δ18O (p ≤ 0.01), while no significant differences are found in δD.
In summary, the magnitude of the differences in characteristics for different regions during the summer and winter seasons varied. The main differences are observed in water temperature, δ18O, TDS and HCO3 in the Golmud River watershed.

4. Discussion

Based on the above analysis, it is evident that there are differences in the water characteristics of the southern and northern parts of the QB during the summer and winter seasons. Surface water and groundwater exhibit spatiotemporal variations, which are related to different underlying surface conditions and external influencing factors. The composition of water sources, surface water to groundwater conversion along the flow path, and the different supply sources of terminal lakes are all related. The following sections will discuss these factors separately.

4.1. Analysis of Spatial Differences

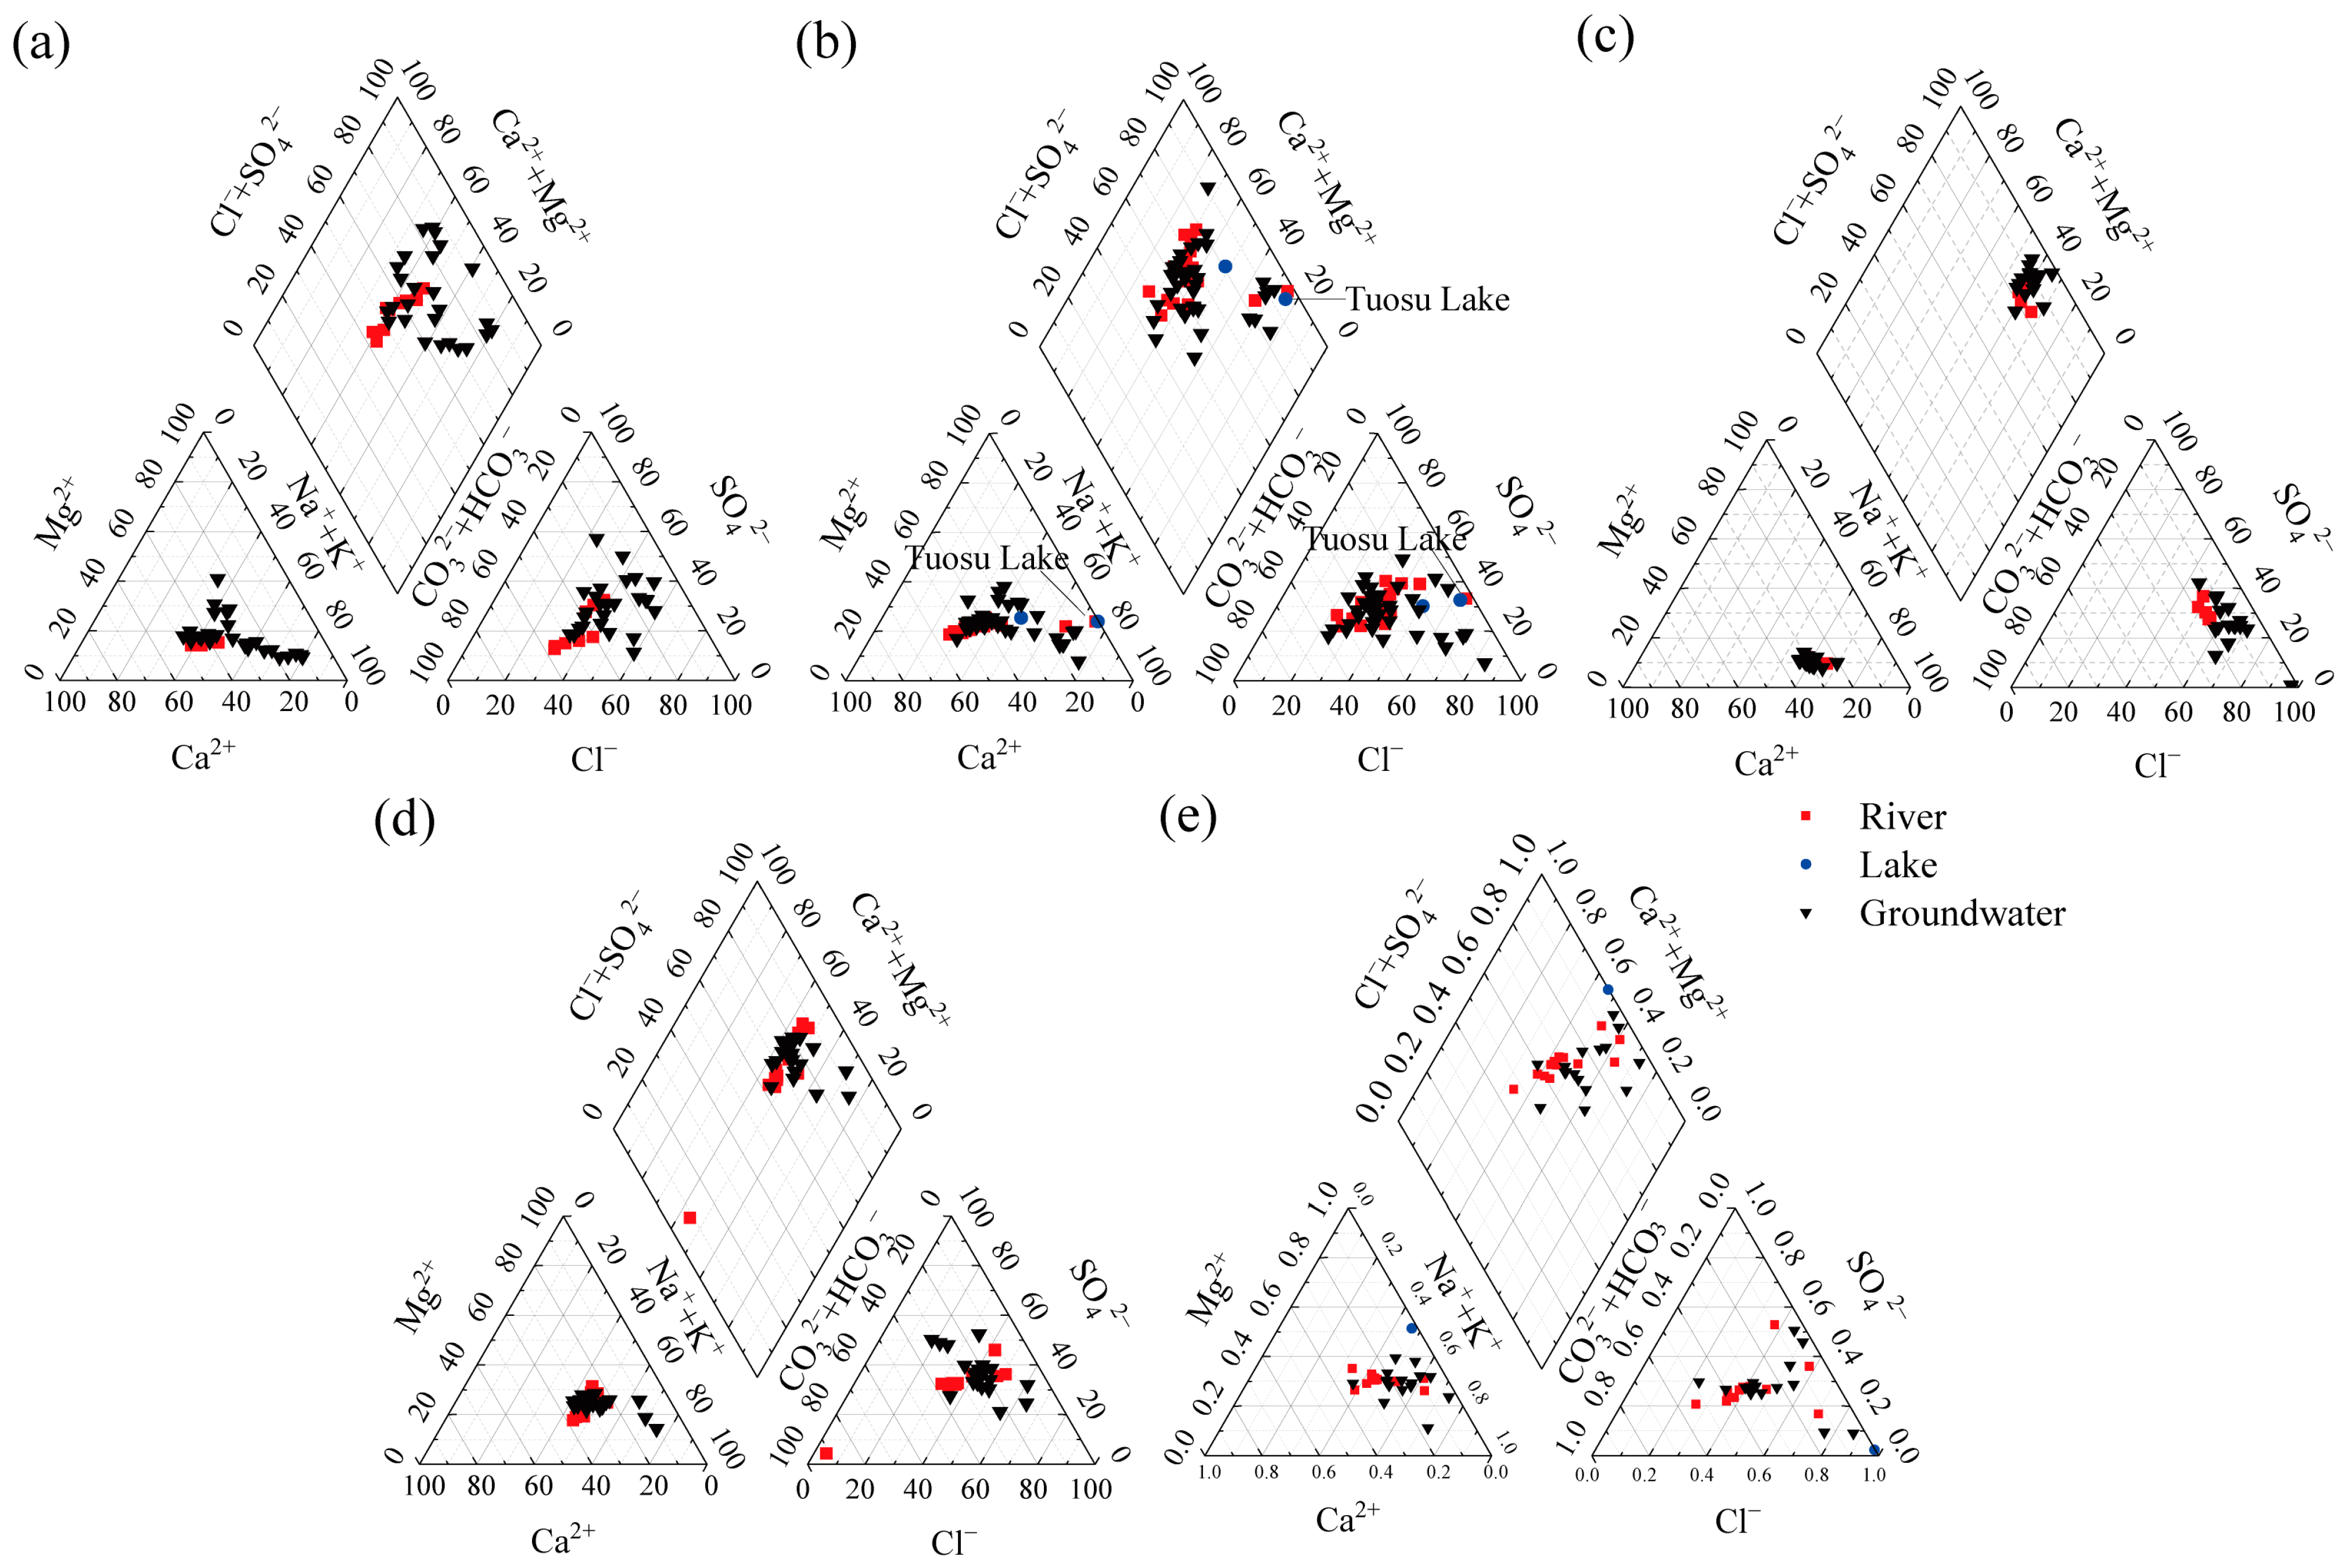
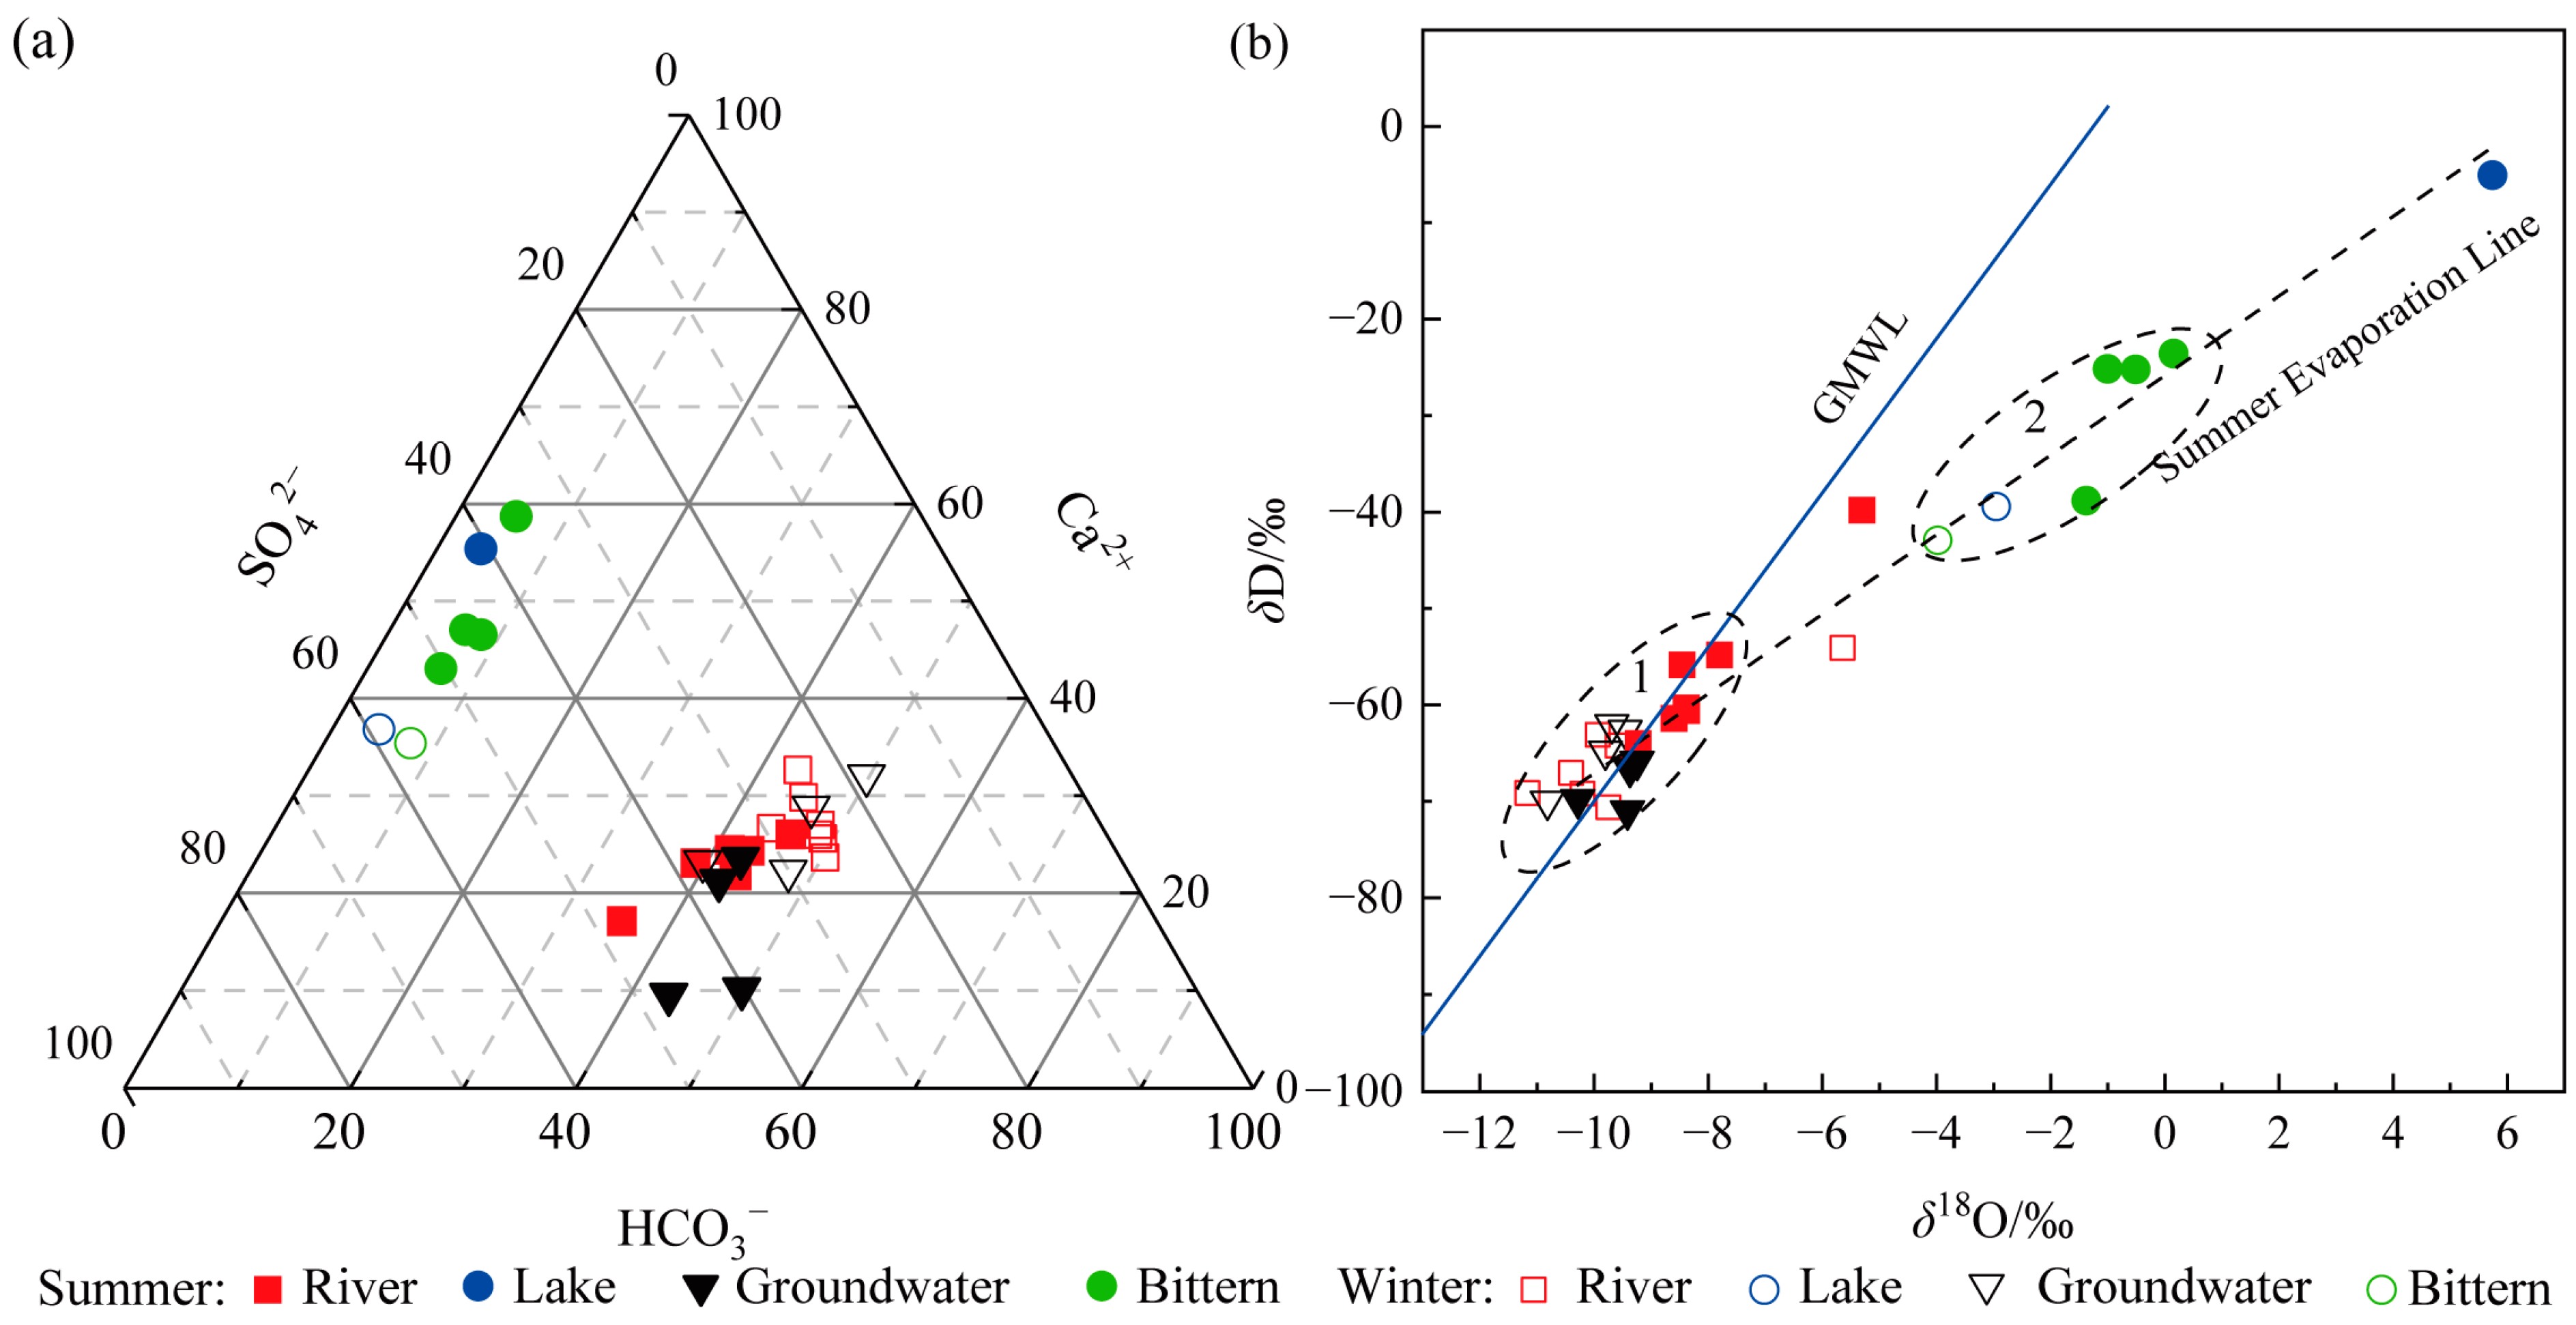
4.1.1. Differences in Hydrochemical Types and Their Causes

Classifying hydrochemical types can provide a more intuitive analysis of the chemical characteristics of water bodies in different basins. By using the Piper ternary diagram and the Shukarev classification method [36], comparisons of the main ion concentrations in the five watersheds were conducted, leading to the categorization of hydrochemical types (Figure 5 and Table 1). It can be observed that the proportions of each ion’s concentration in river water and groundwater are similar, while the concentration of Cl is higher in lake water. In the northern basin (Figure 5a,b), the concentrations of Ca2+ and HCO3 are higher than in the southern basin (Figure 5c–e), while Na+, K+, and Cl concentrations are lower. Table 1 shows that in the northern basin, rivers and groundwater are mainly of the HCO3·Cl·SO4-Na·Ca type, whereas in the southern basin, there are various types of rivers and groundwater, but overall, Cl concentrations are higher. The Tuosu Lake in the northern basin is of the Cl·SO4-Na type, while the East Dabson Lake in the southern basin is of the ClNa·Mg type.
Consequently, there are significant differences in the hydrochemical types between the southern and northern basin watersheds. Additionally, the chemical characteristics of river water and groundwater are similar, whereas lake water differs markedly. The main reason for the differences in the chemical composition of water is the diverse underlying conditions, which can be analyzed from the perspectives of regional geological origin and aquifer lithology. Based on the comprehensive Kunlun Mountains–Xiao Qaidam Lake hydrogeological profile (Figure 1b), it is evident that the surrounding mountains of the basin mainly consist of Paleozoic formations, while the basin and its margin are dominated by Mesozoic–Cenozoic formations. In the southern mountainous regions, there are distributions of Triassic (T, shallow marine deposition), Permian (P), Ordovician (O), Paleoproterozoic (Pt), Jurassic (J), and Devonian (D) formations. The Quaternary system (Q) is mainly distributed within the basin and the wide valley areas between the mountains. The genesis types of the Holocene (Qh) include debris flow accumulation (Qhdl-pl), alluvial fan accumulation (Qhal-l), and marsh sedimentation (Qhfl). In the river channels, the primary accumulations are the Holocene alluvial layers (Qhal), while the periphery of the terminal lake is primarily characterized by chemical deposits–lacustrine layers (Qhch-l), and the lower part mainly consists of late Pleistocene floodplain deposits (Qp3al-pl). In the northern part of Lake Dabson (the largest lake in the Qarhan Salt Lake area), the upper part is mainly covered by late Pleistocene lacustrine layers (Qp3l) and Holocene chemical deposits (Qhch), while the lower part consists of late Pleistocene lacustrine floodplain deposits (Qp3al-l). In the southern part of Xiao Qaidam Lake, there is a distribution of continental red clastic sedimentation belonging to the Paleogene–Neogene system (R). The periphery of the lake is composed of late Pleistocene floodplain deposits (Qp3pl), and the central part of the basin is characterized by marsh sedimentation (Qhfl).
From the perspective of the aquifer system, the surrounding bedrock in mountainous areas in the basin is composed of metamorphic rocks and carbonate rocks. Among these rock formations, numerous springs emerge, transferring the chemical composition of rocks to surface water. In the Kunlun Mountain area, the aquifer formations of metamorphic rocks primarily consist of schist, gneiss, quartz schist, and slate. The carbonate rock fractures are well developed, resulting in abundant spring water flow with excellent water quality. In the Qilian Mountain area, the aquifer formations of metamorphic rocks include sandstone, shale, slate, and gneiss, while the carbonate rocks mainly exhibit thick and massive structures with well-developed joint fissures, creating favorable conditions for the storage and migration of groundwater [10]. This also explains the higher concentration of HCO3 in the water bodies of mountainous regions, as documented in reference [25].
Loose rocks are distributed in the intermountain valleys and alluvial fan areas of each watershed. Vertically, the granular composition transitions from coarse to fine particles, starting from the coarse pebble layer and transitioning to coarse sand, fine sand, and silt towards the basin’s center from the front-tilted plain. Vertically, the transition comprises a single pebble layer to a multilayer structure with overlapping rock types. Horizontally, parallel to the basin’s edge mountains, the main river channels form an independent aquifer system in the front faces of mountainous areas [10].
A significant difference between the southern and northern basins is the varying connectivity of the aquifers in the lacustrine plain. In the southern basin, the confined aquifer in the lacustrine plain is interconnected with the thick aquifer of the alluvial fan, directly receiving groundwater recharge. In the northern basin, the transverse continuity of the confined aquifer is inferior to that of the southern basin. Some areas are isolated by mountains and are independent units. However, vertically, they generally connect with the unconfined aquifer of the alluvial fan primarily through vertical top-supported cross-flow groundwater recharge, and then the groundwater is discharged via groundwater evaporation [10]. The supply of oilfield water in the southern part of the basin (as shown in Figure 1b) is also a leading cause of higher Cl content in the water bodies of the southern basin. According to the research findings in [25], it is known that Na+, Cl, and SO42− dominate the water bodies in the southern basin, while Ca2+ and HCO3 dominate in the northern basin.
Thus, the differences in hydrochemical composition are primarily due to variations in the aquifer’s lithology: (1) in the southern region, the influence of salt rock dissolution and oilfield water is more significant, while in the northern mountainous areas, the development of carbonate rock joints and fissures is more pronounced, indicating a more significant impact due to carbonate weathering; (2) the connectivity of the aquifers in the floodplain areas results in different groundwater recharge mechanisms, with direct upstream groundwater recharge in the south and vertical top-supported cross-flow recharge in the north, resulting in relatively lower potentials for evaporation.

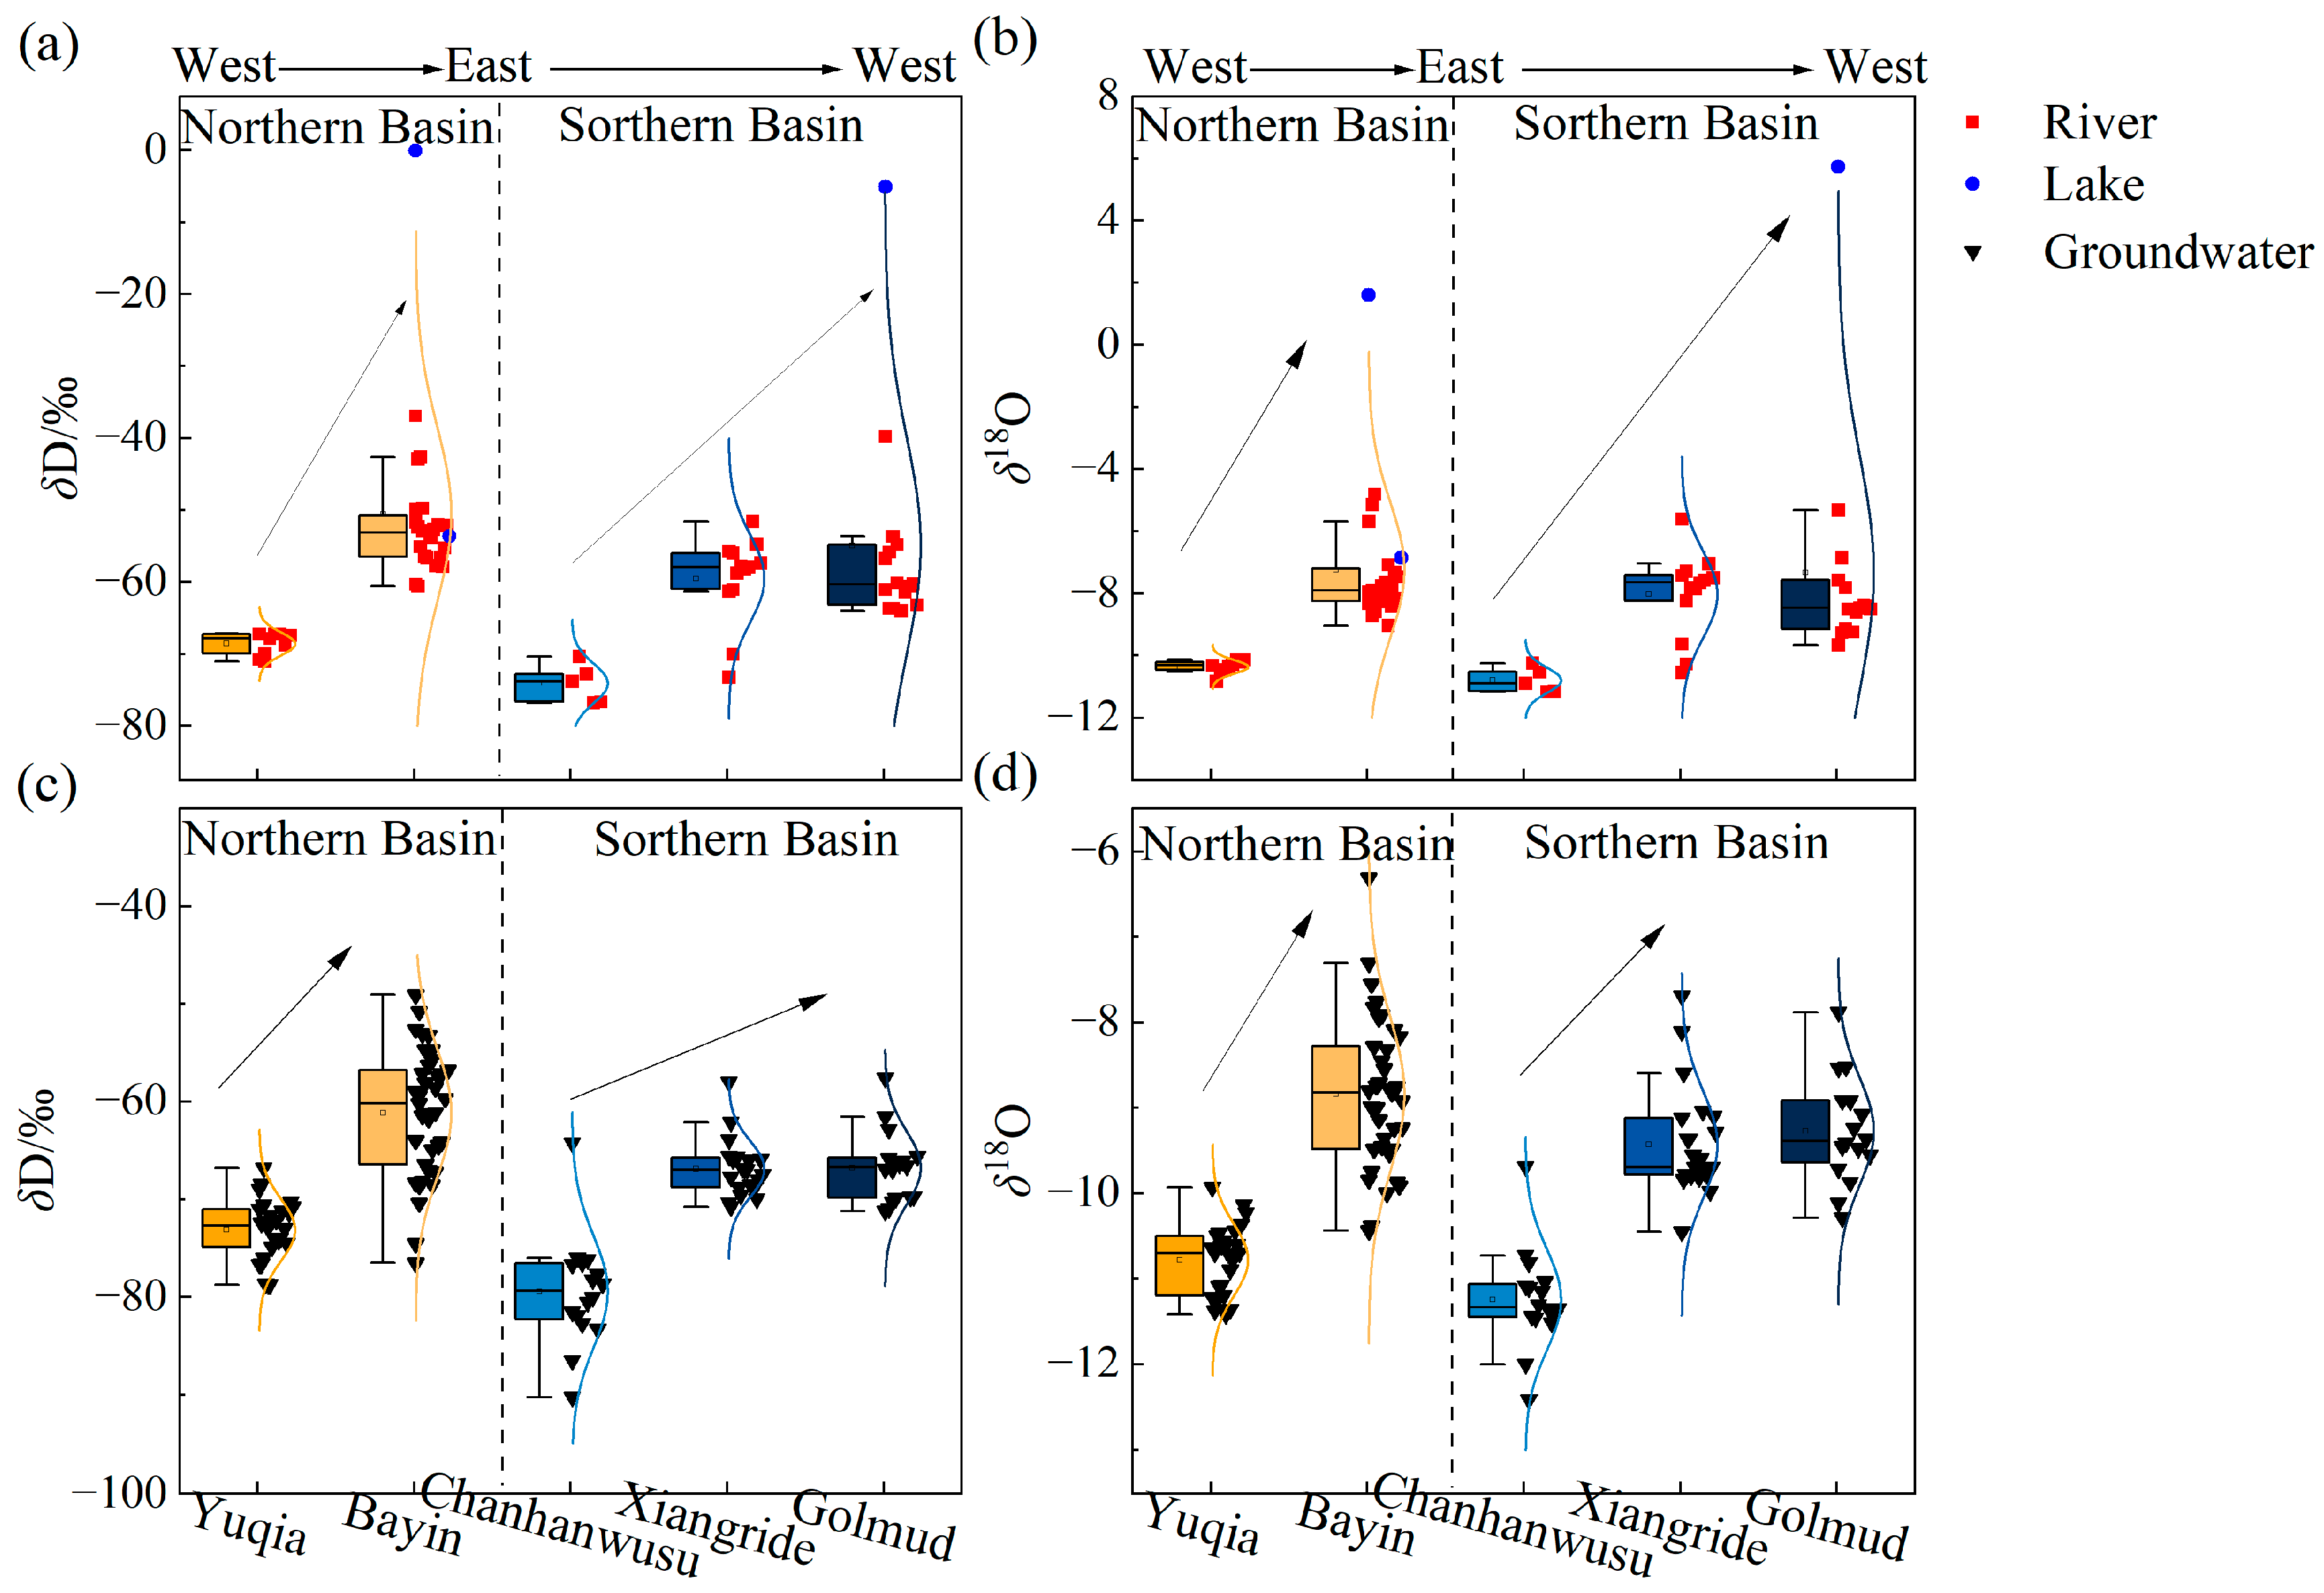
4.1.2. Differences in H-O Isotopes and Their Causes

The surface water in the QB exhibits significant spatial variations in H-O isotopes (Figure 6a,b). In the northern basin, the H-O isotope values increase from west to east, while in the southern basin, there is an overall trend of increasing values from east to west. The less pronounced pattern in the Xiangride River basin is attributed to the fact that the river water is primarily supplied by local precipitation in the plains, whereas in other basins, the river water is mainly replenished by atmospheric precipitation from high-altitude mountain areas [37].
In comparison to surface water, the H-O isotope values in groundwater are lower (Figure 6c,d), as the isotopic fractionation dynamics caused by evaporation and mixing are weaker than in surface water [38]. The spatial variability in groundwater is not as pronounced as in surface water, but follows almost the same distribution pattern within the basin. This suggests that close hydraulic interactions result in similar spatial variations in the H-O isotope composition of both surface water and groundwater.
In summary, the isotopic composition of watersheds in the southern basin contrasts with that of watersheds in the northern basin. In the northern basin, δD and δ18O gradually enrich from west to east, whereas in the southern basin, the opposite trend is observed, indicating a significant influence of local meteorological conditions such as precipitation and evaporation. The following analysis will use precipitation H-O isotopes, deuterium excess (d-excess) and atmospheric water vapor circulation to explore the reasons behind these variations.
Deuterium excess is defined as d-excess = δD − 8δ18O, and its value is related to the relative humidity of the ambient air when the water vapor at the source of precipitation evaporates [39]. This value remains constant during transport and contains important information about the source of water vapor. Generally, precipitation from high-latitude inland areas has a d-excess value of >10‰, while precipitation from low-latitude oceanic evaporation has a d-excess value of <10‰ [40]. In arid regions, the d-excess values decrease during the evaporation process and increase during the local water vapor recycling process associated with intense evaporation [41]. In their study of the source of summer water vapor in the northern Tibetan Plateau, Yang et al. [42] suggested that when the δ18O in precipitation is less than −20‰, the source of water vapor is marine air masses, and when δ18O in precipitation is greater than −13‰, the source of water vapor is local evaporation.
Based on the collected H-O isotope values in precipitation and the river water data collected in this study, the d-excess values for the Golmud and Delingha regions were calculated (Table 2). It can be observed that the δ18O values for precipitation at both locations are higher than −13‰. This is mainly due to the arid climate and intense evaporation in the QB, where local evaporation contributes significantly to the water vapor. In comparison, the δ18O value of precipitation in the Golmud region averages −8.80‰, slightly lower than that of river water (−8.36‰), indicating that in addition to local river water evaporation, precipitation has other sources. The higher d-excess values (average of 10.61‰) indicate relatively dry climate conditions in the moisture source region. Therefore, it can be inferred that some of the water vapor comes from the Central Asian inland moisture transported by the westerlies (the average δ18O value of precipitation in the Central Asian region is −9.79‰ [43]). Precipitation in the Delingha region has a higher d-excess (average of 12.01‰) and a δ18O value (average of −6.96‰) higher than that of river water (average of −7.87‰), indicating that the water vapor is primarily derived from local evaporation.
Using the southern and northern basins as marked regions, precipitation source tracking calculations were conducted using WAM-2Layer. Additionally, regional evaporation and water vapor recycling rates were calculated [29]. The contribution rates of the average precipitation water vapor sources from 2019 to 2020 are shown in Figure 7.
After calculation, the annual average evaporation in the southern basin was deemed to be 404.9 mm, while in the northern basin, it is 216.8 mm. The average annual precipitation recycling rate (water vapor recycling) in the southern basin is 6.7%, whereas in the northern basin, it is 5.2%. Therefore, the southern basin has a stronger local evaporation capacity, leading to a higher precipitation recycling rate compared to the northern basin [35]. According to Figure 7, the westerly circulation and local water vapor cycle are the main contributors to precipitation in the basin [38,43], but their contributions are not entirely the same for the southern and northern basins. The areas that provide moisture for precipitation in the southern basin are mainly concentrated in the central QTP. Among them, the Mushroom Peak on the southwestern edge of the QB contributes the most moisture, with an annual contribution of around 50 mm. There is also a contribution from the southwestern part of the QTP, which may come from the evaporation of snow on high mountains. The moisture sources for the northern basin are mainly in the northeast of the basin, with an annual contribution of around 20 mm. There is less water vapor contribution from the southwest to the northern basin than to the southern basin.
The contribution rates of precipitation water vapor sources and the values of δ18O and d-excess indicate that the sources of water vapor in different regions and the transportation intensity within the basin are not entirely the same. In the case of the southern basin, the contribution of water vapor transported by the westerly winds is relatively significant [44], whereas in the northern basin, the primary source of water vapor is local evaporation [45].

4.2. Analysis of Seasonal Differences

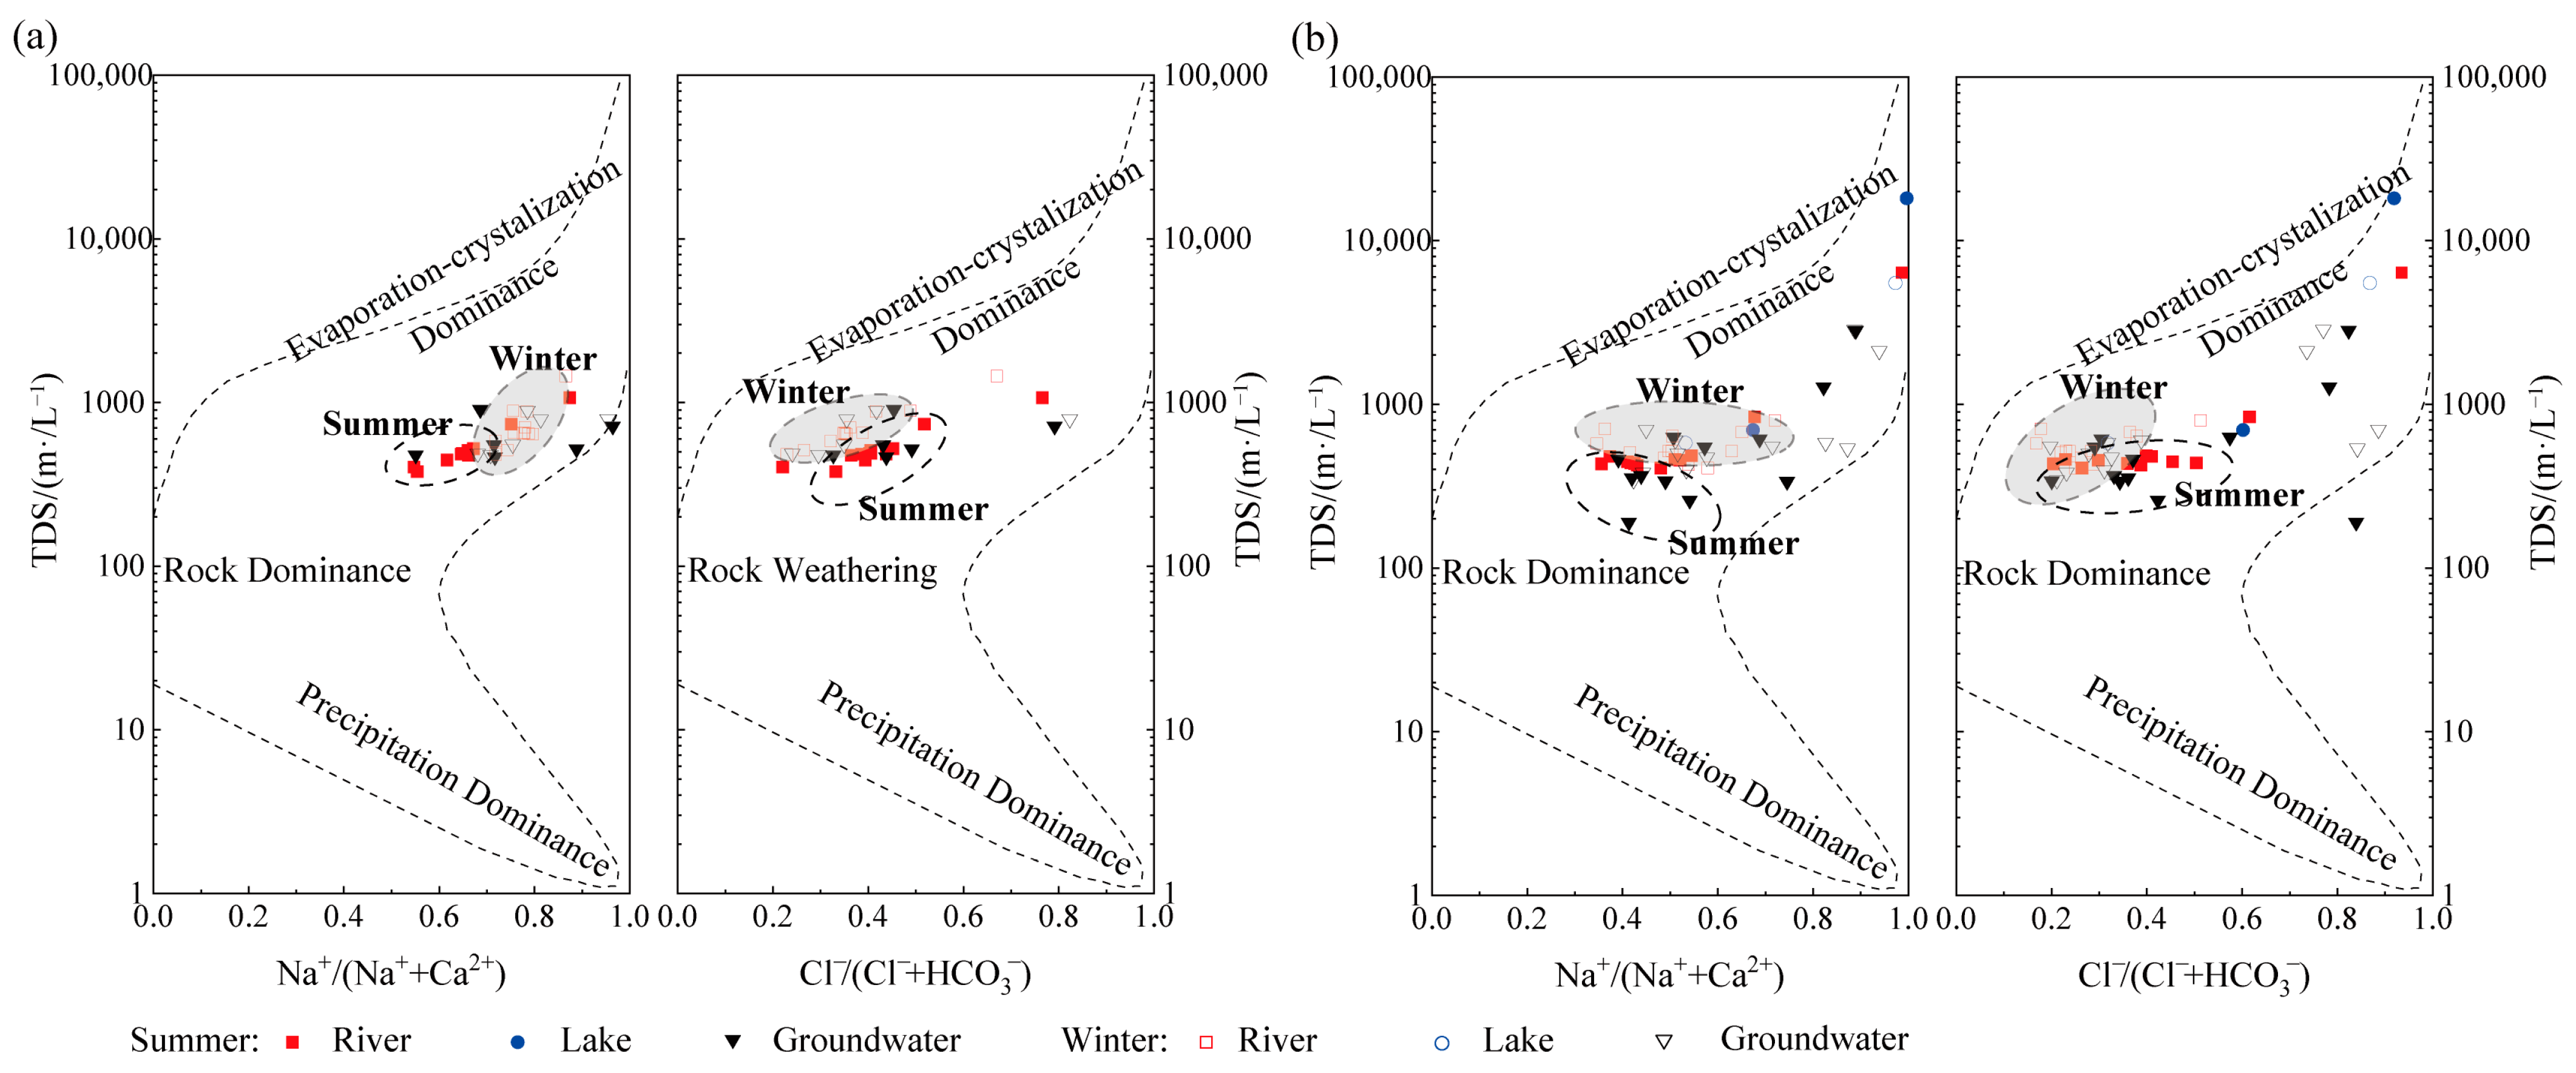
4.2.1. Differences in Hydrochemical Types and Their Causes

By using the Piper ternary diagram to illustrate the differences in major ion concentrations and hydrochemical types for the two watersheds during summer and winter (Figure 8), it can be observed that there are significant differences in the ion concentrations of river water and groundwater for the two watersheds. In the Piper ternary diagram, the summer sample points are positioned above the winter sample points. The seasonal variation trends in ion concentration proportions are similar. During the summer, Ca2+ and Cl, as well as SO42−, are depleted compared to the winter season, while HCO3 and Mg2+, along with Na+, are enriched compared to the summer season.
In the Golmud River watershed, the primary hydrochemical type of river and groundwater is HCO3·SO4·Cl-Na·Mg·Ca in summer and HCO3·SO4-Na·Mg in winter. In the Bayin River watershed, the primary hydrochemical type is SO4·HCO3·Cl-Na·Ca·Mg in summer and HCO3·SO4·Cl-Na·Ca·Mg in winter. The East Dabson Lake in both seasons is of the Cl-Na·Mg type, with Ca2+ and Mg2+ being more enriched during the winter and Na+ being depleted. The differences in anion concentrations are small, leading to minimal impacts on the hydrochemical type. Tuosu Lake maintains the same hydrochemical type in both seasons, being of the Cl·SO4-Na type. Keluke Lake exhibits different hydrochemical types in different seasons. In summer, it is primarily of the HCO3·SO4·Cl−Na·Mg·Ca type, while in winter seasons, it is mainly the HCO3·SO4·Cl−Na·Ca·Mg type.
Therefore, the types of river water and groundwater differ in different seasons, while the hydrochemical types of terminal lakes are not influenced by the seasons. It is evident that the differences in hydrochemical composition and types are related to water temperature, precipitation, the leaching effect of groundwater, and the evaporative precipitation effect.
The Gibbs models are employed to characterize influencing mechanisms, such as atmospheric input, water–rock interaction, and evaporation–crystallization effects [31,46] (Figure 9).
Generally, the Na+/(Na+ + Ca2+) and Cl/(Cl + HCO3) ratios of water samples from both watersheds in different seasons are distributed towards the middle–right position in the Gibbs diagram, indicating that the hydrochemical composition of the study area’s water bodies deviates as a result of atmospheric precipitation, and is mainly controlled by rock weathering and evaporation crystallization. The absence of lake water samples in the Gibbs diagram of the Golmud River is due to a TDS that exceeds 105 mg/L, indicating that the lake water is influenced by other factors. In the case of the Bayin River, one water sample in the summer groundwater falls outside the graph in the Cl/(Cl + HCO3) ratio diagram, suggesting that hydrochemical characteristics may be influenced by other factors, such as human activities [36].
Comparing the hydrochemical mechanisms of the two watersheds in the summer and winter seasons, it can be observed that there are similar seasonal differences. In the Na+/(Na+ + Ca2+) ratio diagram, the summer samples are located below and to the left of the winter samples, indicating a greater influence of rock weathering in the summer, which is likely due to the higher water temperature and stronger water–rock interaction. In the Cl/(Cl + HCO3) ratio diagram, the winter samples are positioned above the summer samples, suggesting a higher TDS in winter, which also implies a greater influence of evaporation and precipitation in the winter, as the region is drier and experiences faster water surface evaporation during this season.
Therefore, water bodies are more influenced by water–rock interaction in summer than in winter seasons; this is not only related to water temperatures, but also to factors such as different seasonal atmospheric precipitation and evaporation.

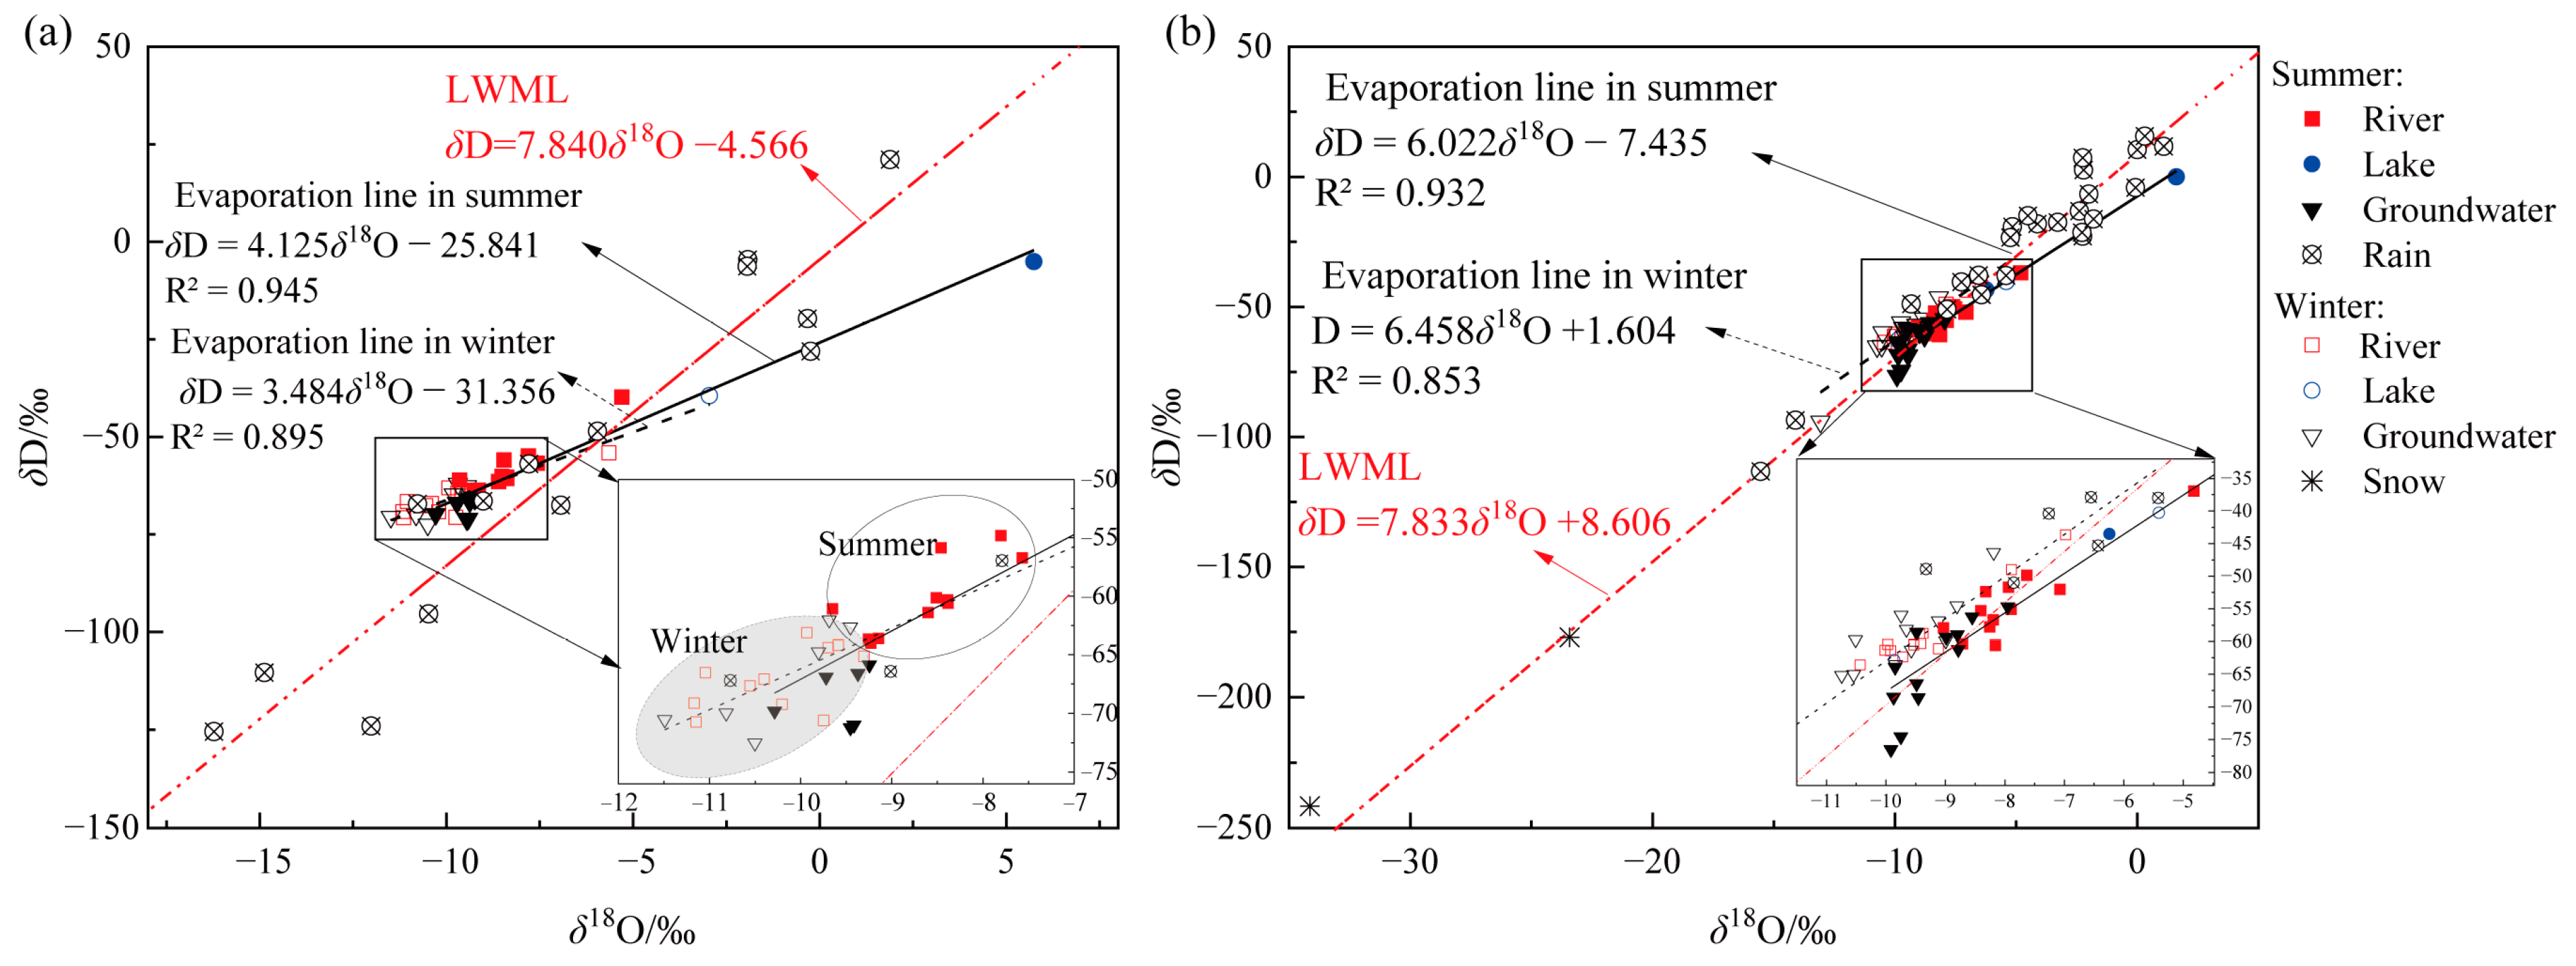
4.2.2. Differences in H-O Isotopes and Their Causes

Evaporation lines with specific slopes represent the isotopic composition characteristics of water samples from the same source, while different positions on the same evaporation line reflect differences in the degree of unbalanced evaporation they have undergone. The δD-δ18O relationships of precipitation isotopes collected from the literature with precipitation, river water, lake water, and groundwater sampled in this study are illustrated in Figure 10. By comparing with the atmospheric precipitation lines from Golmud and Delingha regions (LWML, δD = 7.840 δ18O − 4.566, δD = 7.833 δ18O + 8.606) [45], it is evident that precipitation sampling points in the Golmud area deviate significantly from the LWML, indicating pronounced H-O isotope fractionation due to intense evaporation and minimal rainfall in Golmud. In contrast, precipitation sampling points in Delingha are generally located on the LWML atmospheric precipitation line. Both river water and groundwater in the Golmud River are situated on the evaporation line, suggesting that these three water sources share the same primary supply. However, lake water sampling points deviate from the evaporation line, especially during winter points, located to the upper left of the evaporation line, indicating additional supply sources (detailed analysis in Section 4.3.2). In the Bayin River, several groundwater sampling points are far from the evaporation line (black points in the lower left of Figure 10b) because they were collected from deep water layers (depth of 90~110 m) in the front edge of alluvial fans and lacustrine plains. The water of Keluke Lake aligns with the evaporation line, sharing the same source as river water and groundwater. On the other hand, sampling points for Tuosu Lake are distant from other water bodies. This is attributed to continuous evaporation in Tuosu Lake and the possibility of local groundwater supply (detailed analysis in Section 4.3.2).
Comparing the evaporation lines with the LWML, it is evident that the slopes (δD/δ18O values) and intercepts of the evaporation lines for river water, lake water, and groundwater in the Golmud River are significantly smaller than the local precipitation line’s slope (7.840). Moreover, the winter δD/δ18O values and intercepts (−31.356 and 3.484) are smaller than those in summer (−25.841 and 4.125), indicating that both summer evaporation and winter water freezing lead to the enrichment of heavy isotopes. Additionally, the impact is more pronounced in winter, suggesting a drier winter compared to summer (consistent with Section 4.2.1). In the Bayin River, the slope and intercept of the evaporation line are closer to the local precipitation line. The summer δD/δ18O value (6.022) is slightly lower than in winter (6.458), which is attributed to the relatively lower humidity in summer.
Comparing the distribution of summer and winter evaporation lines and sampling points on the δD-δ18O plot, it is evident that the water bodies in the Golmud River exhibit significant seasonality, while this is not the case for the Bayin River. This observation is related to local climate conditions. Based on the results of precipitation source backtracking, the average water vapor source and evaporation factors for the winter and summer seasons from 2019 to 2021 are calculated, as shown in Table 3.
It can be observed that in the southern basin, the actual total evaporation in summer reaches 219.83 mm, with an effective evaporation rate of 10.02% and an internal cycling rate of 7.24%. In contrast, the effective evaporation rate in winter is only 5.23%, with an internal cycling rate of 3.79%. The evaporation, precipitation, and water vapor internal cycling rates in the northern basin are all lower than those in the southern basin, and the difference in effective evaporation rates between summer and winter is also relatively small.

4.3. Surface Water–Groundwater Interactions and Salt Sources for Terminal Lake

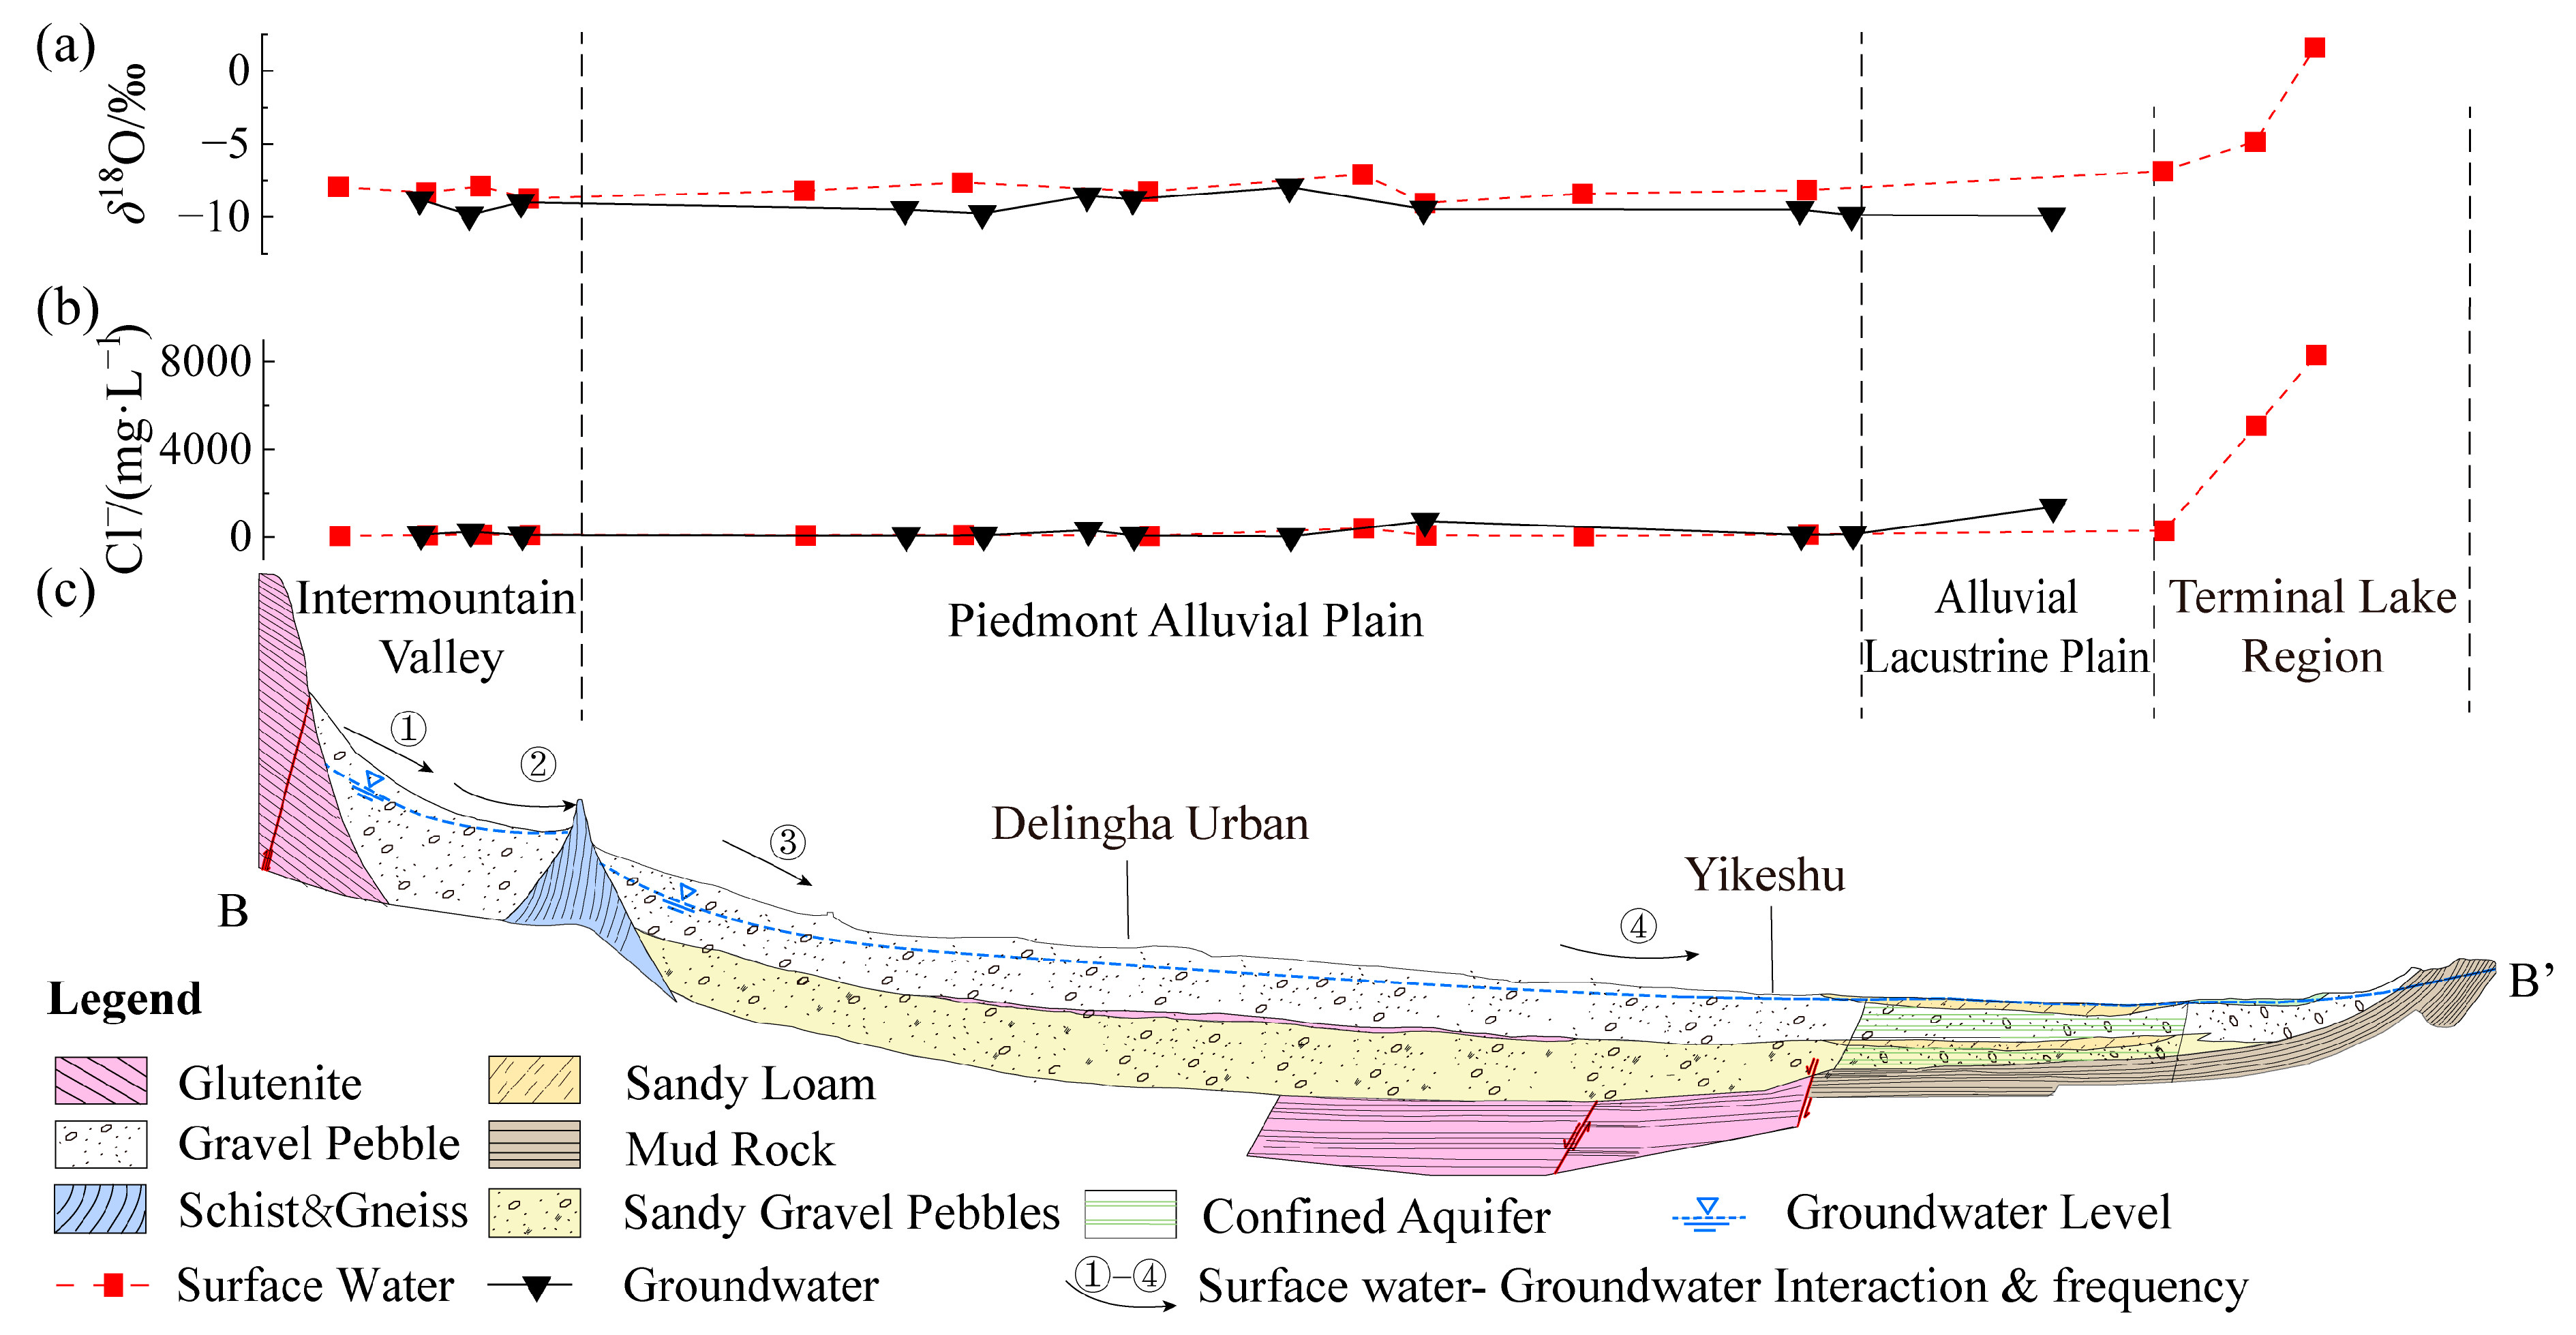
4.3.1. Surface Water–Groundwater Interaction from Mountainous Areas to Terminal Lakes

In arid inland river basins, there are frequent interactions between surface water and groundwater, and the upstream–downstream relationship along the course can also affect the hydrochemical and isotopic characteristics of water bodies. The relatively stable δ18O and Cl are selected as tracers to analyze the surface water–groundwater interaction (taking Bayin River as an example, Figure 11).
It can be observed that in the Bayin River watershed, the frequency of surface water–groundwater interaction is intense due to the control of bedrock barriers, lithology, and terrain. The intermountain valley has larger rock and soil particles. The longitudinal groundwater δ18O first becomes depleted and then enriched, while surface water first becomes enriched and then depleted. This indicates that groundwater is influenced by the bedrock barrier and surfaces in the region. The Quaternary unconsolidated layer is in non-conformity contact with the bedrock, characterized by the presence of foreland uplifts or aquifer structures. Groundwater is obstructed by the bedrock and emerges at the surface. Surface water and groundwater undergo two (or even three or four) conversions in the intermountain valleys before entering the main basin [25]. In the expansive foothill plain, characterized by large sediment particles, a significant amount of surface water replenishes groundwater. From the Delingha urban area to Yikeshu (alluvial plain to lacustrine plain), the terrain gradually becomes gentle, and the rock and soil particles become smaller. This transition from a single unconfined aquifer to multi-layer confined aquifers leads to relatively stable δ18O and Cl levels in surface water. In contrast, fluctuations in δ18O and Cl are observed in the groundwater, suggesting frequent surface water–groundwater transformations within this region. In the terminal lake area, there is a sharp enrichment of δ18O and Cl in both groundwater and surface water, indicating that groundwater and surface water are closely related. Simultaneously, this area exhibits strong evaporation and concentration effects. This can be attributed to the large evaporative surface area of the lake and the shallow groundwater depth (<5 m), leading to significant water consumption.
Therefore, the interaction between surface water and groundwater in the Bayin River can be characterized as follows: In the mountainous regions, river water infiltrates into the ground, and subsequently, groundwater emerges at the surface due to the obstruction of bedrock. After exiting the mountains, groundwater continues to seep downward, with increased seepage in the alluvial plain. Controlled by lithological changes and terrain, it overflows the surface before the front edge of an alluvial fan, replenishing the lakes. This phenomenon explains the similarities between the hydrochemical and isotopic characteristics of river water and groundwater.

4.3.2. Salt Sources for Terminal Lake

The fact that the hydrochemical types of the two terminal lakes do not vary with the seasons while exhibiting significant differences in salt content suggests the possibility of additional sources of replenishment. First, the supply of salt content to terminal lakes from the upstream water bodies is analyzed via an analysis of the hydrochemical distribution characteristics along the course, using the Bayin River watershed as an example (Figure 12). Subsequently, hydrochemical and isotopic methods are utilized to identify potential alternative sources.
In Figure 12, we see that all ions except Ca2+ and HCO3 increase to about the same magnitude. The decrease in Ca2+ and the smaller increase in HCO3 may be due to the precipitation of calcite. It is evident that in the mountainous region of the Bayin River watershed, the changing trends of Cl, SO42−, and HCO3 anions in river water exhibit opposite results. This indicates ion exchange during the leaching process, where carbonate rocks are replaced by rock salts. In the intermountain valley, there is a sudden increase in ion concentrations in the groundwater, while the Cl and SO42− contents of surface water initially increase and then decrease, which is controlled by the bedrock barrier, causing changes in ions after surface water is replenished by groundwater. As the water flow slows upon entering the piedmont alluvial plain area, the transport capacity gradually decreases, leading to the accumulation of fine particulate matter. This forms a single layer of sand and gravel stones in the northern part, gradually transitioning to a multi-layer structure of gravel, sand, silt, and clay (Figure 11c). The infiltration of surface water at the alluvial plain leads to a decreasing and then increasing trend with respect to ion concentrations in the groundwater. At the junction of the alluvial fan and lacustrine plain, there is a sudden increase followed by a decrease in Cl and Na+ in groundwater, and surface water shows a similar trend but with a smaller magnitude of change compared to groundwater. This is because the confined water flows upward, carrying substances from the lower gravel and sandstone into the unconfined aquifer, which then replenishes the surface water. In the alluvial lacustrine plain, the deposition of fine sand, medium sand, silt, and clay begins. The type of groundwater transitions from unconfined water to confined water, and the ion contents of both surface water and groundwater begin to increase sharply. Apart from Mg2+, all other ions in surface water increase to 103~104 mg/L, with Cl, SO42−, and Na+ showing the most noticeable increase rates in groundwater, while HCO3 shows a peak before decreasing. The low content of Mg2+ and Ca2+ is due to their precipitation after saturation, where Na+ replaces Ca2+ and Mg2+. The surrounding area of terminal lakes has a more complex lithology, including black silt with fine sand, clay, and silt layers, yellow-brown fine sand, grayish-blue silt, and silt loam [22], which contributes to the increased ion concentration in the lake area. This also further explains the surface water–groundwater transformation relationship described in Section 4.3.1. Additionally, the intense evaporation in the lake area has led to the significant precipitation of ions such as Cl in the evaporite rocks of the region [48].
Various types of rocks in mountainous regions serve as the primary sources of salt. Over time, these rocks have undergone weathering and transported salt via surface water–groundwater interactions. As water moves from the mountains to the alluvial plain, the dissolution and precipitation of various substances in groundwater alter the chemical composition of surface water. The strong evaporation in lake areas further concentrates ions, particularly chloride ions. The chemical characteristics of water in the mountainous and alluvial plain regions are mainly influenced by lithological changes, with lower ion concentrations in surface water and groundwater. Downstream in the plains, groundwater carries the filtration process to the surface, making it a dominant factor in the area characterized by groundwater–surface water interactions. In the lake area, intense evaporation leads to significant changes in the chemical properties of both surface water and groundwater, resulting in a substantial increase in ion concentrations, dominated by the effects of evaporation. Therefore, weathering in mountainous areas, precipitation leaching, water–rock interactions during surface water–groundwater conversion processes, and the exchange of chemical components play vital roles in providing salt sources to terminal lakes. This is the reason for the differences in the chemical types of water in Keluke Lake during the summer and winter seasons.
It is evident that the salt content in East Dabson Lake and Lake Tuosu does not solely originate from surrounding freshwater sources. In the central and western parts of the QB, there is a widespread occurrence of oilfield brine in the Jurassic–Cretaceous strata at depths ranging from 500 to 1500 m [49]. Research indicates that chloride-type waters from Qarhan Salt Lake are distributed in the northern and northeastern regions, and the northern edge of the salt lake is marked by a fault distribution (Figure 1b), most likely providing a pathway for deep subsurface water [50]. To analyze the potential sources of replenishment around East Dabson Lake, deep brine water pumped from the northeastern region was collected. The brine water is primarily of the CaCl2 type with a TDS concentration of 281.5~417.2 g/L (Appendix A Table A2 and Table A3). In contrast, water recharged by rivers is rich in HCO3, SO42−. Therefore, a comparison is made by plotting the Ca2+-SO42−-HCO3 ternary diagram for different water bodies in the lake area (Figure 13a). It shows that whether in summer or winter, the sampling points of the lake water are closer to those of the brine, suggesting that the lake water receives deep-seated brine. Another compelling piece of evidence is that bromide ions were not detected in any of the river water samples (detection limit: 0.04 mg/L). This would result in all water samples with a Cl concentration greater than 40 mg/L exhibiting a Cl/Br ratio exceeding 1000, which may be indicative of the dissolution halite [51,52]. In the brine and lake, the Br ranges from 1.13 to 12.9 mg/L, with a Cl/Br ratio exceeding 10,000, indicating that the lake is supplied with brine.
Further analyses were conducted using the δD-δ18O relationship (Figure 13b). Water in Zone 1 corresponds to surface and groundwater in the Golmud River watershed and falls along the meteoric water line, indicating that it primarily originates from precipitation in the Kunlun Mountains. Zone 2 represents brine water and winter lake water, both of which fall along the evaporation line, indicating minimal precipitation influence. Summer lake water is distant from Zone 2, suggesting significant evaporation during the summer. The contribution of deep-seated fissure water leads to similar chemical types in East Dabson Lake during both summer and winter seasons. The simultaneous mixing of river water and groundwater leads to the precipitation of MgSO4 evaporites and low sulfate content [53], and its desulfurization process results in a slightly acidic pH.
To analyze the salt sources of Tuosu Lake, the chemical test results of surface water, groundwater, and water from the upstream connected stream, Keluke Lake and rivers are analyzed separately (Table 4). It is observed that the concentrations of F and CO32− in Lake Tuosu are higher than those in the upstream water bodies, while the concentration of Ca2+ is lower, indicating the substitution of F with CaCO3. Additionally, during the summer, there is a sudden increase in concentrations of Mg2+, Na+, Al3+, and Fe2+, suggesting the presence of other rocks in the vicinity of Lake Tuosu that undergo dissolution and precipitation due to water–rock interactions under high-temperature conditions. Previous research indicates that low hills and hillsides with mud volcanoes are distributed on the northeast side of Tuosu Lake, and the formation of Keluke Lake is influenced by the movement of the Himalayas. With the intrusion of magma and the effects of reverse thrust and overthrust structures, significant uplift was seen to occur in the Tertiary strata, leading to the division of Lian Lake into two areas [54]. Therefore, the sources of salt in Tuosu Lake may not only be related to surrounding freshwater replenishment, but also to the presence of lava when the lake formed.

5. Conclusions

Based on the sampling, testing, and research conducted on the hydrochemistry and isotopic spatiotemporal variations in river water, lake water, and groundwater in five typical watersheds of the QB, the following main conclusions have been drawn:
(1)
Spatially, there are significant differences in pH and HCO3 across various watersheds. The hydrochemical types of river water and groundwater in the northern region are HCO3·Cl·SO4-Na·Ca, while those in the southern region are of the Cl·SO4-Na·Ca type. The terminal lake of Bayin River is of the Cl·SO4-Na type, and Golmud River is of the Cl-Na·Mg type. These differences arise primarily due to significant variations in the lithology of the aquifers. The southern basin is more strongly influenced by the dissolution and evaporation of saline rocks, while the northern basin is influenced by carbonate weathering. There are significant differences in H-O isotopes, as the water vapor sources in the southern and northern basins are different. The southern basin receives a greater contribution of water vapor transported by the mid-latitude westerlies, while water vapor in the northern basin mainly results from local evaporation;
(2)
Temporally, there are distinct seasonal differences in water temperatures and δ18O in the two watersheds, as well as TDS, HCO3, and δD in the Golmud River watershed. River water, groundwater, and water from Keluke Lake exhibit significant seasonal differences with respect to hydrochemical types. During the winter, there is a depletion of Ca2+, Cl, and SO42− and an enrichment of HCO3, Mg2+, and Na+ compared to the summer. These variations arise from different hydrochemical influences in the summer and winter seasons, with the water body being more affected by water–rock interactions in the summer. There are significant seasonal differences in H-O isotopes in Golmud River due to the substantial seasonal differences in the effective evaporation rate and the water vapor recycling rate in the southern basin;
(3)
Similar characteristics of river water and groundwater are attributed to frequent transformations between surface water and groundwater from the river mouth to the terminal lake. Geological structures, strata, and topography are controlling factors, and seasonal hydro-meteorological conditions influence localized transformation relationships. The minimal seasonal impact on the salt content of terminal lakes is mainly due to the effects of salt accumulation, and this is supplemented via other sources of groundwater. The leaching action of upstream river water and groundwater and intense downstream evaporation contribute to a portion of the salt content in the terminal lake. However, East Dabson Lake is also influenced by deep-seated fissure water from the northern oil fields, while the salt source of Tuosu Lake may be related to the surrounding volcanoes present during the formation of the lake.

Author Contributions

Conceptualization, H.Y. and J.W.; methodology, H.Y. and K.S.; formal analysis, H.Y.; investigation, H.Y.; data curation, H.Y. and K.S.; writing—original draft preparation, H.Y.; writing—review and editing, J.W. All authors have read and agreed to the published version of the manuscript.

Funding

This research was funded by the Major Science and Technology Project of Qinghai Province, titled “rediction and Risk Assessment of Key River-Lake Water Changes on the Qinghai-Tibet Plateau (Qinghai)” grant number 2021-SF-A6.

Data Availability Statement

Data are contained within the article and appendix.

Acknowledgments

Thanks to the Hydrological and Water Resources Survey Center and the Natural Resources Museum of Qinghai Province for providing data and information support.

Conflicts of Interest

The authors declare no conflicts of interest.

Appendix A

Table A1. Supplementing the collection of precipitation H-O isotope data.
Sample NumberLocationLongitude LatitudeSampling Dateδ18O/‰δD/‰Attribution
P1Golmud95.09136.3461 July 20101.8921.06[45]
P2Golmud95.09136.3465 July 2010−1.92−4.60
P3Golmud95.09136.3465 July 2010−1.94−6.28
P4Golmud95.09136.3468 July 2010−7.79−56.96
P5Golmud95.09136.34628 July 2010−10.48−95.39
P6Golmud95.09136.3462 August 2010−5.95−48.53
P7Golmud95.09136.34610 August 2010−0.24−28.08
P8Golmud95.09136.34616 August 2010−6.93−67.51
P9Golmud95.09136.34615 September 2010−0.32−19.69
P10Golmud95.09136.34618 September 2010−14.88−110.38
P11Golmud95.09136.34620 September 2010−12.02−124.00
P12Golmud95.09136.34624 September 2010−16.23−125.42
P13Golmud95.09136.34627 September 2010−9.01−66.43
P14Golmud94.56335.874June to September 2019−10.77−67.21[43]
P15Delingha96.8237.4826 July 2019−3.28−17.54This article
P16Delingha96.8237.4827 July 2019−2.39−13.19
P17Delingha96.8237.4829 July 20191.0911.74
P18Delingha96.8237.483 August 2019−0.08−4.19
P19Delingha96.8237.484 August 2019−2.00−6.62
P20Delingha96.8237.485 August 2019−2.25−22.85
P21Delingha96.8237.486 August 2019−5.42−37.98
P22Delingha96.8237.4811 August 2019−4.12−18.06
P23Delingha96.8237.4812 August 2019−2.222.62
P24Delingha96.8237.4827 August 2019−2.28−21.45
P25Delingha96.8237.4829 August 2019−6.55−37.88
P26Delingha97.46437.9021 July 2018−1.81−16.24
P27Delingha97.34537.3661 July 20186.43−45.32
P28Delingha97.34537.3663 June 20220.0010.45
P29Delingha97.34537.3667 September 2022−2.267.31
P30Delingha97.34537.36624 August 2022 −14.10−93.61
P31Delingha97.34537.36622 August 2022−15.55−113.32
P32Delingha97.34537.36620 June 2022−5.15−19.22
P33Delingha97.34537.3667 July 2022−5.23−23.33
P34Delingha97.34537.36625 June 20220.3115.60
P35Delingha97.34537.36616 July 2022−4.51−14.92
P36Delingha97.34537.36618 July 2022−9.32−48.90
P37Delingha97.50637.93326 May 20222022/5/26−7.26−40.40
P38Delingha97.37037.3191 December, 2018−34.14−241.71
P39Delingha97.37037.3191 December, 2018−23.43−177.03
P40Delingha97.28437.349June to September 2010−7.85−51.00[45]
Table A2. Statistical results of water temperature (T), pH, TDS, SAL values, ionic concentrations and isotopic compositions of various water bodies in five typical watersheds of Qaidam Basin in summer (the unit of T is °C, the unit of SAL is ppt, the unit of ionic concentration and TDS is mg/L, the unit of δ18O and δD is ‰).
WatershedValueT/°CpHTDSSALFClNO3SO42−CO32−HCO3Ca2+K+Mg2+Na+δDδ18O
Yuqia RiverMin.7.97.7162.20.10.239.50.012.60.042.010.31.03.133.1−78.7−11.4
Max.20.19.9978.60.822.2415.926.5450.213.9309.8107.211.869.5261.6−66.8−9.9
Mean11.98.5462.10.41.3129.83.6137.90.8142.047.93.917.492.6−71.9−10.7
SD3.00.4210.10.23.695.65.0119.93.245.919.52.413.063.93.40.4
Bayin RiverMin.8.17.6190.00.00.022.70.037.60.061.219.61.814.038.8−76.5−10.4
Max.25.69.718,152.717.221.18306.0162.45956.5200.0731.6251.4136.01019.06008.00.01.6
Mean13.58.21020.90.80.8378.311.9315.63.2195.464.87.551.2246.6−56.9−8.2
SD4.50.42366.92.22.91189.423.3848.224.889.030.518.8130.5783.510.21.7
Chanhanwusu
River
Min.7.17.8849.00.70.3263.40.110.20.032.983.36.414.8189.9−90.3−12.4
Max.19.68.91556.81.24.71077.634.6604.40.0258.2175.09.436.7474.1−64.2−9.7
Mean11.08.21123.00.90.7547.711.2332.50.0180.8111.47.424.6260.2−78.2−11.1
SD3.10.3201.30.20.9220.89.1152.30.055.621.10.85.671.15.60.6
Xiangride RiverMin.4.07.6163.50.10.16.30.08.80.043.015.64.213.788.2−73.2−10.5
Max.23.39.31202.50.92.9356.950.9606.313.9330.4113.013.963.4241.4−51.6−5.6
Mean12.78.4689.90.50.4189.68.8241.91.3196.462.96.034.9122.6−64.2−8.9
SD4.40.5189.60.20.568.910.2112.13.961.023.72.19.935.95.51.2
Golmud RiverMin.7.87.2378.80.30.156.20.061.10.039.86.62.820.350.3−71.2−10.3
Max.20.79.8282,277.1261.819.7173,154.0256.25813.731.0707.83290.03248.048,900.081,780.0−5.15.7
Mean13.98.69829.89.01.05839.520.2415.72.7196.0147.8110.91617.22775.7−61.0−8.3
SD3.50.650,565.646.93.531,053.062.61039.77.2111.4583.7582.28775.414,662.912.22.8
Qaidam Basin
(5 watersheds)
Min.4.07.2162.20.00.06.30.08.80.032.96.61.03.133.1−90.3−12.4
Max.25.69.9282,277.1261.822.2173,154.0256.25956.5200.0731.63290.03248.048,900.081,780.00.05.7
Mean12.88.42324.42.00.81215.311.1286.82.0184.180.223.6297.0612.7−64.2−9.2
SD4.00.520,630.619.12.712,627.429.5659.515.080.9237.5236.73564.55969.711.12.0
BrineMin.17.66.7281,468.7253.212.2180,546.522.32994.70.0704.61289.43790.032,520.046,280.0−38.8−1.4
Max.20.37.8417,249.5375.417.4211,549.532.64409.00.0795.62862.012,604.057,340.074,300.0−23.60.2
Mean19.07.1369,910.7332.814.3198,443.828.13907.20.0741.41857.87497.548,160.064,035.0−28.2−0.7
SD1.20.562,814.456.52.413,318.24.5628.20.039.1691.83694.211,434.612,441.17.10.7
Table A3. Statistical results of water temperature (T), pH, TDS, SAL values, ionic concentrations and isotopic composition of various water bodies in Bayin River and Golmud River watershed in winter (the unit of T is °C, the unit of SAL is ppt, the unit of ionic concentration and TDS is mg/L, and the unit of δ18O and δD is ‰).
WatershedValueTpHTDSSALFClNO3SO42−CO32−HCO3Ca2+K+Mg2+Na+δDδ18O
Bayin RiverMin.−0.26.9344.10.00.743.50.332.00.036.427.13.018.442.5−94.2−13.1
Max.8.19.75508.94.63.11848.311.11027.368.4335.4120.641.2298.91709.0−40.3−5.4
Mean3.18.4888.20.61.2232.95.7151.64.0206.766.76.551.6204.1−59.5−9.5
SD3.00.51087.81.00.6396.52.7216.814.165.426.77.560.4370.09.61.4
Golmud RiverMin.−5.57.9479.20.40.868.30.545.30.061.411.84.732.584.6−72.5−11.5
Max.9.19.4195,635.7175.84.9103,499.322.84820.8111.0432.51255.02562.025,500.026,990.0−39.5−3.0
Mean2.18.710,966.59.81.45598.36.5342.017.2236.6106.6192.81388.61571.8−64.9−9.6
SD3.60.444,720.240.20.923,708.05.41085.025.066.6278.3617.15838.96155.67.52.0
BrineValue2.2 7.3 274,318.1253.8 172,651.2349.5 44.3 3924.9 0.0 671.4 1018.0 3744.0 30,620.0 64,840.0 −43.0−4.0

References

  1. Yin, J.; Wei, J.; Li, Q.; Ayantobo, O.O. Regional Characteristics and Impact Factors of Change in Terrestrial Water Storage in Northwestern China from 2002 to 2020. IEEE J. Sel. Top. Appl. Earth Obs. Remote Sens. 2023, 16, 386–398. [Google Scholar] [CrossRef]
  2. Chen, Y.; Li, Z.; Xu, J.; Shen, Y.; Xing, X.; Xie, T.; Li, Z.; Yang, L.; Xi, H.; Zhu, C.; et al. Changes and Protection Suggestions in Water Resources and Ecological Environment in Arid Region of Northwest China. Bull. Chin. Acad. Sci. 2023, 38, 385–393. [Google Scholar] [CrossRef]
  3. Abbas, M.; Zhao, L.; Wang, Y. Perspective Impact on Water Environment and Hydrological Regime Owing to Climate Change: A Review. Hydrology 2022, 9, 203. [Google Scholar] [CrossRef]
  4. Zhang, X.; Chen, J.; Chen, J.; Ma, F.; Wang, T. Lake Expansion under the Groundwater Contribution in Qaidam Basin, China. Remote Sens. 2022, 14, 1756. [Google Scholar] [CrossRef]
  5. Wei, L.; Jiang, S.; Ren, L.; Tan, H.; Ta, W.; Liu, Y.; Yang, X.; Zhang, L.; Duan, Z. Spatiotemporal changes of terrestrial water storage and possible causes in the closed Qaidam Basin, China using GRACE and GRACE Follow-On data. J. Hydrol. 2021, 598, 126274. [Google Scholar] [CrossRef]
  6. Fan, Q.; Cheng, Y.; Chen, T.; Xu, N. Influence of Water Replenishment of Lakes in the Northern Qaidam Basin on Salt Lake Resources and Ecological Environment. J. Salt Lake Res. 2022, 30, 11–18. [Google Scholar]
  7. Zhao, D.; Wang, G.; Liao, F.; Yang, N.; Jiang, W.; Guo, L.; Liu, C.; Shi, Z. Groundwater-surface water interactions derived by hydrochemical and isotopic (222Rn, deuterium, oxygen-18) tracers in the Nomhon area, Qaidam Basin, NW China. J. Hydrol. 2018, 565, 650–661. [Google Scholar] [CrossRef]
  8. Lv, A.; Zhang, C. Analysis of the Characteristics and Driving Forces of Changes in Lake Water Volume in Inland Arid Basins in China. Water 2022, 14, 3141. [Google Scholar] [CrossRef]
  9. Yang, N.; Wang, G.; Shi, Z.; Zhao, D.; Jiang, W.; Guo, L.; Liao, F.; Zhou, P. Application of Multiple Approaches to Investigate the Hydrochemistry Evolution of Groundwater in an Arid Region: Nomhon, Northwestern China. Water 2018, 10, 1667. [Google Scholar] [CrossRef]
  10. Wang, Y.; Guo, H.; Li, J. Investigation and evaluation of groundwater resources and environmental problems in Qaidam Basin. In Investigation and Evaluation of Groundwater Resources and Environmental Problems in Qaidam Basin; Geological Publishing House: Beijing, China, 2008; pp. 49–211. [Google Scholar]
  11. Yang, N.; Zhou, P.; Wang, G.; Zhang, B.; Shi, Z.; Liao, F.; Li, B.; Chen, X.; Guo, L.; Dang, X.; et al. Hydrochemical and isotopic interpretation of interactions between surface water and groundwater in Delingha, Northwest China. J. Hydrol. 2021, 598, 126243. [Google Scholar] [CrossRef]
  12. Xiao, Y.; Shao, J.; Cui, Y.; Zhang, G.; Zhang, Q. Groundwater circulation and hydrogeochemical evolution in Nomhon of Qaidam Basin, northwest China. J. Earth Syst. Sci. 2017, 126, 26. [Google Scholar] [CrossRef]
  13. Han, J.; Xu, J.; Yi, L.; Chang, Z.; Wang, J.; Ma, H.; Zhang, B.; Jiang, H. Seasonal Interaction of River Water-Groundwater-Salt Lake Brine and Its Influence on Water-Salt Balance in the Nalenggele River Catchment in Qaidam Basin, NW China. J. Earth Sci. 2022, 33, 1298–1308. [Google Scholar] [CrossRef]
  14. Zhang, C.; Lv, A.; Jia, S.; Qi, S. Longterm multisource satellite data fusion reveals dynamic expansion of lake water area and storage in a hyperarid basin of China. J. Hydrol. 2022, 610, 127888. [Google Scholar] [CrossRef]
  15. Li, W.; He, Q. Discussion on the Origins of the Materials in Qarhan Salt Lake. J. Hebei Coll. Geol. 1993, 16, 254–263. [Google Scholar]
  16. Zhang, X.; Fan, Q.; Li, Q.; Du, Y.; Qin, Z.; Wei, H.; Shan, F. The Source, Distribution, and Sedimentary Pattern of K-Rich Brines in the Qaidam Basin, Western China. Minerals 2019, 9, 655. [Google Scholar] [CrossRef]
  17. Yi, J.; Fan, Q.; Wei, H.; Wang, M.; Qin, Z.; Yuan, Q.; Shan, F. The Characteristics of the Mineral Assemblage and the Forming Clue in Qarhan Salt Lake. J. Salt Lake Res. 2017, 25, 47–54. [Google Scholar]
  18. Li, J.; Chen, F.; Ling, Z.; Li, T. Lithium sources in oilfield waters from the Qaidam Basin, Tibetan Plateau: Geochemical and Li isotopic evidence. Ore Geol. Rev. 2021, 139, 104481. [Google Scholar] [CrossRef]
  19. Chen, L.; Ma, T.; Ma, J.; Du, Y.; Xiao, C. Identification of material source for the salt lakes in the Qaidam Basin. Hydrogeol. Eng. Geol. 2015, 42, 101–107. [Google Scholar] [CrossRef]
  20. Zhang, X.; Li, Q.; Qin, Z.; Fan, Q.; Du, Y.; Wei, H.; Gao, D.; Shan, F. Boron isotope geochemistry of a brine-carbonate system in the Qaidam Basin, western China. Sediment. Geol. 2019, 383, 293–302. [Google Scholar] [CrossRef]
  21. Li, Q.; Fan, Q.; Wang, J.; Qin, Z.; Zhang, X.; Wei, H.; Du, Y.; Shan, F. Hydrochemistry, Distribution and Formation of Lithium-Rich Brines in Salt Lakes on the Qinghai-Tibetan Plateau. Minerals 2019, 9, 528. [Google Scholar] [CrossRef]
  22. Zhu, Y.; Zhong, J.; Li, W. The Neotectonic Movement and the Evolution of Saline Lakes of Qaidam Basin in Northwestern China. In The Neotectonic Movement and the Evolution of Saline Lakes of Qaidam Basin in Northwestern China; Geological Publishing House: Beijing, China, 1994; pp. 90–99. [Google Scholar]
  23. Hussainzadeh, J.; Samani, S.; Mahaqi, A. Investigation of the geochemical evolution of groundwater resources in the Zanjan plain, NW Iran. Environ. Earth Sci 2023, 82, 123. [Google Scholar] [CrossRef]
  24. Kileshye Onema, J.-M.; Taigbenu, A.E.; Ndiritu, J. Classification and flow prediction in a data-scarce watershed of the equatorial Nile region. Hydrol. Earth Syst. Sci. 2012, 16, 1435–1443. [Google Scholar] [CrossRef]
  25. Yang, H.; Wei, J.; Ren, Q. Interaction between surface water and groundwater and hydrochemical characteristics in the typical watersheds of the Qaidam Basin. Arid Zone Res. 2022, 39, 1543–1554. [Google Scholar] [CrossRef]
  26. Alomari, A.H.; Carvalho, F.P.; Saleh, M.A.; Al-Malkawi, G.; Hashim, S.; Bilbiesy, E.; Banikhalaf, R.; Al-Sayaheen, A.; Abosalim, F.; Sharat, D.; et al. Seasonal Variation In Major Ions Chemistry and Radionuclide Concentrations In Groundwater: A Case Study In The Amman-Zarqa Basin (Jordan). Water Air Soil Pollut. 2023, 234, 256. [Google Scholar] [CrossRef]
  27. Caporaso, J.G.; Kuczynski, J.; Stombaugh, J.; Bittinger, K.; Bushman, F.D.; Costello, E.K.; Fierer, N.; Peña, A.G.; Goodrich, J.K.; Gordon, J.I.; et al. QIIME allows analysis of high-throughput community sequencing data. Nat. Methods 2010, 7, 335–336. [Google Scholar] [CrossRef] [PubMed]
  28. Piper, A.M. A graphic procedure in the geochemical interpretation of water-analyses. Trans. AGU 1944, 25, 914. [Google Scholar] [CrossRef]
  29. Shi, K.; Li, T.; Zhao, J.; Su, Y.; Gao, J.; Li, J. Atmospheric recycling of agricultural evapotranspiration in the Tarim Basin. Front. Earth Sci. 2022, 10, 950299. [Google Scholar] [CrossRef]
  30. Zhang, Y.; Xu, J.; Yan, Y.; Su, W.; Luo, P.; Yu, H. Characteristics and Moisture Sources of the StableIsotopes in Precipitation at the Monsoon MarginalRegion of North-Central China. Pol. J. Environ. Stud. 2022, 31, 1963–1974. [Google Scholar] [CrossRef]
  31. Gibbs, R.J. Mechanisms Controlling World Water Chemistry. Sci. New Ser. 1970, 170, 1088–1090. [Google Scholar] [CrossRef]
  32. Van Der Ent, R.J.; Savenije, H.H.G.; Schaefli, B.; Steele-Dunne, S.C. Origin and fate of atmospheric moisture over continents. Water Resour. Res. 2010, 46, 2010WR009127. [Google Scholar] [CrossRef]
  33. Van Der Ent, R.J.; Tuinenburg, O.A.; Knoche, H.-R.; Kunstmann, H.; Savenije, H.H.G. Should we use a simple or complex model for moisture recycling and atmospheric moisture tracking? Hydrol. Earth Syst. Sci. 2013, 17, 4869–4884. [Google Scholar] [CrossRef]
  34. Shi, K.; Lang, Q.; Huang, Y.; Zhao, J.; Wang, H.; Chen, G.; Zhang, Q.; Yin, H.; Su, Y.; Wang, P. Analysis of the water-vapor sources in rainstorm processes in Tianjin city based on the trajectory method. Atmos. Sci. Lett. 2023, e1196. [Google Scholar] [CrossRef]
  35. Yang, K.; Tang, Q.; Lu, H. Analysis of precipitation recirculation rate and water vapor sources in Tibetan Plateau. Sci. Sin. Terrae 2022, 52, 574–578. [Google Scholar]
  36. Miao, Q.; Li, X.; Xu, Y.; Liu, C.; Xie, R.; Lv, Z. Chemical characteristics of groundwater and source identification in a coastal city. PLoS ONE 2021, 16, e0256360. [Google Scholar] [CrossRef] [PubMed]
  37. Yang, N.; Wang, G. Spatial variation of water stable isotopes of multiple rivers in southeastern Qaidam Basin, northeast Qinghai-Tibetan Plateau: Insights into hydrologic cycle. J. Hydrol. 2024, 628, 130464. [Google Scholar] [CrossRef]
  38. Zhang, Y.; Tan, H.; Cong, P.; Shi, D.; Rao, W.; Zhang, X. Isotopic variations in surface waters and groundwaters of an extremely arid basin and their responses to climate change. Hydrol. Earth Syst. Sci. 2023, 27, 4019–4038. [Google Scholar] [CrossRef]
  39. Dansgaard, W. Stable isotopes in precipitation. Tellus 1964, 16, 436–468. [Google Scholar] [CrossRef]
  40. Gu, W. Isotope Hydrology. In Isotope Hydrology; Science Press: Beijing, China, 2011; pp. 150–173. [Google Scholar]
  41. Froehlich, K.; Gibson, J.J. Deuterium excess in precipitation and its climatological significance. In Study of Environmentalchange Using Isotope Techniques; C&S Papers Series 13; International Atomic Energy Agency: Vienna, Austria, 2002; pp. 54–65. [Google Scholar]
  42. Yang, M.; Yao, T.; Tian, L.; Lu, A. Analysis of Precipitation From Different Water Vapor Sources in Tibetan Plateau. Sci. Geogr. Sin. 2004, 24, 426–431. [Google Scholar]
  43. Rao, W.; Li, Y.; Tan, H.; Li, Y.; Wen, C.; Zhang, X. Stable hydrogen-oxygen isotope composition and atmospheric moisture sources of precipitation in an arid-alpine region: A case study of the Golmud River Watershed on the north slope of the Kunlun Mountains. JHE 2021, 52, 1116–1125. [Google Scholar] [CrossRef]
  44. Yang, N.; Wang, G. Moisture sources and climate evolution during the last 30 kyr in northeastern Tibetan Plateau: Insights from groundwater isotopes (2H, 18O, 3H and 14C) and water vapour trajectories modeling. Quat. Sci. Rev. 2020, 242, 106426. [Google Scholar] [CrossRef]
  45. Zhu, J.; Chen, H.; Gong, G. Hydrogen and Oxygen Isotopic ompositions of Precipitation and Its Water Vapor Sources in Eastern Qaidam Basin. Environ. Sci. 2015, 36, 2784–2790. [Google Scholar] [CrossRef]
  46. Kiyani, V.; Esmaili, A.; Alijani, F.; Samani, S.; Vasić, L. Investigation of drainage structures in the karst aquifer system through turbidity anomaly, hydrological, geochemical and stable isotope analysis (Kiyan springs, western Iran). Environ. Earth Sci. 2022, 81, 517. [Google Scholar] [CrossRef]
  47. Zhao, Z.; Liu, Z.; Xu, W. Hydrogeological Survey of Alluvial Fan Water Supply in Bayin River, Delingha City, Qinghai Province; Qinghai Environmental Geology Exploration Bureau: Xining, China, 2017; pp. 35–42. [Google Scholar]
  48. Zhang, B.; Zhao, D.; Zhou, P.; Qu, S.; Liao, F.; Wang, G. Hydrochemical Characteristics of Groundwater and Dominant Water–Rock Interactions in the Delingha Area, Qaidam Basin, Northwest China. Water 2020, 12, 836. [Google Scholar] [CrossRef]
  49. Fan, Q.; Ma, H.; Tan, H.; Li, T. Geochemistry Characteristics of Sulfur Isotope in Oilfield Brine of the Western Qaidam Basin. Bull. Mineral. Petrol. Geochem. 2009, 28, 137–142. [Google Scholar]
  50. Duan, Z.; Yuan, J. The Origin of Saline Materials of Qarhan Salt Lake in Qaidam Basin, China. Geoscience 1988, 2, 420–428. [Google Scholar]
  51. Davis, S.N.; Whittemore, D.O.; Fabryka-Martin, J. Use of ChlorideBromide Ratios in Studies of Potable Water. Groundwater 1988, 36, 338–350. [Google Scholar] [CrossRef]
  52. Alcalá, F.J.; Custodio, E. Using the Cl/Br ratio as a tracer to identify the origin of salinity in aquifers in Spain and Portugal. J. Hydrol. 2008, 359, 189–207. [Google Scholar] [CrossRef]
  53. Li, Q.; Fan, Q.; Wei, H.; Qin, Z.; Zhang, X.; Du, Y.; Shan, F. Sulfur isotope constraints on the formation of MgSO4−deficient evaporites in the Qarhan salt Lake, western China. J. Asian Earth Sci. 2020, 189, 104160. [Google Scholar] [CrossRef]
  54. Yao, S.; Zhang, J.; Li, W.; Li, H. Preliminary Investigation and Study on the Characteristics of Mud Volcanoes and the Cause of Tuosuo and Keluke Lakes in Lian Lake Area, Delingha. Northwest. Geol. 2016, 49, 155–163. [Google Scholar]
Figure 1. Overview map of QB: (a) digital elevation map; (b) comprehensive hydrogeological profile (revised according to reference [10]): A−A′ profile represents the cross-section from the front of the Kunlun Mountains to the Tataling River.
Water 16 00169 g001
Figure 2. Sampling point distribution map: (a) Yuqia River; (b) Bayin River; (c) Chahanwusu River; (d) Xiangride River; and (e) Golmud River: B−B′ profile represents the cross-section from the outlet of Bayin River to the terminal lake area.
Water 16 00169 g002
Figure 3. Physical and chemical parameters and the H−O isotope of water bodies in summer: (a) water temperature; (b) pH; (c) TDS; (d) SAL; (e) Cl; (f) NO3; (g) F; (h) SO42−; (i) CO32−; (j) HCO3; (k) Ca2+; (l) K+; (m) Mg2+; (n) Na+; (o) δD; (p) δ18O. (Letters Symbols a, b, and c represent significant differences between each pair of data in the five groups. Identical letters indicate no significant difference, while different letters indicate a significant difference, with a significance level of 0.05).
Water 16 00169 g003
Figure 4. Differences in physicochemical parameters and HO isotopes between summer and winter: (a) Golmud River; (b) Bayin River. (The significance level is α = 0.05, with “***” representing p ≤ 0.001, “**” representing p ≤ 0.01, “*” representing p ≤ 0.05, and “n.s.” representing no significant difference).
Water 16 00169 g004
Figure 5. Piper ternary diagram of water bodies in different basins: (a) Yuqia River; (b) Bayin River; (c) Chahanwusu River; (d) Xiangride River; (e) Golmud River.
Water 16 00169 g005
Figure 6. Spatial variation of H-O isotopes in the surface water and groundwater of the QB: (a) δD of surface water; (b) δ18O of surface water; (c) δD of groundwater; (d) δ18O of groundwater: The arrows represent the spatial trend of H-O.
Water 16 00169 g006
Figure 7. Water vapor source of precipitation in the north and south of the QB (mm/y): (a) southern basin; (b) northern basin.
Water 16 00169 g007
Figure 8. Piper ternary diagram for different kinds of water in summer and winter: (a) Golmud River; (b) Bayin River.
Water 16 00169 g008
Figure 9. Gibbs plots of water bodies in the summer and winter: (a) Golmud River; (b) Bayin River.
Water 16 00169 g009
Figure 10. Comparison of the δ18O–δD relationship of water bodies in summer and winter: (a) Golmud River; (b) Bayin River.
Water 16 00169 g010
Figure 11. Surface water–groundwater interactions in the Bayin River: (a) δ18O; (b) Cl; (c) hydrogeological profile (Figure 2b B−B′. Revised according to reference [47]).
Water 16 00169 g011
Figure 12. Variation curves of main ions along the Bayin River from the mountain to terminal lake: (a) surface water; (b) groundwater.
Water 16 00169 g012
Figure 13. Analysis of different water sources in East Dabson Lake: (a) Ca2+−SO42−−HCO3 ternary diagram; (b) δD−δ18O relationship: 1 represents the area where river water and groundwater sampling points are located, and 2 represents the area where lake water and brine sampling points are located.
Water 16 00169 g013
Table 1. Hydrochemical types of the main water bodies in different watersheds.
NumberWatershedRiver and GroundwaterLake
(a)Yuqia RiverHCO3·Cl·SO4-Na·Ca/
(b)Bayin RiverHCO3·Cl·SO4-Na·CaCl·SO4-Na
(c)Chahanwusu RiverCl·SO4-Na·Ca /
(d)Xiangride RiverCl·HCO3·SO4-Na·Ca/
(e)Golmud RiverCl·HCO3-Na·CaClNa·Mg
Table 2. Statistical table of δ18O and d-excess.
Sampling LocationTypeδ18O/‰d-Excess/‰
MinMedianMaxMeanMinMedianMaxMean
GolmudRain−23.44−8.671.89−8.80−27.8611.6838.7010.61
River−9.65−8.49−5.31−8.362.657.8016.178.39
DelinghaRain−34.14−5.161.09−6.96−4.8211.6631.4512.01
River−9.03−8.18−4.83−7.871.709.1514.389.11
Table 3. Evaporation, precipitation, and water vapor internal circulation rates in summer and winter.
AreaSeasonTotal
Evaporation
Regional
Total
Precipitation
Regional
Total
Evaporation
Regional
Actual Total Evaporation
Effective Evaporation RateWater Vapor Loss RateRegional Water Vapor
Circulation Rate
mm/amm/amm/amm/a%%%
Southern basinSummer289.26296.3521.98219.8310.022.397.42
Winter33.8630.751.1621.865.23−9.613.79
Northern basinSummer113.65112.357.55126.095.907.066.05
Winter16.0916.060.4511.883.532.412.56
Table 4. Ion concentrations of different water bodies in the Bayin River watershed. Unit: mg/L.
Sample Name/TypeSeasonFCO32−Ca2+Mg2+Na+Al3+Fe2+
Tuosu LakeSummer0.65200.0219.601019.0060087.324 × 10−3
Winter1.2568.4447.34435.30170900
Connected streamSummer0.31027.73465.60204807 × 10−4
Winter0.8520.9669.0673.20177.3000
Keluke LakeSummer0.37059.8151.57123.5000
Winter0.79088.1150.64100.3000
River water (mean)Summer0.23068.4033.5964.4807.05 × 10−3
Winter1.01072.5745.2870.1404.55 × 10−5
Groundwater (mean)Summer0.28061.4252.34147.2906.98 × 10−2
Winter1.461.2860.1678.32211.5103.67 × 10−4
Disclaimer/Publisher’s Note: The statements, opinions and data contained in all publications are solely those of the individual author(s) and contributor(s) and not of MDPI and/or the editor(s). MDPI and/or the editor(s) disclaim responsibility for any injury to people or property resulting from any ideas, methods, instructions or products referred to in the content.

