Article

Adsorption Mechanism of Methylene Blue on Purified Red Phosphorus and Effects of Different Temperatures on Methylene Blue Desorption

College of Water Conservancy and Civil Engineering, Shandong Agricultural University, Tai’an 271018, China
*
Author to whom correspondence should be addressed.
Water 2024, 16(1), 167; https://doi.org/10.3390/w16010167
Submission received: 22 November 2023 / Revised: 9 December 2023 / Accepted: 27 December 2023 / Published: 31 December 2023

Abstract

:
Purified red phosphorus (RP) can be used as an adsorbent. However, the adsorption mechanism and reuse ability of purified RP have not been reported. This study utilized X-ray diffraction, Fourier transform infrared spectroscopy and scanning electron microscopy techniques (a statistical physics model and the standard molar free energy of formation) to investigate the adsorption mechanism of methylene blue (MB) by purified RP. Purification did not change commercial RP structure according to X-ray diffraction. The results showed that the adsorption process only included physical adsorption according to Fourier transform infrared spectroscopy and UV–vis diffuse reflection absorption spectra. The specific areas of commercial RP and purified RP were 0.02 cm3/g and 5.27 cm3/g, respectively. Thus, purified RP has a higher adsorption capacity compared with commercial RP. A statistical physics model showed that, as the temperature increased from 288 to 308 K, the qe, Dm and qsat of purified RP for MB increased from 179.87, 0.824 and 0.824 to 303.26 mg/g, 1.497 mol/kg and 1.497 mol/kg, respectively. The fitted values of ΔrSmθ, ΔrHmθ and ΔrGmθ were 104.38 J·mol−1·K−1, −2.7 × 10³ J·mol−1 and negative, respectively. Thus, according to adsorption energy, the adsorption of MB by purified RP was a spontaneous process, which was mainly driven by entropy increasing. Compared with neutral dye, the purified RP had higher adsorption ability for the cationic dye and anionic dye. As the purified RP dose increased from 30 to 150 mg, the adsorption capacity of purified RP increased. However, as the MB concentration and pH increased, the adsorption capacity of purified RP decreased. The purified RP had excellent reuse ability and high temperature desorption can be applied to obtain its reuse ability.

1. Introduction

Dyes are significantly synthetic chemical compounds and can chemically adhere to some materials (e.g., textiles, furs and plastics) to provide various colors [1,2,3]. Thus, dyes are widely used in different industrial sectors, such as paper and food. It is reported that more than 105 dyes have been applied in the printing, leather and food industries [4]. Based on the charge of the chromophore group dissolved in the aqueous solution, dyes can be classified into cationic dyes (e.g., methylene blue (MB), malachite green), nonionic dyes (e.g., cresol red (CR)) and anionic dyes (e.g., acid blue 93, methyl orange) [4]. Although dyes provide colors to human life, it is reported that about 100 tons of dye wastewater is discharged into the hydrosphere [5]. The dye wastewater has the characteristics of high organic content [6,7], complex components [8,9] and partially difficult degradation [10]. If dye wastewater is directly discharged without treatment, it will do harm to aquatic organisms and human beings [4]. Thus, the process of removing organic dyes from wastewater has aroused serious environmental concerns in the world.
Flocculation–coagulation [11], membrane separation, advanced oxidation processes [12,13] and biodegradation [14] have been applied to remove dyes from wastewater. However, these treatments have various shortcomings that limit their applications in dye wastewater. Flocculation–coagulation needs to add excessive chemical reagents and will produce massive sludge [15,16]. In addition, limitations of membrane separation include membrane fouling [17,18], frequent membrane cleaning [17,19] and so on. Advanced oxidation processes need to add excessive chemical reagents and may cause secondary pollution [20,21]. Advanced oxidation processes can produce peroxy-sulfate radicals, hydroxyl radicals and sulfate radicals. Although these radicals have the ability to degrade dyes, they can also oxidize halides (e.g., chloride and bromide) to reactive halogen species, such as dihalogen anion radical, halogen atoms, free halogen and halogen oxide radical. These reactive halogen species can react with natural organic matter to form disinfection byproducts, which are cytotoxic and genotoxic [22]. Furthermore, some advanced oxidation processes (e.g., photocatalytic oxidation, ultraviolet/peroxymonosulfate) require illumination [23,24], which faces the challenge of penetration through the thickness of wastewater. The main drawback of biodegradation is that the reduction of azo dyes usually generates aromatic amines [25], which cannot be degraded and function as biotoxins. Furthermore, tanks of biological treatment usually occupy a large footprint [26]. Due to its simple operation and low cost, adsorption has been considered one of the most promising technologies in wastewater treatment [27,28].
Adsorbents include activated carbon [29,30], sewage sludge [31,32], clay [33,34], agriculture waste [35] and so on. Red phosphorus (RP) is earth-abundant and has a high specific surface area and a porous structure [36]. Thus, RP should have excellent adsorbing ability. Yet, the adsorption mechanism of RP at the molecular level remains unanswered.
The recovery, decontamination and reuse ability of spent adsorbents will determine their reusability [37]. A good adsorbent should have desorption and reuse potency for wastewater treatment and reduce the cost of wastewater treatment [38]. The approaches to regenerate spent adsorbents include magnetic separation [39], solvent regeneration [40], advanced oxidation process [41] and so on. Because dyes do not have magnetic potency, magnetic separation cannot be applied to regenerate RP. Due to the addition of chemical reagents, solvent regeneration and advanced oxidation processes are not suitable for regenerating RP. Relevant studies have proven that the dye adsorption capacity increases as temperature increases [4,42]. However, whether thermal desorption is suitable to regenerate RP has not been studied and is worth investigating.
MB is a characteristic cationic dye and has excellent water solubility and color stability [43,44]; it is widely applied in manufacturing, such as paper, textile, printing and so on. Thus, MB was used in this study. The main objectives of this study are to (1) characterize the surface chemistry of purified RP before and after adsorption, (2) investigate the MB adsorption mechanism at the molecular level by using the statistical physical model and the effects of RP dose, MB dose and pH on MB adsorption and (3) study effects of different temperatures on MB desorption. This study will provide theoretical guidance and data support for the use of purified RP.

2. Materials and Methods

2.1. Chemicals

Commercial RP (98.5%), MB (90%), CR (97%), Congo red (98%) and ethanol (99.7%) were obtained from Aladdin (Shanghai, China). Other chemicals were above analytical grade and purchased from Aladdin as well (Shanghai, China). Ultrapure water was produced by a Milli-Q water purification system (18.2 MΩ·cm, Millipore, Wilmington, DE, USA).

2.2. Purification of Commercial RP

According to relevant studies [26,45,46], 2 g commercial RP was dispersed in 15 mL ultrapure water and mixed by a magnetic stirrer for 60 min at 900 rpm. The suspension was transferred into a Teflon-lined autoclave and then heated at 200 °C for 12 h in an oven. After that, the red product was washed twice with ultrapure water (4 mL) and ethanol (4 mL), respectively. Subsequently, the red product was dried to obtain purified RP.

2.3. Characterization

The X-ray diffraction (XRD) patterns of commercial RB and purified RB before and after adsorption were carried out using an X-ray diffractometer (X’Pert PRO MPD, Netherlands). The morphologies of commercial RB and purified RB were obtained by scanning electron microscopy (SEM, Sigma 300 SEM, Kyoto, Japan) with a scanning voltage of 5 kV. Fourier transform infrared spectroscopy (FTIR, IRAffinity-1, Shimadzu, Kyoto, Japan) spectra of commercial RB and purified RB before and after adsorption were recorded in the region of 400–4000 cm−1 with a resolution of 2 cm−1. In addition, ultraviolet–visible (UV–vis) spectra of the MB solution and the MB solution after adsorption were recorded using a UV-2540 spectrometer (Shimadzu, Japan) in the region of 400–800 nm with a resolution of 1 nm. The specific surface area and the pore size distributions were calculated by applying the Brunauer–Emmett–Teller theory (BET, Micromeritics Tristar 3000, Micromeritics, Norcross, GA, USA).

2.4. Experimental Procedures

Adsorption experiments were performed in a 150 mL conical flask, which was shaken (160 rpm) in the incubator (SHA-B, Changzhou, China). To investigate the MB adsorption mechanism at the molecular level, the purified RP (40 mg) was added to MB solution (dissolved in water, 100 mL, 40–160 mg/L) at 288, 298 and 308 K. After the adsorption reached equilibrium, 3 mL dispersion was taken and the clarified supernatant sample was obtained after centrifugation (3 min, 12000 rpm). To investigate the adsorption capacity for different dyes by purified RP, the cationic dye (MB), neutral dye (CR) and anionic dye (Congo red) were used in this study. The structural formulas of MB, CR and Congo red are presented in Figure S1. The purified RP and concentrations of different dyes were 40 mg and 90 mg/L (100 mL), respectively.
To investigate the effects of purified RB dose, MB dose and pH on adsorption, various doses of purified RP (20, 30, 40, 50 and 60 mg), MB (30, 60, 90, 120 and 150 mg/L, 100 mL), and different pH values (3, 5, 7, 9 and 11) were selected. After the adsorption reached equilibrium (purified RP = 40 mg, MB = 90 mg/L (100 mL), T = 308 K, pH = 7), the mixtures were rapidly filtered with a 0.22 μm glass fiber filter to obtain the adsorbent. The obtained adsorbent was then added to 100 mL ultrapure water to investigate the effects of temperature (338, 318, 298, and 278 K) on MB desorption. The concentration of MB was determined by a UV spectrophotometer (UV-2540, Shimadzu, Japan) at 664 nm. The removal of MB was calculated by Equation (1). The amount of MB adsorbed on purified RB at equilibrium (qe) was calculated by Equation (2).
Removal (%) = (C0Ct)/C0 × 100%
qe = (C0Ce)/m × V
where C0 and Ce (mg/L) are the initial and equilibrium concentrations of MB, respectively. Ct is the concentration of MB after t h adsorption, m (g) is the mass of the adsorbent and V (L) is the volume of the solution.

2.5. A Statistical Physics Model

The statistical physics model was selected to model the adsorption of MB on purified RP. For a single dye, this statistical physics model regarded the adsorption of MB on purified RP as the monolayer formation process [47]. Furthermore, the standard molar free energy of formation (ΔrGmθ) was used to characterize adsorption interactions. The expressions of the statistical physics model and ΔrGmθ are given by Equation (3) and Equation (4), respectively. The variables n, Dm, C1/2 and Kθ could be obtained by Mathcad fitting (Equation (5)).
qe = n × Dm/(1 + C1/2/Ce)
ΔrGmθ = ΔrHmθT × ΔrSmθ
ln(Kθ) = ΔrSmθ/R − ΔrHmθ/(R × T)
where n is the number of linked MB molecules per purified RP, Dm is the density of receptor sites, C1/2 is the half-saturation concentration, ΔrHmθ is the standard molar enthalpy, ΔrSmθ is the standard molar entropy change, T is the temperature, Kθ is the standard adsorption equilibrium constant and R is the molar gas constant (8.314 J·mol−1·K−1). Lastly, qsat is qe at saturation and can be calculated by Equation (6).
qsat = n × Dm

3. Results and Discussion

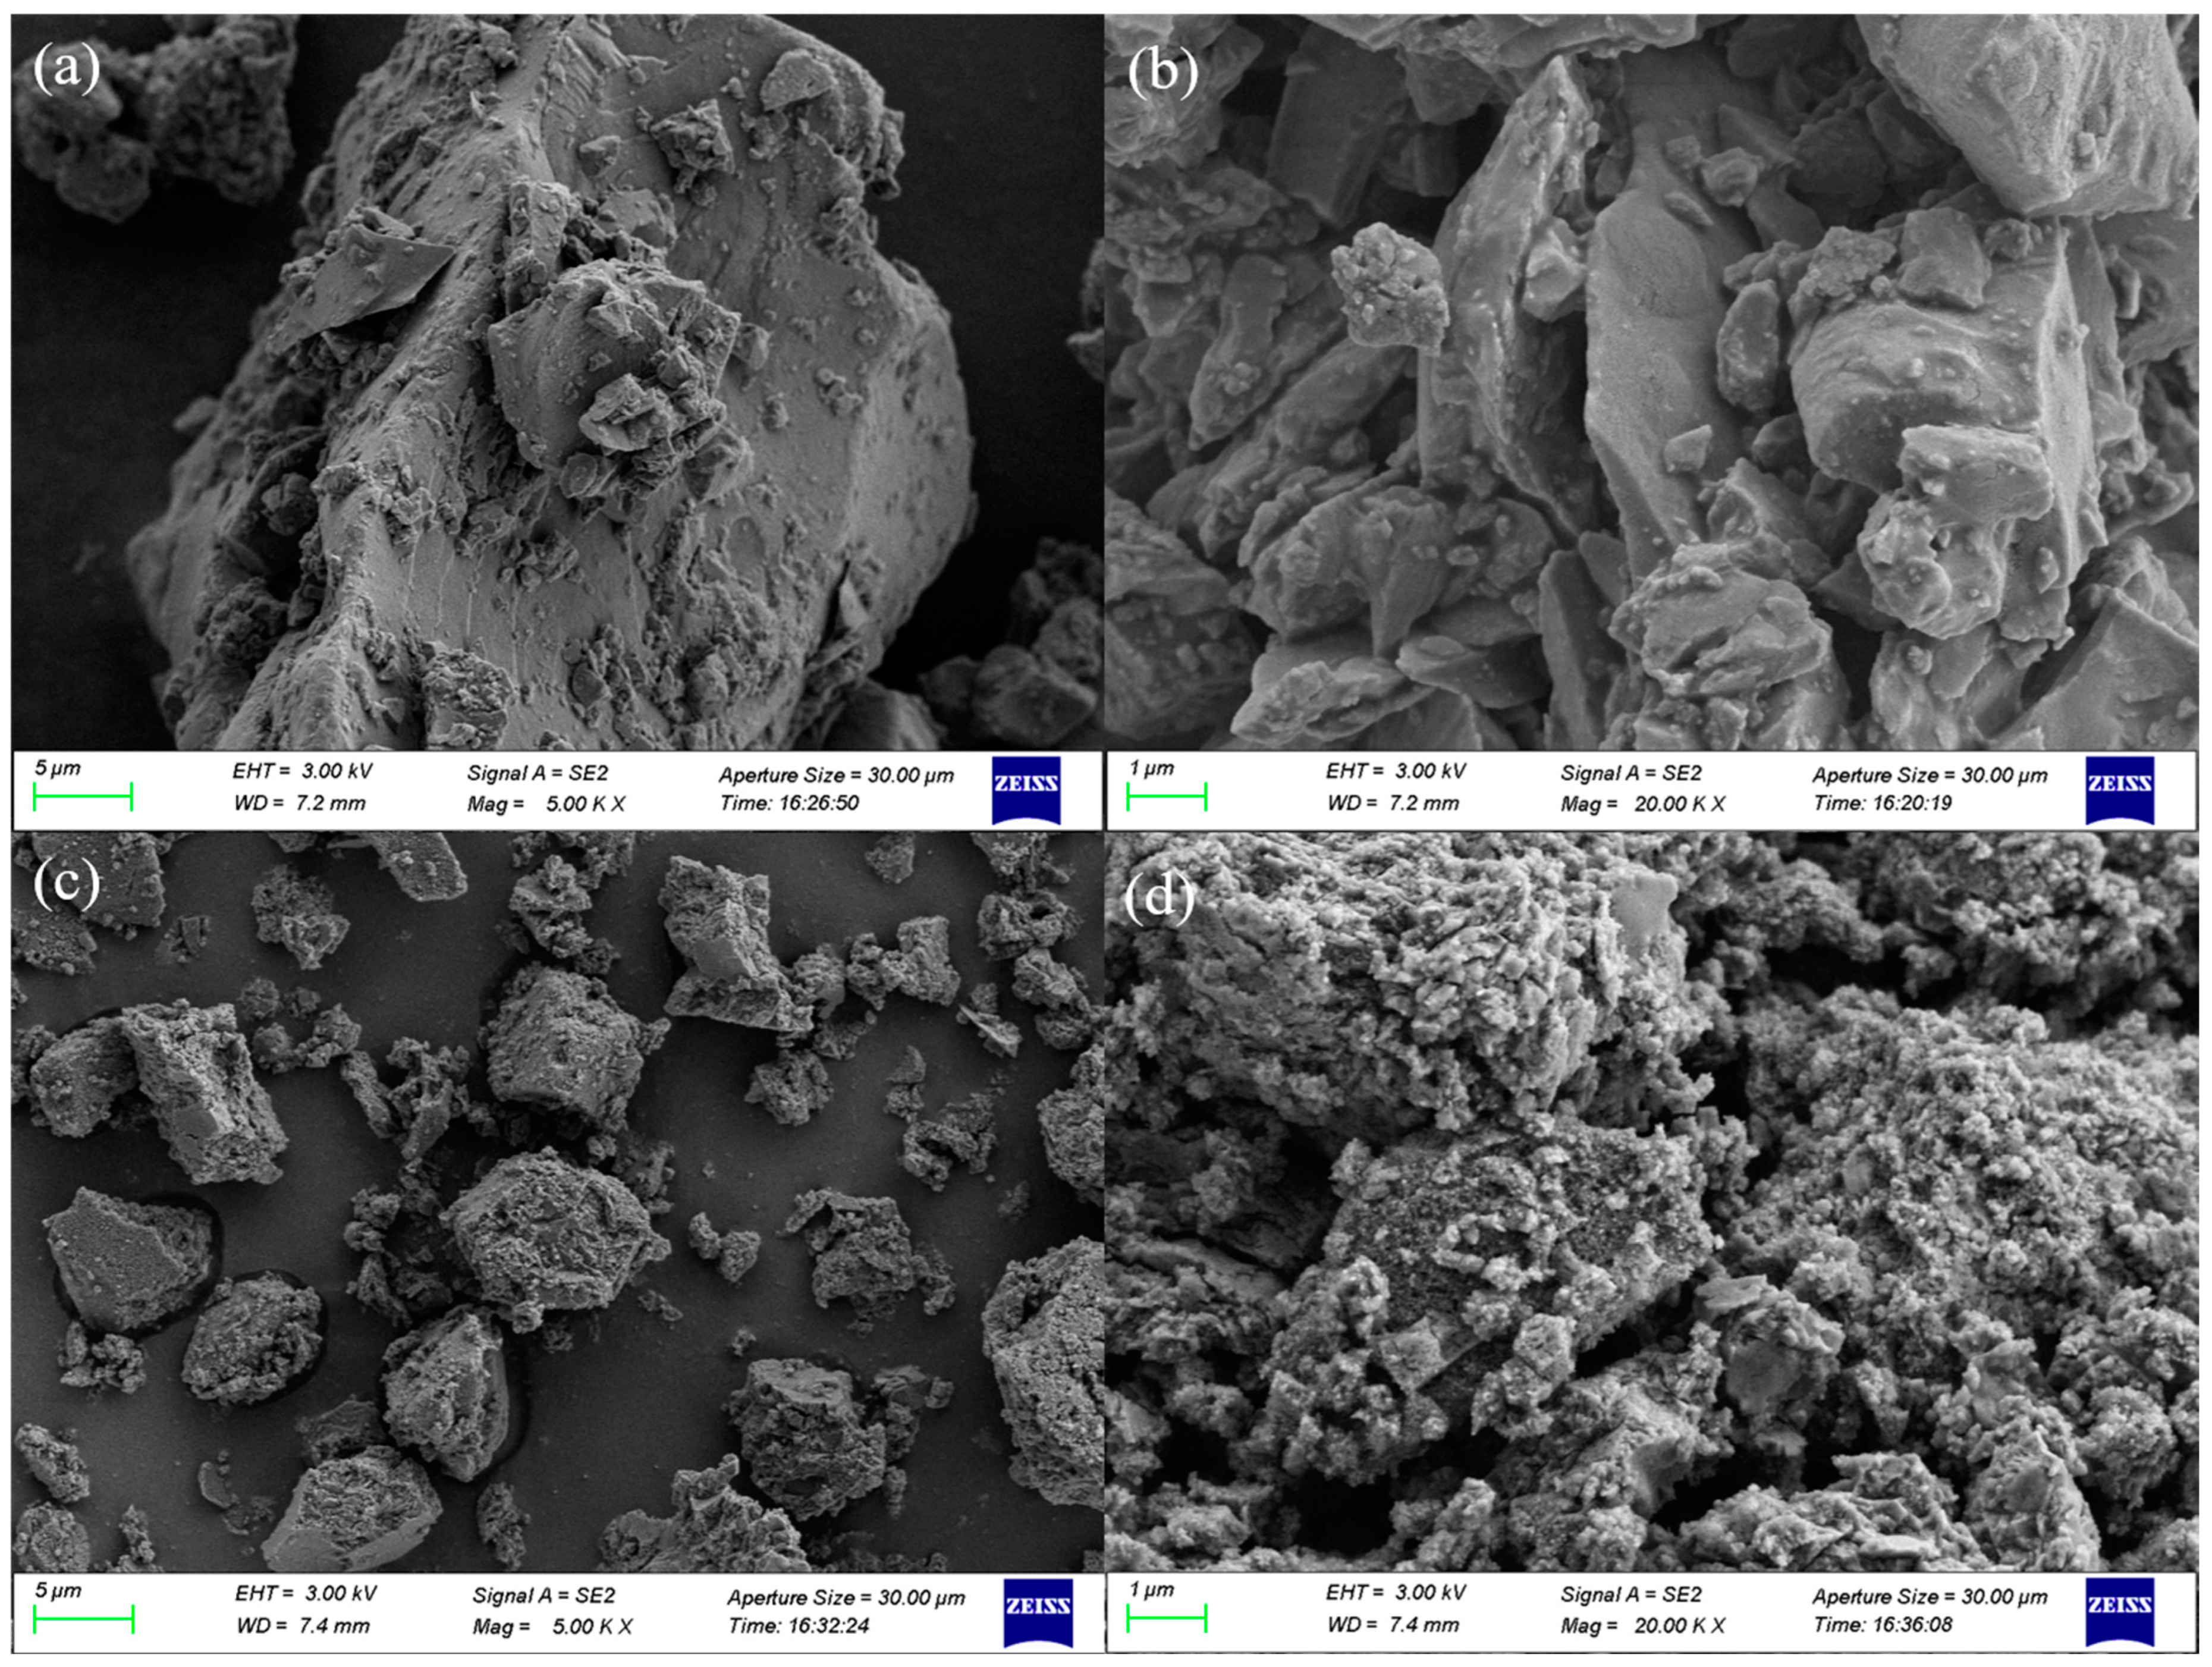
3.1. Characterizations of Purified RP before and after Adsorption of MB

XRD diffraction patterns of commercial RP and purified RP before and after adsorption of MB are shown in Figure 1a. The peak at 15.19° was observed in commercial RP and purified RP before and after adsorption of MB, which belonged to the amorphous structure of RP. The results showed that the purification of commercial RP did not change its structure. The purification of commercial RP only removes the oxygen-containing groups on the surface of RP. Thus, purification cannot change the structure of commercial RP. The XRD result of purified RP is consistent with a previous study in the literature [48]. Compared to purified RP, the introduction of MB could not change the structure of RP, which suggested that the adsorption process did not change the structure of purified RP.
FTIR spectra of the purified RP before and after adsorption of MB are shown in Figure 1b. For the purified RP, the absorption peak at 999 cm−1 was attributed to the P–P–O bond [48]. Moreover, the weak peak at 1170 cm−1 was ascribed to P–O bond [49]. The purified RP characteristic absorption peak is consistent with the previous study [49]. For the purified RB after adsorption of MB, peaks at 1633, 1485, 1394, 1041 and 879 cm−1 appeared, which were not found in the spectrum of purified RB. These peaks can be attributed to C=S, CH3 group, C–N, C–H and C–H bonds, respectively. FTIR spectra (Figure 1b) do not significantly change after the adsorption of MB. UV–vis diffuse reflection absorption spectra of the MB solution and the MB solution after adsorption are shown in Figure S2. For the MB solution (90 mg/L), MB could be completely adsorbed after 48 h at 298 K. Furthermore, there was no appearance of other peaks in the MB solution. These findings also showed that MB removal by the purified RP occurred only via physical adsorption.
The SEM images of commercial RP and purified RP are shown in Figure 2. Commercial RP showed a low-porous surface with irregular particles (Figure 2a,b). Compared to commercial RP, purified RP has a more compact surface with cavities and ledges (Figure 2d), with the main size being ~10 μm (Figure 2c). Furthermore, the size and shape of pores were also different between commercial RP and purified RP. The specific areas of commercial RP and purified RP were also measured by N2 adsorption/desorption isotherms. Compared to commercial RP, the nitrogen adsorption–desorption isotherms of purified RP were type IV (BDDT classification) isotherms with type H3 hysteresis loops at a relative pressure of 0.6–0.9, which indicated the presence of mesoporous structures in the materials (Figure S3). The area of commercial RP (0.02 cm3/g) was lower than that of purified RP (5.27 cm3/g). These conclusions suggested that, compared to commercial RP, purified RP has a higher adsorption capacity.

3.2. MB Adsorption Mechanism by Purified RP at Molecular Level

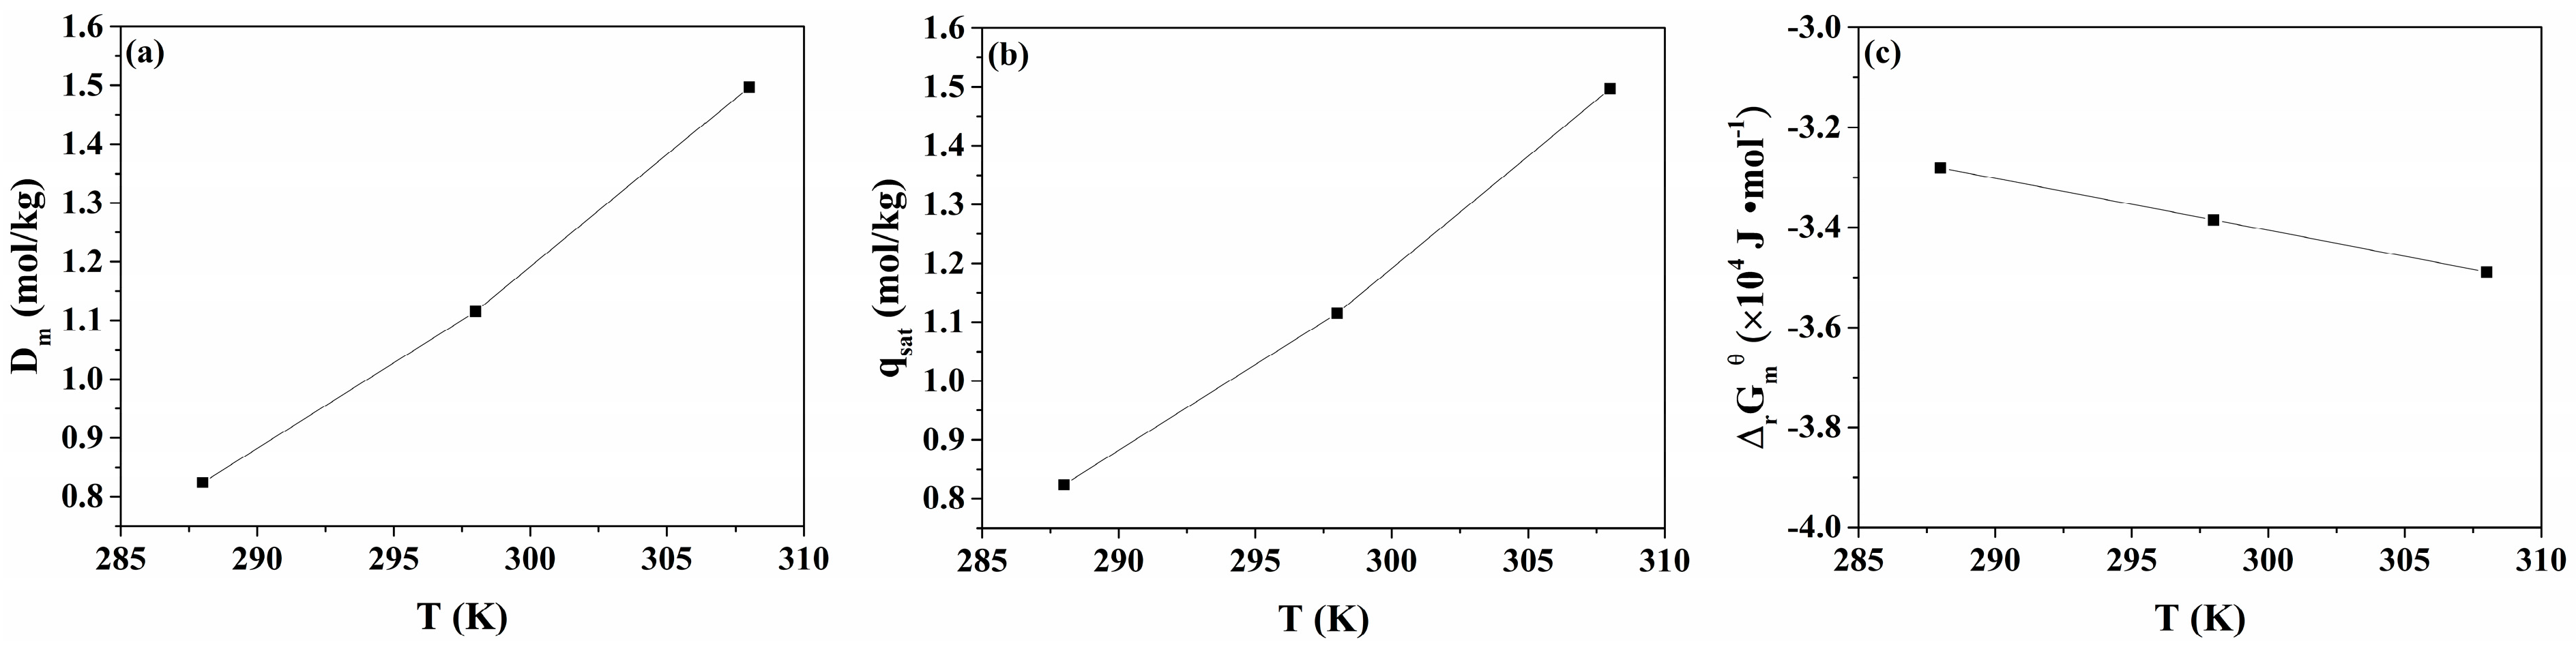
3.2.1. The n, Dm and qsat of Purified RP for MB

The effects of different temperatures on the qe are shown in Figure S4. As the temperature increased from 288 to 308 K, the qe increased from 179.87 to 303.26 mg/g. The increase of qe can be attributed to the increment of the mobility of MB molecules with the increase in temperature, which promotes the interaction of MB with the main adsorption receptor sites on the surface of purified RP [50].
n is the number of linked MB molecules per purified RP. Thus, n is the positive integer, which is different from previous studies [4,51]. When n was one, the determination coefficients at 288, 298 and 308 K were 0.97, 0.97 and 0.96, respectively. When n > one, the determination coefficients were not acceptable. Thus, n was one in this study.
The effects of different temperatures on Dm are presented in Figure 3a. As the temperature increased from 288 to 308 K, the Dm of purified RP for MB increased from 0.824 to 1.497 mol/kg. As the temperature increases, the mobility of MB molecules increases, which can promote the interaction of MB with the main adsorption receptor sites on the surface of purified RP. Thus, the Dm of purified RP for MB increases with the increase in temperature.
The effects of different temperatures on qsat are presented in Figure 3b. As the temperature increased from 288 to 308 K, the qsat of purified RP for MB increased from 0.824 to 1.497 mol/kg. As the temperature increases from 288 to 308 K, the Dm of purified RP for MB increases from 0.824 to 1.497 mol/kg. Thus, the Dm of purified RP for MB increases with the increase in temperature.

3.2.2. Interpretation of the Adsorption Mechanism of MB via ΔrGmθ

The calculation of adsorption energy is conducive to gaining a proper interpretation of the adsorption mechanism of MB on the purified RP. The fitted value of ΔrSmθ was 104.38 J·mol−1·K−1, which proved that the adsorption of MB on the purified RP was an entropy-increasing process. The fitted value of ΔrHmθ was −2.7 × 10³ J·mol−1, which proved that the adsorption of MB on the purified RP was an exothermic process. The effect of temperature on the ΔrGmθ is presented in Figure 3c, indicating that the value of ΔrGmθ was negative. Thus, the adsorption of MB on the purified RP was a spontaneous process. As the temperature increased from 288 to 308 K, the ΔrGmθ decreased from −3.3 × 10⁴ J·mol−1 to −3.5 × 10⁴ J·mol−1, which proved that the increase in temperature was conducive to adsorption of MB on the purified RP. Because adsorption of MB on the purified RP was an exothermic process, the increase in temperature was not conducive to the adsorption of MB on the purified RP. However, the adsorption of MB on the purified RP was also an entropy-increasing process. According to the results, the adsorption of MB on the purified RP was mainly driven by an entropy-increasing process.
The absolute value of ΔrGmθ was lower than 4.0 × 10³ J·mol−1, which proved that the adsorption of MB on the purified RP included physical interactions and hydrogen bonds. This result was consistent with the FTIR spectra and UV–vis diffuse reflection absorption spectra.

3.3. Effects of Different Dyes, Purified RP Dose, MB Dose and pH on Adsorption

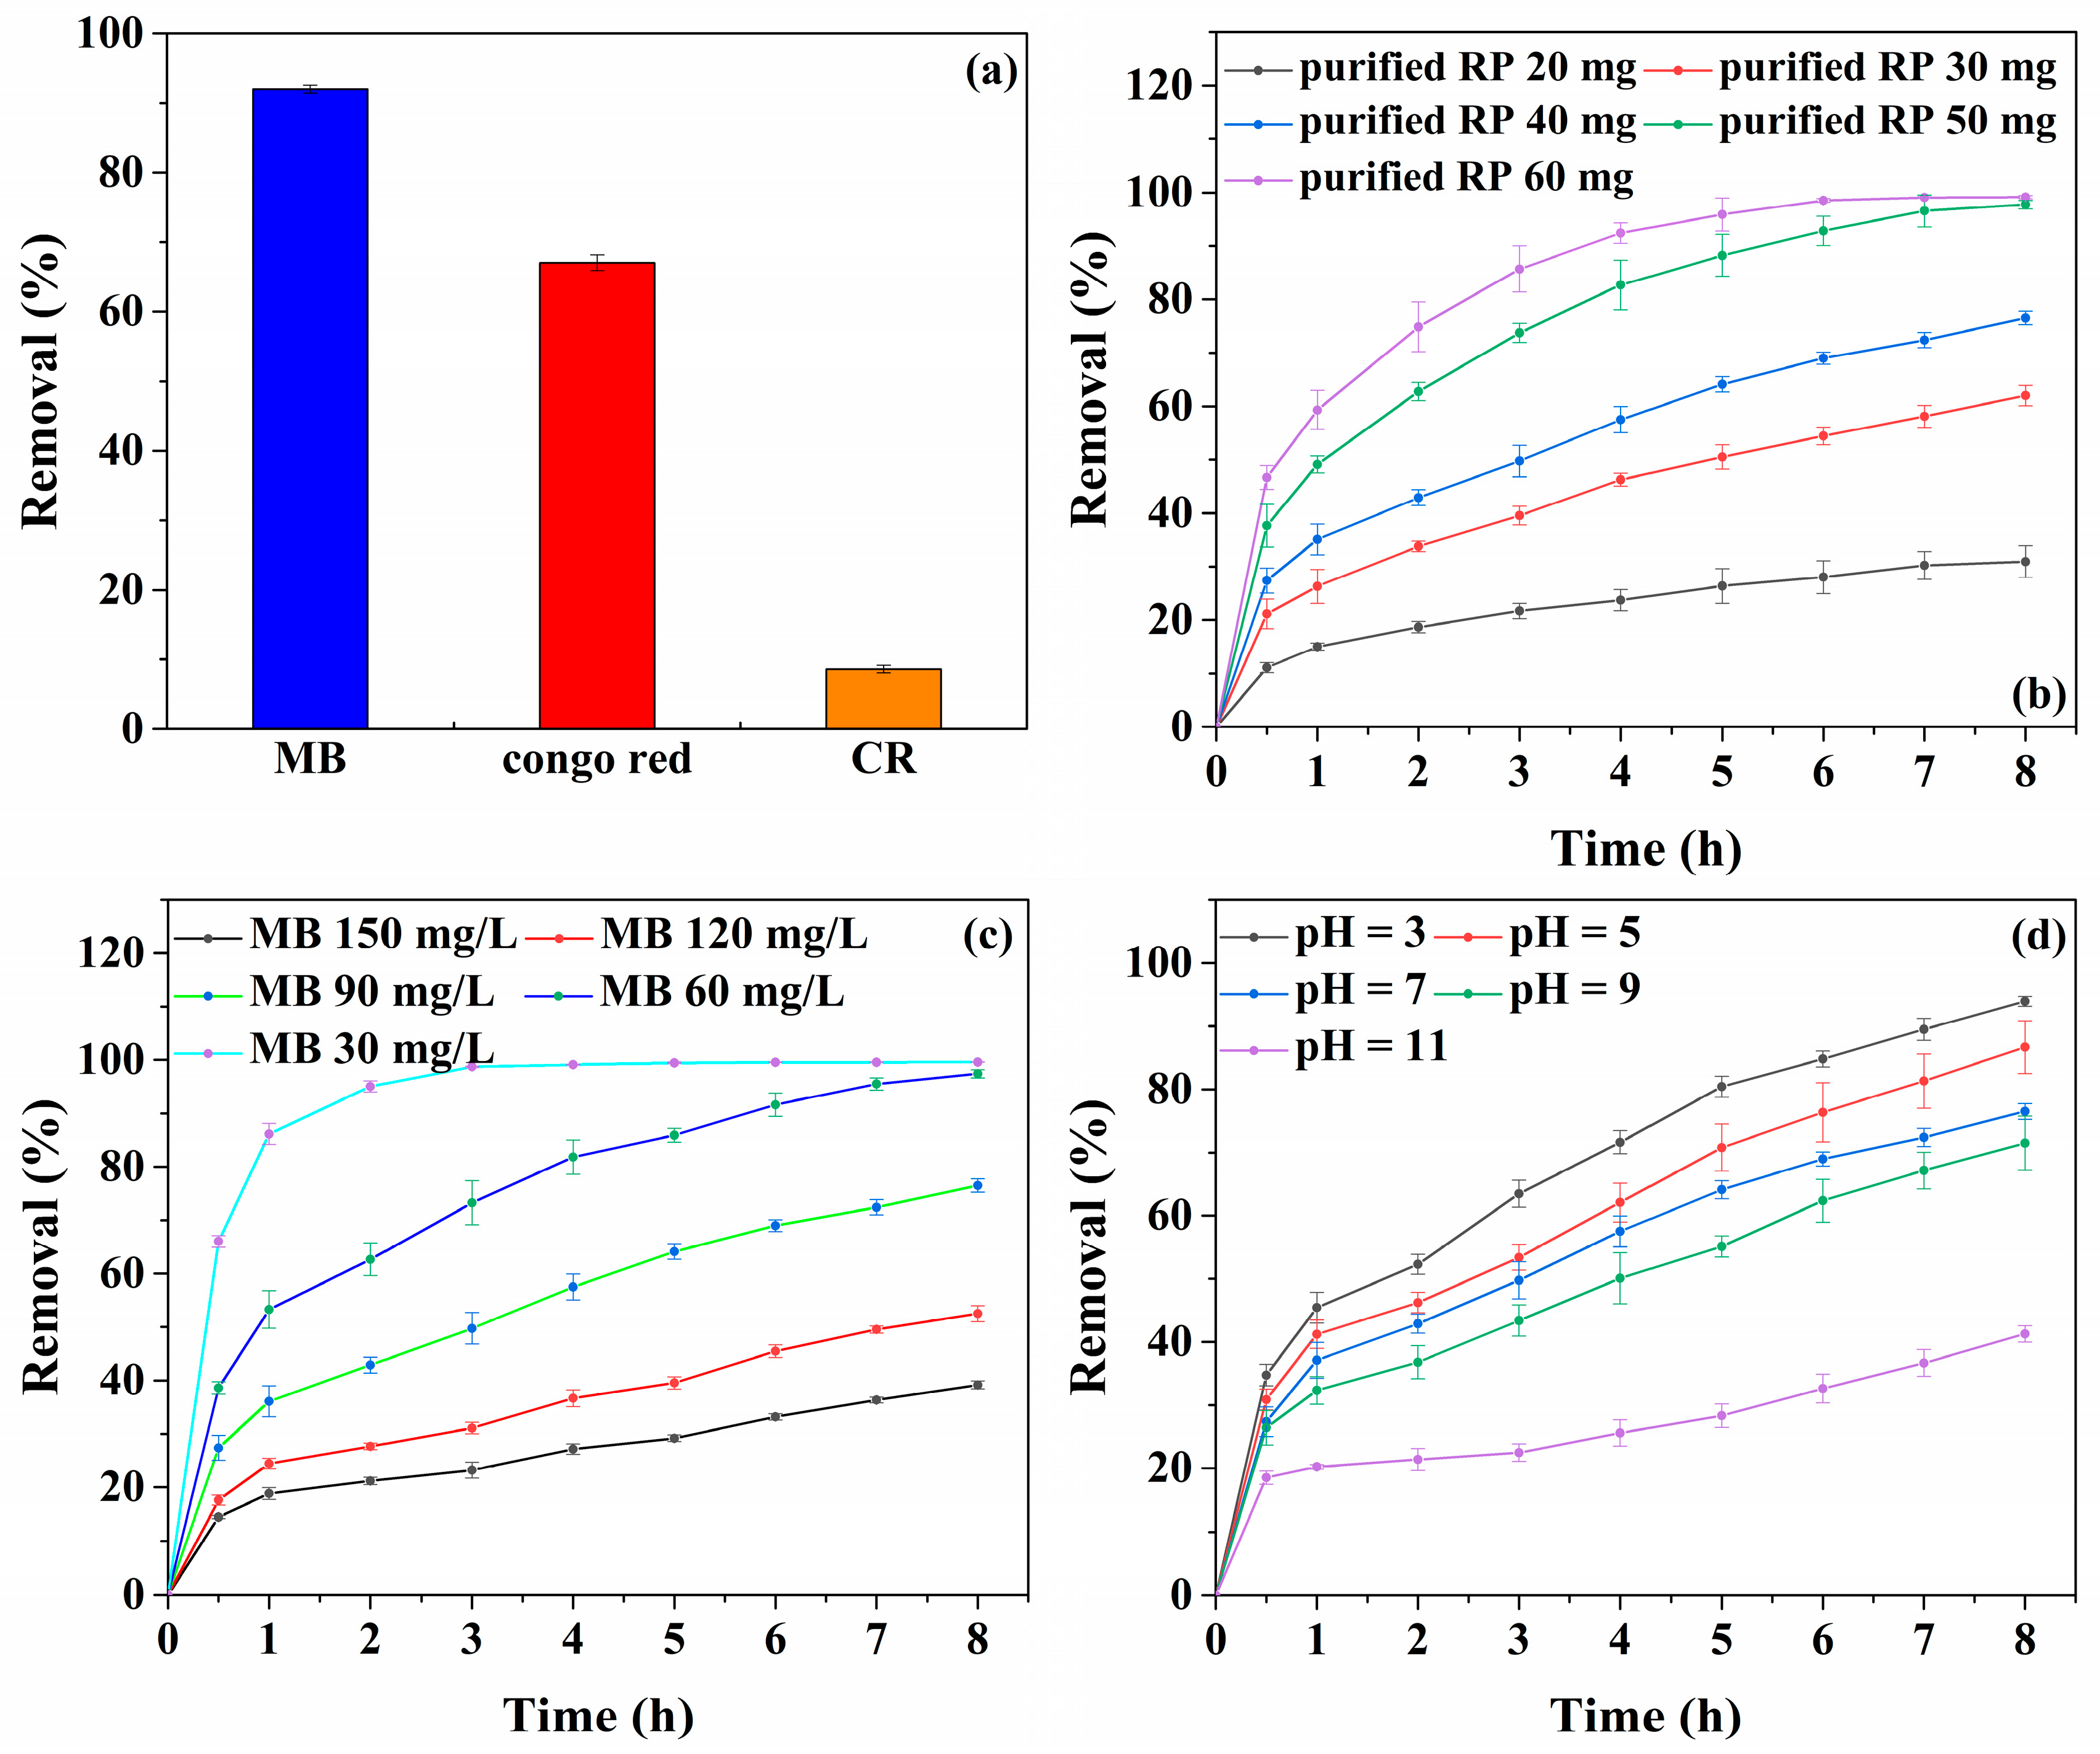
3.3.1. Adsorption of Different Dyes by Purified RP

The results showed that the removal of MB, Congo red and CR was 92.00%, 67.05% and 8.62%, respectively (Figure 4a). The zeta potential of purified RP was negatively charged (pH = 7) (Figure S5). However, the removal of the anionic dye (Congo red) was relatively high, which indicated that electrostatic attraction plays an unimportant role in the adsorption process. Similar results have also been obtained in a previous study [4]. Although the zeta potential of walnut shell-based activated carbon is negatively charged (−13.47 mV), walnut shell-based activated carbon has a high adsorption capacity for anionic dye [4]. The high adsorption of purified RP for anionic dye can be explained by the fact that the anionic dye interacts with purified RP via specific functional groups, such as hydrogen bonds, leading to high adsorption capacity.

3.3.2. Effects of Purified RP Dose, MB Dose and pH on the Adsorption of MB

The effects of purified RP dose, MB dose and pH on the adsorption of MB are shown in Figure 4b, Figure 4c and Figure 4d, respectively. The removal steadily increased from 30.95% to 99.13% as the purified RP dose increased from 20 to 60 mg. As shown in Figure 3a, as the purified RP dose increases from 20 to 60 mg, the density of receptor sites (Dm) increases from 0.8 to 1.5 mol/kg. Thus, the MB removal increased as the purified RP dose increased. With the increase in MB concentration from 30 to 150 mg, the MB removal decreased from 99.6% to 39.2%, which can be explained by the ratio of available surface-active sites decreasing with the increase in MB concentration.
Figure 4d shows the effects of pH on the MB removal. As the pH increased from 3 to 11, the MB removal decreased from 93.96% to 41.29%. The zeta potential of purified RP increased from −38.03 to −35.63 mV and then decreased to −42.27 mV as the pH increased from 3 to 11, which indicated that the pH had little effect on the zeta potential of purified RP suspension. Thus, the results can be attributed to the existence of hydrogen bonds in the MB adsorption process. The RP is known to be easily protonated in an acidic solution, which can prove the existence of more hydrogen bonds between purified RP and MB. The existence of hydrogen bonds could also be proven by ΔrGmθ.

3.4. Effects of Different Temperatures on MB Desorption

The effects of different temperatures on MB desorption are presented in Figure 5a. As the temperature increased, the rate of MB desorption increased. When the temperature increased from 278 to 338 K, the rate of MB desorption increased from 3.16% to 50.46%. As the temperature increased from 278 to 338 K, the molecular movement also accelerated. Furthermore, according to ΔrHmθ (−2.7 × 10³ J·mol−1), the adsorption of MB on the purified RP was an exothermic process. Thus, as the temperature increased, the rate of MB desorption increased.
In order to evaluate the recycling performance of purified RP, three cycles of the adsorption procedure were performed by adding purified RP (40 mg) to 100 mL MB solution (90 mg/L). The added purified RP was collected after the adsorption procedure. The collected purified RP was washed with ultrapure water until the supernatant became colorless. As shown in Figure 5b, after three cycles of the adsorption process, the removal could also reach 93%, which proved that the purified RP had excellent recycling performance.

4. Conclusions

According to XRD diffraction patterns, purification did not change the commercial RP structure. However, according to the results of SEM images and the specific areas of commercial RP (0.02 cm3/g) and purified RP (5.27 cm3/g), purified RP has a higher adsorption capacity compared with commercial RP. MB adsorption by purified RP did not change the structure of purified RB and only occurred through physical adsorption according to the results of the FTIR spectra and UV–vis diffuse reflection absorption spectra. As the temperature increased from 288 to 308 K, the qe, Dm and qsat of purified RP for MB increased from 179.87, 0.824 and 0.824 to 303.26 mg/g, 1.497 mol/kg and 1.497 mol/kg, respectively. The n of purified RP for MB was one. In addition, according to the results of ΔrSmθ (104.38 J·mol−1·K−1), ΔrHmθ (−2.7 × 10³ J·mol−1) and ΔrGmθ, the adsorption of MB on the purified RP was a spontaneous process mainly driven by entropy increasing.
Moreover, the purified RP had selective adsorption for the cationic dye and anionic dye. As the purified RP dose increased from 20 to 60 mg, the removal of purified RP steadily increased from 30.95% to 99.13%. However, as MB concentration increased from 30 to 150 mg and pH increased from 3 to 11, the adsorption capacity of purified RP decreased from 99.6% and 93.96% to 39.2% and 41.29%, respectively. Furthermore, high temperatures could increase the rate of MB desorption. After three cycles of the adsorption process, the removal could also reach 93%. Thus, the purified RP had excellent reuse ability.
Overall, this study provided new insights into the purified RP adsorption mechanism.

Supplementary Materials

The following supporting information can be downloaded at: https://www.mdpi.com/article/10.3390/w16010167/s1. Figure S1. The structural formulas of MB, CR and congo red. Figure S2. UV-vis diffuse reflection absorption spectra of MB solution before and after adsorption. Figure S3. Nitrogen adsorption-desorption isotherms of the commercial RP and purified RP. Figure S4. Adsorption isotherms of MB on purified RP. Figure S5. Effects of pH on zeta potential of purified RP.

Author Contributions

Conceptualization, T.C.; Formal analysis, R.J.; Investigation, T.C.; Resources, T.Z., R.J., Y.Z. and X.L.; Writing—original draft, T.C.; Writing—review & editing, T.Z., J.S., R.J., Y.Z. and X.L.; Visualization, T.C.; Supervision, X.L.; Project administration, X.L.; Funding acquisition, X.L. All authors have read and agreed to the published version of the manuscript.

Funding

This research was funded by the National Natural Science Foundation of China (No. 42107092), Natural Science Foundation of Shandong Province (No. ZR2022QE215) and Technology Development Program of Weifang (No. 2022ZJ1095).

Data Availability Statement

Data is contained within the article and Supplementary Materials.

Conflicts of Interest

The authors declare no conflict of interest.

References

  1. Zhang, Y.; Guo, S.; Gong, Y.; Wang, L. Potential trade-off between water consumption and water quality: Life cycle assessment of nonaqueous solvent dyeing. Water Res. 2022, 215, 118222. [Google Scholar] [CrossRef] [PubMed]
  2. Routoula, E.; Patwardhan, S. Degradation of anthraquinone dyes from effluents: A review focusing on enzymatic dye degradation with industrial potential. Environ. Sci. Technol. 2019, 54, 647–664. [Google Scholar] [CrossRef] [PubMed]
  3. Zong, M.; Song, D.; Zhang, X.; Huang, X.; Lu, X.; Rosso, K. Facet-dependent photodegradation of methylene blue by hematite nanoplates in visible light. Environ. Sci. Technol. 2021, 55, 677–688. [Google Scholar] [CrossRef] [PubMed]
  4. Li, Z.; Hanafy, H.; Zhang, L.; Sellaoui, L.; Netto, M.S.; Oliveira, M.; Seliem, M.K.; Dotto, G.L.; Bonilla-Petriciolet, A.; Li, Q. Adsorption of congo red and methylene blue dyes on an ashitaba waste and a walnut shell-based activated carbon from aqueous solutions: Experiments, characterization and physical interpretations. Chem. Eng. J. 2020, 388, 124263. [Google Scholar] [CrossRef]
  5. Hasanpour, M.; Hatami, M. Photocatalytic performance of aerogels for organic dyes removal from wastewaters: Review study. J. Mol. Liq. 2020, 309, 113094. [Google Scholar] [CrossRef]
  6. Mittal, Y.; Dash, S.; Srivastava, P.; Mishra, P.M.; Aminabhavi, T.; Yadav, A. Azo dye containing wastewater treatment in earthen membrane based unplanted two chambered constructed wetlands-microbial fuel cells: A new design for enhanced performance. Chem. Eng. J. 2022, 427, 131856. [Google Scholar] [CrossRef]
  7. Jin, X.; Wang, R.; Jin, P.; Shi, X.; Wang, Y.; Xu, L.; Wang, X.; Xu, H. How can accumulated organics and salts deteriorate the biological treatment unit in the printing and dyeing wastewater recycling system? Chem. Eng. J. 2021, 413, 127528. [Google Scholar] [CrossRef]
  8. Li, Y.; He, Y.; Zhuang, J.; Shi, H. Hierarchical microsphere encapsulated in graphene oxide composite for durable synergetic membrane separation and Fenton-like degradation. Chem. Eng. J. 2022, 430, 133124. [Google Scholar] [CrossRef]
  9. Mei, R.; Wei, Q.; Zhu, C.; Ye, W.; Zhou, B.; Ma, L.; Yu, Z.; Zhou, K. 3D macroporous boron-doped diamond electrode with interconnected liquid flow channels: A high-efficiency electrochemical degradation of RB-19 dye wastewater under low current. Appl. Catal. B -Eviron. 2019, 245, 420–427. [Google Scholar] [CrossRef]
  10. Usman, M.A.; Khan, A.Y. Selective adsorption of anionic dye from wastewater using polyethyleneimine based macroporous sponge: Batch and continuous studies. J. Hazard. Mater. 2022, 428, 128238. [Google Scholar] [CrossRef]
  11. Liu, Y.; Xiang, Y.; Xu, H.; Li, H. The reuse of nano-TiO2 under different concentration of CO32− using coagulation process and its photocatalytic ability in treatment of methyl orange. Sep. Purif. Technol. 2022, 282, 120152. [Google Scholar] [CrossRef]
  12. McNeice, P.; Reid, A.; Imam, H.; McDonagh, C.; Walby, J.D.; Collins, T.; Marr, A.C.; Marr, P.C. Designing materials for aqueous catalysis: Ionic liquid gel and silica sphere entrapped iron-TAML catalysts for oxidative degradation of dyes. Environ. Sci. Technol. 2020, 54, 14026–14035. [Google Scholar] [CrossRef] [PubMed]
  13. Zhang, G.; Xie, M.; Zhao, J.; Wei, S.; Zheng, H.; Zhang, S. Key structural features that determine the selectivity of UV/acetylacetone for the degradation of aromatic pollutants when compared to UV/H2O2. Water Res. 2021, 196, 117046. [Google Scholar] [CrossRef] [PubMed]
  14. Wang, G.; Yang, S.; Ding, J.; Chen, C.; Zhong, L.; Ding, L.; Ma, M.; Sun, G.; Huang, Z.; Ren, N. Immobilized redox mediators on modified biochar and their role on azo dye biotransformation in anaerobic biological systems: Mechanisms, biodegradation pathway and theoretical calculation. Chem. Eng. J. 2021, 423, 130300. [Google Scholar] [CrossRef]
  15. Hilares, R.T.; Atoche-Garay, D.F.; Pagaza, D.A.P.; Ahmed, M.A.; Andrade, G.; Santos, J.C. Promising physicochemical technologies for poultry slaughterhouse wastewater treatment: A critical review. J. Environ. Chem. Eng. 2021, 9, 105174. [Google Scholar] [CrossRef]
  16. Peydayesh, M.; Suta, T.; Usuelli, M.; Handschin, S.; Canelli, G.; Bagnani, M.; Mezzenga, R. Sustainable removal of microplastics and natural organic matter from water by coagulation-flocculation with protein amyloid fibrils. Environ. Sci. Technol. 2021, 55, 8848–8858. [Google Scholar] [CrossRef] [PubMed]
  17. Peters, C.; Li, D.; Mo, Z.; Hankins, N.P.; She, Q. Exploring the limitations of osmotically assisted reverse osmosis: Membrane fouling and the limiting flux br. Environ. Sci. Technol. 2022, 56, 6678–6688. [Google Scholar] [CrossRef]
  18. Chen, Y.; Lu, K.; Gai, W.; Chung, T. Nanofiltration-inspired janus membranes with simultaneous wetting and fouling resistance for membrane distillation. Environ. Sci. Technol. 2021, 55, 7654. [Google Scholar] [CrossRef]
  19. Xu, D.; Zheng, J.; Zhang, X.; Lin, D.; Gao, Q.; Luo, X.; Zhu, X.; Li, G.; Liang, H.; Van der Bruggen, B. Mechanistic insights of a thermoresponsive interface for fouling control of thin-film composite nanofiltration membranes. Environ. Sci. Technol. 2022, 56, 1927–1937. [Google Scholar] [CrossRef]
  20. Chen, T.; Dong, S.; Guo, X.; Chu, W.; Xu, T.; Yin, D. Dissolved organic carbon removal and CX3R-type byproduct formation during the peroxymonosulfate pre-oxidation followed by coagulation. Chem. Eng. J. 2021, 421, 129654. [Google Scholar] [CrossRef]
  21. Chen, T.; Yu, Z.; Xu, T.; Xiao, R.; Chu, W.; Yin, D. Formation and degradation mechanisms of CX3R-type oxidation by-products during cobalt catalyzed peroxymonosulfate oxidation: The roles of Co3+ and SO4. J. Hazard. Mater. 2021, 405, 124243. [Google Scholar] [CrossRef]
  22. Wu, M.; Ding, S.; Cao, Z.; Du, Z.; Tang, Y.; Chen, X.; Chu, W. Insights into the formation and mitigation of iodinated disinfection by-products during household cooking with Laminaria japonica (Haidai). Water Res. 2022, 225, 119177. [Google Scholar] [CrossRef] [PubMed]
  23. Liu, Y.; Cai, Y.; Li, G.; Wang, W.; Wong, P.K.; An, T. Response mechanisms of different antibiotic-resistant bacteria with different resistance action targets to the stress from photocatalytic oxidation. Water Res. 2022, 218, 118407. [Google Scholar] [CrossRef] [PubMed]
  24. Yang, B.; Wang, C.; Cheng, X.; Zhang, Y.; Li, W.; Wang, J.; Tian, Z.; Chu, W.; Korshin, G.V.; Guo, H. Interactions between the antibiotic tetracycline and humic acid: Examination of the binding sites, and effects of complexation on the oxidation of tetracycline. Water Res. 2021, 202, 117379. [Google Scholar] [CrossRef]
  25. Pazdzior, K.; Bilinska, L.; Ledakowicz, S. A review of the existing and emerging technologies in the combination of AOPs and biological processes in industrial textile wastewater treatment. Chem. Eng. J. 2019, 376, 120597. [Google Scholar] [CrossRef]
  26. Aravind, P.; Selvaraj, H.; Ferro, S.; Sundaram, M. An integrated (electro- and bio-oxidation) approach for remediation of industrial wastewater containing azo-dyes: Understanding the degradation mechanism and toxicity assessment. J. Hazard. Mater. 2016, 318, 203–215. [Google Scholar] [CrossRef]
  27. Tang, D.; Li, J.; Yang, Z.; Jiang, X.; Huang, L.; Guo, X.; Li, Y.; Zhu, J.; Sun, X. Fabrication and mechanism exploration of oxygen-incorporated 1T-MoS2 with high adsorption performance on methylene blue. Chem. Eng. J. 2022, 428, 130954. [Google Scholar] [CrossRef]
  28. Yazidi, A.; Sellaoui, L.; Dotto, G.; Bonilla-Petriciolet, A.; Frohlich, A.C.; Ben Lamine, A. Monolayer and multilayer adsorption of pharmaceuticals on activated carbon: Application of advanced statistical physics models. J. Mol. Liq. 2019, 283, 276–286. [Google Scholar] [CrossRef]
  29. Al-asad, H.A.; Parniske, J.; Qian, J.; Alex, J.; Ramaswami, S.; Kaetzl, K.; Morck, T. Development and application of a predictive model for advanced wastewater treatment by adsorption onto powdered activated carbon. Water Res. 2022, 217, 118427. [Google Scholar] [CrossRef]
  30. Yuan, J.; Passeport, E.; Hofmann, R. Understanding adsorption and biodegradation in granular activated carbon for drinking water treatment: A critical review. Water Res. 2022, 210, 118026. [Google Scholar] [CrossRef]
  31. Yang, W.; Cai, C.; Dai, X. Interactions between virus surrogates and sewage sludge vary by viral analyte: Recovery, persistence, and sorption. Water Res. 2022, 210, 117995. [Google Scholar] [CrossRef] [PubMed]
  32. Wang, Q.; Zhang, C.; Patel, D.; Jung, H.; Liu, P.; Wan, B.; Pavlostathis, S.G.; Tang, Y. Coevolution of iron, phosphorus, and sulfur speciation during anaerobic digestion with hydrothermal pretreatment of sewage sludge. Environ. Sci. Technol. 2020, 54, 8362–8372. [Google Scholar] [CrossRef] [PubMed]
  33. Huang, L.; Yu, Q.; Liu, W.; Wang, J.; Guo, W.; Jia, E.; Zeng, Q.; Qin, R.; Zheng, J.; Hofmockel, K.S.; et al. Molecular determination of organic adsorption sites on smectite during Fe redox processes using ToF-SIMS analysis. Environ. Sci. Technol. 2021, 55, 7123–7134. [Google Scholar] [CrossRef] [PubMed]
  34. Montavon, G.; Lerouge, C.; David, K.; Ribet, S.; Hassan-Loni, Y.; Leferrec, M.; Bailly, C.; Robinet, J.-C.; Grambow, B. Nickel retention on callovo-oxfordian clay: Applicability of existing adsorption models for dilute systems to real compact rock. Environ. Sci. Technol. 2020, 54, 12226–12234. [Google Scholar] [CrossRef] [PubMed]
  35. Kumar, P.; Gayathri, R.; Rathi, B.S. A review on adsorptive separation of toxic metals from aquatic system using biochar produced from agro-waste. Chemosphere 2021, 285, 131438. [Google Scholar] [CrossRef]
  36. Sun, Y.; Ren, Z.; Liu, Y.; Fu, R. Facile synthesis of ultrathin red phosphorus nanosheets with excellent photocatalytic performances. Mater. Lett. 2019, 236, 542–546. [Google Scholar] [CrossRef]
  37. Yang, H.; Ye, S.; Zeng, Z.; Zeng, G.; Tan, X.; Xiao, R.; Wang, J.; Song, B.; Du, L.; Qin, M.; et al. Utilization of biochar for resource recovery from water: A review. Chem. Eng. J. 2020, 397, 125502. [Google Scholar] [CrossRef]
  38. Gupta, S.; Sireesha, S.N.; Sreedhar, I.; Patel, C.; Anitha, K.L. Latest trends in heavy metal removal from wastewater by biochar based sorbents. J. Water. Process. Eng. 2022, 38, 101561. [Google Scholar] [CrossRef]
  39. He, C.; Fang, K.; Gong, H.; Liu, J.; Song, X.; Liang, R.; He, Q.; Yuan, Q.; Wang, K. Advanced organic recovery from municipal wastewater with an enhanced magnetic separation (EMS) system: Pilot-scale verification. Water Res. 2022, 217, 118449. [Google Scholar] [CrossRef]
  40. Orlov, A.; Demenko, D.; Bignaud, C.; Valtz, A.; Marcou, G.; Horvath, D.; Coquelet, C.; Varnek, A.; De Meyer, F. Chemoinformatics-driven design of new physical solvents for selective CO2 absorption. Environ. Sci. Technol. 2021, 55, 15542–15553. [Google Scholar] [CrossRef]
  41. Acevedo-Garcia, V.; Rosales, E.; Puga, A.; Pazos, M.; Sanroman, A. Synthesis and use of efficient adsorbents under the principles of circular economy: Waste valorisation and electroadvanced oxidation process regeneration. Sep. Purif. Technol. 2020, 242, 116796. [Google Scholar] [CrossRef]
  42. Fu, K.; Liu, X.; Lv, C.; Luo, J.; Sun, M.; Luo, S.; Crittenden, J. Superselective Hg(II) removal from water using a thiol-laced MOF-based sponge monolith: Performance and mechanism. Environ. Sci. Technol. 2022, 56, 2677–2688. [Google Scholar] [CrossRef] [PubMed]
  43. Fadillah, G.; Saleh, T.; Wahyuningsih, S.; Putri, E.N.K.; Febrianastuti, S. Electrochemical removal of methylene blue using alginate-modified graphene adsorbents. Chem. Eng. J. 2019, 378, 122140. [Google Scholar] [CrossRef]
  44. Zhao, J.; Dang, Z.; Muddassir, M.; Raza, S.; Zhong, A.; Wang, X.; Jin, J. A new Cd(II)-based coordination polymer for efficient photocatalytic removal of organic dyes. Molecules 2023, 28, 6848. [Google Scholar] [CrossRef]
  45. Liu, E.; Du, Y.; Bai, X.; Fan, J.; Hu, X. Synergistic improvement of Cr(VI) reduction and RhB degradation using RP/g-C3N4 photocatalyst under visible light irradiation. Arab. J. Chem. 2020, 13, 3836–3848. [Google Scholar] [CrossRef]
  46. Li, S.; Ng, Y.H.; Zhu, R.; Lv, S.; Wu, C.; Liu, Y.; Jing, L.; Deng, J.; Dai, H. In situ construction of elemental phosphorus nanorod-modified TiO2 photocatalysts for efficient visible-light-driven H2 generation. Appl. Catal. B -Eviron. 2021, 297, 120412. [Google Scholar] [CrossRef]
  47. Sellaoui, L.; Guedidi, H.; Knani, S.; Reinert, L.; Duclaux, L.; Ben Lamine, A. Application of statistical physics formalism to the modeling of adsorption isotherms of ibuprofen on activated carbon. Fluid Phase Equilib. 2015, 387, 103–110. [Google Scholar] [CrossRef]
  48. Wu, C.; Jing, L.; Deng, J.; Liu, Y.; Li, S.; Lv, S.; Sun, Y.; Zhang, Q.; Dai, H. Elemental red phosphorus-based photocatalysts for environmental remediation: A review. Chemosphere 2021, 274, 129793. [Google Scholar] [CrossRef]
  49. Guo, C.; Du, H.; Ma, Y.; Qi, K.; Zhu, E.; Su, Z.; Huojiaaihemaiti, M.; Wang, X. Visible-light photocatalytic activity enhancement of red phosphorus dispersed on the exfoliated kaolin for pollutant degradation and hydrogen evolution. J. Colloid Interface Sci. 2021, 585, 167–177. [Google Scholar] [CrossRef]
  50. Saeeda, A.; Sharif, M.; Iqbal, M. Application potential of grapefruit peel as dye sorbent: Kinetics, equilibrium and mechanism of crystal violet adsorption. J. Hazard. Mater. 2010, 179, 564–572. [Google Scholar] [CrossRef]
  51. Sellaouia, L.; Francob, D.; Ghallaa, H.; Georginb, J.; Nettob, M.S.; Dottob, G.L.; Bonilla-Petricioletc, A.; Belmabroukd, H.; Bajahzar, A. Insights of the adsorption mechanism of methylene blue on brazilian berries seeds: Experiments, phenomenological modelling and DFT calculations. Chem. Eng. J. 2020, 394, 125011. [Google Scholar] [CrossRef]
Figure 1. XRD patterns of (a) commercial RP purified RP before and after adsorption of MB and (b) FTIR spectra of purified RP before and after adsorption of MB. Conditions: the concentration of MB = 90 mg/L, the volume of MB solution = 100 mL, the weight of purified RP = 40 mg, the absorption time = 48 h, T = 298 K, pH = 7.
Water 16 00167 g001
Figure 2. SEM images of commercial RP (a,b) and purified RP (c,d).
Water 16 00167 g002
Figure 3. Effects of different temperatures on Dm (a), qsat (b) and ΔrGmθ (c) of purified RP for MB adsorption. Conditions: T = 288, 298 and 308 K, the concentration of MB = 40–160 mg/L, the volume of MB solution = 100 mL, the weight of purified RP = 40 mg, pH = 7.
Water 16 00167 g003
Figure 4. Effects of different dyes (MB, CR and anionic dyes were selected) on removal. (a) Conditions: the concentration of dye = 90 mg/L, the volume of dye solution = 100 mL, the weight of purified RP = 40 mg, T = 298 K, pH = 7. Effect of purified RP dose on removal. (b) Conditions: the weight of purified RP = 20, 30, 40, 50 and 60 mg, the concentration of MB = 90 mg/L, the volume of MB solution = 100 mL, T = 298 K, pH = 7. Effect of MB concentration on removal. (c) Conditions: the concentration of MB = 30, 60, 90, 120 and 150 mg/L, the volume of MB solution = 100 mL, the weight of purified RP = 40 mg, T = 298 K, pH = 7. Effect of pH on removal. (d) Conditions: pH = 3, 5, 7, 9 and 11, the concentration of MB = 90 mg/L, the volume of MB solution = 100 mL, the weight of purified RP = 40 mg, T = 298 K.
Water 16 00167 g004
Figure 5. Effects of different temperatures on MB desorption. (a) Conditions: T = 278, 298, 318 and 338 K, the concentration of MB = 90 mg/L, the volume of MB solution = 100 mL, the weight of purified RP = 40 mg, pH = 7. Recycles of purified RP for the adsorption of MB. (b) Conditions: the concentration of MB = 90 mg/L, the volume of MB solution = 100 mL, the weight of purified RP = 40 mg, T = 308 K, pH = 7.
Water 16 00167 g005
Disclaimer/Publisher’s Note: The statements, opinions and data contained in all publications are solely those of the individual author(s) and contributor(s) and not of MDPI and/or the editor(s). MDPI and/or the editor(s) disclaim responsibility for any injury to people or property resulting from any ideas, methods, instructions or products referred to in the content.

