Article

Refined Calculation of Multi-Objective Ecological Flow in Rivers, North China

1
State Key Laboratory of Simulation and Regulation of Water Cycle in River Basin, China Institute of Water Resources and Hydropower Research, Beijing 100038, China
2
School of Water Conservancy and Environment, University of Jinan, Jinan 250022, China
*
Authors to whom correspondence should be addressed.
Water 2023, 15(5), 1003; https://doi.org/10.3390/w15051003
Submission received: 29 January 2023 / Revised: 4 March 2023 / Accepted: 5 March 2023 / Published: 6 March 2023

Abstract

:
The concepts and calculation of basic, suitable, and fine ecological flow are put forward, and an integrated multi-method to calculate the ecological flow in rivers under multi-objectives is explored. Based on this, a refined calculation theory and method of a multi-objective ecological flow division based on time and space is proposed. That is, three commonly used methods, namely, the hydrology method, the hydraulics method, and the habitat method, are selected to finely calculate the ecological flow demand at different periods, in different sections, and under different ecological objectives. This approach breaks through the traditional ecological water demand calculation method based on hydrology and develops a river ecological flow calculation method based on water environmental protection objectives. A refined calculation method of ecological flow division based on time and space is developed to ensure that the ecological-hydrological process in rivers and lakes meets the ecological flow demand in different periods, different reaches, and different ecological objectives. Taking eight rivers entering Baiyangdian Lake as an example, the ecological flow demand in different river sections under different ecological objectives at different times is calculated to ensure the ecological flow process. The results show that the range of basic ecological flow demand range is 0.07–3.87 m3/s, the range of suitable ecological flow demand is 0.51~10.74 m3/s, and the range of fine ecological flow demand is 0.71~20.29 m3/s. In terms of spatial distribution, Ping River has the lowest demand for ecological flow, and the Zhulong River has the largest. In terms of the interannual ecological demand, those of the Baigou River, Fu River, Xiaoyi River, and Zhulong River are larger. In the demand process across the year, the demand is the largest from July to September, while the demand is the smallest from March to May. Similarly, most rivers face such problems as a sharp decline in runoff, drying up of the river, and an urgent need to restore ecology in northern China. This study also has insights and reference significance for other regions.

1. Introduction

The destruction of the ecosystem is a process of gradual change. With the continuous accumulation of various “destructive” energies, the ecosystem enters an “abrupt change” state, leading to ecological extinction or the obvious loss of its service functions. In the process of the destruction of the ecosystem, there are two most critical states: the destruction of the ecological chain, during which a large number of species are reduced, or even face extinction, and the water itself disappears [1]. Lakes around the world are facing threats such as water quality deterioration, serious eutrophication, shrinking dimensions, and swamping [2]. In recent decades, Baiyangdian Lake (BYD), a multi-functional lake, has been suffering from long-term drought and highly intensive human activities, resulting in water surface shrinkage, water level instability [3], eutrophication [4] and ecological degradation [5].
Variation in water resources is a primary factor that influences ecohydrological processes, land use and land cover change, and sustainable development in arid regions [6]. The study of ecological flow can be traced back to a series of river flow studies conducted by the U.S. Fish and Wildlife Service in the 1940s. These studies analyzed the relationship between the growth and reproduction of fish and the river flow, thereby deriving the concept of the minimum ecological flow of the river [7]. These various requirements raise the following questions: (1) What are the ecological water requirements (EWRs)? (2) What is the required standard for EWRs? Should it be based on the status quo or the original state of the rivers and lakes? (3) How do you determine the goal of ecological restoration of rivers and lakes?
A large number of researchers have defined EWRs in terms of the hydrological cycle, water environmental protection, and water resources development and utilization. The original definition was proposed by Covich [8], who believed that the EWR is the water needed to ensure the restoration and maintenance of a healthy ecosystem. Subsequently, Gleick [9] proposed the basic conceptual framework of EWRs and believed that providing a certain quantity and quality of runoff is very important for maintaining ecosystem health, and for protecting species diversity and ecosystem integrity. There are three basic quantitative measures of EWRs: (i) the “minimal” EWRs needed to prevent further degradation of the existing ecosystem; (ii) the “appropriate” EWRs based on the best matching of the hydrological ecosystem; and (iii) the “maximum” EWRs is the full measure of water shortage, or water shortage in the area defined by hydroclimatology, including the ecological water shortage. These definitions all determine the ecological function of a river.
In recent years, some methods for estimating the ecological base flow of rivers have been developed. These methods can be divided into four categories: hydraulics, hydrology, habitat simulation, and holistic [10]. The chosen method should draw on the latest research results of experts and scholars on the ecological flow of rivers and lakes. The ecological flow should be calculated according to different river water resource conditions, development and utilization levels, engineering storage capacity, ecological protection requirements, and water supply and demand situations [11]. In this paper, the concept, basic principle, and calculation framework of EWRs are discussed, and the research trend in the future is discussed. The calculation methods of EWRs are reviewed and summarized, consisting mainly of the hydraulics method, the habitat simulation method, the hydrology method, the environmental function setting method, the hydrology-biology analysis method, etc. The theoretical basis, advantages and disadvantages, and the scope of application of each method are reviewed. The following four calculation methods are more suitable for EWRs in China: the habitat simulation method, the hydrology method, the environmental function setting method, and the comprehensive method (i.e., using several methods comprehensively, comparing and verifying the results with each other). However, the application of the habitat simulation method is limited due to its complexity.
Some scholars have also improved the calculation method of EWRs. An envelope curve-based method is proposed for assessing the minimum ecological water requirements of an urban river system. The water resources allocation strategy designed to meet the minimum ecological water use requirements is described [12]. Considering the practical requirement of ecological operation of reservoirs, an integrated calculation approach of ecological water demand is proposed, according to the ecological water demand in various ecosystems as well as the hydraulic connection between them, and an integrated calculation model of regional ecological water demand by means of the distributed hydrological model is established [13]. The monthly minimum flow calculation method is used to calculate and evaluate the minimum and optimal ecological flow of the Irtysh River, and the improved Tennant method is applied to calculate the different ecological flow standards [14]. To balance water use by humans and ecosystems, Shang et al. propose a multi-objective programming model to determine the minimum ecological flow or water level, where the two objectives are water indices for humans and the habitat index for ecosystems, respectively [15]. A river ecological flow distribution method based on generalized kernel density estimation and its ecological flow index and evaluation grade standard are proposed [16]. This approach considers the annual and interannual variation of natural runoff to reduce the impact of extreme flow and uneven flow distribution in a year [17]. Zhang et al. discuss the definition of urban river EWRs (ecological water requirements) and the uncertainty in the calculation results and propose a calculation method for urban river EWRs independent of human activities [18]. Considering the different life stages of target species, a novel approach for evaluating the ecological flow pattern is proposed [19]. In order to meet the water demand of riparian vegetation during the growth period of indicated species, the water demand law of typical vegetation with growth is studied, the upper and lower water levels are set, and the EWRs of vegetation in each growth stage is determined [20].
The definition and calculation method of river EWRs and the realization of river function do not effectively solve the spatio-temporal objectives and restoration standards, that is, there is a lack of research on the spatio-temporal process of EWRs under multi methods and multi objectives. Each calculation method of EWRs has its own defects, and the applicable conditions are different. At present, most studies only consider a single method and lack research on multi-method integration. At the same time, due to different functional objectives and restoration criteria, different EWRs can be obtained for the same river [21]. Therefore, it is necessary to clarify the functional objectives and standards of river EWRs, determine scientific and reasonable ecological reference values, and select appropriate EWR calculation methods. This is very important to alleviate the conflict between water shortage and the ecological environment. In addition, the previous studies generally put forward only fixed EWRs for one river (or divided into flood period and non-flood period) and do not consider the changes in ecological flow in each period, so it is difficult to effectively evaluate the river’s ecological flow. However, due to the different development degree of a single river from top to bottom, the EWRs of the river ecosystem are different in different periods, in different river sections, and under different objectives. According to Alonso et al. [22] the definition of ecological flow (EF) is the quantity, quality, and variation of the water levels reserved to preserve environmental services, components, functions, processes, and the resilience of aquatic (lotic and lentic) and terrestrial (riparian) ecosystems. They depend on hydrological, geomorphological, ecological, and social processes. Sedighkia et al. propose and evaluate a fuzzy hydraulic habitat simulation-genetic algorithm method to optimize the environmental flow regime. The proposed method develops an objective function that minimizes differences between habitat loss and water demand or project loss. Fuzzy physical habitat simulation is used to develop habitat loss function [23]. An integrated hydrological and hydrodynamic modeling study is carried out to estimate the ecological flow requirement in the Bhogdoi River, India. The flow depth and the current speed corresponding to the observed maximum flow and the ecological flow rates are computed from a two-dimensional hydrodynamic routing model [24]. The concepts of basic, suitable, and fine ecological flow are put forward in this study, and the study takes the river entering Baiyangdian Lake (BYD) as an example for analysis and calculation.
To determine the ecological and environmental flows, more than 207 methodologies have been developed at an international level in more than 55 countries. These methodologies can be grouped into four main groups: hydrological-based, hydraulic-hydrological (better known as hydraulic), habitat simulation, or ecohydraulic and holistic methods. The challenge at present is how to choose the most appropriate method and this depends on whether they comply with the currently valid principles or fundamentals. The main scientific principles on which the determination of an ecological flow regime is based are the paradigm of the natural hydrological regime and the gradient of the biological condition. To address these issues, this study will explore the premise and objectives of river EF calculation, and then integrate multiple methods to calculate river EF under multiple objectives. A refined calculation method of ecological flow division based on time and space is proposed in this study. Three commonly used methods, namely, hydrology methods, hydraulics methods, and habitat methods, are selected to finely calculate river EF in different periods, different reaches, and different ecological objectives. This approach breaks through the traditional EWR calculation method based on hydrology and develops a river EF calculation method based on ecological protection objectives.
The study area is the Baiyangdian Basin (BYDB), which is the middle and upper reaches of the Daqing River Basin, that is, Baiyangdian Lake (BYD) and its upper basins. The Xiongan New Area is located around BYD in the lower reaches of the BYDB. It is the most important strategic area in China after the Shenzhen Special Economic Zone and the Pudong New Area. It can be called “the Millennium Plan and the National Event”, and an ecological city with blue and green interweaving, fresh and bright, with harmony between water and city should be built. BYD and inflow rivers in the BYDB are of great significance to support the green development and ecological restoration of the Xiongan New Area. However, in the past few years, the runoff in rivers has decreased sharply, the water level in BYD is unstable, and the ecological water demand cannot be guaranteed. Under the new development requirements, there is no scientific basis for how to restore the ecology of rivers and ensure their ecological needs. The value of this research is to finely calculate the ecological water demand of rivers under multi-objective and multi-period to provide strong support for their ecological restoration. In addition, most rivers face problems such as a sharp decline of runoff and the drying up of the rivers, and there is an urgent need to restore ecology in northern China. This study also has insights and reference significance for other regions.

2. Materials and Methods

2.1. Materials

2.1.1. Study Area

There are eight rivers in the BYDB, forming a fan-shaped river network, which flows into Baiyang Lake from west to east. After the ecological water supplement in recent years, Fu River, Xiaoyi River, and Baigou River flow all year round, while Zhulong River and Tang River have water in some seasons, and the water volume of other rivers is small. Baiyangdian Lake (BYD) is the largest freshwater wetland in North China Plain, with an area of about 366 km2, and it is a national key ecological wetland. The study area is shown in Figure 1. Since the 1950s, in order to strengthen flood control and drought resistance capacity, large-scale water conservancy projects have been built in the upstream mountainous areas to artificially retain water resources. In addition, there is the problem of excessive development of water resources. The development and utilization rate is as high as 130%, and the groundwater is seriously overdrawn. The water attenuation trends from 1956 to 2018 in the BYDB are shown in Figure 2. The aim of this study is to select a variety of methods to calculate the EF of the eight upstream rivers entering the lake with a division based on time and space, and the ecological flow process requirements under different ecological objectives to provide technical support for the ecological water replenishment and water ecological restoration in the BYDB.

2.1.2. Data Acquisition

Long-series flow data of hydrological stations are needed to calculate EF by the hydrological method. Data on the daily runoff of 18 hydrological stations in the BYDB from station construction to 2018 have been collected, as shown in Figure 1. In addition, the basic parameters of the river are collected, including river roughness, slope coefficient, channel bottom width, hydraulic slope, wet perimeter, the relationship between water depth and section area, etc., to provide data for the calculation of EF by the hydraulic method.

2.2. Methodology

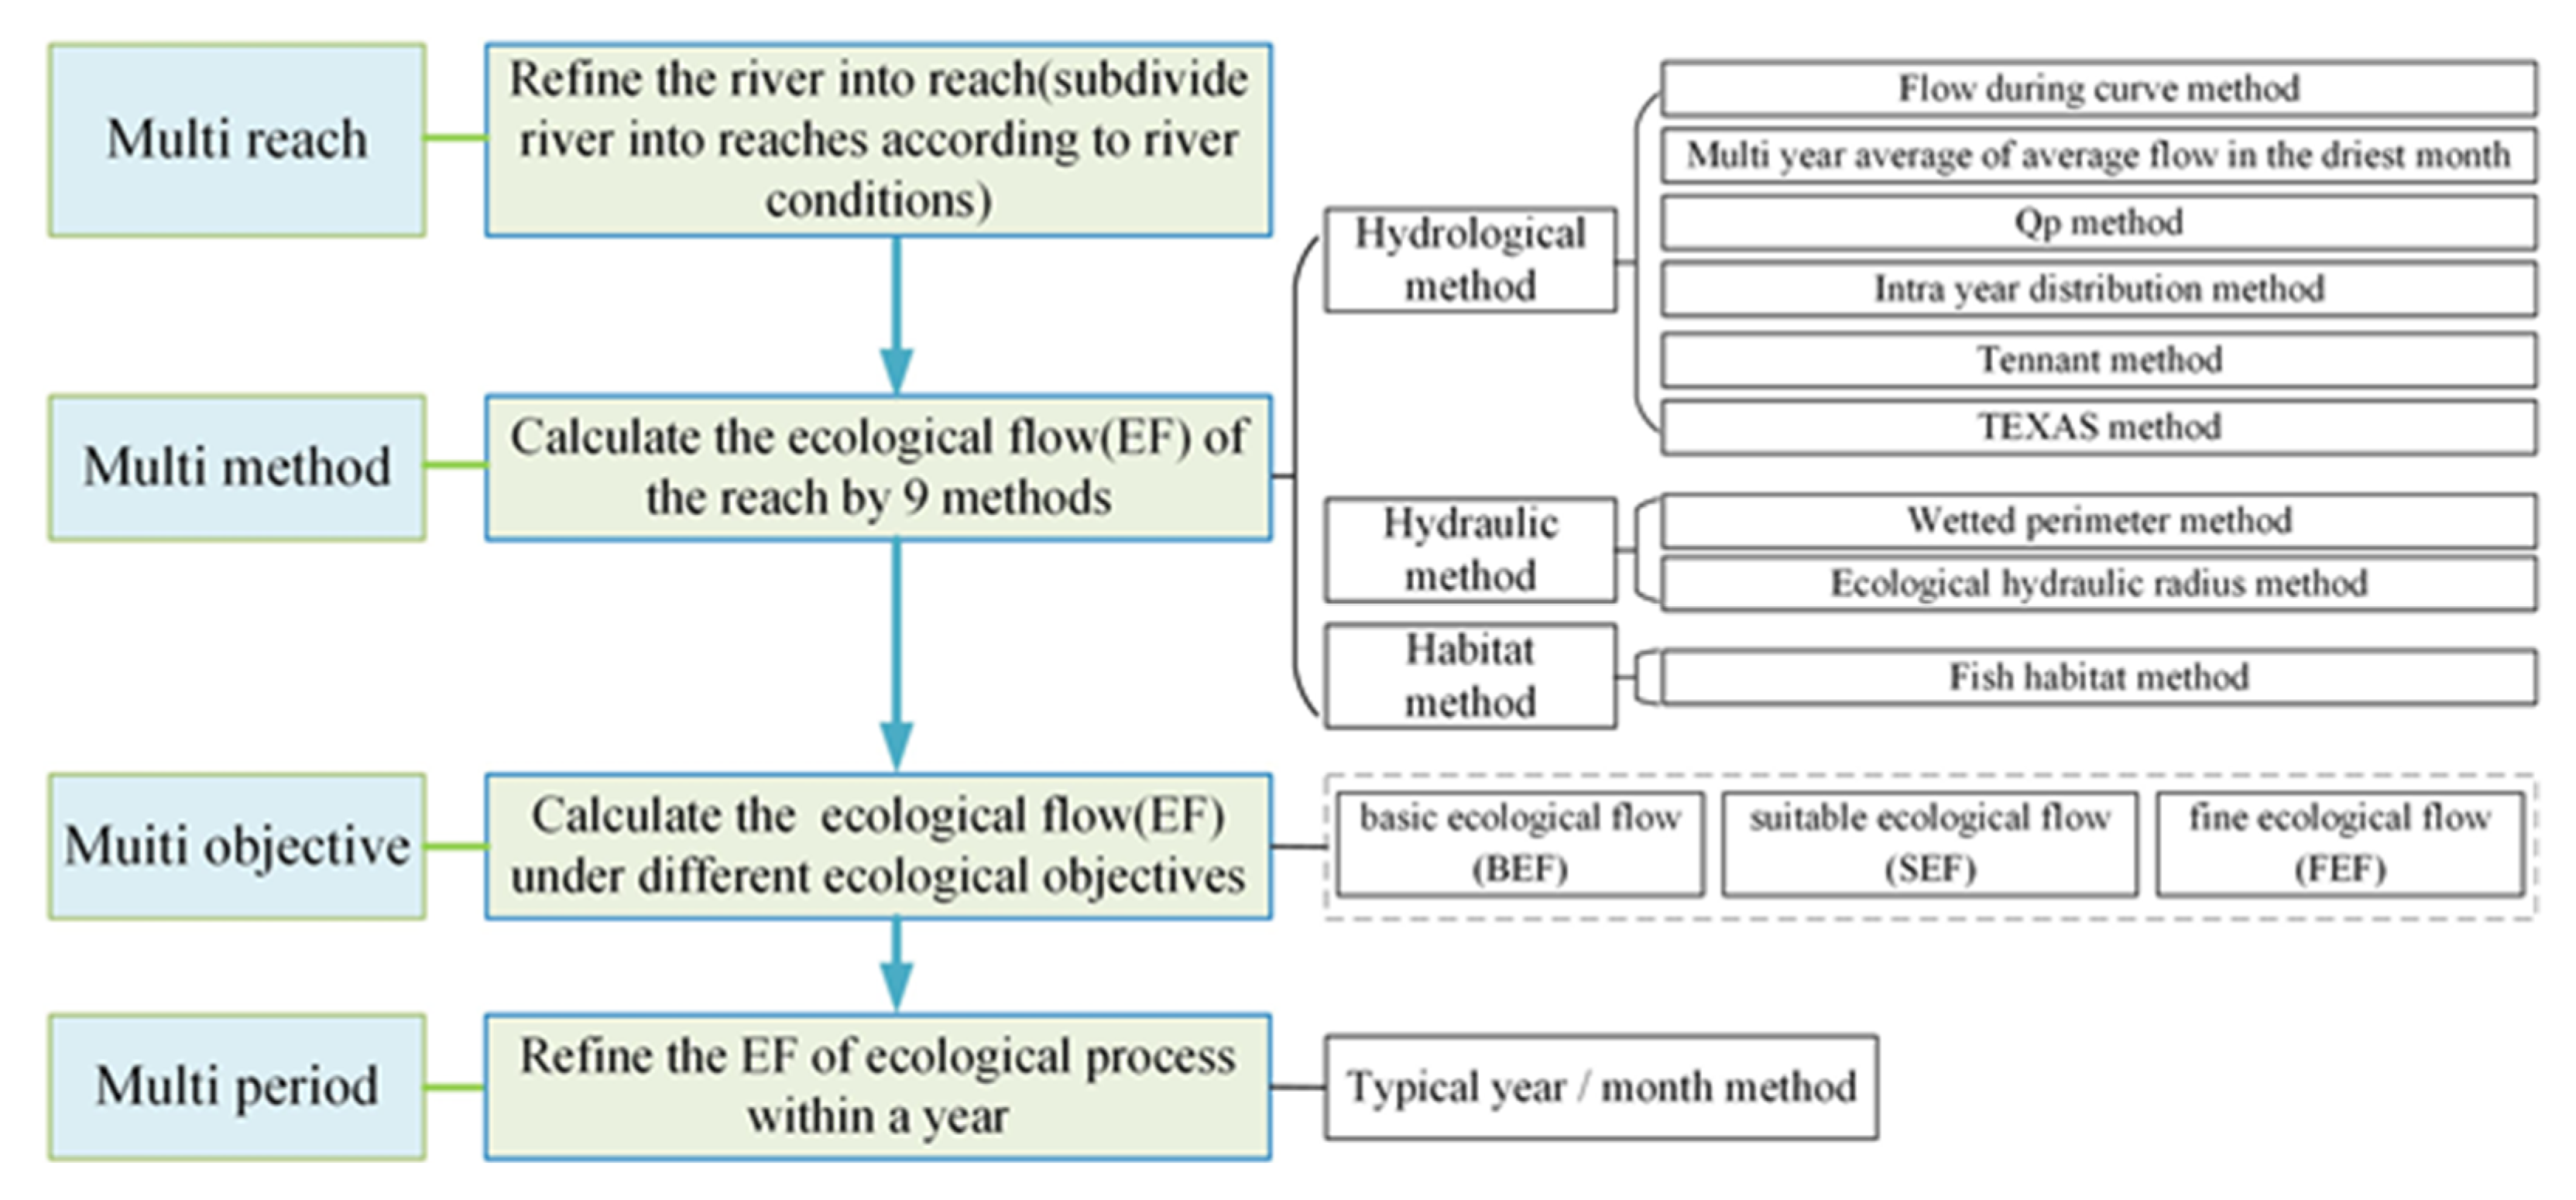
In order to accurately and finely calculate EF, multiple methods are integrated, and the theory and method of time-sharing and segmented ecological water demand refinement calculation under a multi-objective approach are put forward, to obtain the EF of the rivers in different periods, different reaches, and different ecological objectives. This consists of the following four main steps. First, the river is subdivided into reaches; Second, the EF of each reach is calculated by various methods, then the results for the rivers in mountainous and plain areas are assessed and collected. Third, EF under different ecological restoration objectives are calculated. Fourth, the ecological flow demand for each period of the year is refined. The refined calculation steps of multi-objective ecological flow in rivers are shown in Figure 3.

2.2.1. River Refinement

Due to the different channel characteristics and the influence of human activities, the water resources, water ecological characteristics, and EF in different reaches of the same river are also different. Therefore, the river is subdivided into reaches according to the principle of dividing branches and tributaries, the distribution of upstream reservoirs, the boundary of hilly plains, the distribution of hydrological stations and water replenishment nodes, and the distribution of population and other factors.

2.2.2. Integration of Multiple Methods

Three categories and nine methods are used to calculate river EF, hydrological methods, consisting of the flow-duration curve method, the multi-year average of average flow in the driest month, the QP method, the intra-year distribution method, the Tennant method, and the TEXAS method; hydraulic methods consisting of the wetted perimeter method and the ecological hydraulic radius method; and a habitat method consisting of the fish habitat method. Common methods are not introduced in detail. The following describes three of the methods employed: the flow-duration curve method, the intra-year distribution method, and the ecological hydraulic radius method.
(1)
Flow-duration curve method
According to the data of historical flow, the daily flow frequency curve is drawn at each hydrological station based on the monthly scale, taking the flow corresponding to a 90% guarantee rate as the BEF, to a 50% guarantee rate as the SEF, and to a 20% guarantee rate as the FEF. In this way, the basic, suitable, and fine ecological flow processes on a monthly scale can be obtained.
(2)
Intra-year distribution method
According to the long-term natural runoff of hydrological stations, the annual average runoff Q ¯ , the minimum annual runoff Q ¯ m i n , and the ratio of mean value in the same period γ are calculated. The Q i of each month is calculated in combination with the process of annual average monthly runoff.
Q m o n t h = 1 n j = 1 n q i j                 Q ¯ = 1 12 i = 1 12 Q m o n t h
q m i n i = m i n q i j           j = 1 , 2 , , n           Q ¯ m i n = 1 12 i = 1 12 q m i n i  
γ = Q ¯ m i n / Q ¯                 Q i = q i ¯ × γ  
where Q m o n t h is the average monthly runoff in the ith month, q min i is the minimum average monthly runoff in the ith month, and q i j is the average monthly runoff in the ith month of the jth year.
(3)
Ecological hydraulic radius method
This method makes full use of aquatic biological information (fish spawning and migration velocity) and river information (water level, velocity, roughness, etc.) to estimate the ecological water demand in the river.
v = C ( R J ) 1 / 2  
R = n 3 / 2 v 3 / 2 J 3 / 4  
Q = 1 n R 2 / 3 A J 1 / 2  
where R is the ecological hydraulic radius, A is the cross-sectional area, n is the roughness, v is the velocity, and J is the hydraulic gradient.
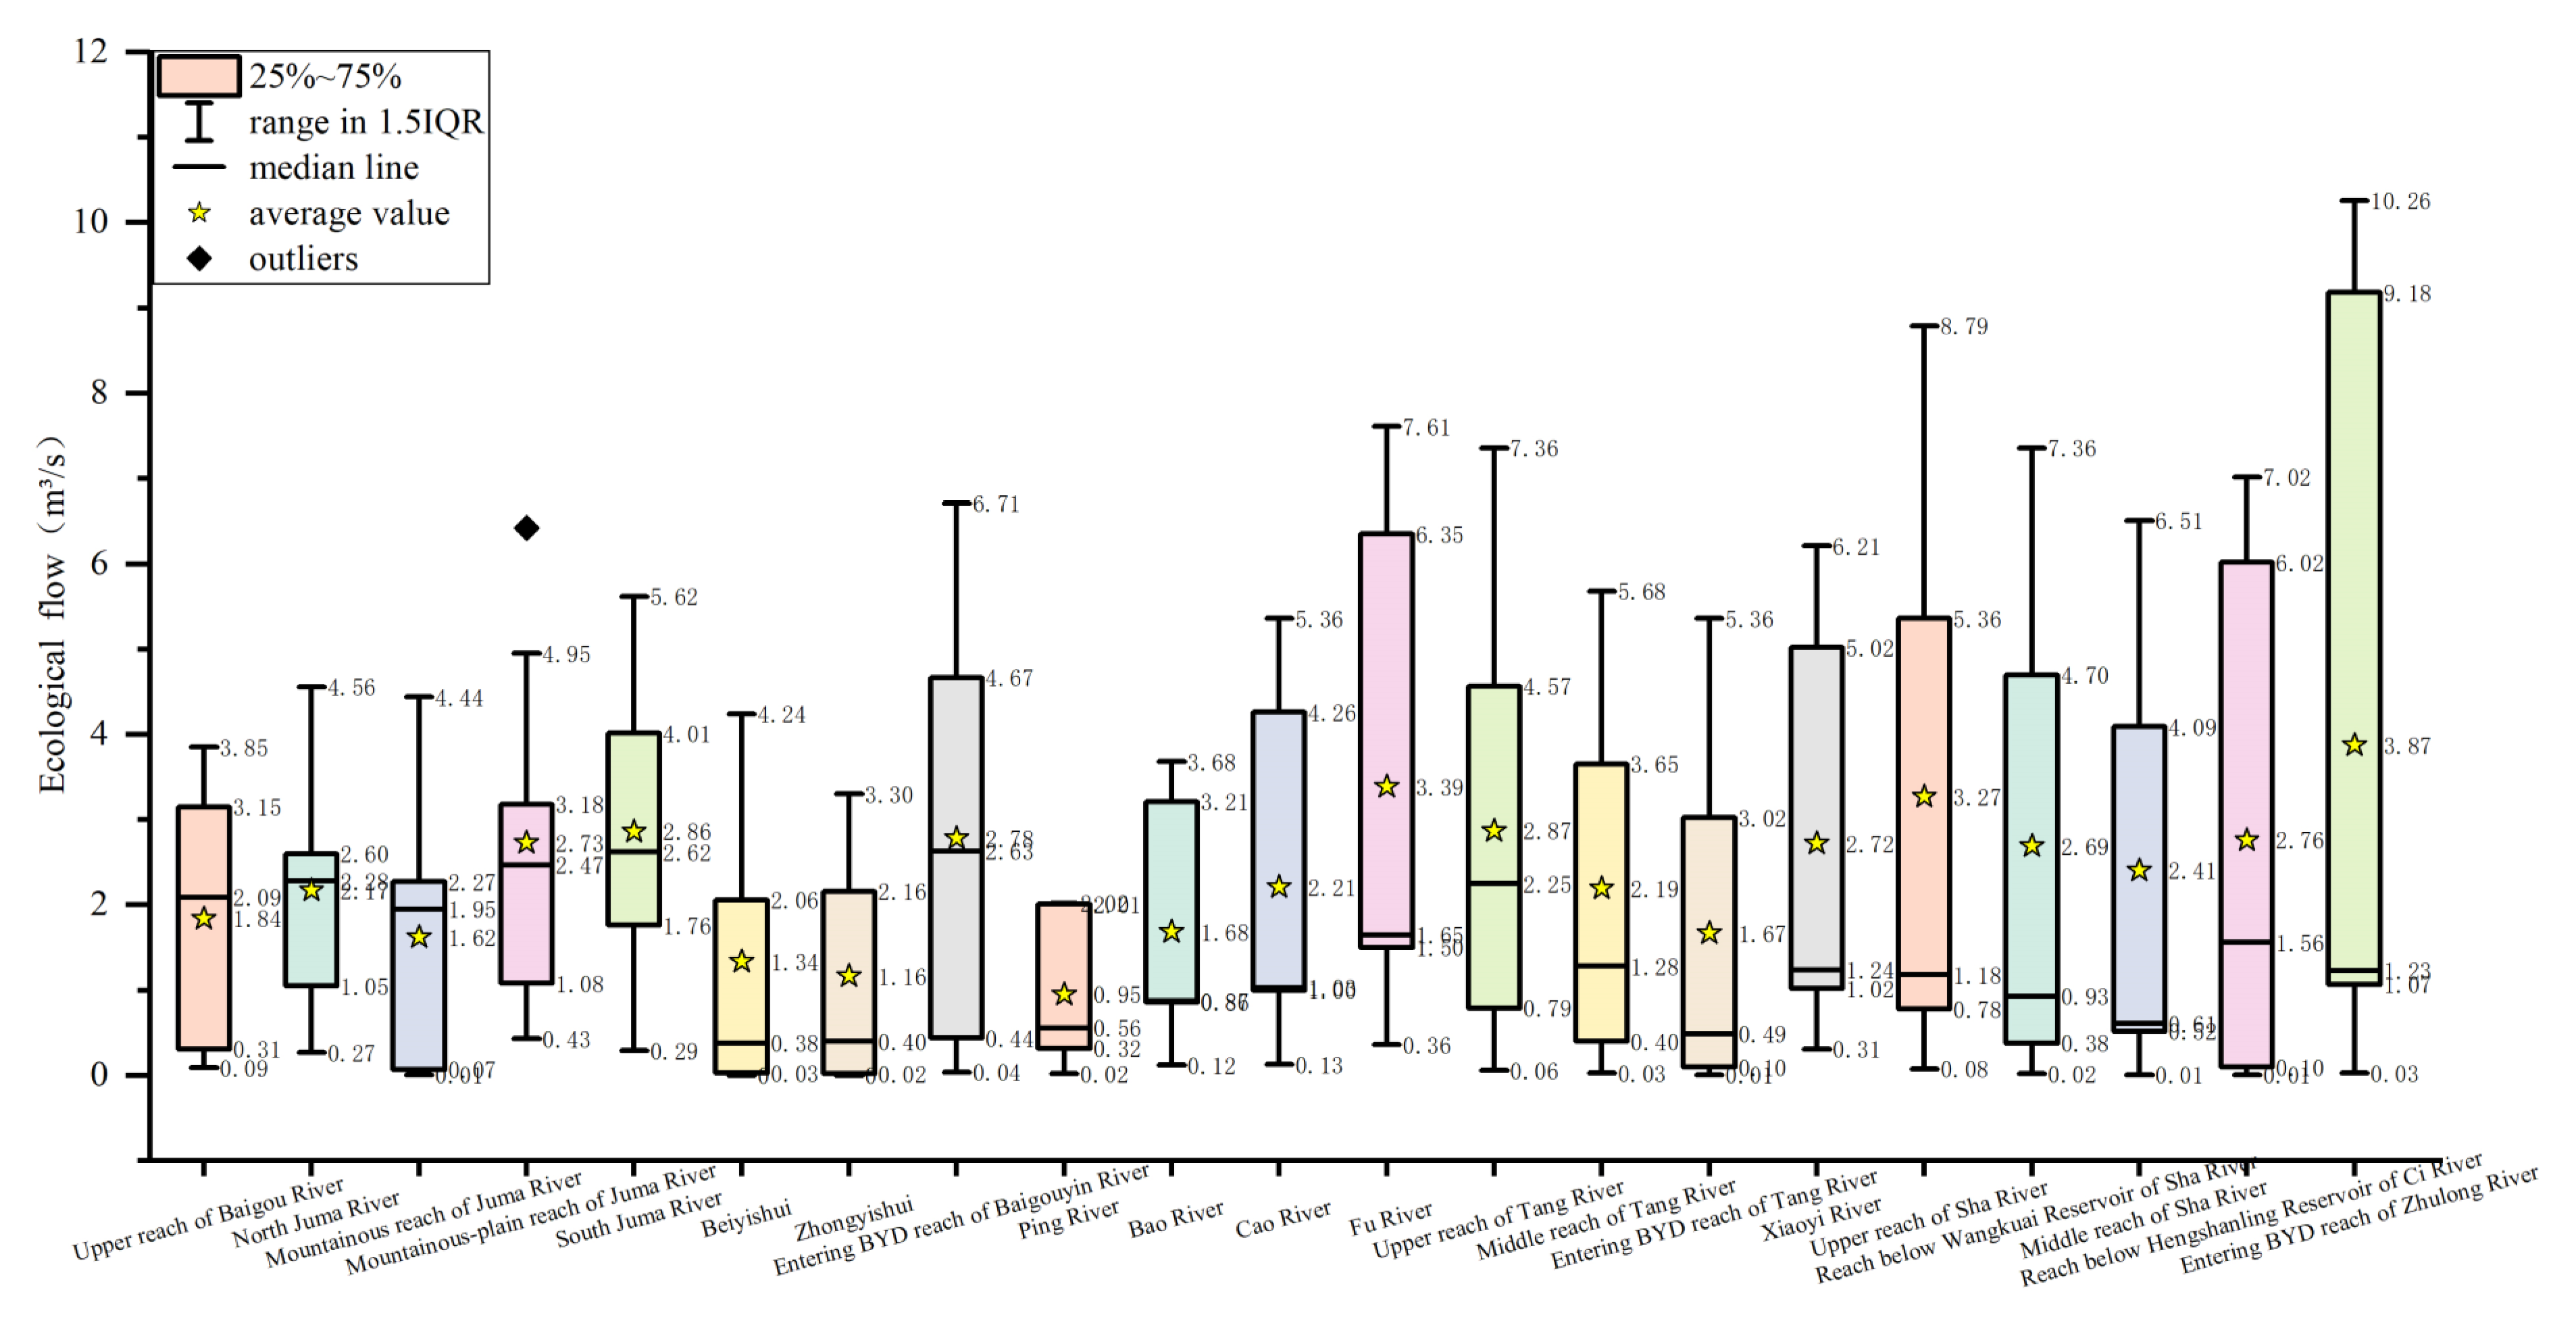
By analyzing the quantile of the results calculated by the nine methods, a box diagram is drawn, and a unique value is selected as the EF of each reach. In order to eliminate the differences caused by different methods and realize the ecological restoration and restore the flow state of the river as much as possible, the greater of the median and average values of the calculation results of the nine methods are taken as the EF of the reach in the plain area. Because there is neither reservoir discharge nor external water source guarantee in the upstream mountainous area, its ecological flow is maintained by natural runoff, and the flow-duration curve method can better reflect its ecological demand. Therefore, the calculation result of the flow-duration curve method is selected as its EF in the mountainous area.
E F = max m e d i a n , a v e r a g e   b y   9   m e t h o d s ,   i n   t h e   p l a i n   a r e a t h e   r e s u l t   o f   f l o w   d u r i n g   c u r v e   m e t h o d , i n   t h e   m o u n t a i n o u s   a r e a

2.2.3. Ecological Flow under Multi-Objective

The EF in rivers refers to the amount of water required to maintain the normal growth of aquatic organisms, protect the growth and survival of special species, improve the water quality, and maintain the balance of water, sediment, and salt. The purpose of ecological flow research is to avoid ecological disasters. It is necessary to study critical water conditions. The critical point corresponds to the state of abrupt change. The first is the condition of water itself, corresponding to the basic ecological flow (BEF); the second is the integrity of species, corresponding to the suitable ecological flow (SEF); the third is to maintain the stability of ecosystems inside and outside the river and ensure species diversity, corresponding to fine ecological flow (FEF). Basic ecological flow refers to the water condition when the river is at the edge of a critical state (such as flow interruption and drying up), and only basic flow maintains the minimum ecological service value. Its physical meaning is to maintain the minimum flow of the size of the river as large as possible, which means that when the flow is greater than the basic ecological flow, the size of the river changes little; however, when the flow is lower than the basic ecological flow, the size of the river decreases rapidly. Appropriate ecological flow refers to the minimum flow to maintain the basic integrity of aquatic species. In other words, the water flow can maintain healthy reproductive conditions and appropriate populations of aquatic species, and ensure their basic integrity. Fine ecological flow refers to the flow process conducive to maintaining the stability of the ecosystem inside and outside the river and ensuring species diversity, that is, restoring the natural ecological service function, diversifying the ecological landscape, and having a certain amount of water resources for human use. The ecological flow under a multi-objective approach is shown in Table 1.

2.2.4. Process of Ecological Flow under Multi-Period

In order to effectively evaluate the annual EF process of a river, considering the differences of EF in different periods of a year, the typical year/month method is used to refine the annual ecological water demand to periods (month or day), and the EF is refined from an interannual to an intra-year daily process. The specific calculation process is as follows.
A year whose annual flow is closest to the multi-year average flow is selected, and the annual EF is allocated month by month according to the monthly flow process of that year. The allocation principle of each month is the same, that is, select a month of a year whose monthly flow is closest to the multi-year average monthly flow, and allocate the monthly EF to each day according to the daily flow process of that month. The steps for selecting a typical year are as follows. The year in which the flow modulus a of the reach is closest to one as the typical year is selected. If two or more are close to each other, the modulus deviation CV of each station sequence is the smallest in a typical year. The calculation formula of a is as follows.
a = i = 1 n Q x / Q n
where a is the flow modulus, Q x is the annual flow of the ith hydrological station in the reach (m3/s), Q is the annual average flow of the ith hydrological station in the reach (m3/s), and n is the number of hydrological stations.

3. Results

3.1. Basic Ecological Flow

The eight rivers upstream of the BYDB are divided into 21 reaches. The division results are shown in Figure 4. Nine methods are used to calculate the EF of the 21 reaches of the eight rivers entering BYD. Since the 1980s, due to the interception of upstream reservoirs and large-scale water intake by human activities, the rivers in the downstream plain area have dried up. By the beginning of this century, they have been dried up almost all year round (the measured flow is zero). Therefore, in order to restore the natural flow of the river, when the hydrological methods are used to calculate the EF, the time series of the upstream mountainous reaches are taken from 1956–2018, while the time series of the downstream plain reaches are taken from 1956–1980. The results of the annual BEF are shown in Table 2.
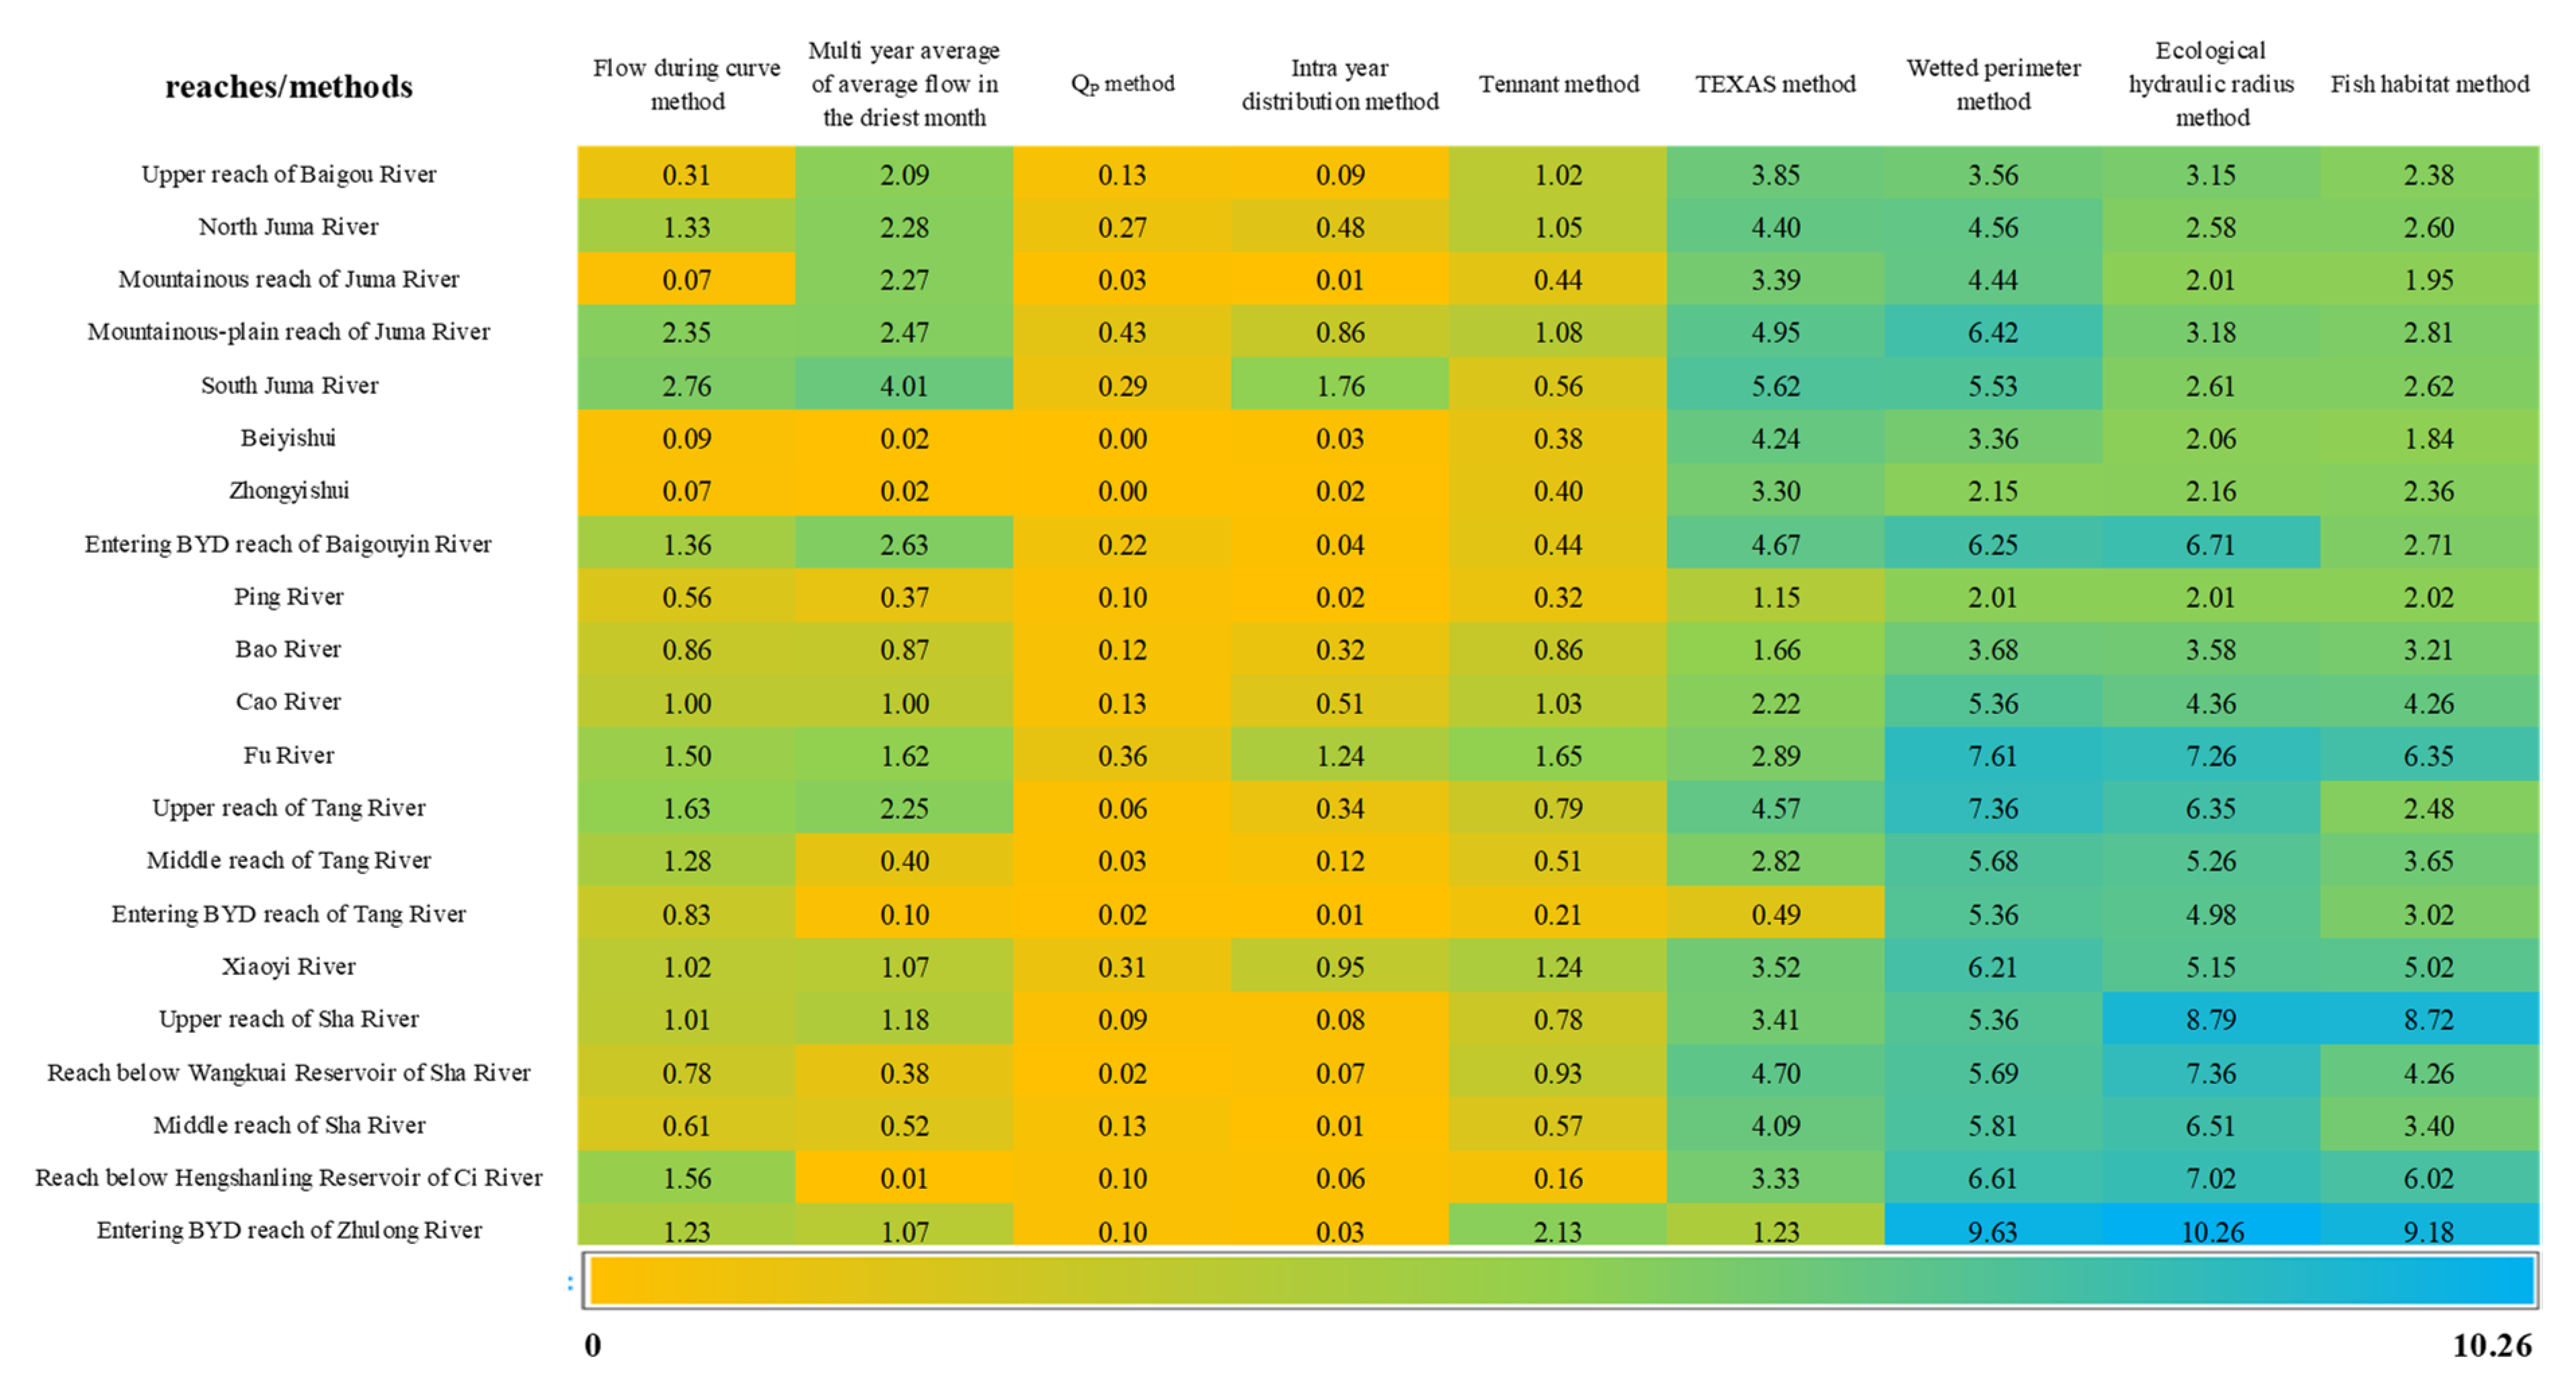
The BEF of the 21 reaches calculated by nine methods are analyzed by drawing a heat map. It can be seen from Figure 5 that the calculation results of hydraulic methods and habitat methods are generally greater than those of hydrological methods. The calculation principles of the first two methods are river section parameters (width, roughness, slope coefficient, etc.) and ensuring certain habitat conditions (flow velocity, water depth, etc.), thus the BEF is large. The principle of hydrology-based methods is to calculate the ecological water demand based on the historical flow. A small historical flow leads to a small calculation result of EF. When the flow demand of each of the eight rivers is considered, the ecological flow demands of the Baigou River and Zhulong River are larger, those of the Fu River, Tang River, and Xiaoyi River are second, and those of the Ping River, Bao River, and Cao River are the least. Through analyzing the quantiles of the results calculated by the nine methods, a box diagram (Figure 6) is drawn to clearly and intuitively see the range of values in each reach. Using Formula (2), a unique value is selected as the BEF demand of every reach, as shown in Table 3.

3.2. Ecological Flow under Multi-Objective

According to the calculation standard of the Tennant method, the basic ecological water demand in a river is set as follows: 10% of the multi-year average monthly flow is taken as the basic ecological water demand in the dry season (October to May of the next year) and 20% of the multi-year average monthly flow is taken as the basic ecological water demand in the wet season (June to September). The suitable ecological water demand is set as follows: 20% of the multi-year average monthly flow is taken as the suitable ecological water demand in the dry season and 40% of the multi-year average monthly flow is taken as the suitable ecological water demand in the wet season. The fine ecological water demand is set as follows: 40% of the multi-year average monthly flow is taken as the fine ecological water demand in the dry season and 80% of the multi-year average monthly flow is taken as the fine ecological water demand in the wet season. Learning from the calculation idea of EF under different objectives by Tennant, the BEF is taken as the benchmark to calculate the SEF and FEF. The results are shown in Table 3. The spatial distribution of EF of each reach under a multi-objective approach is shown in Figure 7.
According to Table 2 and Figure 7, the calculation results of EF in the eight rivers entering BYD are as follows, the BEF, SEF, and FEF of each reach in the Baigou River are 0.07–2.86 m3/s, 0.10–7.91 m3/s, and 0.12~14.73 m3/s, respectively. For the Ping River, they are 0.95 m3/s, 2.56 m3/s, and 4.23 m3/s, respectively. For the Bao River, they are 1.68 m3/s, 4.60 m3/s, and 8.24 m3/s, respectively. For the Cao River, they are 2.21 m3/s, 6.09 m3/s, and 11.16 m3/s, respectively. For the Fu River, they are 3.39 m3/s, 9.39 m3/s, and 17.65 m3/s, respectively. For the Tang River, they are 1.63–2.19 m3/s, 4.46–6.03 m3/s, and 7.97–11.05 m3/s, respectively. For the Xiaoyi River, they are 2.72 m3/s, 7.52 m3/s, and 13.96 m3/s, respectively. For the Zhulong River, they are 1.01–3.87 m3/s, 2.73–10.74 m3/s, and 4.56–20.29 m3/s, respectively. In terms of spatial distribution, the Ping River has the lowest demand and the Zhulong River has the largest demand for ecological flow.

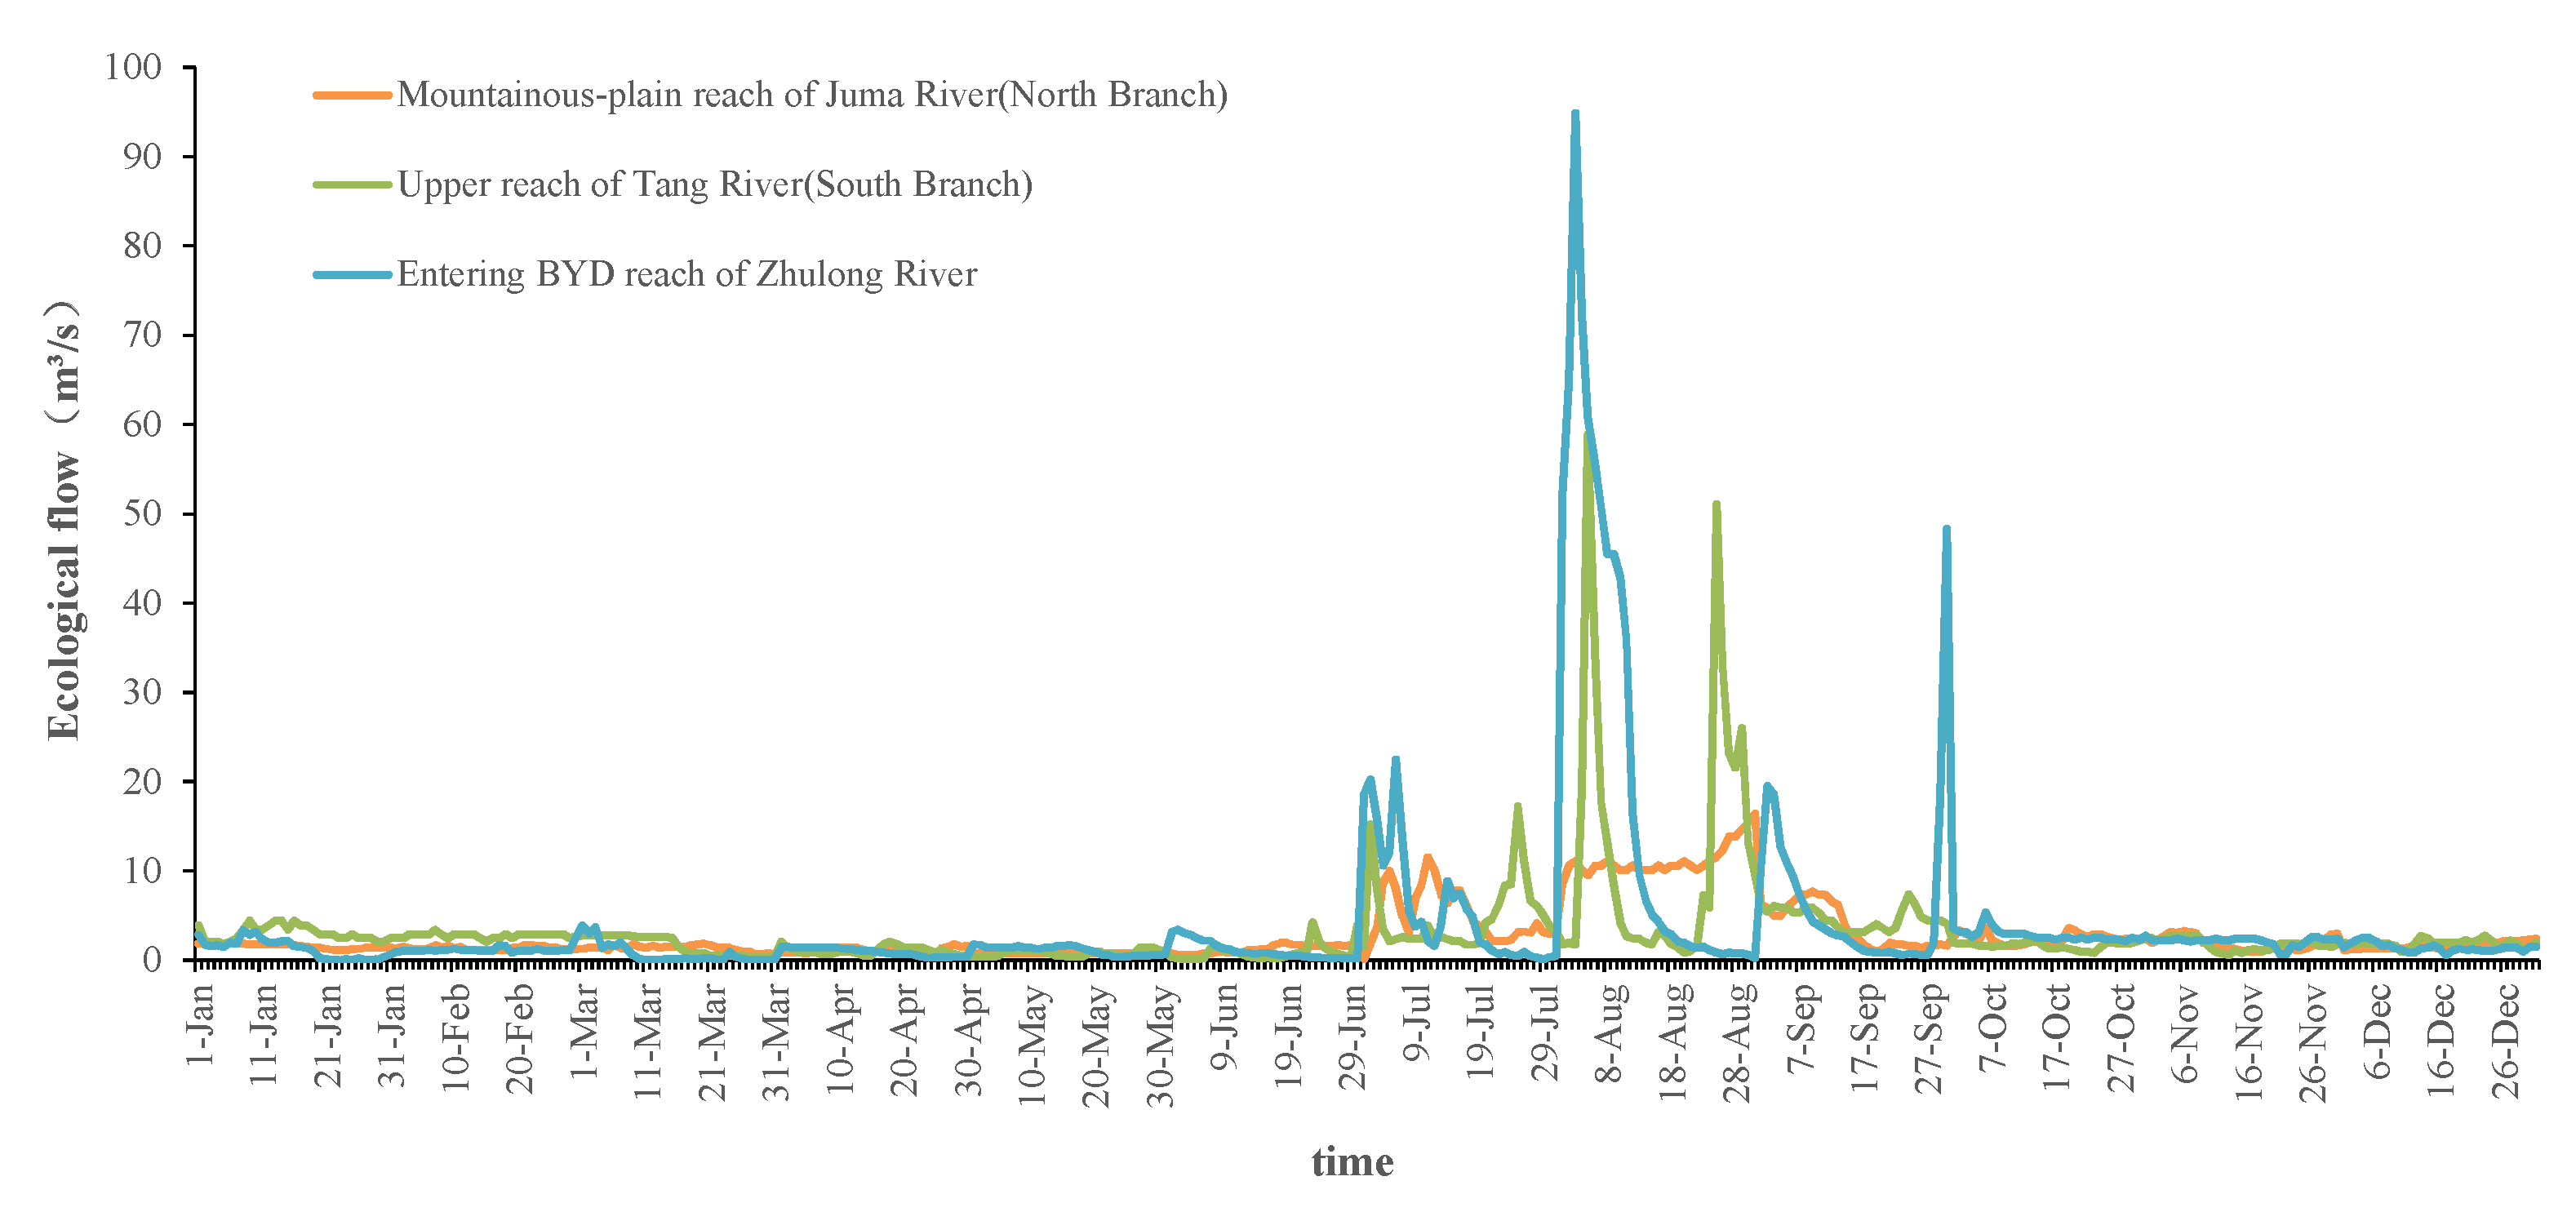
3.3. Annual Water Demand Process

The typical year/month method is employed, i.e., formula (8), and the EF in 21 reaches is refined to the daily process demand. In this paper, three typical reaches are selected, the North Branch, the South Branch, and the Flowing-into-the-BYD reach, respectively. Taking the mountainous-plain reach of the Juma River in the North Branch, the upper reach of the Tang River in the South Branch, and the Flowing-into-the-BYD reach of the Zhulong River in the plain area as examples, the annual (daily) ecological water demand process is shown in Figure 8. The EF demand in the mountainous-plain reach of Juma River is small, and the demand is the largest in August of the year. The average value in August is 10.44 m3/s, and the maximum value is 16.4 m3/s. The EF demand in the upper reach of the Tang River is at a medium level. The demand is the largest in early and late August of the year, with an average value of 11.98 m3/s and a maximum value of 58.9 m3/s in August. The EF demand of the Flowing-into-the-BYD reach of the Zhulong River is the largest. The demand is the highest in early August and the end of September. In August, the average value is 21.33 m3/s and the maximum value is 94.9 m3/s, while in September, the average value is 6.36 m3/s and the maximum value is 48.3 m3/s.

4. Discussion

According to the <Specification for calculation of environmental flow in rivers and lakes>, Gao et al. calculated the basic and target EWRs in the BYDB, analyzed the satisfaction degree of the current ecological water demand, and put forward ecological water compensation measures. They concluded that the total EWRs for the basic ecological environment in the rivers is 200 million m3/a. The largest EWR is 61 million m3/a in the Zhulong River, and the second largest is that of the Baigou River and the Tang River, at 52 million m3/a and 45 million m3/a, respectively. The EWR in the Ping River, Bao River, Cao River, Fu River, and Xiaoyi River is about 10 million m3/a. In terms of the water quantity, the calculation result is smaller than that in this paper, because they use the hydrological method to calculate the EWRs, and the hydrological method, hydraulic method, and habitat method are integrated in this study. The principle of the hydrology method is to calculate EWRs based on the historical flow. A small historical flow leads to a small calculation result of ecological flow; however, the principles of the hydraulic method and the habitat method are river parameters and ensuring certain habitat conditions, resulting in large calculation results of ecological flow. In terms of spatial distribution, the conclusions are fundamentally the same, that is, the ecological water demand of the Zhulong River and the Baigou River is relatively large.
From the perspective of maintaining ecological base flow, the minimum EWRs of eight rivers in the upper reaches of the BYDB are calculated by Yang et al. The calculation of EWRs is mainly based on the measured runoff before the 1980s, using the Tennant method, and taking 30% of the annual average runoff as the ecological base flow standard in flood season (June to September) and 10% in non-flood season. For rivers without measured runoff series, an analogy is made according to the watershed area. The conclusion is that the minimum EWRs of the eight rivers is 338 million m3/a, among which, the largest EWRs, 133 million m3/a, is of the Zhulong River, followed by that of the Baigou River and the Tang River, at 82 million m3/a and 54 million m3/a, respectively. Because they divided different periods (flood season and non-flood season) to calculate EWRs, the results are largely consistent with this study. At the same time, they pointed out that their stated EWRs corresponding to the ecological base flow is only the result of theoretical calculation. The huge groundwater funnel caused by the long-term drying of the riverbed and the overexploitation of groundwater has caused the disorder of the transformation relationship between surface water and groundwater. Therefore, the preliminary calculation of the minimum EWRs is only for reference. Before the regional groundwater level is restored, the river water ecosystem cannot be restored by meeting the minimum EWRs, but the calculated EWRs can be used as a basic goal for the gradual restoration of river ecology.
It can be seen that different scholars have different ideas about EWRs, results for the same region can be significantly different, even if the same method is used, and different processing methods will lead to different results. In these methods, natural runoff cannot meet the EWRs, and they largely ignore the basic make-up of the river and conceal the proper appearance of the river, thus overestimating the EWRs and exceeding the natural carrying capacity of the river. Different from the above scholars, the study in this paper reduces the impact of human factors on the ecological environment, reduces subjective factors, and is more objective. In addition, in the present study, the natural runoff is taken as the reference value, which restores the proper appearance of the river, and ensures that the EF are within the natural carrying capacity of the river.
According to the EF in the BYDB, in this paper, data support is provided for formulating a regulation plan of ecological flow, which realizing ecological flow guarantee under different years, different ecological water requirements objectives, and different water inflow scenarios. Finally, our results will support the establishment of a scientific and long-term water supply mechanism in the BYDB, repairing the water ecology, and forming a water guarantee pattern of interconnecting the upstream and downstream areas in the basin and the internal and external areas, coordinating the multiple water sources.

5. Conclusions

Considering the changes in EF demand of a river ecosystem in different periods, and recognizing that, even if the same river has different development degrees from top to bottom, its EF demands are also distinct, a refined calculation method of EF division based on time and space is proposed in this study. At the same time, according to the consideration of a “multi-objective” approach to ecological restoration in the future, the ecological flows under the three-level ecological objectives are defined, namely, basic, suitable, and fine ecological flow. Three methods, namely, hydrology methods, hydraulics methods, and habitat methods, are selected to finely calculate river EF in different periods, in different reaches, and under different ecological objectives. This approach breaks through the traditional EWR calculation method based on hydrology and develops a river EF calculation method based on ecological protection objectives. The EF is calculated in this study, rather than the traditional EWRs, which provides data support for the regulation of ecological flow.
Taking rivers entering BYD in the BYDB as an example, nine methods are used to finely calculate the ecological water demand across time and space to ensure the ecological flow process under different ecological objectives. Finally, the EF demand of different rivers entering BYD under different ecological objectives at different times is calculated. The results show that the range of BEF demand is 0.07–3.87 m3/s, the range of SEF demand is 0.51–10.74 m3/s, and the range of FEF demand is 0.71–20.29 m3/s. In terms of spatial distribution, the Ping River has the lowest demand and the Zhulong River has the largest demand for EF. In terms of interannual EF demand, the Baigou River, Fu River, Xiaoyi River, and Zhulong River have larger demand. In the demand process across the year, the demand is the largest from July to September, while the demand is the smallest from March to May.
The value of this study lies in the refined calculation of multi-objective and multi-period ecological flow in rivers to provide strong support for river ecological restoration. The research results are of great significance for supporting the green development of the Xiongan New Area and ecological restoration in the basin. In addition, most of the rivers in northern China are facing problems such as runoff reduction, river drying, and ecological degradation. This study also has insights and reference significance for other similar regions.

Author Contributions

Conceptualization, Y.J. and C.L.; methodology, Y.J.; software, Y.J. and Y.C.; validation, Y.J., J.L. and Z.X.; formal analysis, J.L.; investigation, C.L. and Y.C.; resources, C.L. and Z.X.; data curation, J.L.; writing—original draft preparation, Y.J.; writing—review and editing, Y.J. and J.L.; visualization, C.L.; supervision, Z.X.; project administration, C.L.; funding acquisition, C.L. All authors have read and agreed to the published version of the manuscript.

Funding

This research was funded by the Major Science and Technology Program for Water Pollution Control and Treatment (2018ZX07110001), the National Natural Science Foundation of China (51822906), and the National Key Research & Development Project (2017YFC1502405).

Data Availability Statement

Data is unavailable due to the confidentiality.

Conflicts of Interest

The authors declare no conflict of interest.

References

  1. Chen, M.; Wang, G.; Feng, H.; Wang, L. The Calculation of River Ecological Flow for the Liao Basin in China. Procedia Eng. 2012, 28, 715–722. [Google Scholar]
  2. Xu, F.; Yang, Z.F.; Zhao, Y.W.; Chen, B. Effects of Water Recharge on Ecosystem Health in Baiyangdian Lake, China. Procedia Environ. Sci. 2010, 2, 349–358. [Google Scholar] [CrossRef] [Green Version]
  3. Mao, X.; Yang, Z.; Chen, B.; He, C. Examination of wetlands system using ecological network analysis: A case study of Baiyangdian Basin, China. Procedia Environ. Sci. 2010, 2, 427–439. [Google Scholar] [CrossRef] [Green Version]
  4. Ying, Z.; Yang, Z.; Li, Y. Investigation of water pollution in Baiyangdian Lake, China. Procedia Environ. Sci. 2010, 2, 737–748. [Google Scholar]
  5. Xu, F.; Yang, Z.F.; Chen, B.; Zhao, Y.W. Ecosystem Health Assessment of Baiyangdian Lake Based on Thermodynamic Indicators. Procedia Environ. Sci. 2012, 13, 2402–2413. [Google Scholar] [CrossRef] [Green Version]
  6. Si, J.; Feng, Q.; Yu, T.; Zhao, C. Inland river terminal lake preservation: Determining basin scale and the ecological water requirement. Environ. Earth Sci. 2015, 73, 3327–3334. [Google Scholar] [CrossRef]
  7. Yu, Z.; Zhang, J.; Zhao, J.; Peng, W.; Fu, Y.; Wang, Q.; Zhang, Y. A new method for calculating the downstream ecological flow of diversion-type small hydropower stations. Ecol. Indic. 2021, 125, 107530. [Google Scholar] [CrossRef]
  8. Covich, A.P. Water and ecosystems. In Water in Crisis: A Guide to the World’s Fresh Water Resources; Gleick, P.H., Ed.; Oxford University Press: New York, NY, USA, 1993. [Google Scholar]
  9. Gleick, P.H. Water in crisis: Paths to sustainable water use. Ecol. Appl. 1998, 8, 571–579. [Google Scholar] [CrossRef]
  10. Hahn, G.L.; Mader, T.L.; Eigenberg, R.A. A global perspective on environmental flow assessment: Emerging trends in the development and application of environmental flow methodologies for rivers. River Res. Appl. 2003, 19, 397–441. [Google Scholar]
  11. Chou, W.C.; Chuang, M. Habitat evaluation using suitability index and habitat type diversity: A case study involving a shallow forest stream in central Taiwan. Environ. Monit. Assess. 2010, 172, 689–704. [Google Scholar] [CrossRef]
  12. Jia, H.; Ma, H.; Wei, M. Calculation of the minimum ecological water requirement of an urban river system and its deployment: A case study in Beijing central region. Ecol. Model. 2011, 222, 3271–3276. [Google Scholar] [CrossRef]
  13. Jin, X.; Yan, D.H.; Wang, H.; Zhang, C.; Tang, Y.; Yang, G.Y.; Wang, L.H. Study on integrated calculation of ecological water demand for basin system. Sci. China (Technol. Sci.) 2011, 54, 2638–2648. [Google Scholar] [CrossRef]
  14. Yang, F.; Xia, Z.; Yu, L.; Guo, L. Calculation and analysis of the instream ecological flow for the Irtysh River. Procedia Eng. 2012, 28, 438–441. [Google Scholar] [CrossRef] [Green Version]
  15. Shang, S. A general multi-objective minimum ecological flow water bodies programming model for or water level of inland. J. Arid Land 2015, 7, 166–176. [Google Scholar] [CrossRef]
  16. Tan, G.; Yi, R.; Chang, J.; Shu, C.; Yin, Z.; Han, S.; Feng, Z.; Lyu, Y. A new method for calculating ecological flow: Distribution flow method. AIP Adv. 2018, 8, 045118. [Google Scholar] [CrossRef]
  17. Zhang, H.; Chang, J.; Gao, C.; Wu, H.; Wang, Y.; Lei, K.; Long, R.; Zhang, L. Cascade hydropower plants operation considering comprehensive ecological water demands. Energy Convers. Manag. 2019, 180, 119–133. [Google Scholar] [CrossRef]
  18. Zhang, C.; Wan, Z.; Jing, Z.; Zhang, S.; Zhao, Y. Calculation of ecological water requirements of urban rivers using a hydrological model: A case study of Beiyun River. J. Clean. Prod. 2020, 262, 121368. [Google Scholar] [CrossRef]
  19. Wang, L.; Chen, Q.; Zhang, J.; Xia, J.; Wang, J. Incorporating fish habitat requirements of the complete life cycle into ecological flow regime estimation of rivers. Ecohydrology 2020, 13, e2204. [Google Scholar] [CrossRef]
  20. Fu, Y.; Leng, J.; Zhao, J.; Na, Y.; Wu, W. Quantitative Calculation and Optimized Applications of Ecological Flow based on Nature-based Solutions. J. Hydrol. 2021, 598, 126216. [Google Scholar] [CrossRef]
  21. Gu, B.; Wang, F.; Song, L. Calculation and configuration of ecological water requirements for Yongding river Guanting Gorge. Beijing Water 2017, 2, 12–18. [Google Scholar]
  22. Alonso, P.E.; Gómez Ma, A.; Saldaña, P. Requirements to Implement Environmental Flow in Mexico; Editorial IMTA-Alianza: Morelos, Mexico, 2007. [Google Scholar]
  23. Sedighkia, M.; Abdoli, A.; Datta, B. Optimizing monthly ecological flow regime by a coupled fuzzy physical habitat simulation–genetic algorithm method. Environ. Syst. Decis. 2021, 41, 425–436. [Google Scholar] [CrossRef]
  24. Baruah, A.; Sarma, A.K. Ecological flow assessment using hydrological and hydrodynamic routing model in Bhogdoi river, India. Model. Earth Syst. Environ. 2021, 7, 2453–2462. [Google Scholar] [CrossRef]
Figure 1. Location, rivers, and stations of the study area.
Water 15 01003 g001
Figure 2. Water attenuation trends from 1956 to 2018 in the BYDB.
Water 15 01003 g002
Figure 3. Refined calculation steps of multi-objective ecological flow in rivers.
Water 15 01003 g003
Figure 4. Reaches of eight rivers entering the BYD.
Water 15 01003 g004
Figure 5. The heat map of BEF calculated by the nine methods for 21 river reaches flowing into BYD.
Water 15 01003 g005
Figure 6. The box diagram of BEF calculated by the nine methods for 21 river reaches flowing into BYD.
Water 15 01003 g006
Figure 7. The spatial distribution of EF in each reach.
Water 15 01003 g007
Figure 8. The daily EF demand process in typical reaches.
Water 15 01003 g008
Table 1. Connotations of ecological flow under multi-objective.
Target EFEcological ConnotationsExplanations
BEFbasic ecological functionwater condition when a river is at the edge of a critical state
SEFintegrity of speciesthe minimum flow to maintain the basic integrity of aquatic species
FEFmaintain the stability of ecosystemswith the natural ecological service function, diversifying the ecological landscape, and having a certain amount of water resources for use
Table 2. Calculation results of BEF by 9 methods (unit: m3/s).
Serial NumbersRiversReachesHydrological MethodsHydraulic MethodsHabitat Methods
Flow-Duration Curve MethodsMulti-Year Average of Average Flow in the Driest MonthQp MethodIntra-Year Distribution MethodTennant MethodTEXAS MethodWetted Perimeter MethodEcological Hydraulic Radius MethodFish Habitat Method
1Baigou RiverUpper reach of Baigou River0.312.090.130.091.023.853.563.152.38
2North Juma River1.332.280.270.481.054.404.562.582.60
3Mountainous reach of Juma River0.072.270.030.010.443.394.442.011.95
4Mountainous-plain reach of Juma River2.352.470.430.861.084.956.423.182.81
5South Juma River2.764.010.291.760.565.625.532.612.62
6Beiyishui0.090.020.000.030.384.243.362.061.84
7Zhongyishui0.070.020.000.020.403.302.152.162.36
8Entering BYD reach of Baigouyin River1.362.630.220.040.444.676.256.712.71
9Ping RiverPing River0.560.370.100.020.321.152.012.012.02
10Bao RiverBao River0.860.870.120.320.861.663.683.583.21
11Cao RiverCao River1.001.000.130.511.032.225.364.364.26
12Fu RiverFu River1.501.620.361.241.652.897.617.266.35
13Tang RiverUpper reach of Tang River1.632.250.060.340.794.577.366.352.48
14Middle reach of Tang River (Xidayang reservoir-Beixindian)1.280.400.030.120.512.825.685.263.65
15Entering BYD reach of Tang River (Beixindian-BYD)0.830.100.020.010.210.495.364.983.02
16Xiaoyi RiverXiaoyi River1.021.070.310.951.243.526.215.155.02
17Zhulong RiverUpper reach of Sha River1.011.180.090.080.783.415.368.798.72
18Reach below Wangkuai Reservoir of Sha River0.780.380.020.070.934.705.697.364.26
19Middle reach of Sha River0.610.520.130.010.574.095.816.513.40
20Reach below Hengshanling Reservoir of Ci River1.560.010.100.060.163.336.617.026.02
21Entering BYD reach of Zhulong River (Beiguocun-BYD)1.231.070.100.032.131.239.6310.269.18
Table 3. The EF under multi-objective (unit: m3/s).
Serial NumbersRiversReachesBEFSEFFEF
1Baigou RiverUpper reach of Baigou River0.310.510.71
2North Juma River2.286.2811.54
3Mountainous reach of Juma River0.070.100.12
4Mountainous-plain reach of Juma River2.356.4811.93
5South Juma River2.867.9114.73
6Beiyishui1.343.656.37
7Zhongyishui1.163.155.38
8Entering BYD reach of Baigouyin River2.787.6814.29
9Ping RiverPing River0.952.564.23
10Bao RiverBao River1.684.608.24
11Cao RiverCao River2.216.0911.16
12Fu RiverFu River3.399.3917.65
13Tang RiverUpper reach of Tang River1.634.467.97
14Middle reach of Tang River (Xidayang reservoir-Beixindian)2.196.0311.05
15Entering BYD reach of Tang River (Beixindian-BYD)1.674.588.19
16Xiaoyi RiverXiaoyi River2.727.5213.96
17Zhulong RiverUpper reach of Sha River1.012.734.56
18Reach below Wangkuai Reservoir of Sha River2.697.4313.80
19Middle reach of Sha River2.416.6512.26
20Reach below Hengshanling Reservoir of Ci River2.767.6314.18
21Entering BYD reach of Zhulong River (Beiguocun-BYD)3.8710.7420.29
Disclaimer/Publisher’s Note: The statements, opinions and data contained in all publications are solely those of the individual author(s) and contributor(s) and not of MDPI and/or the editor(s). MDPI and/or the editor(s) disclaim responsibility for any injury to people or property resulting from any ideas, methods, instructions or products referred to in the content.