Article

Hydrochemical Characteristics and Ion Source Analysis of the Yarlung Tsangpo River Basin

1
Research Center for Integrated Control of Watershed Water Pollution, Chinese Academy of Environmental Sciences, Beijing 100012, China
2
College of Environmental Sciences and Engineering, Peking University, Beijing 100871, China
*
Author to whom correspondence should be addressed.
Water 2023, 15(3), 537; https://doi.org/10.3390/w15030537
Submission received: 2 December 2022 / Revised: 20 January 2023 / Accepted: 24 January 2023 / Published: 29 January 2023
(This article belongs to the Section Water Quality and Contamination)

Abstract

:
In order to investigate the hydrochemical characteristics and their controlling factors, 212 water samples from the Yarlung Tsangpo River and its tributaries were collected over three precipitation periods in 2018 and analyzed using mathematical statistics, the Gibbs and ion ratio methods, and principal component analysis. The results showed the following: (1) The cations in the water were mainly Ca2+, Na+ and Mg2+, and the anions HCO3 and SO42− were predominant, accounting for more than 97% of the total anion concentrations. The concentration of total dissolved solids (TDS) was 204.51 mg/L. The water chemistry type was SO4·(HCO3)Ca·(Mg) water. (2) The concentrations of major ions in the Yarlung Tsangpo River fluctuate, but in general, the vast majority of the major ions in the water follow the trend of both first increasing and then decreasing in the three precipitation periods. The hydrochemical features of the Yarlung Tsangpo Basin have seasonal differences. (3) The Gibbs model and the PCA analyses showed that the Yarlung Tsangpo River water chemical components are mainly affected by rock weathering. In addition, the influence of the mining industry also plays an important role. The heavy metal concentrations in the three precipitation periods of the Yarlung Tsangpo River could reach the standard of first-class surface water quality.

1. Introduction

The unique natural environment of the Tibetan Plateau sustains a wealth of rare plant and animal resources, forming a special type of ecosystem including glaciers, permafrost, lakes and wetlands [1,2]. The Tibetan Plateau is the location of the headwaters of many significant rivers in Asia, and provides freshwater resources for nearly 1/3 of the world’s population. Its hydrochemical characteristics also reflect the geochemical behavior of elements in the river basin. The chemical weathering of rocks and the amount of CO2 consumed by rock weathering can be evaluated with the aid of hydrochemical studies. As the “third pole” of the world, the Tibetan Plateau occupies a very important proportion of the elemental geochemical cycles that occur through the exchange of land and sea energy. Due to the climate and human activities in this area, the water quality is affected [3]. As a result of global warming, the area of the glaciers is declining, and the snowline is receding. Hydrochemical characteristics and ion composition are important indicators of the water environment and climate change. It is of scientific significance to study the hydrochemical characteristics of rivers and lakes for the water cycle and the protection of water resources and the environment. In addition, it is important to reveal the source of the most abundant major ions, as well as the factors controlling their abundance, in the research of water environment and hydrology [4]. Hydrochemical research on river water mainly focuses on the relationship between chemical composition, natural conditions, the influence of human activities, land weathering, global change, and temporal–spatial changes in water quality. Most research emphasizes theoretical approaches, but studies of this region are few.
Recently, the worldwide researchers, not only the Chinese scholars, have paid attention to the Yarlung Tsangpo River basin, and the fruitful studies can be mainly divided into two factors: the natural influences and the human influences on the Yarlung Tsangpo River basin. Recent studies on the main chemical composition of the Yarlung Tsangpo River basin in the eastern plateau have shown that the processes of weathering and erosion have a strong influence [5]. It has been suggested that the atmospheric CO2 has been consuming and the global climate has been cooling during the continental chemical weathering of silicate rocks since the Cenozoic era, which is driven by the uplifting of the Himalayan and Tibetan Plateau [6]. The hydrochemical characteristics of the Yarlung Tsangpo River are mainly controlled by natural processes within the respective catchments. The significant spatiotemporal changes in the hydrological processes caused by climate change may greatly influence the quality and quantity of the surface water fed by glaciers [7]. Huang [8] evaluated the water quality of the Yarlung Tsangpo River basin, and analyzed the control factors in the hydrochemistry based on the statistical analysis method. In addition to the natural influences, human activities have also played a non-negligible impact on the hydrochemistry of the Yarlung Tsangpo River. However, a major tributary, the Lhasa River, exhibits some anthropogenic influence due to domestic, industrial and agricultural activity near the river [9] (Huang, X. et al., 2009). Since the Tibetan Plateau is the intersection of the westerly Indian Ocean monsoons and the East Asian monsoon, the atmospheric circulation also brings about cross-border pollution transmission from India and Nepal. Both anthropogenic activities and climate change on the plateau will affect the water chemistry of the Yarlung Tsangpo River and present risks to human livelihoods in the river basin of the southern Tibetan Plateau Valley, in India and further downstream in Bangladesh [10]. Recent studies of water quality in the Yarlung Tsangpo basin have reported relative high levels of heavy metals, such as Cd, Hg, Ni, and Cu [9]. The pollution is thought to be caused by the local mining industry. In saline lakes, high concentrations of heavy elements, such as Pb and As, are also found [11]. Geogenic pollution has existed for a long time, but people do not have enough research on this kind of pollution and its damage to the ecological environment. This varying hydrogeological setting influences the water chemistry in different ways [12]. Such sources of pollution cover a wide range, including solid debris, heavy metal contamination, harmful and toxic fluids, gases, and even radioactive, electromagnetic and other harmful physical factors [13]. In general, the chemical characteristics of the Yarlung Tsangpo River have not been systematically studied, and there is a lack of research on the whole basin and its seasonal changes. Compared with other river basins in China, the studies of the chemical characteristics of the Yarlung Tsangpo River basin, the seasonal changes in the chemical weathering process, and the influencing factors are not detailed.
Based on the 212 samplings distributed along the main stretch and tributaries of the Yarlung Tsangpo River during three hydrological periods in 2018, the main aims of the study were: (1) to investigate the composition of anions, cations and heavy metals; (2) to analyze their spatial-temporal distribution characteristics and (3) to evaluate the key factors controlling the hydrochemistry. The innovation of the work was carried out to fill the above gap with the major objective being to research the spatiotemporal variations of the hydrochemical characteristics and their controlling factors during the three typical hydrological periods of the whole year. The results provide vital information for further research on the water quality of the Yarlung Tsangpo River, even the change in the water quality of “Asian Water Tower”. The study also provides scientific evidence for the management of water resources.

2. Study Area and Methods

2.1. River Catchments

The study area is located in southern Tibet, north of the Gangdise, Nyainqentanglha, and Himalaya Mountains. The study area boundary is as follows: 90–95 degrees east longitude and between 28.5 and 30.5 degrees north latitude [14]. The Yarlung Tsangpo River originates from the Jie Ma Yangzom glacier. It flows from west to east, through Zhongba, Shigatse, and Zedang. In the vicinity of Milin County, the river changes course and flows southward out of China and into the Bay of Bengal in the India Ocean. The altitude is between 2800 m and 4500 m, and the study area is shown in Figure 1.
The Yarlung Tsangpo River is a pre-formed river adapted to the development of a faulted tectonic zone, located at the suture zone where the Indian plate subducted northward and collided with the Eurasian plate. The strata on both sides of the valley are discontinuous and inconsistent in occurrence, and ultrabasic rock bodies and exotic rock blocks are distributed along the way for thousands of kilometers. Yarlung Tsangpo River is the highest river in the world, which is obviously adapted to the development of the tectonic fault belt [5].
The lower reaches of the Yarlung Tsangpo basin are usually hot and rainy. The inter-annual variation of precipitation is relatively small, and the annual distribution is variable. The annual average precipitation ranges from 200 mm upstream to 5000 mm downstream. Eighty to ninety percent of rainfall occurs from July to September. The highest monthly temperature is found in June, and the lowest monthly temperature is found in January. In the month with the most precipitation, the water quantity, which is supplied by snow melting, is large [15]. The region is divided into the humid climate of the plateau monsoon, the semi-humid climate of the monsoon in the plateau temperate zone, and the semi-arid climate of the plateau temperate zone. In addition, the river basin has high water flows, low suspended sediment content, low water temperature, low salinity and low total hardness.
Yarlung Tsangpo River has five watershed areas with more than 10,000 km2 of tributaries, such as the Palongzangbu, Nianchuhe, Niyang, and Lhasa rivers. The Niyang river is a tributary of the Yarlung Tsangpo, where the climate is mild and humid. The average annual temperature is about 8 °C, and the annual precipitation is 600–900 mm. The annual runoff is relatively concentrated, mainly from June to September every year, accounting for about 90% of the total annual runoff. The Lhasa river is located in central and southern Tibet. It is 568 km in length, and the basin has an area of 31,760 km2. The Lhasa river basin accounts for only 2.7% of the total area of the Tibet Autonomous Region, while the population and cultivated land in the basin accounts for about 15% of the total Autonomous Region and is a concentrated area for workers, farmers and livestock in Tibet. The ancient city of Lhasa Plateau is located on the right bank of the lower reaches of the river [16,17,18].

2.2. Water Sample Collection and Analysis

2.2.1. Sampling and Measurement

Considering climate and seasonal change could affect the character of the water samples, sampling works were conducted in three periods, including the wet period (September), normal period (November) and dry period (May). A total of 212 samples were collected from the Yarlung Tsangpo main stream and its major tributaries in 2018. In order to accurately determine the hydrochemical characteristics in the whole Yarlung Tsangpo basin, a total of 69 sampling points were evaluated in the Yarlung Tsangpo basin, according to the requirements of GB12998-1991 for water quality sampling and surface water quality standards GB 3838-2002 for the water quality of rivers. In order to investigate the whole Yarlung Tsangpo basin, the sampling points were set as scientifically as possible to cover the entire study area including its tributaries from the upstream to the downstream. Sample distribution was relatively uniform, and the sampling points were distributed in different geomorphological units, hydrogeological conditions, land-use types and hydro-climatic variations with respect to elevation. Each sample point had a certain representation and sample distribution, as shown in Figure 1. Samples were collected in May for the dry season, September for the wet season, and November for the normal period in 2018. For each time period, samples were obtained continuously from downstream to upstream within half a month. However, to keep the sampling conditions consistent, the days without rainfall in 24 h were chosen as sample days.
In order to record the simultaneous conditions of river water at the sampling time, some online detection was conducted in situ including altitude (m), air temperature (°C), pH, dissolved oxygen (mg/L), water temperature (°C), electrical conductivity (uS/cm) and turbidity(NTU). Prior to the sample collection, each sample bottle had been washed with nitric acid for cations and then rinsed with distilled water [8]. Water samples were collected in 2 L polypropylene bottles, followed immediately by filtration through a 0.45 mm cellulose acetate membrane filter. The samples were placed in a clean self-sealing polyethylene (PE) plastic bag and kept in a refrigerator at 4 °C until testing. The filtered samples were analyzed for (1) major ions (Ca2+, Na+, K+, Mg2+, Cl, NO3, HCO3, SO42−, PO34−, and F); (2) trace elements (Al, As, Cu, Fe, Li, Mn, Mo, Ti, Zn, Cd, Co, Cr, Ni, Pb, and Hg); (3) total dissolved sulfur (S) and -silica (SiO2). In addition, (4) total dissolved solids (TDS) were calculated from the SUWM of the concentrations of Ca2+, Na+, K+, Mg2+, Cl, NO3, HCO3, SO42− and SiO2 [16]. In order to ensure the accuracy of the data, the instrument had been calibrated before sampling. In addition, all sample bottles were washed 2–3 times with the collected filtrate before collecting water samples. In order to avoid contamination and damage in the transport process, samples were placed in the refrigerator to keep fresh. Samples, which consisted of water, a filter and sediments, were transported to the laboratory as soon as possible. Aqueous samples were stored in the refrigerator at 4 °C, and sediment samples were kept in a dust-free laboratory under the condition of natural weathering.
The total cation contents were quantified by inductively coupled plasma–atomic emission spectroscopy (ICP-AES). The anions were analyzed by ion chromatography with a Dionex ICS 900. The contents of Cu, Zn, Pb and Cd were analyzed using atomic absorption spectrophotometry method referencing to the GB 7475-87. The contents of Hg, Se, Ti were determined by atomic fluorescence method referencing to the HJ 694-2014 standard. Anions were determined by non-suppressed ion chromatography with conductivity detection. Dissolved SiO2 was measured using an inductively coupled plasma–optical emission spectrometer (OptimaTM-5300DV, PerkinElmer, Waltham, MA, USA). Hg was analyzed by cold vapor-atomic fluorescence spectrophotometer. During the experiment, the instrument was calibrated by National Loess Reference Material (GBW07408) and controlled by standard solution. The analytical precision for both cations and anions was better than 2%. The sum of total cations and anions indicated a good match with the TDS values measured using the probe (Tz+ + Tz = 1.02 TDS, R2 = 0.98), which suggested that the data were of high quality.

2.2.2. Data Processing and Analysis

All statistical computations were made by using Excel 2013 (Microsoft Office) and spss 18.0, (Norman H.Nie, Palo Alto, CA, USA). The experimental results figure was made by using Origin8.0. First, the Kolmogorov–Smirnov test was used to identify whether the content of ion elements followed the normal distribution. Then, the correlation relationship of concentrations of ion elements was assessed using the Pearson correlation analysis. This analysis was based on the 212 samples that had data for the complete set of 38 parameters measured.

3. Results and Discussion

3.1. General Hydrochemical Characteristics

3.1.1. Basic Physical and Chemical Properties of the Main Stream and Tributaries of the Yarlung Tsangpo River

Through the analysis of the conventional hydration parameters, the average values and their variation range in pH, T, EC, DO, TDS of water samples in the Yarlung Tsangpo River basin are shown in Table 1. The water temperature of the river ranged from 0.0 °C to 20.5 °C in the third stage, and the lowest temperature was in the normal water period with an average 4.2 °C; the pH values of the Yarlung Tsangpo River and its tributaries were neutral to alkaline for all the sampling points, ranging from 8.9 to 9.11 with an average of 8.7. The carbonate system is a naturally excellent buffering system, which acts as a buffer against drastic pH changes in natural water. The pH in the wet season (8.6) was slightly lower than the dry season (8.7) and the flat water period (8.8), which may be due to the rainfall that decreases the pH of the water body; the TDS varied greatly, ranging from 59.6 to 386 mg/L, with an average of 204.51 mg/L (N = 212), which is much higher than the world average (120 mg L−1) [19]; a high TDS is a prominent feature of plateau rivers. The chemical weathering of the plateau is strengthened, resulting in a higher concentration of solute in river water. The ionic strength of the water body was described by the conductivity (EC) value. The conductivity of the water in the third stage of the Yarlung Tsangpo River basin varied from 18.5 to 632.0 uS/cm, with an average of 252.3 uS/cm. The dissolved oxygen in the whole river varied in the different periods, influenced by the temperature and salinity factors. The dissolved oxygen in its tributaries was highest in the dry season (mean 10.85 mg L−1) and lowest in the wet season (mean 8.1 mg L−1) (Figure 2), which may be due to the dissolved oxygen content in the water and in the air. The results showed that the partial pressure of oxygen was related to the water temperature, which means that the relatively low temperature of the water during the dry season resulted in a high dissolved-oxygen content (Figure 2). The correlation coefficient between water temperature and air temperature was strong (R2 = 0.83), which reflected that the relatively low annual temperature caused the low water temperature. Apart from the air temperature, the different types of supply also affect the water temperature of the river. Above all, we found that the concentration of dissolved oxygen (Do) in the water was relatively low which was determined by the high altitude and low pressure environment, and it caused the low rate of biochemical processes; the water temperature is low and the annual variance is small, which is the main factor that controls the mineral dissolution rate and water biochemistry in the study area [20].
The cation concentrations in the main channel of the Yarlung Tsangpo basin were Ca2+, Na+, Mg2+, K+ (ordered by concentration). Ca2+ was the dominant cation, accounting for 31.3% of the total cations in the main channel. The anion concentrations were in the following order: HCO3, SO42−, Cl. HCO3 and SO42− were the dominant anions, accounting for 72.35 and 14.32%, respectively, of the total anions. The concentration of Cl ions was relatively low. Concentrations of major ions in the Yarlung Tsangpo River were higher than those of the world average. For instance, the mean concentrations of Ca2+ and SO42− in Yarlung Tsangpo River were over three and four times higher than those of the global average, respectively [19]. These findings are comparable to other rivers in the world (Table 1).

3.1.2. Heavy Metal Analysis

In order to reveal the behavior of heavy metals in the waters of the Yarlung Tsangpo River basin, the heavy metal data were first statistically processed and then their characteristic data were analyzed. In order to understand the spatial distribution of the measured elements in the main stream of the Yarlung Tsangpo River, this section studies the content of heavy metals in the main stream of the Yarlung Tsangpo River in different precipitation periods (dry season, wet season and normal season).
The study showed relatively high concentrations of Al (42.37 mg L−1 on average, in normal period) and Fe (6.97 mg L−1 on average, in wet period), but these concentrations (Al and Fe) could also be due to suspended material passing through the 0.45 µm filters, thereby causing some measurement uncertainties [24,25]. The concentrations of Cu, Zn, Ag, Cd and Cr were generally low, which could be qualified in the category of first class standard of the surface water environmental quality standard of the People’s Republic of China (GB 3838-2002) (Table 2). The content of As measured in the three periods was mostly qualified in the first class standard. The concentration of As in the downstream samples of the Yangbajing geothermal field during the wet season and the dry season were 170.5 and 144.0 ug/L, respectively, which exceeded the five class standard of the surface water environmental quality standard of the People’s Republic of China (GB 3838-2002). The As concentration in the sediments of the Tibetan Plateau was 11.6 times that of the crustal abundance in China. Due to the widespread distribution of As-bearing shale in Tibet, gas/liquid released by geothermal activity leads to high As levels. The reason for the high content could also derive from sulfides such as pyrite [26]. When assessing the content of Hg, the concentrations of mercury in the 90.2% water samples reached the first class standard of the surface water environmental quality standard. The concentrations of As and Li in the upstream Ma jiu Tsangpo sampling points were extremely high (181.2 ug/L in the dry period; 217.58 ug/L in the wet period; 182.1 ug/L in the normal period), which may be related to the mining and smelting of As metal [3].
The coefficient of variation (CV%) is an important indicator of the degree of data dispersion. The larger the value, the greater the external influence on the data. It can be seen from Table 3 that the variation coefficients of all the heavy metals in the water body of Yarlung Tsangpo River basin in the dry season were greater than 0.36 except for Ag, which indicates that the heavy metals in the water body of Yarlung Tsangpo River basin vary greatly in the dry season and have obvious spatial distribution differences.
In order to highlight the spatial distribution characteristics of heavy metals in the mainstream of Yarlung Tsangpo River, six elements with relatively high content in the water body, namely Cu, Al, Cd, As, Zn and Mn, were selected to visually express the spatial and temporal distribution of these heavy metals in the mainstream from upstream to downstream. Y16~Y21 were 20 sampling points from upstream to downstream of the Yarlung Tsangpo River.
It can be seen from Figure 3a, the concentration of the heavy metal Al was significantly different in the three precipitation periods, and the spatiotemporal distribution was uneven. The content of heavy metals at each point in the wet season was low and the concentration changed little from upstream to downstream. The content in dry season and calm season was significantly higher than that in the wet season, and the highest value appeared at the Y26 point in normal season.
It can be seen from Figure 3b, the concentration of As in the water body of Yarlung Tsangpo River basin was generally high in the upstream and low in the middle and downstream. The high value in the upstream appeared near the source (Y14), where only a few herdsmen live and there is strong wind all the year round. The high value may be related to the existence of a large number of shale, schist and other parent rocks rich in these elements on the Qinghai Tibet Plateau. The widely distributed As rich shale in Tibet and the frequent geothermal impact of activities make minerals with very high As content dissolve under geothermal action and the gas and liquid released by geothermal activities are discharged.
It can be seen from Figure 3c, the concentration of heavy metal Cu in the mainstream of Yarlung Tsangpo River was generally high in the upstream and middle reaches, and low in the downstream. The heavy metals contained in the tailing slag of the Julong Copper Mine Company in the upper reaches of Lhasa River enter the Lhasa River body through leaching and then flow into the main stream of the Yarlung Tsangpo River during the dry season (point Y1), resulting in a significantly higher Cu content (4.15 μg/L). The mining industry in the Yarlung Tsangpo River basin will have a certain impact on the content of heavy metals in the water.
It can be seen from Figure 3d, the concentration of heavy metal Cr generally showed a decreasing trend from the upstream (except the source) to the downstream, with a change trend of 8.48~2.98 μg/L. The high water period and low water period were obviously higher than the normal water period. The main reason is that pesticides with a high content of Cr are sprayed more in the middle and upper reaches of the Yarlung Tsangpo River in the wet season, while the relative application amount is lower in the normal season [8,9]. Tibet’s agriculture is mainly concentrated in the Xigaze area on the upper reaches of the Yarlung Tsangpo River, which is consistent with the actual situation [8]. Therefore, the control measures for pesticide use are extremely necessary to improve the water quality of the main stream of the Yarlung Tsangpo River.
It can be seen from Figure 3e,f, the spatial variation of heavy metals Mn and Zn in the mainstream of the Yarlung Tsangpo River was irregular and not obvious. The concentration of heavy metals Mn and Zn fluctuated from the upstream to the downstream. Due to dilution, the content in the wet season is significantly lower than that in the dry season and calm season, and the content is low. The fluctuations of the heavy metals Mn and Zn in the normal season were relatively consistent, indicating that they have the same source. The increase in Zn content may be affected by the mining industry.

3.2. Spatial and Seasonal Variation Characteristics of Major Ions in the Main Stream of the Yarlung Tsangpo River

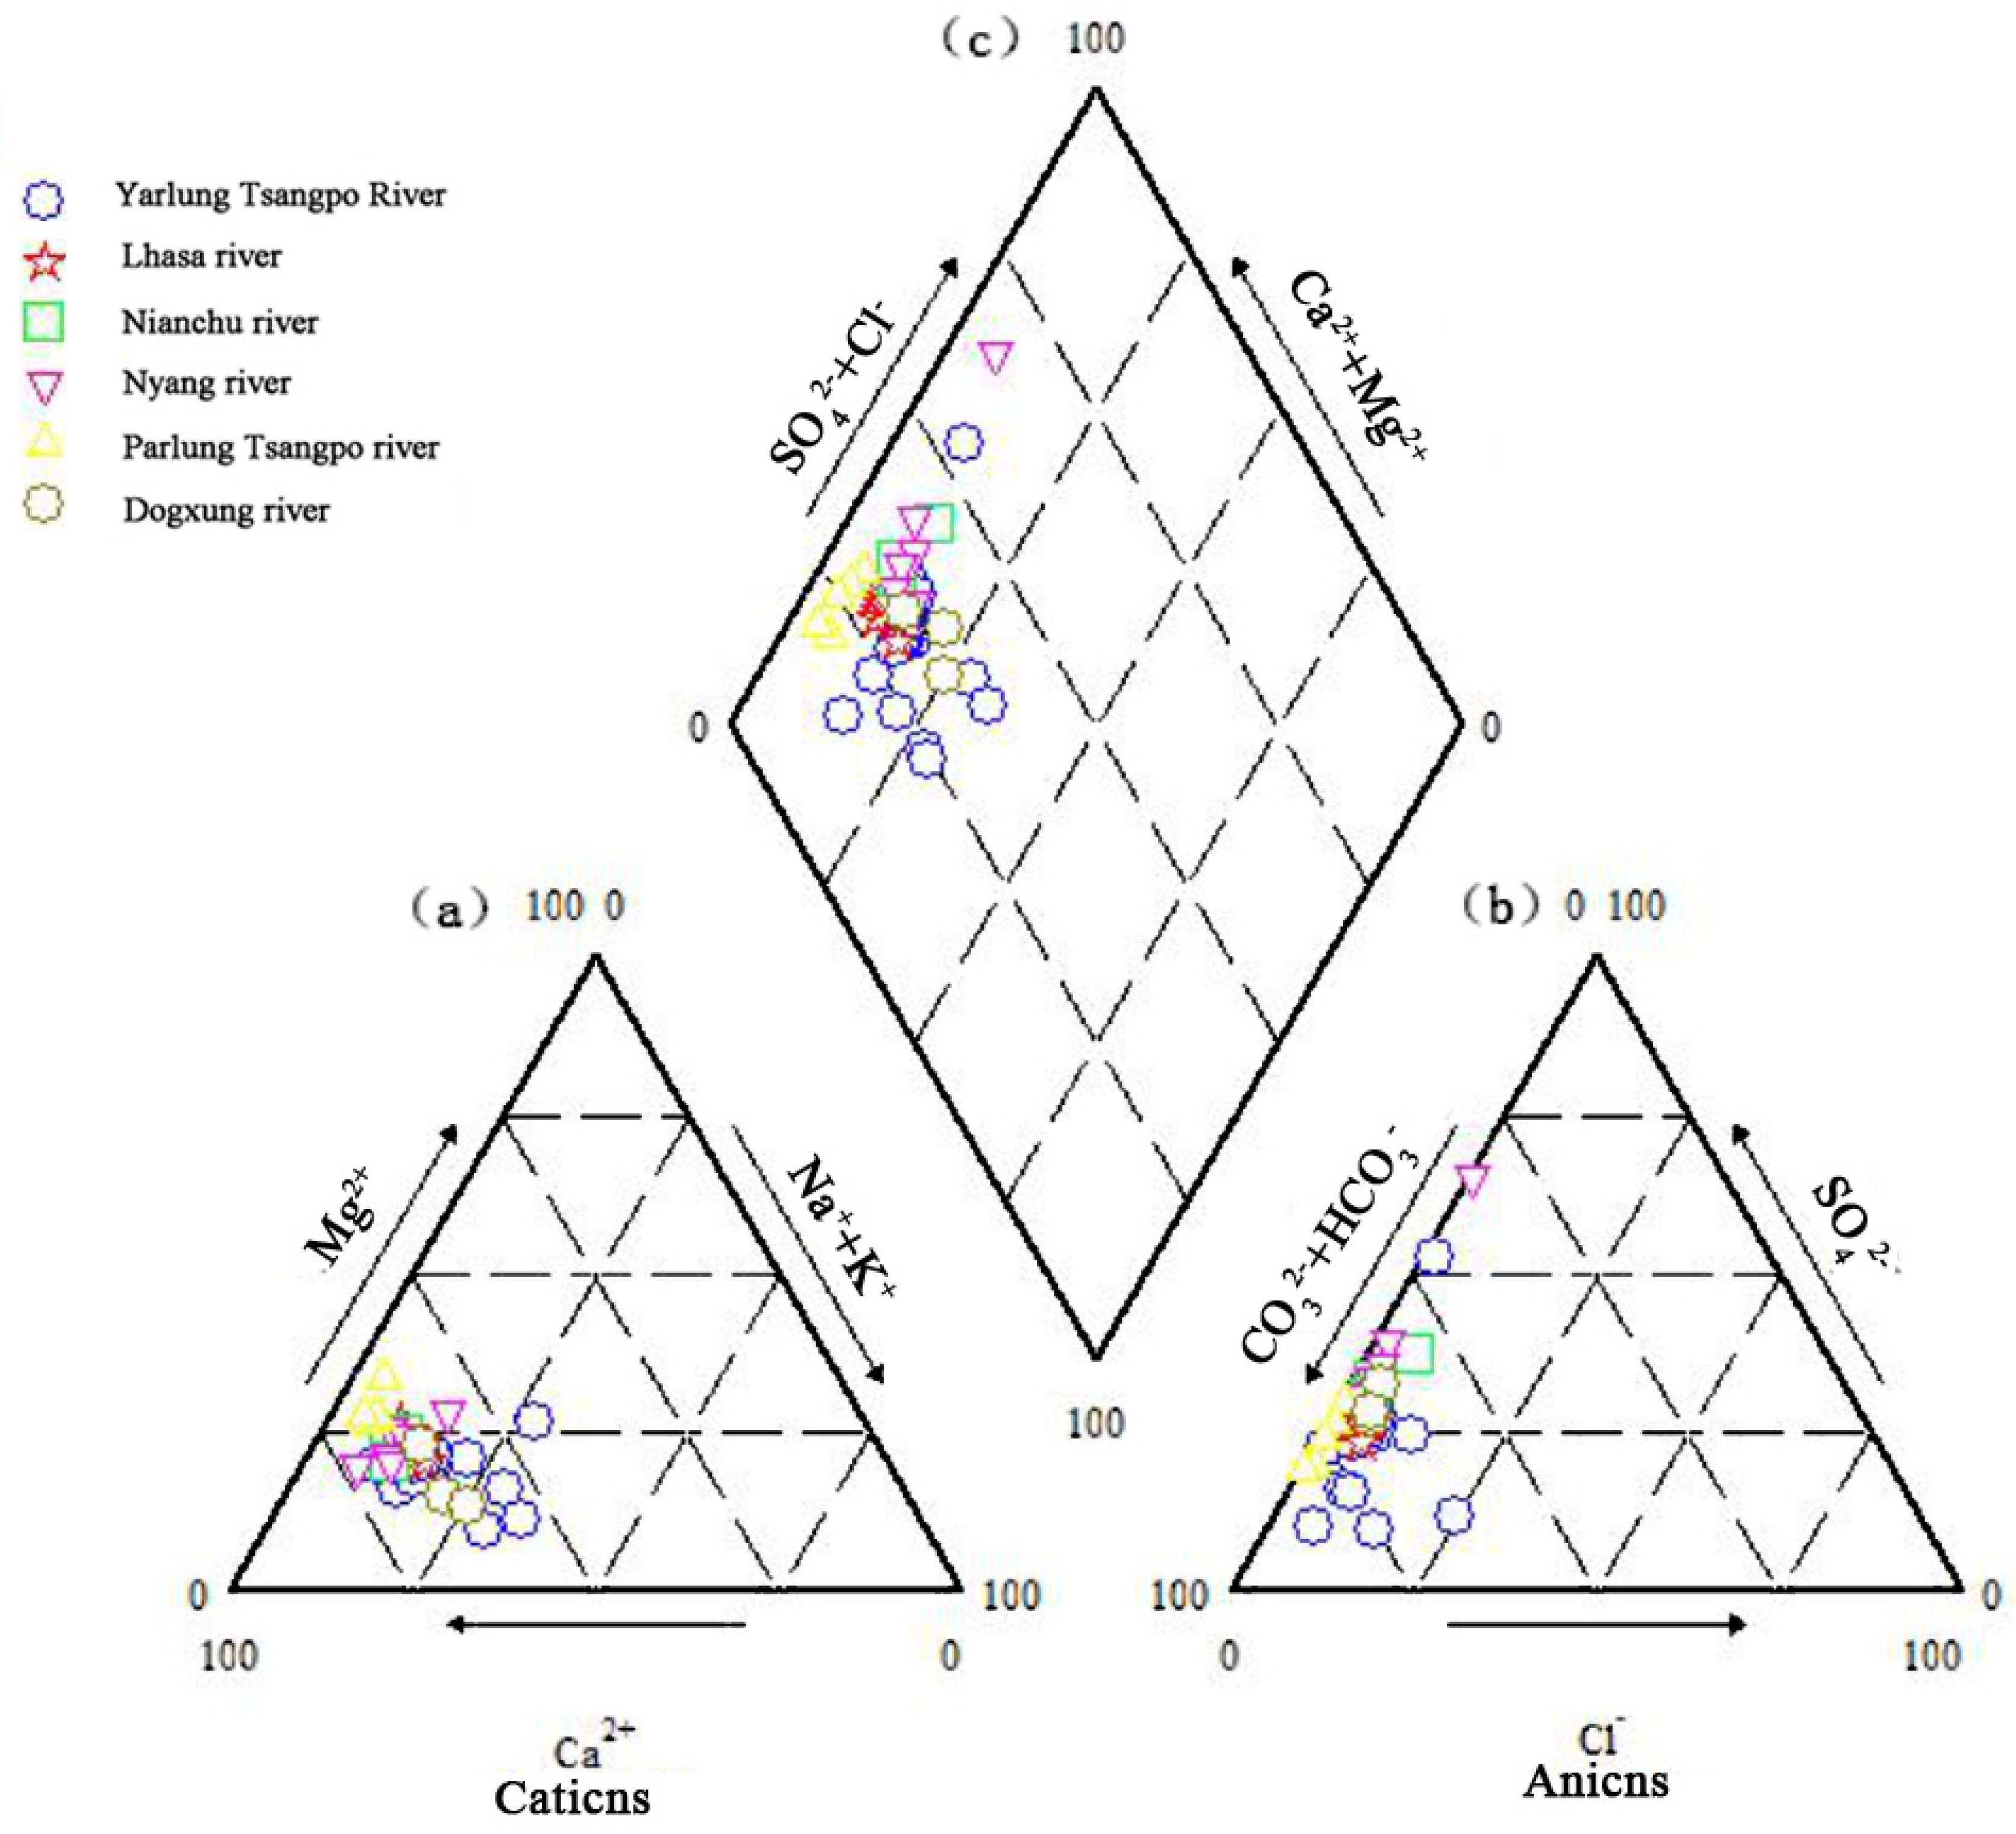
Ternary plots can be used to analyze the evolution of the chemical composition of river water [27]. The relative contents of various major ions can be seen in the ternary plots. The results are shown in Figure 4. The sampling points in the Yarlung Tsangpo River and its tributaries were close to CO32− +HCO3 axis distribution, which means that anions mainly consisted of HCO3 and SO42−. In the cationic trigonometry, the sampling points were located close to the Ca2++Mg2+ axis, indicating that the cations in this region were mainly Ca2+ and Mg2+, which likely reflects the predominance of carbonate weathering. In summary, the sampling area was dominated by SO4·(HCO3)Ca·(Mg) type.
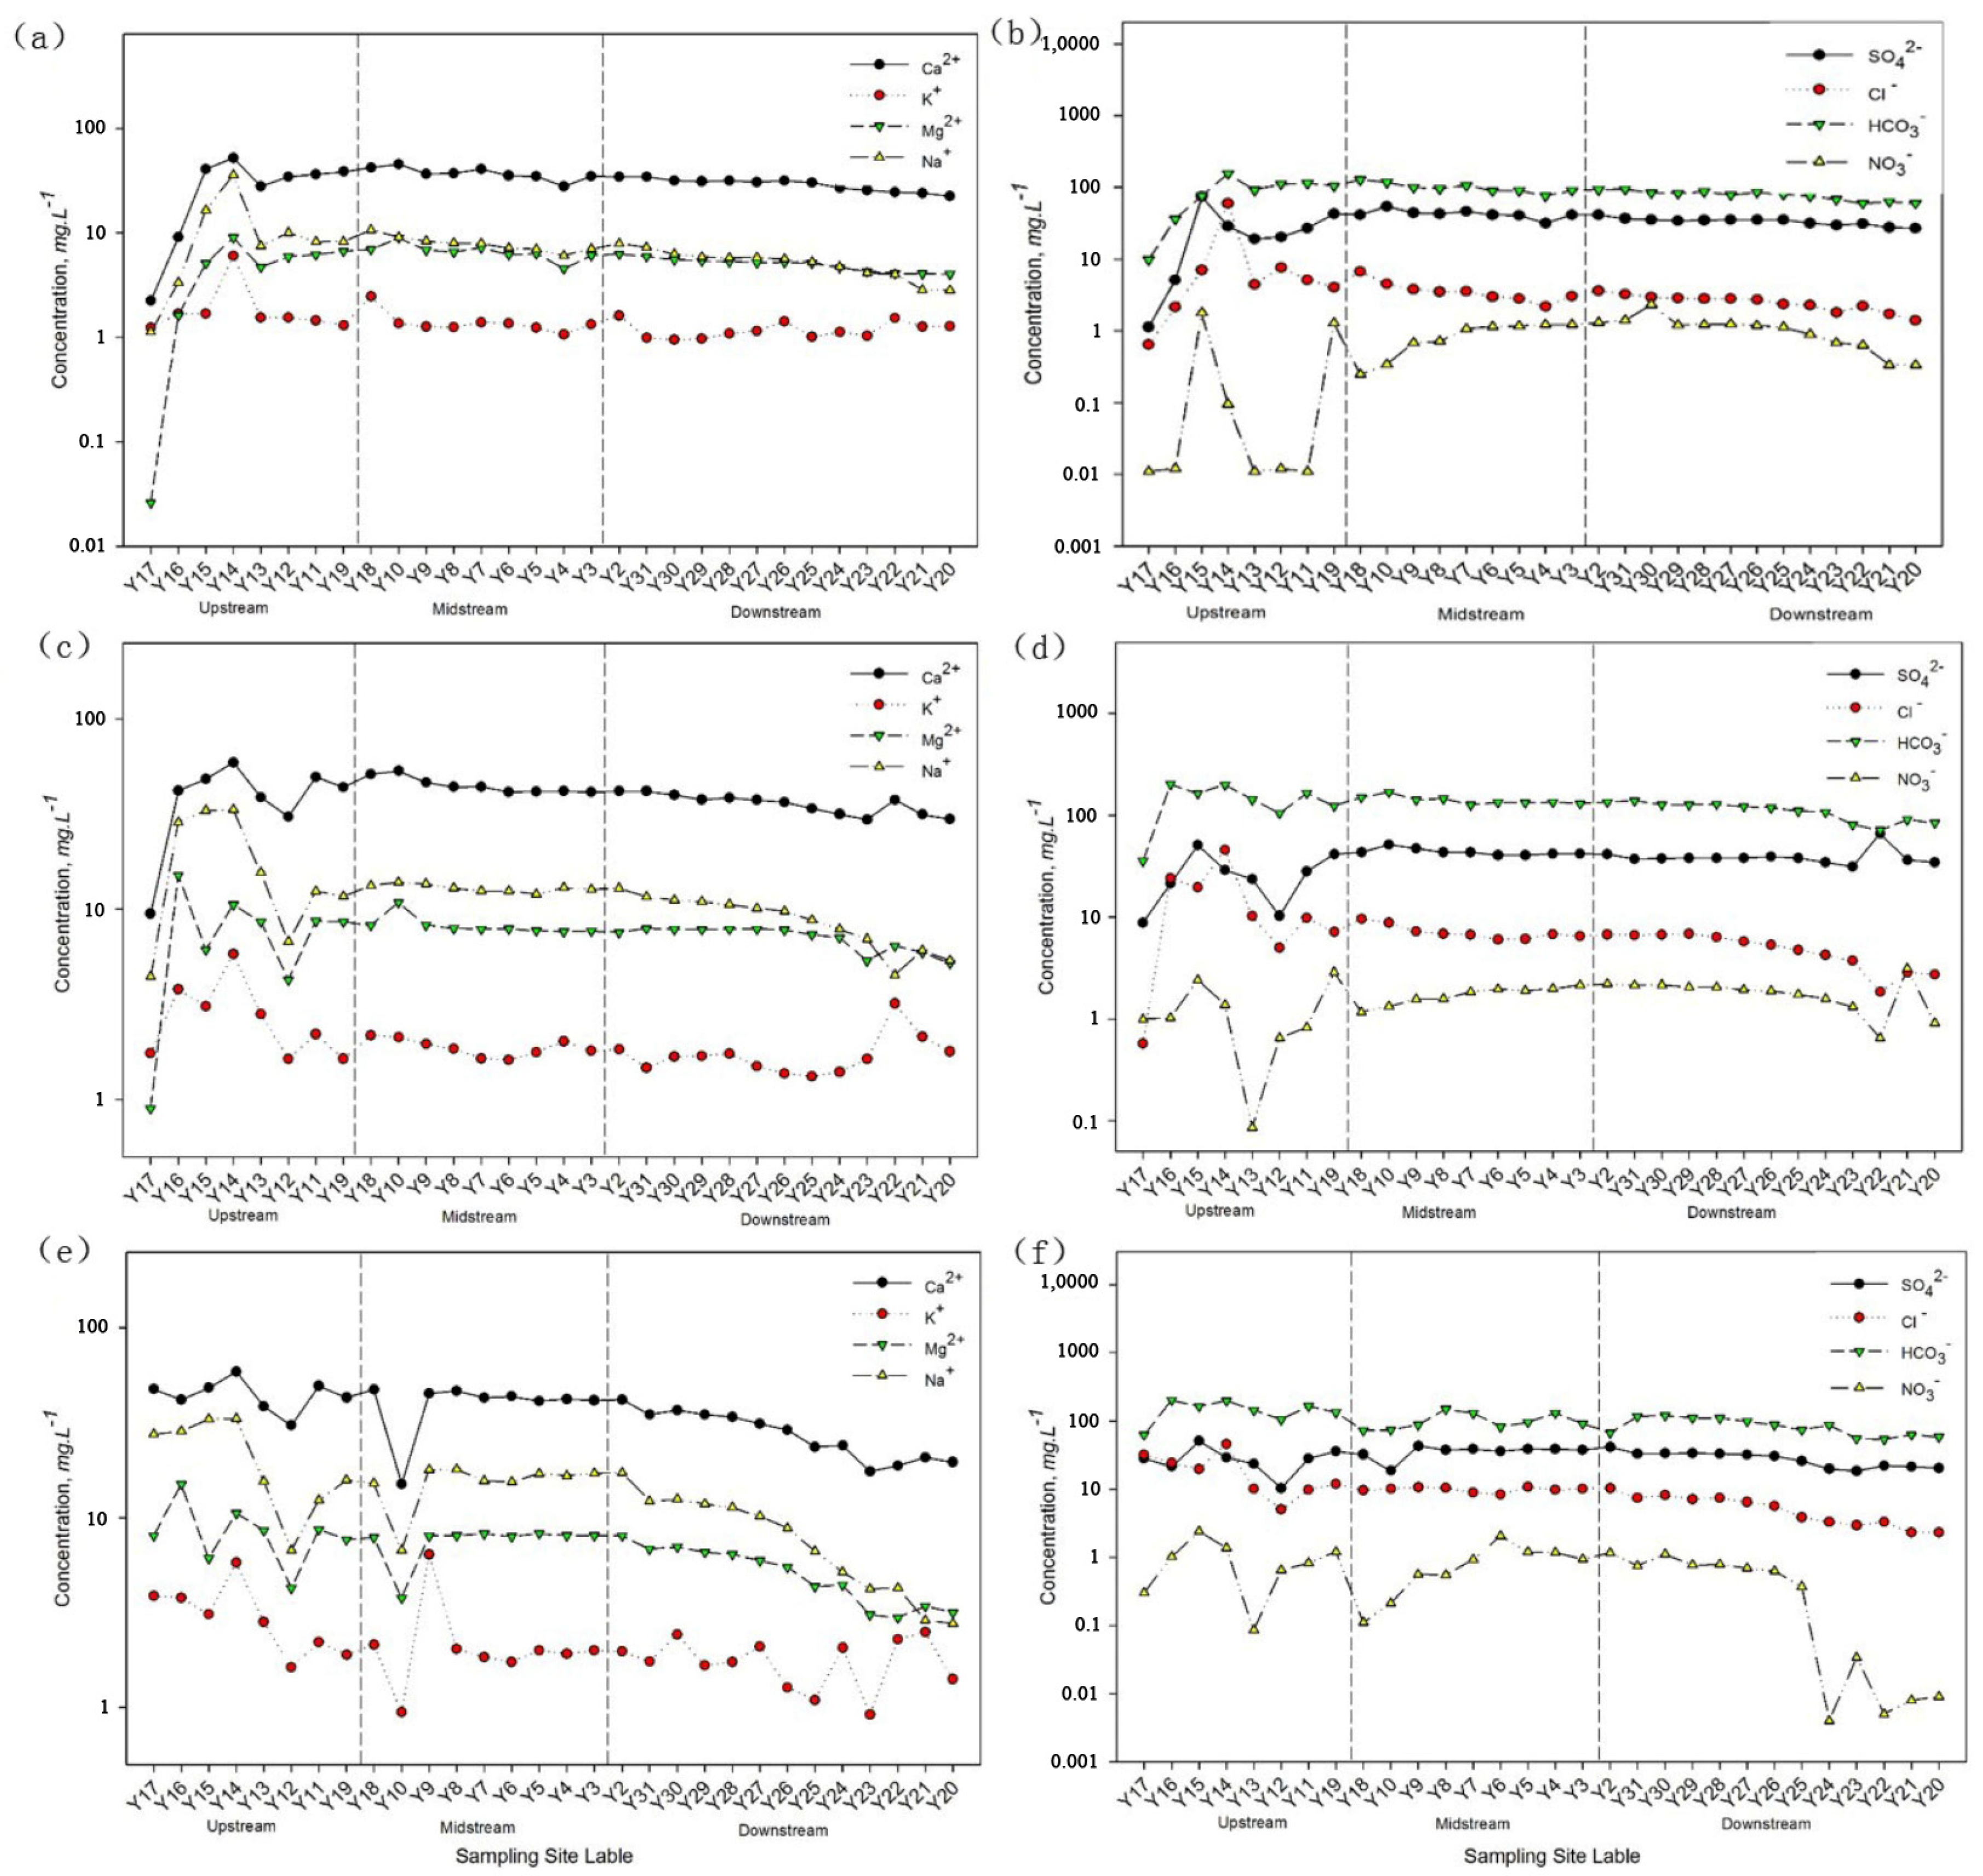
By analyzing the ion concentrations at 30 sampling points along the Yarlung Tsangpo River main channel, the results show that the water chemical characteristics of the river have significant seasonal differences, which are shown in Figure 4. The average TDS was the lowest (149.75 mg L−1) during the wet season. Compared with the dry season, the ion concentration decreased approximately by 20.97 mg L−1, which was approximately 50.37 less than that in the flat water period (Figure 2). The declining ion concentration during the wet period is due to dilution, increased precipitation, and no more ion source. In contrast, the velocity of flow is relatively slow during the normal and dry period, thereby increasing the erosion of rocks in the river, which leads to an increasing ion concentration. The change in cations was dominated by Ca2+, which in the dry season decreased by about 9.35 mg L−1 compared to the flat water period, while the other cations did not change significantly. The change in total anion concentration in the watershed was far more than the cation, and the change in HCO3 was most obvious. The wet season decreased by about 37.42 mg L−1 compared to the flat water period (Table 1). During the dry season and the normal season, the cation and the anion concentrations of the water samples in the main channel followed the order of Ca2+ > Na+ > Mg2+ > K+; however, during the wet season, the order changed to Ca2+ > Mg2+Na+ > K+, mostly obvious in the midstream and downstream (Figure 5). The concentration of anions (mg L−1) of the water samples followed the same order of HCO3 > SO42− > Cl > NO3 in all the seasons. It was shown that the ion concentrations had the highest values in the normal and dry seasons but the lowest values in the wet season under the impact of river discharge and precipitation seasonality.
Spatially, the ion concentrations in the main channel were different from upstream to downstream but had an overall trend of increasing first and then decreasing (Figure 4), which was obvious in the wet season. The TDS measured in the most upstream sampling points (Y17, Y16) was found to be significantly lower compared with the whole main channel. This result is probably due to the glacier and the snow meltwater diluting the ion concentrations. In the upstream area of the Yarlung Tsangpo River, in the arid climate, the rate of evaporation is greater than the amount of rainfall. In addition, serious rock weathering and water erosion occurs in large bare areas and intertidal zones by the river, which leads to the release of large amounts of salt ions into the water. Thus, the ion concentrations at the Y14 and Y15 sampling points were much higher than the other samples. As the river flows downstream, water runoff increases with increasing precipitation. At the same time, the shrubbery, coniferous forest and broad-leaved forests can alleviate soil erosion, which ultimately results in a decrease in ion concentrations. The total cation concentration in the wet season was lower than in the dry season. Among them, the largest difference happened in the upstream (about 29.65 mg L−1), and the difference in mid-stream and downstream were about 16.95 mg L−1 and 14.69mg L−1, respectively, indicating that the largest seasonal variation of cation content happened in the upstream and next to the middle and lower reaches. The seasonal variation of ion concentration from upstream to downstream in the Yarlung Tsangpo River basin gradually decreased.

3.3. Ion Source Analysis

3.3.1. Gibbs Analysis

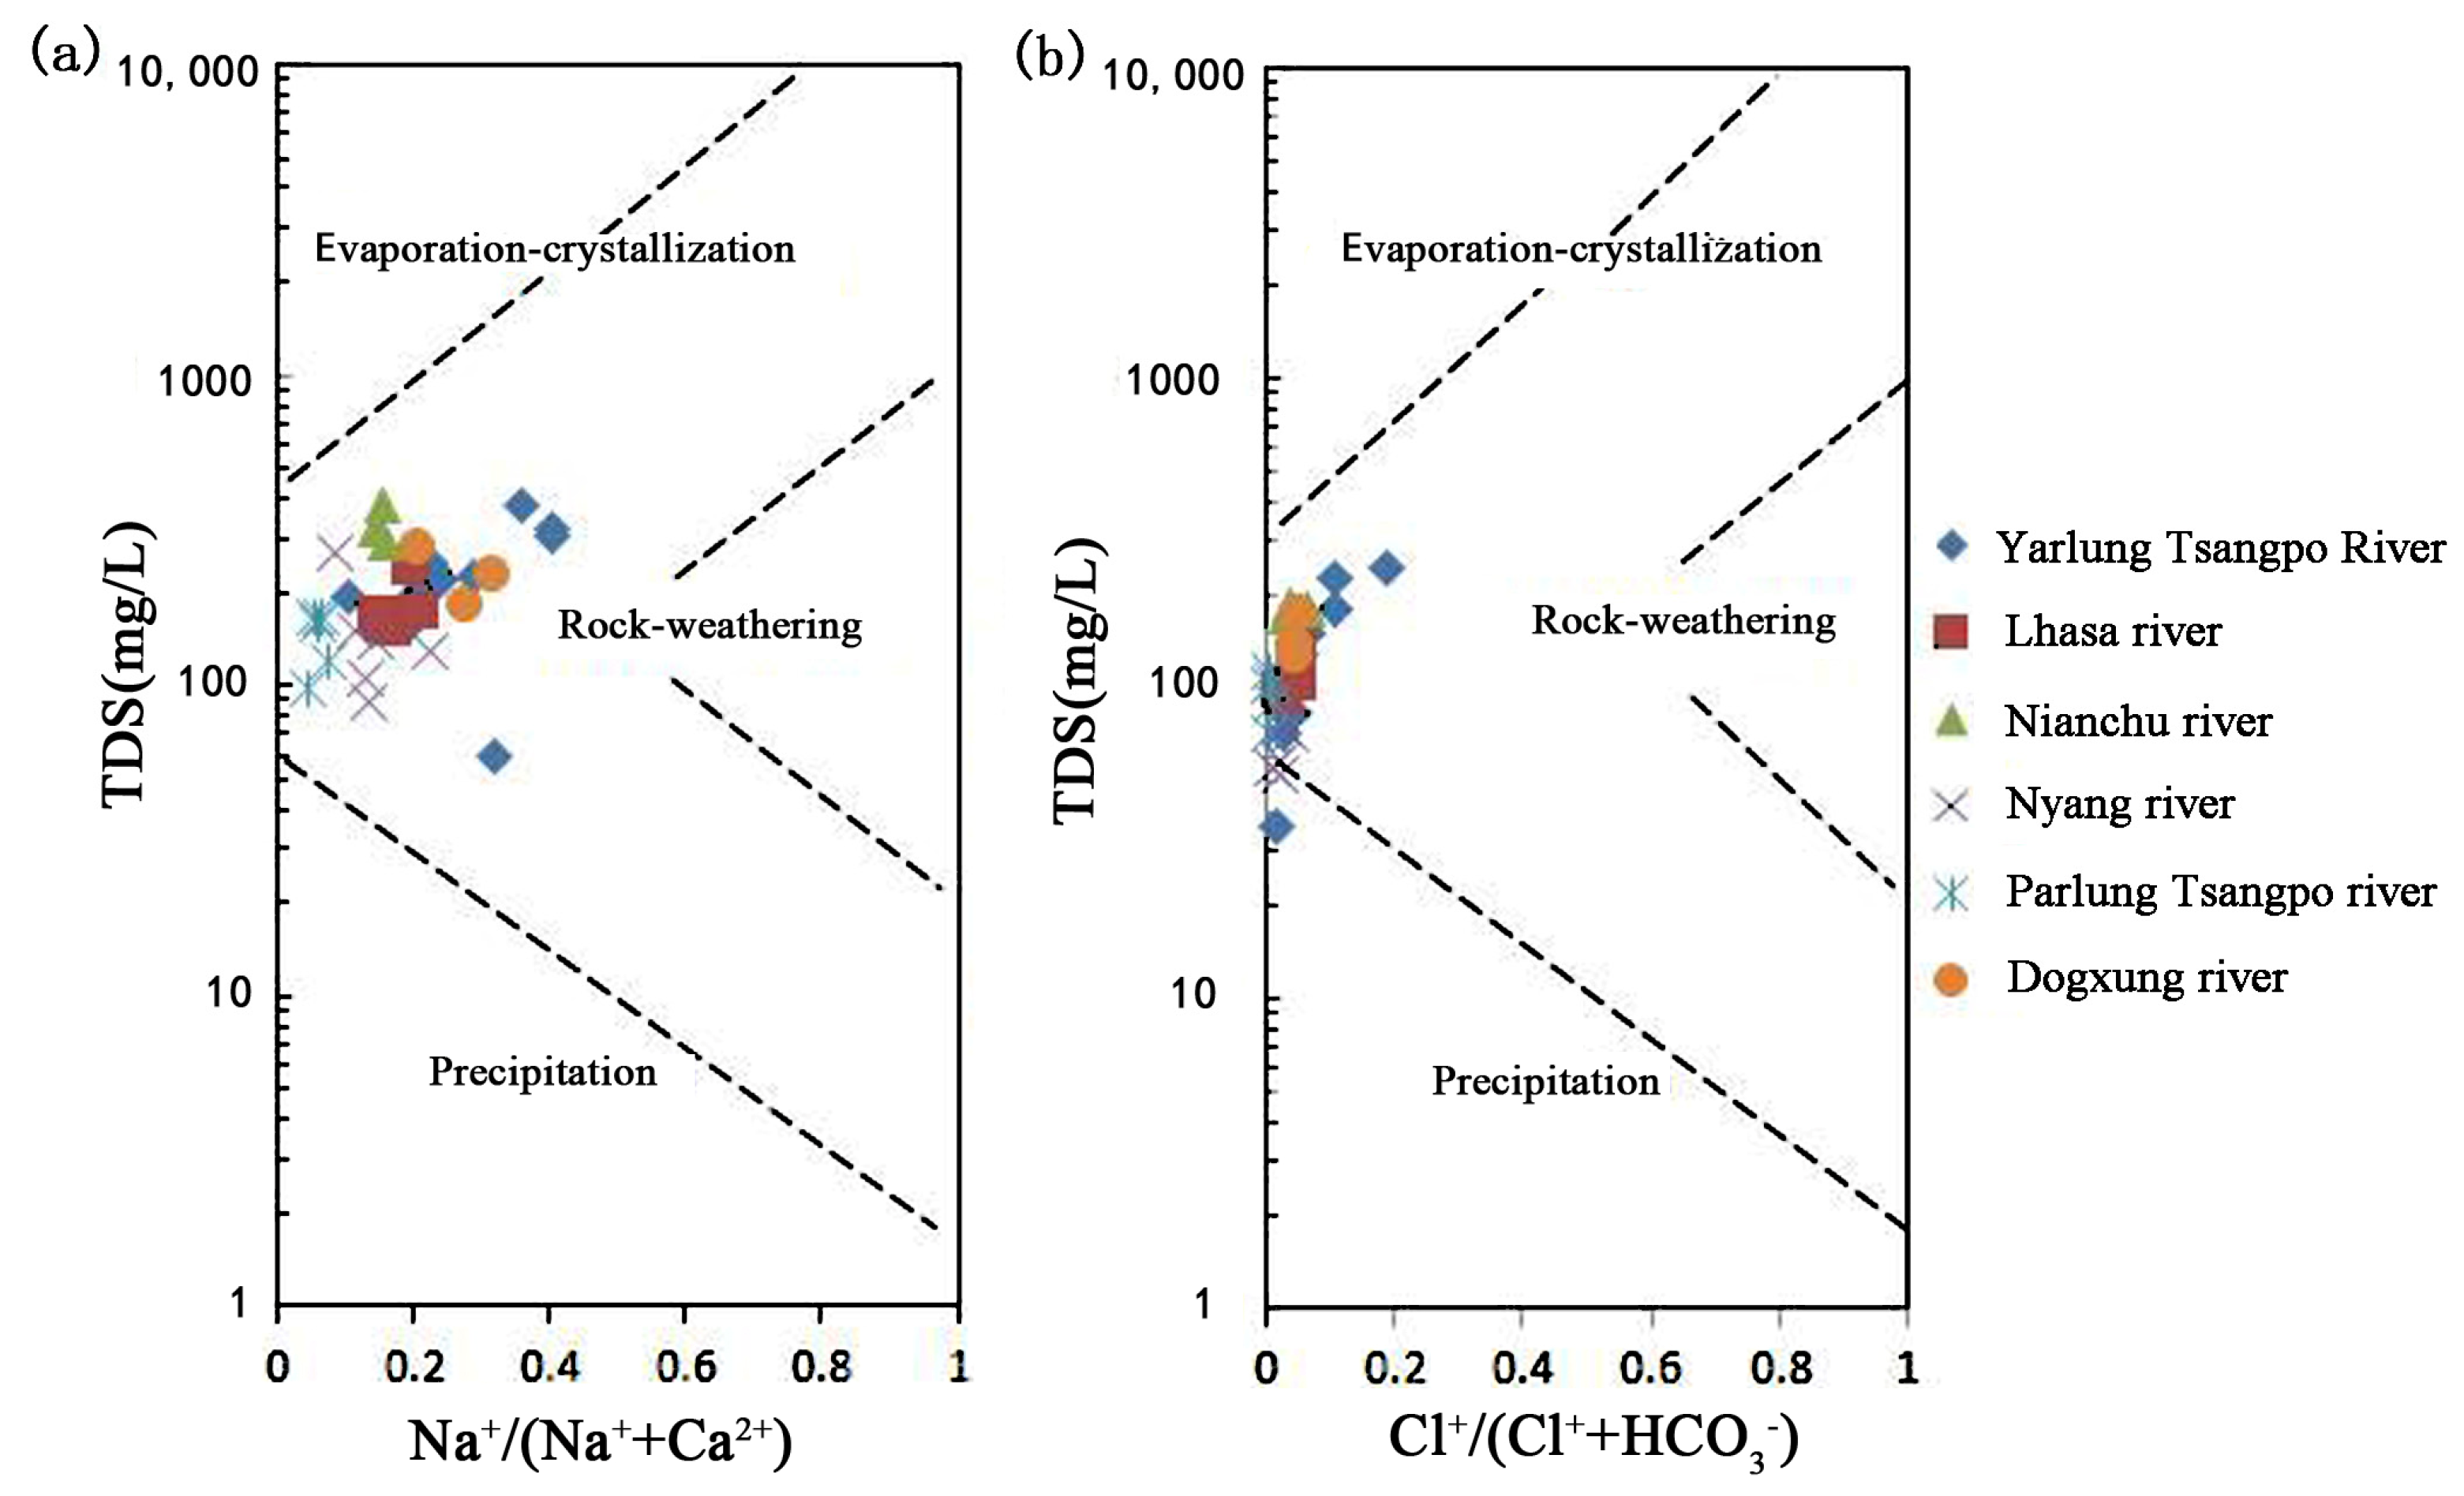
The Gibbs graph provided an assessment of the relative importance of the major natural mechanisms controlling the surface water chemistry, including atmospheric precipitation, evaporation, fractional crystallization and rock weathering [28]. In this study, the samples from the Yarlung Tsangpo River and its tributaries were analyzed in the Gibbs plots. The Gibbs plots show that the ratios of Na+/(Na+ + Ca2+) (<0.38) and Cl/(Cl + HCO3) (<0.21) were relatively low, and the TDS values were moderate, (Figure 6) indicating that the ion chemical properties of the main channel of the Yarlung Tsangpo River and its tributaries are mainly controlled by rock weathering. The collected water samples were far away from the controlled areas of “precipitation dominated” and “evaporative crystallization”. As discussed above, chemical weathering and physical erosion of the parent rock in the Yarlung Tsangpo River basin provided a significant contribution to the ionic chemical composition of the water. The average Cl/Na+ value of the river water was 0.65, much lower than the world average seawater ratio (Cl/Na+ = 1.15), indicating that the effects of atmospheric precipitation and evaporative crystallization on ion mass concentrations in water are not the main controlling factors.

3.3.2. Analysis of the Rock Weathering Process

The cations in the river water surface runoff were mainly Ca2+ and Mg2+; carbonate weathering is an important source of Ca2+ and Mg2+. Taking the normal period as an example, it can be seen from Figure 7a, the (Ca2+ + Mg2+)/ HCO3 ratio was between 0.57 and 1.03 with a mean of less than 1, indicating that other anions in addition to carbonate are involved in the ion balance. Most of the sample points were distributed above the 1:1 line, indicating that the surface runoff is mainly affected by the weathering of carbonate rocks. Surface runoff carbonate action on carbonate rock weathering is mainly calcite and dolomite, as shown on the (Ca2+ + Mg2+)/(HCO3 + SO42−) scale chart (Figure 7b); the vast majority of the sample points were distributed in the 1:1 line, and the two are highly correlated (R2 = 0.93). This shows that sulfuric acid is also involved in the rock weathering reaction of carbonate (calcite and dolomite), which confirms this agreement with that shown in the Piper diagram.
In addition, the ratio of Na++K+ to Cl in the Yarlung Tsangpo River is about four and far greater than one (Figure 7c), indicating that the sources of Na+ and K+ in the water body are relatively complex, not all due to the weathering of evaporite, but it is speculated that it is mainly due to the weathering of silicate. On the other hand, the river water sample fell above (Ca2+ + Mg2+)/(HCO3 + SO42−) = 1:1 (Figure 7d), indicating that individual carbonate weathering products do not contribute to all Ca2+ + Mg2+, and some Ca2+ + Mg2+ are also derived from silicate weathering products, The correlation between Na+ and SiO2 was better, reaching R2 = 0.31 (Figure 7f). It is speculated that sodium feldspar in silicate weathering is the main reaction. Silicate material consumes CO2 in the process of the chemical weathering reaction to produce HCO3, and statistics show that the correlation with SiO2 is not high (R2 = 0.01) (Figure 7e), indicating that the contribution of chemical weathering of silicate to the alkalinity of the water body is not obvious.

3.3.3. Principal Component Analysis

Principal components analysis (PCA) with rotation was used to further explore the relationship between the anions and cations in the Yarlung Tsangpo basin, as well as to understand the geological background and controlling factors of the major ions [29]. Based on the 212 water samples collected during the three periods, three major public factors were obtained through factor analysis, and the cumulative variance was 75.14% of the total variance. Among them, the contribution rates of the first, second and third factors reached 34.5, 26.2 and 14.4%, respectively (Table 3). Cluster 1 consisted of a strong correlation between K+, Na+, Cl, SiO2, which is related to evaporite weathering. The concentration of these major ions is also strongly governed by up-concentration, due to evaporation in the headwater lakes and dilution downstream. This result is consistent with other studies. The clustering of Mg2+, SO42−, Ca2+ and HCO3 in Cluster 2 demonstrated that the correlation between the weathering of calcite and dolomite and the dissolution of sulfate minerals is strong. The carbonate weathering was the main source for the solute Ca2+ [5], and 80–90% of dissolved Ca2+ and Mg2+ are generated from carbonate weathering in the Yarlung Tsangpo catchments. The third factor is related to Mn and Zn, indicating a potential correlation with human activities, such as the mining industry, but the impact of human activities is negligible. The cumulative contribution rate of the three main factors in the flood season and the flat water period was 75.14%. The contribution rates of factors 1, 2 and 3 reached 34.5, 26.2 and 14.4%, respectively. The cumulative variance contribution rate during the dry season was 66.67%. Comparing the water level with the wet period, it was found that the cumulative percentage variance (66.67%) in the dry season was slightly lower than that in the flat and wet season (75.14%), but the ion load value increased. The results showed that the main source of ions in the wet and flat periods is more complicated (Figure 8).

3.3.4. Analysis of Elevation Effect

Tectonic movements have shaped the unique topography and landforms of the Qinghai–Tibet Plateau and also endowed the Yarlung Tsangpo River basin with a unique elevation. The weathering of continental surface rocks is mainly controlled by tectonic uplift and topographic relief [30]. Elevation has a significant effect on chemical weathering (second only to runoff). Globally, the correlation coefficient between elevation and chemical weathering rate is 0.51 [31], and the relationships between rivers and elevation in different regions are significantly different.
The Yarlung Tsangpo River basin, with an average elevation of over 4000 m, is the highest river in the world. From its source to Lizi, the elevation has dropped from 5590 m to 4400 m, from the middle reaches to Paizhen to 2880 m, and from the lower reaches and Palongzangbo to below 2000 m. The large altitude difference is the unique nature of this basin. The atmospheric precipitation, temperature, evaporation conditions and vegetation types of the underlying surface all change with the change in altitude gradient, which has a strong effect on the chemical weathering process and material chemical cycle of the basin, and then affects the water chemical characteristics of the river. The relationship between TDS content and altitude (H) is (Figure 9):
  • High water period: TDS = 0.0235H + 89.65 (R2 = 0.57);
  • Dry season: TDS = 0.0542H + 16.135 (R2 = 0.62);
  • Level water period: TDS = 0.0369H + 95.866 (R2 = 0.50).

4. Conclusions

In this study, a spatiotemporal analysis of the major ions and trace elements in the Yarlung Tsangpo River during the wet, normal and dry periods in 2018 was carried out. The basic water chemical characteristics and their main controlling factors that influence the water chemistry were analyzed. The following conclusions were drawn from this study.
The surface water quality of the Yarlung Tsangpo River basin is weakly alkaline. The average TDS in the river was 204.51 mg L−1, which is above the global average. The main cations are Ca2+ and Mg2+, while the main anions are HCO3 and SO42−. The hydrochemical characteristics in most parts of the Yarlung Tsangpo Basin are of SO4·(HCO3)Ca·(Mg) type. Most heavy metal elements can meet the first class standard of the surface water environmental quality standards; however, only a few sampling points, affected by upstream mining, had excessive levels of As, which could also derive from sulfides such as pyrite. Temporally, the hydrochemical features of the Yarlung Tsangpo basin have significant seasonal differences, where ionic concentrations are the lowest in the wet season and higher in the dry and normal periods. Spatially, the ionic concentrations in the main channel decrease from upstream to downstream, but the ionic concentrations fluctuate remarkably in the tributaries. The results of correlation analysis and the Gibbs model showed that the ion composition in the Yarlung Tsangpo River was mainly controlled by rock weathering. Principal component analysis (PCA) showed that the hydrochemical characteristics of Yarlung Tsangpo River were mainly affected by evaporite weathering and carbonate weathering; meanwhile, the influence of the mining industry also plays an important role. In the context of global climate change, the pollutants accumulated in the glacier will also be released into the river; thus, both anthropogenic activities and climate change can affect the hydrochemical features of the Yarlung Tsangpo River. These factors could present risks to human health on the Tibetan Plateau. The conclusion of this paper provides a basis for further study of the water quality of Yarlung Tsangpo River and the water quality changes in the “Asian Water Tower”. It provides a basic scientific basis for understanding the water environment of the basin and the scientific management of the water resources.

Author Contributions

Conceptualization, J.L. and H.G.; methodology, J.L.; validation, H.G.; formal analysis, J.L.; investigation, J.L.; resources, H.G. data curation, J.L. writing—review and editing, J.L.; visualization, J.L. supervision, H.G.; project administration, H.G. All authors have read and agreed to the published version of the manuscript.

Funding

The research was funded by the Major project of the Ministry of Science and Technology (2015FY111000).

Institutional Review Board Statement

Not applicable.

Informed Consent Statement

Not applicable.

Data Availability Statement

Not applicable.

Acknowledgments

The authors wish to thank all who assisted in conducting this work.

Conflicts of Interest

The authors declare no conflict of interest.

References

  1. Dewey, J.; Shackleton, R.; Chengfa, C. The tectonic evolution of the Tibetan Plateau. Philos. Trans. R. Soc. Lond. A Math. Phys. Eng. Sci. 1988, 327, 379–413. [Google Scholar]
  2. Tian, L.; Yao, T.; Shen, Y. Study on stable isotope in river water and precipitation in Naqu River basin, Tibetan Plateau. Adv. Water Sci. 2002, 13, 206–210. [Google Scholar]
  3. Paudyal, R.; Kang, S.; Sharma, C. Variations of the physicochemical parameters and metal levels and their risk assessment in 2 urbanized Bagmati River, Kathmandu, Nepal. J. Chem. 2016, 2016, 6025905. [Google Scholar] [CrossRef] [Green Version]
  4. Huang, X.; Sillanpaa, M.; Gjessing, E. Water quality in the Tibetan Plateau: Major ions and trace elements in the headwaters of four major asian rivers. Sci. Total Environ. 2009, 407, 6242–6254. [Google Scholar] [CrossRef] [PubMed]
  5. Hren, M.; Chamberlain, C.P.; Hilley, G.E.; Blisniuk, P.M.; Bookhagen, B. Major ion chemistry of the Yarlung Tsangpo–Brahmaputra river: Chemical weathering, erosion, and CO2 consumption in the southern Tibetan Plateau and eastern syntaxis of the Himalaya. Geochim. Cosmochim. Acta 2007, 71, 2907–2935. [Google Scholar] [CrossRef] [Green Version]
  6. Wu, W.; Xu, S.; Yang, J.; Yin, H. Silicate weathering and CO2 consumption deduced from the seven Chinese rivers originating in the Qinghai–Tibet Plateau. Chem. Geol. 2008, 249, 307–320. [Google Scholar] [CrossRef]
  7. Liu, Y.; Vick-Majors, T.; Priscu, J. Biogeography of cryoconite bacterial communities on glaciers of the Tibetan Plateau. FEMS Microbiol. Ecol. 2017, 93, fix072. [Google Scholar] [CrossRef] [Green Version]
  8. Huang, X.; Sillanpää, M.; Gjessing, E. Water quality in the southern Tibetan Plateau: Chemical evaluation of the Yarlung Tsangpo (Brahmaputra). River Res. Appl. 2011, 27, 113–121. [Google Scholar] [CrossRef]
  9. Liu, J.; Xie, J.; Gong, T. Impacts of winter warming and permafrost degradation on water variability, upper Lhasa River, Tibet. Quat. Int. 2011, 244, 178–184. [Google Scholar] [CrossRef]
  10. Niu, H.; He, Y.; Lu, X. Characteristics of modern atmospheric dust deposition in snow in the Mt. Yulong region, southeastern Tibetan Plateau. J. Asian Earth Sci. 2017, 94, 45–54. [Google Scholar] [CrossRef]
  11. Zhang, L.; Zhao, Z.; Zhang, W. Characteristics of water chemistry and its indication of chemical weathering in Jinshajiang, Lancangjiang and Nujiang drainage basins. Environ. Earth Sci. 2016, 75, 506. [Google Scholar] [CrossRef]
  12. Karunanidhi, D.; Subramani, T.; Roy, P. Impact of groundwater contamination on human health. Environ. Geochem. Health 2021, 43, 643–647. [Google Scholar] [CrossRef] [PubMed]
  13. Fuoco, I.; Marini, L.; De Rosa, R.; Figoli, A.; Gabriele, B.; Apollaro, C. Use of reaction path modelling to investigate the evolution of water chemistry in shallow to deep crystalline aquifers with a special focus on fluoride. Sci. Total Environ. 2022, 830, 154566. [Google Scholar] [CrossRef] [PubMed]
  14. Zhang, Y.; Sillanpää, M.; Li, C. River water quality across the Himalayan regions: Elemental concentrations in headwaters of Yarlung Tsangbo, Indus and Ganges River. Environ. Earth Sci. 2015, 73, 4151–4163. [Google Scholar] [CrossRef]
  15. Gong, Z.; Wang, J. Two new species of Garra (Cypriniformes: Cyprinidae) from the lower Yarlung Tsangpo River drainage in southeastern Tibet, China. Zootaxa 2018, 4532, 367–384. [Google Scholar] [CrossRef]
  16. Liu, J.; Zhao, Y.; Li, Z. Quantitative source apportionment of water solutes and CO2 consumption of the whole Yarlung Tsangpo River basin in Tibet, China. Environ. Sci. Pollut. Res. 2019, 26, 28243–28255. [Google Scholar] [CrossRef]
  17. Scherler, D.; Bookhagen, B.; Strecker, M. Spatially variable response of Himalayan glaciers to climate change affected by debris cover. Nat. Geosci. 2011, 4, 156–159. [Google Scholar] [CrossRef]
  18. Gong, T.; Liu, C.; Liu, J. Hydrological response of Lhasa River to climate change and permafrost degradation in Xizang. Acta Geogr. Sin. 2006, 61, 519–526. [Google Scholar]
  19. Gaillardet, J.; Dupre, B.; Louvat, P. Global silicate weathering and CO2 consumption rates deduced from the chemistry of large rivers. Chem. Geol. 1999, 159, 3–30. [Google Scholar] [CrossRef]
  20. Pant, R.; Zhang, F.; Rehman, F. Spatiotemporal variations of hydrogeochemistry and its controlling factors in the Gandaki River Basin, Central Himalaya Nepal. Sci. Total Environ. 2017, 770, 622–623. [Google Scholar] [CrossRef]
  21. Paudyal, R.; Kang, S.; Sharma, C. Major ions and trace elements of two selected rivers near Everest region, southern Himalayas, Nepal. Environ. Earth Sci. 2016, 75, 46. [Google Scholar] [CrossRef]
  22. Abbas, N.; Subramanian, V. Erosion and sediment trans-port in the Ganges river basin, India. J. Hydrol. 1984, 69, 173–182. [Google Scholar] [CrossRef]
  23. Varol, M.; Gokot, B.; Bekleyen, A.; Şen, B. Geochemistry of the Tigris river basin, Turkey: Spatial and seasonal variations of major ion compositions and their controlling factors. Quat. Int. 2013, 304, 22–32. [Google Scholar] [CrossRef]
  24. Kennedy, V.; Zellweger, G. Filter pore-size effects on the analysis of Al, Fe, Mn, and Ti in water. Water Resour. Res. 1974, 56, 785–790. [Google Scholar] [CrossRef]
  25. Laxen, D.; Chandler, I. Comparison of filtration techniques for size distribution in freshwater. Anal. Chem. 1982, 54, 1350–1355. [Google Scholar] [CrossRef]
  26. Fuoco, I.; De Rosa, R.; Barca, D.; Figoli, A.; Gabriele, B. Arsenic polluted waters: Application of geochemical modelling as a tool to understand the release and fate of the pollutant in crystalline aquifers. J. Environ. Manag. 2022, 301, 113796. [Google Scholar] [CrossRef]
  27. Apollaro, C.; Tripodi, V.; Vespasiano, G.; De Rosa, R.; Dotsika, E.; Fuoco, I.; Critelli, S. Chemical, isotopic and geotectonic relations of the warm and cold waters of the Galatro and Antonimina thermal areas, southern Calabria, Italy. Mar. Pet. Geol. 2019, 109, 469–483. [Google Scholar] [CrossRef]
  28. Gibbs, R. Mechanisms controlling world water chemistry. Science 1971, 170, 1088–1090. [Google Scholar] [CrossRef]
  29. Mohamed, A.; Asmoay, A.; Alshehri, F.; Abdelrady, A. Hydro-geochemical applications and multivariate analysis to assess the water–rock interaction in arid environments. Appl. Sci. 2022, 12, 6340. [Google Scholar] [CrossRef]
  30. Raymo, M.; Ruddiman, W. Tectonic forcing of late Cenozoic climate. Nature 1992, 359, 117–122. [Google Scholar] [CrossRef]
  31. Moya, C.; Raiber, M.; Taulis, M. Hydrochemical evolution and groundwater flow processes in the Galilee and Eromanga basins, Great Artesian Basin, Australia: A multivariate statistical approach. Sci. Total Environ. 2015, 508, 411–426. [Google Scholar] [CrossRef] [PubMed]
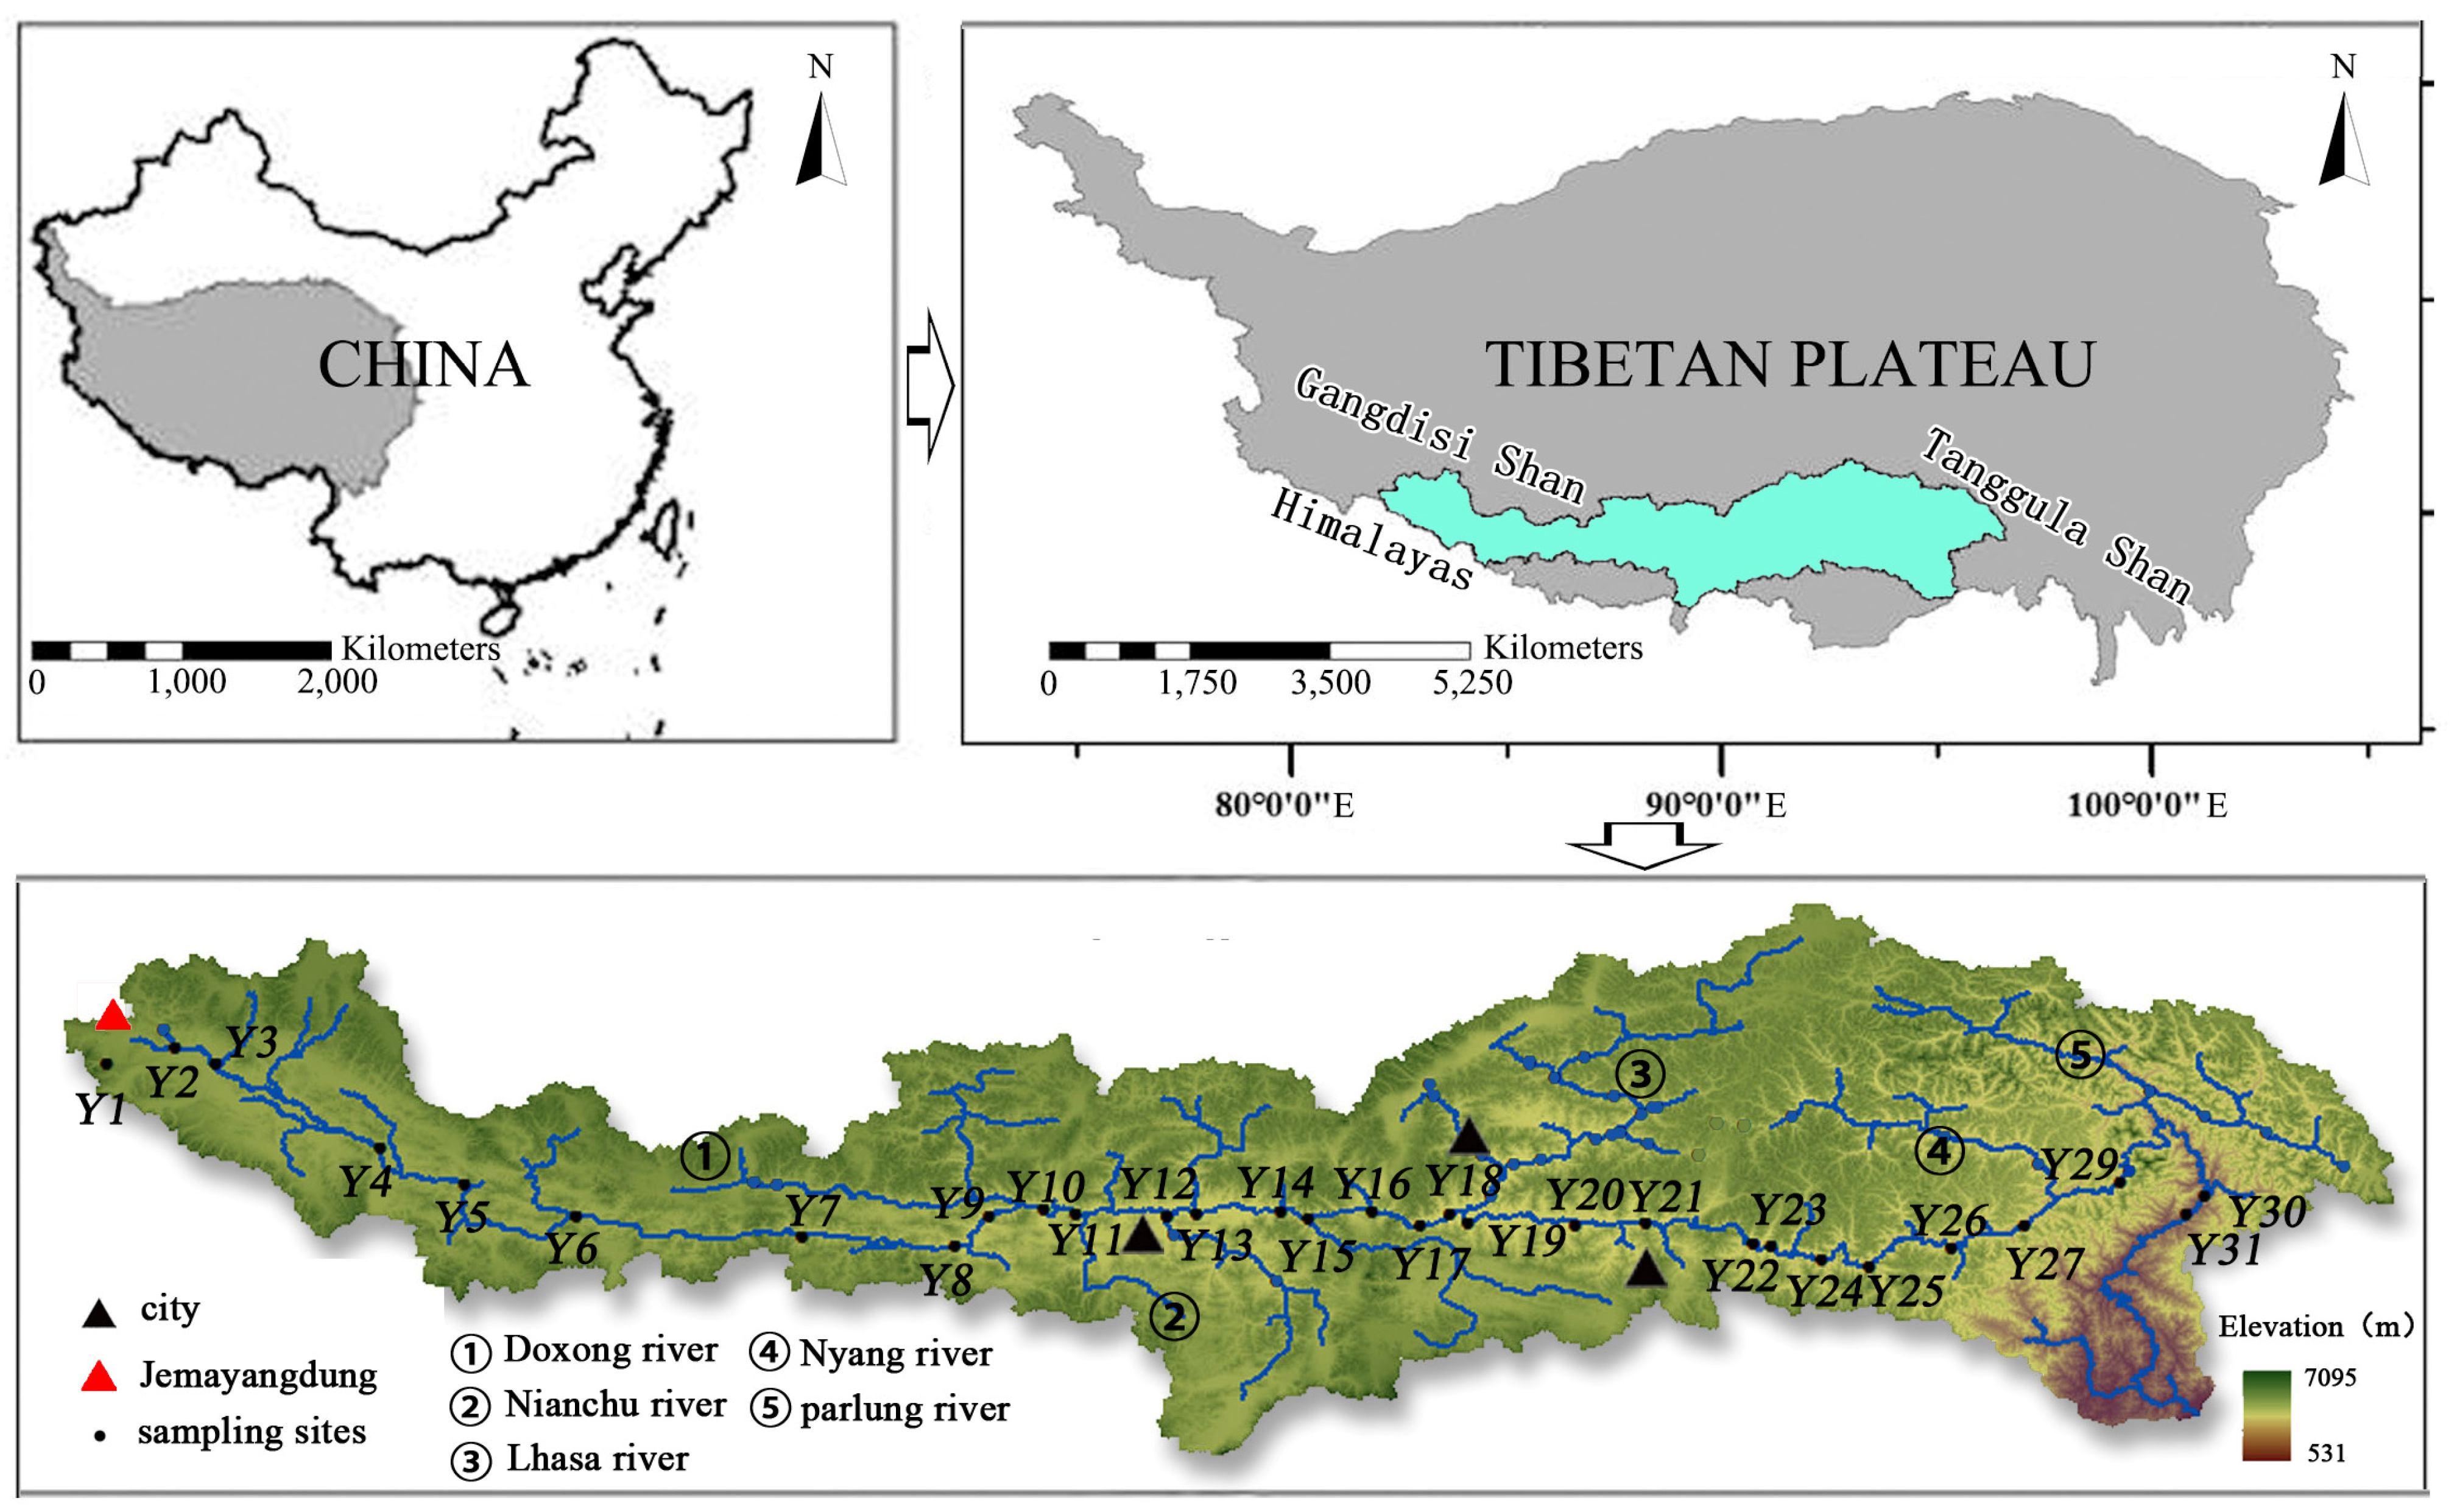
Figure 1. The Yarlung Tsangpo basin in the Tibetan Plateau and a sampling point distribution diagram. Black circles and letters indicate sampling sites that correspond with figures and elsewhere in this study. Black triangles refer to major cities, red triangle refers to Jemayangdung. Y1–Y31 represents the sampling point location.
Water 15 00537 g001
Figure 2. Boxplots of basic physical and chemical properties (pH, T (Water temperature) (°C), Do (Dissolved oxygen) (mg/L), EC (Electrical conductance)(µS/cm), TDS (Total dissolved solids) (mg/L)) of the Yarlung Tsangpo River during wet, normal and dry seasons.
Water 15 00537 g002
Figure 3. Temporal and spatial variation of major heavy metals in the main stream of the Yarlung Tsangpo River. (a) Spatiotemporal variation characteristics of heavy metal Al. (b) Spatiotemporal variation characteristics of heavy metal As. (c) Spatiotemporal variation characteristics of heavy metal Cu. (d) Spatiotemporal variation characteristics of heavy metal Cr. (e) Spatiotemporal variation characteristics of heavy metal Mn. (f) Spatiotemporal variation characteristics of heavy metal Zn. Y16-Y21 represents the sampling point location in the main stream of the Yarlung Tsangpo River.
Water 15 00537 g003
Figure 4. Ternary plot of dissolved anions and cations on an equivalent concentration (leq/L) basis in the Yarlung Tsangpo River and its tributaries. Each symbol corresponds to streams from the main tributaries analyzed in this study: the Lhasa river, Nianchu river, Nyang river and Parlung Tsangpo. (a) Cation plot: most of the samples cluster around Ca2+ apex, indicating dominance of carbonate weathering contribution to major ion concentrations. (b) Anion plot: data near the mixing line between HCO3 + CO32−, suggesting carbonate and evaporite weathering in these basins. (c) Diamond plot: most of the samples cluster around SO42 + Cl apex.
Water 15 00537 g004
Figure 5. The variation of major ion concentrations along 800 km of the Yarlung Tsangpo River main channel during wet, normal and dry periods. (a) Cation concentration changes in wet season, (b) anion concentration changes in wet season, (c) cation concentration changes in normal season, (d) anion concentration changes in normal season, (d) anion concentration changes in normal season, (e) cation concentration changes in dry season, (f) anion concentration changes in dry season. Y17-Y20 represents the sampling point location in the main stream of the Yarlung Tsangpo River.
Water 15 00537 g005
Figure 6. Gibbs plots of concentrations ratios of (a) TDS versus Na+/(Na+ + Ca2+) and (b) TDS versus Cl/(Cl + HCO3) for the Yarlung Tsangpo River basin and its tributaries. Each symbol corresponds to streams from the main tributaries analyzed in this study: the Lhasa river, Nianchu river, Nyang river, Parlung Tsangpo and Dogxung.
Water 15 00537 g006
Figure 7. Proportion of major ions in Yarlung Tsangpo River water. The dotted line represents the fitting line. The black dots represent the sampling points.
Water 15 00537 g007
Figure 8. Component plot in the rotated (PCA) and wet period. (a) PC1, PC2 and PC3 loading of the Yarlung Tsangpo River basin in normal period. (b) PC1, PC2 and PC3 loading of the Yarlung Tsangpo River basin in wet period.
Water 15 00537 g008
Figure 9. Variation of TDS with altitude of the Yarlung Tsangpo River during wet, normal and dry periods. The dotted line represents the fitting line. The black dots represent the sampling points.
Water 15 00537 g009
Table 1. Summary statistics of hydrochemical composition of the Yarlung Tsangpo and its comparison with other rivers around the world.
River pHTDSCa2+Mg2+K+Na+SiO2CLNO3SO42−HCO3FReference
Dry period of Yarlung TsangpoMin7.9713.302.110.040.510.810.000.080.000.957.540.00This study
Max9.03451.0054.4328.98.4249.760.0446.8210.9476.85303.250.75
Mean8.67183.5426.726.021.529.580.017.460.7930.0079.840.26
SD0.1772.7213.573.820.429.580.327.291.4417.5440.320.324
Normal period of Yarlung TsangpoMin7.6259.69.460.90.760.983.150.330.088.8135.540
Max8.9138677.9518.269.5349.9934.03603.1599.44201.41.67
Mean8.46204.5136.027.251.9811.158.647.321.5836.86115.570.20
SD0.6568.0312.193.011.339.283.9610.080.8316.1236.560.26
Wet period of Yarlung TsangpoMin8.0815.202.240.030.590.722.660.420.011.139.810.01
Max8.98375.0061.0813.456.0035.7310.4359.652.61105.31155.320.49
Mean8.58154.1429.225.291.375.936.323.700.7534.0578.150.01
SD0.1761.2111.332.350.775.141.427.510.6118.7327.310.08
Dudhkoshi, Nepal7.52377.900.40.700.80-0.601.203.7022-[21]
Indus, India8.55260244.501.607.302.894.801.7011.981.2-[22]
Tigris, Turkey8.4527646.619.141.446.435.9220.702.4923.20153.80-[23]
Upper Yangtze, China7.9877853.4022.905.50157.70-233.701.30114.90188.50-[16]
Upper Mekong, China8.423024914112.001.8614-69.01138.00-[16]
Yellow, China9.3048644.9022.403.50608.4046.907.408.20200.10-[16]
Global mean8120154.102.306.307.637.80111.2058.40-[19]
All units in mg L−1, SD: standard deviation, Min: minimum, Max: maximum.
Table 2. Statistical characteristics of heavy metals in the Yarlung Tsangpo River basin during the dry, wet and normal periods (N = 67).
ELE FeCuNiCoMnCrLiTiAlMoAgCdPbZnSeAsHg
UnitDry periodmg/Lug/Lug/Lug/Lug/Lug/Lug/Lug/Lug/Lug/Lug/Lug/Lug/Lug/Lug/Lug/Lug/L
Min13.862.1174.181.8713.506.60300.003.3475.9110.600.216.647.37122.730.04182.090.07
Max0.000.431.400.221.713.7821.600.310.310.640.210.040.080.250.010.150.00
Mean2.361.2423.671.356.545.45138.751.0121.142.580.211.384.3264.960.0212.510.03
SD4.270.6019.620.383.700.9797.900.8029.721.670.001.322.3844.400.0132.830.02
CV%0.542.311.353.511.775.601.421.250.711.540.211.031.791.481.590.381.38
MinWet period10.394.513.360.7786.748.83203.332.1170.584.580.000.170.245.090.00217.560.13
Max4.940.510.550.271.092.8312.332.112.680.440.000.170.070.420.000.190.01
Mean6.971.462.350.456.405.0742.022.1140.331.670.000.170.121.270.0025.860.05
SD0.960.870.550.2315.051.1135.690.0017.170.690.000.000.041.120.0067.790.04
CV%7.201.663.581.980.434.091.170.290.282.280.000.000.691.100.000.381.34
MinNormal period0.181.646.880.8022.906.60300.0012.10597.0010.600.000.040.401.640.12182.090.07
Max0.010.290.490.201.711.3016.502.911.030.640.000.040.050.240.000.280.00
Mean0.030.762.400.375.434.0175.657.5142.371.830.000.040.130.530.0512.200.03
SD0.040.301.070.214.351.1457.324.60104.681.680.000.000.090.360.0331.730.02
CV%0.712.502.211.791.233.531.321.630.401.070.000.001.351.461.610.381.21
Table 3. Principal component analysis (PCA) of elements in river waters.
VariableWet PeriodNormal PeriodDry Period
pc1pc2pc3pc1pc2pc3pc1pc2pc3
Ca2+−0.4460.875−0.0390.2720.8800.2030.0460.6670.254
K+0.6620.5880.1480.897−0.0340.1200.7030.323−0.076
Mg2+0.688−0.614−0.0400.0690.8600.0740.2260.789−0.027
Na+0.9100.3560.1110.9760.0180.0040.9070.290−0.088
SO42−0.599−0.6450.1790.0210.6460.6320.0650.6610.595
HCO30.7240.5120.1910.4870.778−0.1580.9090.115−0.114
CL0.862−0.255−0.2450.9340.0140.0260.1960.622−0.322
SiO2−0.3550.635−0.0550.775−0.3360.0420.089−0.7070.098
Mn−0.4100.4780.0330.031−0.2420.929−0.042−0.6960.144
Al0.7500.4820.141−0.074−0.6180.0380.948−0.100−0.048
Zn−0.184−0.2470.885−0.195−0.3000.868−0.069−0.0700.874
The variance contribution rate30.57%28.31%13.41%30.57%28.31%13.41%30.52%21.49%14.64%
The cumulative variance contribution rate%30.57%58.89%72.31%30.57%58.89%72.31%30.52%52.02%66.67%
Disclaimer/Publisher’s Note: The statements, opinions and data contained in all publications are solely those of the individual author(s) and contributor(s) and not of MDPI and/or the editor(s). MDPI and/or the editor(s) disclaim responsibility for any injury to people or property resulting from any ideas, methods, instructions or products referred to in the content.