


Abstract
In the past decade, more than 300 people have died per year on average due to mountain torrents in China. Mountain torrents mostly occur in ungauged small and medium-sized catchments, so it is difficult to maintain high accuracy of flood prediction. In order to solve the problem of the low accuracy of flood simulation in the ungauged areas, this paper studies the influence of different methods on the parameter regionalization of distributed hydrological model parameters in hilly areas of Hunan Province. According to the terrain, landform, soil and land use characteristics of each catchment, we use Shortest Distance, Attribute Similarity, Support Vector Regression, Generative Adversarial Networks, Classification and Regression Tree and Random Forest methods to create parameter regionalization schemes. In total, 426 floods of 25 catchments are selected to calibrate the model parameters, and 136 floods of 8 catchments are used for verification. The results showed that the average values of the Nash–Sutcliffe coefficients of each scheme were 0.58, 0.64, 0.60, 0.66, 0.61 and 0.68, and the worst values were 0.27, 0.31, 0.25, 0.43, 0.35 and 0.59. The random forest model is the most stable solution and significantly outperforms other methods. Using the random forest model to regionalize parameters can improve the accuracy of flood simulation in ungauged areas, which is of great significance for flash flood forecasting and early warning.
1. Introduction
Hunan Province is located in the southeast inland of China, with abundant rainfall but extremely uneven temporal and spatial distribution. Due to frequent and high-intensity rainfall and short confluence time in hilly areas, the flood rises and falls steeply, which can very easily cause mountain torrents. The climate, underlying surface and geomorphic types in hilly areas are diverse, and most of them are areas without data. This is an important challenge for flood forecasting and early warning in hilly areas.
The hydrological model is an important tool for understanding the laws of hydrological science, analyzing hydrological processes and studying hydrological cycle mechanisms [1]. How to identify hydrological parameters in ungauged areas accurately is an important area of research for PUB (Prediction in Ungauged Basins). The regionalization method is usually used to determine the parameters of hydrological models for ungauged basins at present, and the commonly used methods include shortest distance, attribute similarity, regression, average, machine learning, etc. The main idea of the regionalization method is to analyze the relationship between model parameters and characteristic attributes of basins, and the parameters of the hydrological model for ungauged basins are deduced from the calibration results of gauged basins [2].
The parameter transplant method includes the shortest distance method and the attribute similarity method. Among them, the distance approach refers to finding one or more basins adjacent to the research object in the geographical location. The attribute similarity method is used to find a basin that is similar to the research basin in attributes. Young achieved the ideal result of parameter transplant by computing the spatial distance between 260 catchments in the UK [3]. Parajka et al. selected indicators such as watershed area, average slope, watershed latitude, river network density, vegetation coverage, drought index, etc., to analyze the similarity of watershed attributes and complete parameter transplantation. The results show that attribute selection plays a decisive role in the performance of transplantation [4]. Li et al. compared the shortest distance method with the attribute similarity method and pointed out that the performance of transplantation results is affected by the density of hydrological stations, and it is easier to achieve better results in areas with dense hydrological stations [5].
The parameter regression method is mainly used to establish the functional relationship between watershed characteristics and model parameters. Yokoo et al. established a multiple linear regression equation between the Tank model parameters and soil, geology and land use data [6]. Cheng et al. established a regression equation between the SCS model parameter CN, concentration time and soil, land use, average slope and river length [7]. Based on the parameter regionalization method combining spatial proximity and stepwise regression analysis, Yao et al. found that stepwise regression analysis can effectively deduce the sensitive parameters [8]. Sun et al. pointed out that the parametric regression method is prone to the phenomenon of “the same effect of different parameters”, and the basin properties screening is highly subjective, which is not suitable for small samples [9].
Machine learning research mainly includes SOM classification and the CART decision tree method. Yi et al. used hierarchical clustering analysis HCA and unsupervised neural network SOM methods to divide the sub basins of Dianchi Lake basin into 7 groups based on 16 physical characteristics, and they believed that the basin parameters of the same group can be transplanted to each other [10]. Ragettli et al. took 35 basins in different regions of China as the research object, comprehensively considering the physical properties of watersheds and the spatial distance of watersheds; the CART tree model was used to optimize the parameter transplantation rules, and the results show that the CART tree has better parameter adaptability [11]. Liu et al. conducted a parametric zoning study on 19 small catchments in Henan Province; the success rate of parameter transplantation based on the CART tree is about 20% higher than that of random transplantation [12].
The advantage of the CART tree is that it is easy to interpret and the mapping between basin characteristics and transplantation rules is intuitive. In recent years, with the advent of machine learning algorithms, more and more models have been used to create parameter transplantation schemes. However, many machine learning algorithms usually require a large number of samples, and data showing that hydrological model modeling can be used for parameter calibration is often very limited, so it is necessary to reasonably build a large number of learning samples, or to study intelligent algorithms suitable for small sample research. In this study, 33 small and medium-sized catchments in Hunan Province were taken as examples. We constructed distributed hydrological models of these catchments and selected four machine learning models—Support Vector Regression, Generative Adversarial Networks, Classification and Regression Tree, and Random Forest—to create different parametric regionalization schemes and compared them with two traditional methods—Shortest Distance and Attribute Similarity. By analyzing the transplantation results of different schemes, it can provide a reference for determining the parameters of the distributed hydrological model in ungauged areas, which is very valuable for flash flood forecasting and early warning.
2. Materials and Methods
2.1. Study Area
Hunan Province is located on the South Bank of the middle reaches of the Yangtze River. The general geomorphological characteristics are that it is surrounded by mountains in the east, south and west, hills in the middle, plains and lakes in the north, and an asymmetric horseshoe basin that was high in the southwest and low in the northeast. XueFeng mountain runs through the central part of the province from southwest to northeast, which divides the whole province into two parts: mountainous area and hilly area. Due to the comprehensive influence of monsoon circulation and the geomorphic conditions, the mid subtropical monsoon humid climate with obvious continental characteristics is formed. Mountain torrents occur frequently because of the complex topography, developed water system and abundant rainfall. The average annual precipitation in Hunan Province is 1450 mm, but the distribution of precipitation is uneven in time and space, and the interannual variation is large, with an average annual variation of 1200–1800 mm. The province’s annual average water surface evaporation is 736.5 mm, with a variation range of 600–900 mm.
2.2. Data Collection
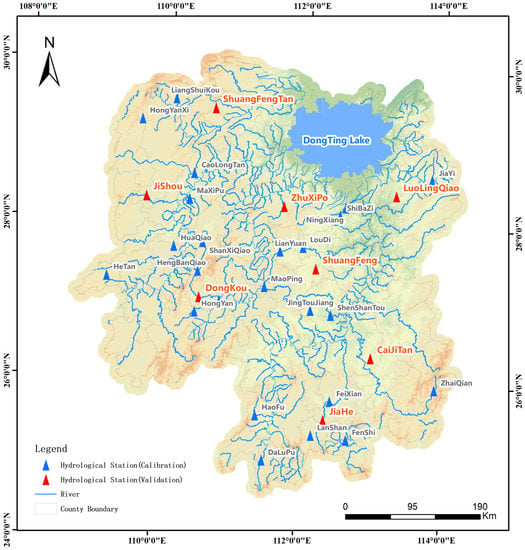
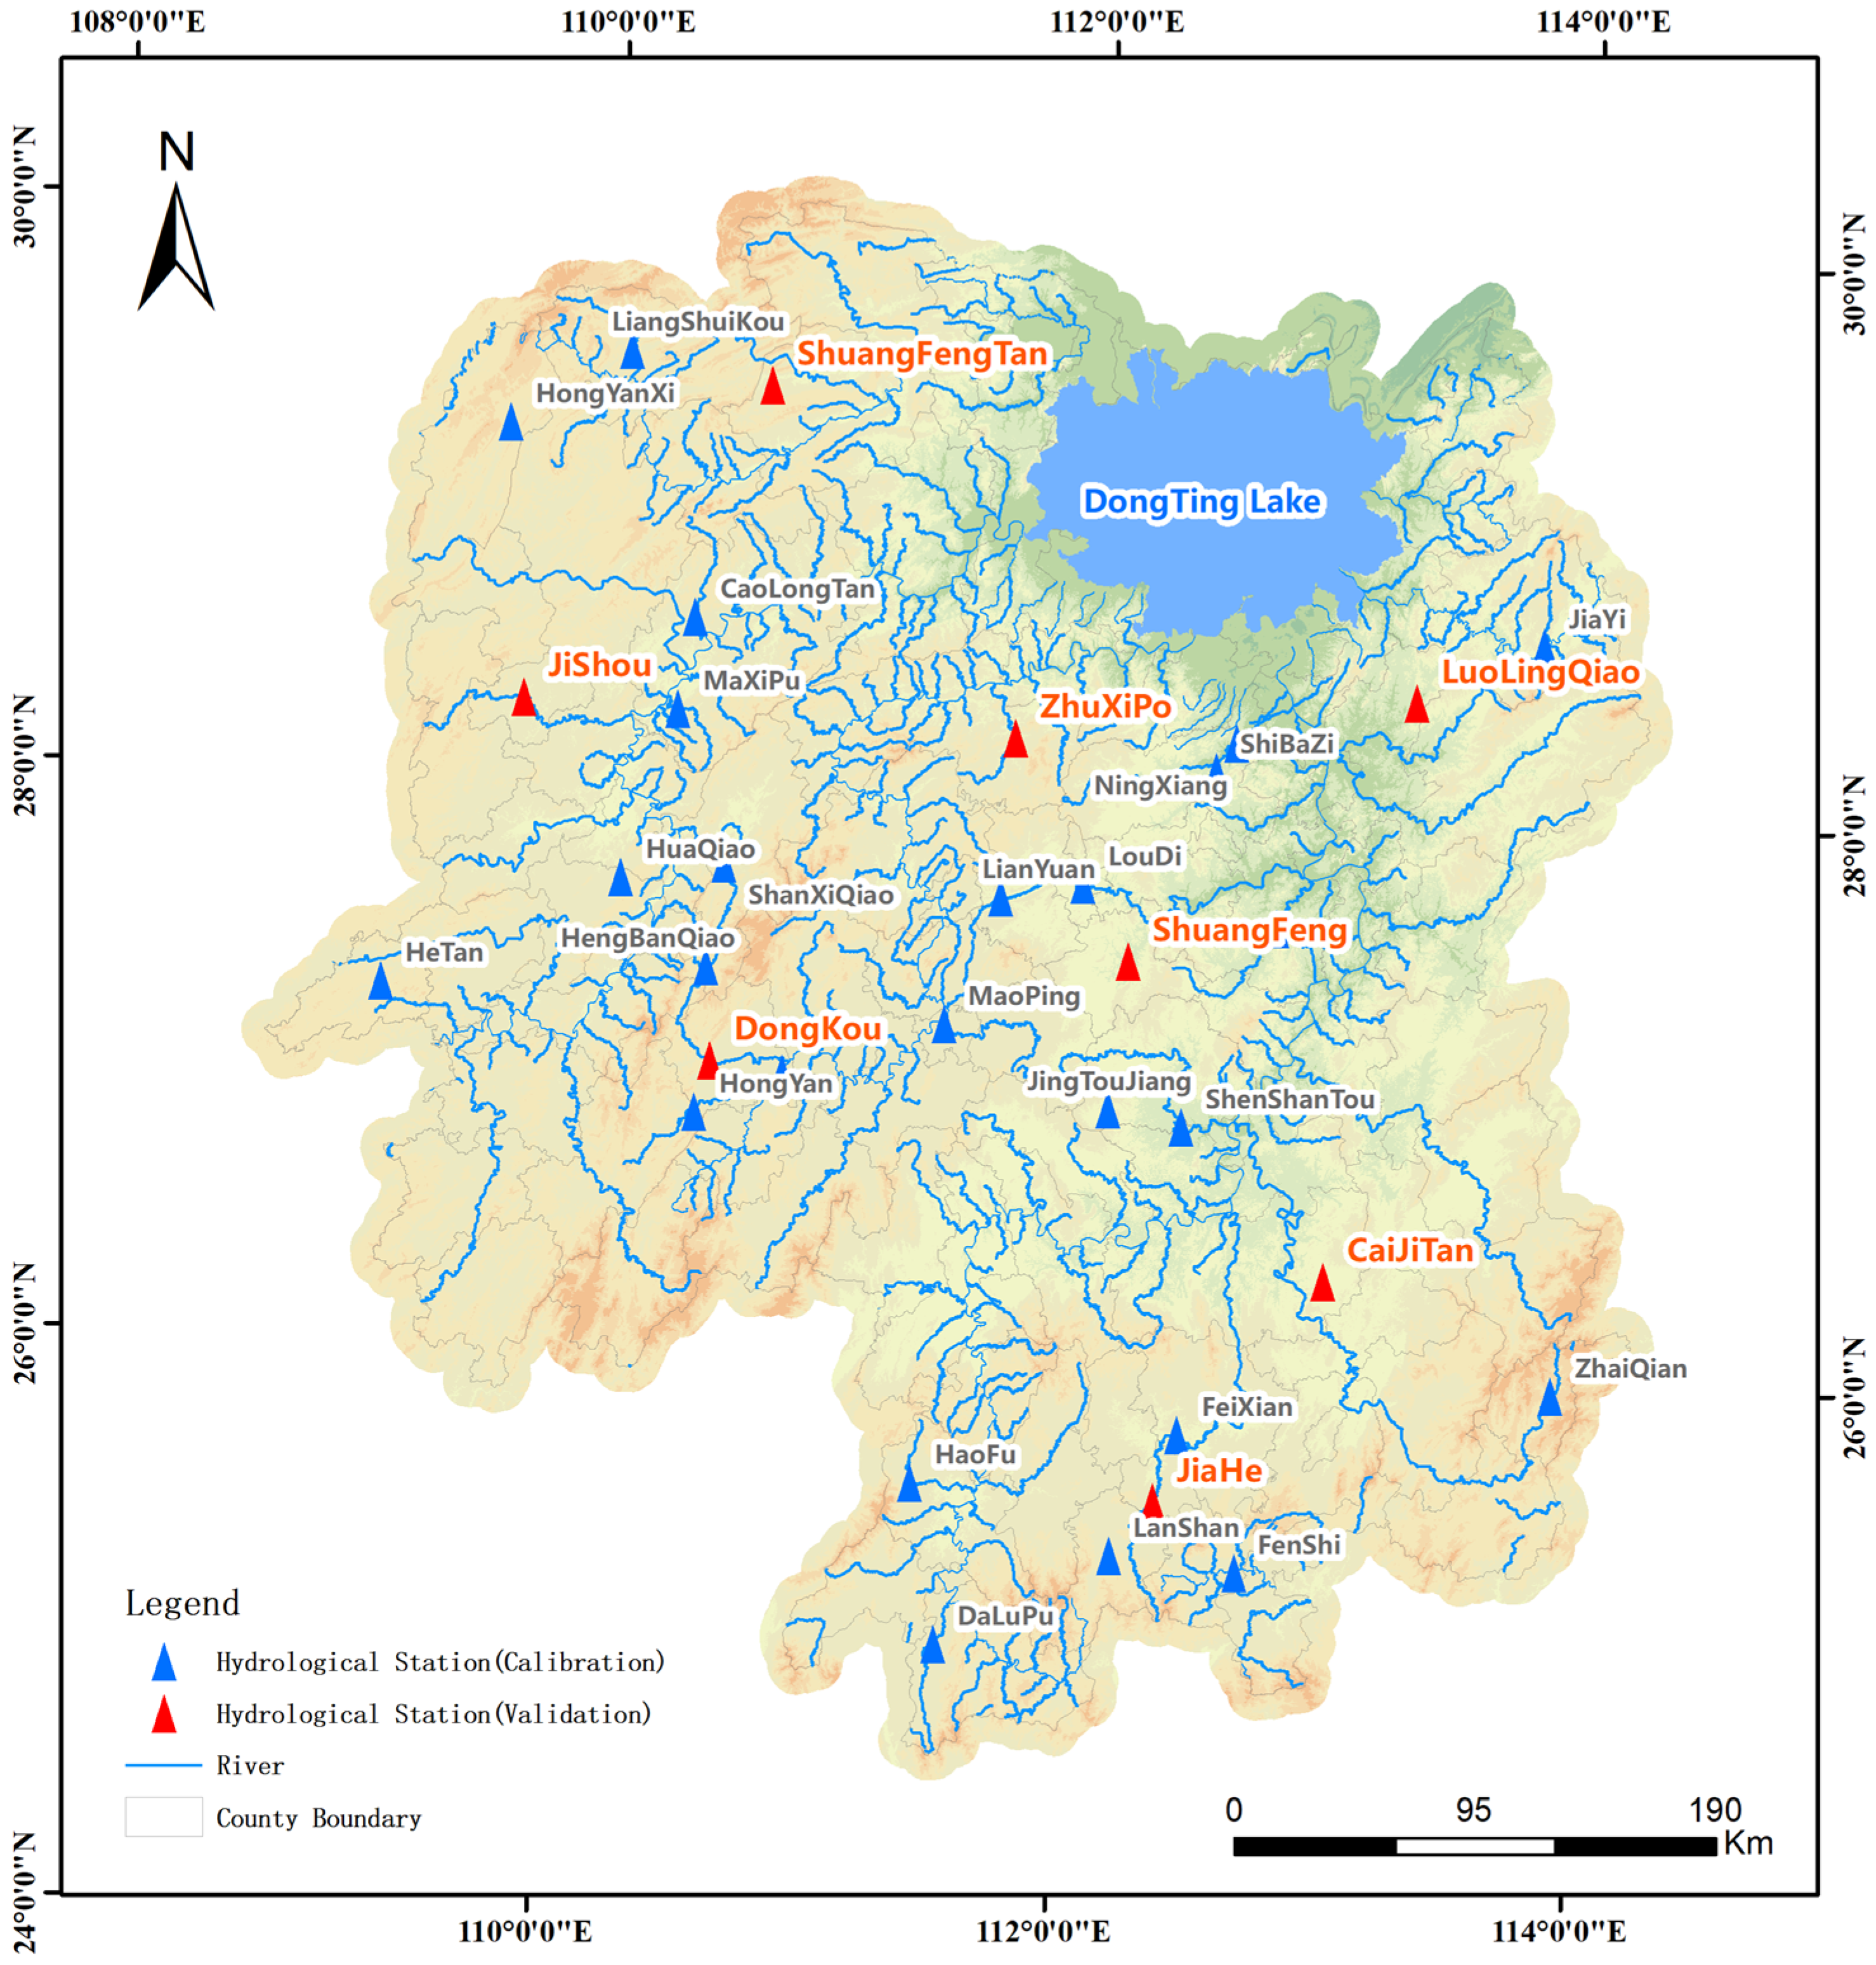
Taking 33 hydrological stations with observation data from 1979 to 2020 in Hunan Province as examples, we collected the ASTER GDEM V2 dataset, land use layer and soil type layer in Hunan Province. At the same time, a distributed hydrological model of all hydrological stations was established with 30 min as the simulation step. In this study, 426 floods in 25 catchments were selected to calibrate the model parameters, and the regionalization scheme was determined by comparing the simulation results of the other 8 catchments. Figure 1 shows the distribution of hydrological stations.
Figure 1.
Distribution of hydrological stations.
The smallest catchment is HengBanQiao, with a catchment area of 31 km2, and the largest catchment is FeiXian, with a catchment area of 3659 km2. The hydrological data collection is shown in Table 1.
Table 1.
Information of study stations.
2.3. Modeling Approaches
2.3.1. Distributed Hydrological Model
Based on the ASTER GDEM V2 dataset, the sub basin and river are extracted by GIS tools. The resolution of the DEM data grid is 30 m, and the area of the sub basin is controlled within 10–30 km2. At the same time, the attributes of sub basins and rivers are extracted, including basin area, slope, longest concentration path, average altitude, average drop (average elevation minus outlet elevation), river length, river section gradient, geomorphic unit hydrograph, etc.
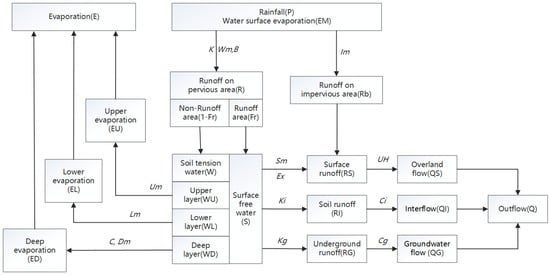
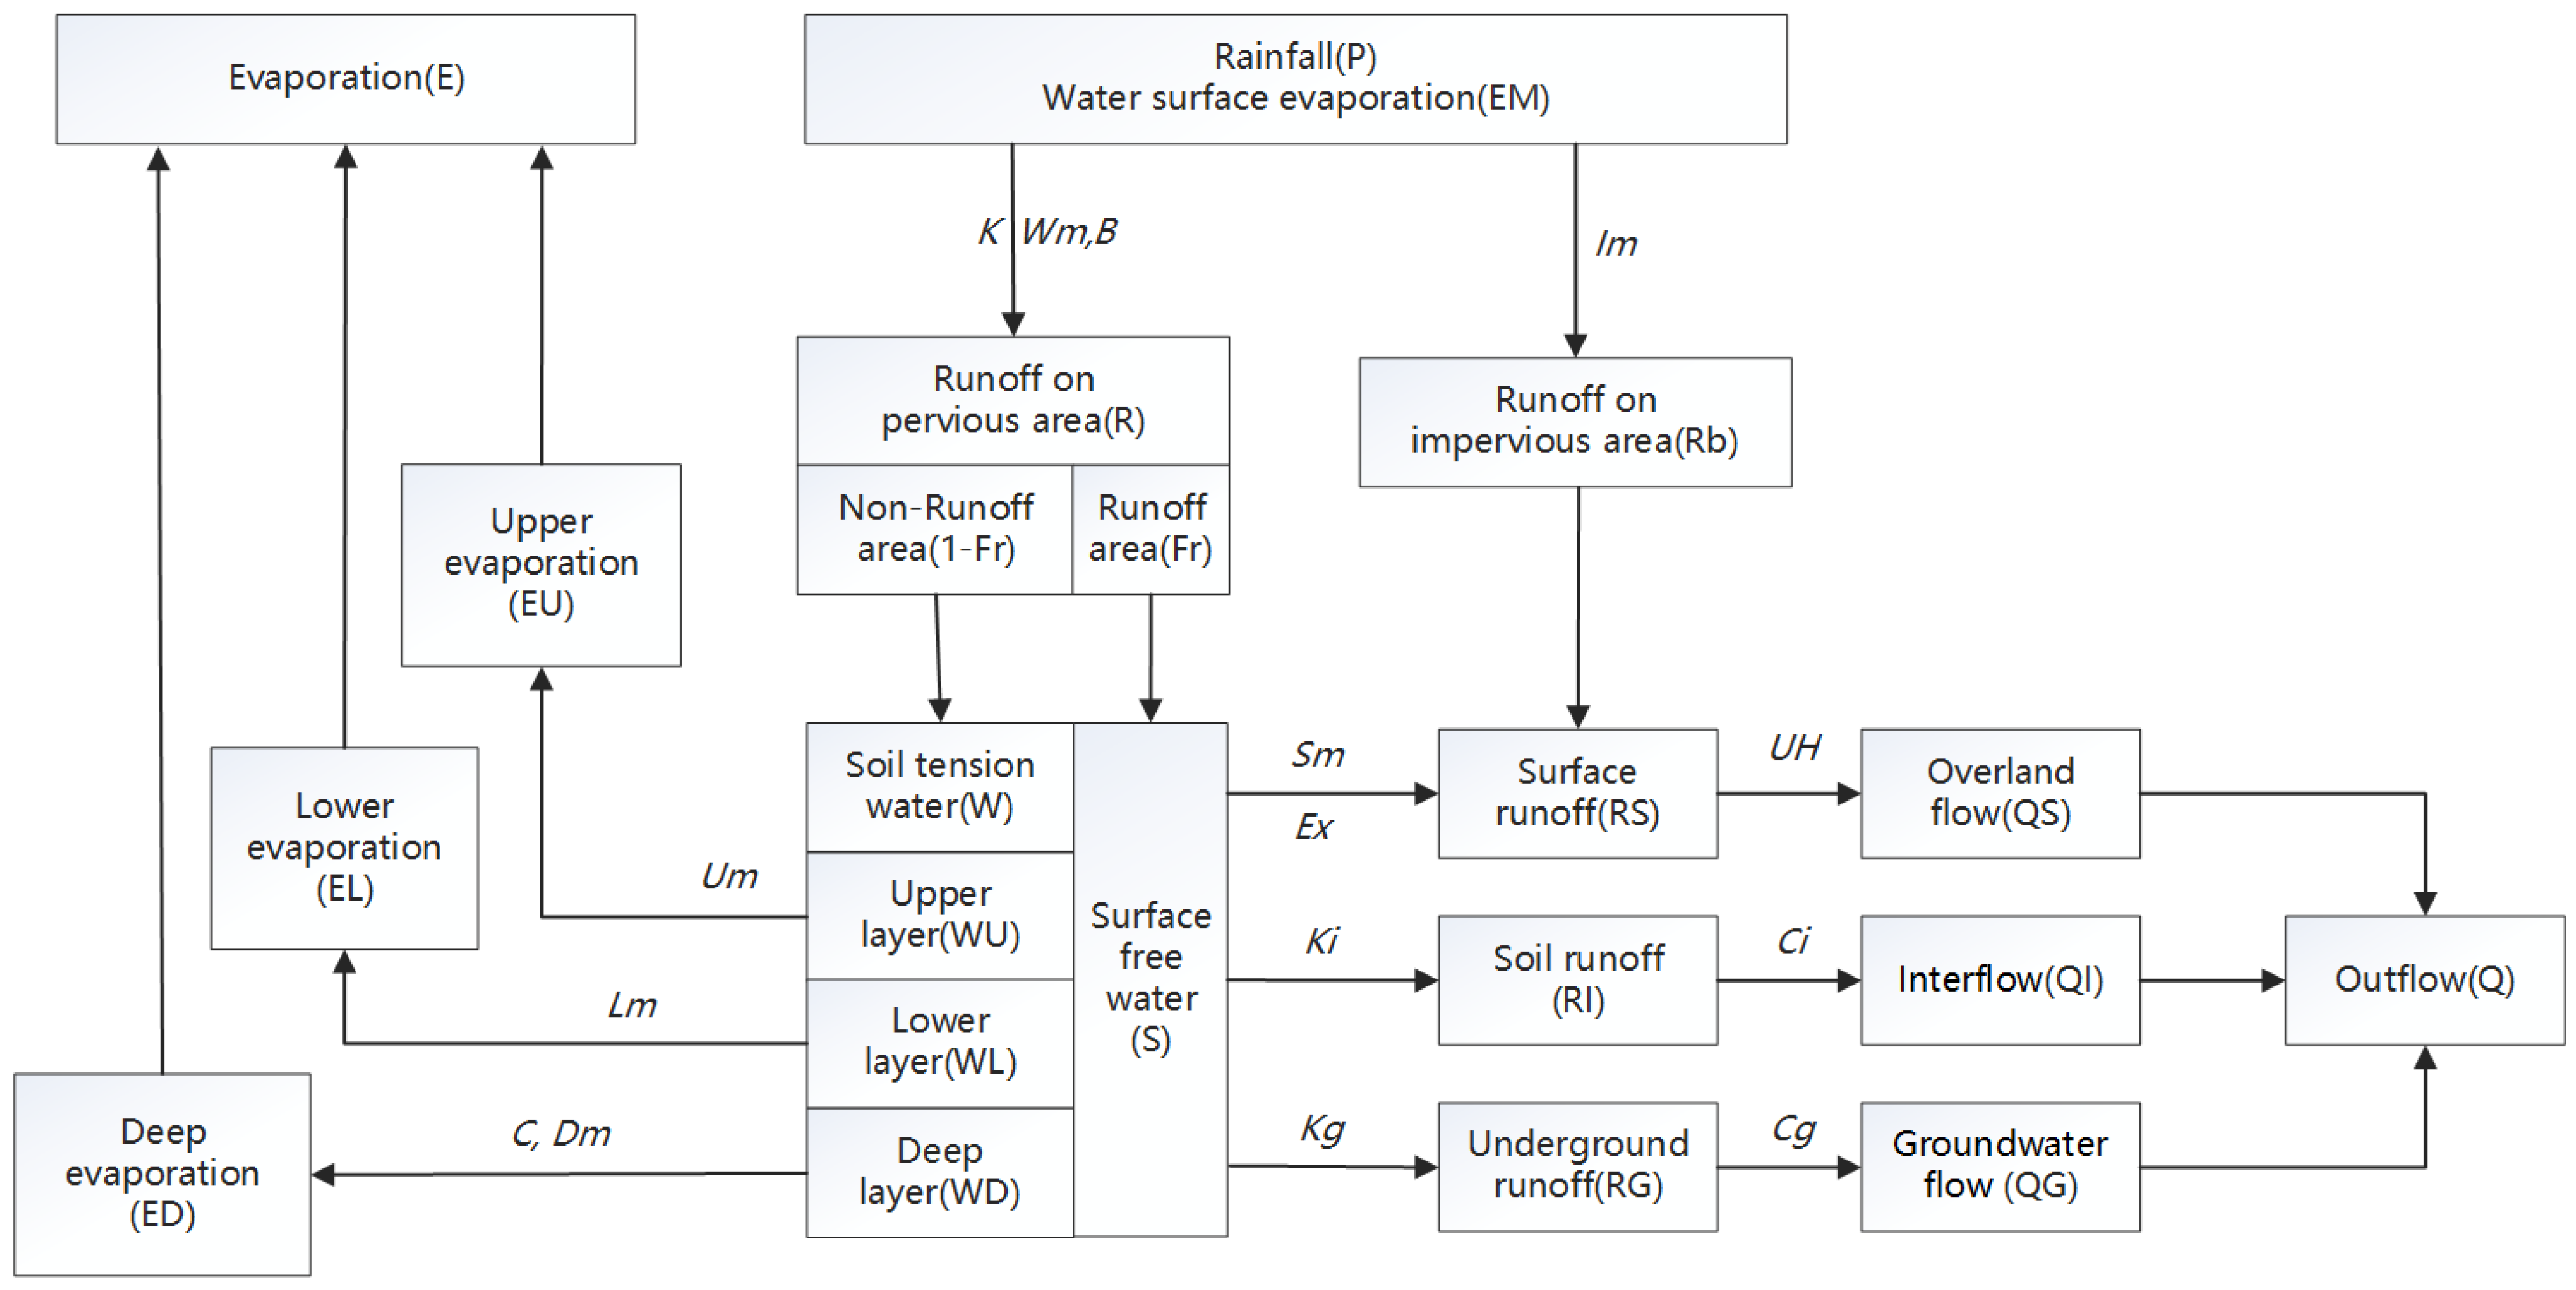
The Xinanjiang model is adopted for runoff generation computation [13,14,15]. A three-layer evaporation model is used to calculate watershed evaporation. The total runoff produced by rainfall is computed according to the concept of saturated runoff, and the influence of the uneven underlying surface on runoff yield area is considered by the water storage curve of the basin. In the aspect of runoff component division, according to the runoff production theory of “hillside hydrology”, the total runoff is divided into saturated surface runoff, soil water runoff and groundwater runoff by a reservoir with limited volume, a side hole and a bottom hole. The unit hydrograph is used to convert the surface runoff into the overland flow, and the linear reservoir model is used to calculate the interflow and groundwater flow, and is finally incorporated into the river network. Figure 2 shows the structure of the Xinanjiang model.
Figure 2.
Computation flow of the Xinanjiang model.
Table 2 shows the parameters of the Xinanjiang model, all of which need to be determined through parameter calibration.
Table 2.
Physical meanings and units of model parameters.
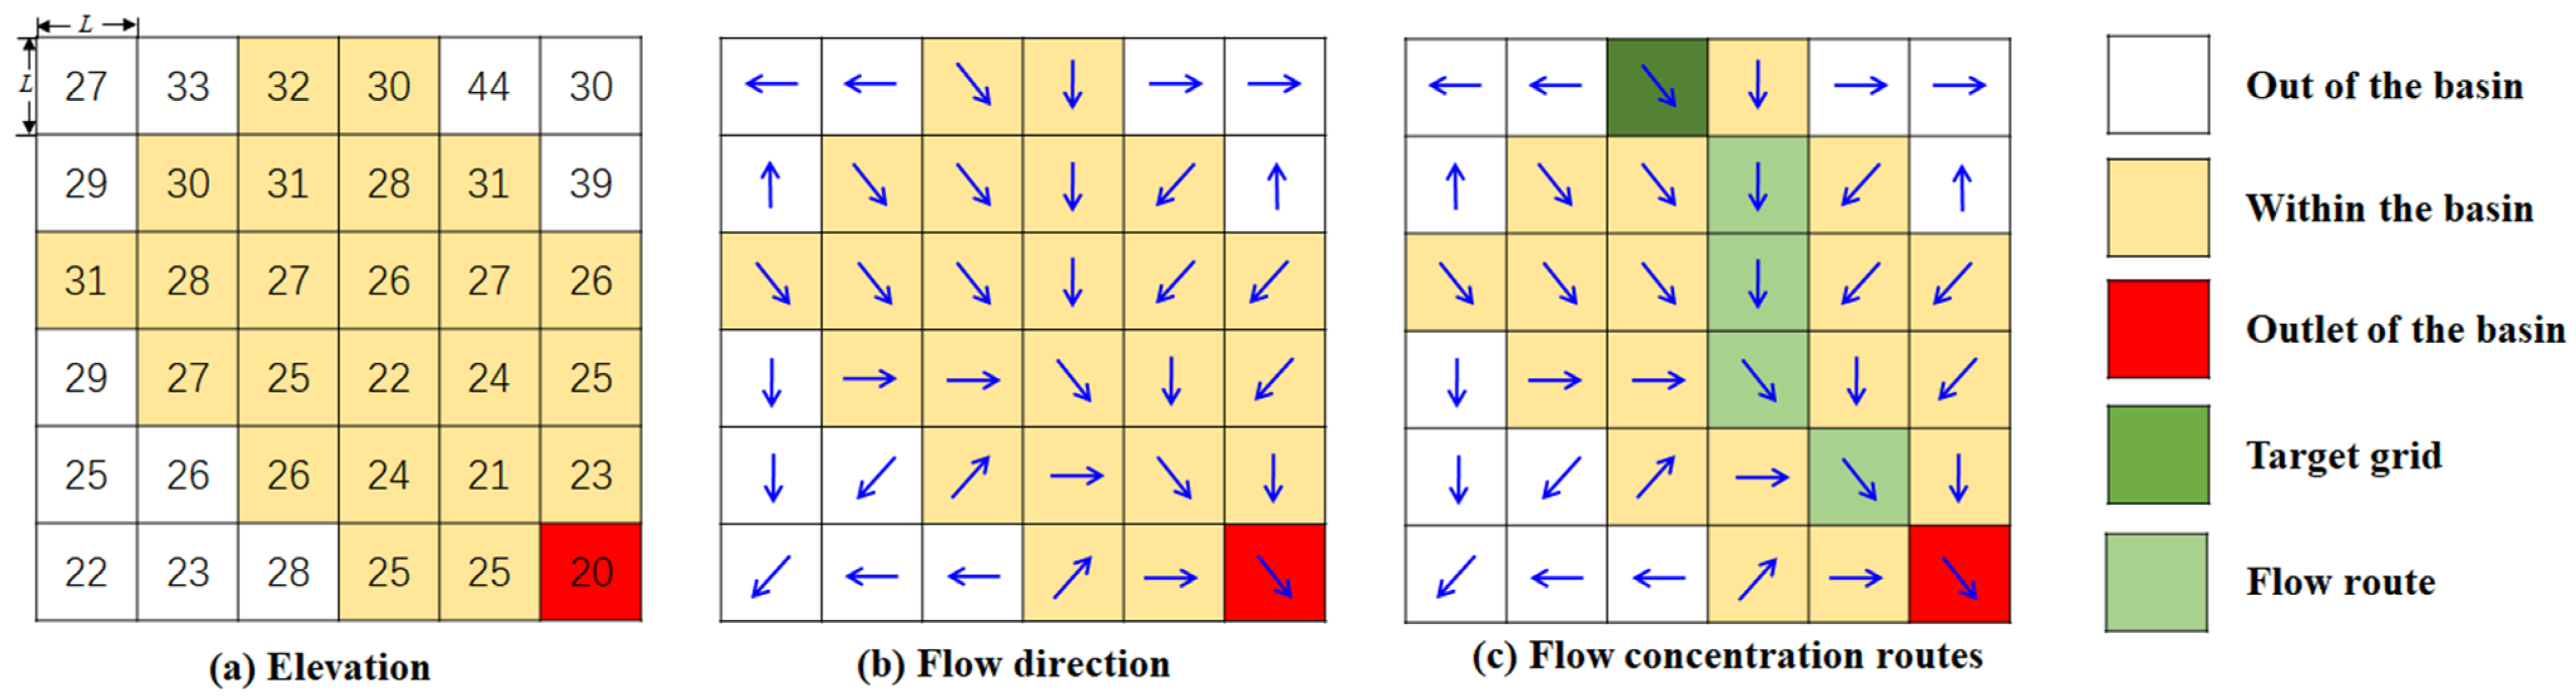
The geomorphic unit hydrograph model is adopted for overland flow concentration computation, which is based on the results of DEM data analysis (Figure 3).
Figure 3.
Flow direction and flow concentration routes.
The flow direction of each grid is analyzed according to the D8 algorithm [16], and the probability density distribution function of concentration time is determined by computing the time of each water particle falling on the surface of the basin reaching the outlet, so as to further determine the geomorphic unit hydrograph [17]. Based on the principle of energy conversion, this improves the formula of flow velocity and unifies the formula of slope velocity and river velocity [18], as shown in Formula (1).
where μ′ is the energy residual coefficient and its range is [0,1], θ is the slope angle of the grid outflow direction, n is the total number of grids in the basin upstream of the target grid (including the target grid), g is the gravity acceleration, Δh is the elevation difference between the target grid and the outflow grid, N is the number of inflow grids of the target grid, nk and vk are the number of upstream grids and the average flow velocity of the kth inflow grid, respectively.
The Muskingum model is used for river network flow concentration [19,20]. Continuous flood routing is realized by segment-by-segment estimation of the model parameters [21].
2.3.2. Evaluation Criteria
To evaluate the suitability of the proposed model for the studied Basin, the Nash–Sutcliffe Coefficient of Efficiency (NSCE) is chosen to analyze the degree of goodness of fit [22], which is defined as:
where Qo(i) and Qs(i) are the observed and simulated flow, respectively, N is the number of data points, and is the mean value of the observed flow. According to national criteria for flood forecasting in China [23], the scheme is excellent when the average NSCE reaches 0.9. When the average NSCE is greater than 0.7 and less than 0.9, the effect of this scheme is better. This scheme is for reference only; if the average NSCE is greater than 0.5 but less than 0.7, it may not be accurate. Otherwise, the results of the performances of parameter calibration are unsatisfactory for online flood forecasting.
2.3.3. Parameter Optimization Method
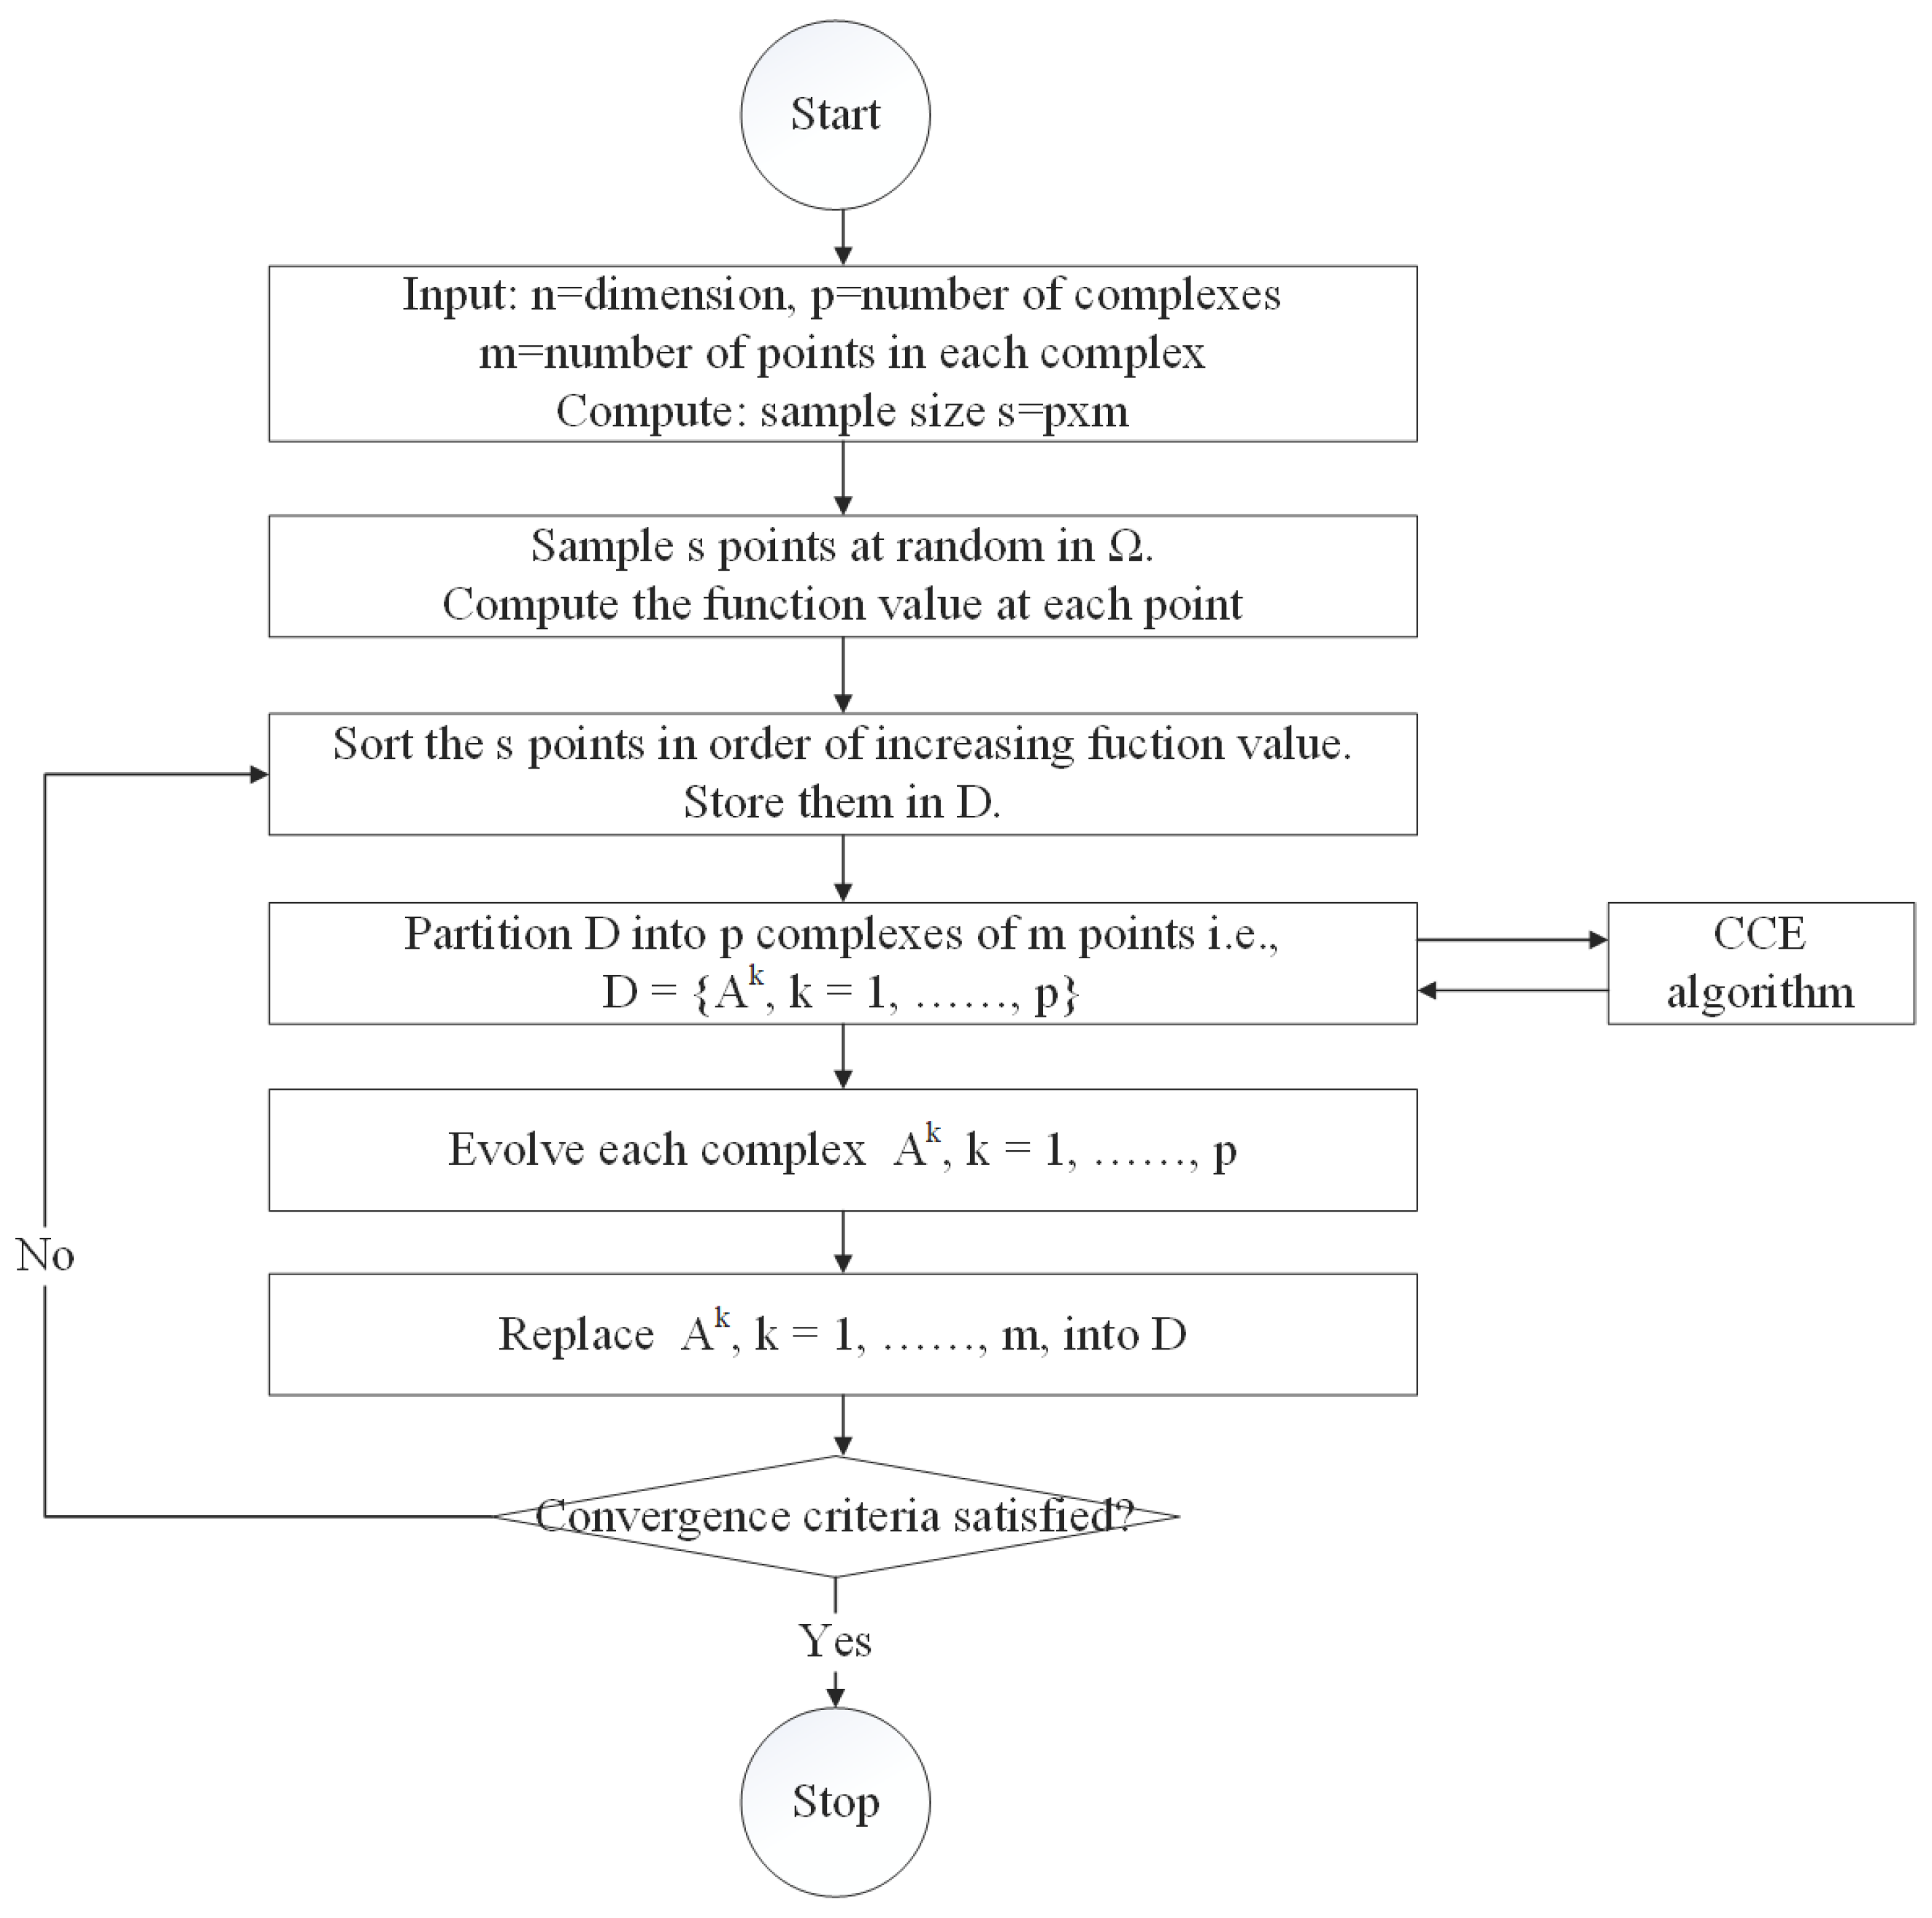
The shuffled complex evolution (SCE-UA) method is used to optimize the model parameters. The SCE-UA algorithm is a nonlinear hybrid algorithm which combines the advantages of the genetic algorithm and the simplex algorithm, and is based on information exchange and biological evolution laws. It can effectively solve the problems of multi-peak, multi-noise, discontinuity, high-dimension and non-linearity in parameter optimization. Figure 4 shows the calculation flow of the SCE-UA algorithm. This method can efficiently and quickly search for the global optimal solution of model parameters [24,25]. There are 14 parameters that need to be optimized in this study, including 13 parameters of the Xinanjiang model (see Table 1) and 1 parameter of the geomorphic unit hydrograph (μ′). μ′ is the energy residual coefficient and its range is [0,1].
Figure 4.
Flow of the shuffled complex evolution (SCE-UA) method.
According to the evaluation criteria, the larger the NSCE, the better the simulation effect. Therefore, this study aimed to find the highest mean value of NSCE. Since the goal of the SCE-UA algorithm is to find the minimum, Equation (3) is used as the objective function.
where F is the value of objective function, t is the number of floods.
2.3.4. Parameter Regionalization Scheme
The Shortest Distance, Attribute Similarity, Support Vector Regression, Generative Adversarial Networks, Classification and Regression Tree and Random Forest method are used to determine the parameter regionalization scheme, and the final scheme is determined by comparing the simulation results of different methods. For readability, Table 3 lists the abbreviations representing the different methods.
Table 3.
Abbreviation of parameter regionalization methods.
- (1)
- Shortest Distance (SD)
The nearest basin is determined by computing the spatial distance between the centroid coordinates of the study basin and other basins, and the model parameters of the nearest basin are directly applied to the distributed model of the study basin.
where D is the distance, R is the radius of the earth, about 6,378,137 m, and Lon1, lat1, lon2 and Lat2 are the centroid coordinates of the two basins.
- (2)
- Attributes Similarity (AS)
The area (A, km2), average slope (P), average elevation (E, m), average elevation drop (H, m), shape coefficient (L), soil type S = {s1, s2, s3} (s1, s2 and s3 are the percentages of clay, silt and sand, %) and land use U = {u1, u2, u3, u4} (u1, u2, u3, u4 are the percentages of forest, grass, cultivated land and other, %) were selected for similarity analysis. The components of U and S range in value from 0 to 1, so no additional processing is required. However, for other attributes, the maximum value method is used for normalization, as follows: collect the maximum values MaxA, MaxP, MaxE, MaxH and MaxL of attribute A, P, E, H and L in 33 catchments, and then let C = {A/MaxA, P/MaxP, E/MaxE, H/MaxH, L/MaxL}, then C is the normalized result. The similarity index of catchment x and catchment y was defined as Formula (5):
where D(a,b) and cos(a,b) are Euclidean distances and cosines value of two vectors a and b, respectively.
where T is the similarity index, and its range is [0,1]. The larger the T value, the greater the similarity between the two catchments. Select the basin most similar to the study basin and transplant its parameters.
- (3)
- Support Vector Regression (SVR)
The essence of a support vector machine (SVM) is to map the non-linear function relationship to the linear problem of high-dimensional space, and then find the optimal regression hyperplane in this high-dimensional space, so that all samples are the minimum distance from the optimal hyperplane [26]. Support Vector Regression (SVR) is a method based on a support vector machine to deal with regression problems. It is used to study the relationship between input variables and numerical output variables, and to predict the output value of new variables. It retains the advantages of a support vector machine and is mainly used in the case of a limited or small number of samples [27].
- (4)
- Generative Adversarial Network (GAN)
The generative adversarial network (GAN) is an unsupervised learning model consisting of a discriminator and a generator [28]. The generator automatically generates data, learns the distribution of real samples, and generates pseudo samples that are close to real samples. The discriminator has to distinguish between real samples obtained from the data and fake samples generated by the generator. The two models are iteratively optimized through continuous confrontation training, so that the data distribution generated by the generator is as close as possible to the real data distribution. When the probability of each output of the discriminator is basically 1/2, it indicates that the model has reached the optimal state.
- (5)
- Classification And Regression Tree (CART)
The CART (Classification and Regression Tree) algorithm is a decision tree classification method. It uses a dichotomy recursive segmentation technique to divide the current sample set into two sub sample sets, so that each non leaf node generated has two branches. The decision tree is a weak learning algorithm [29]. The improvement of classification accuracy depends on the reasonable construction and pruning of the tree structure. The CART algorithm generates a decision tree based on the training dataset, and the generated decision tree should be as large as possible. The validation dataset is used to prune the generated tree and select the optimal subtree. At this time, the minimum loss function is used as the pruning standard.
- (6)
- Random Forest (RF)
Random forest model generates multiple different datasets from the original dataset by sampling with put back [30]. The CART tree is used as a weak classifier, and each sub-dataset corresponds to a classifier. Each decision tree selects the attribute with the strongest classification ability for node splitting, without pruning to maximize growth. All final generated decision trees form a random forest. The model can be used for classification or regression prediction, the result of which is determined by the classifier voting.
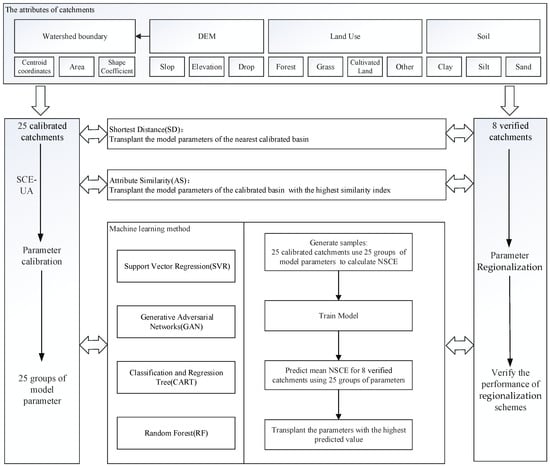
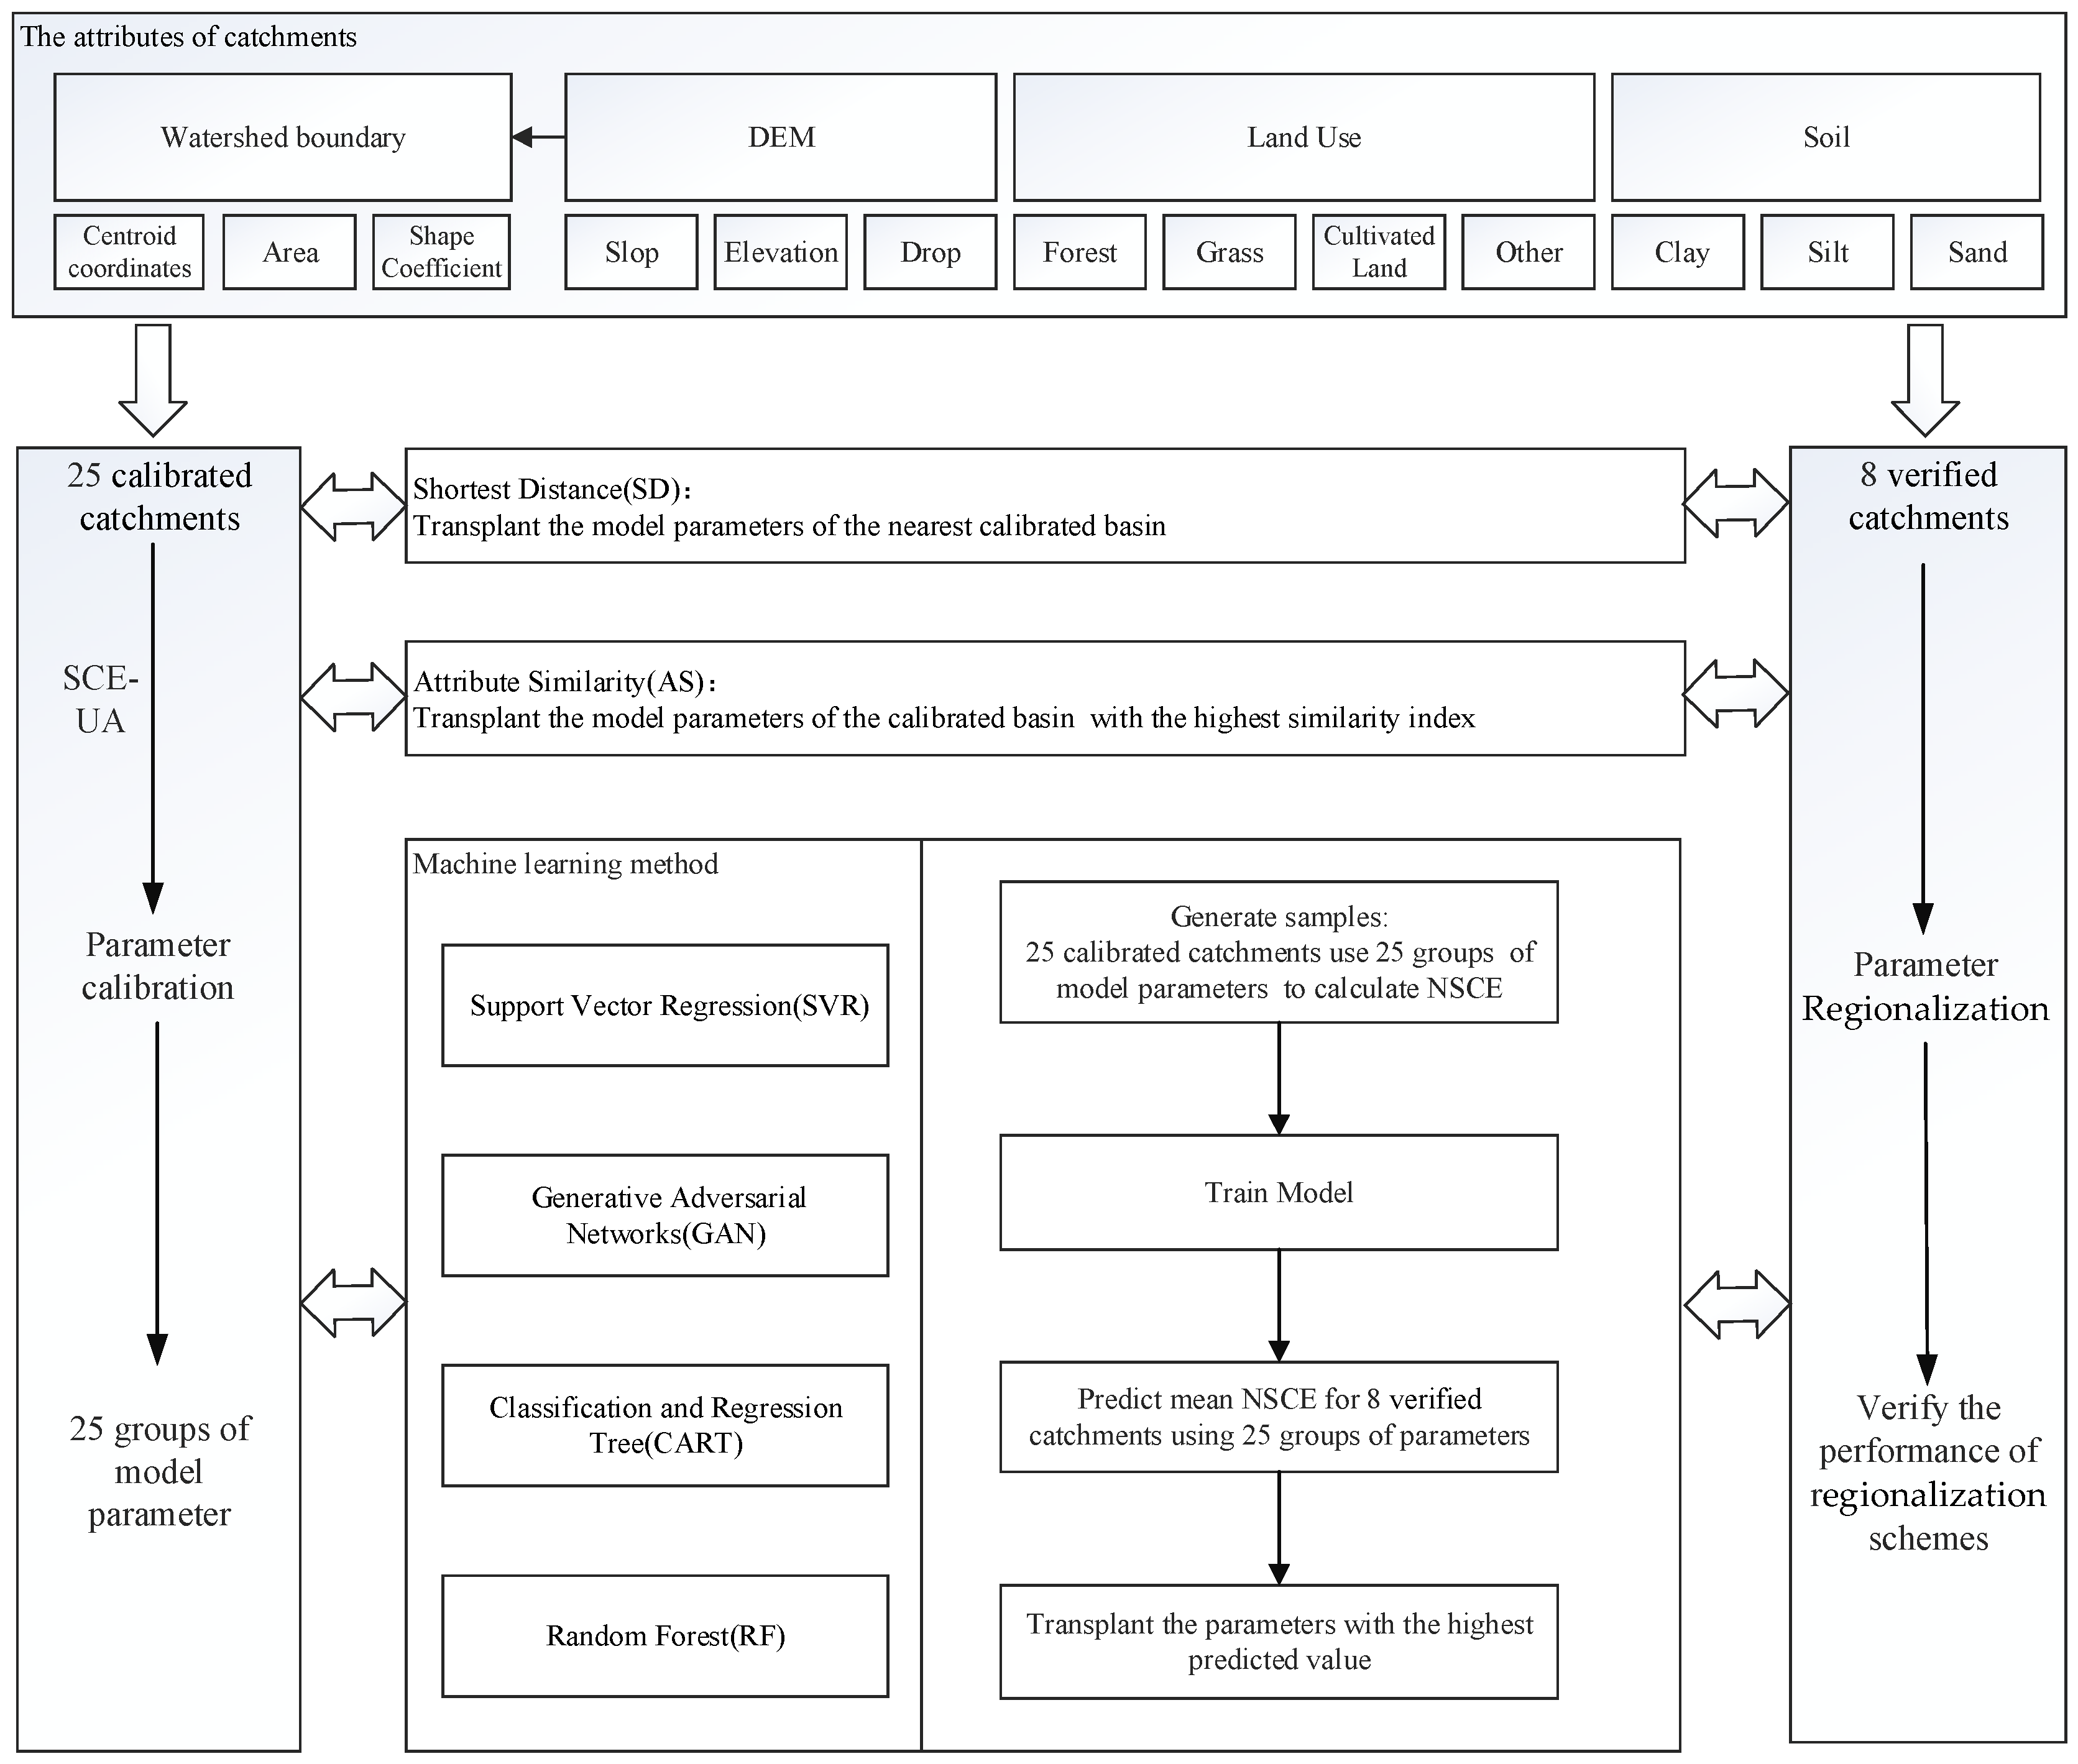
Based on the above, Figure 5 shows the flow of parameter regionalization. When SVR, GAN, CART and RF are selected for parameter transplantation. The analysis steps are as follows:
Figure 5.
Flow of parameter regionalization method.
- (1)
- For each calibrated catchment A, use the model parameters of any catchment B to compute the average Nash–Sutcliffe coefficient NSCEa-b. Collect all catchment A attributes, catchment B attributes, NSCEa-b as training dataset for model training. In this study, the sample size of the training set is 25 × 25.
- (2)
- For each verified catchment C and calibrated catchment D, use the trained model to take the attributes of C and D as input to predict the mean NSCE, and the parameter group with the highest predictive value is used as the model parameter of C.
3. Results
3.1. Model Parameter Optimization
The SCE-UA algorithm is used to automatically optimize the model parameters of 25 hydrological stations, and the objective function is to obtain the highest average Nash–Sutcliffe coefficient. The results of parameter calibration are shown in Table 4.
Table 4.
Simulation results of calibration.
It can be seen that there are 23 hydrological stations with an average NSCE between 0.7 and 0.9, and 2 between 0.5 and 0.7. According to national criteria for flood forecasting in China, most calibration parameters meet the requirements of online flood forecasting. The distributed model based on the Xinanjiang model and geomorphic unit hydrograph is stable and suitable for most areas of Hunan Province.
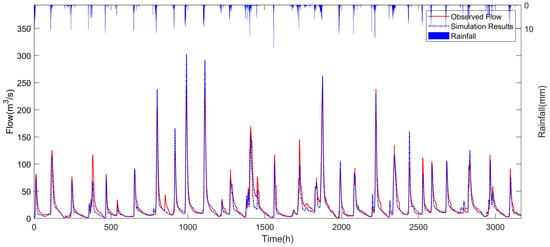
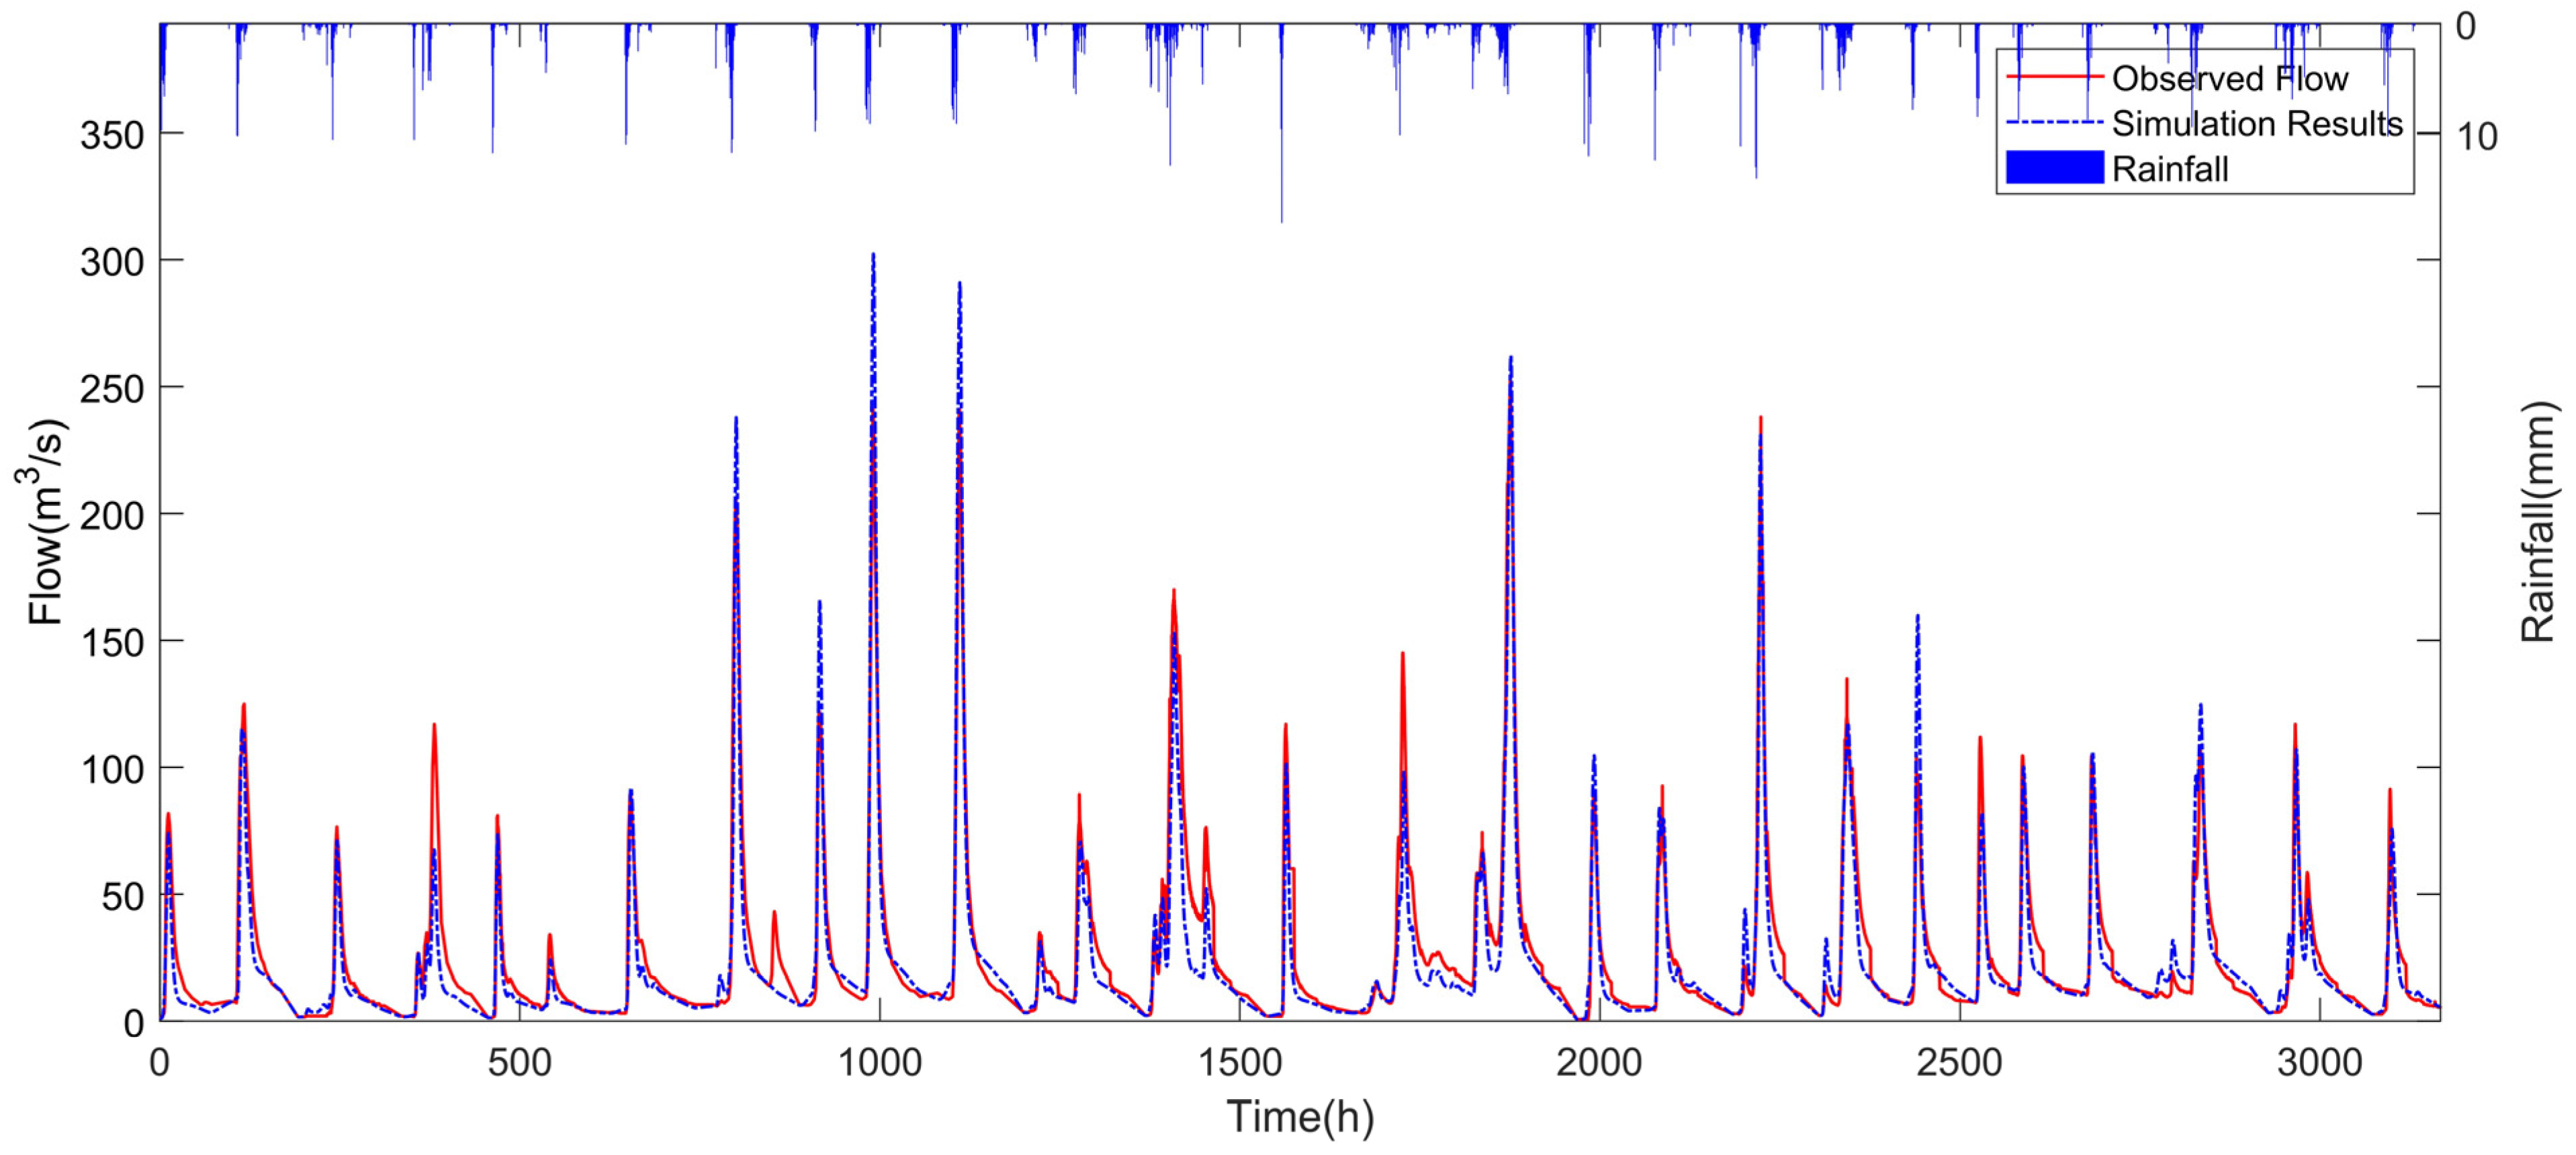
The calibration parameters were fed into the distributed model to simulate 426 floods in 25 catchments. Taking LianYuan Station as an example, the calibration result is shown in Figure 6.
Figure 6.
Comparison of observed and simulated hydrograph of LianYuan station.
3.2. Regionalization Schemes
The shortest distance, attribute similarity, support vector regression, generative adversarial networks, classification and regression tree, and random forest models are selected to construct and verify the parameter regionalization scheme.
According to the catchment attributes, the results of SD and AS can be directly calculated. The centroid coordinates and basic attributes of the 33 catchments are shown in Table 5, including east longitude (lon, ◦), north latitude (lat, ◦), area (A, km2), average slope (P), average elevation (E, m), average elevation drop (H, m), shape coefficient (L), and the percentages of forest (u1), grass (u2), cultivated land (u3), other (u3), clay (s1), silt (s2) and sand (s3). These attributes were extracted during sub-watershed division.
Table 5.
Information of typical watershed characteristics.
According to the coordinates of the center of the basin, the centroid distance between the verification basin and the calibration basin is calculated by Formula (3), and the calibration basin with the closest distance is selected, and its model parameters are used directly. Normalize the basin properties, calculate the similarity index between the verification basin and the calibration basin using Formula (4), and transfer the model parameters with the highest similarity. Table 6 shows the transplant results of the SD and AS methods.
Table 6.
Transplant results of SD and AS methods.
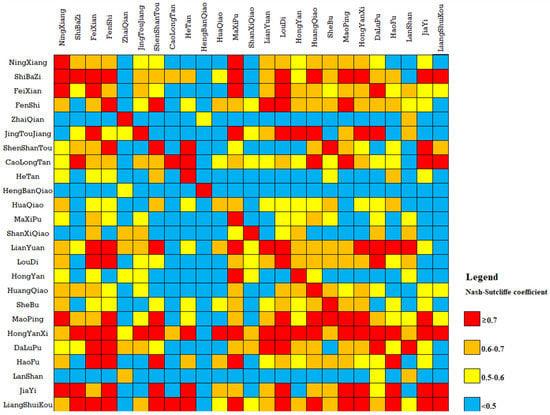
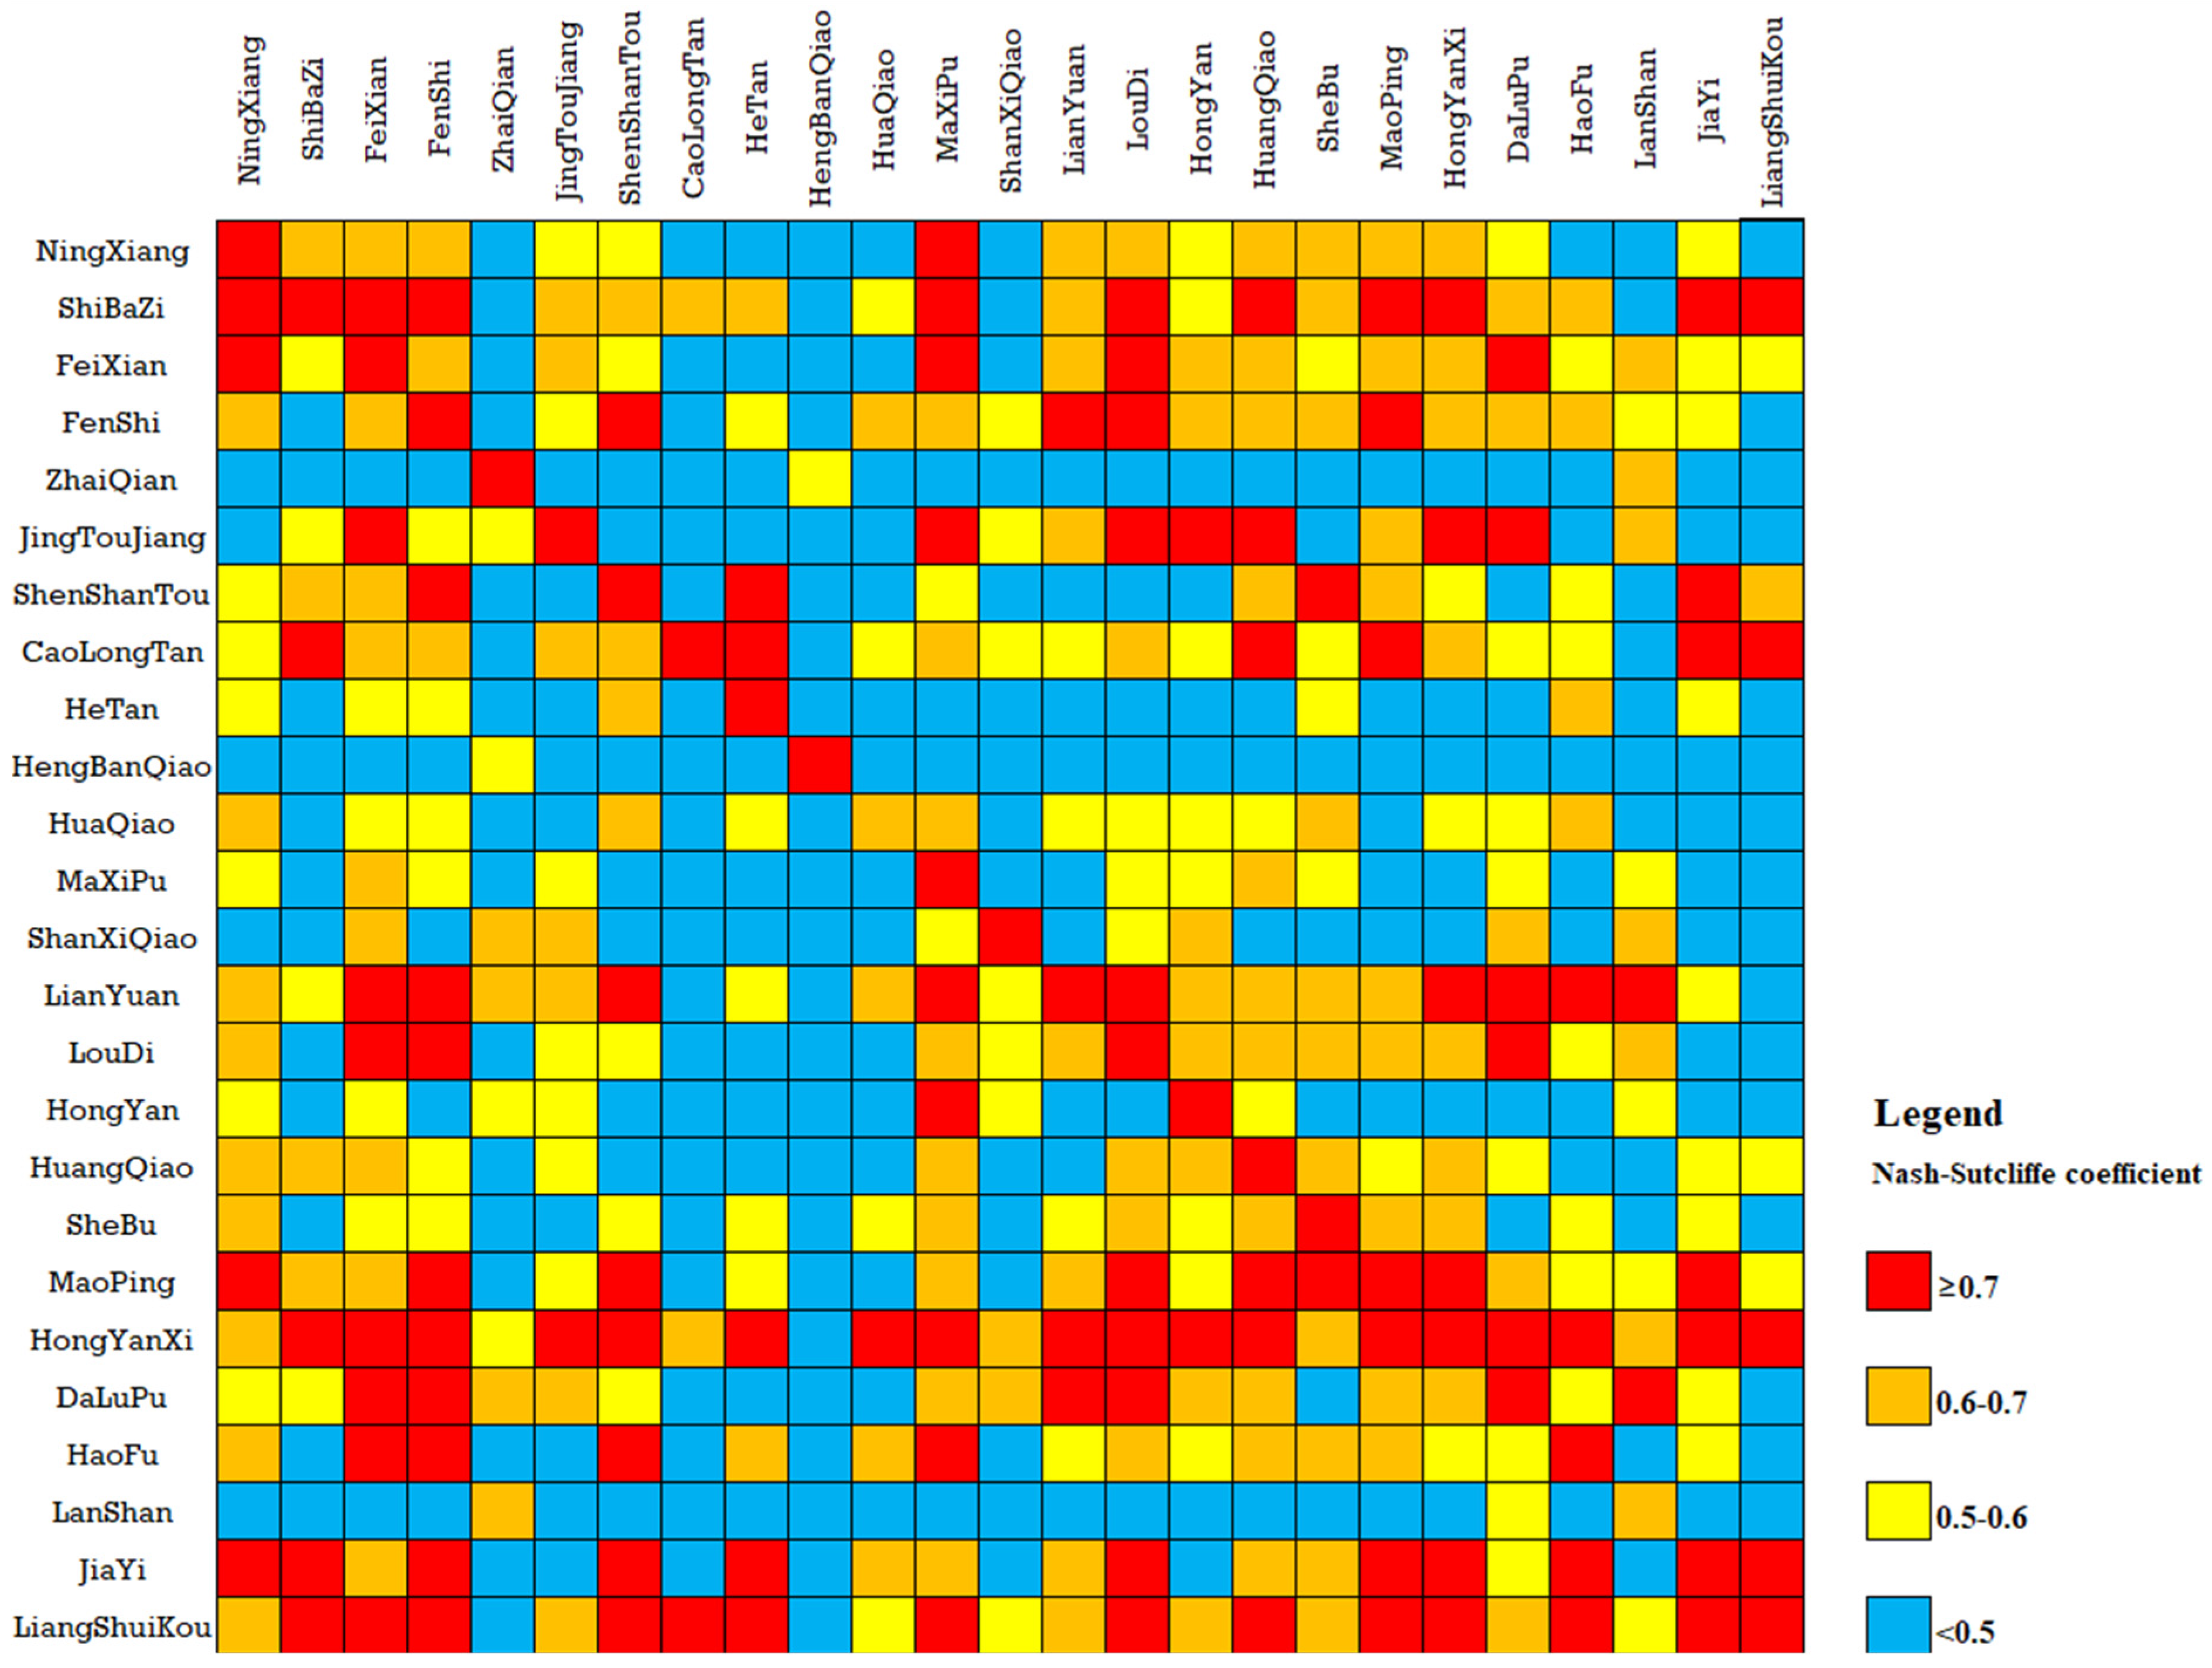
For SVR, GAN, CART and RF methods, we need to collect samples and train the model first. This required cross-validation of the model parameters for 25 catchments. We apply 25 groups of parameters to the flood simulations of 25 catchments and calculate the mean NSCE.
Figure 7 shows the 25 × 25 cross-validation results for the samples. Among the 625 samples, there are 121 samples with a Nash–Sutcliffe coefficient greater than 0.7, accounting for 19.4% of the total number of samples; 138 samples with a Nash–Sutcliffe coefficient between 0.6 and 0.7, accounting for 22.1%; 112 samples with a Nash–Sutcliffe coefficient between 0.6 and 0.7, accounting for 17.9%; and 254 samples with a Nash–Sutcliffe coefficient less than 0.5, accounting for 40.1%. These samples are used as input to train four models of SVR, GAN, CART and RF, and the results of different parameter groups are used to predict eight verification basins, and the optimal results are selected for parameter transplantation. The Nash–Sutcliffe coefficients of the simulation results are shown in Table 7.
Figure 7.
Cross validation results of parameter transplantation.
Table 7.
Transplant results of machine learning methods.
4. Discussion
It can be seen from Table 6 that two groups, CaojiTan-ZhaiQian and DongKou-HengBanQiao, performed poorly when using the transplantation parameters of the SD method, with average NSCE of 0.27 and 0.29, respectively. When the AS method was used for transplant parameters, two groups had poor results, namely JiaHe-JiaYi and JiShou-ShanXiQiao, with average NSCEs of 0.31 and 0.46, respectively. Table 8 shows the attributes of these groups of catchments.
Table 8.
Information on basin attributes.
It can be seen from Table 8 that DongKou and HengBanQiao are not only close, but also most of the attributes are similar except for the area and average drop. The area of DongKou is 931 km2, and the area of HengBanQiao is 31 km2. Their average drops are 458.6 m and 274.67 m, respectively. It is obvious that the different areas will lead to large differences in concentration time, and the average drop may significantly affect the concentration speed, which is the most critical factor affecting the geomorphic unit hydrograph [18]. Similarly, compared with JiaHe and JiaYi, their attributes are very similar, except for average elevation and drop. Therefore, we can infer that if the attributes of two catchments are very close, but their average drop difference is significant, this is likely to cause a failed transplantation. The opposite conclusion cannot be established. Table 6 shows an example with the best results (LuoLingQiao-LianYuan). The average NSCE of transplantation can reach 0.86, which is excellent according to the evaluation criteria. However, the attributes of the two catchments, including the average drop, differed significantly (as shown in Table 5).
From the above cases, it can be seen that the applicable conditions and scope of parameter transplantation are relatively complex, and a single factor cannot be considered in isolation. When multiple attributes are considered for parameter transplantation, the results may not be satisfactory for catchments with similar attributes sometimes, so precisely defining the similarity index is a challenge.
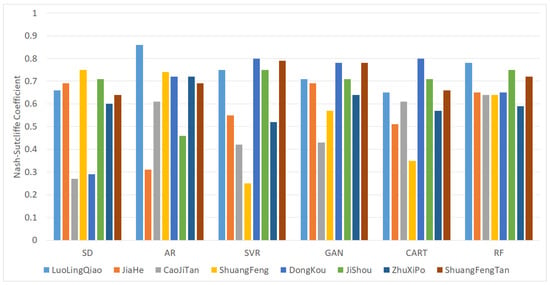
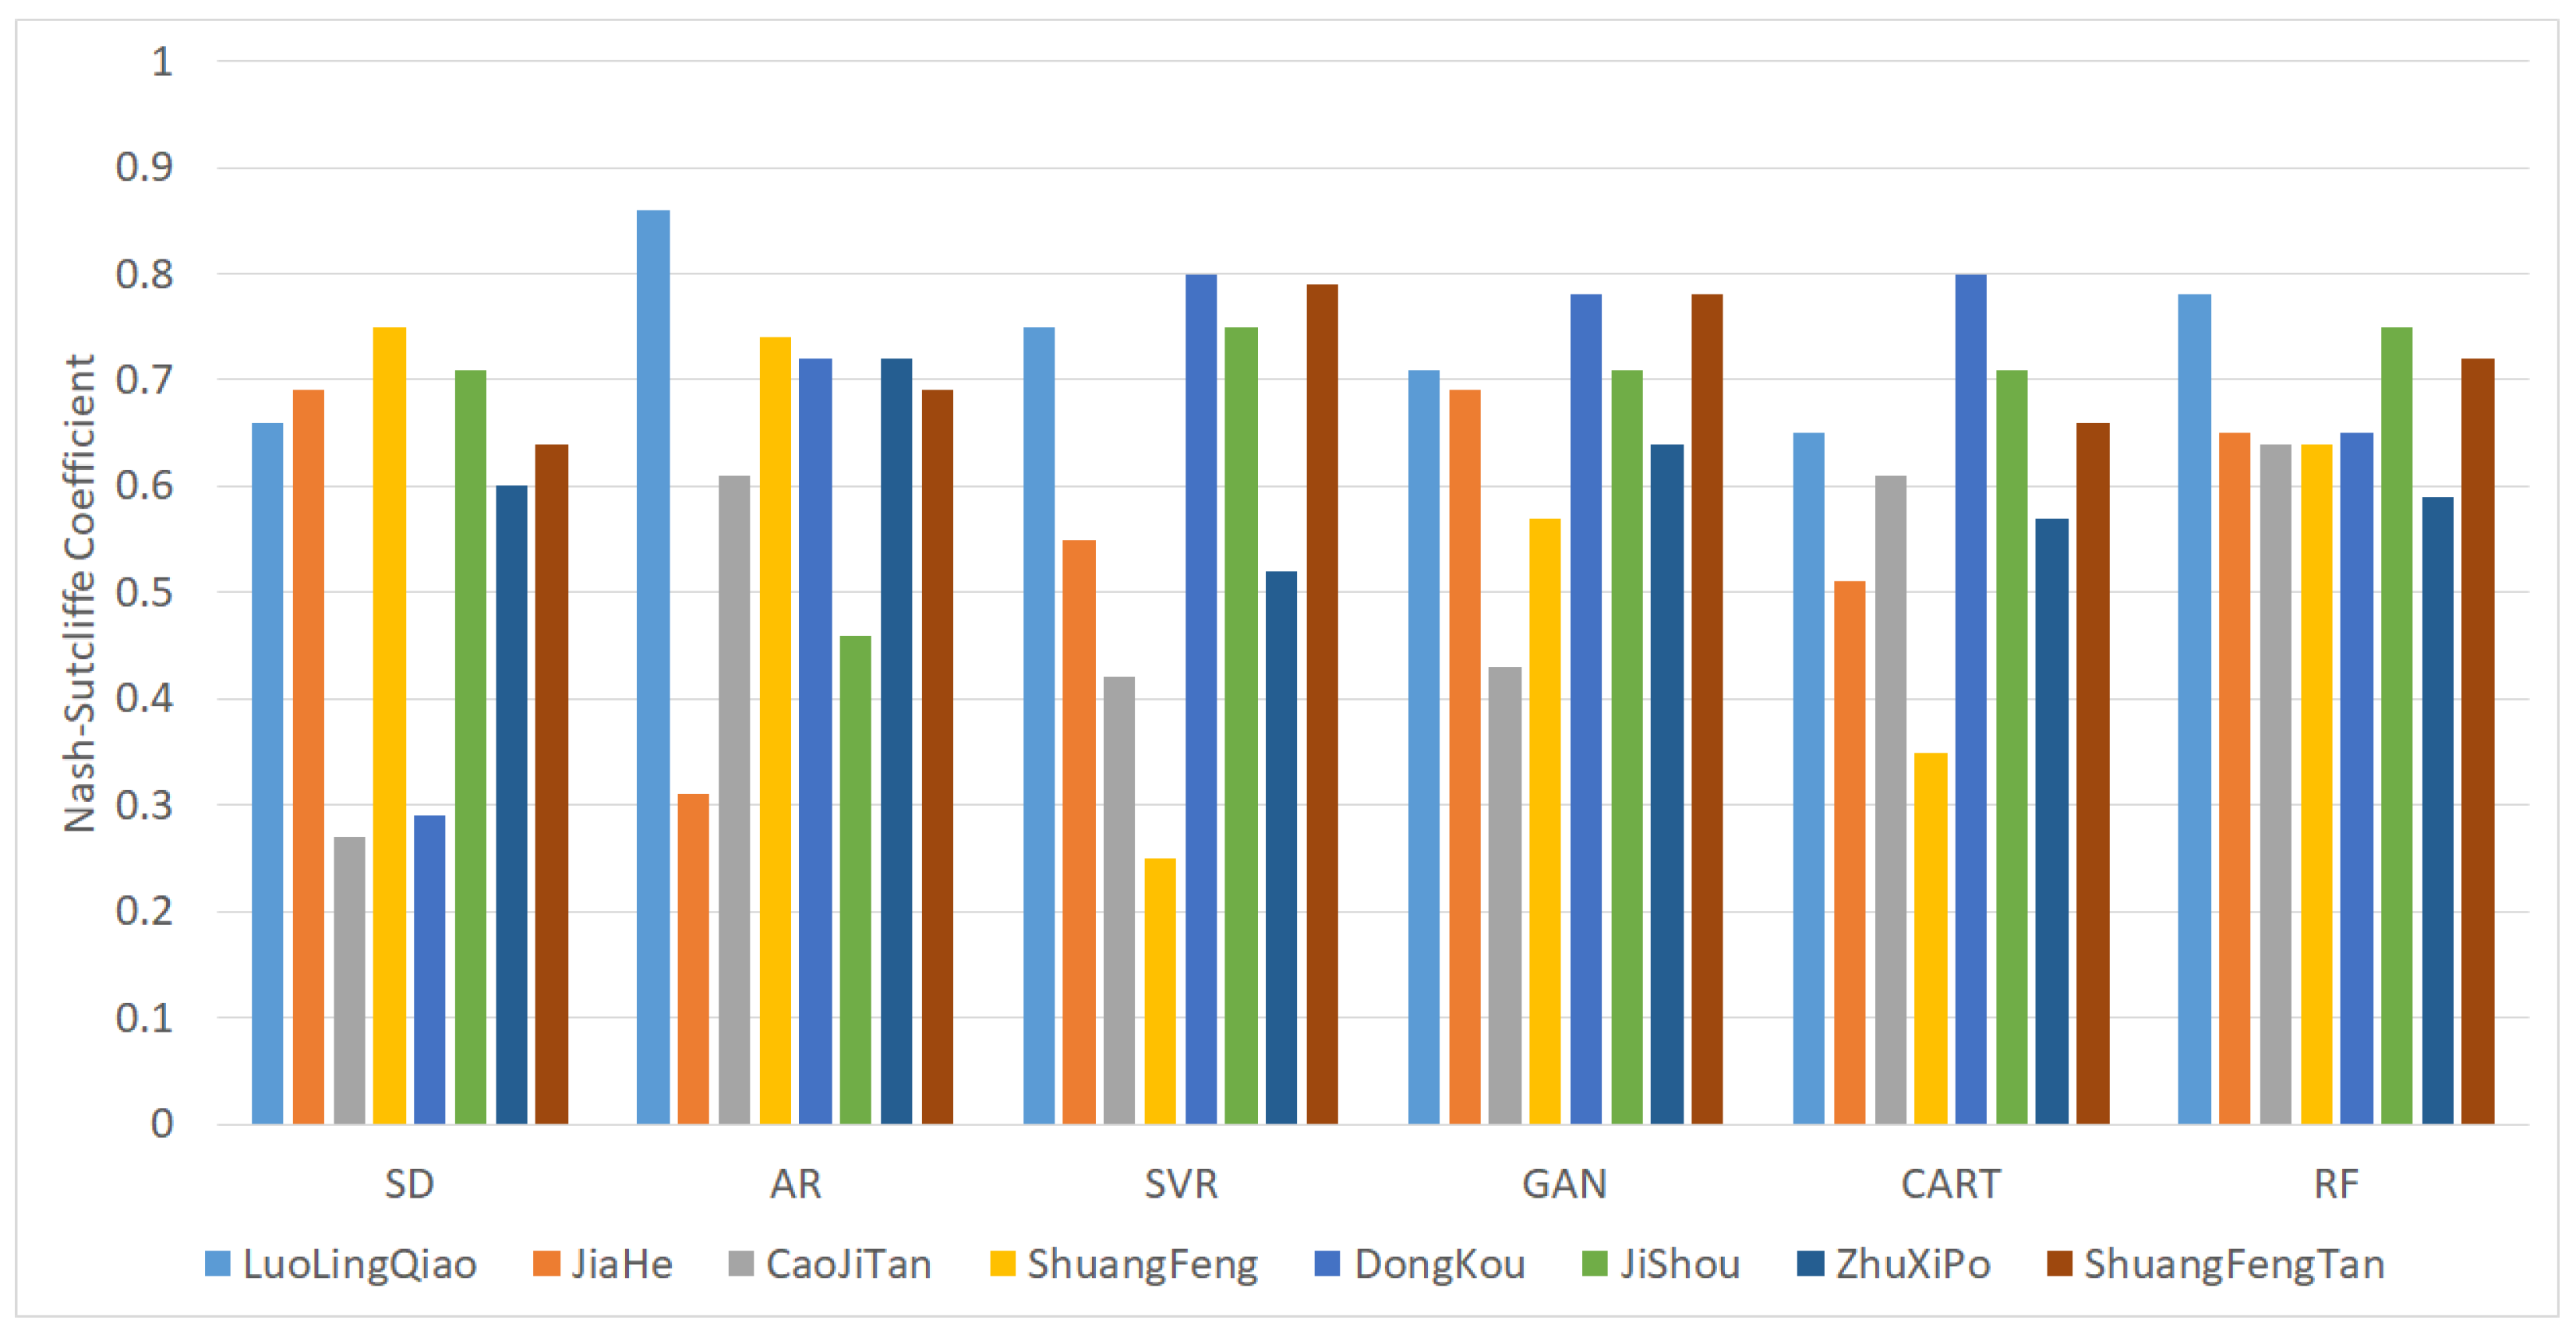
In contrast, machine learning methods can discover more hidden rules in data. However, the methods of machine learning cannot all achieve satisfactory results. Comparing only the average NSCE, the results of SVR and CART were even worse than the AS method. In order to better compare the performance of different methods, Table 9 shows the optimal value, worst value and average value obtained using different methods. Figure 8 shows the average NSCEs for the different methods.
Table 9.
Comparison of parameter regionalization schemes.
Figure 8.
Validation results of regionalization schemes.
It can be seen from Table 9 that the average and worst Nash–Sutcliffe coefficients of the simulation results using the random forest model are the highest. Among the best NSCE results in Table 9, AR > SVR ≥ CART > RF ≥ GAN > SD, with AR performing best and SD performing worst. The worst result of NSCE is RF > GAN > CART > AR > SD > SVR; RF is the best and SVR is the worst. According to the NSCE average results, RF > GAN > AR > CART> SVR > SD; RF performed the best and SD performed the worst.
Table 10 summarizes the validation results of the different methods and shows the percentage of catchments with an average NSCE greater than 0.9, greater than 0.7 and less than 0.9, greater than 0.5 and less than 0.7, and less than 0.5.
Table 10.
NSCE statistical results.
It can be seen from Table 10 that all of the NSCE results of RF are greater than 0.5, which is not achieved by all of the other methods. According to national criteria for flood forecasting in China, if the average NSCE is less than 0.5, the simulation result is unsatisfactory for online flood forecasting. Therefore, the RF model has better performance than the other methods.
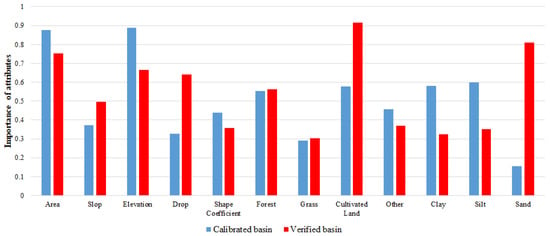
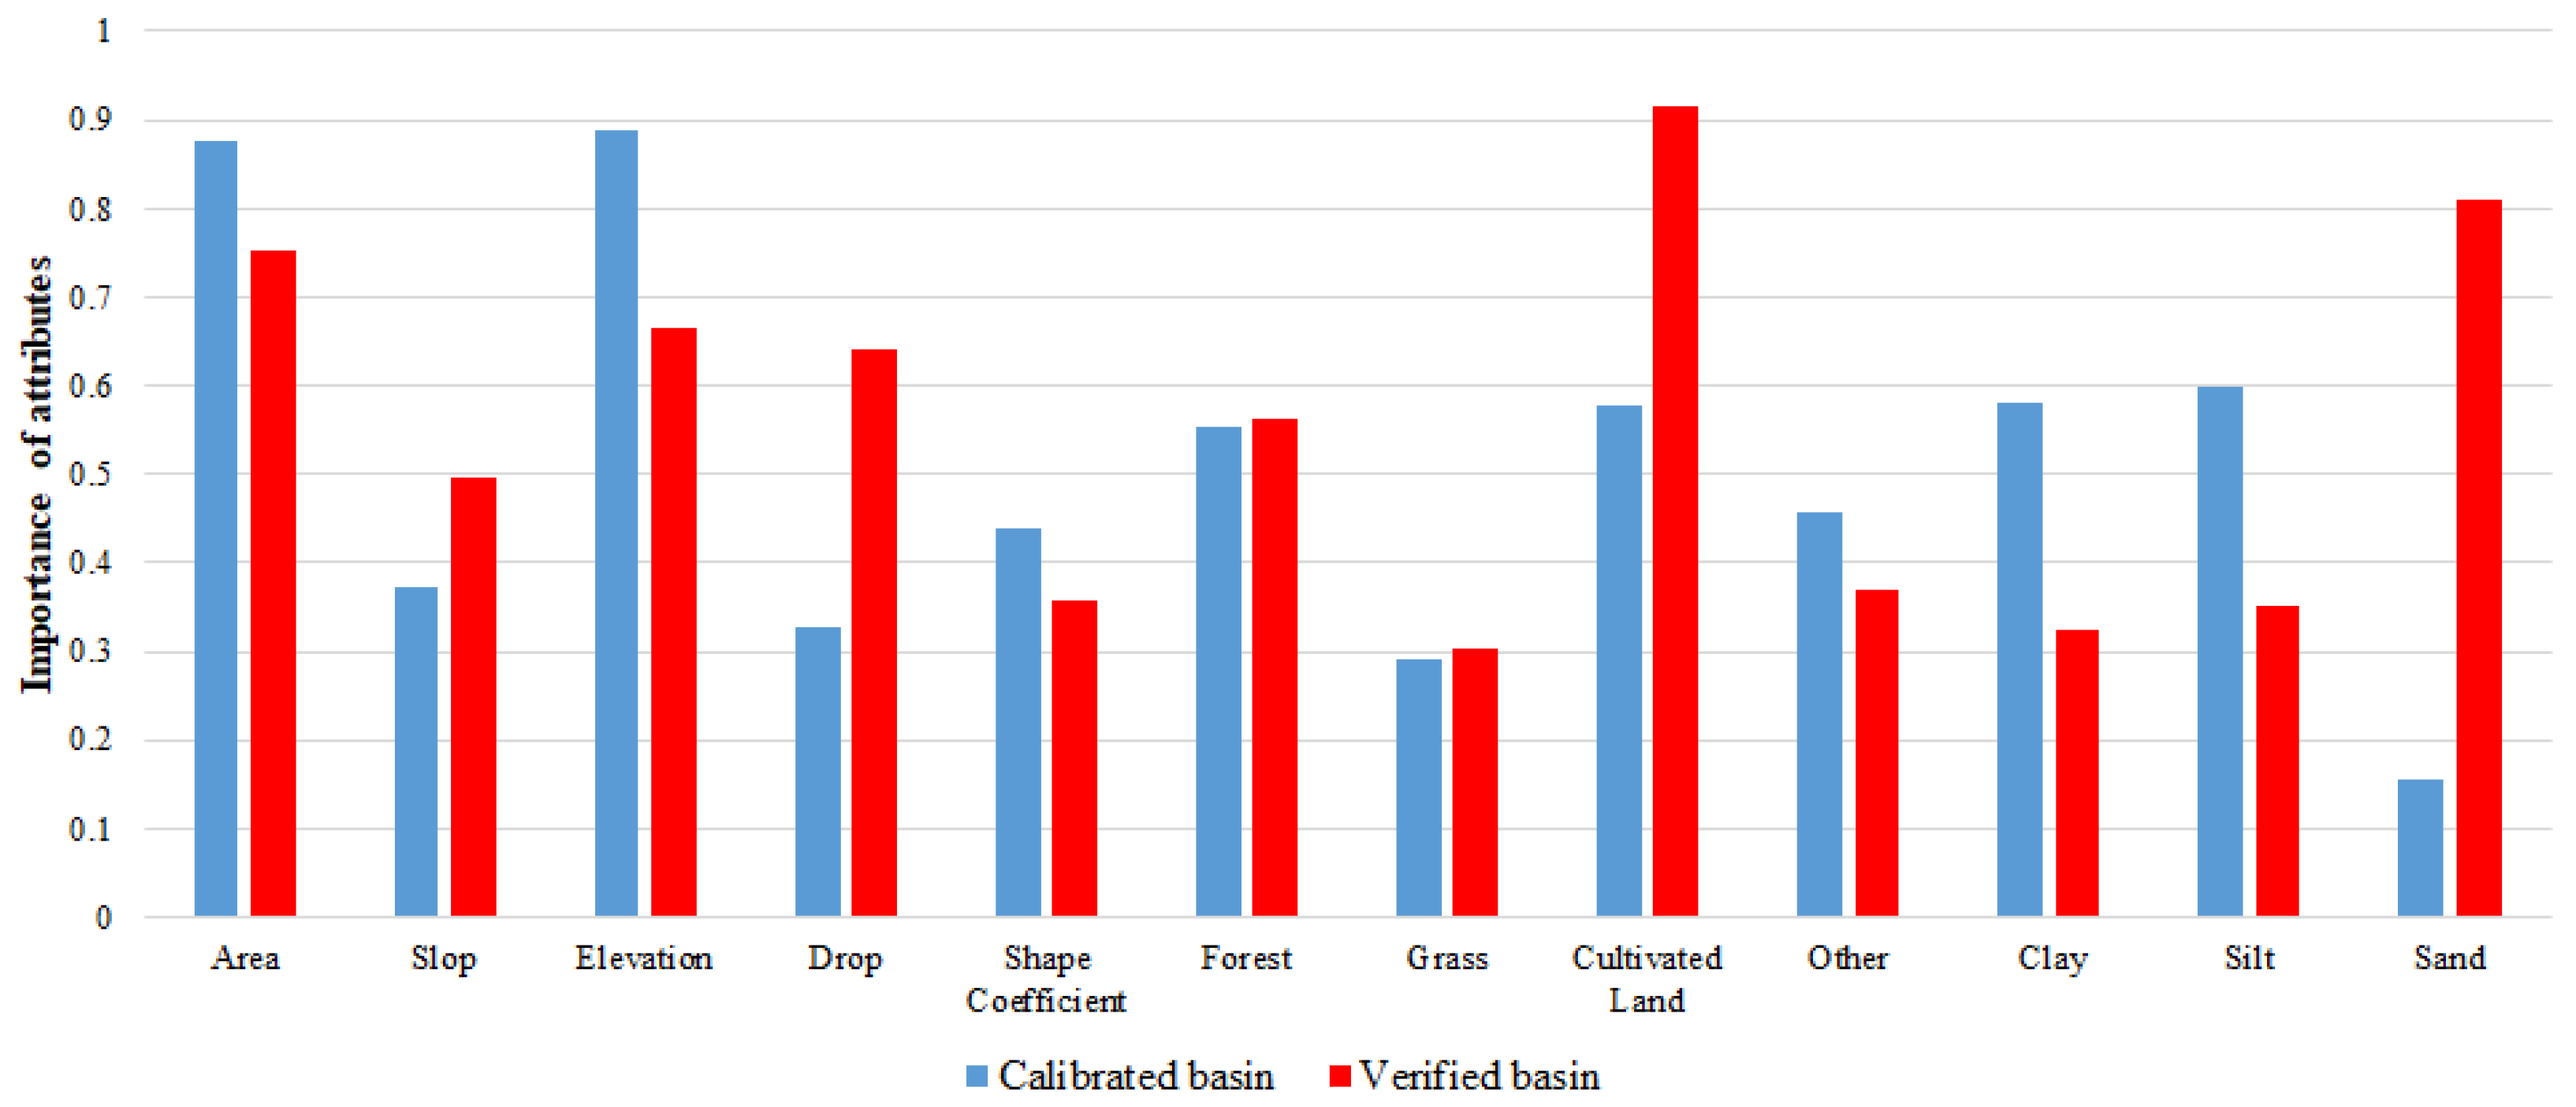
Figure 9 lists the importance of each attribute in the RF model. The most important attribute for prediction using the RF model is the percentage of cultivated land area within the transplanted catchment, followed by the area and average elevation of the calibration catchment. It is well known that slope is a significant impact on hydrological models. However, from the parameter importance of the RF model, the influence of slope is smaller than that of cultivated land, which may be another issue that needs further research.
Figure 9.
Importance of attributes in RF model.
5. Conclusions
In this study, the distribution hydrological models of 33 small and medium-sized catchments in Hunan Province were constructed. The model parameters of 25 catchments were calibrated by using the SCE-UA algorithm. The parameter regionalization scheme including Shortest Distance (SD), Attribute Similarity (AS), Support Vector Regression (SVR), Generative Adversarial Networks (GAN), Classification and Regression Tree (CART) and Random Forest (RF) were validated using data from eight catchments. The main conclusions are as follows:
- (1)
- A total of 426 floods of 25 catchments were selected to calibrate the model parameters. Among the simulation results of these 25 catchments, there are 23 catchments with an average NSCE greater than 0.7, and 2 between 0.5 and 0.7. According to national criteria for flood forecasting in China, most calibration parameters meet the requirements of online flood forecasting. The distributed model based on the Xinanjiang model and geomorphic unit hydrograph is suitable for most areas of Hunan Province.
- (2)
- Based on the watershed attributes and cross validation results of model parameters, six parameter regionalization schemes including SD, AR, SVR, GAN, CART and RF were generated, and 136 floods of 8 catchments were used for verification. The average values of the Nash–Sutcliffe coefficients of each scheme were 0.58, 0.64, 0.60, 0.66, 0.61 and 0.68, and the worst values were 0.27, 0.31, 0.25, 0.43, 0.35 and 0.59. The Nash–Sutcliffe coefficients of the RF model are all greater than 0.5, which cannot be achieved by other methods. The RF model is the most stable solution and significantly outperforms other methods. Using the random forest model to regionalize parameters can improve the accuracy of flood simulation in ungauged areas, which is of great significance for flash flood forecasting and early warning.
- (3)
- The applicable conditions and scope of parameter transplantation are relatively complex, and a single factor cannot be considered in isolation, and the attributes of adjacent catchments may also vary greatly. The result of the attribute similarity method is not very stable, and transplantation can fail when most of the attributes of two catchments are similar, but if the attributes are very different, sometimes good results will be achieved. According to the parameter importance analyzed by the RF model, the slope is not so important, while the cultivated land area is the key to decision making. This result goes against common sense and deserves further research.
There are many factors that affect the accuracy of parameter transplantation. In practice, continuous data collection is required to improve the quality of the underlying dataset. With the accumulation of data and the continuous improvement of the regionalization model, the accuracy of parameter transplantation can be improved.
Author Contributions
Conceptualization, W.W. and Y.T.; methodology, Q.M. and Y.T.; software, Y.Z.; validation, R.D.; project administration, C.L. All authors have read and agreed to the published version of the manuscript.
Funding
Special project for collaborative innovation of science and technology in 2021 (No: 202121206).
Institutional Review Board Statement
Not applicable.
Informed Consent Statement
Not applicable.
Data Availability Statement
Not applicable.
Conflicts of Interest
The authors declare no conflict of interest.
References
- Gou, J.J.; Miao, C.Y.; Duan, Q.Y. Progress in parameter sensitivity analysis-optimization-regionalization methods for hydrological models. Prog. Geogr. 2022, 41, 1338–1348. [Google Scholar] [CrossRef] [Scilit]
- Sivapalan, M. Prediction in ungauged basins: A grand challenge for theoretical hydrology. Hydrol. Process. 2003, 17, 3163–3170. [Google Scholar] [CrossRef] [Scilit]
- Young, A.R. Stream flow simulation within UK ungauged catchments using a daily rainfall-runoff model. J. Hydrol. 2006, 320, 155–172. [Google Scholar] [CrossRef] [Scilit]
- Parajka, J.; Bloschl, G.; Merz, R. Regional calibration of catchment models: Potential for ungauged catchments. Water Resour. Res. 2007, 43. [Google Scholar] [CrossRef] [Scilit]
- Li, H.X.; Zhang, Y.Q.; Chiew, F.H.S.; Xu, S. Predicting runoff in ungauged catchments by using Xinanjiang model with MODIS leaf area index. J. Hydrol. 2009, 370, 155–162. [Google Scholar] [CrossRef] [Scilit]
- Yokoo, Y.; Kazama, S.; Sawamoto, M.; Nishimura, H. Regionalization of lumped water balance model parameters based on multiple regression. J. Hydrol. 2001, 246, 209–222. [Google Scholar] [CrossRef] [Scilit]
- Cheng, X.; Ma, X.X.; Wang, W.S.; Liu, X.X.; Wang, Q.L.; Xiao, Y. Applicability Research of HEC-HMS Model Parameter Regionalization in Small Basin of Henan Province. J. China Hydrol. 2022, 42, 40–46, 102. [Google Scholar] [CrossRef]
- Yao, C.; Qiu, Z.Y.; Li, Z.J.; Hu, W.D.; Xu, J. Parameter regionalization study and application of API model and Xin’anjiang model. J. China Inst. Water Resour. Hydropower Res. 2019, 47, 189–194. [Google Scholar] [CrossRef]
- Sun, Z.L.; Liu, Y.L.; Chen, X.; Shu, Z.K.; Wu, H.F.; Wang, J.; Bao, Z.X.; Wang, G.Q. Review of Hydrological Model Parameter Regionalization Method [OL]. J. China Hydrol. 2022, 1–9. [Google Scholar] [CrossRef]
- Yi, X.; Zhou, F.; Wang, X.Y.; Yang, Y.H.; Guo, H.C. Classification and runoff simulation of data-scarce basins based on self-organizing maps. Prog. Geogr. 2014, 33, 1109–1116. [Google Scholar]
- Ragettli, S.; Zhou, J.; Wang, H.; Liu, C.; Guo, L. Modeling flash floods in ungauged mountain catchments of China: A decision tree learning approach for parameter regionalization. J. Hydrol. 2017, 555, 330–346. [Google Scholar] [CrossRef] [Scilit]
- Liu, C.J.; Zhou, J.; Wen, L.; Ma, Q.; Guo, L.; Ding, L.Q.; Sun, D.Y. Research on spatio temporally-mixed runoff model and parameter regionalization for small and medium-sized catchments. J. China Inst. Water Resour. Hydropower Res. 2021, 19, 99–114. [Google Scholar] [CrossRef]
- Zhao, R.J. The Xinanjiang model applied in China. J. Hydrol. 1992, 135, 371–381. [Google Scholar] [CrossRef] [Scilit]
- Zhao, R.J.; Zhang, Y.L.; Fang, L.R. The Xinanjiang model. In Hydrological Forecasting, Proceeding Oxford Symposium, Oxford, UK, 15–18 April 1980; IASH: Washington, DC, USA, 1980; pp. 351–356. [Google Scholar]
- Wang, W.C.; Cheng, C.T.; Chau, K.W.; Xu, D.M. Calibration of Xinanjiang model parameters using hybrid genetic algorithm based fuzzy optimal model. J. Hydroinform. 2012, 14, 784–799. [Google Scholar] [CrossRef] [Scilit]
- Fairfield, J.; Leymarie, P. Drainage networks from grid digital elevation models. Water Resour. Res. 1991, 27, 709–717. [Google Scholar] [CrossRef] [Scilit]
- Rui, X.; Yu, M.; Liu, F.; Gong, X. Calculation of watershed flow concentration based on the grid drop concept. Water Sci. Eng. 2008, 1, 1–9. [Google Scholar] [CrossRef] [Scilit]
- Wang, W.-C.; Zhao, Y.-W.; Chau, K.-W.; Xu, D.-M.; Liu, C.-J. Improved flood forecasting using geomorphic unit hydrograph based on spatially distributed velocity field. J. Hydroinform. 2021, 23, 724–729. [Google Scholar] [CrossRef] [Scilit]
- Tewolde, M.; Smithers, J. Flood routing in ungauged catchments using Muskingum methods. Water SA 2006, 32, 379–388. [Google Scholar] [CrossRef] [Scilit]
- Todini, E. A mass conservative and water storage consistent variable parameter Muskingum-Cunge approach. Hydrol. Earth Syst. Sci. 2007, 11, 1645–1659. [Google Scholar] [CrossRef] [Scilit]
- Song, X.-M.; Kong, F.-Z.; Zhu, Z.-X. Application of Muskingum routing method with variable parameters in ungauged basin. Water Sci. Eng. 2011, 4, 1–12. [Google Scholar] [CrossRef]
- Nash, J.E.; Sutcliffe, J.V. River flow forecasting through conceptual models part I—A discussion of principles. J. Hydrol. 1970, 10, 282–290. [Google Scholar] [CrossRef] [Scilit]
- National Center of Hydrological Information. The National Criteria for Hydrological Forecasting; Hydroelectric Press: Beijing, China, 2000. [Google Scholar]
- Duan, Q.Y.; Gupta, V.K.; Sorooshian, S. Shuffled complex evolution approach for effective and efficient global minimization. J. Optim. Theory Appl. 1993, 76, 501–521. [Google Scholar] [CrossRef] [Scilit]
- Sorooshian, S.; Duan, Q.Y.; Gupta, V.K. Optimal use of the SCE-UA global optimization method for calibrating watershed models. J. Hydrol. 1994, 158, 265–284. [Google Scholar] [CrossRef] [Scilit]
- Okkan, U.; Serbes, Z.A. Rainfall-runoff modeling using least squares support vector machines. Environmetrics 2012, 23, 549–564. [Google Scholar] [CrossRef] [Scilit]
- Panahi, M.; Sadhasivam, N.; Pourghasemi, H.R.; Rezaie, F.; Lee, S. Spatial prediction of groundwater potential mapping based on convolutional neural network (CNN) and support vector regression (SVR). J. Hydrol. 2020, 588, 125033. [Google Scholar] [CrossRef] [Scilit]
- Wang, M.Q.; Yuan, W.W.; Zhang, J.Y. Overview of research on Generative Adversarial Network GAN. Comput. Eng. Des. 2021, 42, 3389–3395. [Google Scholar] [CrossRef]
- Li, X.N.; Zhang, Y.J.; She, Y.J.; Chen, L.W.; Chen, J.X. Estimation of impervious surface percentage of river network regions using an ensemble leaning of CART analysis. Remote Sens. Land Resour. 2013, 25, 174–179. [Google Scholar] [CrossRef]
- Breiman, L. Random forests. Mach. Learn. 2001, 45, 5–32. [Google Scholar]

Disclaimer/Publisher’s Note: The statements, opinions and data contained in all publications are solely those of the individual author(s) and contributor(s) and not of MDPI and/or the editor(s). MDPI and/or the editor(s) disclaim responsibility for any injury to people or property resulting from any ideas, methods, instructions or products referred to in the content. |
© 2023 by the authors. Licensee MDPI, Basel, Switzerland. This article is an open access article distributed under the terms and conditions of the Creative Commons Attribution (CC BY) license (https://creativecommons.org/licenses/by/4.0/).