1. Introduction
Okra is a very nutritive and tasty vegetable enriched with vitamins and minerals and is grown in many parts of India. India holds first position in okra production compared to other countries. The Agricultural and Processed Food Products Export Development Authority of India reported that India accounts for more than 60% of okra production of the world. Water-soluble nutrients in okra enable the immune system of the human body. Traditionally, irrigation scheduling is being practiced according to time-based or historic weather-based scheduling. Many studies were conducted on okra under drip irrigation to assess its water requirement based on a climatological approach. Based on this concept of irrigation scheduling, the availability of moisture in the soil is not considered, which is very much useful for plant growth.
Many researchers studied the effect of applying different doses of fertilizer through the broadcasting method on growth parameters and yield of okra [
1,
2,
3,
4,
5], while few studies indicated the effect of fertilizer through drip fertigation. Under water stress conditions, a significant reduction in leaf area, growth, plant height and yield in podded plants (one-time harvest) and depodded plants (frequent harvest) of okra was observed [
6]. The crop water requirement was based on CROPWAT and 100, 80 and 60% of crop water requirement treatments were tested. Maximum growth, yield and root length were attained with 413 mm of water applied under 80% of water requirement [
7]. The consumptive water use with low water application was observed as 296 mm based on a mini lysimeter study, where okra was irrigated at 50% water holding capacity [
8].
Yield reduction was estimated up to 70% in three okra cultivars (Kano Dwarf, Lady Finger and Awgu Early) under moisture stress during the flowering and pod-filling stages, whereas minimum yield reduction was observed under moisture stress at the vegetative stage [
9]. A moisture regime of 60% field capacity gave poor yield, growth parameters, leaf area, root length, shoot length and harvest index compared to 100% field capacity [
10,
11]. Maximum okra plant height, internodal length and fruit weight were attained under irrigation at 80% evapotranspiration with daily irrigation compared to 2 or 3 days interval irrigation [
12]. Around 98% increased okra yield was attained under furrow irrigation with the 4 days interval and reduction in growth and yield parameters with furrow irrigation at the 12 days interval [
13]. A study was conducted in okra with double- and single-row drip laterals geometry with 120, 100 and 80% recommended fertilizer and attained maximum yield when irrigated through single lateral geometry with 100% recommended fertilizers [
14]. Maximum reduction in okra plant growth, yield and photosynthetic pigments were observed with drought stress at 50% level compared to low drought stress of 0 and 25% kept after 21 days of sowing [
15]. Drought stress was induced at the vegetative, flowering and early pod-filling stages of okra, and it was observed that drought stress could be an indication for irrigation management practices [
16].
Maximum nitrogen uptake (125 kg/ha) and yield were attained in drip-irrigated okra compared to sprinkler irrigation with 30% water saving [
17]. Higher okra yield (1.4 t/ha), maximum root length and dry weight were attained in drip fertigation with 150:75:150 NPK kg/ha [
18]. To provide irrigation based on soil moisture depletion, soil moisture should be assessed by soil matric potential. Tensiometers (Irrometer Company, Inc., Riverside, CA, USA) were used to measure soil matric potential, which is the pressure exerted by the plant roots to absorb soil moisture. Tensiometers are highly precise instruments to measure soil matric potential [
19,
20]. From soil matric potential observations, it is easy to understand the soil moisture distribution at the crop root zone. The soil moisture distribution pattern under drip irrigation was studied by researchers in different crops. Soil moisture under different drip lateral layouts like single-row, paired-row and microtube layouts in mulberry decreased with an increase in depth and distance from the dripping point [
21]. Soil moisture distribution was assessed in drip-irrigated pea in fine sandy soil with a tensiometer-measured soil matric potential at −70, −75 and −85 kPa and found efficient distribution in the effective root zone depth compared to the top layer of soil [
22].
Maximum moisture content was at the emitting point, which decreased with an increase in the distance from the dripper point [
23]. Drip irrigation provided uniform distribution of water at the root zone of okra, which gave maximum yield with 45% water saving compared to a conventional irrigation system [
24]. Uniform distribution of moisture at the effective root zone of okra ensured better yield and water productivity. Maximum yield (4.2 t/ha) and water use efficiency (8.1 kg/ha.mm) were attained in okra when drip irrigation was at 1.0 Epan and 120% of the recommended dose fertilizer application [
25]. Fertigation enhances the nutrient availability at the root zone and thereby improved plant growth and yield. Higher plant growth and yield were attained under fertigation with 100% recommended fertilizer compared to conventional fertilizer application [
26]. Maximum okra yield of 21 t/ha was attained with irrigation level at 125%ETc compared to 100, 75 and 50% ETc with maximum water use efficiency of 35 kg/ha.mm [
27]. Maximum water use efficiency of 58 kg/ha.mm was observed under drip irrigation at 0.8 ET with plastic mulch compared to higher and lower ETc level [
28].
In okra, water use efficiency of 8.8 kg/ha.mm was attained with irrigation at 40% crop water requirement, but 60% crop water requirement was recommended to attain good yield and water saving [
28]. Irrigation at 1.0 ET produced maximum okra yield of 16 t/ha compared to lower ET levels with irrigation of 350 mm and attained maximum water use efficiency [
28]. Maximum okra yield (7.8 t/ha) and water use efficiency were attained under modified bucket kit drip irrigation compared to water can application [
29].
As the climatic variation affects crop ET, it is necessary to irrigate the crop as and when required [
30,
31]. Hence, irrigation should be based on soil moisture availability in order to save water and to increase water use efficiency. The stored moisture in the soil needs to be considered to schedule irrigation. The relative soil moisture availability can be represented by soil matric potential, which can be measured by tensiometers. Hence, soil-matric-potential-based irrigation is a very accurate practice to increase the yield and water use efficiency of okra. Hence, field research was carried out with the following objectives: (i) to determine the suitable soil moisture depletion level to schedule irrigation for okra, (ii) to determine the suitable fertilizer application rate with respect to yield and water use efficiency of okra in sandy loam soil under semiarid conditions.
2. Materials and Methods
2.1. Details of the Study
Research work was conducted at the Water Technology Centre, IARI, New Delhi during 2021 in sandy loam soil.Particle size distribution was determined by sieve analysis. Four samples were collected from different places of the field (at 0–15 cm; 15–30 cm and 30–45 cm depth), and the average values of particle sizes were considered to identify the soil type. The particle size distribution at the depth of 20–25 cm was 18% clay, 57% sand and 25% silt. The dry bulk density of the soil was 1.42 g·cm
−3. The soil profile consisted of less formed A, B and E horizons. Hence, as per USDA soil taxonomy, it was classified as inceptisol. The inceptisol horizon sequence was Ap–Bw–Bt. The field capacity and wilting point of the soil were estimated by a pressure plate apparatus. The field capacity was measured at the hydrolimits of 0.1 bar, and the wilting point was measured at the hydrolimits of 15 bar. At 0–15 cm, 15–30 cm and 30–45 cm depth, the field capacity was 24.35, 28.20 and 31.04
v/
v, respectively. At 0–15 cm, 15–30 cm and 30–45 cm depth, the wilting point was 9.15, 11.32 and 12.81
v/
v, respectively. The okra has maximum root density at the top 20 cm depth. Hence, the top layer field capacity was considered as a reference to schedule irrigation. Maximum and minimum mean temperatures were 36.2 and 21.3 °C, respectively, while rainfall of 129.5 mm was received during the crop growing period. The maximum and minimum mean relative humidity levels were 71.8 and 42.2%, respectively, while mean wind speed was 5.4 kmph during the season. Tensiometers were used to measure soil matric potential (SMP). There were 12 tensiometers installed in the field to measure soil matric potential. Volumetric soil moisture content was determined for different soil matric potential values. The experimental field had an area of 900 m
2. The location of the research field is given in
Figure 1. After ploughing, Trichoderma viride was applied at one kg/ha to avoid fungal infection from soil. Okra (Pusa B-5 variety) seeds were treated with Trichoderma viride (produced at Indian Agricultural Research Institute) at 8 gm/kg and Pseudomonas flourescens (produced at Indian Agricultural Research Institute) at 10 gm/kg and dried under shade. Seeds were sown on raised beds of size 60 cm with a furrow size of 20 cm. Sowing was done by dibbling seeds at 40 cm × 20 cm spacing. Each raised bed has 2 rows with one lateral and population of 80 plants/raised bed. Critical irrigation was given to the entire plot. Each irrigation treatment had 6 raised beds of 8 m × 6 m length. Twelve treatment combinations of 4 irrigation and 3 fertigation levels were tested with 3 replications in a split-plot design. Irrigation levels were superimposed on the main plots, while fertigation levels were superimposed on the subplots.
The dry bulk density of undisturbed soil was determined by core cutter method at various depth. At 0–15 cm, 15–30 cm and 30–45 cm depth, the dry bulk density was 1.43, 1.47 and 1.38, respectively. The average value was considered as dry bulk density of the soil in the research field. Tensiometers of size 30 cm were installed in each treatment to observe the soil matric potential at the effective root zone depth of 20–25 cm. Before the cropping period, soil samples were collected with a screw auger at the depth of 20–25 cm from six different places in the research field for various soil matric potential (SMP)values under wet moisture conditions. To arrive at the soil moisture characteristics curve, soil samples were collected to estimate soil moisture content at different matric potentials. The soil samples were collected for every 2 kpa difference, that is, from 10 to 46 kpa (like 10, 12, 14, 16, 18 kpa and so on). For each matric potential, 3 times the soil samples were collected at a time from the field, and this exercise was continued a number of times until the consistent values of moisture content against each matric potential were attained.
The soil samples of approx. 50 to 70 g weight were collected from the 20–30 cm depth with a screw auger and immediately kept in an oven to determine moisture content. The moisture content of the collected samples was estimated on a percentage basis by oven-dry method. This percentage moisture content was multiplied by the dry bulk density of the soil to estimate volumetric soil moisture content in terms of cm
3/cm
3. Then, the soil moisture characteristic curve was derived between volumetric moisture content and soil matric potential (
Figure 2).
Soil moisture depletion (SMD) percentage was estimated based on the available moisture in the root zone at different soil matric potential levels. At −20 kPa SMP, soil moisture depletion (SMD) was 20%, and at −30, −35 and −40 kPa SMP, the moisture depletion was equal to 30, 40 and 50% of the available soil moisture at the effective root zone, respectively. The soil moisture characteristics curve for the research field is given in
Figure 2.
The relationship between volumetric moisture content and soil matric potential was determined using the RETC model proposed by Van Genuchten (1980) [
32]. The soil water retention curve for the research field was arrived at for the particular range of soil matric potential and not for the entire wilting point range. The soil water retention curve was drawn for the matric potential ranged from −10 kPa to −50 kPa only, as we have fixed the irrigation treatments in between a −20 to −40 kPa range of soil matric potential. The plotted readings were obtained from the soil samples taken from the field against each matric potential (observed values) and the fitted values derived from the RETC model. The soil moisture retention curve for the experimental field is given in
Figure 3.
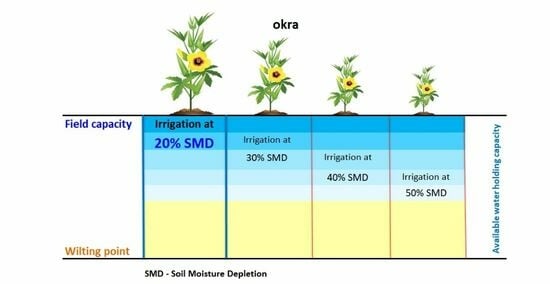
A program was predefined in an irrigation controller unit to start solenoid valves for irrigation whenever the specified soil moisture depletion was attained in four irrigation treatments (I1:20%, I2:30%, I3:40% and I4:50% of soil moisture depletion rate). There were three fertigation treatments (F1:100%, F2:80% and F3:60% of recommended NPK (100:25:40 kg/ha)) given in five split doses. The irrigation treatments were superimposed 15 days after sowing based on the soil moisture depletion levels. Irrigation was started when the pre-specified soil moisture depletion level was reached. The amount of water was given in order to bring back the soil moisture to field capacity level.
2.2. Soil Moisture Distribution at Effective Root Zone Depth
Soil moisture distribution was assessed at different soil moisture depletion levels using Surfer 10.0 software. This software transforms 3-dimensional data and develops a contour plot. Moisture content data were given as input in XYZ coordinates format. The X-coordinate represented the radial distance from the emitter (near emitter, 15 and 30 cm distance), the Y-coordinate represented soil depth (10, 20 and 30 cm) and the Z-coordinate represented soil moisture. When the tensiometer showed SMP of −20, −30, −35 and −40 kPa (20%, 30%, 40% and 50% of soil moisture depletion), soil moisture samples were taken near the emitter point, 15 and 30 cm away from the emitter point at 10, 20 and 30 cm depth.
2.3. Okra Plant Growth and Yield Attributes
The plant height, number of branches/plant, leaf area index (LAI), number of pods/plant, 100 pods weight, number of seeds/pod of okra were observed. Five plants in each treatment were tagged randomly for observations. LAI was measured from each treatment (5 plants/replication) using an LAI 2000 LI-COR Plant canopy analyzer. Okra harvest started from the 60th day after sowing and continued every alternate day.
Water Use Efficiency (WUE)
Water use efficiency is the ratio between the produce yield obtained (kg) and the volume of water consumed (m
3) during the cropping season [
33,
34,
35]. The efficiency of water use was calculated by the ratio of okra yield to the amount of water applied [
36]. Water use efficiency was calculated between crop yield and water used and reported higher water use efficiency with a low water application rate [
37]. Higher water use efficiency was registered with a higher yield of okra [
38].
Water use efficiency (WUE) was determined for each treatment as
Descriptive statistics were derived for plant growth and yield parameters. Analysis of variance (ANOVA) of data was carried out to assess the effects of irrigation, fertigation and their interaction based on a split-plot design [
39]. Correlation coefficients and regression models were derived between yield and plant parameters and tested for significance based on coefficient of determination (R
2) and prediction error.
3. Results and Discussion
3.1. Fluctuation of Soil Matric Potential Values
In the okra field, the soil matric potential values fluctuated between −20 kPa and −11 kPa in I1 treatment between two irrigations. When the soil moisture attained a 20% soil moisture depletion level, the particular treatment was irrigated automatically, and the soil moisture was brought back to the field capacity level. Similarly, when the soil moisture reached the 30%, 40% and 50% soil moisture depletion levels, the I2, I3 and I4 treatments were irrigated, and the corresponding soil matric potential values ranged from −30 kPa to −11 kPa, −35 kPa to −11 kPa and −40 kPa to −11 kPa, respectively, throughout the crop growing season between irrigation cycles.
The daily soil matric potential variations were observed for 105 days from sowing to harvest of okra crop.
Figure 4 shows the soil matric potential together with the rainfall and irrigation events.
The soil moisture available at the effective root zone depth of okra under different irrigation treatments during the crop season is given in
Figure 5. In I
1 treatment when irrigation was scheduled at 20% SMD, the available soil water content was maintained at almost 90% of field capacity level. Similarly, in I
2, I
3 and I
4 treatments when irrigation was scheduled at 30%, 40% and 50% SMD, the available soil water content was maintained at 80%, 75% and 70% of field capacity level.
The descriptive statistics of the soil matric potential values as influenced by the four irrigation treatments are given in
Table 1. Under I
1, the SMP values ranged from −22 to −10 with a mean of −15.990 (coefficient of variation of −21.2%), while the values ranged from −30 to −10 with a mean of −21.705 (CV of −35.2%) under I
2. Similarly, the SMP values ranged from −35 to −10 with a mean of −21.705 (CV of −38.8%) under I
3, while the values ranged from −40 to −11 with a mean of −23.924 (CV of −42.3%) under I
4. Thus, I
4 had a wide range, maximum mean and CV (%), followed by I
3, I
2 and I
1, respectively.
The fluctuations of soil matric potential values under each treatment were assessed for normality by grouping the 105 observations into 10 different classes, as described in
Table 2. The differences between the observed and expected frequencies in different classes were tested based on Chi-square test at
p < 0.05 and
p < 0.01 levels of significance. The calculated Chi-square test values were more than the Chi-square critical values and indicated the best fit of normal distribution for the SMP data observed under all four treatments. The fluctuations of the SMP values in the four irrigation treatments in different classes are depicted in
Figure 6.
3.2. Assessment of Consistency and Reliability of Soil Matric Potential Values
Based on the relationships of soil matric potential values observed under different treatments, the four treatments were found to be positively and significantly related to each other. The relationship was maximum between I3 and I4 (0.620), followed by I1 and I2 (0.527), I1 and I4 (0.452), I1 and I3 (0.443), I2 and I3 (0.425) and I2 and I4 (0.321). Maximum and significant negative correlation was observed for I4 (−0.325), followed by I1 (−0.296), I3 (−0.286) and I2 (−0.234) over a period of time. The Cronbach values were determined between different pairs of treatments over a period of 105 days from sowing to harvest in order to assess the internal consistency and reliability of the changes that occurred in the SMP values. A Cronbach value of (i) more than 0.8 would indicate a high consistency and reliability, while (ii) a value between 0.5 and 0.8 would indicate moderate consistency and reliability, and (iii) a value less than 0.5 would indicate low consistency and reliability based on a comparison of treatments. When a set of two treatments were compared, maximum moderate reliability was observed between (i) I3 and I4 (0.757), followed by (ii) I2 and I3 (0.589) and (iii) I1 and I2 (0.587). However, the comparisons of (i) I1 and I3 (0.469), (ii) I1 and I4 (0.428), and (iii) I2 and I4 (0.461) indicated that the treatments had a low consistency and reliability over a period of time.
When a set of three treatments were compared, all the three comparisons of I1, I2 and I3 (0.649), I1, I2 and I4 (0.575), and (iii) I2, I3 and I4 (0.712) indicated a moderate consistency and reliability of the SMP values. When a set of all four treatments were compared, the treatments were found to be moderately consistent and reliable with a Cronbach value of 0.729.
3.3. Soil Moisture Distribution Pattern under Drip Irrigation
At a 20% soil moisture depletion rate, soil moisture samples were collected near the emitter point, 15 cm and 30 cm away from the emitter point at a depth of 10, 20 and 30 cm. The soil moisture distribution pattern at different levels of soil moisture depletion rate (20%, 30% 40% and 50%) at different spatial distances and depths are depicted in
Figure 7. Distribution of soil moisture was given in terms of volume basis. The graphical plots indicated that the moisture content decreased in deeper soil layers with increasing distance from the emitters. Higher moisture content was found at the top layer of the soil depth near the dripper point. Irrigation at 20% soil moisture depletion treatment maintained sufficient water content, followed by 30%, 40% and 50% soil moisture depletion rate treatments. Insufficient moisture distribution was found at irrigation at a 50% soil moisture depletion rate. With irrigation at 20% soil moisture depletion treatment, the level of moisture content ranged from 92% to 87% of field capacity from the dripper to 30 cm spatial distance and at the depth of 10–20 cm. With irrigation at 30% soil moisture depletion level treatment, about 83% to 77% of field capacity moisture content spread was found horizontally at the depth of 20 cm. There was a decreasing trend of moisture content at the deeper layer and the location away from the emitting point. With irrigation at40% moisture depletion treatment, the moisture content range at the effective root zone depth was 77% to 70% of field capacity from the dripper to 30 cm spatial distance. With irrigation at50% moisture depletion, the moisture content range at the effective root zone depth was 72% to 66% of field capacity from the dripper to 30 cm spatial distance. At the 20%, 30%, 40% and 50% soil moisture depletion levels, the moisture distribution was nearly 90%, 80%, 75% and 70% of the field capacity level, respectively.
Many studies were carried out on soil moisture distribution under drip-irrigated crops. Uniform distribution of soil moisture between soil depths of 15 to 37 cm in sandy loam soil at 30 cm dripper spacing was assessed with parallel contour lines plotted in Surfer 7.0 software with better uniformity of water spread [
40]. The soil matric potential is decided by transporting irrigation water within the soil under a drip irrigation system [
41]. The salt distribution in peas under a drip irrigation system was found to increase the soil salinity at the vertical distance from the dripper point and around the periphery of the wetted zone [
42].
The fluctuation in moisture content at the effective root zone depth of okra under different treatments influenced the crop growth and yield parameters. Okra yield and growth parameters were found to be significant with irrigation at 25% soil moisture depletion level compared to 50% and 75% of soil moisture depletion level [
43].
3.4. Irrigation Scheduling for Okra
Figure 8 depicts the irrigation depth and frequency applied during the crop growing season for the treatments of irrigation at 20%, 30%, 40% and 50% soil moisture depletion levels. An equal quantity of irrigation was applied till 20 days after the sowing of okra. The calculated amount of irrigation given per irrigation cycle in I
1 was 4.9 mm, I
2 was 8.7 mm, I
3 was 12.1 mm and I
4 was 15.3 mm in order to bring the soil moisture closer to the field capacity level. During rainfall, the soil matric potential was below −10 kPa. Irrigation was not started until the pre-specified soil matric potential was reached in each irrigation treatment. The depth of water which satisfied the actual evapotranspiration was considered as effective rainfall. Similar findings were reported by applying an equal quantity of water with varying frequencies of irrigation in a drip-irrigated tomato crop [
44]. The optimum soil moisture level in the root zone was maintained by the application of water through drip irrigation in tomato based on soil matric potential [
19].
3.5. Effect of Irrigation and Fertigation on Okra Plant Parameters, Yield and Water Use Efficiency
The various plant growth parameters were observed in all the treatments. Increased plant height (123.6 cm), maximum number of fruiting branches (18), maximum number of flowers per plant (23), maximum number of fruits per plant (22), maximum 100 fruits weight (1.23 kg), maximum fruit length (14.6 cm), maximum fruit girth (6.4 cm) and maximum leaf area index (1.9) were observed in the treatment of irrigation at 20% soil moisture depletion with 100% of the recommended dose of fertilizers. Fewer plant growth parameters were observed in the treatment of irrigation scheduling at 50% soil moisture depletion level with 60% of the recommended dose of fertilizers as the frequency of irrigation was longer (
Table 3). The plant might not obtain enough moisture and nutrients due to the unavailability of sufficient moisture at the root zone as the irrigation time interval was long. In less irrigation frequency treatments, it is not possible to maintain near-field-capacity moisture between successive irrigation treatments. The effects of various water application levels through drip irrigation with different nutrient requirements and fertilizer application methods were studied to determine the okra yield by many researchers [
45,
46,
47,
48].
A maximum okra yield of 12.3 t/ha was obtained in the treatment of irrigation scheduling at 20% soil moisture depletion level with 100% of the recommended dose of fertilizers, while a minimum yield of 7.5 t/ha was obtained in the treatment of irrigation scheduling at 50% of soil moisture depletion with 60% of the recommended dose of fertilizers. The minimum yield was due to non-uniform moisture availability because of a longer irrigation interval, thereby less nutrient uptake. Irrigation at 1.00 ET produced a maximum okra yield of 16 t/ha compared to lesser ET levels with a total irrigation quantity of 350 mm; however, it obtained maximum water use efficiency at lower ET levels [
49]. Drip irrigation combined with mulches was tried in okra with different irrigation levels of 100%, 80% and 60% of net irrigation volume and obtained maximum yield in the treatment of irrigation at 100% of net irrigation volume with black plastic mulch [
50]. Okra plant was irrigated based on leaf air temperature differential sensors, soil electrical conductivity sensors and evaluated leaf air temperature and soil moisture throughout the crop season [
51]. Maximum okra yield was attained under sub-surface irrigation provided with 100% ETc, and the total application of water was 800 mm [
52]. Maximum pea yield and water productivity were attained with the irrigation treatment scheduled at the soil matric potential level of −30 kPa [
53]. The maximum number of fruits, fruit weight and yield of okra were influenced by the sowing time and hormone application in okra [
54]. Higher fruit yield and maximum fertilizer use efficiency were recorded in okra when irrigation was at a 30% maximum allowable depletion level under sprinkler irrigation [
55]. Maximum okra yield (24 t/ha) was obtained when irrigation was scheduled based on tensiometer reading compared to time-based irrigation [
56]. Maximum water use efficiency (3.5 kg/m
3) was observed in the treatment of irrigation scheduled at 20% soil moisture depletion and supplied with 100% of the recommended dose of fertilizers in five split doses. The minimum water use efficiency (2.1 kg/m
3) was observed in irrigation scheduled at 50% soil moisture depletion and supplied with 60% of the recommended dose of fertilizers as okra yield was poor (
Figure 9). Few studies were carried out to find out the water use efficiency of okra which confirmed this finding. The amount of water applied for okra under a drip irrigation system was around 500 mm and obtained a maximum water use efficiency of 8.1 kg/ha/mm with irrigation at 1.0 Epan with 120% of the recommended dose of fertilizers, but maximum agronomic efficiency (40.8 kg pod yield per kg of N applied) was obtained with a lower fertigation dose (60% of RDF) [
25]. Okra crop was experimented with three different irrigation frequencies and obtained the highest water use efficiency (702 kg·ha
−1cm
−1) in the treatment of daily irrigation of 15 min [
57]. The maximum water use efficiency (12.95 kg/m
3) was recorded in an automated water delivery system to okra compared to traditional water application with 11% water saving [
58].
The descriptive statistics of yield and other plant parameters as influenced by different irrigation treatments are given in
Table 4. The okra yield ranged from 7.2 to 12.5 t/ha with a mean of 9.1 t/ha (CV of 14.3%). I
1 was superior with a maximum mean yield of 10.0 t/ha (CV of 18.1%), while I
4 gave a minimum mean yield of 8.4 t/ha (CV of 9.2%). The water use efficiency ranged from 2.1 to 3.6 kg/m
3 with a mean of 2.6 kg/m
3 (CV of 14.0%). I
1 was superior with a maximum WUE of 2.8 kg/m
3 (CV of 18.4%), while I
4 gave a minimum mean WUE of 2.1 kg/m
3 (CV of 9.6%). The plant height ranged from 87.2 to 124.6 cm with a mean of 98.3 cm (CV of 9.9%). I
1 was superior with a maximum mean plant height of 106.1 cm (CV of 12.8%), while I
4 gave a minimum mean plant height of 93.0 cm (CV of 4.5%). The number of fruiting branches/plant ranged from 9.8 to 18.4 with a mean of 13.1 (CV of 18.2%). I
1 was superior with a maximum mean number of fruiting branches/plant of 15 (CV of 16.5%), while I
4 gave a minimum number of fruiting branches/plant of 11.2 (CV of 12.0%).
The number of flowers/plant ranged from 15 to 24 with a mean of 18 (CV of 12.4%). I1 gave a maximum mean number of flowers/plant of 19.6 (CV of 15.3%), while I4 gave a minimum number of flowers/plant of 16.4 (CV of 7.2%).The number of fruits/plant was in a range of 12.8 to 22.8 with a mean of 16.0 (CV of 15.8%). I1 gave a maximum mean number of fruits/plant of 18.0 (CV of 17.5%), while I4 gave a minimum number of fruits/plant of 14.3 (CV of 10.2%).The 100 fruit weight (kg) was ranged from 0.94 to 1.24 kg with a mean of 1.04 kg (CV of 7.9%). I1 was superior with a maximum mean 100 fruit weight of 1.11 kg (CV of 9.3%), while I4 gave a minimum fruit weight of 0.99 kg (CV of 6.1%).The length of okra was in the range of 9.6 to 14.7 cm with a mean of 11.8 cm (CV of 11.2%), while the girth of okra was in the range of 5.1 to 6.5 cm with a mean of 5.7 cm (CV of 7.3%). I1 was superior for both length and girth of okra with a maximum mean length of 13.1 cm (CV of 9.1%) and girth of 6.0 cm (CV of 6.0%), while I4 gave a minimum length of 10.6 cm (CV of 8.1%) and girth of 5.2 cm (CV of 1.7%), respectively. The leaf area index ranged from 1.1 to 2.0 with a mean of 1.5 (CV of 15.4%). I1 was superior with a maximum mean LAI of 1.7 (CV of 11.3%), while I4 gave a minimum LAI of 1.3 (CV of 12.7%). The study has indicated the superiority of application of irrigation at 20% soil moisture depletion with 100% of the recommended dose of fertilizers with a maximum mean okra yield and other plant parameters compared to 30%, 40% and 50% treatments.
The analysis of variance of the effects of irrigation in combination with fertilizer doses on yield and other plant parameters tested based on Snedecor’s F-test are given in
Table 5. There was a significant difference in the effects of irrigation and fertigation and their interaction on the plant height, number of fruiting branches/plant, number of flowers/plant, number of fruits/plant, 100 fruit weight, length of okra, girth of okra, leaf area index and yield. Based on the Least Significant Difference (LSD) criteria at
p < 0.05 level of significance, the irrigation and fertilizer treatments which are significantly superior for different parameters have been identified.
3.6. Relationship between Different Plant Parameters in Okra
The estimates of correlation between different plant parameters as influenced by the irrigation at different soil moisture depletion levels are given in
Table 6. Okra yield had a significant correlation with all the plant parameters under all irrigation treatments except with (i) number of flowers under I
4, (ii) 100 fruit weight under I
3 and I
4, and (iii) LAI under I
3, while WUE had no significant correlation with (i) 100 fruit weight under I
4 and (ii) LAI under I
3. The plant height had a significant correlation with all the other plant parameters under all irrigation treatments except with (i) number of flowers, number of fruits and 100 fruit weight under I
3 and I
4, and (ii) LAI under I
4. The number of fruit-yielding branches had a significant correlation with all the other plant parameters under all irrigation treatments except with (i) 100 fruit weight and LAI under I
3. The number of flowers had a significant correlation with all the other plant parameters under all irrigation treatments except with (i) 100 fruit weight under I
3 and I
4 and (ii) LAI under I
3. The number of fruits had a significant correlation with all the other plant parameters under all irrigation treatments except with (i) 100 fruit weight under I
3 and I
4, (ii) girth of okra under I
3 and I
4, and (iii) LAI under I
3. The fruit weight had a significant correlation with all the other plant parameters under all irrigation treatments except with (i) LAI under I
3 and I
4.The length of okra had a significant correlation with all the other plant parameters under all irrigation treatments except with (i) LAI under I
3, while the girth of okra had a significant correlation with all the other plant parameters under all irrigation treatments except with LAI under I
3 and I
4.
3.7. Regression Models of Yield with Different Plant Parameters in Okra
The effects of different plant parameters on okra yield under different irrigation treatments were assessed based on the regression model of yield through each plant parameter and also with the pooled regression model of yield. The regression coefficients, along with the coefficient of determination (R
2) and prediction error (PE) values, are given in
Table 7. The regression coefficients of all the plant parameters under all irrigation treatments indicating the effects of plant parameters on okra yield were found to be significant except for (i) the number of flowers/plant under I
4, (ii) 100 fruit weight under I
3 and I
4 and (iii) leaf area index under I
3. The predictability as indicated by the coefficient of determination was significant for all the plant parameters under all irrigation treatments except for (i) the number of flowers/plant under I
4, (ii) 100 fruit weight under I
3 and I
4 and (iii) leaf area index under I
3 and I
4. The prediction error of okra yield ranged from 0.092 t/ha under I
4 with the model of water use efficiency to 1.068 t/ha under I
1 with the model of leaf area index.
Significant relationships were found between yield and different plant parameters when the data were pooled over the four irrigation treatments tested in the study. The relationship (r-value) of okra yield with the number of fruiting branches/plant (r = 0.945) and length of okra (r = 0.865) are described in
Figure 10 (top), and the girth of okra (r = 0.848) and water use efficiency (r = 0.987) pooled over different irrigation treatments are described in
Figure 10 (bottom). The relationship of okra yield with the number of flowers/plant (r = 0.902) and number of fruits/plant (r = 0.934) is described in
Figure 11 (top), and 100 fruit weight (r = 0.855) and leaf area index (r = 0.792) pooled over different irrigation treatments are described in
Figure 11 (bottom). The relationship of okra yield with the plant height (r = 0.942) is described in
Figure 12.
3.8. Ranking of Different Treatments for Superiority of Okra Yield, Plant Parameters
Ranks were assigned to the 12 different treatment combinations of 4 levels of irrigation and 3 levels of fertilizer for their performance of okra yield and different plant parameters. Based on the ranks, the rank sum of each treatment was derived to identify the superior treatment with a minimum rank sum. Based on the rank sums, I
1 F
1 was superior with the lowest rank sum of 9, while I
4 F
3 attained the highest rank sum of 80. I
2 F
1 was the 2nd-best treatment with a rank sum of 18, while I
1 F
2 was the 3rd-best treatment with a rank sum of 28 based on the ranks assigned to different plant parameters. The rank sums of treatments based on the ranks assigned to okra yield and different plant parameters are described in
Figure 13.
The irrigation treatment I
1was provided with sufficient soil moisture as the frequency of irrigation was higher. Among the four treatments, I
1 was the superior treatment with significantly higher okra yield and plant growth parameters. The analysis of variance indicated that I
1 was superior with a significantly higher mean yield and other plant parameters compared to other irrigation treatments. It had a maximum and significant correlation with yield and other plant parameters compared to I
2, I
3 and I
4 treatments. Based on the rank sums, the treatment I
1 in combination with F
1 was superior among different irrigation and fertilizer treatment combinations tested in the study. Similar findings were reported in okra whereby to achieve a higher yield, the soil moisture needs to be maintained at field capacity level with the dosage of application of 100% of the recommended dose of fertilizers [
59]. The soil-moisture-based irrigation method provided sufficient moisture in the root zone, increased okra yield and saved adequate water [
60].
4. Conclusions
The field study was conducted on okra with four irrigation and three fertigation treatments. Irrigation was scheduled based on soil moisture depletion at 20%, 30%, 40% and 50% together with fertilizer doses of 100%, 80% and 60% of recommended NPK (100:25:40 kg/ha). The soil matric potential fluctuations were observed continuously throughout the crop season by using electronic tensiometers. Uniform distribution of soil moisture between two successive irrigations was observed when irrigation was scheduled at a 20% soil moisture depletion rate. The moisture percentage was ranging from 92% to 87% of field capacity from the dripper point to 30 cm spatial distance at the effective root zone depth. Okra yield ranged from 7.2 to 12.5 t/ha with a mean of 9.1 t/ha, while water use efficiency ranged from 2.1 to 3.6 kg/m3 with a mean of 2.6 kg/m3. Cronbach alpha values indicated moderate reliability and consistency of the soil moisture depletion values under different irrigation treatments from sowing to harvest. Soil moisture depletion values were significantly predicted based on a regression model calibrated for each treatment. The model gave minimum prediction error (PE) for irrigation treatments. Irrigation scheduled at 20% soil moisture depletion together with 100% of the recommended dose of fertilizers gave significantly higher yield, plant height, number of fruiting branches/plant, number of flowers/plant, number of fruits, length and girth of okra with a minimum rank sum and significant correlation among parameters. The limitation of this study is that the research was conducted for one soil type and one vegetation season only, and the data were analyzed statistically. The same methodology should be tried for two or three vegetation seasons to validate the results. From this study, it is recommended to schedule irrigation at a 20% moisture depletion rate combined with 100% of the recommended fertilizers for attaining maximum returns from okra under inceptisols. Around 22 percent reductions in yield and water use efficiency were observed under 80% of the recommended dose of fertilizers through fertigation. However, to reduce the extreme usage of fertilizers, it is suggested to schedule irrigation at a 20% moisture depletion rate combined with 80% of the recommended dose of fertilizers.


 ,
, 


