

Regionalization of Root Zone Moisture Estimations from Downscaled Surface Moisture and Environmental Data with the Soil Moisture Analytical Relationship Model


Abstract
:1. Introduction
2. Materials and Methods
2.1. Datasets
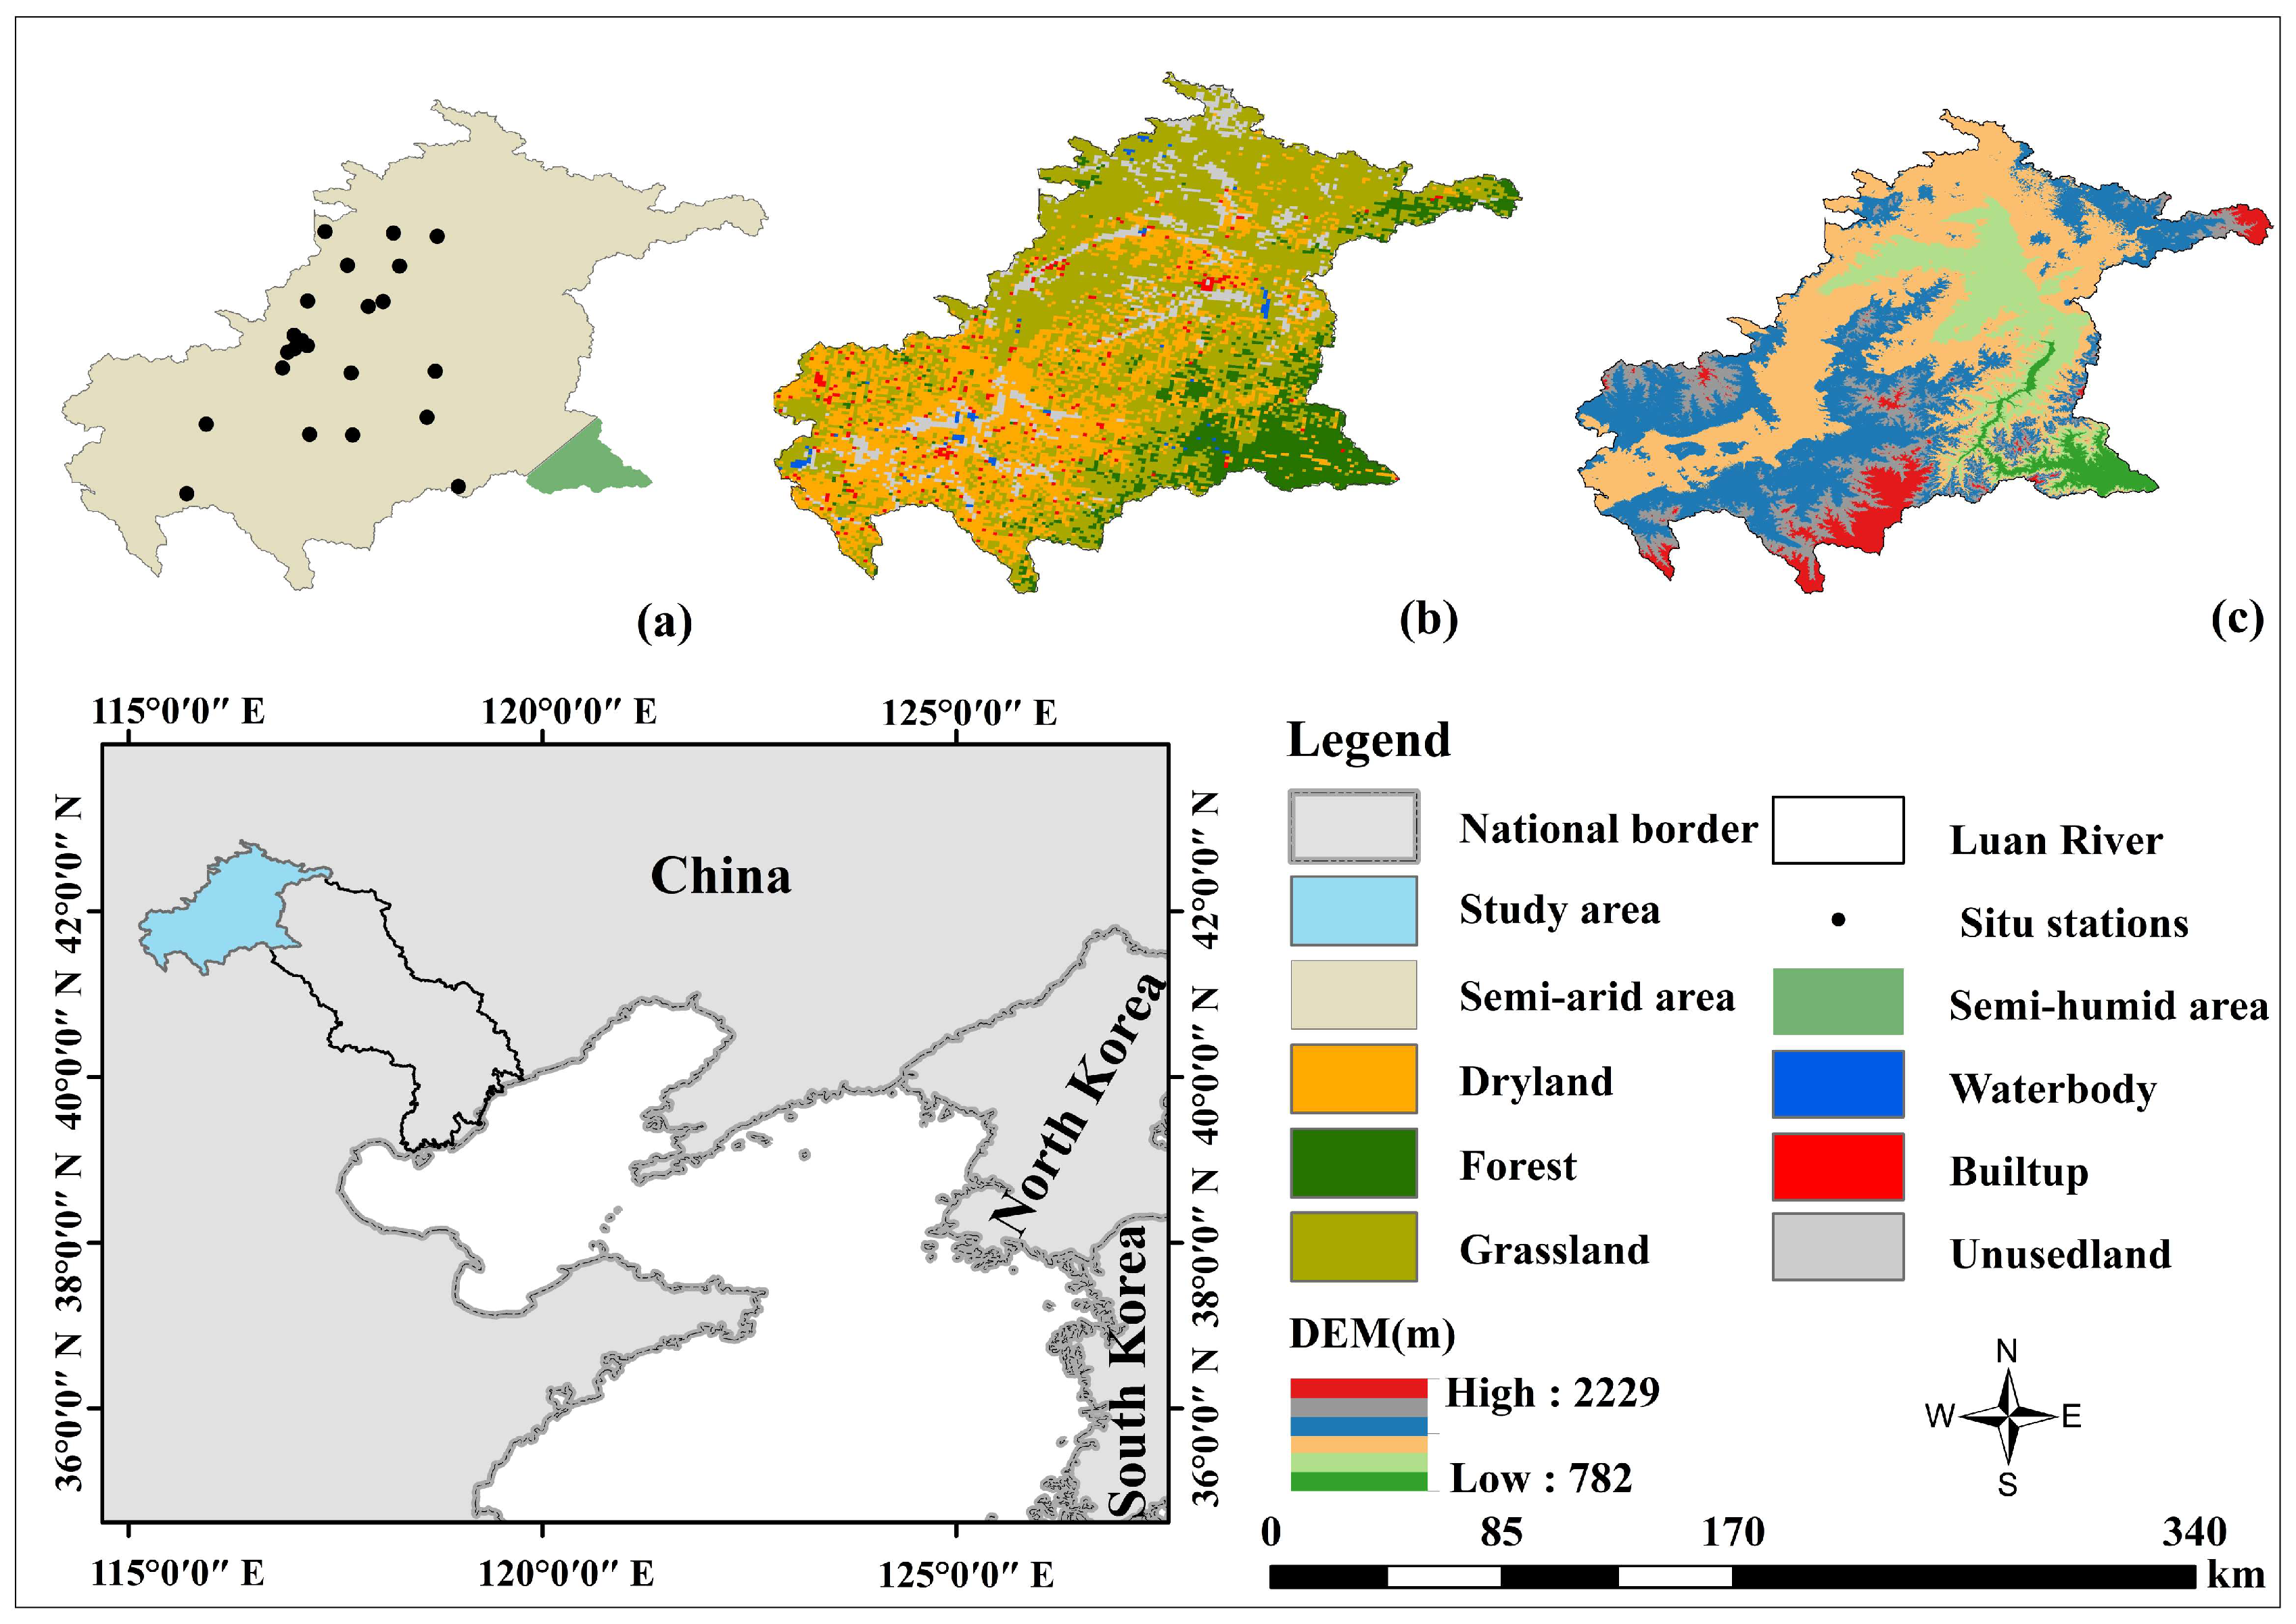
2.1.1. In Situ Data
2.1.2. Auxiliary Data
2.1.3. SSM Dataset
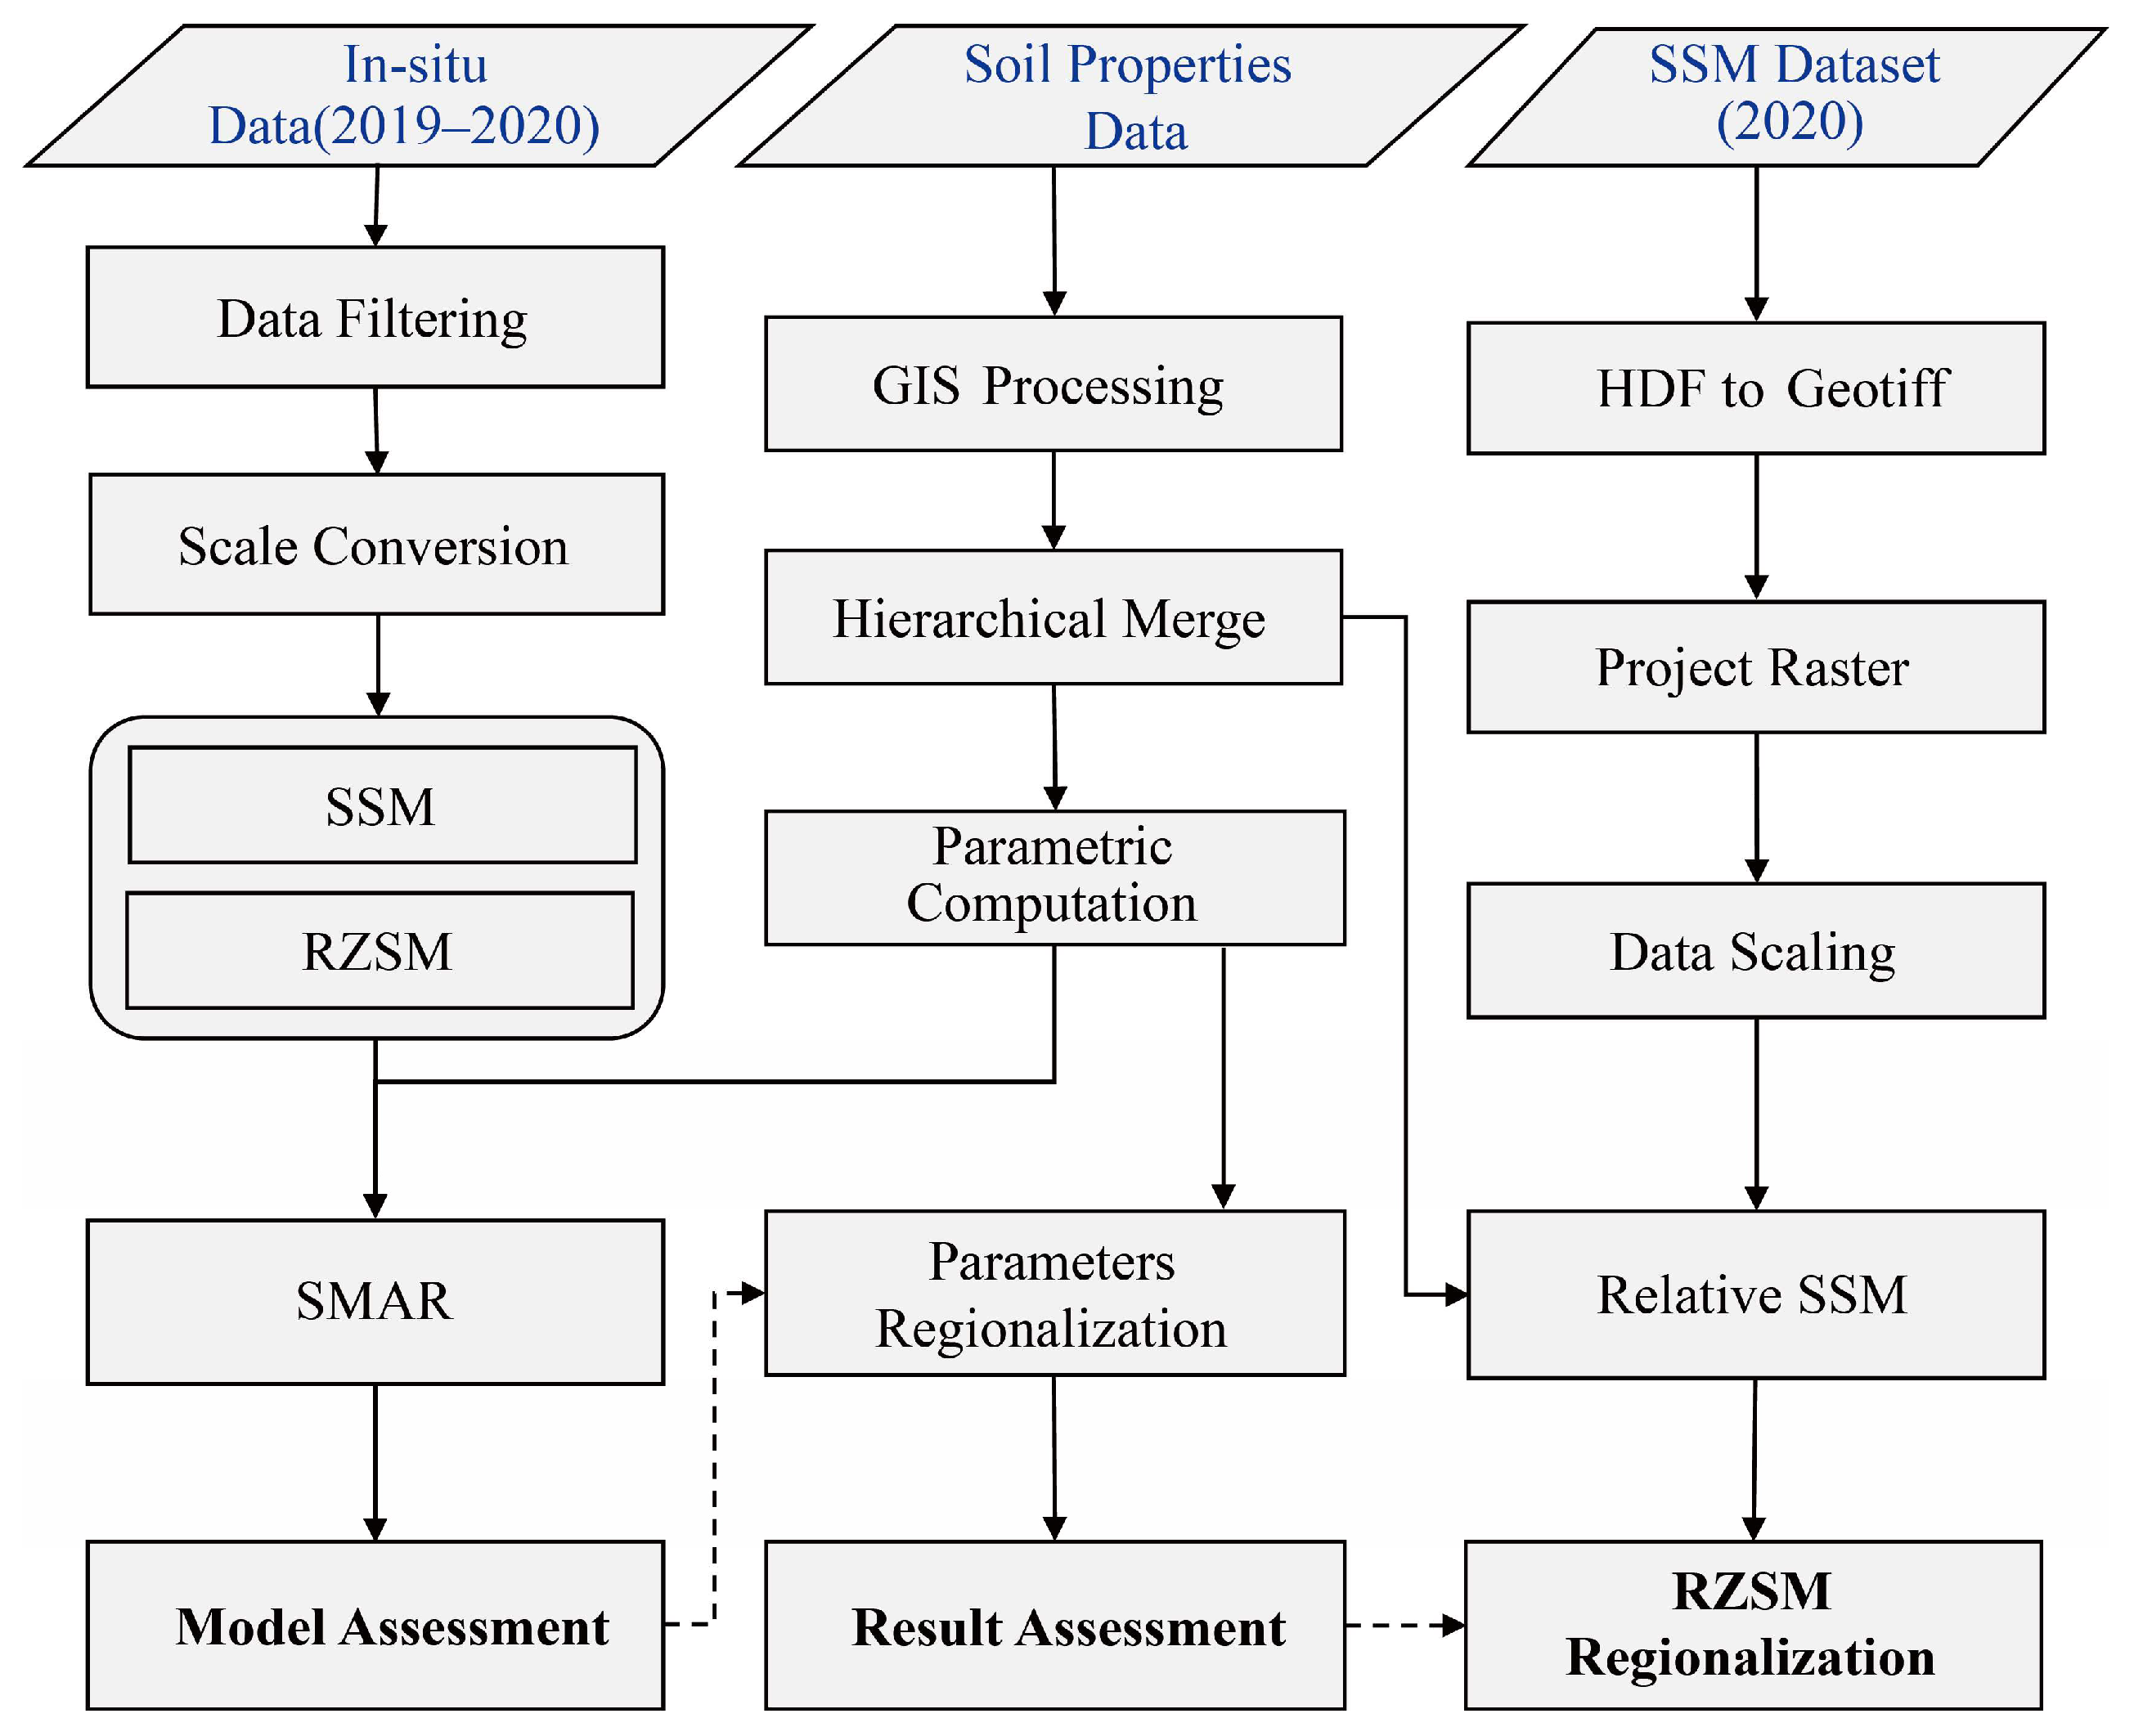
2.2. Methods
2.2.1. SMAR Model
2.2.2. SMAR Parameters Optimization
2.2.3. Multiple Linear Regression
2.2.4. Evaluation Metrics
3. Results
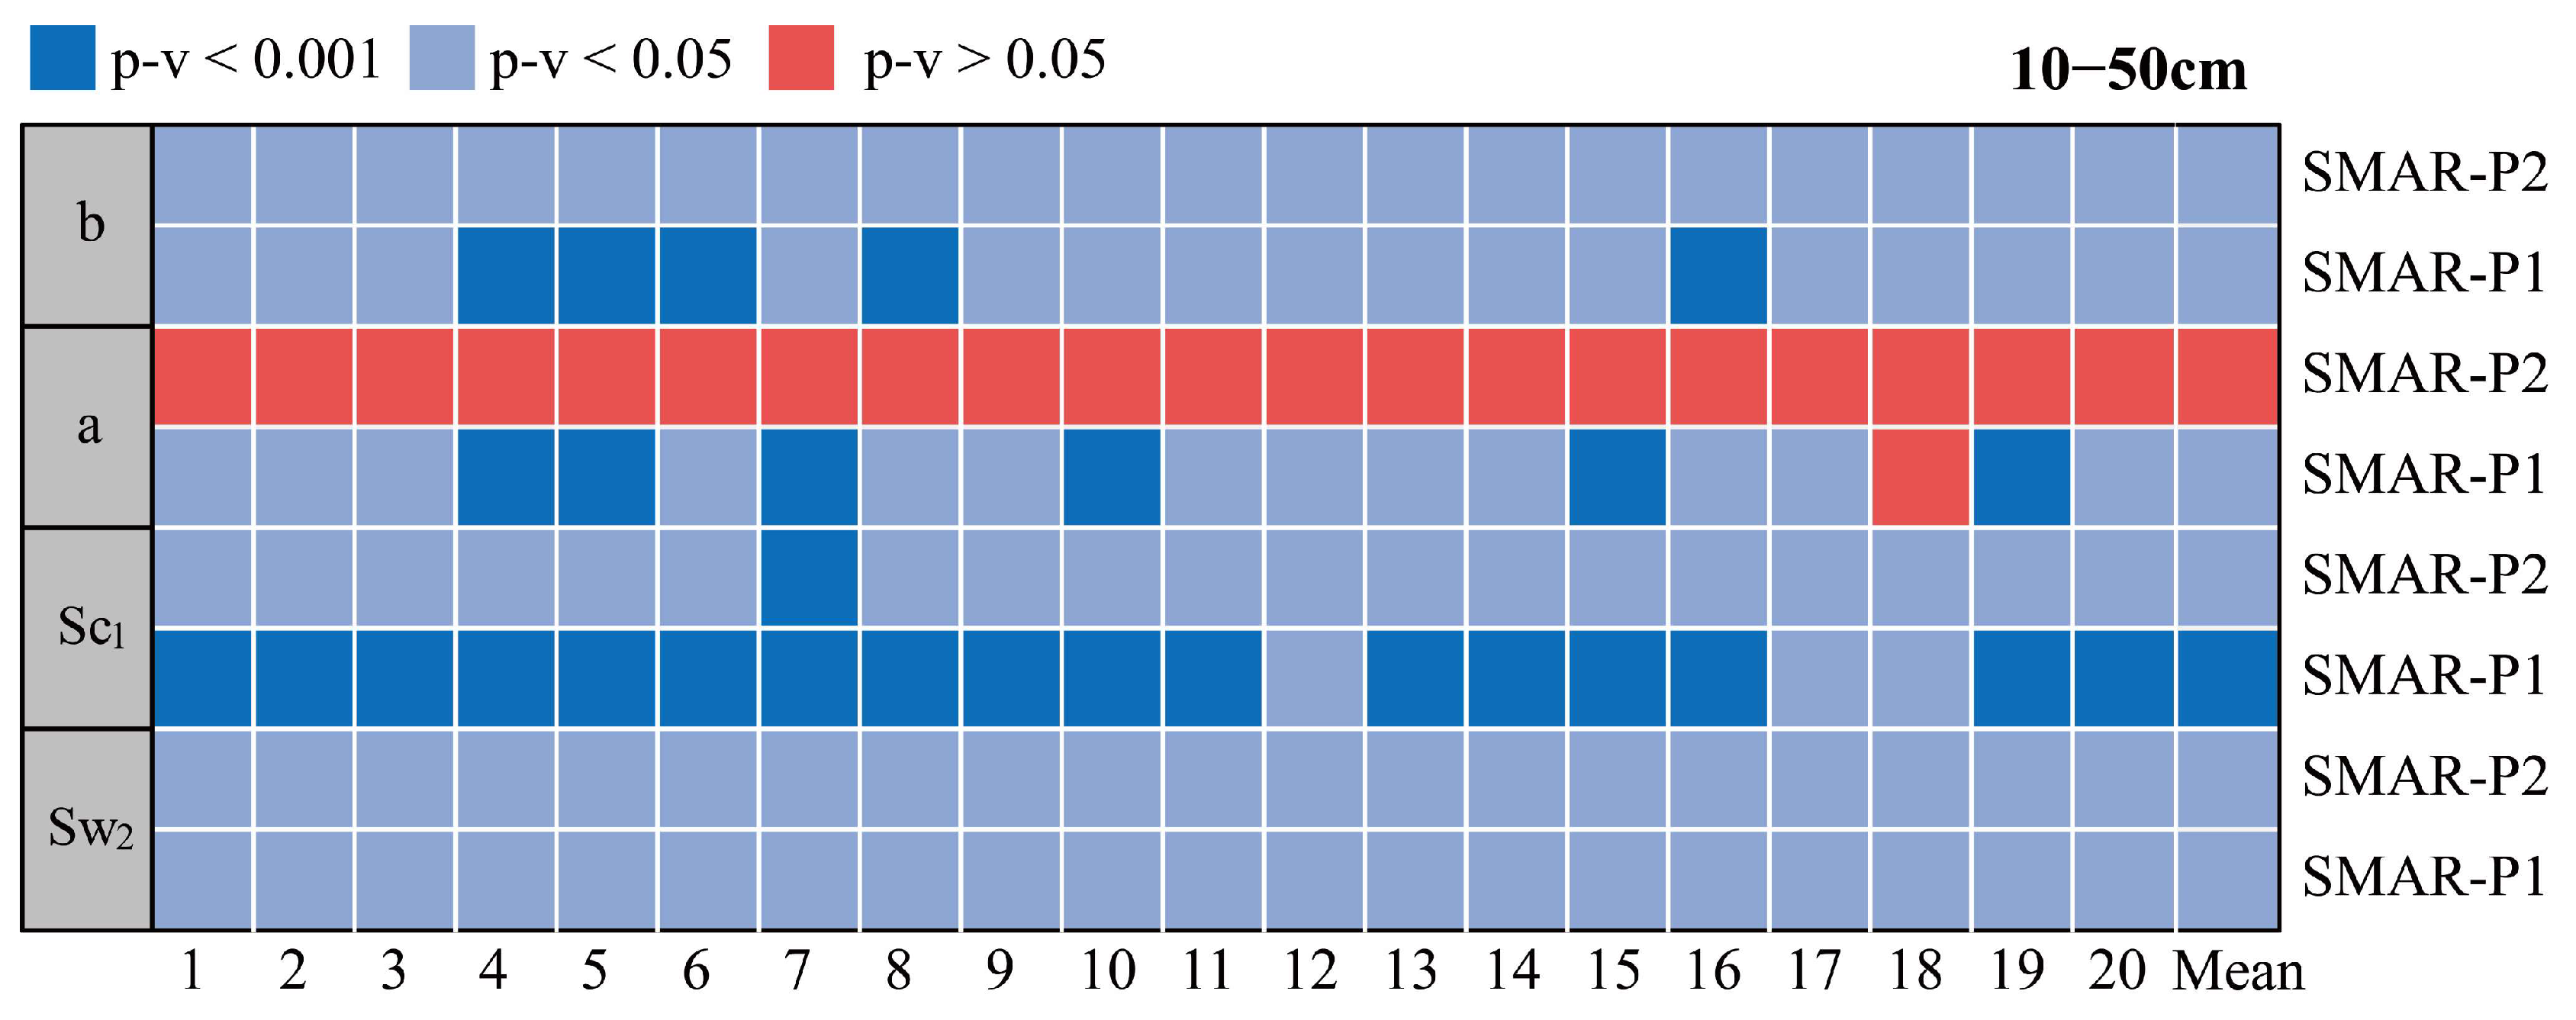
3.1. In-Site Simulation Results
3.2. Results of SMAR Parameters Regionalization
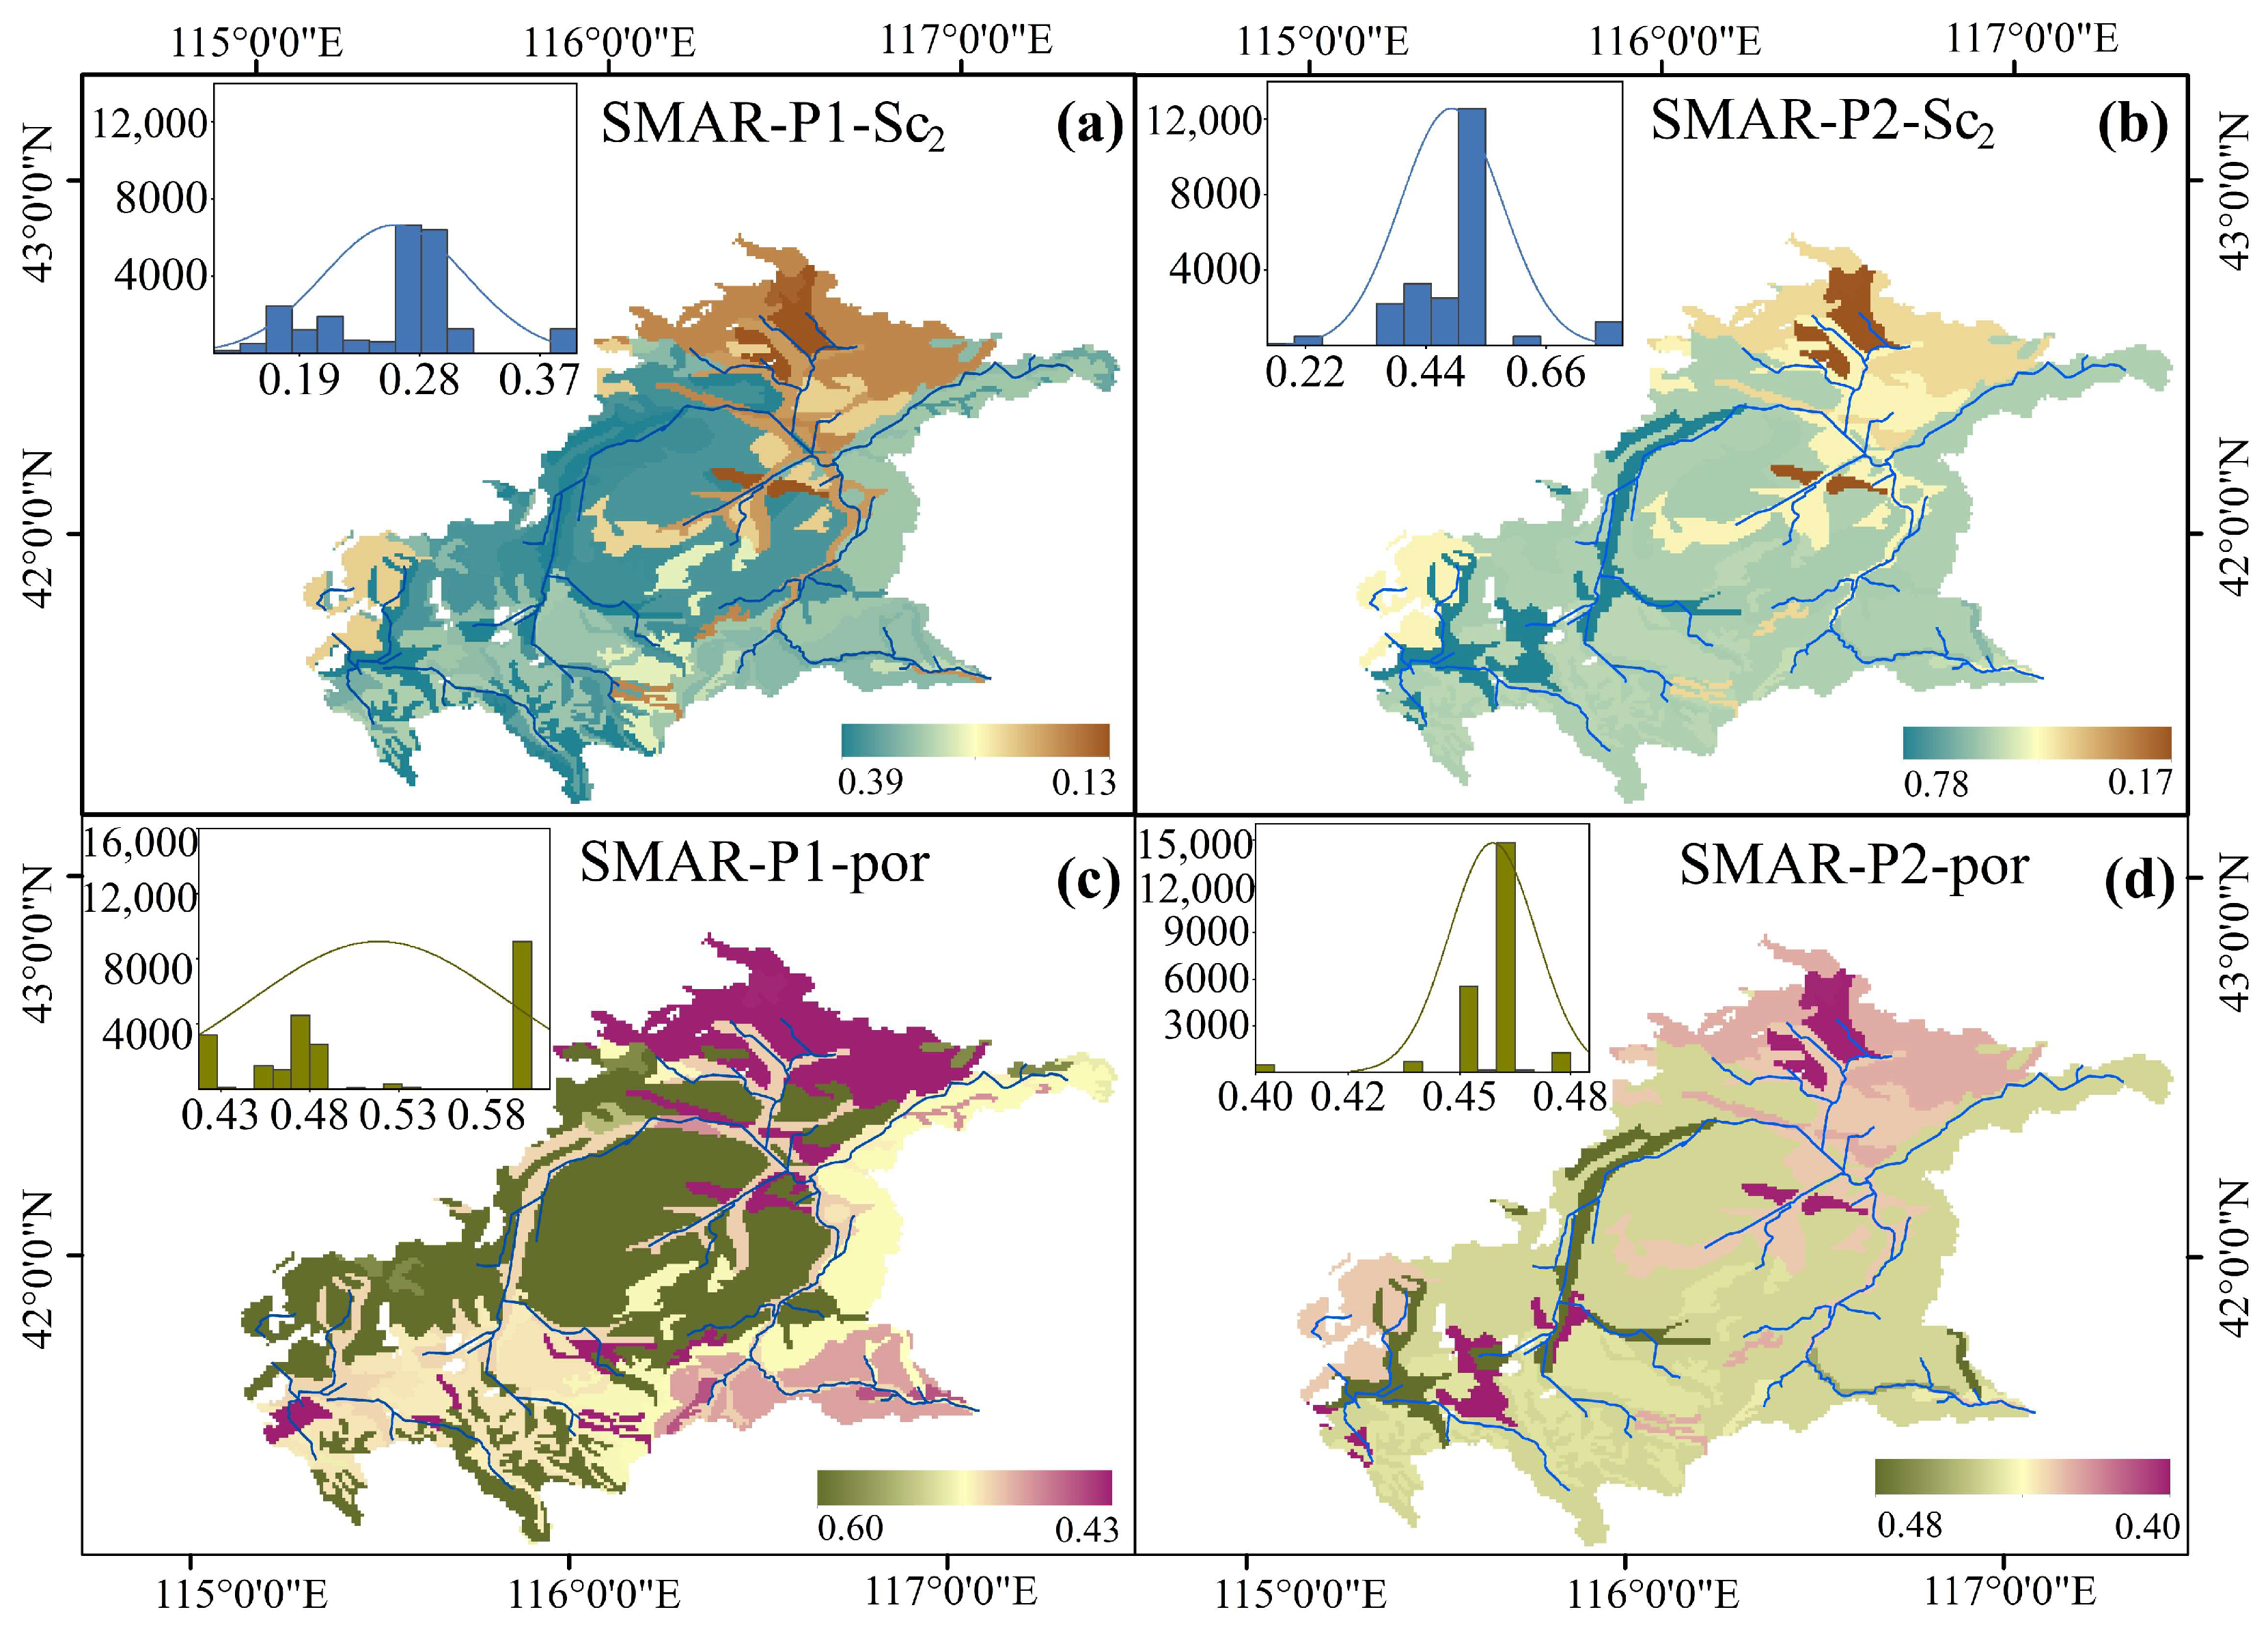
3.3. Regional Estimation of RZSM
4. Discussion
4.1. Applicability of the SMAR Model at Different Root Depths
4.2. Multivariate Modeling Analysis
4.3. Regional RZSM Error Analysis
5. Conclusions
Supplementary Materials
Author Contributions
Funding
Data Availability Statement
Acknowledgments
Conflicts of Interest
References
- Pablos, M.; González-Zamora, Á.; Sánchez, N.; Martínez-Fernández, J. Assessment of Root Zone Soil Moisture Estimations from SMAP, SMOS and MODIS Observations. Remote Sens. 2018, 10, 981. [Google Scholar] [CrossRef]
- El Hajj, M.; Baghdadi, N.; Zribi, M.; Belaud, G.; Cheviron, B.; Courault, D.; Charron, F. Soil moisture retrieval over irrigated grassland using X-band SAR data. Remote Sens. Environ. 2016, 176, 202–218. [Google Scholar] [CrossRef]
- Rigden, A.J.; Rigden, N.; Mueller, N.; Holbrook, N.; Pillai, P.; Huybers, P. Combined influence of soil moisture and atmospheric evaporative demand is important for accurately predicting us maize yields. Nat. Food 2020, 1, 127–133. [Google Scholar] [CrossRef] [PubMed]
- Seneviratne, S.; Corti, T.; Davin, E.; Hirschi, M.; Jaeger, E.; Lehner, L.; Orlowsky, B.; Teuling, A. Investigating soil moisture-climate interactions in a changing climate: A review. Earth-Sci. Rev. 2010, 99, 125–161. [Google Scholar] [CrossRef]
- Sheffield, J.; Wood, E. Global trends and variability in soil moisture and drought characteristics, 1950–2000, from observation-driven simulations of the terrestrial hydrologic cycle. J. Clim. 2008, 21, 432–458. [Google Scholar] [CrossRef]
- Wasko, C.; Nathan, R. Influence of changes in rainfall and soil moisture on trends in flooding. J. Hydrol. 2019, 575, 432–441. [Google Scholar] [CrossRef]
- Dorigo, W.; Wagner, W.; Albergel, C.; Albrecht, F.; Balsamo, G.; Brocca, L.; Chung, D.; Ertl, M.; Forkel, M.; Gruber, A.; et al. ESA CCI Soil Moisture for improved Earth system understanding: State-of-the art and future directions. Remote Sens. Environ. 2017, 203, 185–215. [Google Scholar] [CrossRef]
- Kerr, Y.H.; Waldteufel, P.; Richaume, P.; Wigneron, J.P.; Ferrazzoli, P.; Mahmoodi, A.; Bitar, A.A.; Cabot, F.; Gruhier, C.; Juglea, S.E.; et al. The SMOS soil moisture retrieval algorithm. IEEE Trans. Geosci. Remote Sens. 2012, 50, 1384–1403. [Google Scholar] [CrossRef]
- Das, N.N.; Entekhabi, D.; Dunbar, R.S.; Colliander, A.; Chen, F.; Crow, W.; Jackson, T.J.; Berg, A.; Bosch, D.D.; Caldwell, T.; et al. The SMAP mission combined active-passive soil moisture product at 9 km and 3 km spatial resolutions. Remote Sens. Environ. 2018, 211, 204–217. [Google Scholar] [CrossRef]
- Yang, F.; Huang, M.; Li, C.; Wu, X.; Guo, T.; Zhu, M. Changes in soil moisture and organic carbon under deep-rooted trees of different stand ages on the Chinese Loess Plateau. Agric. Ecosyst. Environ. 2022, 328, 107855. [Google Scholar] [CrossRef]
- Liu, S.; Xing, B.; Yuan, G. Relationship analysis between soil moisture in root-zone and top-most layer in China. Chin. J. Plant Ecol. 2013, 37, 1–17. (In Chinese) [Google Scholar] [CrossRef]
- Mahmood, R.; Littell, A.; Hubbard, K.G.; You, J. Observed data-based assessment of relationships among soil moisture at various depths, precipitation, and temperature. Appl. Geogr. 2012, 34, 255–264. [Google Scholar] [CrossRef]
- Sun, L.; Seidou, O.; Nistor, I.; Goïta, K.; Magagi, R. Simultaneous assimilation of in situ soil moisture and streamflow in the SWAT model using the Extended Kalman Filter. J. Hydrol. 2016, 543, 671–685. [Google Scholar] [CrossRef]
- Seo, E.; Lee, M.I.; Reichle, R.H. Assimilation of SMAP and ASCAT soil moisture retrievals into the JULES land surface model using the Local Ensemble Transform Kalman Filter. Remote Sens. Environ. 2021, 253, 112222. [Google Scholar] [CrossRef]
- Liu, J.; Rahmani, F.; Lawson, K.; Shen, C. A multiscale deep learning model for soil moisture integrating satellite and in situ data. Geophys. Res. Lett. 2022, 49, e2021GL096847. [Google Scholar] [CrossRef]
- Grillakis, M.; Koutroulis, A.; Alexakis, D. Regionalizing root-zone soil moisture estimates from ESA CCI Soil Water Index using machine learning and information on soil, vegetation, and climate. Water Resour. Res. 2021, 57, e2020WR029249. [Google Scholar] [CrossRef]
- Ebrahim, B.; Sidike, P.; Nahian, S.; Devabhaktuni, V.; Markus, T. Estimation of root-zone soil moisture from ground and remotely sensed soil information with multi-sensor data fusion and automated machine learning. Remote Sens. Environ. 2021, 260, 112434. [Google Scholar]
- Wagner, W.; Lemoine, G.; Rott, H. A Method for Estimating Soil Moisture from ERS Scatterometer and Soil Data. Remote Sens. Environ. 1999, 70, 191–207. [Google Scholar] [CrossRef]
- Albergel, C.; Rüdiger, C.; Pellarin, T. From near-surface to root-zone soil moisture using an exponential filter: An assessment of the method based on in-situ observations and model simulations. Hydrol. Earth Syst. Sci. 2008, 12, 1323–1337. [Google Scholar] [CrossRef]
- Manfreda, S.; Brocca, L.; Moramarco, T. A physically based approach for the estimation of root-zone soil moisture from surface measurements. Hydrol. Earth Syst. Sci. 2014, 18, 1199–1212. [Google Scholar] [CrossRef]
- Faridani, F.; Farid, A.; Ansari, H. A modified version of the SMAR model for estimating root-zone soil moisture from time-series of surface soil moisture. Water SA 2017, 43, 492–498. [Google Scholar] [CrossRef]
- Wang, Y. Root-Zone Soil Moisture Retrieval Based on Surface Soil Moisture Observations. Master’s Thesis, Hebei GEO University, Shijiazhuang, China, 2022. (In Chinese). [Google Scholar]
- Du, X.; Fang, X.; Wang, W. Estimation of soil moisture in root-zone of semiarid area based on SMAR model. Res. Soil Water Conserv. 2020, 27, 119–127+133. (In Chinese) [Google Scholar]
- Das, N.; Mohanty, B.; Cosh, M. Modeling and assimilation of root-zone soil moisture using remote sensing observations in Walnut Gulch Watershed during SMEX04. Remote Sens. Environ. 2008, 112, 415–429. [Google Scholar] [CrossRef]
- Lv, H.; Yu, Z.; Zhu, Y. Dual state-parameter estimation of root-zone soil moisture by optimal parameter estimation and extended Kalman filter data assimilation. Adv. Water Resour. 2011, 34, 395–406. [Google Scholar]
- Tian, J.; Han, Z.; Bogena, H. Estimation of subsurface soil moisture from surface soil moisture in cold mountainous areas. Hydrol. Earth Syst. Sci. 2020, 24, 4659–4674. [Google Scholar] [CrossRef]
- Reichstein, M.; Camps-Valls, G.; Stevens, B. Deep learning and process understanding for data-driven Earth system science. Nature 2019, 566, 195–204. [Google Scholar] [CrossRef] [PubMed]
- Farokhi, M.; Ansary, H.; Faridhosseini, A. Estimation of Soil Moisture using Downscaling Soil Moisture Method of Microwave Sensor and the SMAR Model (A Case Study: Rafsanjan Plain). JWSS-Isfahan Univ. Technol. 2020, 24, 133–144. [Google Scholar]
- Gheybi, F.; Paridad, P.; Faridani, F.; Farid, A.; Pizarro, A.; Fiorentino, M.; Manfreda, S. Soil moisture monitoring in Iran by implementing satellite data into the root-zone SMAR model. Hydrology 2019, 6, 44. [Google Scholar] [CrossRef]
- Fan, J.; Wang, Q.; Wang, Y. Simulated effects of texture and rooting depth on soil moisture sensor placement. J. Drain. Irrig. Mach. Eng. 2013, 31, 70–74. (In Chinese) [Google Scholar]
- Zhuang, R.; Zeng, Y.; Manfreda, S. Quantifying Long-Term Land Surface and Root-Zone Soil Moisture over Tibetan Plateau. Remote Sens. 2020, 12, 509. [Google Scholar] [CrossRef]
- Baldwin, D.; Manfreda, S.; Lin, H.; Smithwick, E. Estimating Root-Zone Soil Moisture Across the Eastern United States with Passive Microwave Satellite Data and a Simple Hydrologic Model. Remote Sens. 2019, 11, 2013. [Google Scholar] [CrossRef]
- Fischer, G.; Nachtergaele, F.; Prieler, S.; Van Velthuizen, H.T.; Verelst, L.; Wiberg, D. Global Agro-Ecological Zones Assessment for Agriculture (GAEZ 2008); IIASA: Laxenburg, Austria; FAO: Rome, Italy, 2008. [Google Scholar]
- Rawls, W.J.; Ahuja, L.R.; Brakensiak, D.L.; Shirmohammadi, A. Infiltration and Soil Water Movement. In Handbook of Hydrology; McGraw-Hill Education: New York, NY, USA, 1993. [Google Scholar]
- Zhao, T.; Shi, J.; Lv, L. Soil moisture experiment in the Luan River supporting new satellite mission opportunities. Remote Sens. Environ. 2020, 240, 111680. [Google Scholar] [CrossRef]
- Zheng, J.; Zhao, T.; Lv, H.; Shi, J.; Cosh, M.H.; Ji, D.; Jiang, L.; Cui, Q.; Lu, H.; Yang, K.; et al. Assessment of 24 soil moisture datasets using a new in situ network in the Shandian River Basin of China. Remote Sens. Environ. 2022, 271, 112891. [Google Scholar] [CrossRef]
- Zhao, T.; Shi, J.; Xu, H.; Sun, Y.; Chen, D.; Cui, Q.; Jia, L.; Huang, S.; Niu, S.; Li, X.; et al. Comprehensive remote sensing experiment of water cycle and energy balance in the Shandian river basin. Natl. Remote Sens. Bull. 2021, 25, 871–887. (In Chinese) [Google Scholar] [CrossRef]
- Nadeem, A.A.; Zha, Y.; Shi, L.; Ran, G.; Ali, S.; Jahangir, Z.; Afzal, M.M.; Awais, M. Multi-Scale Assessment of SMAP Level 3 and Level 4 Soil Moisture Products over the Soil Moisture Network within the ShanDian River (SMN-SDR) Basin, China. Remote Sens. 2022, 14, 982. [Google Scholar] [CrossRef]
- Dai, Y.; Shangguan, W.; Duan, Q. Development of a China Dataset of Soil Hydraulic Parameters Using Pedotransfer Functions for Land Surface Modeling. J. Hydrometeorol. 2013, 14, 869–887. [Google Scholar] [CrossRef]
- Shangguan, W.; Dai, Y.; Liu, B. A China Dataset of Soil Properties for Land Surface Modeling. J. Adv. Model. Earth Syst. 2013, 5, 212–224. [Google Scholar] [CrossRef]
- Yan, F.; Shangguan, W.; Zhang, J.; Hu, B. Depth-to-bedrock map of China at a spatial resolution of 100 meters. Earth Syst. Sci. Data Discuss. 2018; 1–27, preprint. [Google Scholar]
- Peng, S. 1-km Monthly Potential Evapotranspiration Dataset in China (1990–2021); National Tibetan Plateau Data Center: Beijing, China, 2022. [Google Scholar]
- Zheng, C.; Jia, L.; Zhao, T. Global Daily Surface Soil Moisture Dataset at 1-km Resolution (2000–2020); National Tibetan Plateau/Third Pole Environment Data Center: Beijing, China, 2022. [Google Scholar] [CrossRef]
- Zheng, C.; Jia, L.; Zhao, T. A 21-year dataset (2000–2020) of gap-free global daily surface soil moisture at 1-km grid resolution. Sci. Data 2023, 10, 139. [Google Scholar] [CrossRef]
- Heber Green, W.; Ampt, G. Studies on Soil Phyics. J. Agric. Sci. 1911, 4, 1–24. [Google Scholar] [CrossRef]
- Baldwin, D.; Manfreda, S.; Keller, K.; Smithwick, E.A.H. Predicting root zone soil moisture with soil properties and satellite near-surface moisture data across the conterminous United States. J. Hydrol. 2017, 546, 393–404. [Google Scholar] [CrossRef]
- Xu, X.; Guan, H.; Skrzypek, G.; Simmons, C.T. Root-zone moisture replenishment in a native vegetated catchment under Mediterranean climate. Hydrol. Processes 2019, 33, 2394–2407. [Google Scholar] [CrossRef]
- Jia, Y.; Shao, M.; Jia, X. Spatial pattern of soil moisture and its temporal stability within profiles on a loessial slope in northwestern China. J. Hydrol. 2013, 495, 150–161. [Google Scholar] [CrossRef]
- Jia, J.; Fu, Z.; Chen, H. Effect of irregular bedrock topography on the soil profile pattern of water content in a Karst hillslope. Chin. J. Appl. Ecol. 2016, 27, 1708–1714. [Google Scholar]
- Fan, Y.; Miguez-Macho, G.; Jobbágy, E.G.; Jackson, R.B.; Otero-Casal, C. Hydrologic regulation of plant rooting depth. Proc. Natl. Acad. Sci. USA 2017, 114, 10572–10577. [Google Scholar] [CrossRef]
- Rahardjo, H.; Nistor, M.M.; Gofar, N.; Satyanaga, A.; Qin, X.; Chui Yee, S.I. Spatial distribution, variation and trend of five-day antecedent rainfall in Singapore. Georisk Assess. Manag. Risk Eng. Syst. Geohazards 2020, 14, 177–191. [Google Scholar] [CrossRef]


| Multivariate Linear Regression Function | R2 | p-v | |
|---|---|---|---|
| Sw2 | −0.15 + 0.2 * BD10–50 + 0.003 * DtB | 0.40 | 0.007 |
| Sc1 | −0.22 + 0.007 * DtB − 0.01 * silt 0–10 + 0.02 * silt 10–50 | 0.56 | 0.002 |
| a | 0.85 − 1.68 * BD0–10 + 1.07 * BD10–50 − 0.002 * DtB + 0.002 * sand10–50 | 0.63 | 0.001 |
| b | −0.43 + 0.12 * BD10–50 + 0.001 * DtB + 0.006 * PET | 0.52 | 0.002 |
Disclaimer/Publisher’s Note: The statements, opinions and data contained in all publications are solely those of the individual author(s) and contributor(s) and not of MDPI and/or the editor(s). MDPI and/or the editor(s) disclaim responsibility for any injury to people or property resulting from any ideas, methods, instructions or products referred to in the content. |
© 2023 by the authors. Licensee MDPI, Basel, Switzerland. This article is an open access article distributed under the terms and conditions of the Creative Commons Attribution (CC BY) license (https://creativecommons.org/licenses/by/4.0/).
Share and Cite
Liu, Y.; Li, T.; Zhang, W.; Lv, A. Regionalization of Root Zone Moisture Estimations from Downscaled Surface Moisture and Environmental Data with the Soil Moisture Analytical Relationship Model. Water 2023, 15, 4133. https://doi.org/10.3390/w15234133
Liu Y, Li T, Zhang W, Lv A. Regionalization of Root Zone Moisture Estimations from Downscaled Surface Moisture and Environmental Data with the Soil Moisture Analytical Relationship Model. Water. 2023; 15(23):4133. https://doi.org/10.3390/w15234133
Chicago/Turabian StyleLiu, Yonghao, Taohui Li, Wenxiang Zhang, and Aifeng Lv. 2023. "Regionalization of Root Zone Moisture Estimations from Downscaled Surface Moisture and Environmental Data with the Soil Moisture Analytical Relationship Model" Water 15, no. 23: 4133. https://doi.org/10.3390/w15234133
APA StyleLiu, Y., Li, T., Zhang, W., & Lv, A. (2023). Regionalization of Root Zone Moisture Estimations from Downscaled Surface Moisture and Environmental Data with the Soil Moisture Analytical Relationship Model. Water, 15(23), 4133. https://doi.org/10.3390/w15234133