Article

Assessing Water Quality Dynamics in Tidally Influenced Blackwater Rivers along a Rural–Urban Gradient

by
Taryn M. Chaya
1,2,*,
Tracey B. Schafer
1,2 and
Todd Z. Osborne
1,2
1
Whitney Laboratory for Marine Bioscience, University of Florida, St. Augustine, FL 32080, USA
2
Soil, Water, and Ecosystem Sciences Department, University of Florida, Gainesville, FL 32611, USA
*
Author to whom correspondence should be addressed.
Water 2023, 15(23), 4154; https://doi.org/10.3390/w15234154
Submission received: 24 October 2023 / Revised: 27 November 2023 / Accepted: 29 November 2023 / Published: 30 November 2023
(This article belongs to the Section Water Quality and Contamination)

Abstract

:
The aim of this research was to identify the impacts of land use and subsequent pulse-driven events on water quality across a gradient of urbanization spanning three blackwater rivers in northeast Florida that contribute to a common estuary ecosystem. Three blackwater rivers in St. Augustine, FL, were classified as rural, suburban, and urban, based on percentages of residential, industrial, and commercial parcel type. Turbidity, dissolved oxygen, fluorescent dissolved organic matter, chlorophyll a, salinity, and pH were measured at 15 min intervals from May to December 2020. Monthly phosphate, nitrate, ammonium, total coliforms, and E. coli concentrations were also examined. Principal component analyses identified the distance to the freshwater source, distance to the inlet, salinity, dissolved oxygen, and pH as major sources of variance between the sites. Significant physicochemical differences between sites are more likely due to a site’s proximity to an inlet or freshwater source, rather than the percent of urban parcels, and site distance to freshwater and saltwater influences should be considered due to its influence on water quality in estuarine systems. This study provides insight into potential water quality responses to urbanization, or lack thereof, and addresses challenges in selecting the optimal site locations for long-term in situ water quality monitoring studies of urbanization in blackwater rivers.

1. Introduction

Florida’s population is rapidly increasing, with roughly 800 people projected to migrate everyday between 2022 and 2027 [1]. Urban growth models predict that the urbanization extent in the southeastern United States will increase by 101% to 192% in the next 50 years [2]. Florida’s economy relies substantially on eco-tourism, and leverages public appreciation of springs, beaches, rivers, and other water resources. However, urban development in Florida has significantly decreased the area of natural habitat, exacerbated ecosystem fragmentation, and degraded the quantity and quality of natural resources.
Urbanization modifies the landscape through increased infrastructure development, energy and resource consumption, and nonpoint and point pollutant sources [3,4]. Poor water quality, characterized by nutrient and contaminant loading, is a major consequence of urban development. Heavy metals, pharmaceuticals, plastics, pesticides, and fertilizers that alter ecosystem biogeochemistry and function are released through urban stormwater [5,6,7,8,9], and ample literature suggests contaminant loading increases with urbanization and impervious coverage [10,11,12,13,14]. Increased impervious surface coupled with the removal of vegetation and smoothing of the topography, promotes swift surface flow that picks up dissolved and particulate matter, such as nutrients, oils, sediment, and dissolved metals [15,16]. Particularly after rainfall events, anthropogenically sourced fertilizers, pet waste, and sediments can contribute to nutrient loading events, high turbidity, or increased inputs of organic matter due to impervious surfaces and their effect on the local hydrology [12,17,18,19,20,21,22]. Rural landscapes also have sources of pollution, such as wastes from animals or septic tanks; however, pollutant discharge is typically not as extreme, and the absence of impervious infrastructure allows watershed inputs after rain events to occur more gradually. Pollutant loading brought on by increased stormwater runoff can cause detrimental ecological effects; for example, increased turbidity and total suspended solids can inhibit light penetration for submerged aquatic organisms, additional labile organic matter inputs can encourage decomposition and subsequent dissolved oxygen depletion, and inputs of fecal matter can cause serious illness [23,24]. Therefore, it is important to determine and understand the effects of hydrological flashiness on local aquatic systems so that management strategies can be implemented to prevent further pollutant loading.
Globally, many studies have been conducted to understand how urbanization affects local water quality; however, limited research related to this topic is available for the tidally influenced blackwater systems of northeast Florida. Blackwater river systems are characterized by high dissolved organic matter loads that deliver tannins, humic and fulvic acids, and color to the estuary. Freshwater flow from the blackwater rivers moves nutrients, sediments, and organic material that are important to the biogeochemical cycling of estuaries, but they also transport many of the anthropogenic pollutants previously mentioned [25]. Meanwhile, the tidal cycle also influences water quality and may mask runoff properties [26,27,28]. Tidal amplitude, estuary length, current speed, and the degree of vertical mixing are examples of estuarine characteristics that control flushing, or residence times [29,30]. The natural tidal process can impact several water quality parameters, such as turbidity, dissolved oxygen, chlorophyll-a, dissolved organic matter, and pH, by regulating the presence or absence of suspended particulates, organic matter, nutrients, and carbonates [31,32]. As an effect, incoming constituents from pulse-driven events may be transported or transformed quickly.
This study had two goals: (1) to understand patterns between land use and water quality of brackish rivers in northeast Florida through in situ water monitoring, and (2) to emphasize the importance of site location and sampling protocol for tidally influenced study sites aiming to observe specific water quality characteristics, such as those brought by urbanization.

2. Materials and Methods

This study was conducted from May to December 2020, in three blackwater rivers near St. Augustine in northeast Florida: (1) the Urban site, located in the San Sebastian River; (2) the Suburban site, located in Moultrie Creek; and (3) the Rural site, located in Pellicer Creek. Five supplemental sites were added to further understand of the relationship between local water quality, and tidal influence: Inlet, Estuarine, GTM Inlet, GTM Urban, and GTM Rural (Figure 1). Sites prefixed with ‘GTM’ were managed by the Guana Tolomato Matanzas National Estuarine Research Reserve (GTMNERR). All sites experience semidiurnal tidal fluctuation, ranging from approximately 0.35 to 1.5 m [33]. The study area includes two inlets—the St. Augustine Inlet, adjacent to the St. Augustine historic district, and the Matanzas Inlet, located approximately 28 km south. The inlets are connected via the Matanzas River, a well-mixed estuary. The St. Augustine Inlet was altered and modified with jetties in the 20th century to improve navigation, while the Matanzas Inlet remains unchanged [34]. Each blackwater river is a major tributary of the Matanzas River, which is routinely dredged to accommodate navigation. The site climates are temperate, and June to September is the wet season with an average rainfall of 140 cm annually [35].
Site distances to the freshwater and saltwater source were determined in Google Earth Pro© (Ver. 7.3.3.7786). The freshwater threshold was defined by the transition of the creek headwaters into predominantly forested vegetation. The saltwater source was defined as the mouth of the nearest inlet. Site distances are plotted according to their distance to the closest freshwater and saltwater source (Figure 2).
Percentage urban land use for this study was categorized by using land use data provided by the State of Florida’s Department of Revenue and the Water Body IDs (WBID) delineated by the Florida Department of Environmental Protection, which were then compiled by the GTMNERR into a map in ArcGIS [36]. Upper and lower watershed areas of each blackwater river were included in the representation for each site (e.g., Upper Moultrie Creek and lower Moultrie Creek for the Suburban site). The approximate total watershed areas for each urbanization category are as follows: Urban (15,560,000 acres), Suburban sites (50,285,000), and Rural sites (16,076,000). Each parcel type percentage for a site was calculated by dividing the acreage of parcel type by the overall area of the blackwater river’s watershed. Total urban land use was the sum of the residential, commercial, and industrial parcel areas. (Table 1). The contributing watershed area for each site in the same blackwater river (e.g., Rural and GTM Rural) is naturally different, but could not be quantified with the available data.
Multi-parameter water sondes (EXO2, YSI, Inc., Yellow Springs, OH, USA) were used to collect turbidity, DO, pH, chlorophyll-a, specific conductivity, salinity, fluorescent dissolved organic matter (FDOM), and temperature readings. The GTMNERR’s water quality sondes do not have FDOM sensors; therefore, the site names beginning with ‘GTM’ are not included with FDOM results. Measurements were taken at 15 min intervals, from May 2020 to December 2020. All sonde probes were calibrated with recommended standards and protocols every two weeks to limit sensor drift and inaccurate readings [37]. Furthermore, sonde data was run through the Centralized Data Management Office database used by all National Estuarine Research Reserves (NERR) to validate data and/or flag data that may be exceeding typical probe ranges. In the event of probe malfunction, the data for that sampling period was not used. The GTMNERR collected monthly ammonium, nitrate, and ortho-phosphate concentrations at the GTM Urban and GTM Rural sites, in accordance with NERR sampling guidelines [38]. The GTMNERR does not have a sonde or sampling site in the suburban blackwater river, so only the two endmembers could be examined for those site names preceding with ‘GTM’. The GTMNERR also measures meteorological information approximately 4 km from the downstream GTM Rural site [39]. Total precipitation values (cm), taken at 15 min intervals, were used to assess rainfall. All GTMNERR data incorporated into this study, including sonde, nutrient, and meteorological data, is publicly available through the surface water monitoring program (SWMP) website [40].
Grab samples were collected once a month from June to December 2020 at the water column surface opportunistically in high-density polyethylene 125 mL and 1 L bottles for fecal indicator analysis. Total coliforms and E. coli were measured using IDEXX® Sealer and Colilert-18 test kit (IDEXX Laboratories, Inc., Westbrook, ME, USA). Defined Substrate Technology (DST) nutrient-indicators detect the presence or absence of fecal matter. A reagent including the nutrient indicators, ortho-nitrophenyl-β-d-galactopyranoside (ONPG) and 4-methylumbelliferyl-β-d-glucuronide (MUG), are added to the collected water samples. Total and fecal coliforms metabolize ONPG using β-galactosidase enzymes and produce a yellow color. E. coli metabolize MUG with β-glucuronidase enzymes and produce fluorescence. Saline samples (>10 ppt) underwent a 1:20 dilution to reduce salinity interference with the added enzymes. Water samples are added to a Quanti-Tray, sealed, and incubated at 35 ± 0.5 °C for 18 h. Fluorescence was determined with a 6-watt, 365 nm UV light in a dark environment. The Quanti-Tray well count presence of a yellow color and/or fluorescence was determined. To quantify the concentration of total coliforms and E. coli per 100 mL, a Most Probable Number (MPN) is determined based on the count of positive wells. The MPN table was provided by IDEXX Laboratories, Inc. (Westbrook, ME, USA).
Statistical analyses were completed in the statistical program, R© (Ver. 1.3.1093, R Foundation for Statistical Computing, Vienna, Austria). Study period means and standard deviations were determined for all parameters (Table 2, n = 121,216). Mean values are listed with plus or minus one standard deviation. Two 10-day events during the data collection period were selected to magnify any patterns between site location and parameter response. The first notable weather event was a Nor’easter (a storm characterized by north-easterly winds on the U.S. East Coast) that occurred 19–21 September 2020, where winds reached up to 49 mph in the study region and the area experienced roughly 6.5 cm of rainfall. Tides were measured to be approximately 1 ft above normal high tide for the time period selected. The second event were three separate rain events that occurred 1–10 November 2020. Rainfall events on 1, 5, and 9 November, brought approximately 2 cm of rainfall each. The wind and rain events associated with the nor’easter were more persistent over a period of four days, unlike the November rain events which lasted roughly two to three hours for each event. A Kruskal–Wallis non-parametric test (α < 0.05) was used to compare parameters three days before and after the Nor’easter event and the 5 November rainfall event (n = 290). A correlation matrix provided Spearman correlation coefficients between each water quality parameter (Table 3).
A principal component analysis (PCA) was used to understand the relationships between variables and identify which independent variables (i.e., major principal components) produced the most variation in the dataset [41,42,43,44]. Average monthly values for each parameter were used for each site in the analysis (n = 8). Two primary principal component analyses were focused on: one that considered only the Urban, Suburban, and Rural sites to understand potential land use-driven differences, and another that considered all sites. The variables included in both analyses were: pH, turbidity, DO, chlorophyll-a, salinity, distance to freshwater, and distance to inlet. In the PCA including all sites, FDOM was not included because the GTM sites do not have FDOM sensors, as previously mentioned. Biplots were graphed with each associated PCA to visualize the variance among variables and sites.

3. Results

3.1. Physicochemical Parameter Response

Mean salinities were highest for GTM Inlet and Inlet, and lowest for the Rural site, indicative of their location along the aquatic continuum. Similarly, average DO and pH values increased with salinity, where DO was greater than 85% saturation and pH was at least 7.80 at the most saline sites (>29 ppt). Conversely, the Rural site had the lowest average pH and DO concentrations. The Inlet sites had the highest average turbidity, while the Rural sites had the lowest. Chlorophyll-a was highest in the sites furthest from the inlet.
FDOM values were negatively correlated with salinity. The Rural site, furthest from the inlet, had the highest average FDOM, followed by the Suburban site, the Estuarine site, the Urban site, and the Inlet site. FDOM standard deviations were highest for the Suburban site and the Estuarine site (Table 2). Considering the water and land use properties typical of blackwater rivers at the Rural sites, trends between DO, FDOM, and pH, are likely due to the naturally occurring inputs of organic matter and their subsequent decomposition.
A correlation analysis showed strong relationships in salinity, pH, DO, and temperature. Salinity and pH have a strong positive correlation (R2 = 0.93). DO has positive correlations with salinity (R2 = 0.82) and pH (R2 = 0.82). Furthermore, there is an inverse relationship between FDOM and salinity (R2 = −0.93), pH (R2 = −0.81), and % DO (R2 = −0.77). Turbidity had no relationships with the other parameters. Chlorophyll-a, a parameter that is sometimes associated with eutrophication, was not correlated with pH, FDOM, or DO.
The Kruskal–Wallis test indicated no significant differences in turbidity or FDOM before and after both weather events, suggesting FDOM and turbidity was correlated more with salinity and the tidal influence, than the percentage of urban parcels. pH exhibited significant differences before and after the rainfall events; however, significant differences were found for all sites. Thus, the influence of external natural processes (i.e., tidal influence, rainfall, and wind) were likely responsible rather than the level of urbanization.
Standard deviations and means of FDOM and turbidity for the Nor’easter and November rainfall events, with references to the percentage of Urban land and distances of each site to the freshwater and saltwater sources were determined for the sites that measure FDOM (Tables S3 and S4). The Urban, Suburban, and Estuarine sites, which are situated in the middle of the river–estuary continuum compared to the other sites (Figure 2), have the highest standard deviations for turbidity and FDOM during both events.
Monthly total coliform and E. coli data for the Urban, Suburban, and Rural sites suggest there is no correlation between fecal indicators and urbanization (Figure 3). The Rural site had the highest total coliform and E. coli numbers for most months; although, it is important to note the Rural site had been declared impaired for fecal coliforms since 1986 due to wild hog populations, septic tank usage, and agricultural activities [45,46]. Total coliforms and E. coli were notably high for the Rural site in August, exceeding the highest most probable number (>2419.6 MPN) for both analytes. The Suburban site’s E. coli numbers exceeded the Rural site on three occasions.

3.2. Nutrient Response

Differences in average inorganic nitrogen (NH4-N and NO3-N) between sites were minimal, the GTM Urban site had slightly higher ammonium (0.033 mg NH4-N/L) but lower nitrate (0.12 mg NO3-N/L), compared to GTM Rural (0.031 mg NH4-N/L and 0.14 mg NO3-N/L). Conversely, GTM Rural had higher average ortho-phosphate (0.043 mg P/L vs. 0.020 mg P/L), which can be sourced from natural sources (e.g., organic matter) or unnatural sources (e.g., septic tanks and fertilizers) [13].

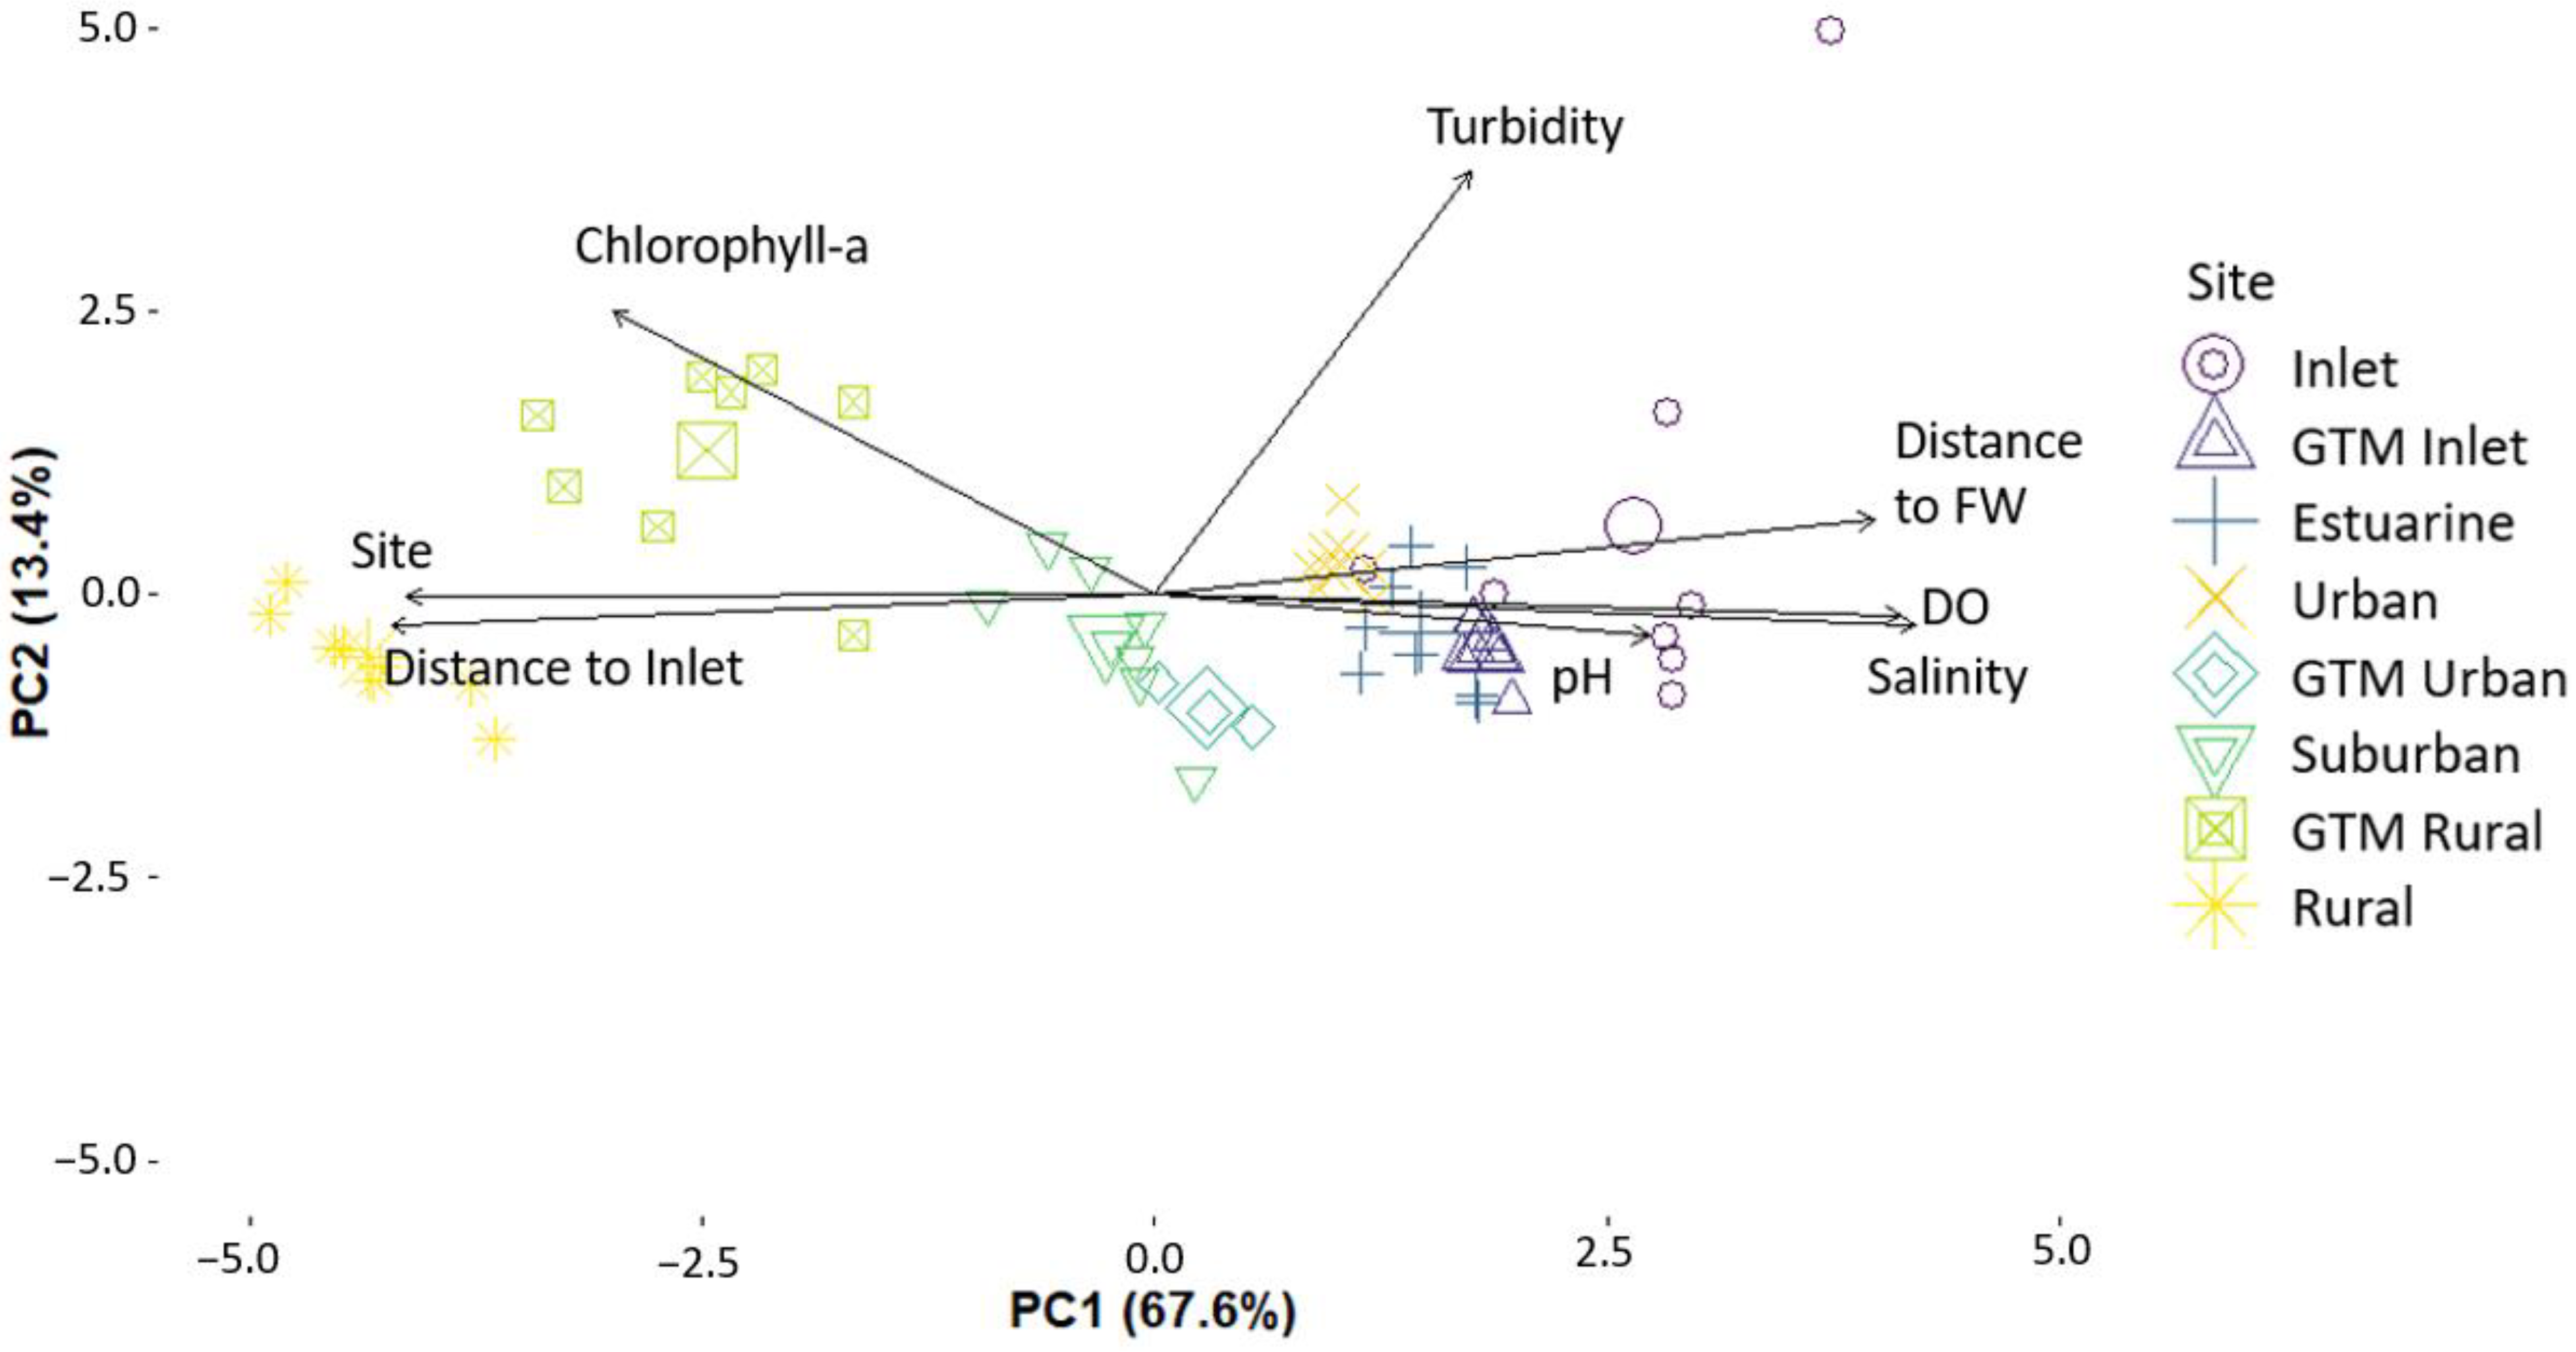
3.3. Principal Component Analysis

To first understand the relationship between land use and water properties, a PCA analyzing only the Urban, Suburban, and Rural sites yielded five principal components, where a combined 83.3% of the variation can be described in the first two components; principal component 1 (PC1) contributed 73.3% and principal component 2 (PC2) returned 10% of the variation (Figure 4). The PCA assessing all sites yielded five principal components, where the first two components accounted for 67.6% and 13.4% of the variation, respectively (Figure 5). In both PCA analyses, salinity, the distances to inlet and freshwater sources, DO, and FDOM contributed the most variation to PC1 (Table S5). The separation of sites closest to the inlet from those furthest reveals the site limitations in determining if effects of urbanization on water quality are present.

4. Discussion

Water quality parameters in urban areas were hypothesized to exhibit significant differences from the rural site, particularly following rainfall events, owing to the reduced infiltration capacity, altered hydrological pathways, and higher peak flow discharge that rapidly enters urban rivers [14,22,47]. This characteristic of urban hydrology suggests that turbidity, FDOM, and other physicochemical value ranges in estuaries adjacent to urbanized watersheds would be temporally distinct when compared to rural watersheds. The flashy nature of urban watersheds was thought to drive, to a large degree, the response variables measured by sondes. However, dramatic differences in water quality across this gradient was not observed readily upon analysis of the data collected in this study. Tidal flushing is thought to play a dominant role in site efficacy due to the site locations varying with respect to distance from fresh and salt-water inputs.

4.1. Nutrients

The inorganic nitrogen concentrations at GTM Urban did not suggest greater nitrogen loading compared to GTM Rural. Nitrate at both GTM Rural and GTM Urban was greater than ammonium concentrations, which is atypical compared to previous studies and what is known about the biogeochemical cycling of estuaries [27,48]. Fertilizer use, sewage effluent outputs, or other anthropogenic influences may contribute to the higher average nitrate concentrations [49,50,51]. Nitrate is quite mobile given its solubility, so runoff can transport large amounts following storm events [52,53]. Dissolved inorganic nitrogen often trends towards fluxing into coastal areas instead of remaining in the estuary during storm events [54]. Similarly, runoff caused by storm events has been found to double the amount of total particulate phosphorus entering river systems [55]. In Florida, roughly 80% of septic tanks are located near water bodies [56] and the properties around the Rural site are known to be mostly serviced by septic tank systems. Septic tanks add considerable amounts of phosphate in groundwater [52,57,58,59] and, like nitrate, it can create eutrophic conditions and increase biological oxygen demand. A prior study in this region utilizing GTM data came to a similar conclusion, where GTM Rural had higher total phosphorus concentrations than the more saline GTM Urban or GTM Inlet sites [27]. Other studies have also acknowledged an estuary’s dilution capacity for phosphorus and nitrogen compounds [27,48]. Notably, the publicly available nutrient dataset used in this study offers a small glimpse into the nutrient dynamics of these sites. Sites were only sampled for ammonium, nitrate, and ortho-phosphate once monthly, with replicates. Further research attempting to understand the nutrient dynamics along an aquatic continuum will require more frequent and extensive sampling efforts, expanded nutrient analyses (e.g., total dissolved nitrogen, total dissolved phosphorus), as well as opportunistic sampling before and after storm events.

4.2. Tidal Flushing

Correlation matrices show inverse relationships between DO and FDOM, and FDOM and salinity, indicative of the interconnectedness of DOM abundance, freshwater tendency, and biological oxygen demand particularly found in blackwater rivers. In blackwater river systems, particularly near the freshwater source, the high dissolved organic carbon concentrations can increase biological oxygen demand as microorganisms use oxygen and carbon as an electron acceptor and energy source, respectively [60,61,62]. The Rural site in Pellicer Creek is naturally enriched with high amounts of dissolved organic matter, and as flows transport the FDOM downstream, photolytic processes, tidal mixing and biological decomposition degrades labile dissolved organic matter resulting in the saline sites having the lowest measured FDOM values [63,64,65,66]. Strong correlations between DO, salinity, and FDOM, and a weak correlation between DO and chlorophyll-a, suggest DO is influenced more by salinity and FDOM concentrations—regulated by the distance to the inlet or freshwater source—rather than a proliferation of algae and other photosynthetic organisms that could be caused by urbanization-induced eutrophication. Positive correlations between DO, salinity, and pH were foreseeable, given the tidal influence that occurs at those sites closer to the inlet. The principal component analysis results also suggest that site differences are attributed to a site’s location along the aquatic continuum. Salinity, distance to the inlet, and distance to the freshwater source were the primary parameters that explained the variation between sites, suggesting that the sites’ location along the river-estuary continuum and not the degree of urbanization, is driving the water quality results in this study.
Although approximate residence times of each site are unknown, residence time indexes (RTI) were previously calculated for GTM Urban, GTM Rural, and GTM Inlet, based on weighted ratings of tidal excursion, freshwater flow, wind, and several other factors [27]. RTIs ranged from 1–4, where 1 indicated the lowest residence time and 4 was the highest. The results suggested GTM Urban and GTM Inlet have a RTI of 1, and GTM Rural has an RTI of 2. The findings stressed how the distance to the inlet and freshwater source alters the residence time of nutrients, chlorophyll-a, and dissolved organic matter, thus influencing the dynamics for the aforementioned parameters. Shortly after, a comprehensive three-dimensional tidal circulation model was developed to simulate flushing times for the same segments of the Matanzas River, often containing sites from this study [67]. Estimated flushing times are comparable to the residence time indices from the previous study: the segment near the St. Augustine Inlet, including sites GTM Urban and Urban sites, had the lowest flushing time of around 2 days. Segments near Matanzas Inlet (i.e., GTM Inlet and Inlet sites) had a flushing time between 3–4 days. Those sites furthest from either inlet had the longest flushing time, approximately two weeks. The calculated flushing times from both studies in the region support the observations that the Urban and Inlet sites experience tidal flushing that can diminish, or remove, discrete effects of urbanization and storm events. For example, tidal fluctuations, or lack of, can significantly dilute microbiological concentrations [56,68]. A study of E. coli distribution in this region indicated spring tides flush out pollutants, whereas the neap tide increased residence time [56]. Contrary to original predictions, the Urban site exhibited the lowest fecal indicator concentrations on most occasions, and this could be attributed to its proximity to the inlet and the low residence time of coliforms. A site’s proximity to an inlet suggests effects from urbanization that could be evident in that system, are diminished due to decreased water residence time [69]. Previous studies have highlighted the importance of short-term scale sampling, in order to assess tidal variability, the contributions of river flow, and their influence on water quality [25,70]. The 15 min sampling interval in this study provided a detailed dataset that distinguished a site’s tidal variability; however, other critical parameters, such as nutrients, were not included in those frequent measurements. Long term monitoring programs may benefit from incorporating periods of burst sampling in order to capture short-term water quality patterns, such as increased turbidities caused by hydrological flashiness.

4.3. Storm Events

An increase in impervious surfaces and subsequent hydrological flashiness associated with urbanization was predicted to distinguish the water quality characteristics in rural areas from more urban sites. According to the Kruskal–Wallis results, the Rural sites remained relatively stable during both storm events (Tables S1 and S2). Similarly, the sites closest to the inlet primarily responded to tidal changes and were relatively unaffected by the rainfall events. pH was shown to be statistically significantly different after both storms for all sites, which is indicative of an increase in FDOM imports throughout the river-estuary continuum following rain events, particularly from the blackwater rivers. FDOM indicates the presence of freshwater, which results in slightly lower salinity and concomitant drop in pH. Since all sites experienced significant pH changes before and after storm events, there is insufficient data to suggest that increasing urbanization influences pH. Rather, the naturally occurring FDOM exports from the blackwater rivers is driving the significant changes in pH throughout the aquatic continuum. Significantly higher turbidities seen at the sites closest to the inlet were likely because of their proximity to the inlet and the consequent sediment resuspension from strong tidal currents or boat wakes [71,72]. Although increased suspended solids in the water column can be an effect of hydrological flashiness, the spatial variability of sites introduces confounding variables like the tidal influence, which hinder accurate site comparisons for the selected parameters measured. Weather patterns can have a substantial influence on the aquatic continuum, through means of affecting tidal intensity, wind patterns, flooding duration, water level, and other characteristics of the hydrologic regime [73], which can heighten turbid conditions or influence residence times. Furthermore, rainfall can dilute incoming pollutant loading and contribute to reduced residence times in some cases [74]. The simultaneity of a high tide and increased rainfall could significantly mask the effects of sediment loads or pollutants associated with hydrological flashiness. A study in Pellicer Creek found that FDOM concentrations were much higher during low tide during Hurricane Irma than low tide, potentially signaling this diluting effect [35]. Future studies and monitoring programs examining the effects of runoff on water quality may benefit from intensive sampling during low tide to reduce the effects of the tidal cycle on pollutant residence time.
Notably, the Suburban, Urban, and Estuarine sites had the highest standard deviations following the rainfall events for FDOM and turbidity. This could indicate that those sites closer to either endmember along the aquatic continuum (i.e., freshwater input or inlet), experience less variance in general, most likely due to the buffering capacities of their adjacent hydrological inputs. Relative to the other sites, the Suburban and Estuarine sites are situated furthest from the freshwater and saltwater inputs; thus, their locations may more easily reveal the effects of the storm events on water quality. These sites may provide the optimal site location in tidally influenced study areas; however, more research needs to be completed to support this.
Characterizing runoff pollution is a challenging undertaking, as nonpoint sources of pollutants and sediments are ubiquitous in urbanized areas and difficult to fully capture. Furthermore, examination of water quality trends is hindered by attempts to define the fluctuating hydrological and geomorphic boundaries of estuary-river continuums [75]. Care should be taken in long-term monitoring programs to establish sites throughout the river–estuary continuum to best capture its fluctuating tendencies. Due to funding and staff limitations, long-term water quality monitoring programs are typically dominated by in situ sonde deployments and infrequent nutrient sampling; thus, the optimal research design for studying hydrological flashiness may be unfeasible. Current efforts to study storm runoff and its effects on estuarine water quality are dominated by integrated models that incorporate land use, rainfall runoff characteristics, topography, and other physical processes [76,77,78]. When paired with large datasets taken throughout the aquatic continuum, they can be effective for management and restoration programs aiming to characterize and improve water quality.

5. Conclusions

This effort to characterize the impacts of urbanization along a rural–urban gradient in an estuarine system suggests tidal influence can mask changes in water quality that may be due to urbanization, highlighting the importance of site location and methodology in monitoring and assessment programs. Further research should aim to reduce data variability by selecting locations with similar hydrological characteristics, which is highly dependent on the distances to freshwater or saltwater inputs. Alternative models and analyses to isolate tidal marine influence or reduce confounding factors between sites may be suitable for future datasets. Representative water quality measurements not only maximize time and resources, but provide the necessary guidance that resource managers and urban planners need for making decisions that reduce our anthropogenic footprint.

Supplementary Materials

The following supporting information can be downloaded at: https://www.mdpi.com/article/10.3390/w15234154/s1, Table S1: Nor’easter Kruskal–Wallis; Table S2: November Rainfall Events Kruskal–Wallis; Table S3: Nor’easter FDOM and Turbidity; Table S4: November Rainfall Events FDOM and Turbidity; Table S5: PCA components.

Author Contributions

Conceptualization, T.M.C. and T.Z.O.; methodology, T.M.C. and T.Z.O.; software, T.M.C.; validation, T.M.C., T.Z.O. and T.B.S.; formal analysis, T.M.C.; investigation, T.M.C.; resources, T.Z.O.; data curation, T.M.C.; writing—original draft preparation, T.M.C.; writing—review and editing, T.M.C., T.Z.O. and T.B.S.; visualization, T.M.C. and T.B.S.; supervision, T.Z.O.; project administration, T.M.C. and T.Z.O.; funding acquisition, T.Z.O. All authors have read and agreed to the published version of the manuscript.

Funding

This research was supported through ‘iCoast’ funding provided by the University of Florida’s Office of the Provost.

Data Availability Statement

Publicly available datasets were analyzed in this study, courtesy of the National Estuarine Research Reserve monitoring system. This data can be found here: https://cdmo.baruch.sc.edu/ (accessed on 30 December 2020).

Acknowledgments

We thank the Guana Tolomato Matanzas Estuarine Research Reserve staff for the sonde and meteorological data that were analyzed for this study and Anna Thornton for field and technical assistance throughout this project.

Conflicts of Interest

The authors declare no conflict of interest. The funders had no role in the design of the study; in the collection, analyses, or interpretation of data; in the writing of the manuscript; or in the decision to publish the results.

References

  1. Office of Economic & Demographic Research. Demographic Estimating Conference Executive Summary. 2022. Available online: http://edr.state.fl.us/content/conferences/population/archives/220718demographic.pdf (accessed on 1 August 2022).
  2. Terando, A.J.; Costanza, J.; Belyea, C.; Dunn, R.R.; McKerrow, A.; Collazo, J.A. The Southern Megalopolis: Using the Past to Predict the Future of Urban Sprawl in the Southeast U.S. PLoS ONE 2014, 9, e102261. [Google Scholar] [CrossRef] [PubMed]
  3. Baker, A. Land Use and Water Quality. In Encyclopedia of Hydrological Sciences; John Wiley & Sons, Ltd.: Hoboken, NJ, USA, 2005. [Google Scholar] [CrossRef]
  4. McDonnell, M.J.; Pickett, S.T.A. Ecosystem Structure and Function along Urban-Rural Gradients: An Unexploited Opportunity for Ecology. Ecology 1990, 71, 1232–1237. [Google Scholar] [CrossRef]
  5. Brown, L.R.; Cuffney, T.F.; Coles, J.F.; Fitzpatrick, F.; McMahon, G.; Steuer, J.; Bell, A.H.; May, J.T. Urban Streams across the USA: Lessons Learned from Studies in 9 Metropolitan Areas. J. N. Am. Benthol. Soc. 2009, 28, 1051–1069. [Google Scholar] [CrossRef]
  6. Ouyang, Y.; Nkedi-Kizza, P.; Wu, Q.T.; Shinde, D.; Huang, C.H. Assessment of Seasonal Variations in Surface Water Quality. Water Res. 2006, 40, 3800–3810. [Google Scholar] [CrossRef] [PubMed]
  7. Toor, G.S.; Occhipinti, M.L.; Yang, Y.Y.; Majcherek, T.; Haver, D.; Oki, L. Managing Urban Runoff in Residential Neighborhoods: Nitrogen and Phosphorus in Lawn Irrigation Driven Runoff. PLoS ONE 2017, 12, e0179151. [Google Scholar] [CrossRef]
  8. Lusk, M.G.; Toor, G.S.; Yang, Y.Y.; Mechtensimer, S.; De, M.; Obreza, T.A. A Review of the Fate and Transport of Nitrogen, Phosphorus, Pathogens, and Trace Organic Chemicals in Septic Systems. Crit. Rev. Environ. Sci. Technol. 2017, 47, 455–541. [Google Scholar] [CrossRef]
  9. Tufford, D.L.; Samarghitan, C.L.; McKellar, H.N.; Porter, D.E.; Hussey, J.R. Impacts of Urbanization on Nutrient Concentrations in Small Southeastern Coastal Streams. J. Am. Water Resour. Assoc. 2003, 39, 301–312. [Google Scholar] [CrossRef]
  10. Chen, Q.; Mei, K.; Dahlgren, R.A.; Wang, T.; Gong, J.; Zhang, M. Impacts of Land Use and Population Density on Seasonal Surface Water Quality Using a Modified Geographically Weighted Regression. Sci. Total Environ. 2016, 572, 450–466. [Google Scholar] [CrossRef]
  11. Smucker, N.J.; Kuhn, A.; Charpentier, M.A.; Cruz-Quinones, C.J.; Elonen, C.M.; Whorley, S.B.; Jicha, T.M.; Serbst, J.R.; Hill, B.H.; Wehr, J.D. Quantifying Urban Watershed Stressor Gradients and Evaluating How Different Land Cover Datasets Affect Stream Management. Environ. Manag. 2015, 57, 683–695. [Google Scholar] [CrossRef]
  12. Yang, Y.Y.; Lusk, M.G. Nutrients in Urban Stormwater Runoff: Current State of the Science and Potential Mitigation Options. Curr. Pollut. Rep. 2018, 4, 112–127. [Google Scholar] [CrossRef]
  13. Yang, Y.Y.; Toor, G.S. Stormwater Runoff Driven Phosphorus Transport in an Urban Residential Catchment: Implications for Protecting Water Quality in Urban Watersheds. Sci. Rep. 2018, 8, 11681. [Google Scholar] [CrossRef] [PubMed]
  14. Walsh, C.J.; Roy, A.H.; Feminella, J.W.; Cottingham, P.D.; Groffman, P.M.; Morgan, R.P. The Urban Stream Syndrome: Current Knowledge and the Search for a Cure. J. N. Am. Benthol. Soc. 2005, 24, 706–723. [Google Scholar] [CrossRef]
  15. Da Silva, E.B.; Gao, P.; Xu, M.; Guan, D.; Tang, X.; Ma, L.Q. Background Concentrations of Trace Metals As, Ba, Cd, Co, Cu, Ni, Pb, Se, and Zn in 214 Florida Urban Soils: Different Cities and Land Uses. Environ. Pollut. 2020, 264, 114737. [Google Scholar] [CrossRef] [PubMed]
  16. House, M.A.; Ellis, J.B.; Herricks, E.E.; Hvitved-Jacobsen, T.; Seager, J.; Lijklema, L.; Aalderink, H.; Clifforde, I.T. Urban Drainage Impacts on Receiving Waters. Water Sci. Technol. 1993, 27, 117–158. [Google Scholar] [CrossRef]
  17. Arias, M.E.; Brown, M.T.; Sansalone, J.J. Characterization of Storm Water–Suspended Sediments and Phosphorus in an Urban Catchment in Florida. J. Environ. Eng. 2013, 139, 277–288. [Google Scholar] [CrossRef]
  18. Wu, J.; Ren, Y.; Wang, X.; Wang, X.; Chen, L.; Liu, G. Nitrogen and Phosphorus Associating with Different Size Suspended Solids in Roof and Road Runoff in Beijing, China. Environ. Sci. Pollut. Res. 2015, 22, 15788–15795. [Google Scholar] [CrossRef] [PubMed]
  19. Müller, A.; Österlund, H.; Marsalek, J.; Viklander, M. The Pollution Conveyed by Urban Runoff: A Review of Sources. Sci. Total Environ. 2020, 709, 136125. [Google Scholar] [CrossRef]
  20. Shen, C.; Liao, Q.; Titi, H.H.; Li, J. Turbidity of Stormwater Runoff from Highway Construction Sites. J. Environ. Eng. 2018, 144, 04018061. [Google Scholar] [CrossRef]
  21. Brett, M.T.; Arhonditsis, G.B.; Mueller, S.E.; Hartley, D.M.; Frodge, J.D.; Funke, D.E. Non-Point-Source Impacts on Stream Nutrient Concentrations along a Forest to Urban Gradient. Environ. Manag. 2005, 35, 330–342. [Google Scholar] [CrossRef]
  22. Hasenmueller, E.A.; Criss, R.E.; Winston, W.E.; Shaughnessy, A.R. Stream Hydrology and Geochemistry along a Rural to Urban Land Use Gradient. Appl. Geochem. 2017, 83, 136–149. [Google Scholar] [CrossRef]
  23. Lake, S.J.; Brush, M.J. Contribution of Nutrient and Organic Matter Sources to the Development of Periodic Hypoxia in a Tributary Estuary. Estuar. Coasts 2015, 38, 2149–2171. [Google Scholar] [CrossRef]
  24. Park, G.S. The Role and Distribution of Total Suspended Solids in the Macrotidal Coastal Waters of Korea. Environ. Monit. Assess. 2007, 135, 153–162. [Google Scholar] [CrossRef] [PubMed]
  25. Nascimento, Â.; Biguino, B.; Borges, C.; Cereja, R.; Cruz, J.P.C.; Sousa, F.; Dias, J.; Brotas, V.; Palma, C.; Brito, A.C. Tidal Variability of Water Quality Parameters in a Mesotidal Estuary (Sado Estuary, Portugal). Sci. Rep. 2021, 11, 23112. [Google Scholar] [CrossRef] [PubMed]
  26. Ketchum, B.H.; Rawn, A.M. The Flushing of Tidal Estuaries. Sew. Ind. Waste 1951, 23, 198–209. [Google Scholar] [CrossRef]
  27. Phlips, E.J.; Love, N.; Badylak, S.; Hansen, P.; Lockwood, J.; John, C.V.; Gleeson, R. A Comparison of Water Quality and Hydrodynamic Characteristics of the Guana Tolomato Matanzas National Estuarine Research Reserve and the Indian River Lagoon of Florida. J. Coast. Res. 2004, 20, 93–109. [Google Scholar] [CrossRef]
  28. Huggett, R.D.; Purdie, D.A.; Haigh, I.D. Modelling the Influence of Riverine Inputs on the Circulation and Flushing Times of Small Shallow Estuaries. Estuar. Coasts 2021, 44, 54–69. [Google Scholar] [CrossRef]
  29. Uncles, R.J.; Stephens, J.A.; Smith, R.E. The Dependence of Estuarine Turbidity on Tidal Intrusion Length, Tidal Range and Residence Time. Cont. Shelf Res. 2002, 22, 1835–1856. [Google Scholar] [CrossRef]
  30. Pritchard, D.W. Dispersion and Flushing of Pollutants in Estuaries. J. Hydraul. Div. 1969, 95, 115–124. [Google Scholar] [CrossRef]
  31. Rosario-Llantín, J.-A.; Zarillo, G.A. Flushing Rates and Hydrodynamical Characteristics of Mosquito Lagoon (Florida, USA). Environ. Sci. Pollut. Res. 2021, 28, 30019–30034. [Google Scholar] [CrossRef]
  32. Gianesella, S.M.F.; Saldanha-Correa, F.M.P.; Teixeira, C. Tidal Effects on Nutrients and Phytoplankton Distribution in Bertioga Channel, Sao Paula, Brazil. Aquat. Ecosyst. Health Manag. 2000, 3, 533–544. [Google Scholar] [CrossRef]
  33. National Oceanic and Atmospheric Association. NOAA Tide Predictions. Available online: https://tidesandcurrents.noaa.gov/noaatidepredictions.html?id=8720686 (accessed on 30 April 2020).
  34. Dix, N.; Noel, A.; Brockmeyer, R.; Hyun Jung, C.; Shauna Ray, A.; Radabaugh, K. Coastal Habitat Integrated Mapping and Monitoring Program Report for the State of Florida. Florida Fish and Wildlife Conservation Commission, Fish and Wildlife Research Institute Technical Report No. 21; Chapter 13 Northeast Florida. 2017, pp. 144–154. Available online: https://myfwc.com/research/habitat/coastal-wetlands/chimmp/ (accessed on 1 January 2022).
  35. Schafer, T.; Ward, N.; Julian, P.; Reddy, K.R.; Osborne, T.Z. Impacts of Hurricane Disturbance on Water Quality across the Aquatic Continuum of a Blackwater River to Estuary Complex. J. Mar. Sci. Eng. 2020, 8, 412. [Google Scholar] [CrossRef]
  36. Kyzar, T. Land Use and Water Quality Data within the GTM NERR. Available online: https://www.arcgis.com/apps/webappviewer/index.html?id=13873bbef4ab43cea2382cf1558a8502 (accessed on 1 April 2020).
  37. YSI Inc. YSI EXO Manual. Available online: https://www.ysi.com/File%20Library/Documents/Manuals/EXO-User-Manual-Web.pdf (accessed on 1 May 2020).
  38. Kennish, M.J. NERRS Research and Monitoring Initiatives. J. Coast. Res. 2004, 45, 1–8. [Google Scholar] [CrossRef]
  39. Dix, N.G.; Phlips, E.J.; Gleeson, R.A. Water Quality Changes in the Guana Tolomato Matanzas National Estuarine Research Reserve, Florida, Associated with Four Tropical Storms. J. Coast. Res. 2008, 10055, 26–37. [Google Scholar] [CrossRef]
  40. NERR National Estuarine Research Reserve System-Centralized Data Management Office. Available online: https://cdmo.baruch.sc.edu (accessed on 30 April 2020).
  41. Caccia, V.G.; Boyer, J.N. Spatial Patterning of Water Quality in Biscayne Bay, Florida as a Function of Land Use and Water Management. Mar. Pollut. Bull. 2005, 50, 1416–1429. [Google Scholar] [CrossRef] [PubMed]
  42. Glińska-Lewczuk, K.; Gołaś, I.; Koc, J.; Gotkowska-Płachta, A.; Harnisz, M.; Rochwerger, A. The Impact of Urban Areas on the Water Quality Gradient along a Lowland River. Environ. Monit. Assess. 2016, 188, 624. [Google Scholar] [CrossRef]
  43. Mustapha, A.; Abdu, A. Application of Principal Component Analysis in Surface Water Quality Monitoring. Princ. Compon. Anal.-Eng. Appl. 2012, 2, 16–24. [Google Scholar] [CrossRef]
  44. Akbar, T.A.; Hassan, Q.K.; Achari, G. Clusterization of Surface Water Quality and Its Relation to Climate and Land Use/Cover. J. Environ. Prot. 2013, 04, 333–343. [Google Scholar] [CrossRef]
  45. Bridger, K. FINAL TMDL Report Fecal Coliform TMDL for the Pellicer Creek (WBID 2580B). 2012. Available online: https://floridadep.gov/sites/default/files/pellicer-creek-coliform-tmdl.pdf (accessed on 1 May 2020).
  46. Frenzel, S.A.; Couvillion, C.S. Fecal-Indicator Bacteria in Streams Alonga Gradient of Residential Development. J. Am. Water Resour. Assoc. 2002, 38, 265–273. [Google Scholar] [CrossRef]
  47. Pumo, D.; Arnone, E.; Francipane, A.; Caracciolo, D.; Noto, L.V. Potential Implications of Climate Change and Urbanization on Watershed Hydrology. J. Hydrol. 2017, 554, 80–99. [Google Scholar] [CrossRef]
  48. Pagliosa, P.; Fonseca, A.; Barbosa, F.; Braga, E. Urbanization Impact on Subtropical Estuaries: A Comparative Study of Water Properties in Urban Areas and in Protected Areas. J. Coast. Res. 2006, II, 731–735. [Google Scholar]
  49. Lewis, D.B.; Grimm, N.B. Hierarchical Regulation of Nitrogen Export from Urban Catchments: Interactions of Storms and Landscapes. Ecol. Appl. 2007, 17, 2347–2364. [Google Scholar] [CrossRef] [PubMed]
  50. Panton, A.; Couceiro, F.; Fones, G.R.; Purdie, D.A. The Impact of Rainfall Events, Catchment Characteristics and Estuarine Processes on the Export of Dissolved Organic Matter from Two Lowland Rivers and Their Shared Estuary. Sci. Total Environ. 2020, 735, 139481. [Google Scholar] [CrossRef] [PubMed]
  51. Stoner, E.W.; Arrington, D.A. Nutrient Inputs from an Urbanized Landscape May Drive Water Quality Degradation. Sustain. Water Qual. Ecol. 2017, 9–10, 136–150. [Google Scholar] [CrossRef]
  52. Geary, P.; Lucas, S. Contamination of Estuaries from Failing Septic Tank Systems: Difficulties in Scaling up from Monitored Individual Systems to Cumulative Impact. Environ. Sci. Pollut. Res. 2019, 26, 2132–2144. [Google Scholar] [CrossRef]
  53. Kincaid, D.W.; Seybold, E.C.; Adair, E.C.; Bowden, W.B.; Perdrial, J.N.; Vaughan, M.C.H.; Schroth, A.W. Land Use and Season Influence Event-Scale Nitrate and Soluble Reactive Phosphorus Exports and Export Stoichiometry from Headwater Catchments. Water Resour. Res. 2020, 56, e2020WR027361. [Google Scholar] [CrossRef]
  54. Lin, J.; Krom, M.D.; Wang, F.; Cheng, P.; Yu, Q.; Chen, N. Simultaneous Observations Revealed the Non-Steady State Effects of a Tropical Storm on the Export of Particles and Inorganic Nitrogen through a River-Estuary Continuum. J. Hydrol. 2022, 606, 127438. [Google Scholar] [CrossRef]
  55. Zhang, M.; Krom, M.D.; Lin, J.; Cheng, P.; Chen, N. Effects of a Storm on the Transformation and Export of Phosphorus Through a Subtropical River-Turbid Estuary Continuum Revealed by Continuous Observation. J. Geophys. Res. Biogeosci. 2022, 127, e2022JG006786. [Google Scholar] [CrossRef]
  56. Pinton, D. Understanding How the Release of E. coli and Nutrients from Septic Tanks into the Guana- Tolomato-Matanzas Estuary and the Adjacent Ocean Affect Human, Plant and Animal Health; One Health Final Report; University of Florida: Gainesville, FL, USA, 2020; pp. 1–35. [Google Scholar]
  57. Lapointe, B.E.; Herren, L.W.; Paule, A.L. Septic Systems Contribute to Nutrient Pollution and Harmful Algal Blooms in the St. Lucie Estuary, Southeast Florida, USA. Harmful Algae 2017, 70, 1–22. [Google Scholar] [CrossRef]
  58. Roy, J.W.; Spoelstra, J.; Robertson, W.D.; Klemt, W.; Schiff, S.L. Contribution of Phosphorus to Georgian Bay from Groundwater of a Coastal Beach Town with Decommissioned Septic Systems. J. Great. Lakes Res. 2017, 43, 1016–1029. [Google Scholar] [CrossRef]
  59. Zampella, R.A. Characterization of Surface Water Quality Along a Watershed Disturbance Gradient. JAWRA J. Am. Water Resour. Assoc. 1994, 30, 605–611. [Google Scholar] [CrossRef]
  60. McCabe, K.M.; Smith, E.M.; Lang, S.Q.; Osburn, C.L.; Benitez-Nelson, C.R. Particulate and Dissolved Organic Matter in Stormwater Runoff Influences Oxygen Demand in Urbanized Headwater Catchments. Environ. Sci. Technol. 2021, 55, 952–961. [Google Scholar] [CrossRef] [PubMed]
  61. Yoon, B.; Raymond, P.A. Dissolved Organic Matter Export from a Forested Watershed during Hurricane Irene. Geophys. Res. Lett. 2012, 39, L18402. [Google Scholar] [CrossRef]
  62. Gold, A.C.; Thompson, S.P.; Magel, C.L.; Piehler, M.F. Urbanization Alters Coastal Plain Stream Carbon Export and Dissolved Oxygen Dynamics. Sci. Total Environ. 2020, 747, 141132. [Google Scholar] [CrossRef] [PubMed]
  63. Boyd, T.J.; Osburn, C.L. Changes in CDOM Fluorescence from Allochthonous and Autochthonous Sources during Tidal Mixing and Bacterial Degradation in Two Coastal Estuaries. Mar. Chem. 2004, 89, 189–210. [Google Scholar] [CrossRef]
  64. Zhou, Y.; Li, Y.; Yao, X.; Ding, W.; Zhang, Y.; Jeppesen, E.; Zhang, Y.; Podgorski, D.C.; Chen, C.; Ding, Y.; et al. Response of Chromophoric Dissolved Organic Matter Dynamics to Tidal Oscillations and Anthropogenic Disturbances in a Large Subtropical Estuary. Sci. Total Environ. 2019, 662, 769–778. [Google Scholar] [CrossRef] [PubMed]
  65. Dosskey, M.G.; Bertsch, P.M. Forest Sources and Pathways of Organic Matter Transport to a Blackwater Stream: A Hydrologic Approach. Biogeochemistry 1994, 24, 1–19. [Google Scholar] [CrossRef]
  66. Singh, S.; Dash, P.; Silwal, S.; Feng, G.; Adeli, A.; Moorhead, R.J. Influence of Land Use and Land Cover on the Spatial Variability of Dissolved Organic Matter in Multiple Aquatic Environments. Environ. Sci. Pollut. Res. 2017, 24, 14124–14141. [Google Scholar] [CrossRef]
  67. Sheng, Y.P.; Tutak, B.; Davis, J.R.; Paramygin, V. Circulation and Flushing in the Lagoonal System of the Guana Tolomato Matanzas National Estuarine Research Reserve (GTMNERR), Florida. J. Coast. Res. 2008, 10055, 9–25. [Google Scholar] [CrossRef]
  68. Aslan, A.; Anderson, K.W.; Chapman, A. The Impact of Tides on Microbial Water Quality at an Inland River Beach. J. Environ. Qual. 2018, 47, 1123–1129. [Google Scholar] [CrossRef]
  69. Marsooli, R.; Orton, P.M.; Fitzpatrick, J.; Smith, H. Residence Time of a Highly Urbanized Estuary: Jamaica Bay, New York. J. Mar. Sci. Eng. 2018, 6, 44. [Google Scholar] [CrossRef]
  70. DiLorenzo, J.L.; Filadelfo, R.J.; Surak, C.R.; Litwack, H.S.; Gunawardana, V.K.; Najarian, T.O. Tidal Variability in the Water Quality of an Urbanized Estuary. Estuaries 2004, 27, 851–860. [Google Scholar] [CrossRef]
  71. Hubeny, J.B.; Kenney, M.; Warren, B.; Louisos, J. Multi-Faceted Monitoring of Estuarine Turbidity and Particulate Matter Provenance: Case Study from Salem Harbor, USA. Sci. Total Environ. 2017, 574, 629–641. [Google Scholar] [CrossRef] [PubMed]
  72. Mitchell, S.B.; Lawler, D.M.; West, J.R.; Couperthwaite, J.S. Use of Continuous Turbidity Sensor in the Prediction of Fine Sediment Transport in the Turbidity Maximum of the Trent Estuary, UK. Estuar. Coast. Shelf Sci. 2003, 58, 645–652. [Google Scholar] [CrossRef]
  73. Zhang, L.; Thomas, S.; Mitsch, W.J. Design of Real-Time and Long-Term Hydrologic and Water Quality Wetland Monitoring Stations in South Florida, USA. Ecol. Eng. 2017, 108, 446–455. [Google Scholar] [CrossRef]
  74. Yang, L.; Li, J.; Zhou, K.; Feng, P.; Dong, L. The Effects of Surface Pollution on Urban River Water Quality under Rainfall Events in Wuqing District, Tianjin, China. J. Clean. Prod. 2021, 293, 126136. [Google Scholar] [CrossRef]
  75. O’Connor, J.A.; Erler, D.V.; Ferguson, A.; Maher, D.T. The Tidal Freshwater River Zone: Physical Properties and Biogeochemical Contribution to Estuarine Hypoxia and Acidification—The “Hydrologic Switch”. Estuar. Coast. Shelf Sci. 2022, 268, 107786. [Google Scholar] [CrossRef]
  76. Hasan Tanim, A.; Goharian, E. Developing a Hybrid Modeling and Multivariate Analysis Framework for Storm Surge and Runoff Interactions in Urban Coastal Flooding. J. Hydrol. 2021, 595, 125670. [Google Scholar] [CrossRef]
  77. Xu, H.; Wang, G.; Huang, Z.; Su, Y.; Bai, Y.; Zhang, J. Hydrodynamic Interactions between Tide and Runoff in the Luanhe Estuary in Bohai Sea, China: From Aquaculture Reclamation to Restoration. Ocean Coast Manag. 2023, 239, 106586. [Google Scholar] [CrossRef]
  78. Biemond, B.; de Swart, H.E.; Dijkstra, H.A.; Díez-Minguito, M. Estuarine Salinity Response to Freshwater Pulses. J. Geophys. Res. Oceans 2022, 127, e2022JC018669. [Google Scholar] [CrossRef]
Figure 1. Locations of the eight deployed YSI EXO 2 multiparameter sondes throughout the Matanzas River and its tributaries, located in northeast Florida.
Water 15 04154 g001
Figure 2. Site distances to the inlet or freshwater source (km).
Water 15 04154 g002
Figure 3. Bar graph of E. coli and total coliform concentrations (MPN) from June to December 2020, for the Rural, Suburban, and Rural sites. Data from the Urban site was unavailable in June.
Water 15 04154 g003
Figure 4. PCA assessing distance to inlet, distance to freshwater, turbidity, pH, dissolved oxygen (DO), salinity, chlorophyll-a, and FDOM parameters at the Urban (red), Suburban (orange), and Rural (green) sites.
Water 15 04154 g004
Figure 5. PCA assessing distance to inlet, distance to freshwater, turbidity, pH, dissolved oxygen (DO), salinity, and chlorophyll-a, at all sites: Inlet, GTM Inlet, Estuarine, Urban, GTM Urban, Suburban, GTM Rural, and Rural.
Water 15 04154 g005
Table 1. Percentages of parcel type for each site. Percentage of urban parcels (“% Urban”) is the sum of the residential, commercial, and industrial parcel percentages.
SiteResidentialCommercialIndustrialAgricultureParksOther% Urban
Urban38.915.41.90.10.043.756.2
Suburban34.22.54.929.55.923.141.6
Rural4.30.50.04.922.867.54.8
Table 2. Mean and standard deviation values (in parentheses) for all sites for the parameters: salinity (ppt), pH, DO (% sat.), turbidity (FNU), chlorophyll-a (ug/L), temperature (°C), and FDOM (QSU).
SiteSalinitypHDOTurbidityChl-aTemp.FDOM
Urban29.77.989.24.74.719.255.2
(1.6)(0.1)(7.3)(2.7)(1.7)(4.1)(6.5)
GTM Urban32.77.986.011.09.526.1 
(2.2)(0.2)(11.9)(48.2)(3.8)(4.5) 
Suburban27.57.673.210.16.327.071.5
(7.2)(0.2)(14.1)(17.2)(3.9)(4.7)(50.1)
Inlet34.28.091.610.77.527.316.4
(1.9)(1.1)(9.4)(16.0)(10.70)(2.8)(16.3)
GTM Inlet33.17.989.47.56.726.1 
(2.0)(0.1)(10.0)(39.2)(3.4)(4.4) 
Estuarine29.97.986.46.96.726.356.4
(4.4)(0.2)(11.3)(9.2)(8.2)(4.5)(40.3)
GTM Rural8.97.063.210.716.126.0 
(7.0)(0.4)(14.3)(7.0)(4.2)(5.4) 
Rural0.26.647.62.211.723.8171.2
(0.3)(0.3)(11.8)(10.8)(5.2)(4.7)(26.6)
Table 3. Correlation analysis for sites including FDOM (Urban, Suburban, Rural, Inlet, and Estuarine).
 SalinitypHDOTurb.Chl-aTempFDOM
Salinity1      
pH0.931     
% DO0.820.821    
Turbidity0.190.180.151   
Chl-a−0.34−0.34−0.230.071  
Temp0.280.18−0.010.110.011 
FDOM−0.93−0.81−0.77−0.190.29−0.341
Disclaimer/Publisher’s Note: The statements, opinions and data contained in all publications are solely those of the individual author(s) and contributor(s) and not of MDPI and/or the editor(s). MDPI and/or the editor(s) disclaim responsibility for any injury to people or property resulting from any ideas, methods, instructions or products referred to in the content.

