
Sediment Transport Beneath a Simulated Partial Ice Cover: Effects of Asymmetric Border Ice

Abstract
:1. Introduction
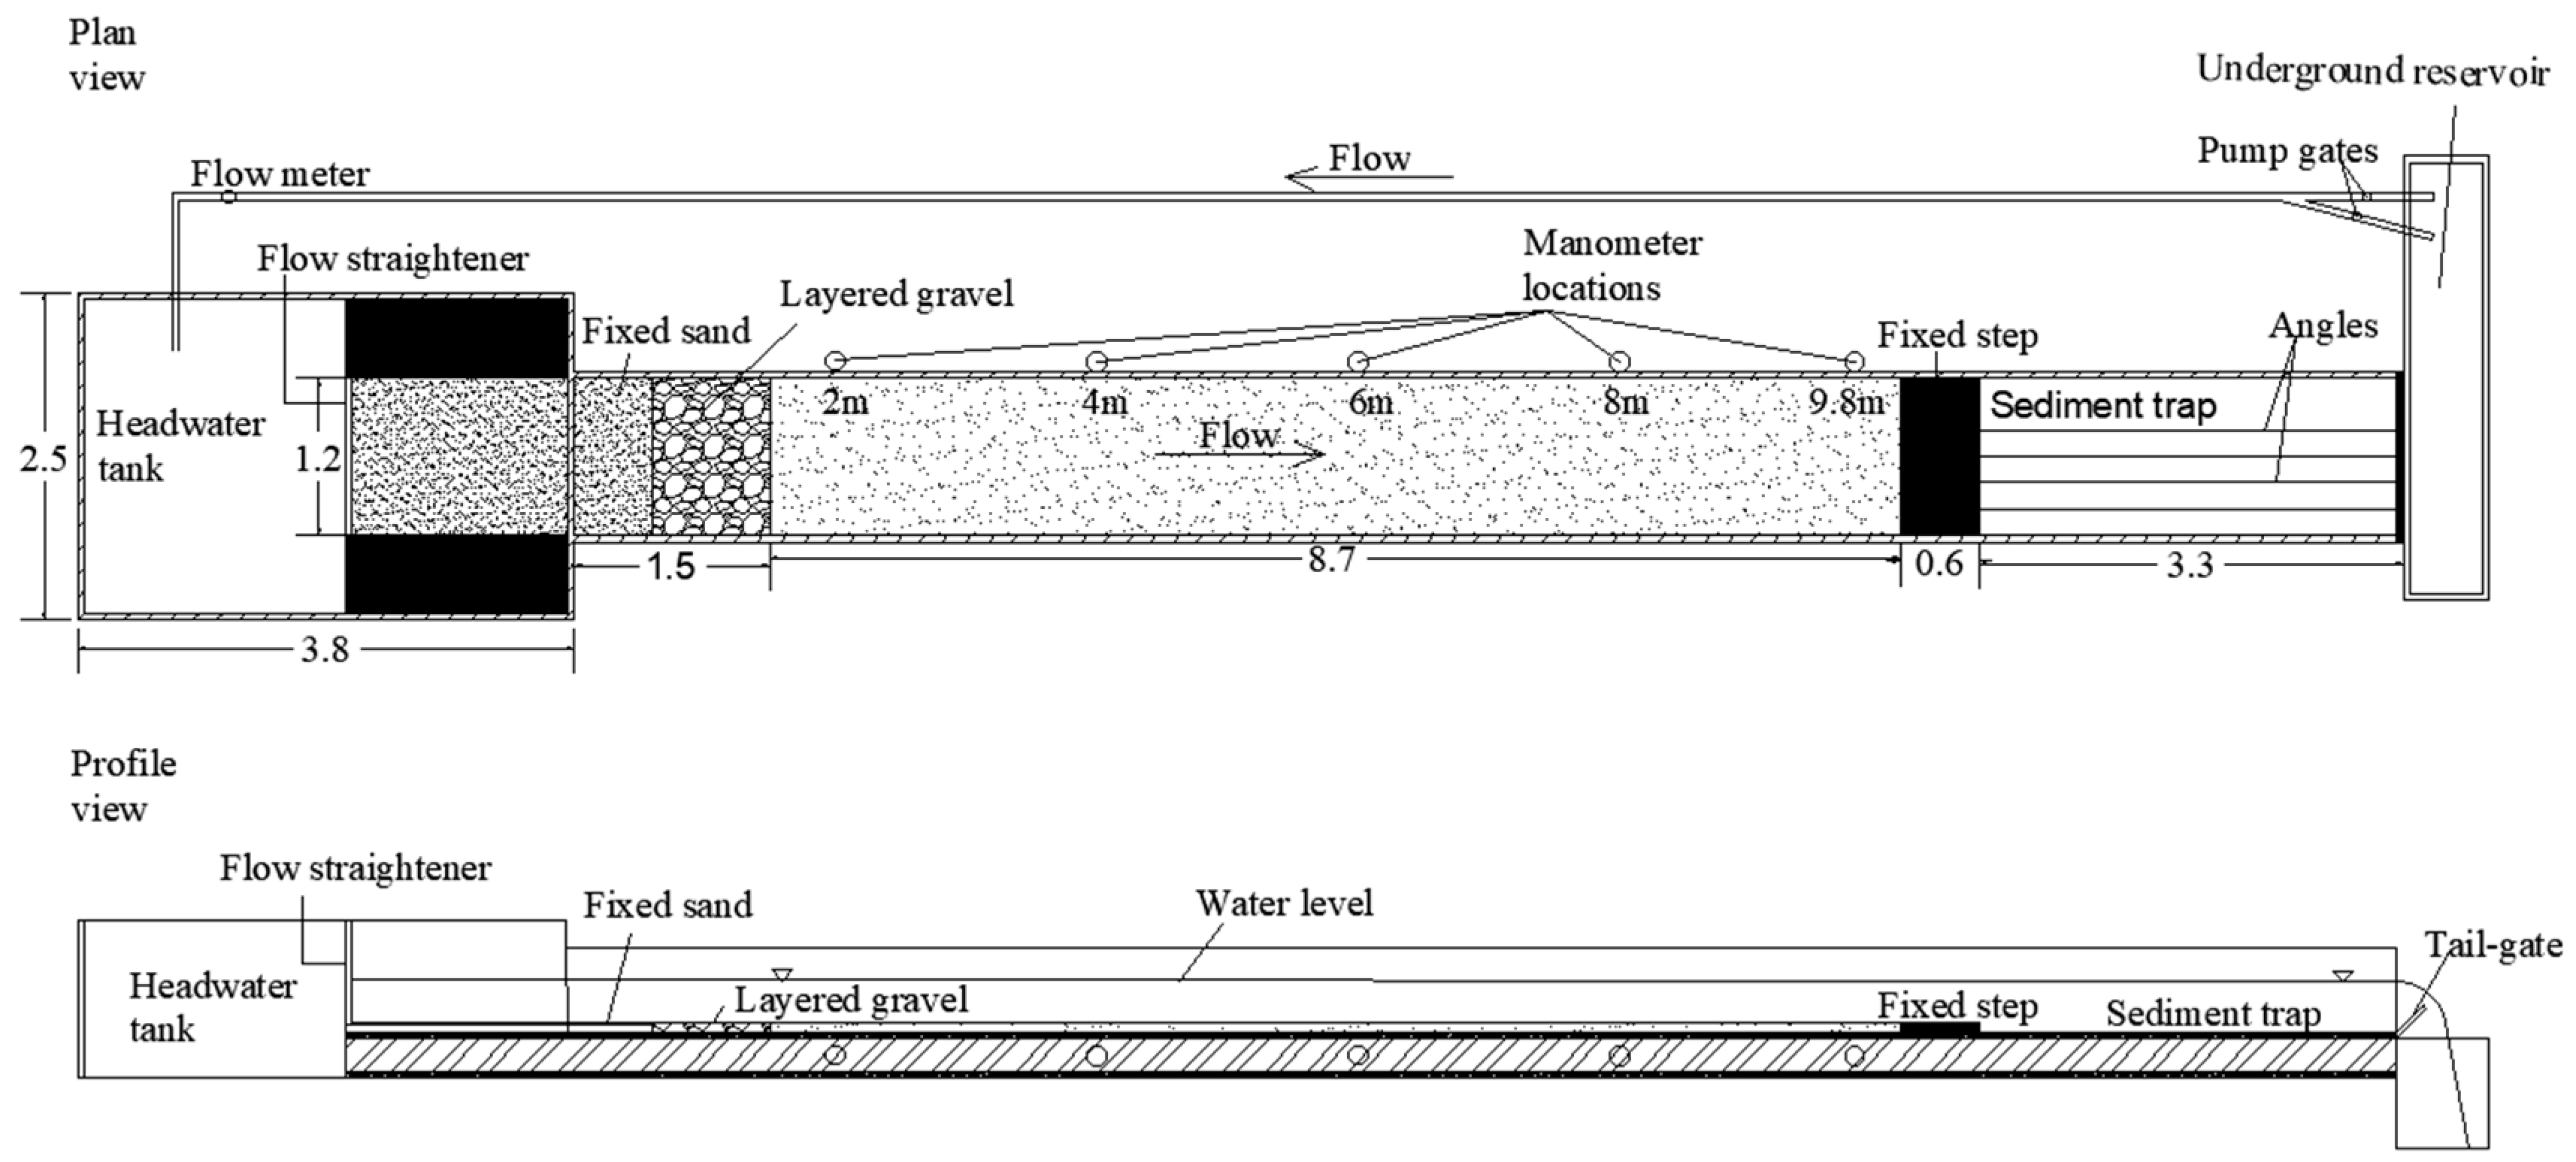
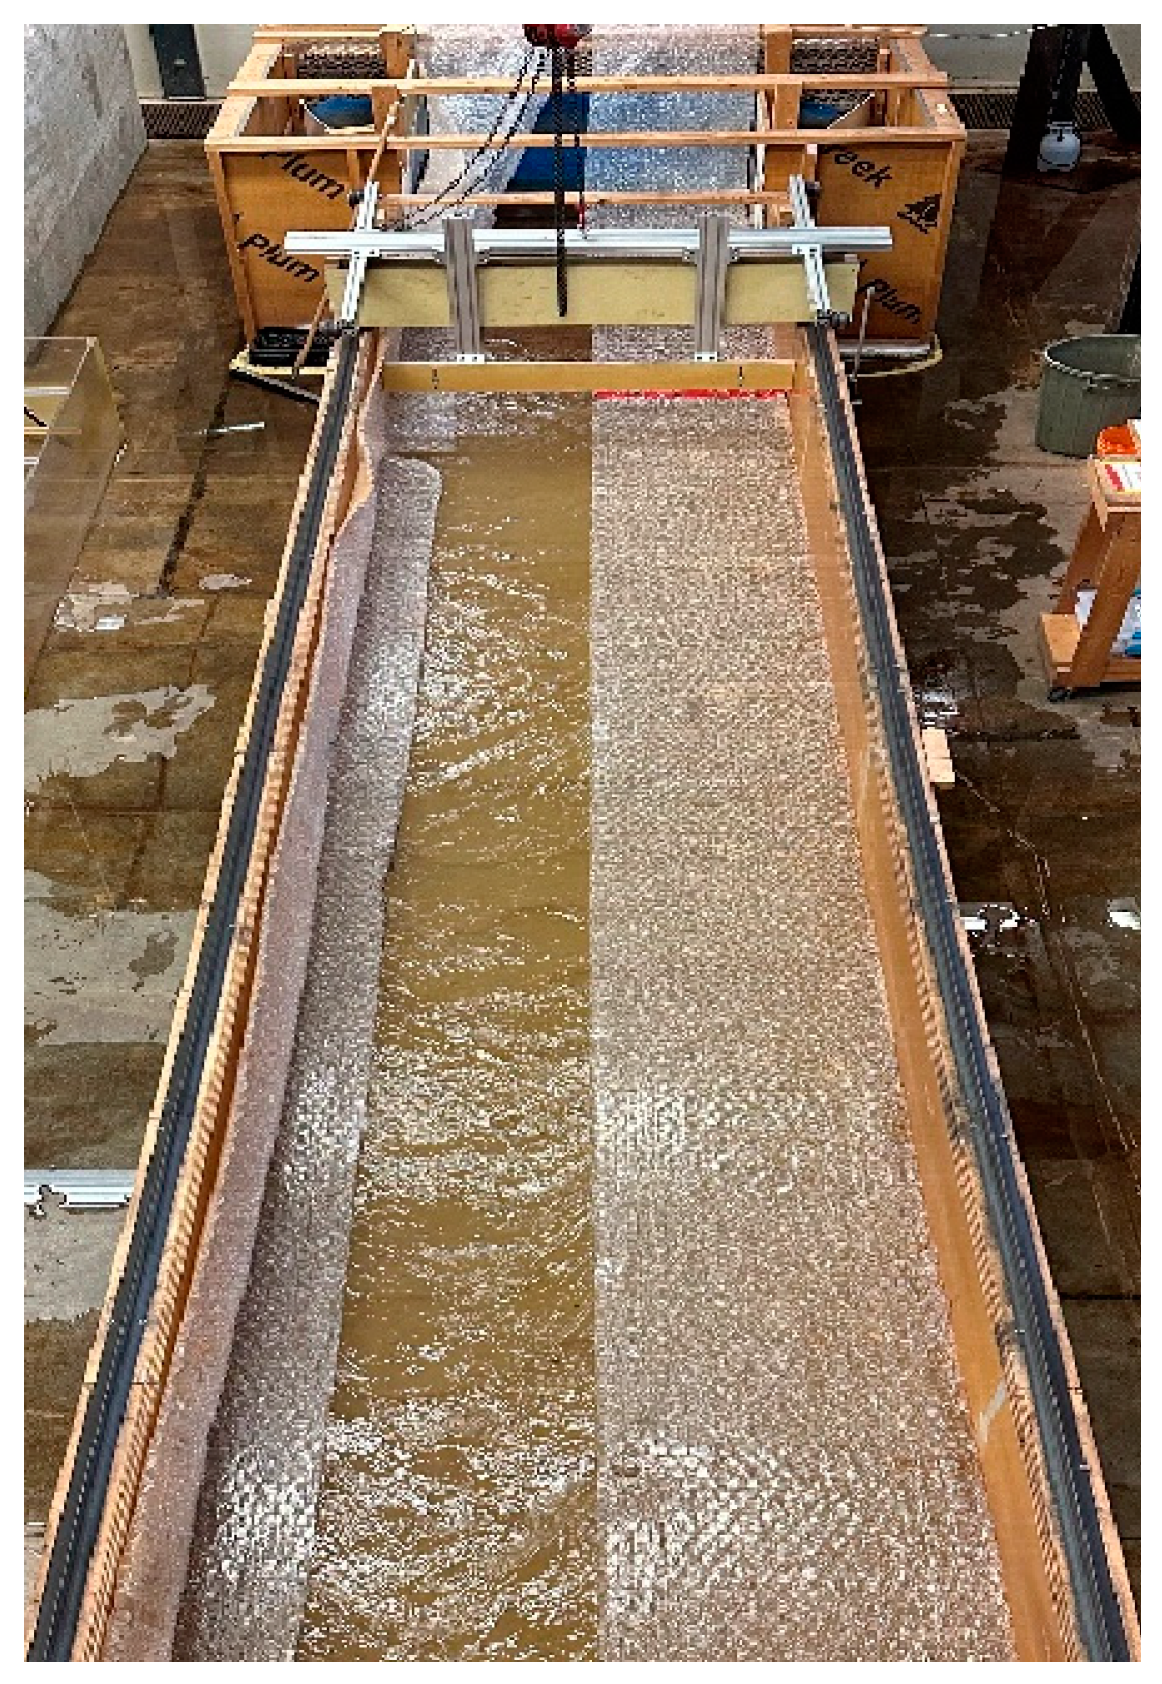
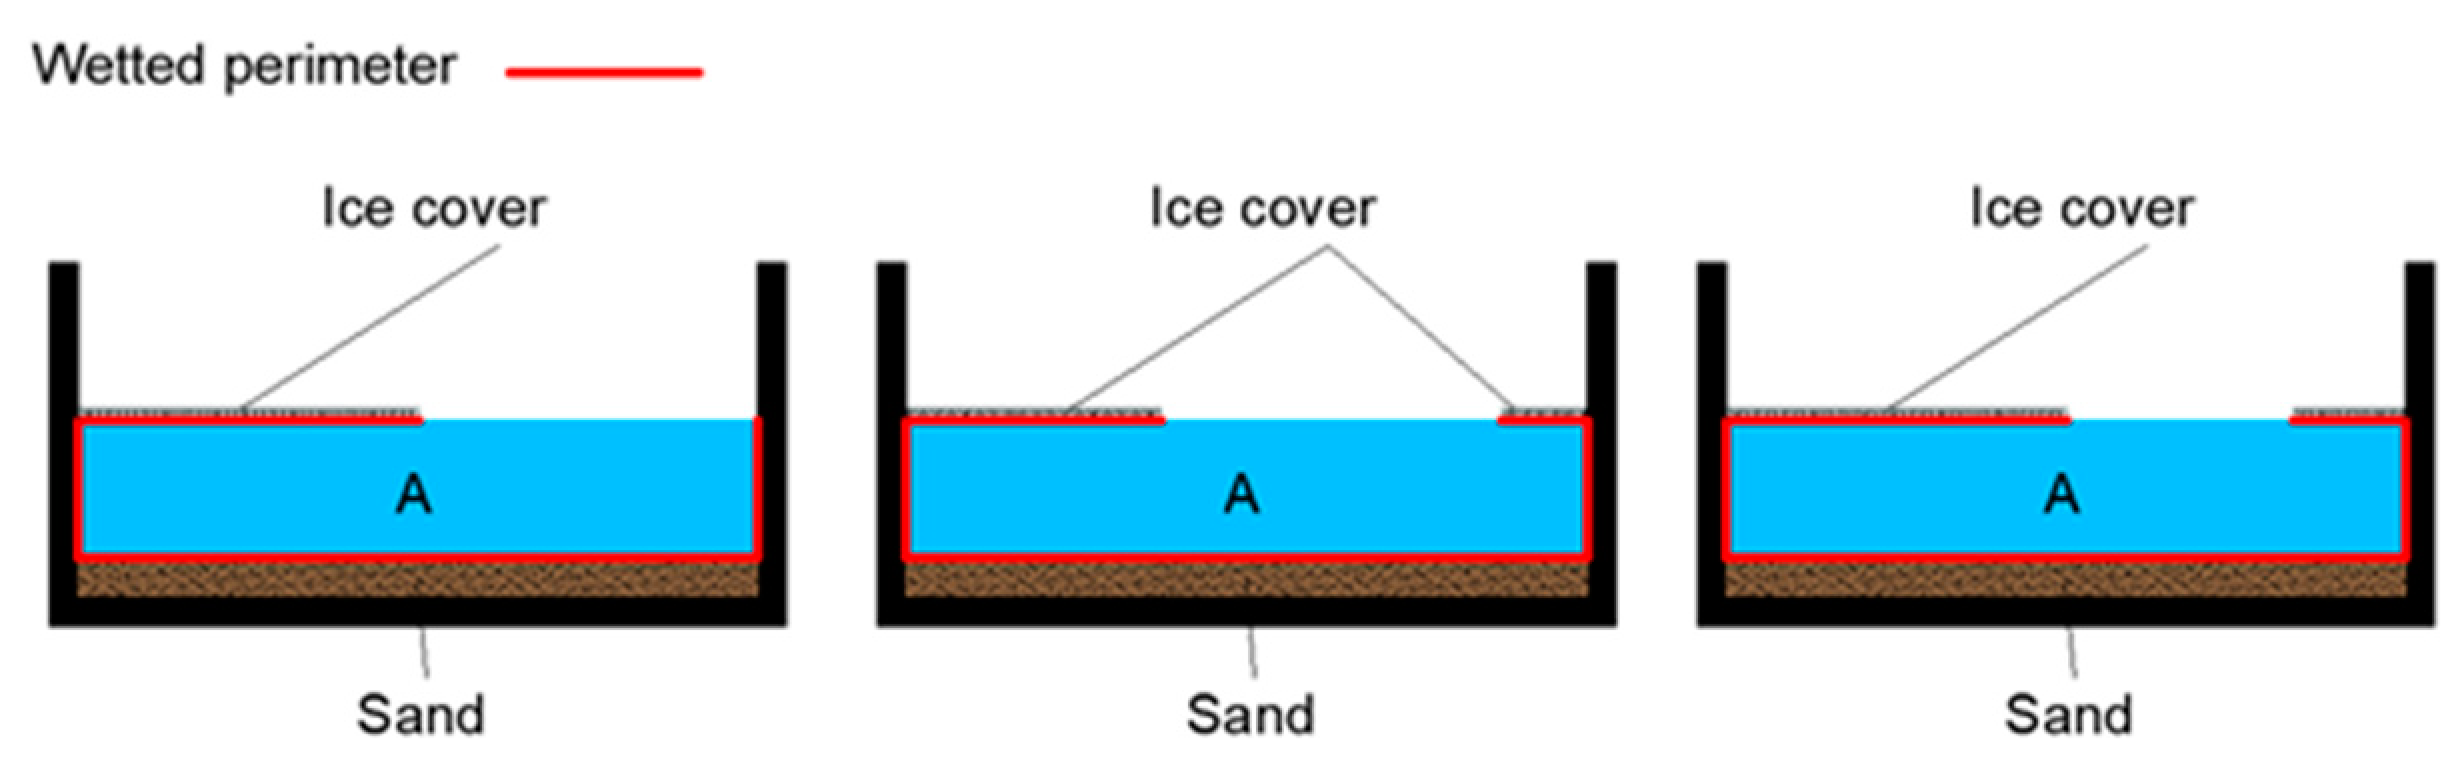
2. Methodology
3. Results and Analysis
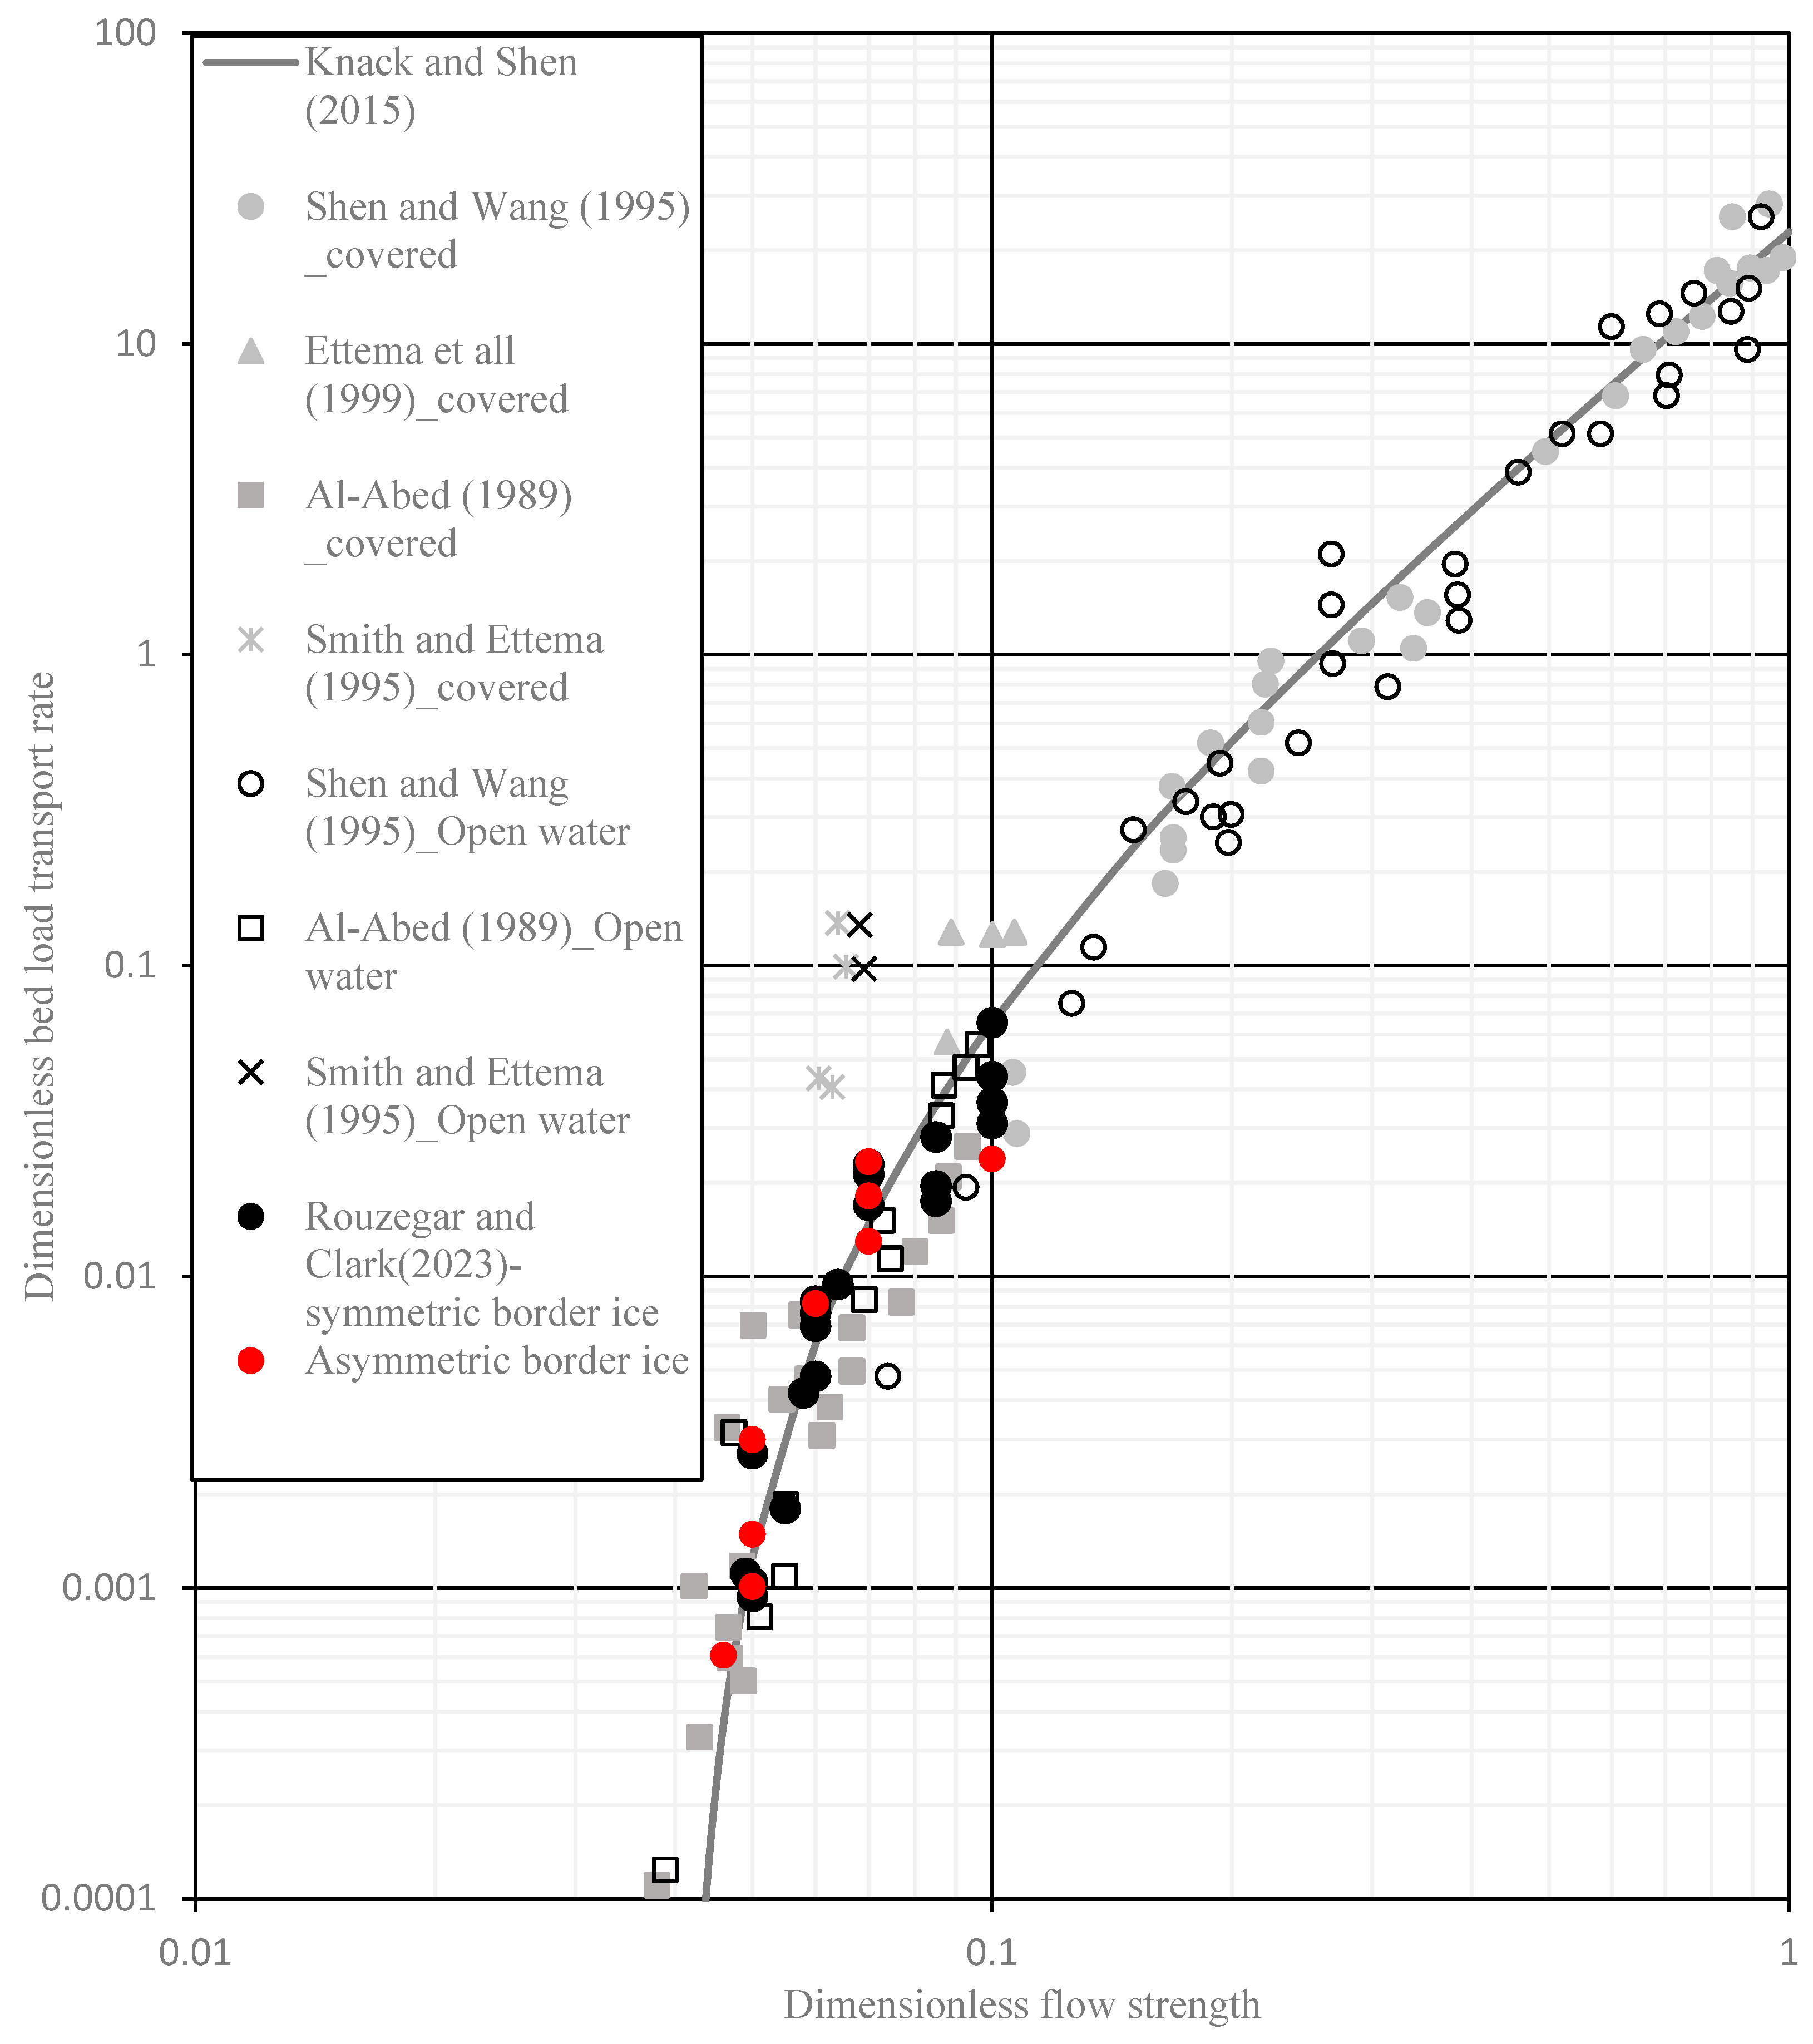
3.1. Cross-Section-Averaged Bedload Transport Rate
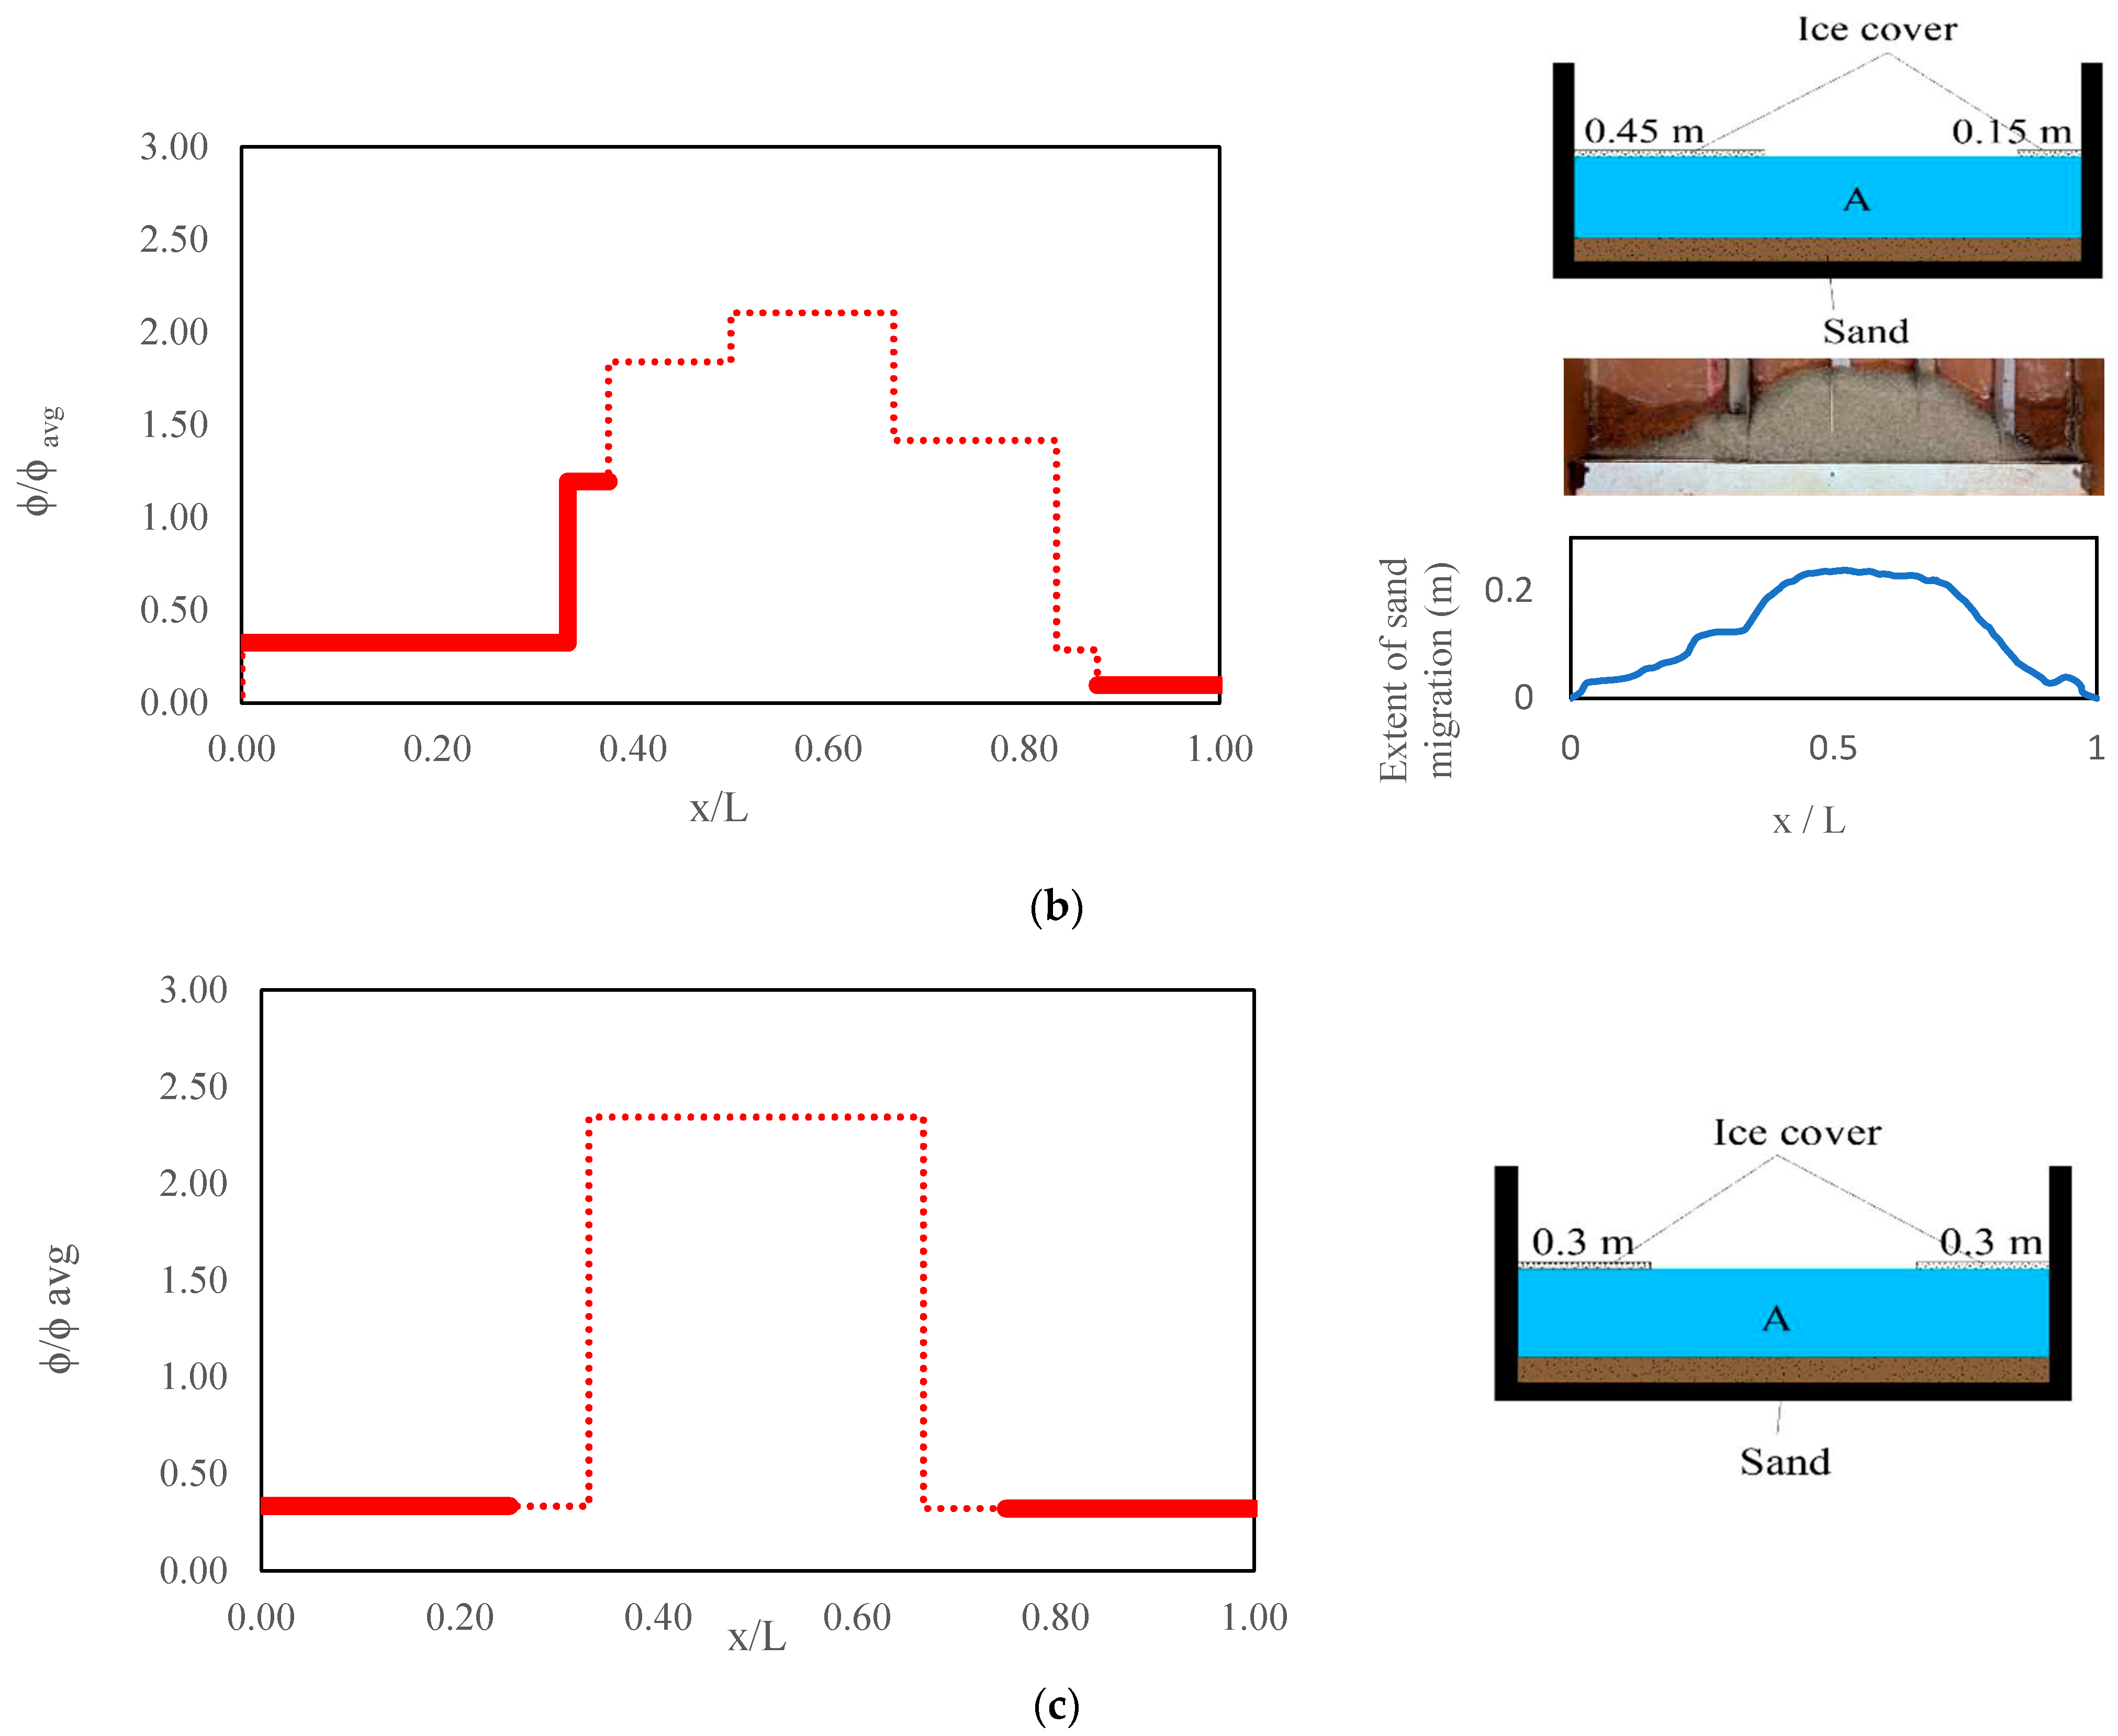
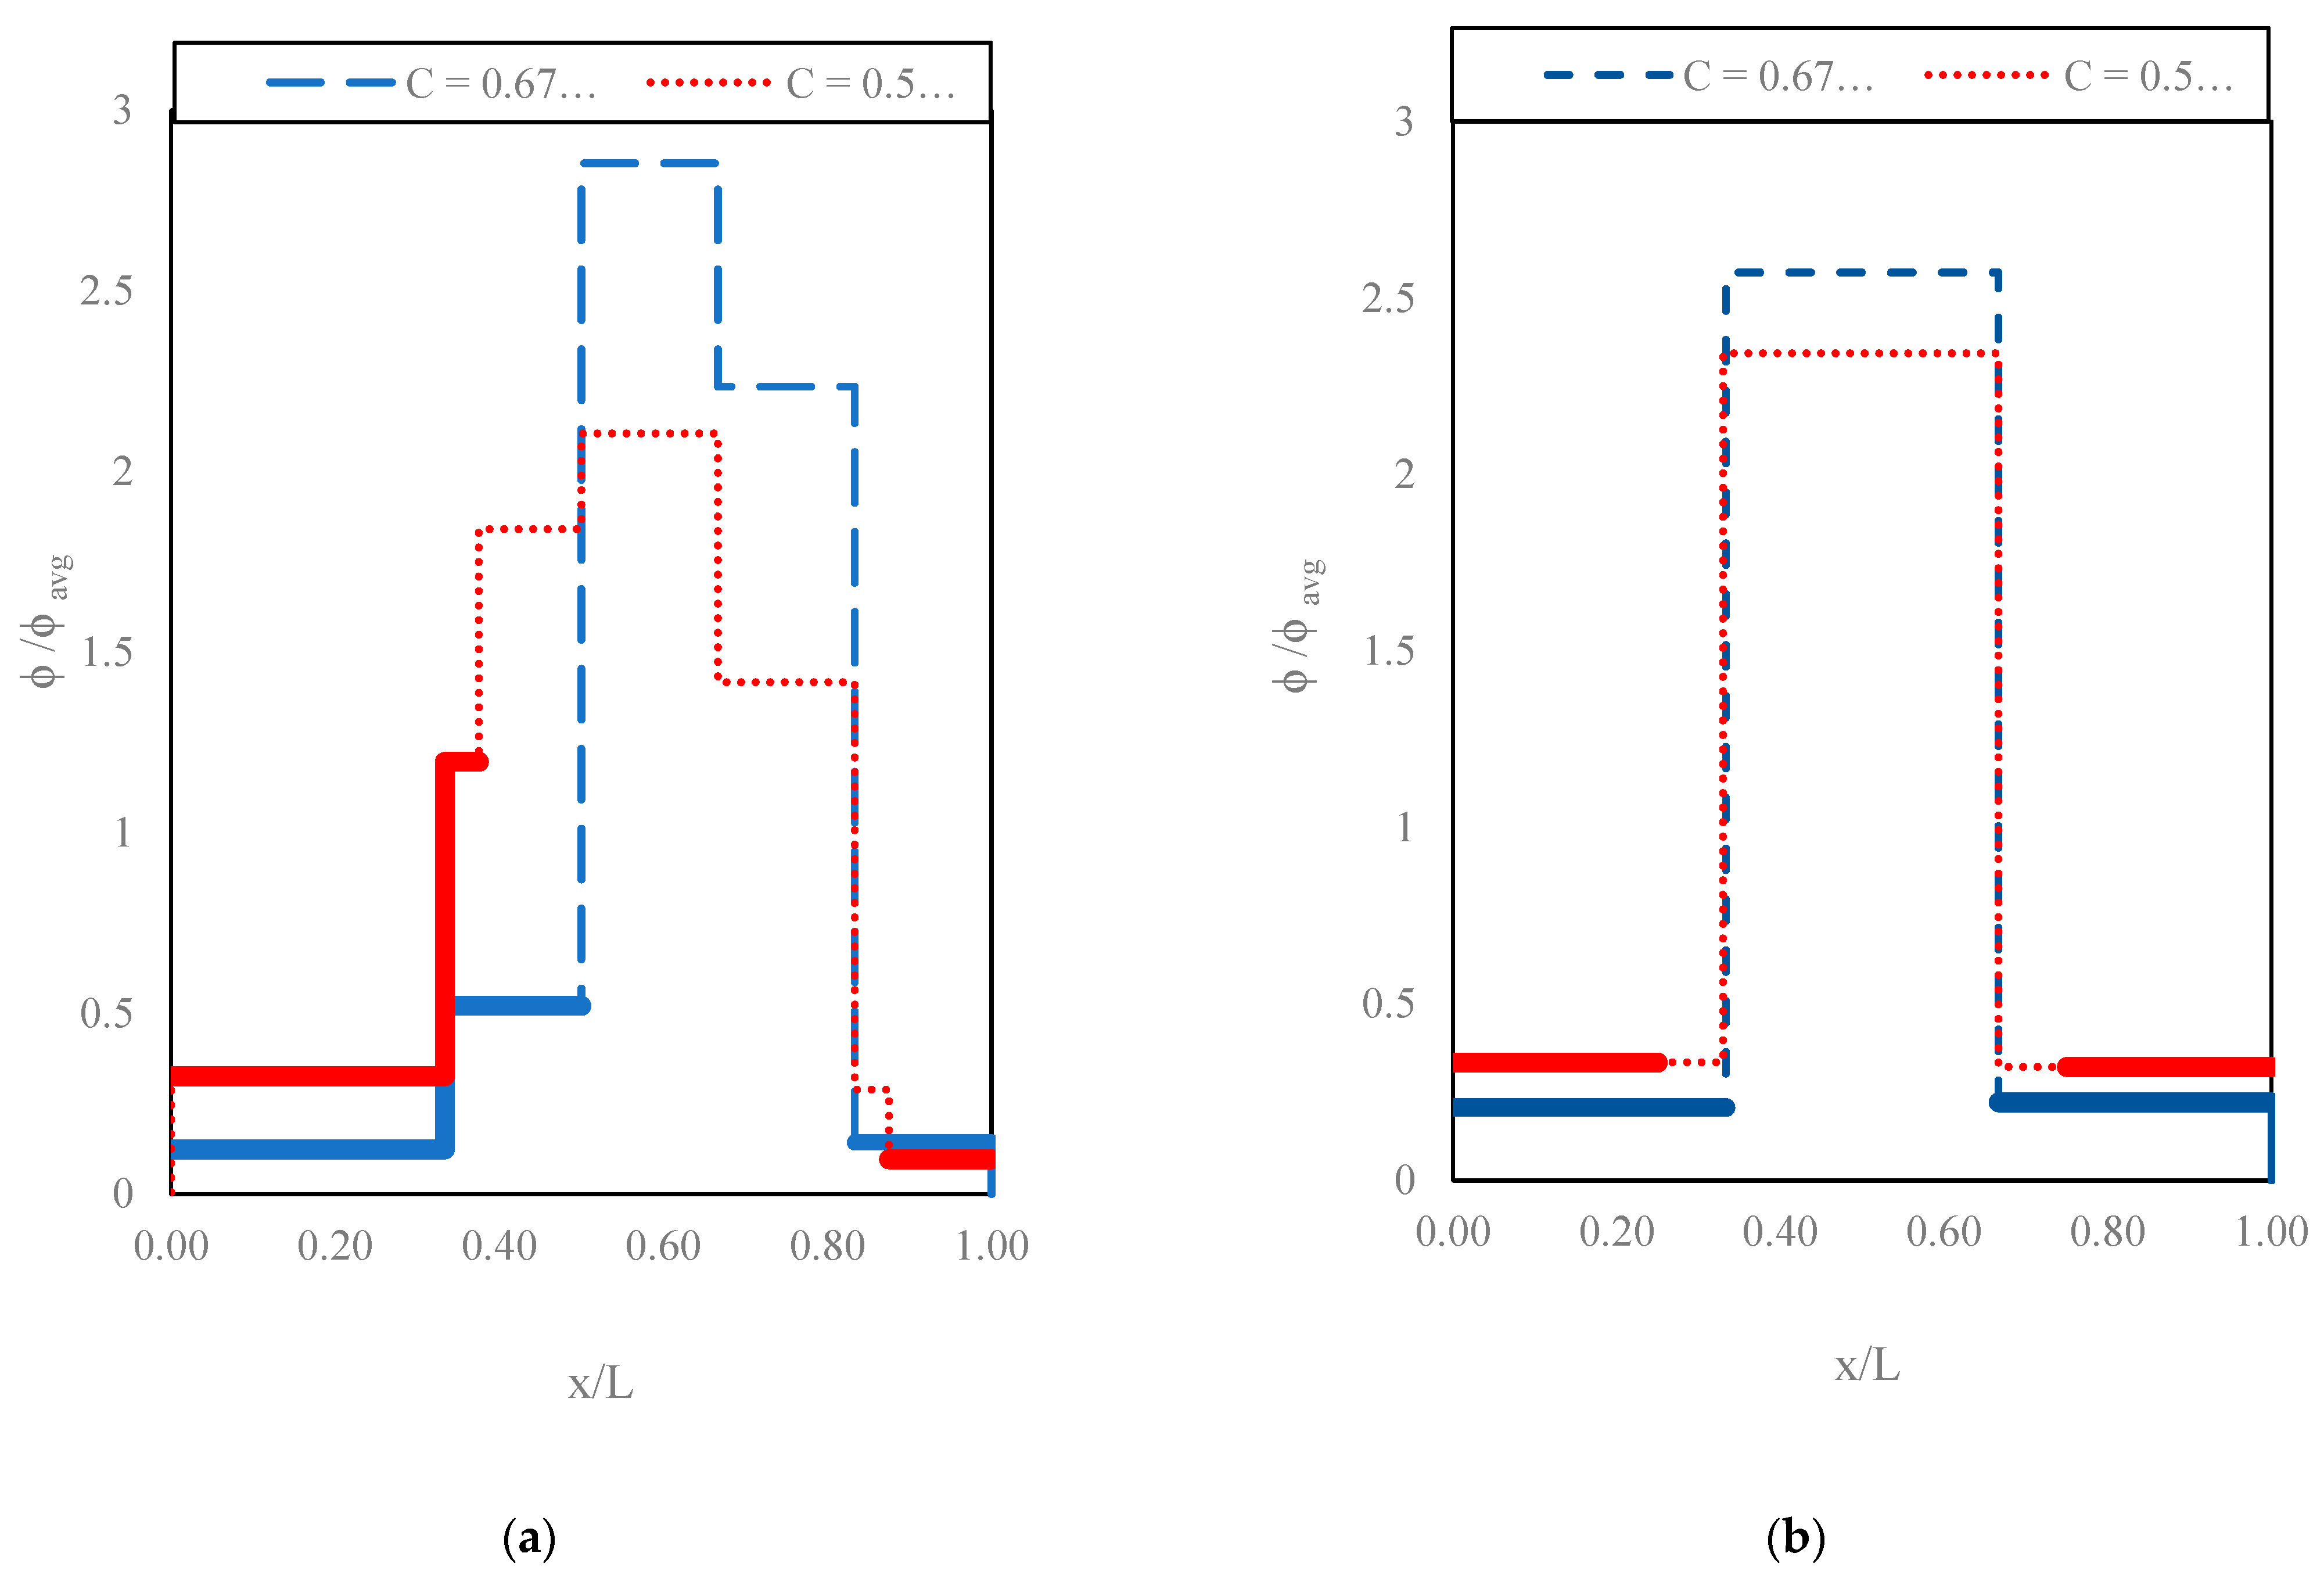
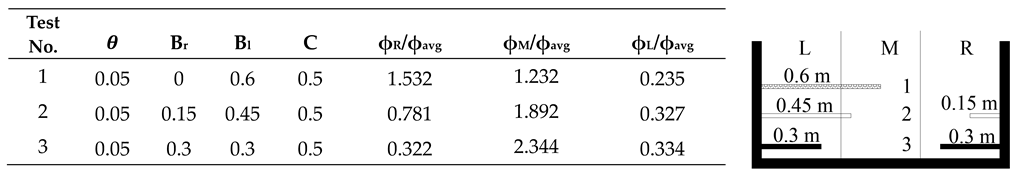
3.2. Effect of Level of Asymmetry
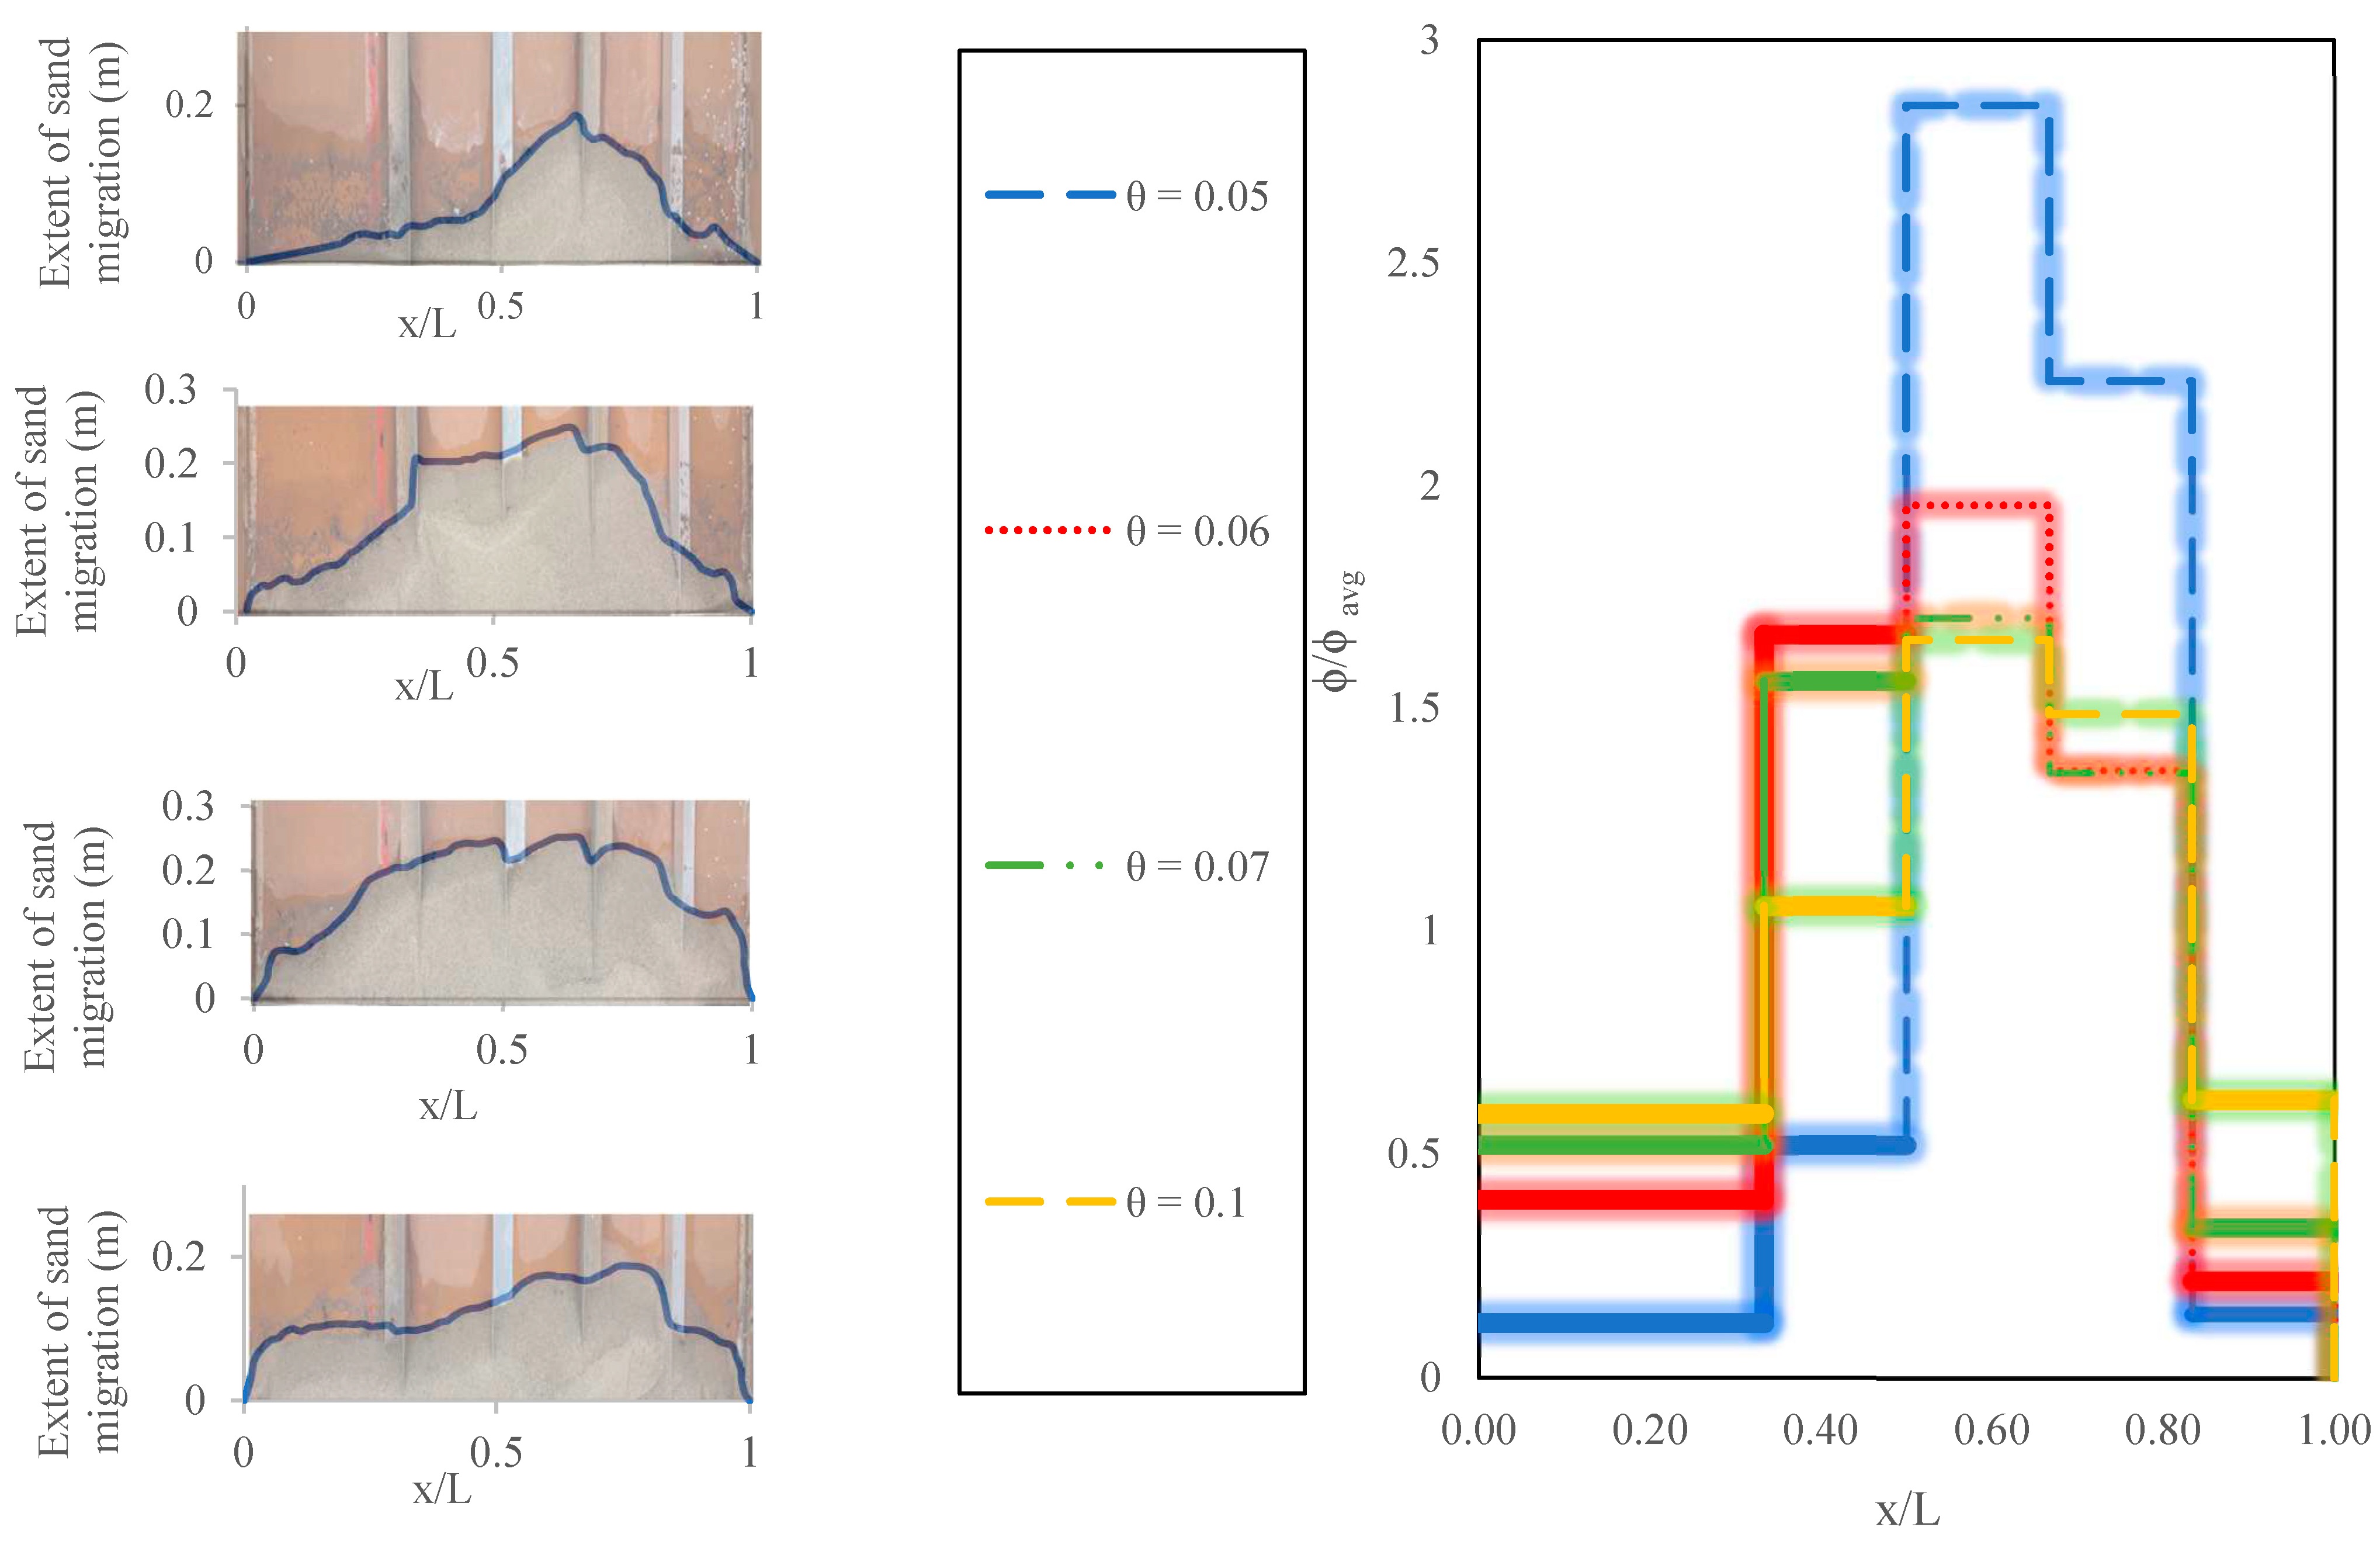
3.3. Effect of Coverage Ratio
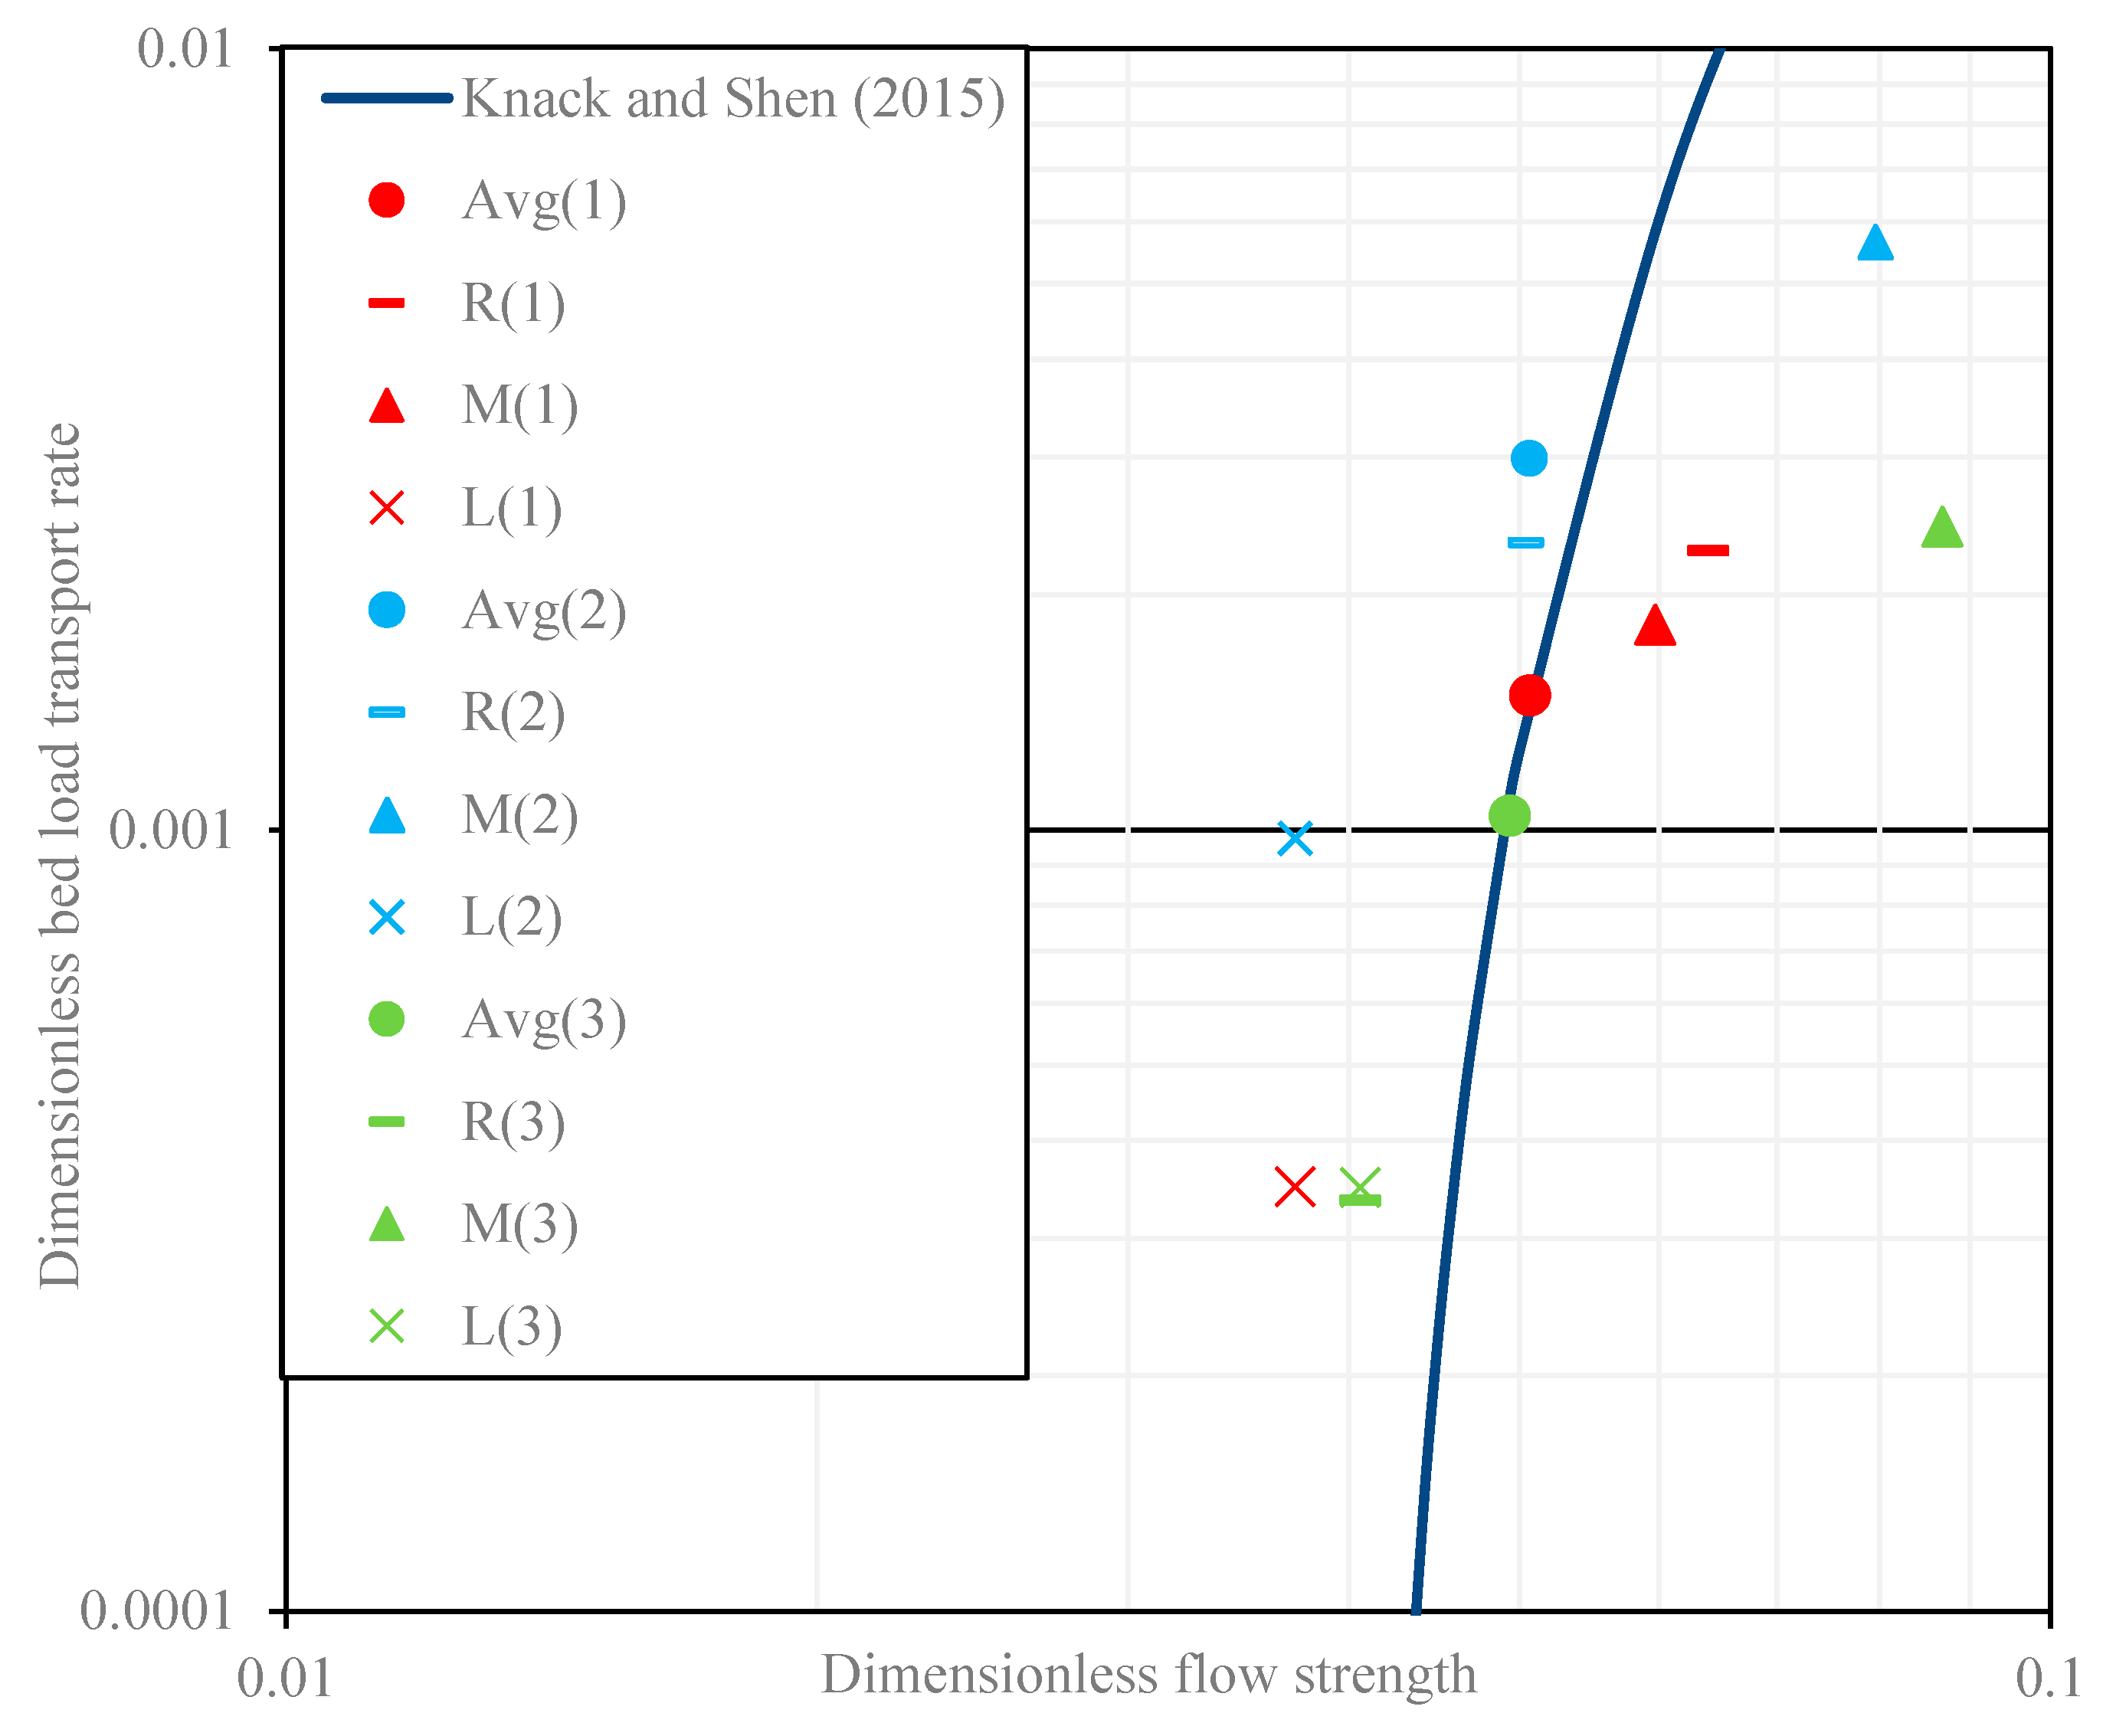
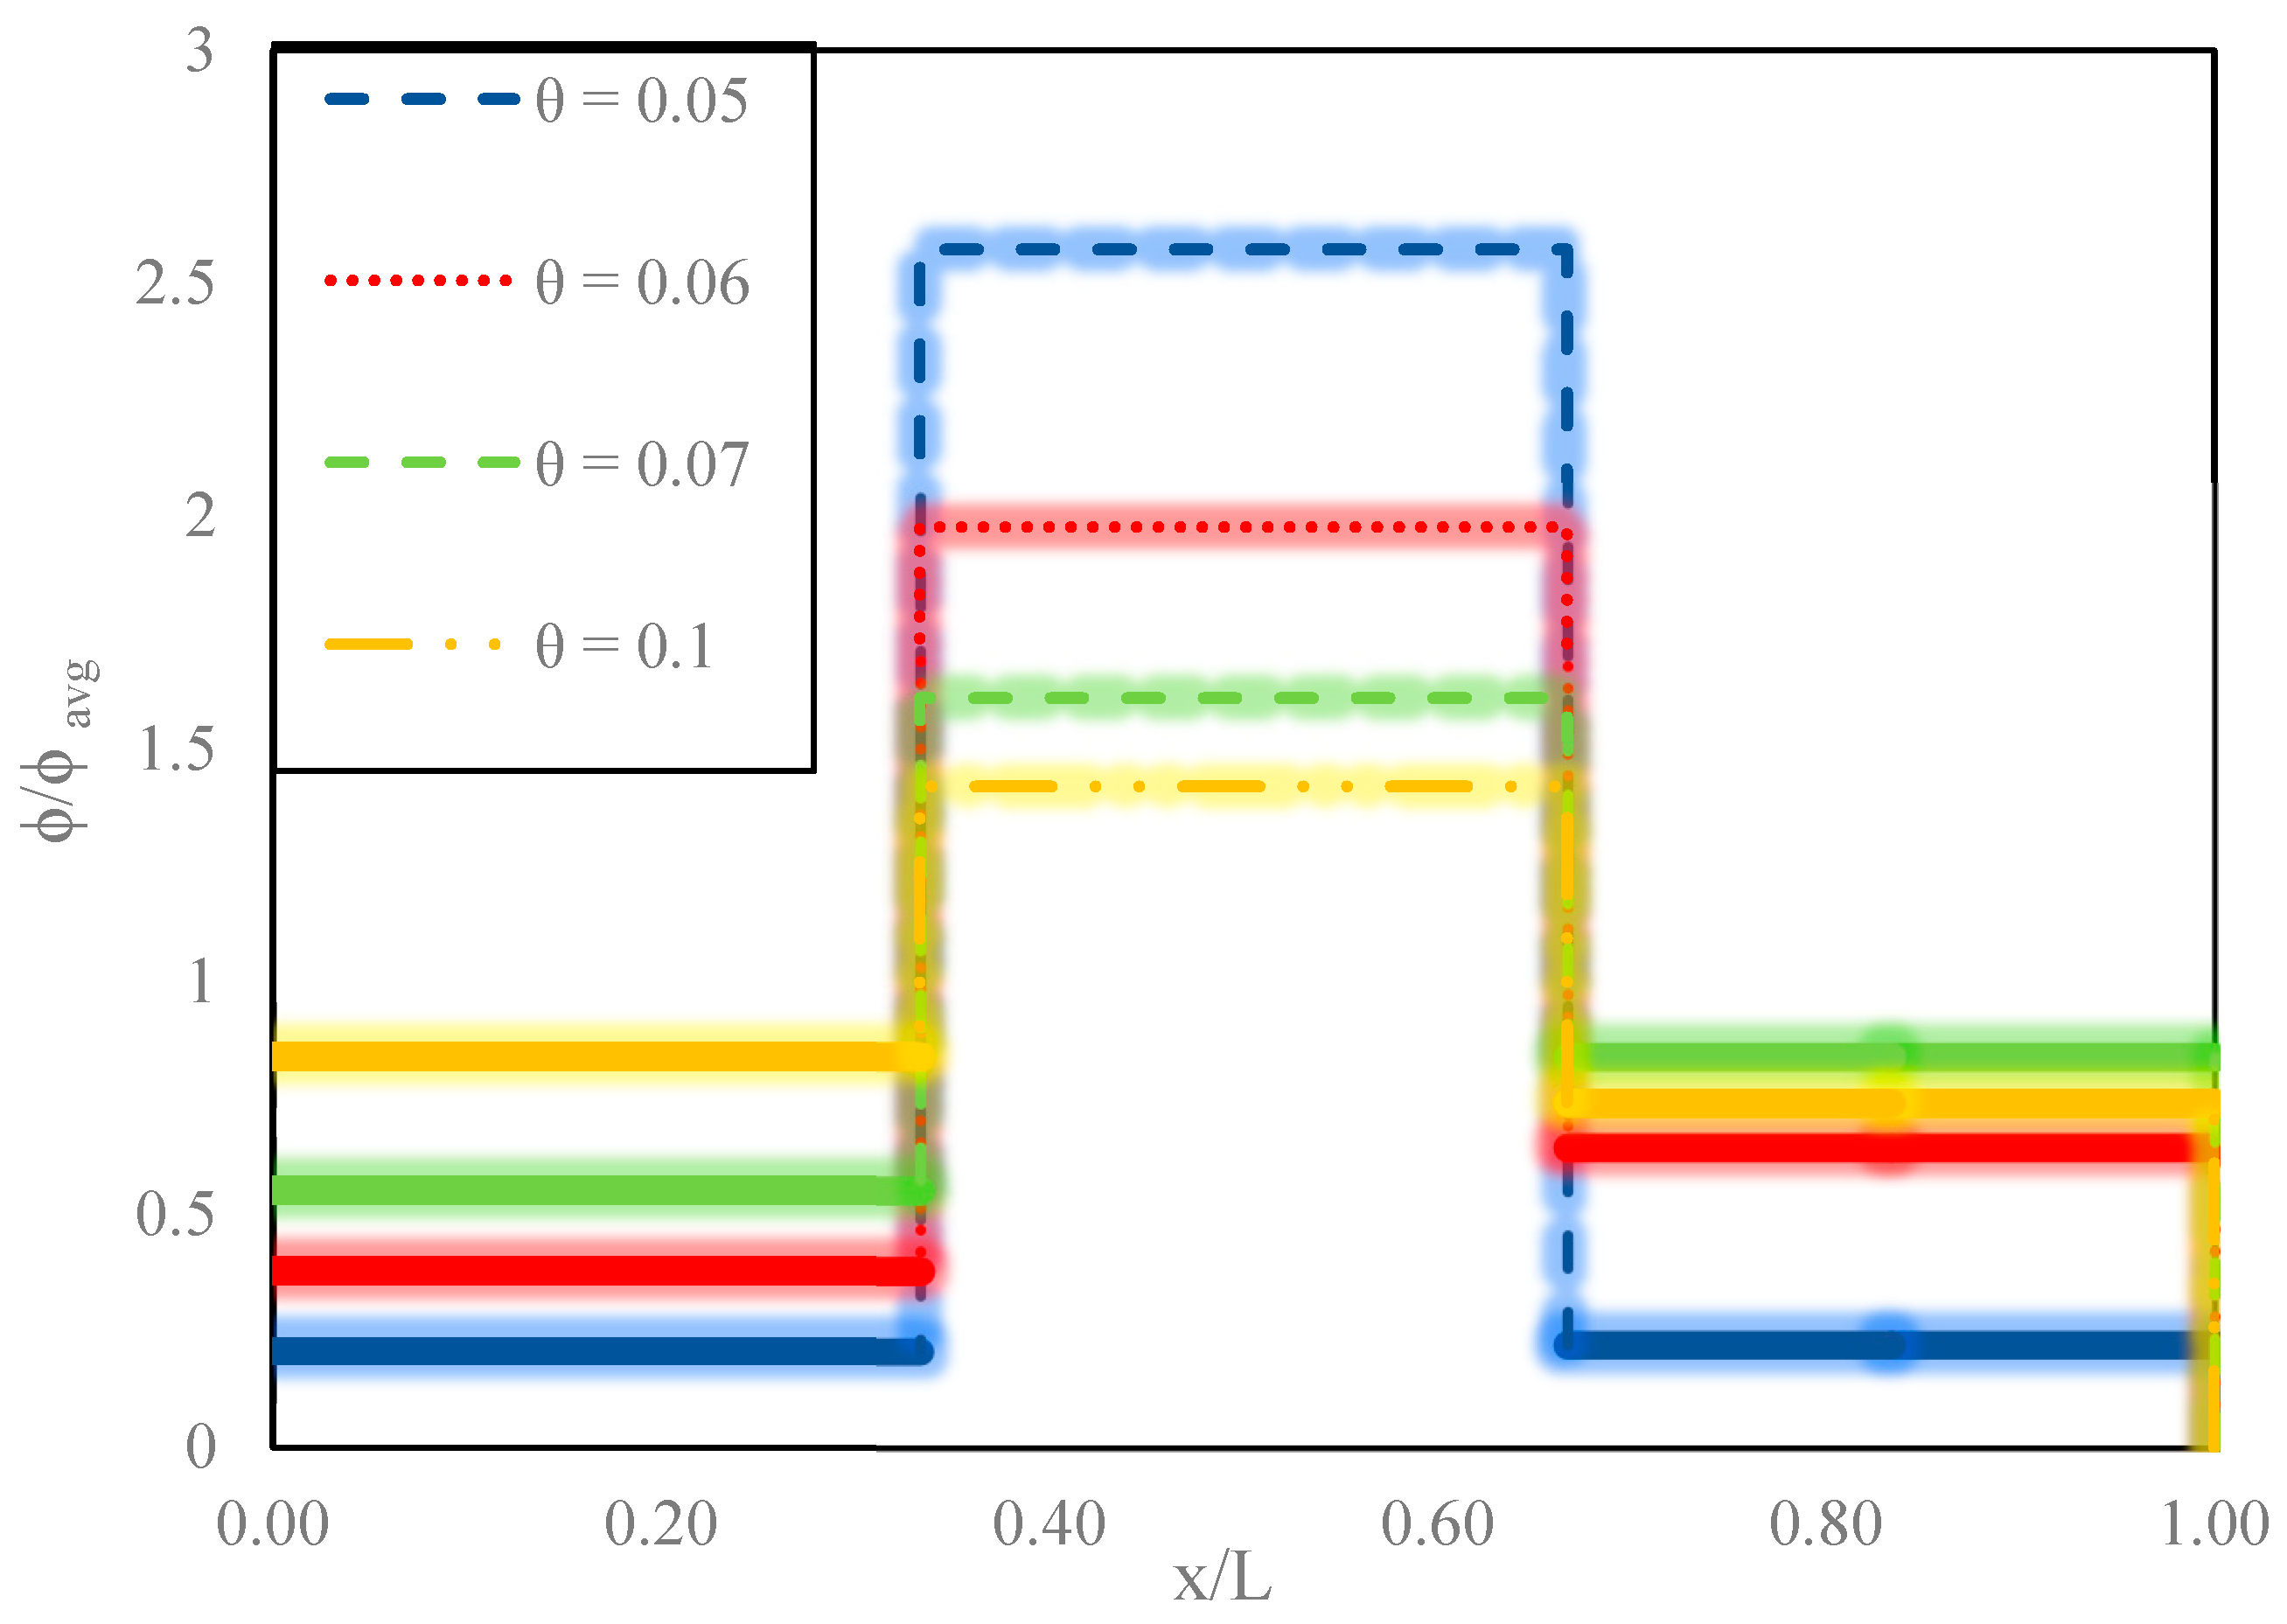
3.4. Effect of Flow Strength
4. Discussion
5. Conclusions
Author Contributions
Funding
Data Availability Statement
Acknowledgments
Conflicts of Interest
References
- Peters, M.; Dow, K.; Clark, S.P.; Malenchak, J.; Danielson, D. Experimental investigation of the flow characteristics beneath partial ice covers. Cold Reg. Sci. Technol. 2017, 142, 69–78. [Google Scholar] [CrossRef]
- Clark, S. Border and Skim Ice. In River Ice Formation; Beltaos, S., Ed.; Committee on River Ice Processes and the Environment: Edmonton, AB, Canada, 2013; pp. 77–106. [Google Scholar]
- Nyantekyi-Kwakye, B.; Essel, E.E.; Dow, K.; Clark, S.P.; Tachie, M.F. Hydraulic and turbulent flow characteristics beneath a simulated partial ice-cover. J. Hydraul. Res. 2021, 59, 392–403. [Google Scholar] [CrossRef]
- Peters, M.; Clark, S.P.; Dow, K.; Malenchak, J.; Danielson, D. Flow Characteristics beneath a Simulated Partial Ice Cover: Effects of Ice and Bed Roughness. J. Cold Reg. Eng. 2018, 32, 1. [Google Scholar] [CrossRef]
- Kimiaghalam, N.; Clark, S.; Dow, K. Estimation of Shear Stress Distribution in a Partially-Covered Channel. In Proceedings of the CGU HS Comm. River Ice Process. Environ. 19th Workshop, Hydraulics of Ice-Covered Rivers, Whitehorse, YT, Canada, 9–12 July 2017. [Google Scholar]
- Majewski, W. Laboratory investigation of the flow in open channels with partial ice cover. In Proceedings of the 11th International Symposium on Ice, Banff, AB, Canada, 15–19 June 1992; pp. 335–345. [Google Scholar]
- Essel, E.E.; Clark, S.P.; Dow, K.; Tachie, M.F. Experimental and numerical investigation of three-dimensional open channel with simulated partial ice-covers. J. Hydraul. Res. 2021, 59, 977–988. [Google Scholar] [CrossRef]
- Ettema, R.; Daly, S.F. Sediment Transport under Ice; US Army Engineer Research and Development Center, Cold Regions Research and Engineering Laboratory: Hanover, NH, USA, 2004. [Google Scholar]
- Lawson, D.E.; Chacho, E.F., Jr.; Brockett, B.E.; Wuebben, J.L.; Collins, C.M.; Arcone, S.A.; Delaney, A.J. Morphology, Hydraulics, and Sediment Transport of an Ice Covered River: Field Techniques and Initial Data; U.S. Army Cold Regions Research and Engineering Laboratory: Hanover, NH, USA, 1986. [Google Scholar]
- Wuebben, J.L. Effects on an ice cover on flow in a movable bed channel. In Proceedings of the 9th International Symposium on Ice, IAHR, Sapporo, Japan, 23–27 August 1988; pp. 137–146. [Google Scholar]
- Wuebben, J.L. A laboratory study of flow in an ice-covered sand bed channel. In Proceedings of the 8th International Symposium on Ice, IAHR, Iowa City, IA, USA, 18–22 August 1986; pp. 3–14. [Google Scholar]
- Shen, H.T.; Wang, D.S. Under Cover Transport and Accumulation of Frazil Granules. J. Hydraul. Eng. 1995, 121, 184–195. [Google Scholar] [CrossRef]
- Al-Abed, N.M.A. Sediment Transport under Ice Covered Channels. Ph.D. Dissertation, University of Kashmir, Srinagar, India, 1989. [Google Scholar]
- Muste, M.; Braileanu, F.; Ettema, R. Flow and sediment transport measurements in a simulated ice-covered channel. Water Resour. Res. 2000, 36, 2711–2720. [Google Scholar] [CrossRef]
- Ettema, R.; Braileanu, F.; Muste, M. Method for Estimating Sediment Transport in Ice-Covered Channels. J. Cold Reg. Eng. 2000, 14, 130–144. [Google Scholar] [CrossRef]
- Ettema, R.; Braileanu, F.; Muste, M. Laboratory Study of Suspended Sediment Transport in Ice-Covered Flow Laboratory Study of Suspended Sediment Transport in Ice-Covered Flow; University of Iowa: Iowa City, IA, USA, 1999. [Google Scholar]
- Sayre, W.W.; Song, G.B. Effects of Ice Covers on Alluvial Channel Flow and Sediment Transport Processes; Iowa Institute of Hydraulic Research: Iowa City, IA, USA, 1979. [Google Scholar]
- Smith, B.T.; Ettema, R. Ice-Cover Influence on Flow and Bedload Transport in Dune-Bed Channels; IIHR Rep. No. 374; Iowa Institute of Hydraulic Research, University of Iowa: Iowa City, IA, USA, 1995. [Google Scholar]
- Meyer-Peter, E.; Muller, R. Formulas for bed-load transport. In Proceedings of the 2nd Meeting of IAHR, Stockholm, Sweden, 7 June 1948; pp. 39–64. [Google Scholar]
- Einstein, H.A. The Bed-Load Function for Sediment Transportation in Open Channel Flows; Technical Bulletin 1026; U.S. Department of Agriculture: Washington, DC, USA, 1950. [Google Scholar]
- Carr, M.L.; Tuthill, A.M. Modeling of Scour-Inducing Ice Effects at Melvin Price Lock and Dam. J. Hydraul. Eng. 2012, 138, 85–92. [Google Scholar] [CrossRef]
- Kolerski, T.; Shen, H.T. Possible effects of the 1984 St. Clair river ice jam on bed changes. Can. J. Civ. Eng. 2015, 42, 696–703. [Google Scholar] [CrossRef]
- Manolidis, M.; Katopodes, N. Bed scouring during the release of an ice jam. J. Mar. Sci. Eng. 2014, 2, 370–385. [Google Scholar] [CrossRef]
- Yang, X.; Zhang, B.; Shen, H.T. Simulation of wintertime fluvial processes in lower Yellow River. J. Sedimentary Res. 1993, 2, 36–43. [Google Scholar]
- Knack, I. Mathematical Modeling of River Dynamics with Thermal-Ice-Sediment Processes; Clarkson University: Potsdam, NY, USA, 2011. [Google Scholar]
- Knack, I.M.; Shen, H.T. A numerical model for sediment transport and bed change with river ice. J. Hydraul. Res. 2018, 56, 844–856. [Google Scholar] [CrossRef]
- Rouzegar, M.; Clark, S.P. Experimental investigation of sediment transport in partially ice-covered channels. Int. J. Sediment Res. 2023, 38, 769–779. [Google Scholar] [CrossRef]
- Rouzegar, M.; Clark, S. Experimental Investigation of Asymmetric Border Ice Effect on Sediment Transport. In Proceedings of the 40th IAHR World Congress, Vienna, Austria, 21–25 August 2023. [Google Scholar]
- Rouzegar, M.; Clark, S.P. Sediment transport rate estimation in partially ice-covered channels. In Proceedings of the 26th IAHR International Symposium on Ice, Montreal, QC, Canada, 19–23 June 2022. [Google Scholar]
- ASTM C128-15; Standard Test Method for Density, Relative Density (Specific Gravity) and Absorption of Fine Aggregates. ASTM International: West Conshohocken, PA, USA, 2015.
- Khosravi, K.; Chegini, A.H.; Cooper, J.R.; Daggupati, P.; Binns, A.; Mao, L. Uniform and graded bed-load sediment transport in a degrading channel with non-equilibrium conditions. Int. J. Sediment Res. 2020, 35, 115–124. [Google Scholar] [CrossRef]
- Nezu, I.; Rodi, W. Open-channel flow measurements with a laser doppler anemometer. J. Hydraul. Eng. 1986, 112, 335–355. [Google Scholar] [CrossRef]
- Tsai, W.; Ettema, R.; Tsai, A.M.W.; Member, A.A. Modified eddy viscosity model in fully developed asymmetric channel flows. J. Eng. Mech. 1994, 120, 720–732. [Google Scholar] [CrossRef]
- Binns, A.D.; da Silva, A.M. On the Quantification of the Bed Development Time of Alluvial Meandering Streams. J. Hydraul. Eng. 2009, 135, 350–360. [Google Scholar] [CrossRef]
- Peters, M. An Experimental Study of the Hydraulic Characteristics Beneath a Partial Ice Cover; University of Manitoba: Winnipeg, MB, Canada, 2015. [Google Scholar]
- Knack, I.; Shen, H.-T. Sediment transport in ice-covered channels. Int. J. Sediment Res. 2015, 30, 63–67. [Google Scholar] [CrossRef]
- Chein, N.; Wan, Z. Mechanics of Sediment Transport; ASCE Press: Reston, VA, USA, 1999. [Google Scholar]
- Blackburn, J.; She, Y. A comprehensive public-domain river ice process model and its application to a complex natural river. Cold Reg. Sci. Technol. 2019, 163, 44–58. [Google Scholar] [CrossRef]
- Shen, H.T. Development of a comprehensive river ice Simulation system. In Proceedings of the 16th IAHR International Symposium on Ice, IAHR, Dunedin, New Zealand, 2–6 December 2002; pp. 142–148. [Google Scholar]
- Steffler, P.; Blackburn, J. River2D: Two-Dimensional Depth Averaged Model of River Hydrodynamics and Fish Habitat, Introduction to Depth Averaged Modeling and User’s Manual; University of Alberta: Edmonton, AB, Canada, 2002. [Google Scholar]


| Test No. | C | Dimensionless Flow Strength (θ) | Q (m3/s) | Water Depth (m) | Sand Bed Slope (%) | Border Ice Width-Right (m) | Border Ice Width-Left (m) |
|---|---|---|---|---|---|---|---|
| IΙ-1 | 0.67 | 0.05 | 0.11 | 0.17 | 0.1 | 0.2 | 0.6 |
| IΙ-2 | 0.67 | 0.06 | 0.16 | 0.22 | 0.1 | 0.2 | 0.6 |
| IΙ-3 | 0.67 | 0.07 | 0.21 | 0.26 | 0.1 | 0.2 | 0.6 |
| IΙ-4 | 0.67 | 0.1 | 0.11 | 0.13 | 0.26 | 0.2 | 0.6 |
| IΙ-5 | 0.5 | 0.05 | 0.1 | 0.16 | 0.1 | 0 | 0.6 |
| IΙ-6 | 0.5 | 0.05 | 0.1 | 0.16 | 0.1 | 0.15 | 0.45 |
| IΙ-7 | 0.5 | 0.07 | 0.2 | 0.24 | 0.1 | 0.15 | 0.45 |
 |
Disclaimer/Publisher’s Note: The statements, opinions and data contained in all publications are solely those of the individual author(s) and contributor(s) and not of MDPI and/or the editor(s). MDPI and/or the editor(s) disclaim responsibility for any injury to people or property resulting from any ideas, methods, instructions or products referred to in the content. |
© 2023 by the authors. Licensee MDPI, Basel, Switzerland. This article is an open access article distributed under the terms and conditions of the Creative Commons Attribution (CC BY) license (https://creativecommons.org/licenses/by/4.0/).
Share and Cite
Rouzegar, M.; Clark, S.P. Sediment Transport Beneath a Simulated Partial Ice Cover: Effects of Asymmetric Border Ice. Water 2023, 15, 4153. https://doi.org/10.3390/w15234153
Rouzegar M, Clark SP. Sediment Transport Beneath a Simulated Partial Ice Cover: Effects of Asymmetric Border Ice. Water. 2023; 15(23):4153. https://doi.org/10.3390/w15234153
Chicago/Turabian StyleRouzegar, Mina, and Shawn P. Clark. 2023. "Sediment Transport Beneath a Simulated Partial Ice Cover: Effects of Asymmetric Border Ice" Water 15, no. 23: 4153. https://doi.org/10.3390/w15234153
APA StyleRouzegar, M., & Clark, S. P. (2023). Sediment Transport Beneath a Simulated Partial Ice Cover: Effects of Asymmetric Border Ice. Water, 15(23), 4153. https://doi.org/10.3390/w15234153