Article

Location and Extents of Scour Hole around an Erodible Spill-through Abutment under Clear Water Condition and the Abutment Classification

1
Water Resource Engineering and Management, National University of Science and Technology (NUST), Islamabad 44000, Pakistan
2
School of Civil and Environmental Engineering, Georgia Institute of Technology, Atlanta, GA 30332, USA
3
Department of Civil and Environmental Engineering, Hanyang University ERICA, Ansan 15588, Republic of Korea
*
Author to whom correspondence should be addressed.
Water 2023, 15(23), 4155; https://doi.org/10.3390/w15234155
Submission received: 5 October 2023 / Revised: 26 November 2023 / Accepted: 26 November 2023 / Published: 30 November 2023
(This article belongs to the Special Issue Sediment Transport in Open Channel Flow)

Abstract

:
Bridge abutment scour is a complex phenomenon, which significantly affects bridge stability and is responsible for the damage and failures of many bridges over waterways across the world. Given the widespread and devastating human and societal costs, numerous experimental studies have been conducted to find the mechanisms of bridge abutment scour, and several empirical and mathematical prediction models are available. However, the location of the scour hole and its extents have not been investigated in detail, which is one of the important parameters, not only for the bridge stability itself, but also for the safety of structures around the bridge and their design. Thus, in this study, laboratory experiments were carried out using several different lengths of erodible abutment under different flow conditions to suggest a new mathematical criterion for abutment classification with respect to the location of scour holes. Furthermore, additional analysis was conducted to locate the point of the deepest scour depth and extent of the scour hole around the abutment. Both in transverse and flow direction, the location of the scour hole and the point of the deepest scour are governed by the geometric contraction ratio. This research will be useful in analyzing the bridge safety itself as well as safety of the river training works close to the bridge with respect to the location and extents of the scour hole.

1. Introduction

Bridges are one of the most critical elements of highways and railways with respect to design, economy, and safety. Failure and damage of a bridge involves high repair costs, traffic disturbance, and the loss of precious lives in some cases. In the United States of America, about 84% of the bridges are over waterways [1,2]. Statistics show that almost 60% of the bridge damage and failure is attributed to hydraulic parameters, where scour plays the most critical role in their foundation [3,4,5]. Tropical Storm Alberto in 1994 accounted for USD 130 million budget for bridges’ repairs in the state of Georgia, where more than 500 bridges were damaged [6]. Thus, since the 1950s several researchers have contributed to the investigation of individual bridge scour components [7,8,9,10] and their interaction including lateral contraction, abutment, pier, and vertical contraction scour [11,12,13,14,15,16,17,18,19,20,21].
In addition to the interaction among different scour components, Zolghadr et al. [22] and Nabaei et al. [23] explored the effect of artificial roughening elements and vegetation on the maximum scour depth by conducting laboratory experiments with several different widths of the fixed abutment. Fathi et al. [24] also conducted a laboratory experiment and they pointed out, because of rock riprap sliding over time during the scouring, the point of the maximum scour relocated from the upstream corner to the downstream of the abutment. Raikar et al. [25] elucidated the effect of flow unsteadiness on abutment scour by applying a hydrograph in their experiment, and Bonakdari et al. [26] used machine learning to estimate the abutment scour depth in a marine environment, instead of applying a conventional regression-based analysis to the experimental results.
Recently, historical flood patterns have altered by the recent climate change scenario. An example is the 2009 flooding in the metro Atlanta area, where the intense heavy rainfalls have resulted in reportedly 18 gauges exceeding a 500-year flood discharge [27,28]. Another outcome of the increased discharge is bridge submergence, which causes frequent pressure flow conditions (submerged orifice flow and overtopping flow) resulting in a significant contribution of contraction scour by vertical flow contraction. Vertical contraction scour has thus gained more attention by several researchers [29,30,31,32,33,34,35] and Abdelhaleem et al. [36] found pressure flow conditions increased scour depth by a factor between 2.15 and 9.81 times compared to the cases under non-pressure flow conditions.
One of the important parameters for a bridge design is the calculated maximum scour depth [7,37,38] which accounts for the interaction among scour components including local scour as well as vertical/lateral contraction scour. However, as pointed out by [20,24] the point of deepest scour may or may not fall under the bridge. Thus, designing of the bridge pile cap depth based on the calculated maximum scour depth may be a conservative approach. Conversely, the actual interactive scour under the recent climate change scenario may result in an even higher value in comparison to the case under historical floods because of larger discharges and a significantly high contribution of the vertical contraction scour component by submerged orifice flows and/or overtopping flows. Thus, understanding the important aspect of location and extent of the scour hole using pertinent hydraulic parameters such as geometric and flow contraction in a bridge, flow structures, and level of turbulence should be explored [39,40]. However, only a few studies have contributed to abutment classification criterion [20,41,42].
In a compound channel, the interaction between flow in a main channel and in a floodplain can be dictated by the length of the abutment. If the abutment is well set back from the bank of the main channel, the lateral flow convergence by the existing abutment does not affect the main channel flow. However, if the abutment is sufficiently long, it develops the flow interaction and redistribution between the main channel and the floodplain. Flow convergence over the bank has complex mechanics and affects the scour process. The abutments are thus categorized as long, intermediate, and short setback abutments. Melville [41] classified abutments based on the ratio between L a = length of abutment and Y 1 = approach flow depth as follows:
0 < L a / Y 1   1 Long   setback   abutment   ( LSA ,   similar   to   a   pier ) 1 < L a / Y 1   25 Intermediate   setback   abutment 25 < L a / Y 1 Short   setback   abutment   ( SSA )
Later, Chang and Davis [42] assumed that mixing of the floodplain and main channel flow makes a uniform redistribution for the short setback abutment, and thus the velocity under the bridge is uniform for the entire cross-section. Additionally, it was assumed that for long setback abutments, the interaction between the main channel and the floodplain does not occur, so the discharge per unit width between the approach flow and bridge is the same as that of the geometric contraction ratio. This criterion is not applicable for overtopping flow conditions as the flow redistribution is affected by the component of flow overtopping the bridge. The criterion suggested by Chang and Davis [42] is given in Equation (2):
0.75   W   <   Setback Long   setback   abutment 5.0   Y m o < Setback   distance   0.75   W Intermediate   setback   abutment Setback   distance     5.0   Y m o Short   setback   abutment
where Y m o = hydraulic depth in the main channel and W = the opening width of the floodplain within the bridge section. Hydraulic Engineering Circular number 18 (HEC-18) makes an abutment classification based on the dimensionless variable W / Y f 1 (where Y f 1 is approach flow depth in the floodplain). The criterion classifies a long setback abutment (LSA) where the dimensionless width of the floodplain is sufficiently large ( W / Y f 1 > 5.0 ) such that the deepest point of the scour hole remains in the floodplain. For W / Y f 1 < 5.0 , the abutment is classified as a short setback abutment (SSA) [6]. A modification in the criterion was suggested by Hong [20] which classifies LSA as W / Y f 1 > 6.0 and SSA as W / Y f 1 < 6.0 . More recently, Xu et al. [43] investigated the effect of abutment length on the abutment scour depth and suggested length parameter which includes abutment length, flow depth, and channel width, for scaling abutment scour depth.
However, the abutment classification has not been extended to location and the extent of the scour hole even though these factors play an important role in the design and safety of the bridge itself and the design of river training works in the vicinity of the bridge, both in an upstream and downstream direction. Furthermore, almost all of the previous studies on abutment scour have focused on the simpler and idealized situations of scour in fixed abutments placed in straight rectangular channels even though many abutments are erodible and sited in compound channels whose geometry and hydraulic characteristics are site-specific in the real world. Therefore, to suggest a new criterion for abutment classification with respect to the location of a scour hole, laboratory experiments were carried out in a flume using several different lengths of erodible spill-through abutment in a compound channel under clear water scour (CWS) conditions. Furthermore, additional analysis was conducted to locate the point of deepest scour and extent of the scour hole around the abutment that can be readily useful for designing a bridge foundation depth as well as river training works close to the bridge.

2. Methodology

A flume was modelled in the hydraulics laboratory of the Georgia Institute of Technology, Atlanta, GA, USA, with a length of 24.4 m, width of 4.5 m, and height as 0.76 m having a constant head overhead tank. The site of Towaliga River near Macon, Georgia was reproduced with slight modifications, which included horizontal floodplains on both sides of a main channel, preserved main channel bathymetry, and straightening of the river section for accurate velocity and turbulence measurements along straight and parallel stream-lines as in Hong et al. [29] and Hong and Abid [44].

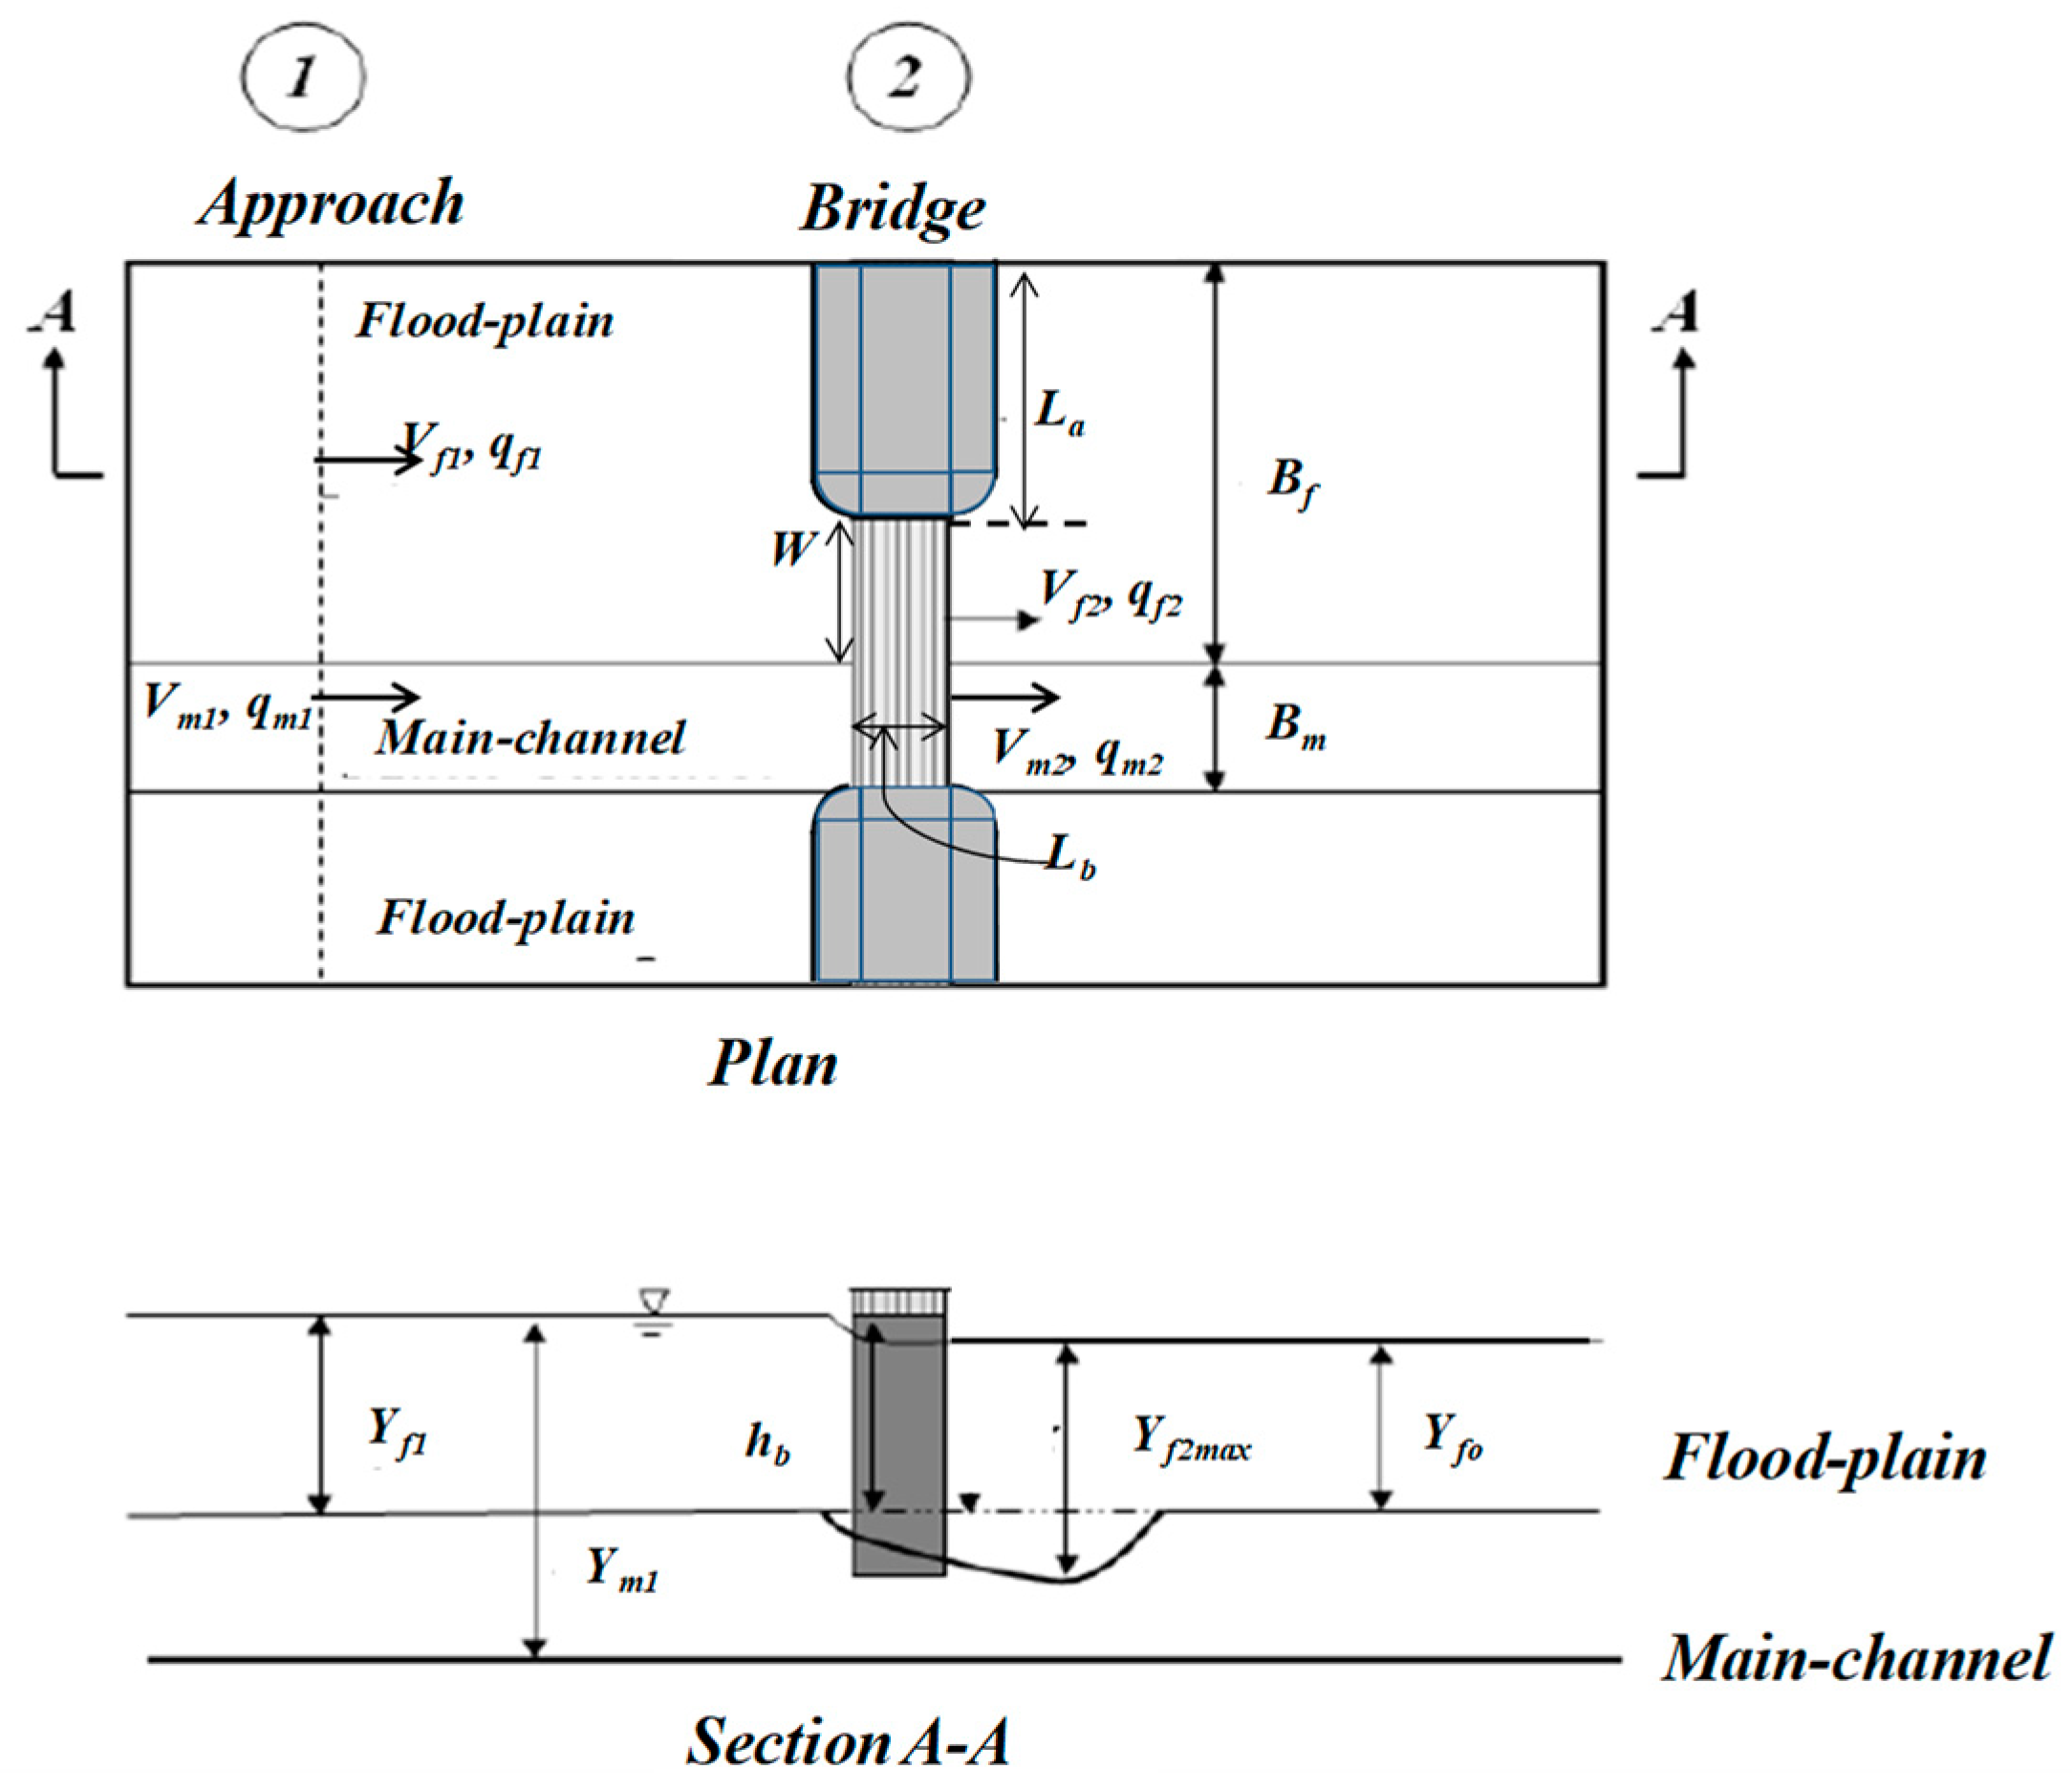
2.1. Model Specifications

A set of variables, used in this study, defined for the compound channel, are shown in Figure 1 with subscript “1” and “2” for the approach and bridge section, respectively, and subscript “f’ and “m” for the floodplain and main channel, respectively. Figure 2 shows the variables involving the location and extents of the scour hole, where Bf is the width of the floodplain, Lb is the perpendicular size of the bridge in the flow direction, Ls is the distance of the point of deepest scour from the floodplain edge in a lateral direction, Lm is the distance of the point of deepest scour from the toe of the abutment in a lateral direction, and Lx is the distance of the point of deepest scour from the upstream edge of the bridge in a flow direction.
The flume had five main sections, namely an inlet section, an approach section, a test section, a downstream section, and an end/tailgate section. The inlet section had a 0.3 m diameter pipe inflow with an arrangement which ensures inflow turbulence diffusion and the smooth entry of water into the 10.66 m long approach section. The approach section geometry consisted of a main channel with floodplains on both sides such that the floodplain to the main channel width ratio (Bf/Bm) was 3:1 and 1:1 on the left and right floodplains, respectively, while looking in a downstream direction. A coarser sand grain size of 3.3 mm was filled in the initial part of the approach section (5.5 m long) to ensure clear water approach conditions and to develop fully a rough, turbulent flow condition. For the remaining part of the flume, including a 1.53 m long test section, the sediment size was kept as 1.1 mm uniform sand having a geometric standard deviation σg = 1.13. As shown in Figure 3, the spill-through abutments in the test sections were of five different abutment lengths (La) to floodplain width (Bf) ratios in the left floodplain such that La/Bf was 0.41, 0.53, 0.71, 0.77, and 0.88. The abutment side slope was kept as 2:1 with riprap protection. The size of the riprap was 9.2 mm having a geometric standard deviation σg = 1.25 with the thickness and area of the riprap apron as per the Hydraulic Engineering Circular-23. Figure 3 shows the details of the test section with a picture of it in Figure 3a, looking from downstream of the flume, and a schematic test cross-section in Figure 3b, with five different abutment ratios within the left floodplain. The 2.6 m long downstream section followed by the test section again consisted of a sediment size of 3.3 mm uniform material to accumulate the scoured sediment of the test section. An adjustable tail gate was installed in the end of the flume to control the flow depth. Water was re-circulated through underground sump by using two pumps and an overhead constant head water tank. As shown in Figure 3a, a standard two-lane bridge deck used by the Georgia Department of Transportation (DOT) for rural area was reproduced with a 1:40 scale in the experiments to simulate different flow conditions including free (F), submerged orifice (SO), and overtopping (OT) flows. The acoustic Doppler velocimeter (ADV) and point gauge were used to measure the bathymetry at the equilibrium.

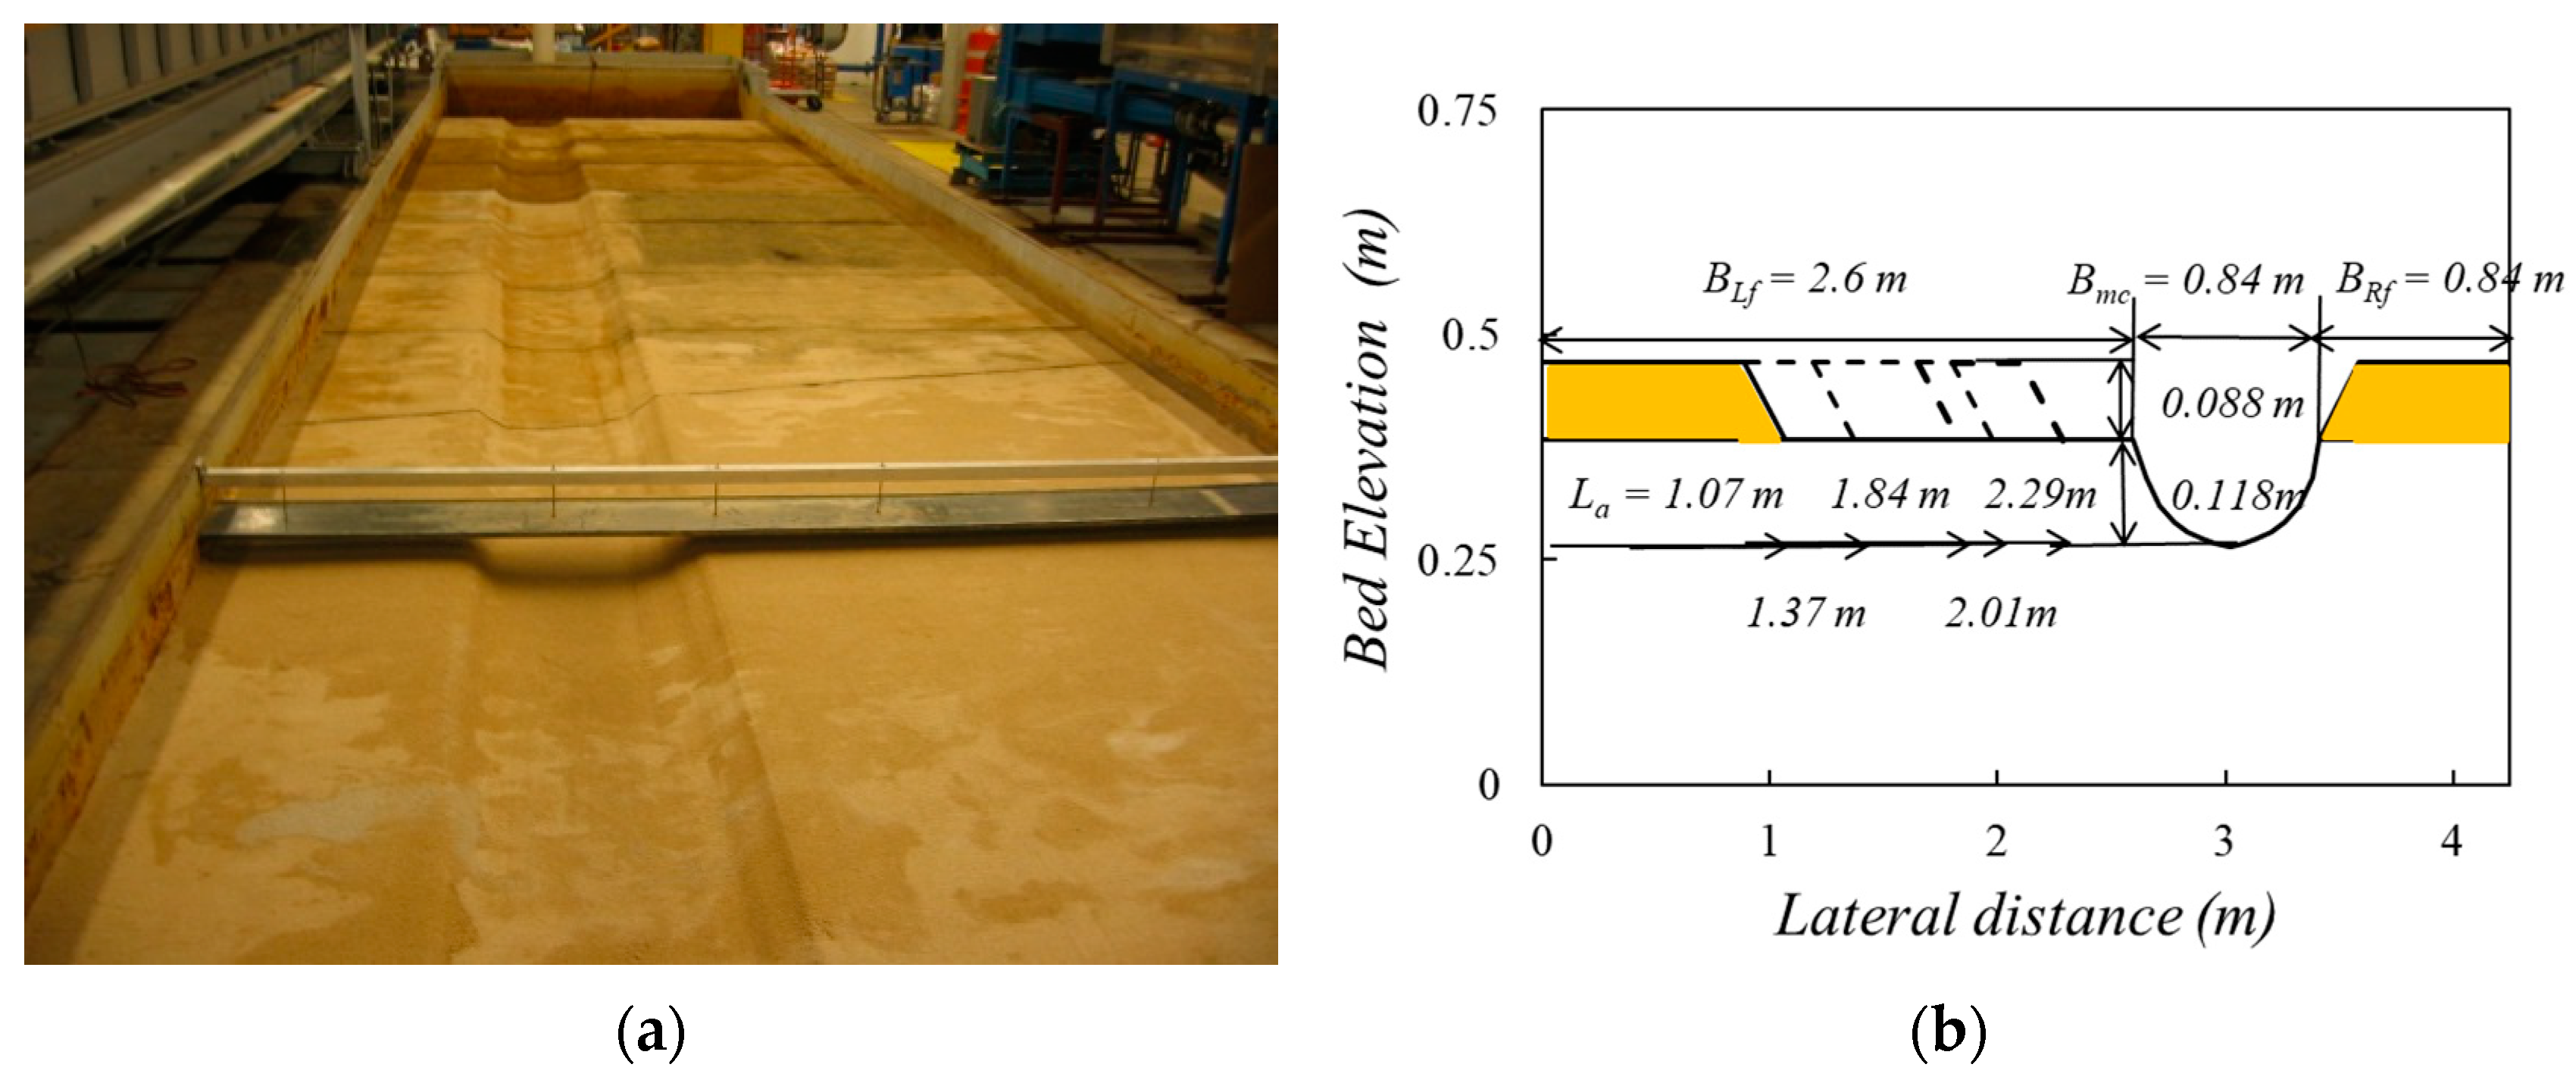
2.2. Experimental Setting

Experiments were run for all three flow conditions including free (F), submerged orifice (SO), and overtopping (OT) flows. The independent variables in the form of dimensionless parameters were approach flow intensity (V1/Vc) both in the main channel and in the floodplain, relative water depth of contracted section to the un-obstructed flow (Y1/Y0) both in the main channel and in the floodplain, and the relative length of the abutment (La/Bf).

3. Experimental Results and Discussion

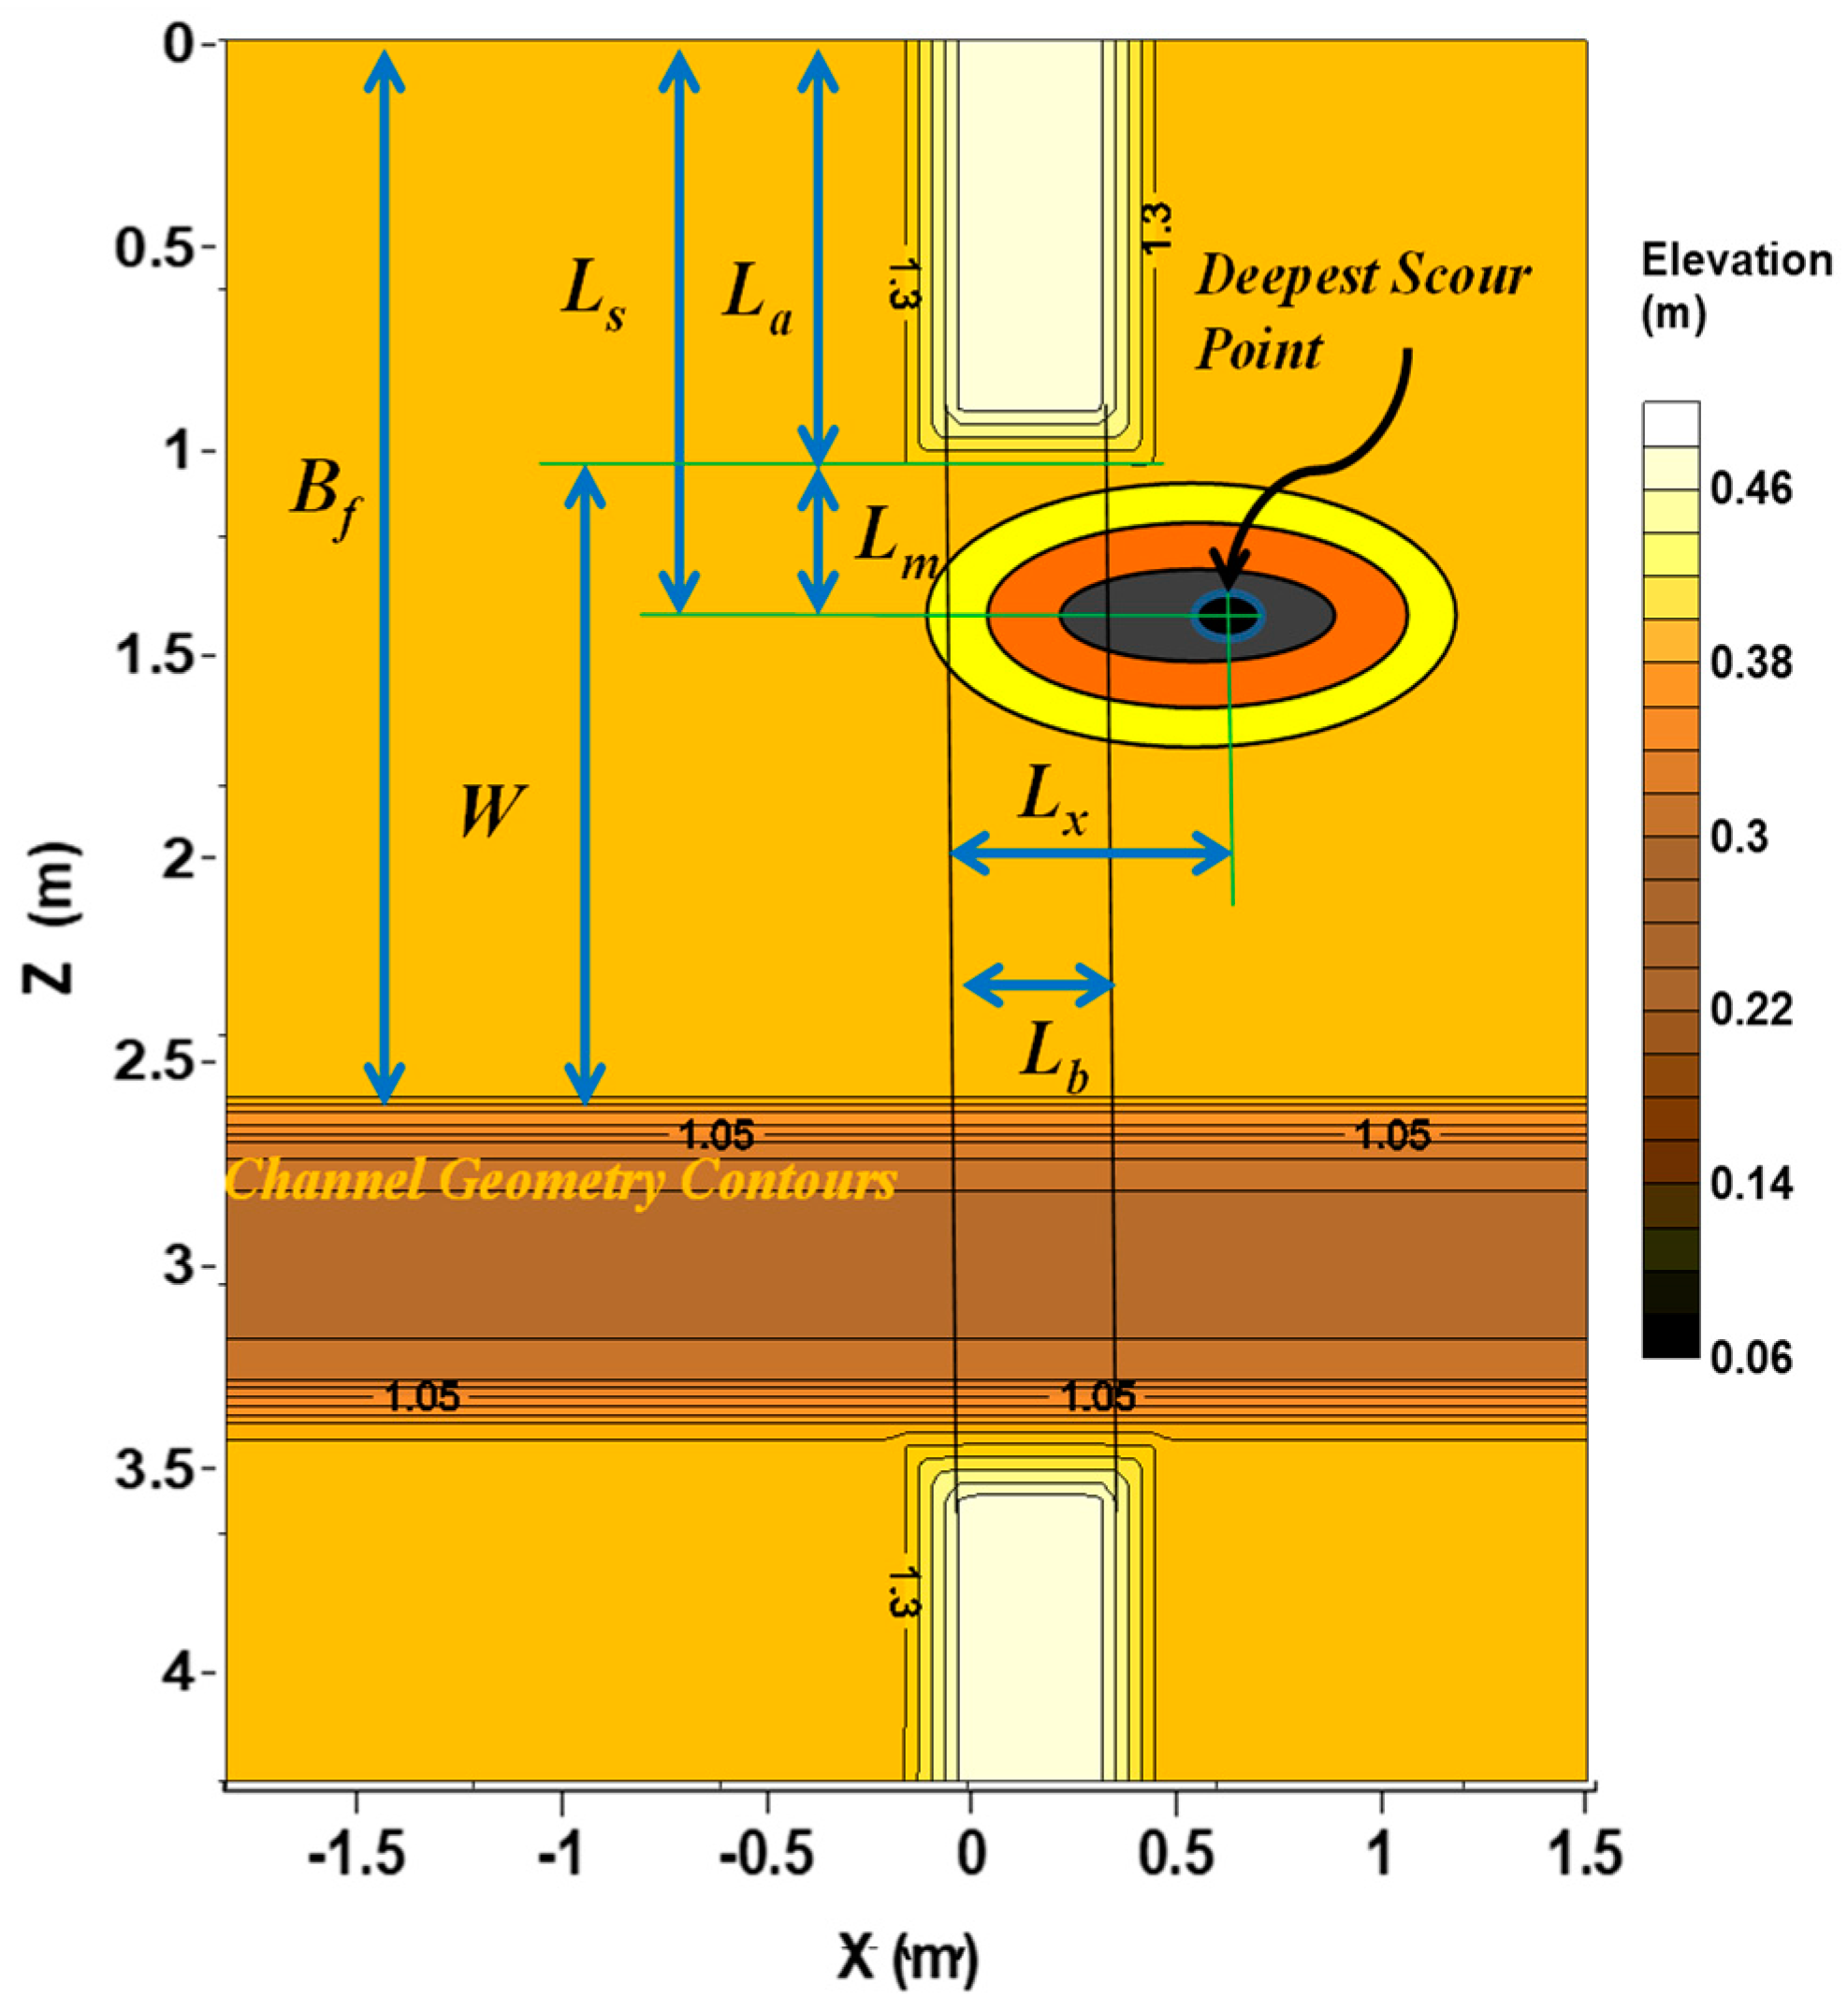
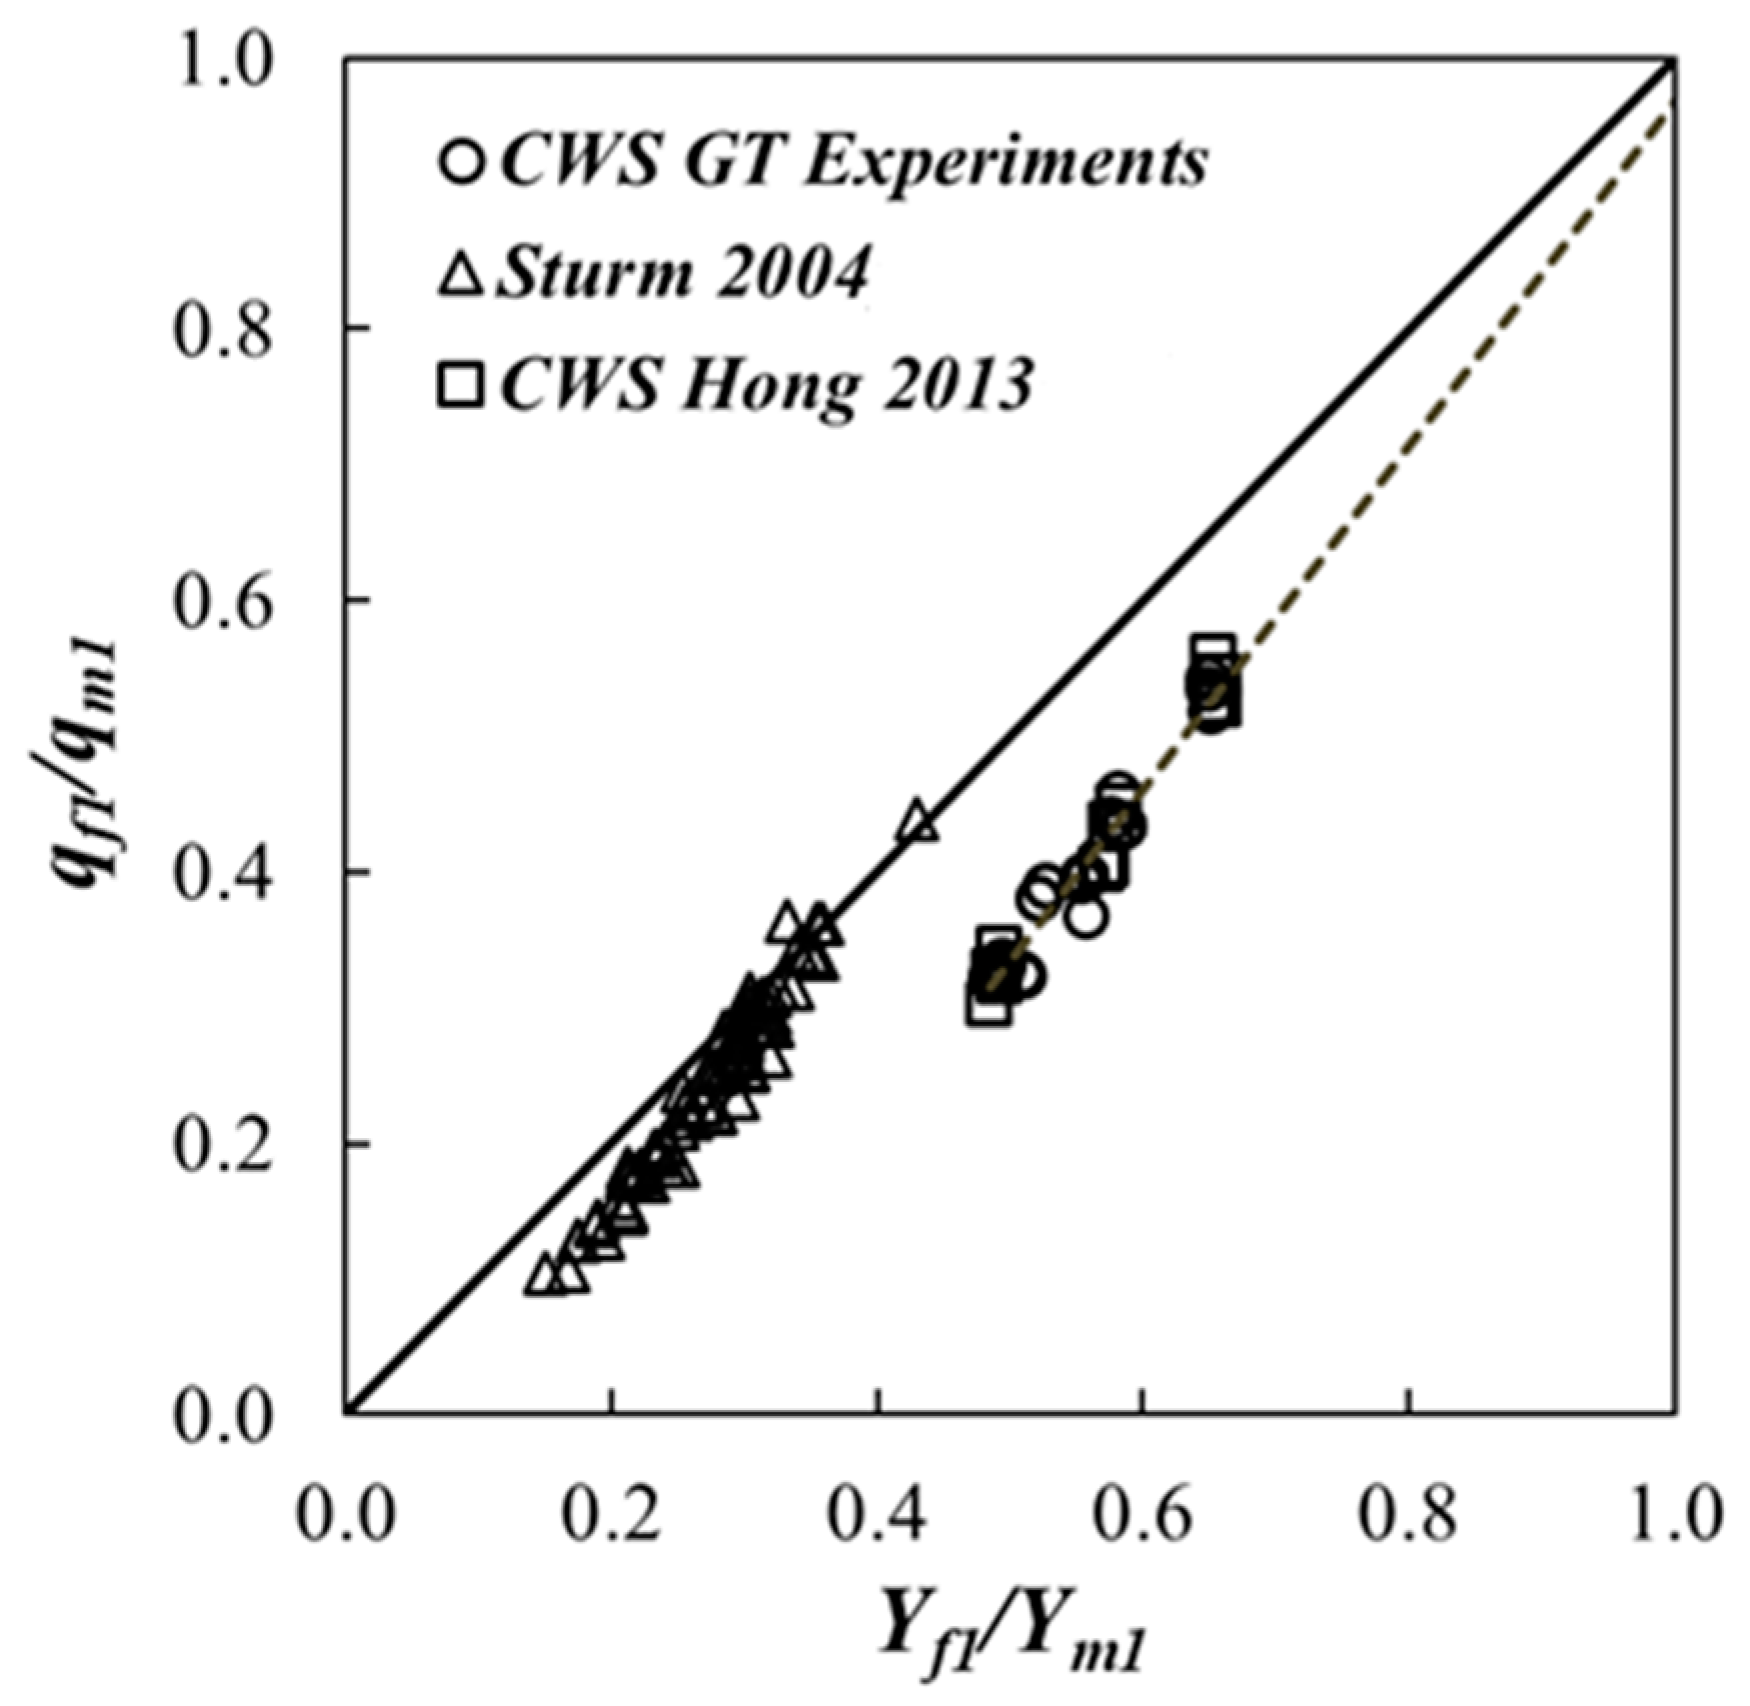
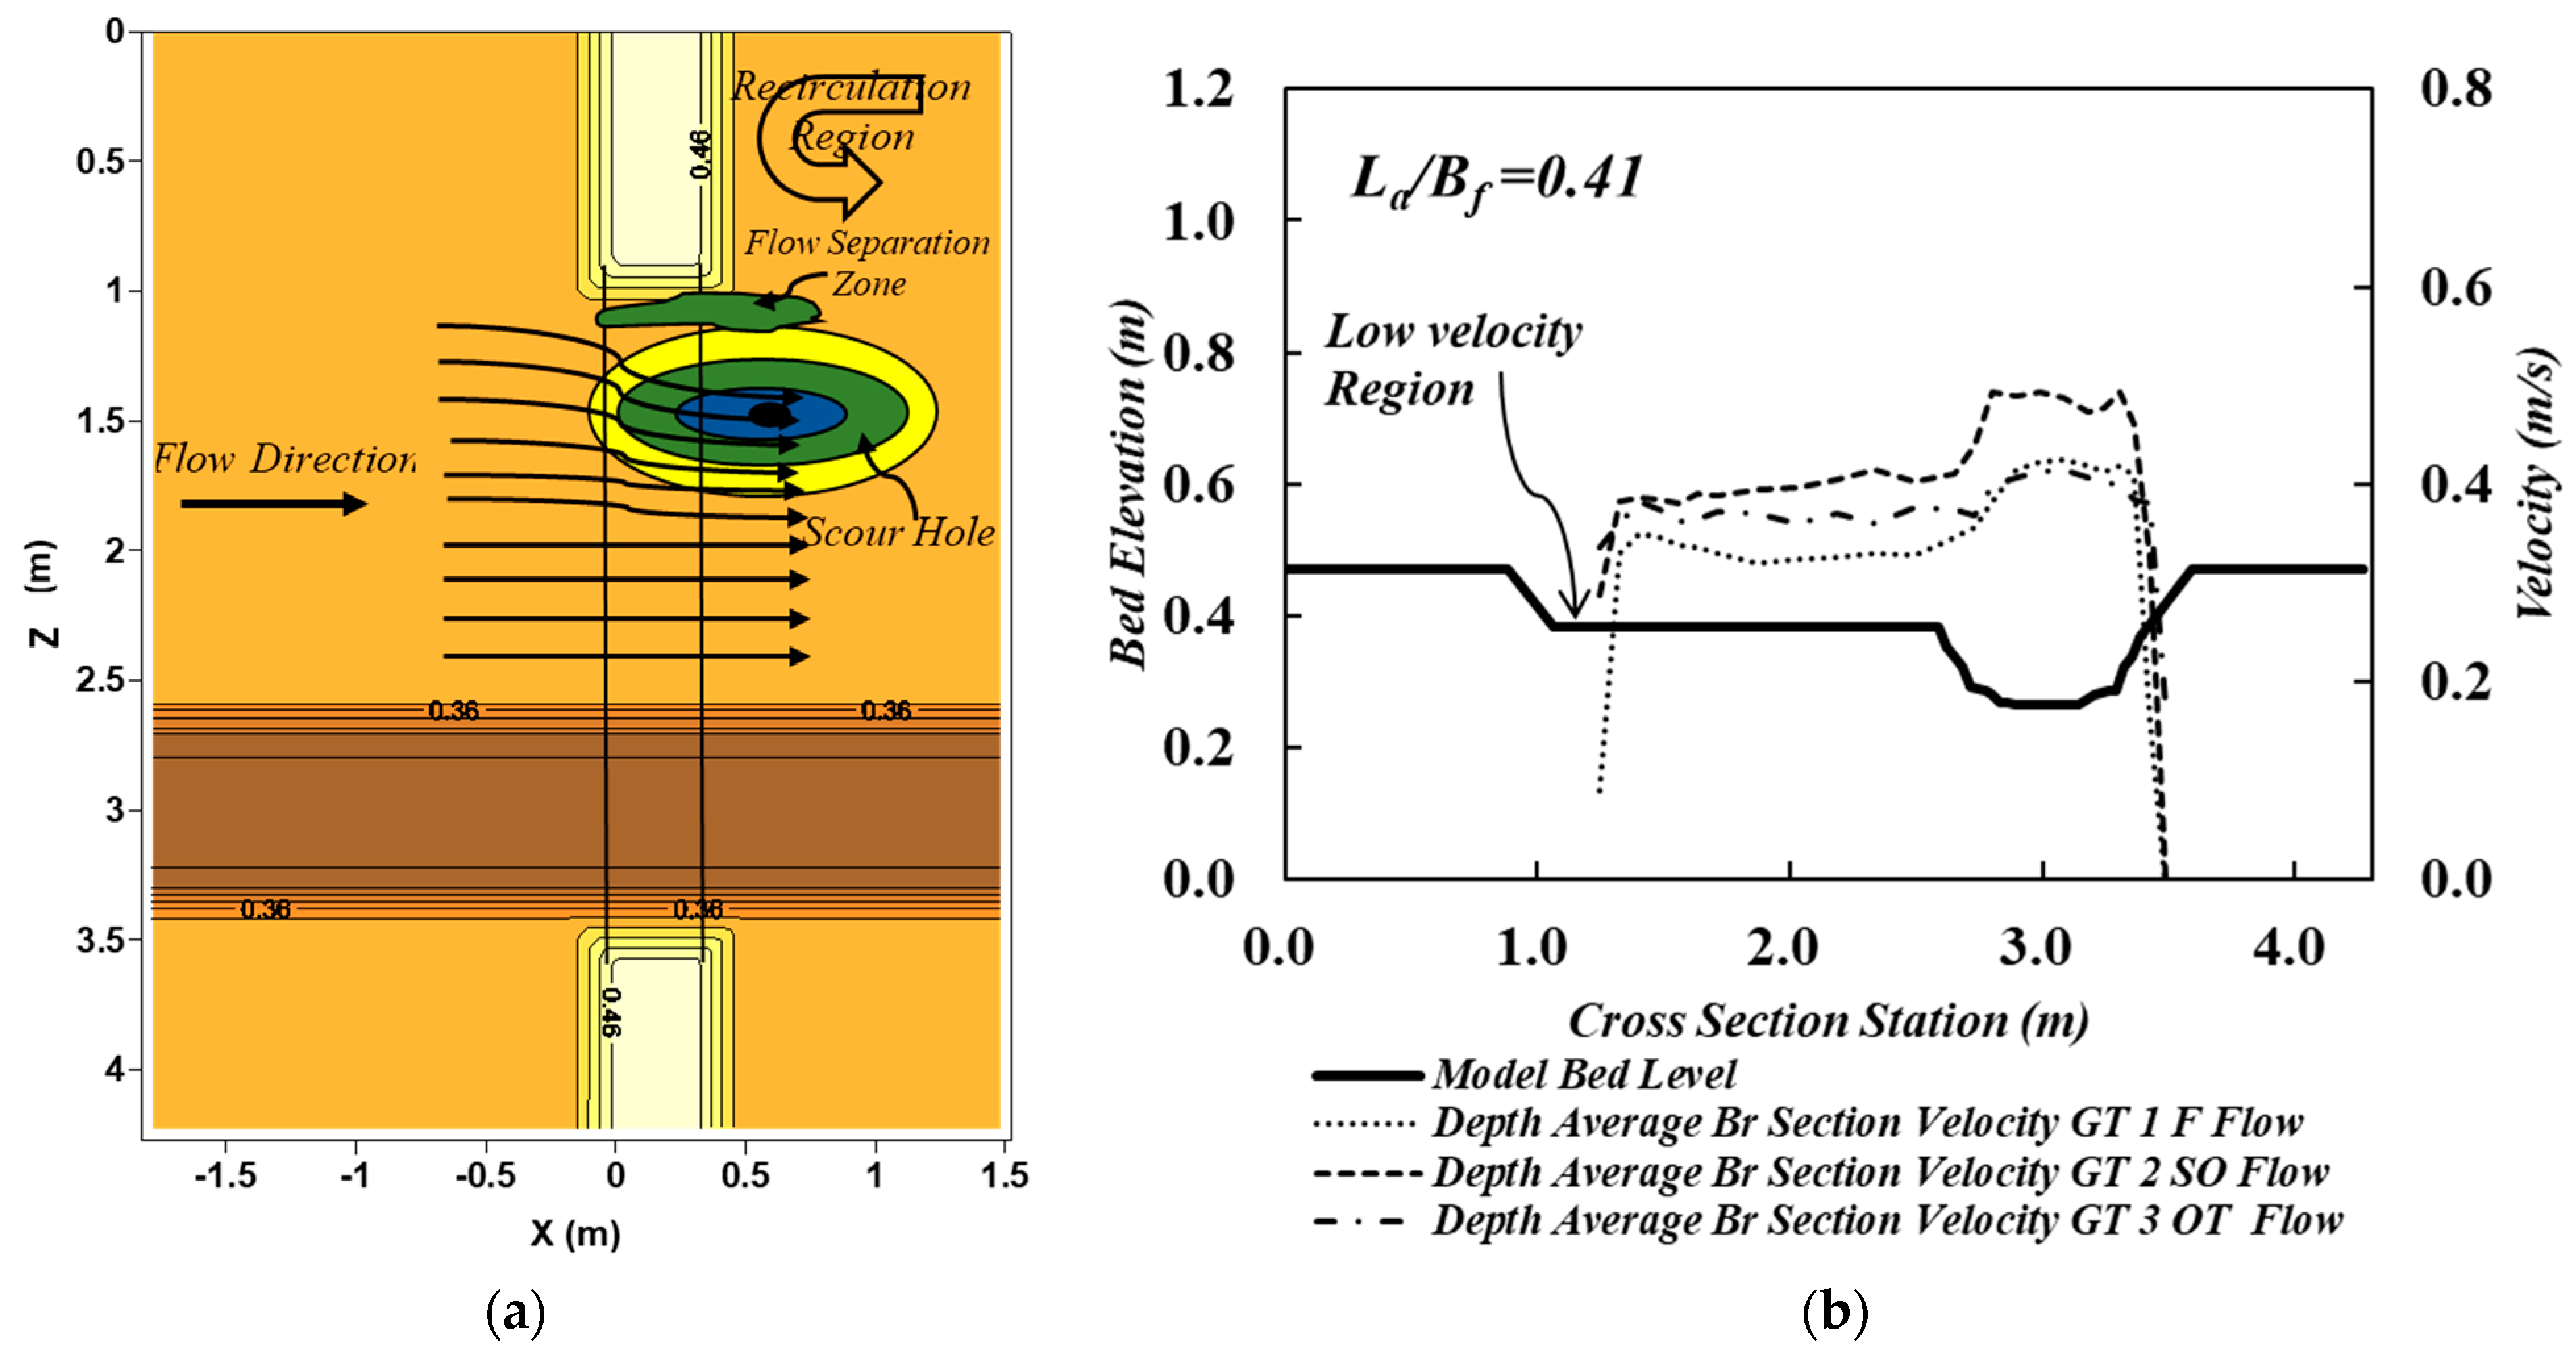
3.1. Experimental Results

The experiments were conducted with a similar procedure as in Hong [20] where the tailgate was raised in the beginning of the experiment and subsequently lowered to the targeted approach flow depth. Once the targeted flow depth had been reached under a desired discharge, the scour continued for 5 to 6 days until equilibrium was achieved. Measurements of the point of deepest scour (location and depth) over time were taken until the equilibrium scour was reached. The equilibrium scour criterion was set as the change in scour depth at the point of deepest scour to be less than 5% in 24 h as given by Melville and Chiew [45] and Hong [20]. The bathymetry of the entire test section was measured at equilibrium which included the magnitude of scour depth as well as the extent of the scour hole. The scour bathymetries were measured in a cartesian coordinate system, both in the flow and in the transverse direction and the example of the scour bathymetries are shown in Figure 4. The summary of the dimensionless form of experimental results in equilibrium conditions are presented in Table 1, where La/Bf is dimensionless abutment length, Ls/Bf is dimensionless distance of the point of deepest scour from the floodplain edge in the transverse direction, Lx/Lb is the dimensionless distance of the point of deepest scour in the flow direction, Yf1/Yf0 is the dimensionless approach flow depth in the floodplain, Vfi/Vfc is the approach flow velocity intensity in the floodplain where Vfc is a critical velocity calculated by using the Keulegan equation [46], qf2/qf1 is the unit discharge ratio in a floodplain in which q is the discharge per unit width, and W/Yf1 is the dimensionless floodplain width in the bridge section.
Concurrent to the previous research, the magnitude of the bridge scour in a compound channel depends on numerous parameters: the degree of geometric and flow contraction, flow readjustment between the floodplain and the main channel including the flow interaction at the banks between the floodplain and the main channel, approach flow intensity, and flow structures forming as a result of bridge contraction [11,12,13,14,15,16,17,18,19,20,29,47,48,49].
The spatial distribution of the scour depends on numerous factors including the scour magnitude, as the higher magnitude will result in a wider and a longer scour hole both in a transverse and flow direction, respectively [44]. The lateral contraction scour depth in an idealized long contraction is a function of discharge per unit width in the contracted section to the approach section q2/q1 [20]. The flow distribution in a compound channel approach section and the flow redistribution in the contracted bridge section between the floodplain and the main channel is a complex function. The degree of flow acceleration differs in the floodplain in comparison to the main channel; however, the lateral distribution of discharge, separately, in the floodplain and the main channel are likely to be uniform. Therefore, to treat the value of q2/q1 separately in the floodplain and in the main channel is a reasonable approximation. Consequently, the degree of contraction in the bridge section and the distribution of discharge per unit width (q) in approach flow and in the bridge section become important. The degree of interaction between the floodplain and the main channel is influenced by the turbulent processes at the interface of the floodplain and the main channel and the length of the abutment [50,51,52].
The ratio of discharge per unit width (q) between the floodplain and main channel in the approach section is shown in Figure 5 with respect to the value of relative water depth Yf1/Ym1 between the floodplain and main channel. The data in Figure 5 included Sturm [50] who conducted a clear-water abutment scour experiment using a fixed (non-erodible) abutment with the different compound channel geometries. As shown in Figure 5, qf1/qm1 increases as the value of relative depth (Yf1/Ym1) increases and approaches the line of equal values (value of a rectangular channel). In other words, compound channel effects on the flow distribution diminish with the relative depth for a given geometry and roughness distribution and as a result, Vf1/Vm1 approaches unity, which is true for a rectangular channel. This phenomenon either occurs when the abutment length is very long in comparison to the floodplain width or the flow depth in a floodplain is comparable to that of main channel. Resultantly the phenomenon affects the flow readjustment between the floodplain and the main channel including the flow interaction at the banks between the floodplain and the main channel and consequently the scour magnitude and extents in a compound channel.
As explained in Hong and Abid [44], in the beginning of the scouring experiment, the development of the scour hole initiates near the upstream corner of the abutment which expands with time, both in the flow and in the transverse direction. Flow convergence along the face of the abutment formulates a flow separation zone, starting from the upstream toe of the abutment, which expands in a transverse direction as it moves downstream. The recirculation region developed downstream of the abutment merges with the flow separation zone in the alignment of line of toe of the abutment at the downstream end. The phenomenon is schematically presented in Figure 6a. Flow convergence in the bridge opening around the abutment creates higher velocity in comparison to approach velocity. Figure 6b shows that the velocity in the flow separation zone is negligible (a stagnant or fluctuating zone) compared to the highest values of velocities in the same cross-section. In the transverse direction moving away from the abutment, the flow separation zone adjoins with a high velocity region creating a shear layer between the two distinct velocity regions. This phenomenon contributes to the scour development affecting both the magnitude and extents of the scour hole.
HEC-18 defines long set back abutment as the magnitude of a dimensionless contracted floodplain width (W) normalized by the approach flow depth (Yf1) as W/Yf1 > 5, whereas Hong [18] redefined the criterion as W/Yf1 > 6 based on his experiments. In order to validate the results of the experiments conducted in the current experiment, Ls/Bf, which is the non-dimensionalized location of the point of deepest scour in a transverse direction, has been plotted against W/Yf1 in Figure 7, where the HEC-18 criterion is shown with a dashed line and modified criterion given by Hong [20] is shown with dotted line. This includes experiments shown in Table 1 and experiments conducted in the laboratory of the University of Auckland (UoA) [53] which were conducted on the same methodology as that of the experiment conducted in the Georgia Institute of Technology. As shown in Figure 7, the normalized location of the deepest point of scour hole in a transverse direction (Ls/Bf) shows a greater variability and scatter when plotted with a normalized contracted section width (W/Yf1). Early studies [41,42] mentioned that scour around an abutment was related to the geometric contraction ratio which was defined as the ratio of the width of the contracted opening to the approach channel width. However, the geometric contraction ratio is only appropriate for a constricted rectangular channel in which the flow rate per unit width is essentially constant across the approach and the constricted sections. In the case of a compound channel as in this study, the flow distribution across the cross-section is non-uniform and dependent on the compound channel geometry and roughness. As the flow accelerates through the contracted section, it is redistributed between the main channel and the floodplain. Thus, abutment scour depth should not depend directly on the abutment length in a compound channel, but rather on the effect of the abutment length on the flow redistribution in the contracted section for a particular compound channel geometry and roughness which resulted in a scatter plot compared to the cases in [41,42].
The normalized location of the deepest point of the scour hole (Ls/Bf) is observed to re-occur at different values of a normalized width of the floodplain in the contracted section (W/Yf1). The reason for this scatter and recurrence is that the width of the contracted section of the floodplain (W) does not account for the degree of lateral flow contraction and a given value of the contracted section floodplain width (W) may exist for different abutment lengths, which give different geometric and flow contraction ratios as shown in Figure 8. Alternatively, a constant contracted section floodplain width (W) may result from a number of abutment lengths ranging from long setback to intermediate to short setback abutments with the same approach flow depth. Although the constant normalized contracted section width (W/Yf1) will result in single abutment classification, the degree of flow and geometric contraction will result in greater variability in the location, size, and extent of the scour hole depending on the length of abutment for the same approach flow depth (Yf1).

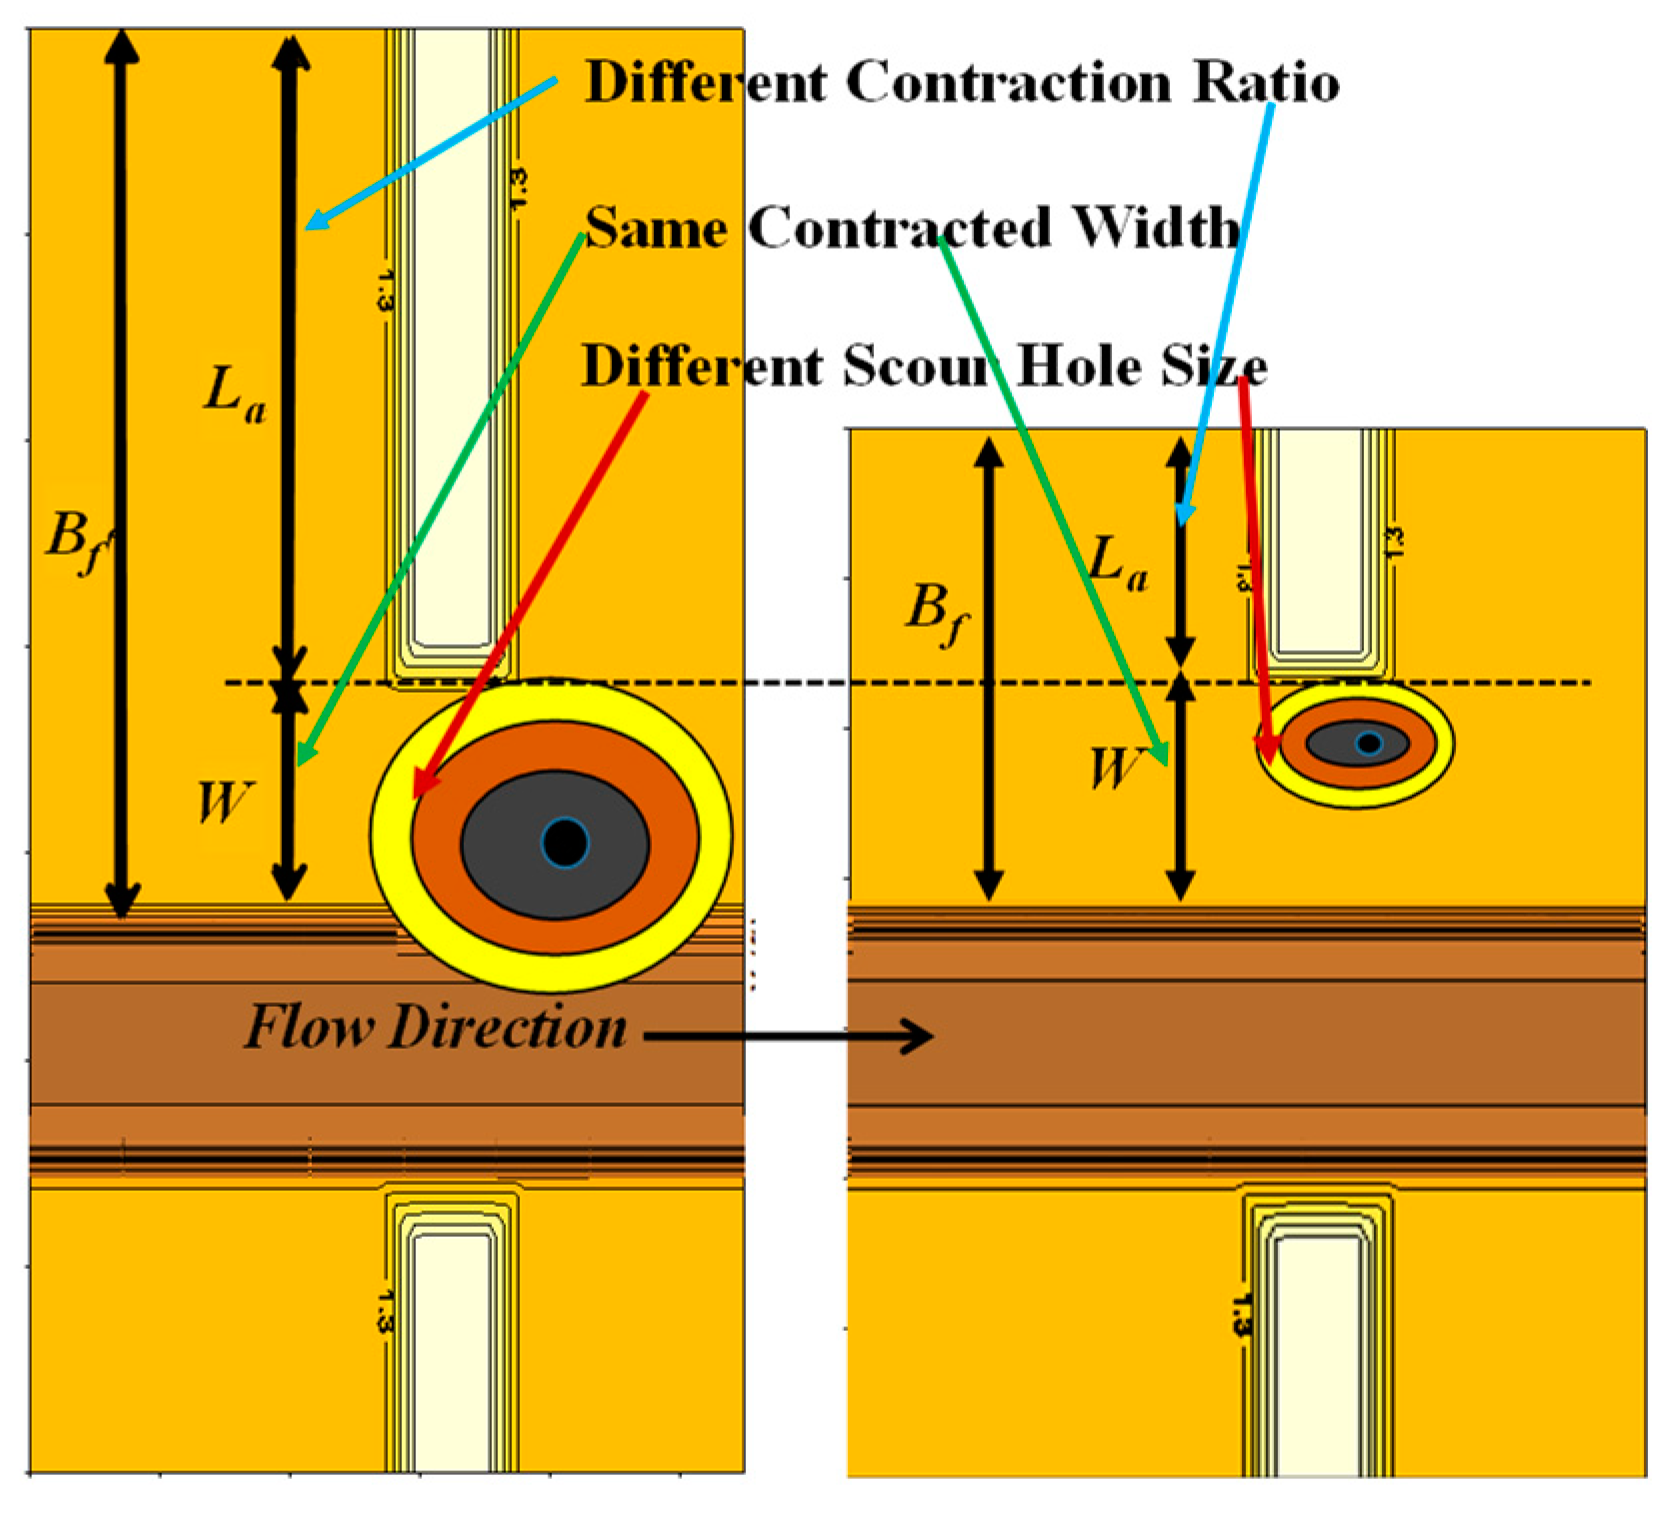
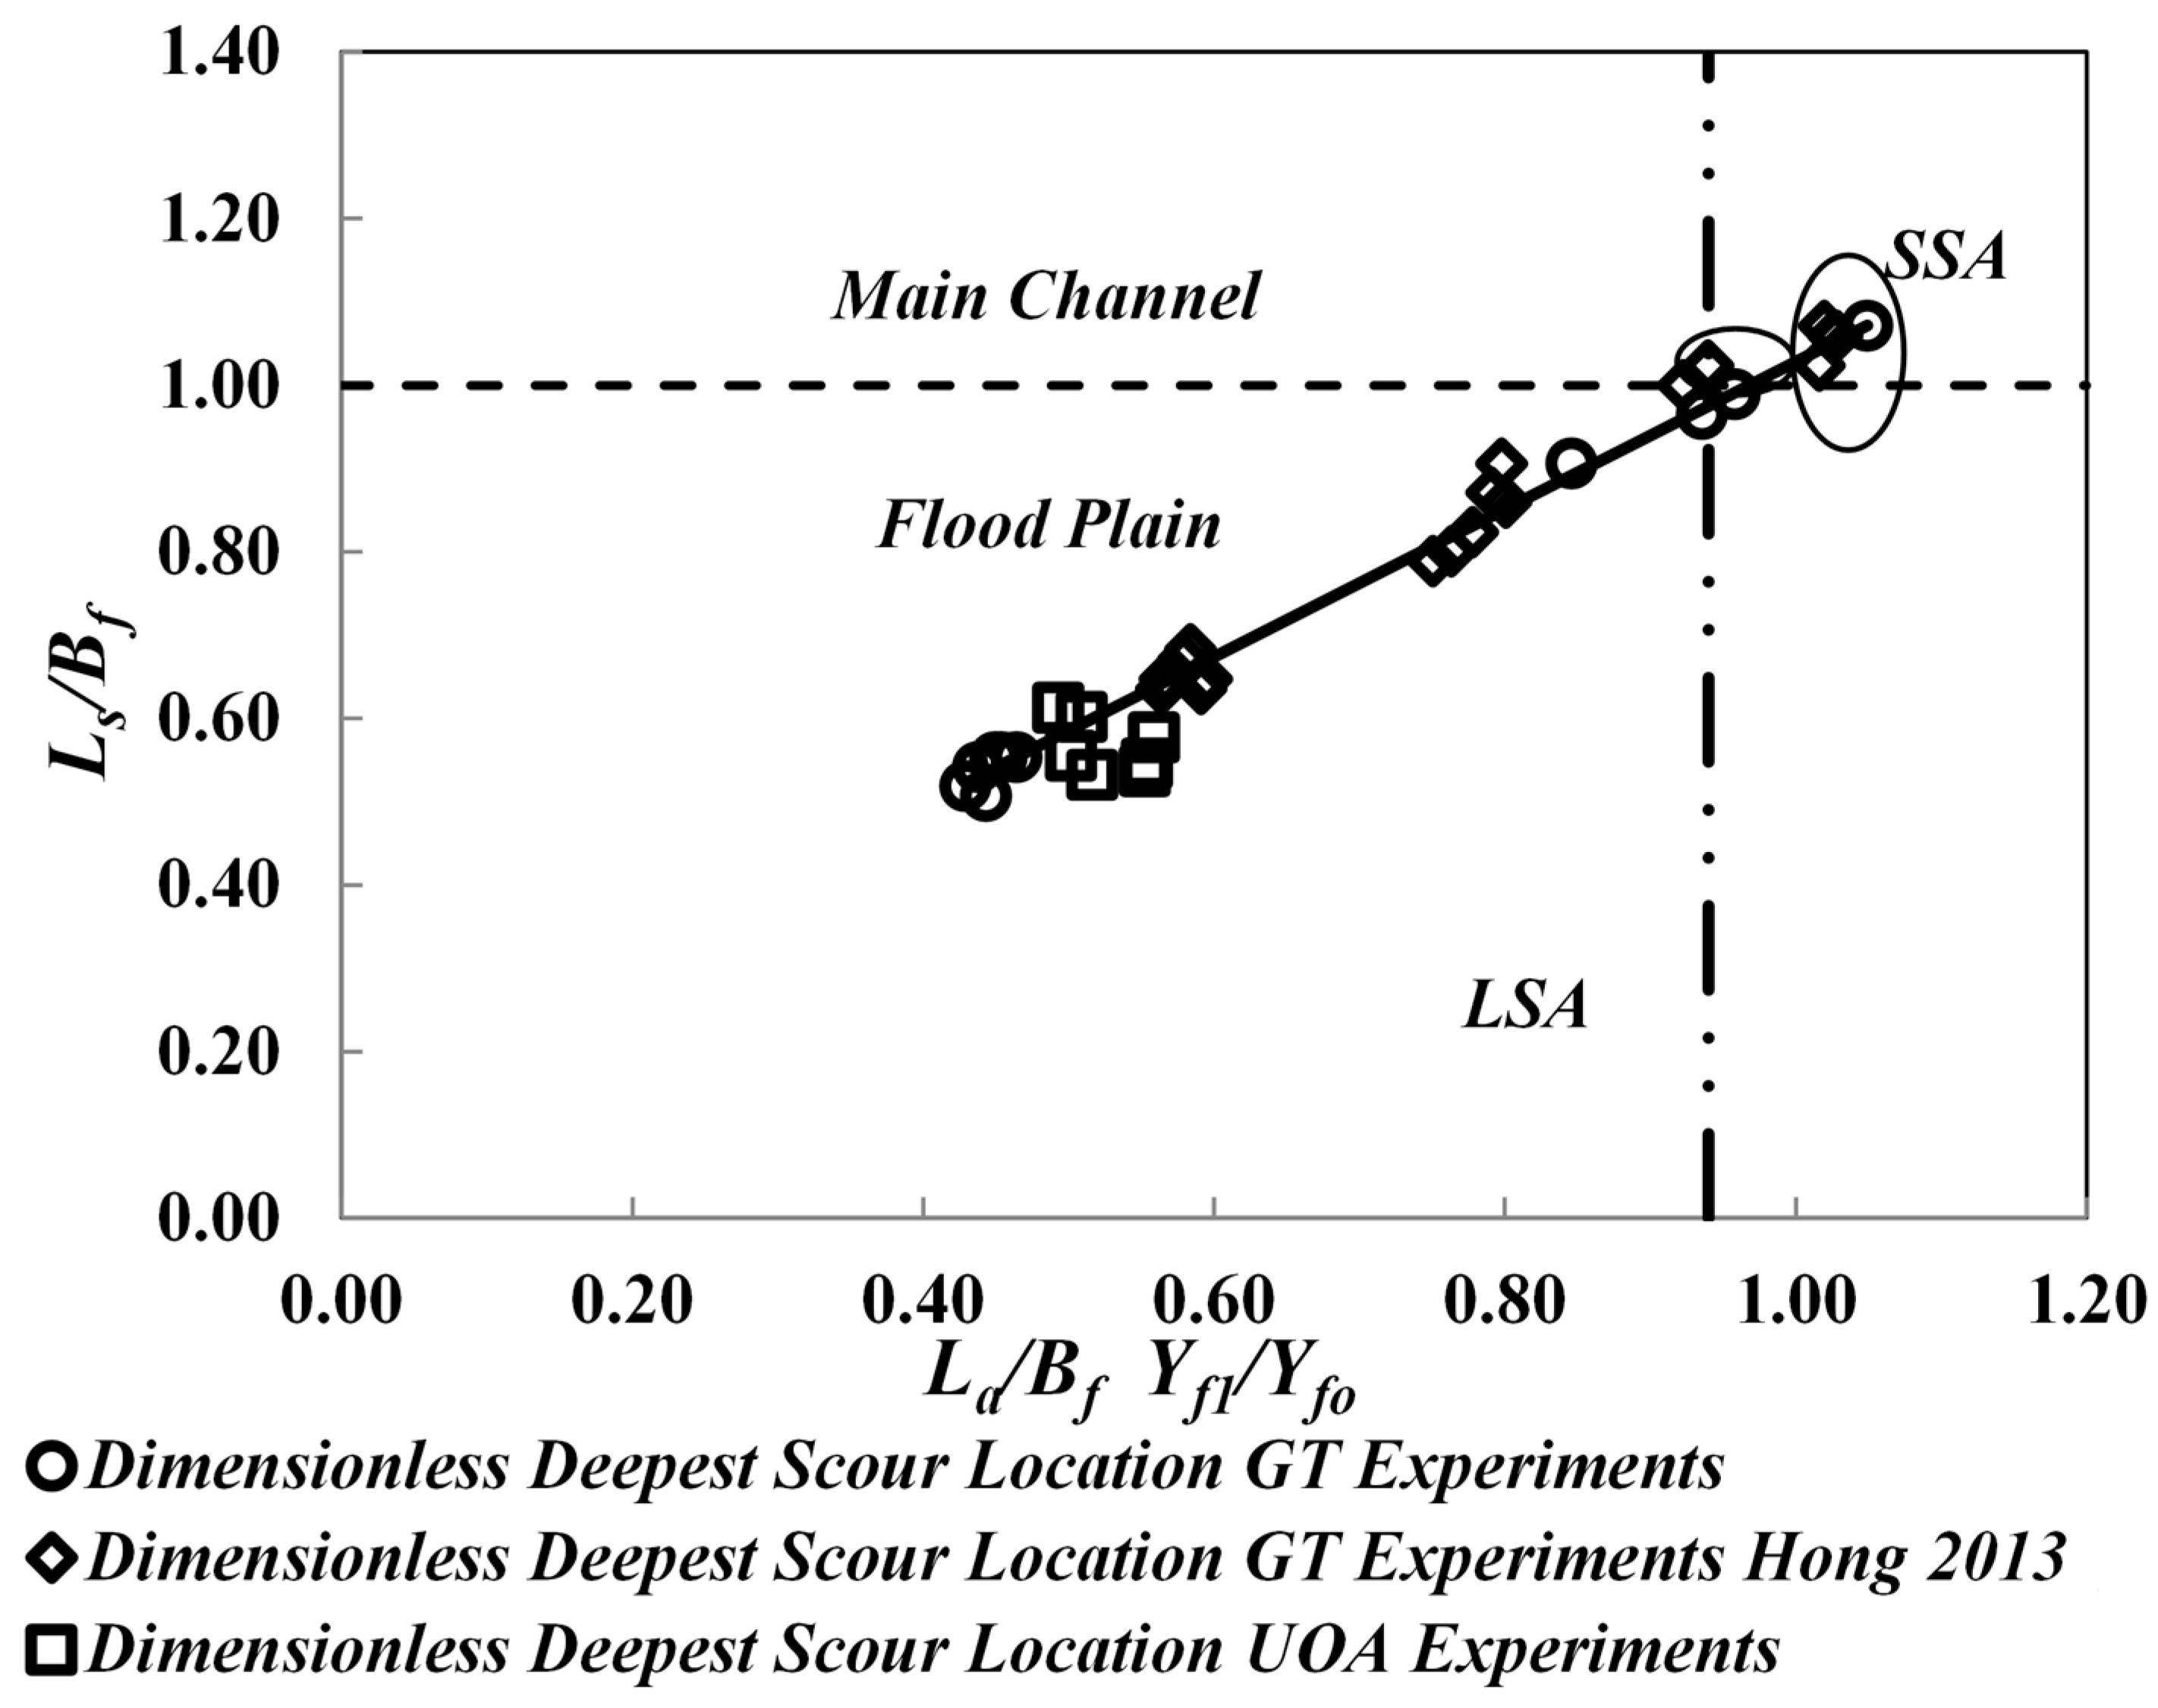
3.2. Classification of Abutment and Prediction of Maximum Scour Location in Transverse Direction

As explained in the previous paragraph, the location of the deepest point in the transverse direction (which dictates the abutment classification criterion as well) depend on the geometric length ratio, flow contraction ratio, roughness ratio between the approach and contracted section, approach flow intensity, and head-loss in the contracted section or turbulent flow structures forming as a result of bridge contraction for a given type of abutment as shown in Equation (3).
L s B f = f L a B f , q f 2 q f 1 , n f 2 n f 1 , V f 1 V f c , Y f 1 Y f o
The geometric length ratio and the flow contraction ratios complement each other, and the roughness ratio between the approach and contracted section shown in Equation (3) is implicitly included in the flow contraction ratio [29,44]. The approach flow intensity parameter contribution to the location of the scour hole is negligible in comparison to the lateral contraction ratio effect, especially in the clear water scour conditions as in this study. Therefore, Equation (3) can be rewritten as:
L s B f = f L a B f , Y f 1 Y f o
With the variables in Equation (4), the normalized locations of the deepest point of scour hole in a transverse direction (Ls/Bf) are plotted with the variables corresponding to the combined effect of lateral contraction and back water in the bridge section (La/Bf)(Yf1/Yf0) in Figure 9. The laboratory experimental results from the current studies as well as Hong [20] are included in the plot. As shown in Figure 9, the value of Ls/Bf has a strong relationship with the product of a dimensionless variable (La/Bf)(Yf1/Yf0). Compared to Figure 7, (La/Bf)(Yf1/Yf0) converges all the points in one straight line in the figure. As defined in the previous paragraph, the occurrence of point of maximum scour in the floodplain or in the main channel is a criteria to define long setback abutment (LSA) and short setback abutment (SSA). As shown in Figure 9, when (La/Bf)(Yf1/Yf0) > 0.94, the deepest point of the scour hole occurs in the main channel and for (La/Bf)(Yf1/Yf0) < 0.94 the deepest point of the scour hole remained in the floodplain. Depending on the experimental uncertainty and collapse mechanism of the main channel bank as the scour developed, the occurrence of the point of deepest scour near the bank of the main channel shows some variability in the range of a normalized variable as 0.94 < (La/Bf)(Yf1/Yf0) < 1.0. Thus, the criterion for LSA and SSA is defined as given by Equation (5).
L a B f Y f 1 Y f 0 < 0.94     f o r   L S A ;     L a B f Y f 1 Y f 0 > 0.94   f o r   S S A
As discussed earlier, the location of the point of deepest scour in a transverse direction and abutment classification criterion complement each other; therefore, a linear regression applied to the points plotted in Figure 9 by the least square method to find a best fit curve resulted in the location of the point of deepest scour. This gave the coefficient of determination as 0.98. Equation (6) shows the relationship for the prediction of the location of the deepest point of the scour hole in a transverse direction.
L s B f = 0.91 L a B f Y f 1 Y f 0 + 0.13

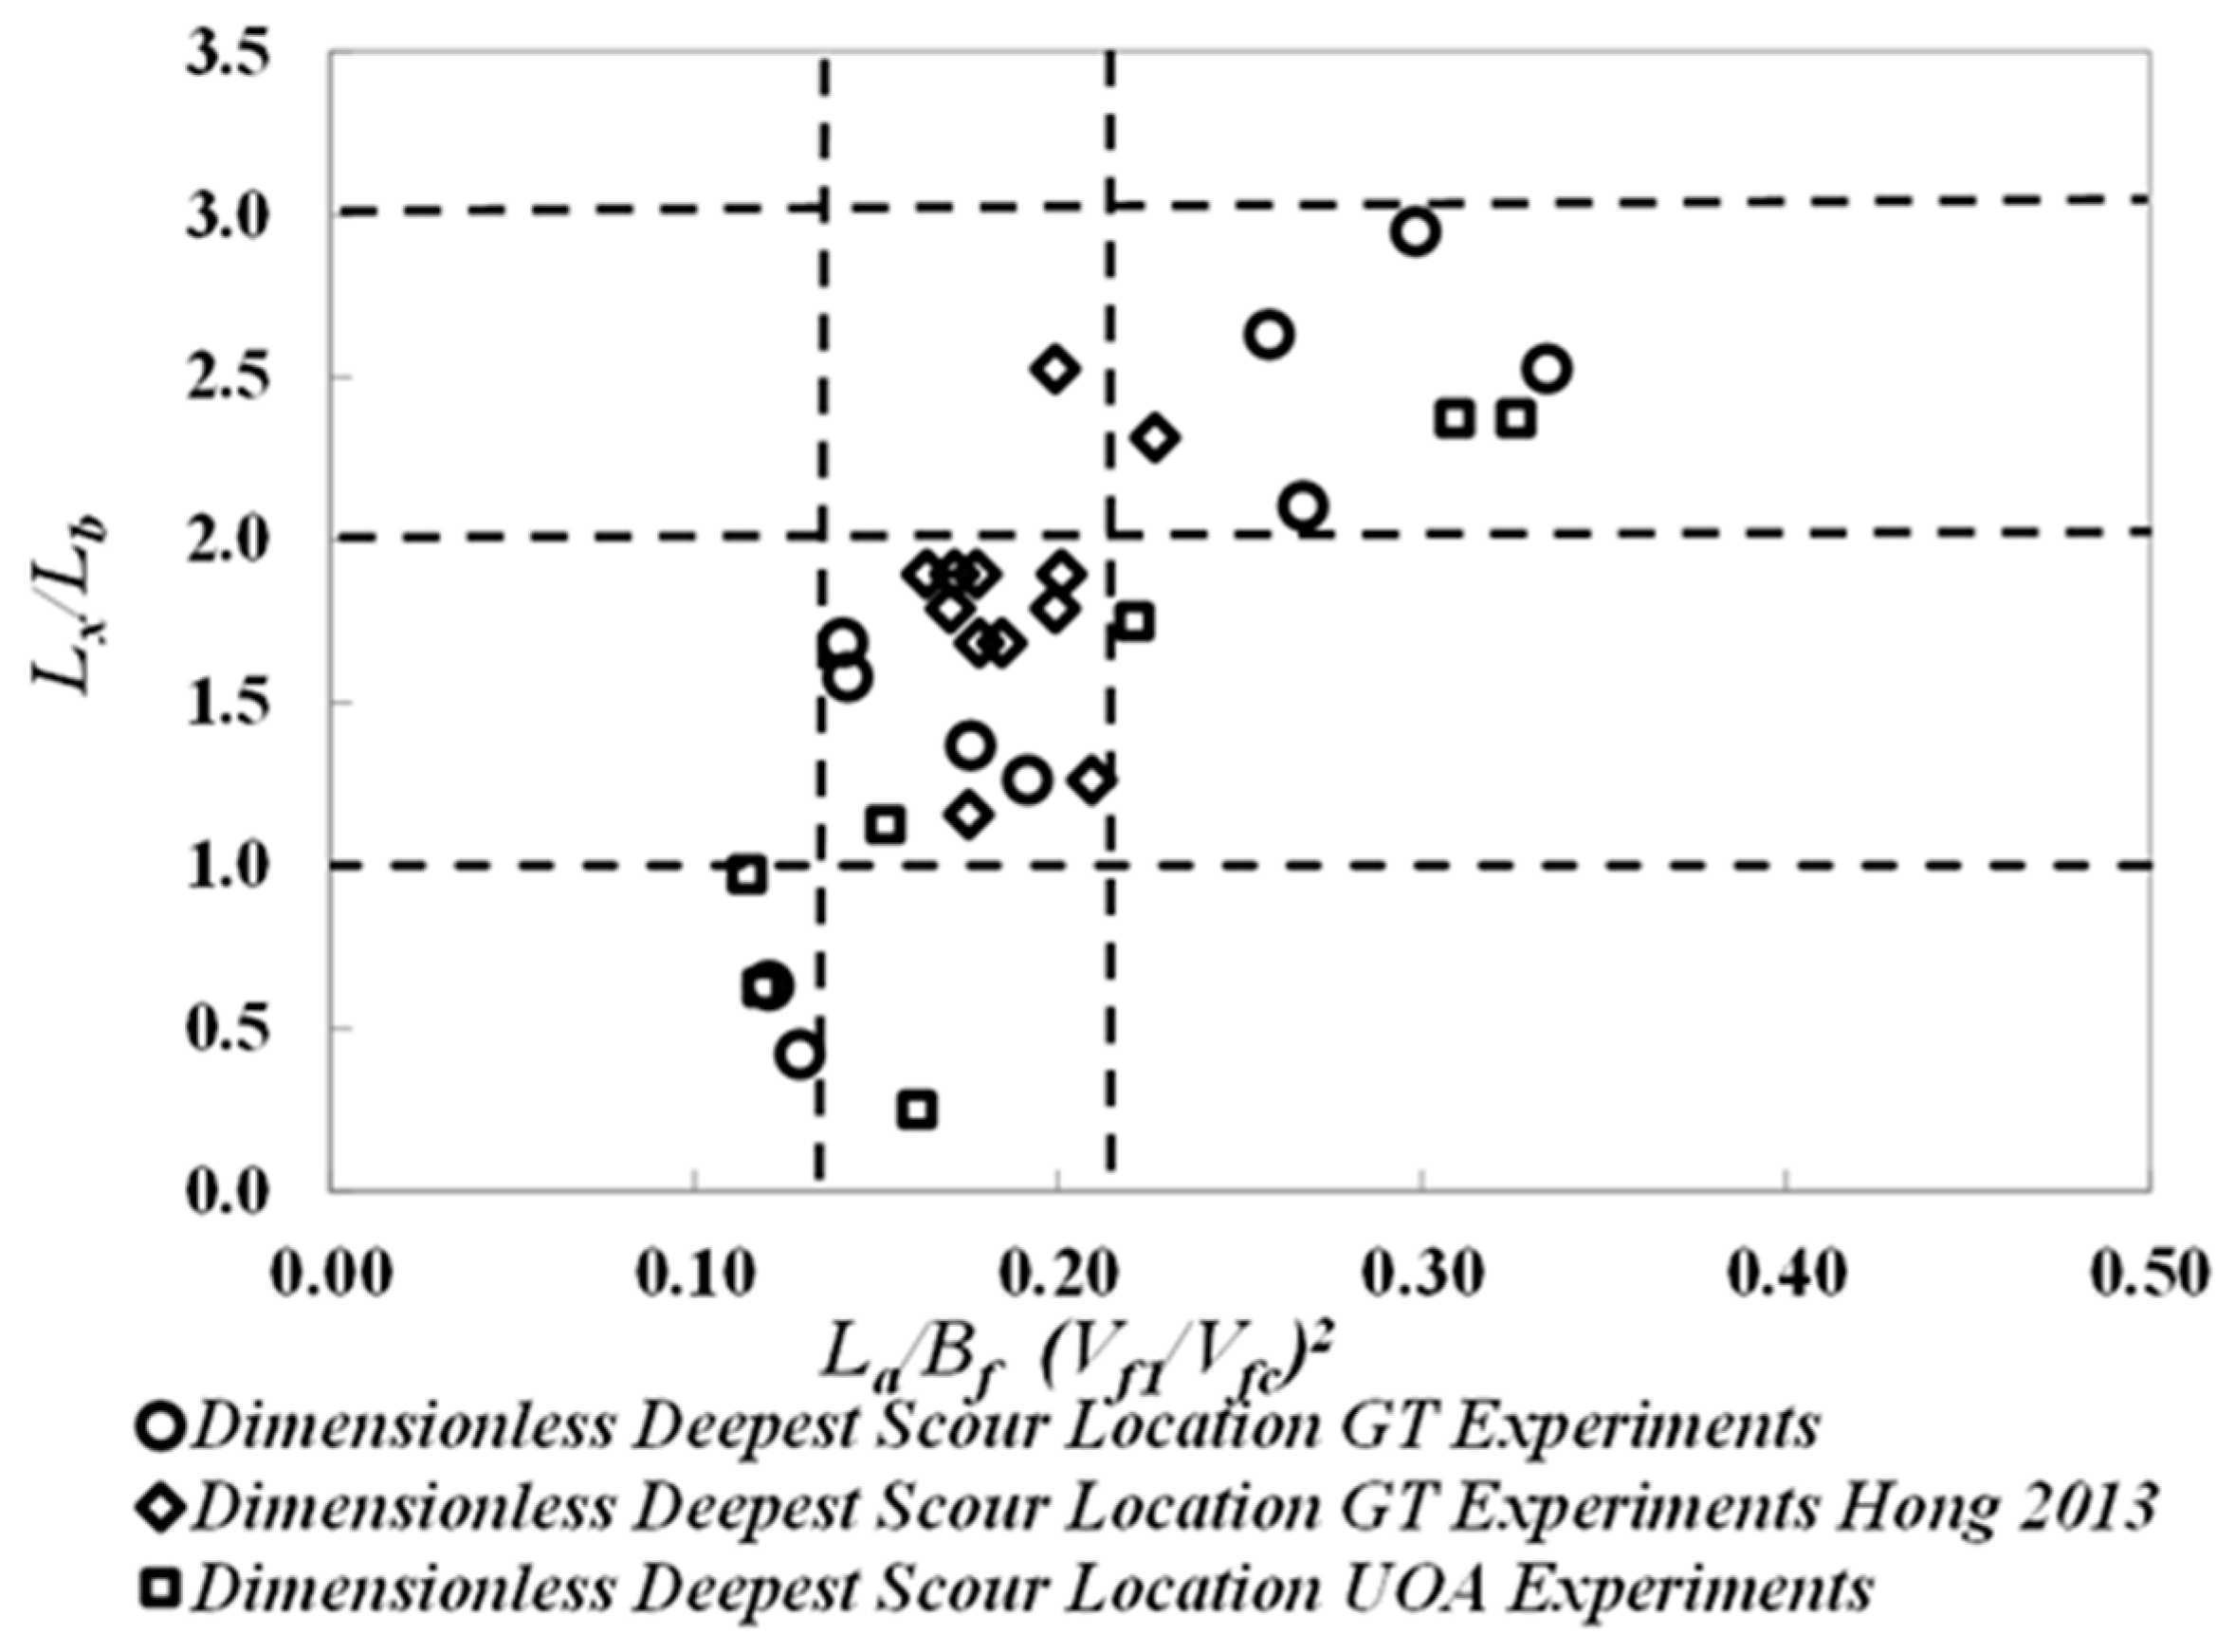
3.3. Prediction of Maximum Scour Location in Flow Direction

A scour hole initiates at the upstream corner of the abutment and extends in the downstream flow direction. The location of the deepest point of the scour hole in the flow direction showed a larger variability in the experiments conducted in the Georgia Institute of Technology as shown in Table 1 (values of Lx/Lb); thus, it is difficult to predict the exact location of the deepest point in the flow direction. However, it was observed that a higher shear stress results in a deeper and larger scour hole and moves the deepest point of the scour hole further downstream (comparison of values of Vf1/Vfc and Lx/Lb in Table 1). Whereas, shear stress is a function of the square of the velocity, (V1/Vc)2, as a dimensionless velocity variable [45]. Nevertheless, a greater degree of flow contraction (La/Bf) results in a deeper and elongated scour hole in the flow direction, as shown in Figure 8. Thus, the longitudinal distance of the maximum scour location in the flow direction (Lx) can be considered as a function of both La/Bf and (V1/Vc)2. Figure 10 shows the dimensionless location of the deepest point of scour in the flow direction (Lx/Lb) as a function of the product of a geometric contraction ratio and the square of the approach flow intensity, representing the shear stress ((La/Bf)(V1/Vc)2). In comparison to the dimensionless length with respect to the bridge width Lx/Lb, the location of the point of the deepest scour can be divided into three distinct zones, as shown in Figure 10, with their limits defined in Equation (7) for the deepest point under the bridge, up to a one-bridge width downstream of the bridge, and up to a two-bridge width downstream of the bridge, respectively. As the presence of the pier affects the flow considerably, in the contracted section, the variability in location of the deepest point of the scour hole thus shows a larger scatter. Therefore, the applicability of Equation (7) is restricted to cases where either the pier is away from the influence of abutment and contraction scour hole or the bridge is without a pier (namely single-span bridges).
L x L b < 1   F o r   L a B f V f 1 V f c 2 < 0.13 1 < L x L b < 2   F o r   0.13 < L a B f V f 1 V f c 2 < 0.22 2 < L x L b < 3   F o r   L a B f V f 1 V f c 2 > 0.22

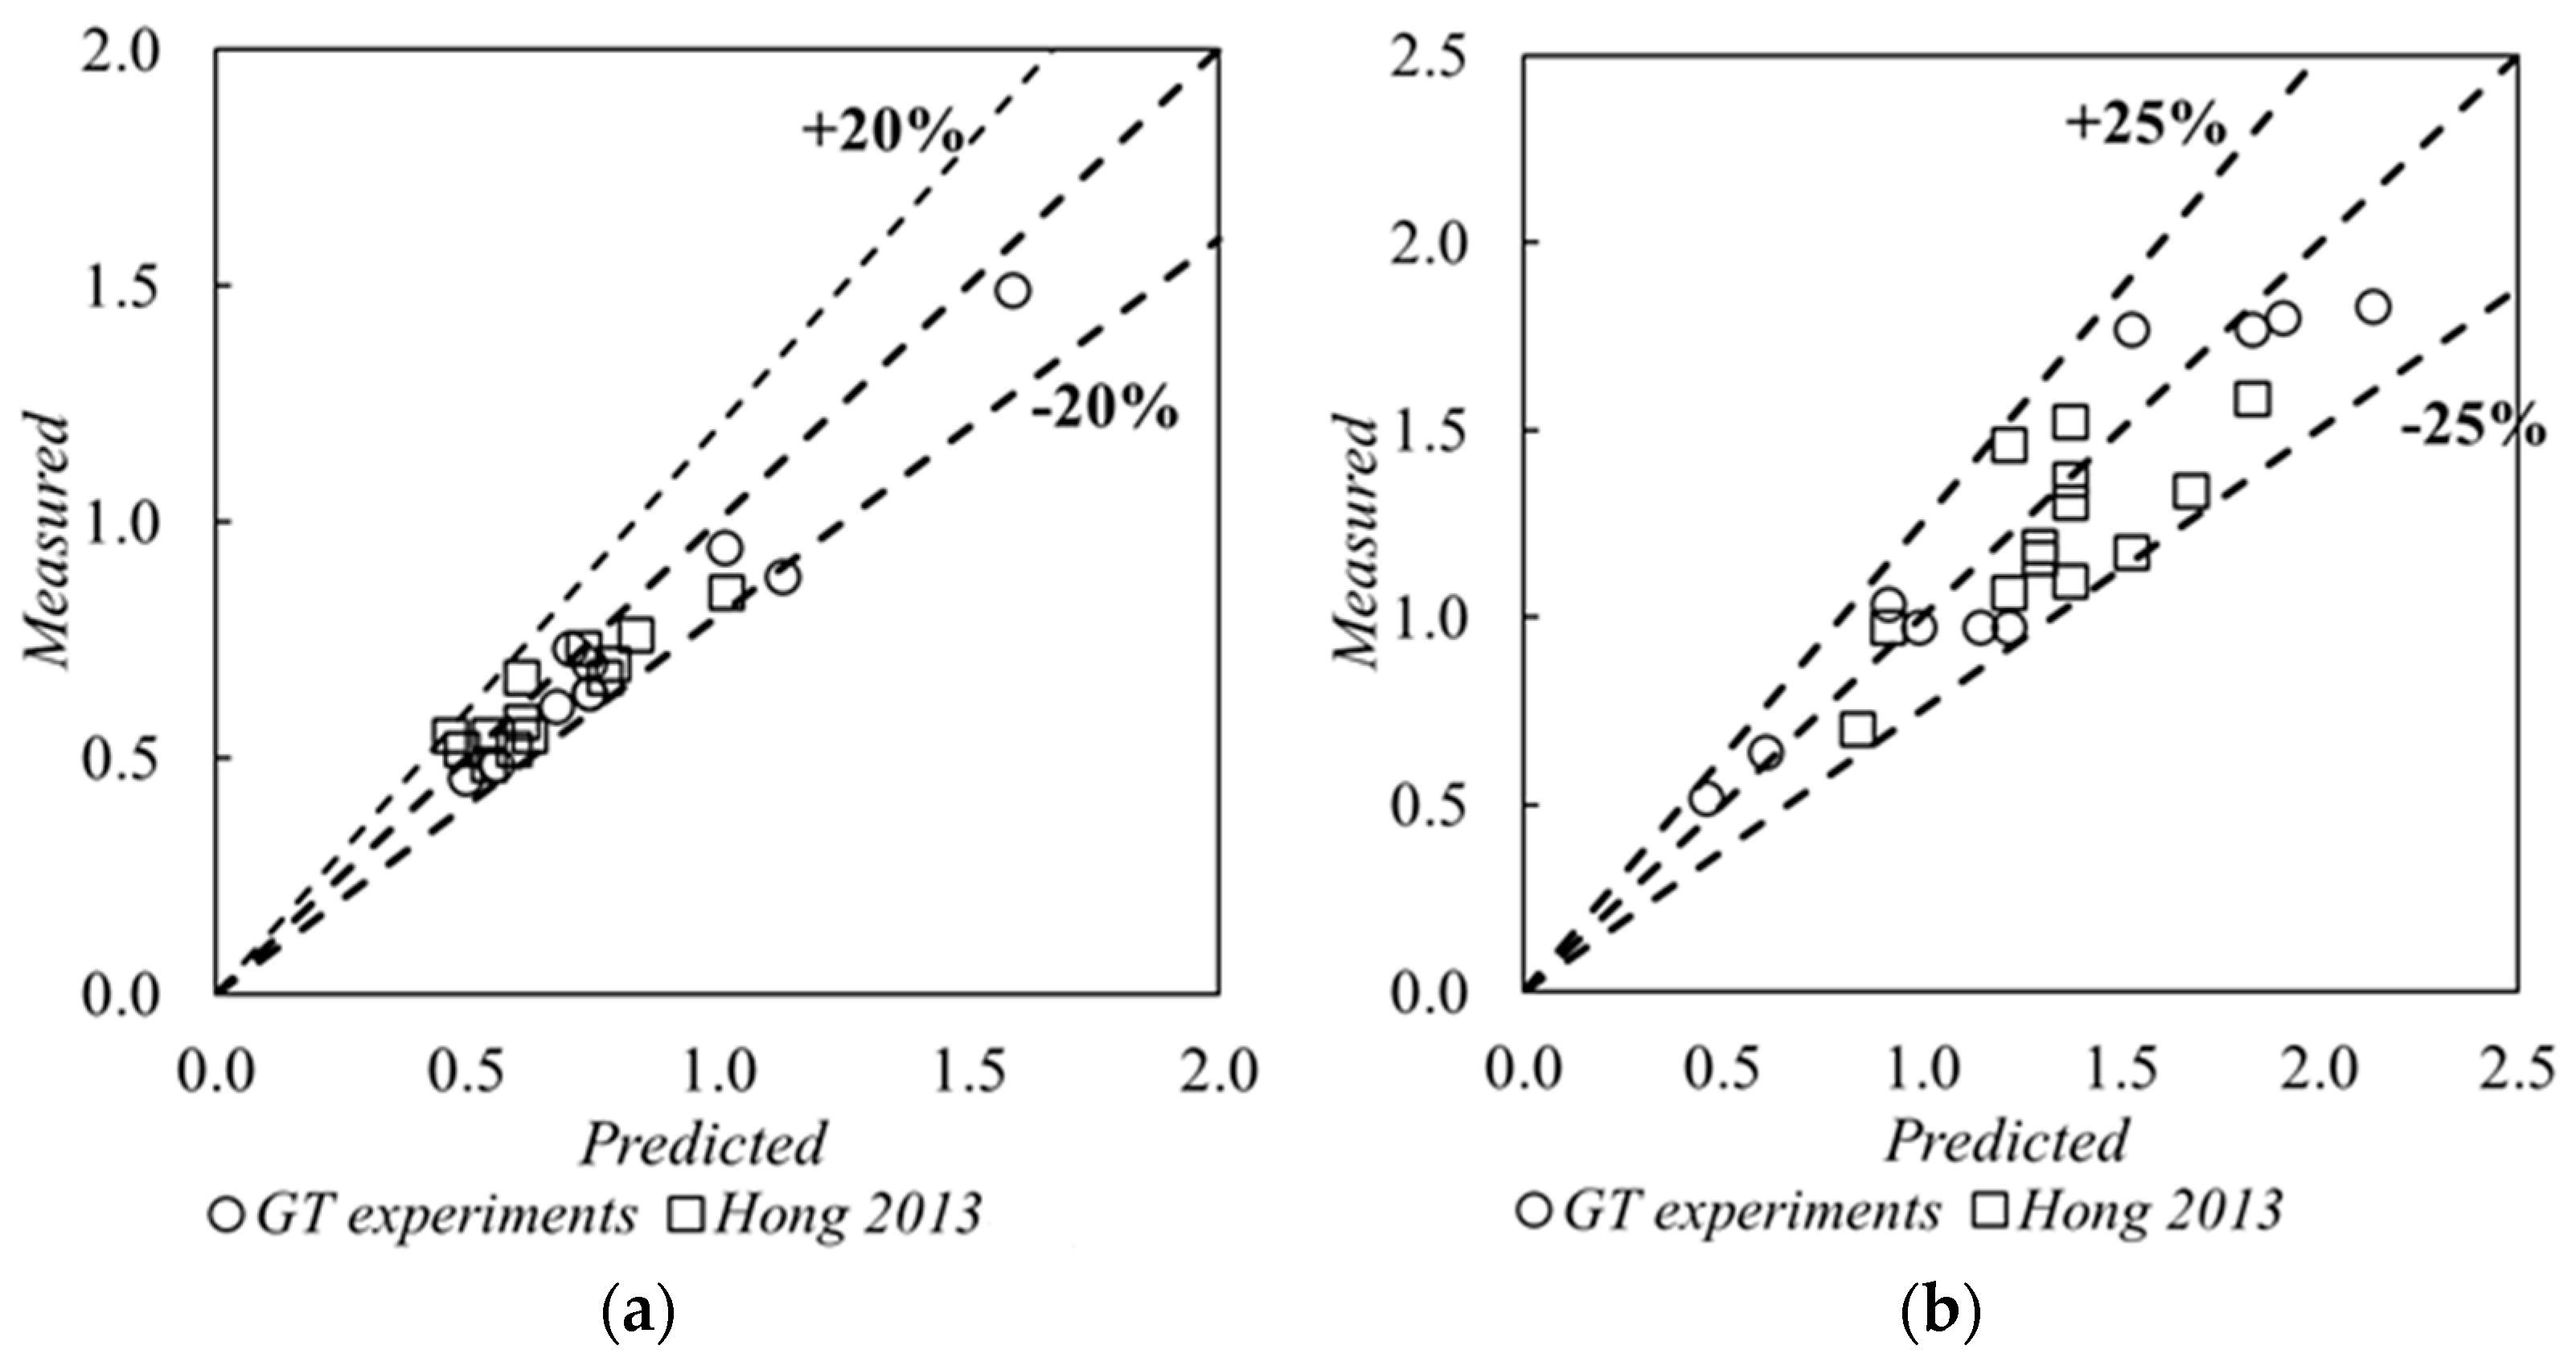
3.4. Prediction of Extent of Scour Hole

The extent of the scour hole in both the directions (transverse direction and flow direction) must be related to the location of the point of deepest scour with reference to the toe of the abutment. The shape of the scour hole generally remains oval with slight variations depending on the flow intensity, degree of flow contraction, and type of flow. Table 2 shows that the width of the scour hole in a lateral direction remains less than twice the distance of the deepest point of scour hole from the toe of the abutment, which ranges between 1.8 Lm and 1.9 Lm and can thus be considered as 2 Lm as a conservative approach. If a scour hole covers the full width of the contracted section floodplain (W), the variables in Equation (6) (Ls = La + Lm) can be replaced as Lm = W/2 (for the scour hole to cover the full width of the contracted section, where W = BfLa); the resulting equation after simplification can be written as Equation (8). This equation gives the normalized length of the abutment in terms of the normalized approach flow depth for which the scour hole covers the full width of the contracted section floodplain.
L a B f = 0.37 0.91 Y f 1 / Y f 0 0.5
As discussed earlier, the length of the scour hole in the flow direction is a strong function of shear stress and thus the square of the dimensionless velocity (V1/Vc). In the contracted section, the turbulent forces are very dominating, which ease out as the flow moves in a downstream direction out of the bridge constriction. This leaves a relatively larger scour hole, which can be approximated as 2.5 Lx as shown in Table 2. The comparison of the measured scour hole size to the predicted scour hole size is presented in Figure 11 for the transverse and flow directions.

4. Summary and Conclusions

In the past research, an abutment was classified based on the degree of flow convergence under the bridge between the main channel and the floodplain. However, in this study, abutment classification criterion is suggested based on the location of the point of deepest scour in a transverse direction because the location is important in the design and safety of the bridge itself, as well as the design of the river training works in the vicinity of the bridge. The formula in the current research shows better accuracy for the abutment classification by converging the points to a linear function by incorporating a better-suited non-dimensional variable. This classification further leads to the location of the point of deepest scour in a transverse direction when regressed over the independent variable linearly. Both the abutment classification criterion and the location of the point of deepest scour in a transverse direction complement each other. A fair estimate of the point of deepest scour has also been suggested in the flow direction in terms of a normalized distance from the upstream edge of the bridge, Lx/Lb. Based on the experimental study, Lx/Lb can be considered to be a function of both shear stress and flow contraction, and the location of the point of deepest scour can be divided into three distinct zones based on the bridge width. This criterion needs further improvement through additional experimentation and field observations because the presence of the pier affects the flow considerably, in the contracted section; thus, the variability in the location of the deepest point of the scour hole needs more refinements. Finally, a reasonable estimate of the extents of the scour hole starting from the toe of the abutment in a transverse and flow direction have also been suggested. The summary of the findings is presented in Table 3.
The flood risk associated with the scour can be optimized depending on both the location of the point of deepest scour in addition to its magnitude. Thus, a reasonably accurate prediction of the location of the point of deepest scour in the transverse direction can help improve a safe abutment design, pier location, and the distances between the piers, whereas the location of the point of deepest scour in the flow direction can help improve the design and location of the downstream structures/river training works in the downstream direction. This will help reduce the cost of the structures as well as the maximum efficacy of the river training works to control floods. Even if this study suggested abutment classification criterion and a more practical way of predicting the location of scour, a well-designed physical model is recommended to investigate those characteristics under live bed conditions. In addition, different sediment sizes and non-uniform-sized sediment should be incorporated in the future research, as natural rivers generally consist of non-uniform sediment.

Author Contributions

I.A.: writing—original draft, laboratory experiment, data curation. T.W.S.: conceptualization, methodology, and review. S.H.H.: conceptualization, methodology, laboratory experiment, writing—review and editing, data curation. All authors have read and agreed to the published version of the manuscript.

Funding

This research was supported by the Ministry of the Interior and Safety, South Korea [grant number MOIS63-002].

Data Availability Statement

The data that support the findings of this study are available from the corresponding author, Seung Ho Hong, upon reasonable request.

Acknowledgments

We would like to express our sincere appreciation to Terry W. Sturm, our mentor and advisor at the Georgia Institute of Technology, for his support.

Conflicts of Interest

The authors declare that they have no known competing financial interest or personal relationships that could have appeared to influence the work reported in this paper. Furthermore, there was no clinical trial during this research.

References

  1. Landers, M.N. Bridge scour data management. In Proceedings of the ASCE Water Forum ’92, Baltimore, MD, USA, 2–6 August 1992; pp. 1094–1099. [Google Scholar]
  2. Rehman, K.; Wang, Y.-C.; Waseem, M.; Hong, S.H. Tree-based machine learning models for prediction of bed elevation around bridge piers. Phys. Fluids 2022, 34, 085105. [Google Scholar] [CrossRef]
  3. Shirole, A.M.; Holt, R.C. Planning for a comprehensive bridge safety assurance program. Transp. Res. Record. 1991, 1290, 39–50. [Google Scholar]
  4. Lee, S.O.; Abid, I.; Hong, S.H. Effect of complex shape of pier foundation exposure on time development of scour. Environ. Fluid Mech. 2020, 21, 103–127. [Google Scholar] [CrossRef]
  5. Rehman, K.; Hong, S.H. Influence of lateral flow contraction on bed shear stress estimation by using measured turbulent kinetic energy. Exp. Therm. Fluid Sci. 2022, 139, 110742. [Google Scholar] [CrossRef]
  6. Arneson, L.A.; Zevenbergen, L.W.; Lagasse, P.F.; Clopper, P.E. Evaluating scour at bridges. In Hydraulic Engineering Circular 18 (HEC-18); U.S. Federal Highway Administration: Washington, DC, USA, 2012. [Google Scholar]
  7. Wu, P.; Hirshfield, F.; Sui, J.-Y. Local scour around bridge abutments under ice covered condition—An experimental study. Int. J. Sediment Res. 2015, 30, 39–47. [Google Scholar] [CrossRef]
  8. Yang, Y.; Melville, B.W.; Xiong, X.; Wang, L. Temporal evolution of scour at bridge abutments in compound channels. Int. J. Sediment Res. 2022, 37, 662–674. [Google Scholar] [CrossRef]
  9. Pandey, M.; Sharma, P.K.; Ahmad, Z.; Singh, U.K. Experimental investigation of clear-water temporal scour variation around bridge pier in gravel. Environ. Fluid Mech. 2017, 18, 871–890. [Google Scholar] [CrossRef]
  10. Chaudhuri, S.; Pandey, M.; Debnath, K.; Oliveto, G. A comparative study on equilibrium scour volume around circular cylinders in clay-sand mixed cohesive beds, at near threshold velocity of sand- an experimental approach. Water 2022, 22, 6777–6791. [Google Scholar] [CrossRef]
  11. Straub, L.G. Effect of channel contraction works upon regimen of moveable bed streams. Trans. Am. Geophys. Union 1934, 15, 454–463. [Google Scholar]
  12. Laursen, E.M. Scour at bridge crossings. J. Hydraul. Div. 1960, 86, 39–54. [Google Scholar] [CrossRef]
  13. Laursen, E.M. An analysis of relief bridge scour. J. Hydraul. Div. 1963, 89, 93–118. [Google Scholar] [CrossRef]
  14. Gill, M.A. Bed erosion in rectangular long contraction. J. Hydraul. Div. 1981, 107, 273–284. [Google Scholar] [CrossRef]
  15. Froehlich, D.C. Local scour at bridge abutments. In Proceedings of the National Conference of Hydraulic Engineering, ASCE, New Orleans, LA, USA, 14–18 August 1989; pp. 13–18. [Google Scholar]
  16. Sturm, T.W.; Janjua, N.S. Clear-water scour around abutments in floodplains. J. Hydraul. Eng. 1994, 120, 956–972. [Google Scholar] [CrossRef]
  17. Sturm, T.W. Scour around bankline and setback abutments in compound channels. J. Hydraul. Eng. 2006, 132, 21–32. [Google Scholar] [CrossRef]
  18. Oben-Nyarko, K.; Ettema, R. Pier and abutment scour interaction. J. Hydraul. Eng. 2011, 137, 1598–1605. [Google Scholar] [CrossRef]
  19. Sturm, T.W.; Ettema, R.; Melville, B. Evaluation of Bridge-Scour Research: Abutment and Contraction Scour Progresses and Prediction; Final Report, NCHRP Project 24-27(02); Transportation Research Board, The National Academies: Washington, DC, USA, 2011. [Google Scholar]
  20. Hong, S. Prediction of Clear-Water Abutment Scour Depth in Compound Channel for Extreme Hydrologic Events. Ph.D. Thesis, Smartech Home @ Georgia Tech, Atlanta, GA, USA, 2013. Available online: https://smartech.gatech.edu/handle/1853/47535?show=full (accessed on 14 January 2013).
  21. Khosronejad, A.; Diplas, P.; Angelidis, D.; Zhang, Z.; Heydari, N.; Sotiropoulos, F. Scour depth prediction at the base of longitudinal walls: A combined experimental, numerical, and field study. Environ. Fluid Mech. 2020, 20, 459–478. [Google Scholar] [CrossRef]
  22. Zolghadr, M.; Zomorodian, S.M.A.; Fathi, A.; Tripathi, R.P.; Jafari, N.; Mehta, D.; Sihag, P.; Azamathulla, H.M. Experimental study on the optimum installation depth and dimensions of roughening elements on abutment as scour countermeasures. Fluids 2023, 8, 175. [Google Scholar] [CrossRef]
  23. Nabaei, S.F.; Afzalimehr, H.; Sui, J.; Kumar, B.; Nabaei, S.H. Investigation of effect of vegetation on flow structures and turbulence anisotropy around semi-elliptical abutment. Water 2021, 13, 3108. [Google Scholar] [CrossRef]
  24. Fathi, A.; Zomorodian, S.M.A.; Zolghadr, M.; Chadee, A.; Chiew, Y.-M.; Kumar, B.; Martin, H. Combination of riprap and submerged vane as an abutment scour countermeasure. Fluids 2023, 8, 41. [Google Scholar] [CrossRef]
  25. Raikar, R.V.; Hong, J.-H.; Deshmukh, A.R.; Guo, W.-D. Parametric study on abutment scour under unsteady flow. Water 2022, 14, 1820. [Google Scholar] [CrossRef]
  26. Bonakdari, H.; Moradi, F.; Ebtehaj, I.; Gharabaghi, B.; Sattar, A.A.; Azimi, A.H.; Radecki-Pawlik, A. A non-tuned machine learning technique for abutment scour depth in clear water condition. Water 2020, 12, 301. [Google Scholar] [CrossRef]
  27. Choo, H.; Zhao, Q.; Burns, S.; Sturm, T.; Hong, S. Laboratory and theoretical evaluation of impact of packing density, particle shape, and uniformity coefficient on erodibility of coarse-grained soil particles. Earth Surf. Process. Landf. 2020, 45, 1499–1509. [Google Scholar] [CrossRef]
  28. Gotvald, A.J.; McCallum, B.E. Epic Flooding in Georgia, 2009 (No. 2010-3107); US Geological Survey: Atlanta GA USA, 2010. [Google Scholar]
  29. Umbrell, E.R.; Young, G.K.; Stein, S.M.; Jones, J.S. Clear-water contraction scour under bridges in pressure flow. J. Hydraul. Eng. 1998, 124, 236–240. [Google Scholar] [CrossRef]
  30. Lyn, D. Pressure-flow scour: A Reexamination of the HEC-18 equation. J. Hydraul. Eng. 2008, 134, 1015–1020. [Google Scholar] [CrossRef]
  31. Lyn, D. Turbulence models in sediment transport engineering. In Chapter 16 in Sedimentation Engineering: Measurements, Modeling, and Practice; Garcia, M., Ed.; ASCE Manual of Practice No. 110; ASCE: Reston, VA, USA, 2008. [Google Scholar]
  32. Guo, J.; Kerenyi, K.; Pagan-Ortiz, J.E.; Flora, K. Bridge pressure flow scour at clear water threshold condition. Trans. Tianjin Univ. 2009, 15, 79–94. [Google Scholar] [CrossRef]
  33. Shan, H.; Xie, A.; Bojanowski, C.; Suaznabar, O.; Lottes, S.; Shen, J.; Kerenyi, K. Submerged Flow Bridge Scour under Clear Water Conditions; Report FHWA-HRT-12-034; Federal Highway Administration: McClean, VA, USA, 2012.
  34. Hong Seung Ho Sturm, T.W.; Stoesser, T. Clear-water abutment scour depth in compound channel for extreme hydrologic events. J. Hydraul. Eng. 2015, 141. [Google Scholar] [CrossRef]
  35. Koushki, M.; Chamani, M.R.; Moghim, M.N. Assessment of equilibrium pressure-scour depth using jet flow theory. Int. J. Sediment Res. 2023, 38, 141–151. [Google Scholar] [CrossRef]
  36. Abdelhaleem, F.S.; Mohamed, I.M.; Shaaban, I.G.; Ardakanian, A.; Fahmy, W.; Ibrahim, A. Pressure-flow scour under bridge deck in clear water conditions. Water 2023, 15, 404. [Google Scholar] [CrossRef]
  37. Sui, J.; Afzalimehr, H.; Samani, A.K.; Maherani, M. Clear-water scour around semi-elliptical abutments with armored beds. Int. J. Sediment Res. 2010, 25, 233–245. [Google Scholar] [CrossRef]
  38. Pandey, M.; Valyrakis, M.; Qi, M.; Sharma, A.; Lodhi, A.S. Experimental assessment and prediction of temporal scour depth around a spur dike. Int. J. Sediment Res. 2020, 36, 17–28. [Google Scholar] [CrossRef]
  39. Sodjavi, K.; Montagné, B.; Bragança, P.; Meslem, A.; Byrne, P.; Degouet, C.; Sobolik, V. PIV and electrodiffusion diagnostics of flow field, wall shear stress and mass transfer beneath three round submerged impinging jets. Exp. Therm. Fluid Sci. 2016, 70, 417–436. [Google Scholar] [CrossRef]
  40. Zhang, W.; Zapata, M.U.; Bai, X.; Pham-Van-Bang, D.; Nguyen, K.D. Three-dimensional simulation of horseshoe vortex and local scour around a vertical cylinder using an unstructured finite-volume technique. Int. J. Sediment Res. 2020, 35, 295–306. [Google Scholar] [CrossRef]
  41. Melville, B.W. Local scour at bridge abutments. J. Hydraul. Eng. 1992, 118, 615–631. [Google Scholar] [CrossRef]
  42. Chang, F.; Davis, S. Maryland SHA Procedure for Estimating Scour at Bridge Abutments Part 2-Clear Water Scour. Stream Stability and Scour at Highway Bridges: Compendium of Stream Stability and Scour Papers Presented at Conferences Sponsored by the Water Resources Engineering (Hydraulics) Division of the American Society of Civil Engineers; ASCE: Memphis, TN, USA, 1998. [Google Scholar]
  43. Xu, P.; Cheng, N.; Wei, M. Length parameter for scaling abutment scour depth. Water 2020, 12, 3058. [Google Scholar] [CrossRef]
  44. Hong, S.H.; Abid, I. Scour around an erodible abutment with riprap apron over time. J. Hydraul. Eng. 2019, 145, 06019007. [Google Scholar] [CrossRef]
  45. Melville, B.W.; Chiew, Y.-M. Time Scale for Local Scour at Bridge Piers. J. Hydraul. Eng. 1999, 125, 59–65. [Google Scholar] [CrossRef]
  46. Sturm, T.W. Open Channel Hydraulics, 2nd ed.; McGraw-Hill: New York, NY, USA, 2010. [Google Scholar]
  47. Pagliara, S.; Hassanabadi, S.; Kurdistani, M. Log-Vane scour in Clear water conditions. River Res. Appl. 2014, 31, 1176–1182. [Google Scholar] [CrossRef]
  48. Carnacina, I.; Pagliara, S.; Leonardi, N. Bridge pier scour under pressure flow conditions. River Res. Appl. 2019, 35, 844–854. [Google Scholar] [CrossRef]
  49. Roy, D.; Pagliara, S. Equilibrium morphology and scour evolution at blunt nosed chevrons. River Res. Appl. 2021, 38, 499–512. [Google Scholar] [CrossRef]
  50. Sturm, T.W. Enhanced Abutment Scour Studies for Compound Channels; FHWA-RD-99-156; Federal Highway Administration: Mclean, VA, USA, 2004. [Google Scholar]
  51. Kara, S.; Stoesser, T.; Sturm, T.W. Turbulence statistics in compound channels with deep and shallow overbank flows. J. Hydraul. Res. 2012, 50, 482–493. [Google Scholar] [CrossRef]
  52. Abdelaziz, A.A.; Lim, S.Y. Effect of abutment aspect ratio on clear-water scour in floodplains. River Res. Appl. 2019, 36, 148–160. [Google Scholar] [CrossRef]
  53. Xiong, X. Combined Abutment and Contraction Scour in Compound Channels for Extreme Flood Events. Ph.D. Thesis, Libraries and Learning Services @ The University of Auckland, Auckland, New Zealand, 2017. [Google Scholar]
Figure 1. Schematic diagram showing experimental variables for the approach and the bridge section.
Water 15 04155 g001
Figure 2. Schematic diagram showing variables for location of scour hole and the extents.
Water 15 04155 g002
Figure 3. (a) Flume test section looking from downstream to upstream; (b) the bridge cross-section showing different abutment lengths in the left floodplain.
Water 15 04155 g003
Figure 4. Equilibrium scour hole around the abutment for (a) Hong 2 and (b) Hong 8.
Water 15 04155 g004
Figure 5. Effect of water depth increase on flow distribution in main channel to floodplain for a compound channel [20,50].
Water 15 04155 g005
Figure 6. (a) Schematic diagram showing flow contraction around the abutment; (b) transverse distribution of depth-averaged velocity and the flow stagnation zone around the abutment.
Water 15 04155 g006
Figure 7. Comparison of abutment classification criteria and scour location [20].
Water 15 04155 g007
Figure 8. Schematic diagram showing the effect of different abutment lengths on scour phenomenon (same contracted section width (W) with different abutment lengths and different scour magnitudes).
Water 15 04155 g008
Figure 9. Normalized location of point of the deepest scour in transverse direction [20].
Water 15 04155 g009
Figure 10. Normalized location of point of the deepest scour in flow direction [20].
Water 15 04155 g010
Figure 11. Graphical representation of the scour hole size measurement and the prediction as [20]: (a) transverse direction (width); (b) flow direction (length).
Water 15 04155 g011
Table 1. Dimensionless scour parameters for prediction of scour location.
RunLa/BfFlow TypeLs/BfLx/LbYf1/Yf0Vf1/Vfcqf2/qf1W/Yf1
GT 10.41F0.510.631.0800.5421.54820.746
GT 20.41SO0.551.581.1060.5891.51915.576
GT 30.41OT0.520.841.0460.5611.04310.460
GT 40.41F0.551.371.1320.6551.50020.080
GT 50.41OT0.541.261.0670.6841.01410.183
GT 100.77F0.992.531.2440.6591.8217.547
GT 110.77SO0.312.631.3620.5791.8655.540
GT 120.77OT0.912.951.0980.6221.1543.984
GT 180.41F0.551.681.0960.5861.67015.723
GT 190.77F0.972.111.2150.5892.1036.211
Hong 1 *0.88OT1.002.111.0480.4201.3392.087
Hong 2 *0.53F0.641.791.1150.6131.81816.460
Hong 3 *0.53F0.651.681.1220.5801.75516.194
Hong 4 *0.71F0.861.261.1270.5432.23610.080
Hong 5 *0.71F0.821.161.0950.4972.20810.373
Hong 6 *0.53SO0.681.681.1020.5901.87511.527
Hong 7 *0.53SO0.671.901.0920.5691.78111.268
Hong 8 *0.71SO0.911.901.1230.5322.2577.418
Hong 9 *0.71SO0.871.791.1140.4902.2237.289
Hong 10 *0.53OT0.652.531.0680.6131.1488.197
Hong 11 *0.53OT0.641.901.0640.5561.2508.264
Hong 12 *0.71OT0.802.321.0740.5651.1765.091
Hong 13 *0.71OT0.791.901.0570.5001.2785.176
Note: * The experimental results from Hong [20].
Table 2. Measured and predicted value of scour hole size.
RunLa/BfFlow TypeLm
(m)
2 Lm
(m)
Measured Scour Width, (m)Lx
(m)
2.5 Lx (m)Measured Scour Length, (m)
GT 10.41F0.2490.4970.4570.1830.4580.518
GT 20.41SO0.3710.7410.7010.4571.1430.975
GT 30.41OT0.2800.5600.4880.2430.6080.640
GT 40.41F0.3710.7410.6400.3960.9900.975
GT 50.41OT0.3400.6790.6100.3660.9141.036
GT 100.77F0.5651.1300.8840.7321.8291.768
GT 110.77SO0.7921.5851.4940.7621.9041.798
GT 120.77OT0.3520.7050.7320.8532.1341.829
GT 180.41F0.3710.7410.6400.4881.2190.975
GT 190.77F0.5051.0100.9450.6101.5241.768
Hong 1 *0.88OT0.3110.6220.5490.6101.5241.173
Hong 2 *0.53F0.2720.5440.5490.5181.2951.158
Hong 3 *0.53F0.3030.6060.5790.4881.2191.067
Hong 4 *0.71F0.3860.7720.6710.3660.9140.975
Hong 5 *0.71F0.2950.5910.5180.3350.8380.701
Hong 6 *0.53SO0.3940.7880.7010.4881.2191.463
Hong 7 *0.53SO0.3650.7310.7320.5491.3721.524
Hong 8 *0.71SO0.5081.0160.8530.5491.3721.372
Hong 9 *0.71SO0.4170.8340.7620.5181.2951.189
Hong 10 *0.53OT0.3030.6060.6710.7321.8291.585
Hong 11 *0.53OT0.2720.5440.4880.5491.3721.311
Hong 12 *0.71OT0.2330.4660.5490.6711.6761.341
Hong 13 *0.71OT0.2440.4880.5180.5491.3721.097
Note: * The experimental results from Hong [18].
Table 3. Summary of the findings.
No.FindingCriteriaRemarks
1.Abutment Classification L a B f Y f 1 Y f 0 < 0.94   L S A
L a B f Y f 1 Y f 0 > 0.94   S S A
2.Location in Transverse Direction L s B f = 0.91 L a B f Y f 1 Y f 0 + 0.13 Point of Deepest Scour
3.Location in Flow Direction L x L b < 1   F o r   L a B f V f 1 V f c 2 < 0.13
1 < L x L b < 2   F o r   0.13 < L a B f V f 1 V f c 2 < 0.22
2 < L x L b < 3   F o r   L a B f V f 1 V f c 2 > 0.22
Point of Deepest Scour
4.Size of the Scour Hole2 Lm for the transverse direction
2.5 Lx for the flow direction
Disclaimer/Publisher’s Note: The statements, opinions and data contained in all publications are solely those of the individual author(s) and contributor(s) and not of MDPI and/or the editor(s). MDPI and/or the editor(s) disclaim responsibility for any injury to people or property resulting from any ideas, methods, instructions or products referred to in the content.

