Article

Heavy Metal Content Characteristics and Pollution Source Analysis of Shallow Groundwater in Tengzhou Coal Mining Area

1
Geophysical Prospecting and Surveying Team, Shandong Bureau of Coal Geological, Jinan 250102, China
2
College of Earth Science and Engineering, Shandong University of Science and Technology, Qingdao 266590, China
*
Authors to whom correspondence should be addressed.
Water 2023, 15(23), 4091; https://doi.org/10.3390/w15234091
Submission received: 26 October 2023 / Revised: 22 November 2023 / Accepted: 22 November 2023 / Published: 25 November 2023
(This article belongs to the Topic Human Impact on Groundwater Environment)

Abstract

:
This study analyzed the sources of total metal elements using the positive matrix factorization (PMF) model and conducted human health risk assessment for adults and children using the health risk assessment model recommended by the United States Environmental Protection Agency (USEPA). According to the health risk assessment, As is the main contributor to the non-carcinogenic risk of groundwater in Tengzhou, with drinking water as the main exposure route. Regarding carcinogenic risks (CR), the values of As and Cr for adults and children were higher than 1 × 10⁻⁴, with drinking water as the main exposure route. Therefore, As is the largest contributor to the CR of groundwater for adults and children and drinking water is the main exposure route in the study area. The primary exposure pathways are oral intake and dermal contact, with oral intake presenting a significant risk. The carcinogenic risks according to principal component analysis (PCA) and PMF analysis showed that the main sources of heavy metals in shallow groundwater in Tengzhou City are agricultural, industrial, natural, and industrial deposition sources, with contribution rates of 21.7%, 27.2%, 31.0%, and 20.1%, respectively. In particular, natural sources are the largest contributor to the accumulation of heavy metals.

1. Introduction

Groundwater is an important natural resource for human survival and development. At present, China is facing the problem of groundwater pollution. According to the “Report on the State of the Ecology and Environment in China 2020”, among the 10,171 groundwater quality monitoring points installed by the natural resources department, Class IV water accounted for 68.8% of the total monitoring points, and Class V water accounted for 17.6% [1]. However, with the rapid development of modern industry and agriculture, the quality of urban groundwater is deteriorating. In particular, heavy metals are the main pollutants in groundwater. Heavy metals such as As, Cr, Hg, and Pb enter the human body through drinking water and skin contact. They can interact strongly with proteins and various enzymes in the human body, making them inactive. They can also be enriched in certain organs of the human body as they are resistant to degradation. When their levels exceed the tolerance limit of the human body, various forms of poisoning, such as acute poisoning, subacute poisoning, and chronic poisoning, will occur, causing great harm to human health [2].
In recent years, with continuous attention being paid to the prevention and control of urban groundwater pollution and the strengthening of people’s awareness regarding the health risks of pollutants, the health risk assessment of heavy metals in urban water resources has become a hot topic in urban environmental research. At present, an increasing number of studies are paying attention to the pollution source analysis and health risk assessment of heavy metals in groundwater [3]. The sources of heavy metals in groundwater can be divided into geological background and anthropogenic sources. The geological background sources include the weathering of parent rocks and soil formation, and the anthropogenic sources include metal smelting, sewage irrigation, industrial discharge, and pesticide and fertilizer application [4]. In recent years, the source apportionment of heavy metals in groundwater has primarily been conducted using multivariate statistical analysis and model analysis. Multivariate statistical analysis mainly includes correlation, principal component, and factor analysis, while model analysis mainly includes chemical mass balance (CMB) and absolute principal component. Moreover, multivariate linear regression (APCS-MLR) and positive definite matrix factorization (PMF) have also been applied [5,6,7].
Tengzhou City is located in the central and southern part of Shandong Province. This city is rich in mineral resources, of which coal is the pillar industry of local economic development. In this study, 24 well points were selected to determine the contents of As, Hg, Cd, Co, Cr, Cu, Ni, Zn, pH, TDS, Th, and COD in the groundwater. The PMF model was used to analyze the sources of total metal elements, and the health risk assessment model recommended by the United States Environmental Protection Agency (USEPA) was used to carry out human health risk assessment for adults and children. The findings are expected to provide a reference for formulating and implementing safety measures regarding groundwater supply and pollution prevention in Tengzhou City [8,9,10].

2. Materials and Methods

2.1. Study Area

Tengzhou City is located in the south of Shandong Province (34°50′–35°17′ N, 116°49′–117°24′ E). It is a famous energy base and industrial city in Shandong Province, China, with an area of 1495 km2 and a population of 1.75 million. It borders Zoucheng City in the north, Shanting District in the east, Xuecheng District in the south, Weishan Lake in the west, and Weishan County. The study area is located in the southern part of the warm temperate semi-humid area. The area experiences a prominent monsoon continental climate. Affected by atmospheric circulation, the four seasons are distinct. Springs are windy and rainy, summers are rainy and hot, autumns are sunny and cool, and winters are cold and dry. The annual average temperature is 14.5 °C, average annual precipitation is approximately 695 mm, and average relative humidity is 68%. The terrain is tilted from northeast to southwest, surrounded by mountains on three sides and faces Nansi Lake towards the west. This area features four soil types, among which fluvo-aquic soil and cinnamon soil account for the largest surface area coverage. The study area is divided into six hydrogeological units: Tengxi Plain, Dangshan Fault Terrace, Fushan Fault Block, Jingquan Fault Block, Guanqiao Fault Block, and Yangzhuang Basin. According to the burial characteristics and hydraulic characteristics of groundwater in the study area, the water-bearing rock groups can be divided into three main types. The first type is the Quaternary loose rock group with water-bearing pores, which is distributed throughout the area. The lithology is mainly clay, sub-clay, and gravel, the water type is mainly HCO3–Ca, and the salinity is generally about 0.3 g/L. The second type is carbonate rock and clastic rock group with water-bearing fissures, which is distributed in the northeast of the study area. The third type is the Ordovician and Cambrian carbonate rock group with water-bearing fractures, which is mainly distributed in Yangzhuang, Weizhuang, Houshiwan Village, and Longshantou [11]. Atmospheric precipitation is the main source of supply, and draining is mainly facilitated by artificial mining and natural processes. Tengzhou is an important political, economic, cultural, scientific, educational, and commercial center in southern Shandong Province. Coal and limestone are the main mineral resources of the city. The development and utilization of these mineral resources have made great contributions to the economic and social development of the city.

2.2. Sampling and Analysis

According to the hydrogeological conditions of the study area, a monitoring well was set up at the site in February 2022, and a total of 24 groundwater samples were collected. The groundwater sampling points are shown in Figure 1. The sample collection was carried out according to the requirements of the “Technical Guidelines for Sampling Volatile Organic Compounds in Soil and Groundwater” (HJ 1019–2019) [12]. The water samples were collected in a 500 mL polyethylene bottle (Tai’an Xinming Plastic Co., Ltd., Tai’an, China). The sampling bottle was rinsed with distilled water before sampling. After sampling, 2.5 mL nitric acid (1:1) (Shandong Xinhao Chemical Co., Ltd., Zibo, China) was added to the sample bottle to ensure that the pH of the sample was below 2.0, and the sample was then sealed with a white polytetrafluoroethylene bottle cap. After completing sample collection, all samples were sent to the experimental test center of the Shandong Lunan Geological Engineering Exploration Institute for immediate testing. The standard “Water quality-Determination of 65 elements-Inductively coupled plasma-mass spectrometry” (HJ700–2014) was applied for the detection of Cd, Cr, Cu, Ni, Pb, and Zn, and the test instrument was Thermo Fisher iCAP-RQ(Thermo Fisher Scientific Co., Ltd., Waltham, MA, America) [13]. The standard “Water Quality–Determination of Mercury, Arsenic, Selenium, Bismuth and Antimony–Atomic Fluorescence Spectrometry” (HJ694–2014) was applied for the detection of Hg and As, and the test instrument was PF5-2 atomic fluorescence spectrometer(Beijing General Analytical Instrument Co., Ltd., Beijing, China) [14]. The detection limits of As, Cd, Co, Cr, Cu, Hg, Ni, and Zn were 0.12, 0.01, 0.03, 0.11, 0.08, 0.01, 0.06, and 0.67 ug/L, respectively. The standard deviation of the test results for all elements was less than 15%, and the recovery rate was about 90%.

2.3. Water Quality Evaluation

The single-factor pollution index and Nemerow index were used to evaluate the heavy metal pollution, and to analyze and discriminate the risk degree of heavy metals in groundwater in Tengzhou City. The Nemerow index method can comprehensively reflect the pollution of each risk element in a water body [15]. Therefore, it has been widely used in China and abroad for calculating the comprehensive pollution index. The calculation formula is as follows:
P i = C i / H i
P n = P i m a x 2 + P i a v e 2 / 2
In the formula, Pi is the single-factor pollution index of heavy metals in category I; Ci is the measured value of heavy metals in category I; Hi is the weight of type i. The metal water quality standard adopts the Class III water quality standard in the “Standard for Groundwater Quality” (GB14848–2017) as the evaluation standard; Pimax is the maximum value of the single-factor pollution index; Piave is the average of the single-factor pollution index; the obtained Pn is classified according to the Nemerow comprehensive pollution classification standard [16,17].

2.4. Source Analysis

2.4.1. Principal Component Analysis

Principal component analysis (PCA) is a statistical method used to simplify datasets through dimensionality reduction. It can transform a complex dataset containing many variables into a simpler dataset containing a few principal components. These principal components can retain the variation information in the original data as much as possible, such that the data can be analyzed without losing too much information. PCA statistics include the covariance matrix, eigenvalue, principal component score, and cumulative contribution rate. Based on PCA, this study further applied PMF to analyze the sources of heavy metals, thus increasing the reliability of the PMF results [18].

2.4.2. Positive Matrix Factorization

Positive matrix factorization (PMF) is a receptor model analysis method. It separates the mixed effects of multiple sources by statistically analyzing the variability among indicators, such that the contribution of each source to the indicators can be determined. The specific formula is as follows:
X i j = k = 1 p g i k f k j + e i j
In the formula, Xij is the concentration of the jth element in the ith sample; gik is the contribution of source k to the first i sample, that is, the contribution rate matrix of the source; fkj is the concentration of the jth element in the source k, that is, the source component spectrum matrix; e is the residual matrix; p is the number of pollution data sources.
The factor contribution and distribution are determined by minimizing the objective function Q, and the specific formula is as follows:
Q = i = 1 n i = 1 m e i j / u i j
In the formula, i represents the sample serial number; j represents the element serial number; k denotes the sequence number of the contamination data source; n is the total number of samples; m is the total number of elements; uij is the uncertainty of heavy metals. The uncertainty formula is as follows:
u i j = 5 6 MDL                                                 C MDL E F × C 2 + 0.5 × M D L 2 ,             C > MDL  
In the formula, MDL represents the detection limit of heavy metals in the sample; C is the measured value of heavy metals in the sample (mg/L); EF is the relative uncertainty [19].

2.5. Health Risk Assessment

The risks of heavy metals in groundwater to human health are primarily facilitated by oral intake and dermal contact, and 90% of pollutants enter the human body through these two pathways. In this study, the health risk assessment model recommended by the United States Environmental Protection Agency (USEPA) was used to evaluate the health risk of heavy metal elements in the groundwater of the study area. The specific calculation formula of heavy metal exposure dose in soil is as follows:
A D I o r a l = C × R o r a l × E F × T B W × A T
A D I d e r = C × S A × A F × A B S × E F × T B W × A T
In the formula, the subscripts oral and der represent oral intake and dermal contact, respectively; C represents the content of heavy metal elements; R represents the intake rate; EF represents the exposure frequency; T represents the exposure time of the population; BW represents the average weight of the population; AT represents the average total exposure time; SA represents the area of skin exposure; AF represents the adhesion factor of heavy metal elements; ABS represents the skin absorption factor. The relevant values are shown in Table 1 and Table 2 [20].
According to the pollutants detected in groundwater, the health risks are divided into two categories: non-carcinogenic health risks (HI) and carcinogenic health risks (CR). The calculation formula is as follows:
H I = i = 1 n A D I o r a l R f D o r a l + A D I d e r R f D d e r i
C R = i = 1 n A D I o r a l × S F o r a l + A D I d e r × S F d e r i
In the formula, RfD represents the reference measurement of each exposure pathway; SF represents the carcinogenic slope factor of each pathway. The relevant values are shown in Table 2.
According to the USEPA classification, for non-carcinogenic risk, HI < 1 indicates a lower non-carcinogenic risk, and HI > 1 indicates potential adverse effects. For carcinogenic risk, if the HI value is lower than 10−6, the pollutant is considered to have no carcinogenic risk. If the HI value is 10−6–10−4, the pollutant is considered to have a carcinogenic risk tolerable by the human body. If the HI value is greater than 10−4, the pollutant is considered to pose dangerous carcinogenic risk to the human body [21].

3. Results and Discussion

3.1. Levels of Major Parameters

In this study, a total of 24 groundwater samples were collected within Tengzhou. Specifically, eight heavy metals were tested, namely As, Cd, Co, Cr, Cu, Hg, Ni, and Zn. The conventional indicators tested included pH, TDS, Th, and COD. The statistical results of the measured data are shown in Table 3. Among the twenty-four samples, the Cd contents of fourteen samples and the Hg contents of five samples were below the detection limits. Nevertheless, heavy metals were detected in the remaining samples. According to the limit values of Class III water in the “Standard for Groundwater Quality” (GB14848-2017) [16], the contents of As, Cd, Co, Cr, Cu, Hg, and Zn were within the permissible limits. Although the average content of Ni was less than the standard limit, the Ni content of one sample exceeded the standard, reflecting some pollution. Among the tested heavy metals, the coefficient of variation of Cd, Cu, and Zn exceeded 1.0, indicating large differences in water quality among the groundwater samples.

3.2. Evaluation of Groundwater Heavy Metal Pollution Risk

The results of the single-factor pollution index analysis and Nemerow comprehensive pollution index are shown in Table 4. The single-factor pollution indexes of As, Cd, Cr, Co, Hg, and Zn in groundwater were 0.12–0.21, 0.001–0.033, 0.013–0.072, 0.01–0.05, 0.005–0.056, and 0.003–0.195, respectively, all of which correspond to the clean grade. Moreover, the single-factor pollution index of Cu was very small, also corresponding to the clean grade. The single-factor pollution index of Ni was 0.22–1.07. It corresponded to the clean grade at most plots except for TS03, at which the value was 1.07, corresponding to mild pollution. The calculation results of the Nemerow comprehensive pollution index showed that the value was below 0.7 at most plots, corresponding to the clean grade, except for TS03, where the value was 0.78. Therefore, this site was classified under the pollution alert grade. In general, under water quality standard III, the groundwater in the area is under good conditions and the water quality is high. The most likely heavy metal pollutants are As and Ni, which requires follow-up attention.

3.3. Groundwater Health Risk Assessment

According to the health risk assessment model recommended by the USEPA, the daily average exposure of the eight heavy metals was analyzed under two exposure pathways (oral intake and dermal contact). Moreover, the health risk assessment was carried out according to the content of heavy metal elements in groundwater. The health risk assessment model was used to calculate the single non-carcinogenic health risk index and carcinogenic health risk index of heavy metals in adults and children under the two exposure pathways. The results are shown in Table 5.
The order of magnitude of the non-carcinogenic health risks of heavy metals through oral intake and dermal contact was between 1 and 10−5. For adults, the HI values followed the order As > Cr > Ni > Zn > Hg > Co > Cd > Cu. In particular, the HI value of As was 1.51, and the other heavy metals were classified as posing low risk. Regarding oral intake, the HI value for adults was 1.92, which is close to twice the value recommended by the USEPA. Regarding dermal contact, the HI value for adults was smaller than the recommended value by two orders of magnitude. The HI values of heavy metals for children were much lower than the USEPA-recommended values, except for As with a value of 0.72 under the oral intake pathway. In general, As was the main contributor to the non-carcinogenic risk of groundwater in Tengzhou, and oral intake is the main pathway of exposure.
In terms of carcinogenic risk, the values of As and Cr exceeded the maximum acceptable value of 1 × 10⁻⁴ for adults and children recommended by the USEPA, and the main exposure pathway is oral intake. The CR of As to adults and children through the two pathways was the largest, and the CR value of oral intake exceeded the acceptable level by two orders of magnitude, reflecting a significant risk. The CR values of As through dermal contact were 1.78 × 10⁻⁵ and 4.84 × 10⁻⁶ for adults and children, respectively, which were classified as possible risks. Cr presented a significant carcinogenic risk to both adults and children through drinking water, and Cd may pose a carcinogenic risk to both adults and children through drinking water. In general, As was the primary contributor to the carcinogenic health risk to the population in the region, with oral intake as the main exposure pathway.
Pearson correlation analysis was conducted to analyze the correlation of heavy metals in the groundwater in Shijiazhuang. The results show that the correlation coefficients between heavy metals Co–Cd, Co–Cr, Co–Ni, and Cr–Ni were 0.5, 0.43, 0.91, and 0.44, respectively, indicating significant positive correlations between them (p < 0.05). They may have common material sources and similar hydrogeochemical behaviors. There was no significant correlation between Zn and As and other metal elements, indicating different material sources or migration and transformation pathways of these metal elements(Figure 2).
SPSS26.0 was used to standardize the original data. Thereafter, the KMO test and Bartlett’s test of sphericity were performed on the standardized data. The KMO statistic value was 0.507 (greater than 0.5), and Bartlett’s test of sphericity yielded a value less than 0.05, indicating that the data are suitable for PCA. Four principal components, PC1, PC2, PC3, and PC4, were extracted using the Kaiser standardized orthogonal rotation method. By multiplying the linear combination coefficient with the quotient of the variance interpretation rate and the cumulative variance interpretation rate, the loadings of the principal components were obtained, and the results are presented in Table 6.

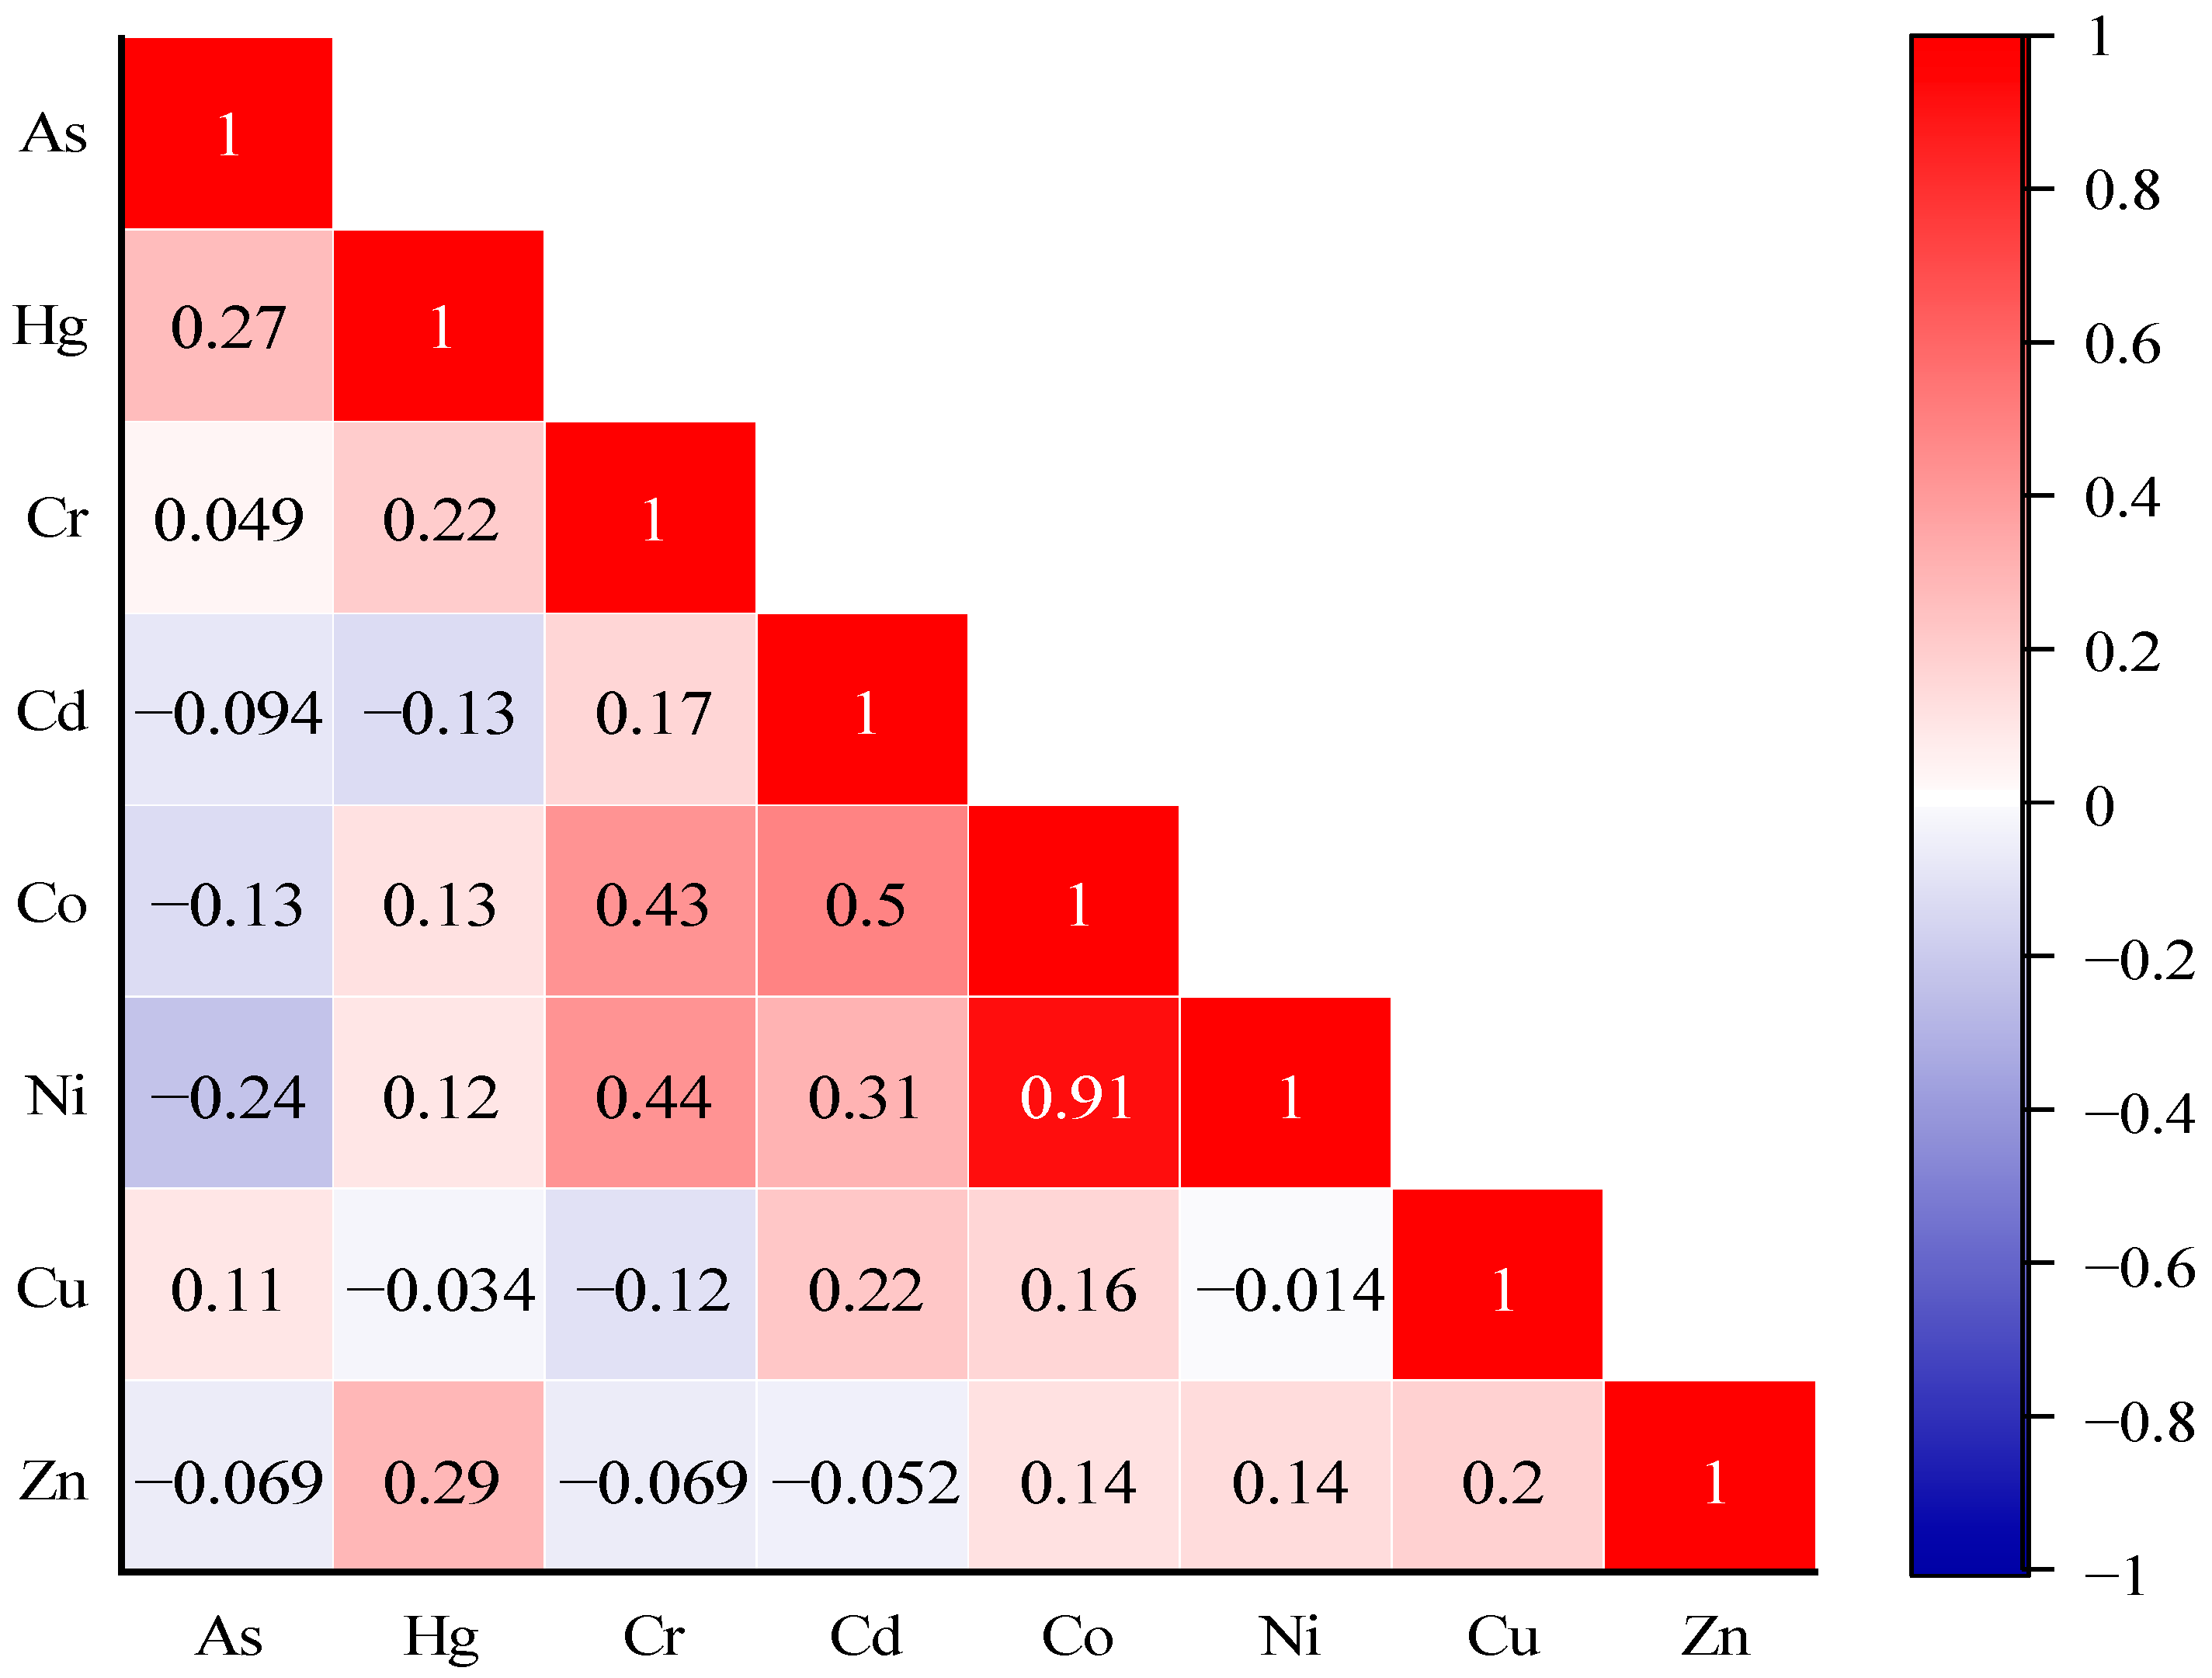
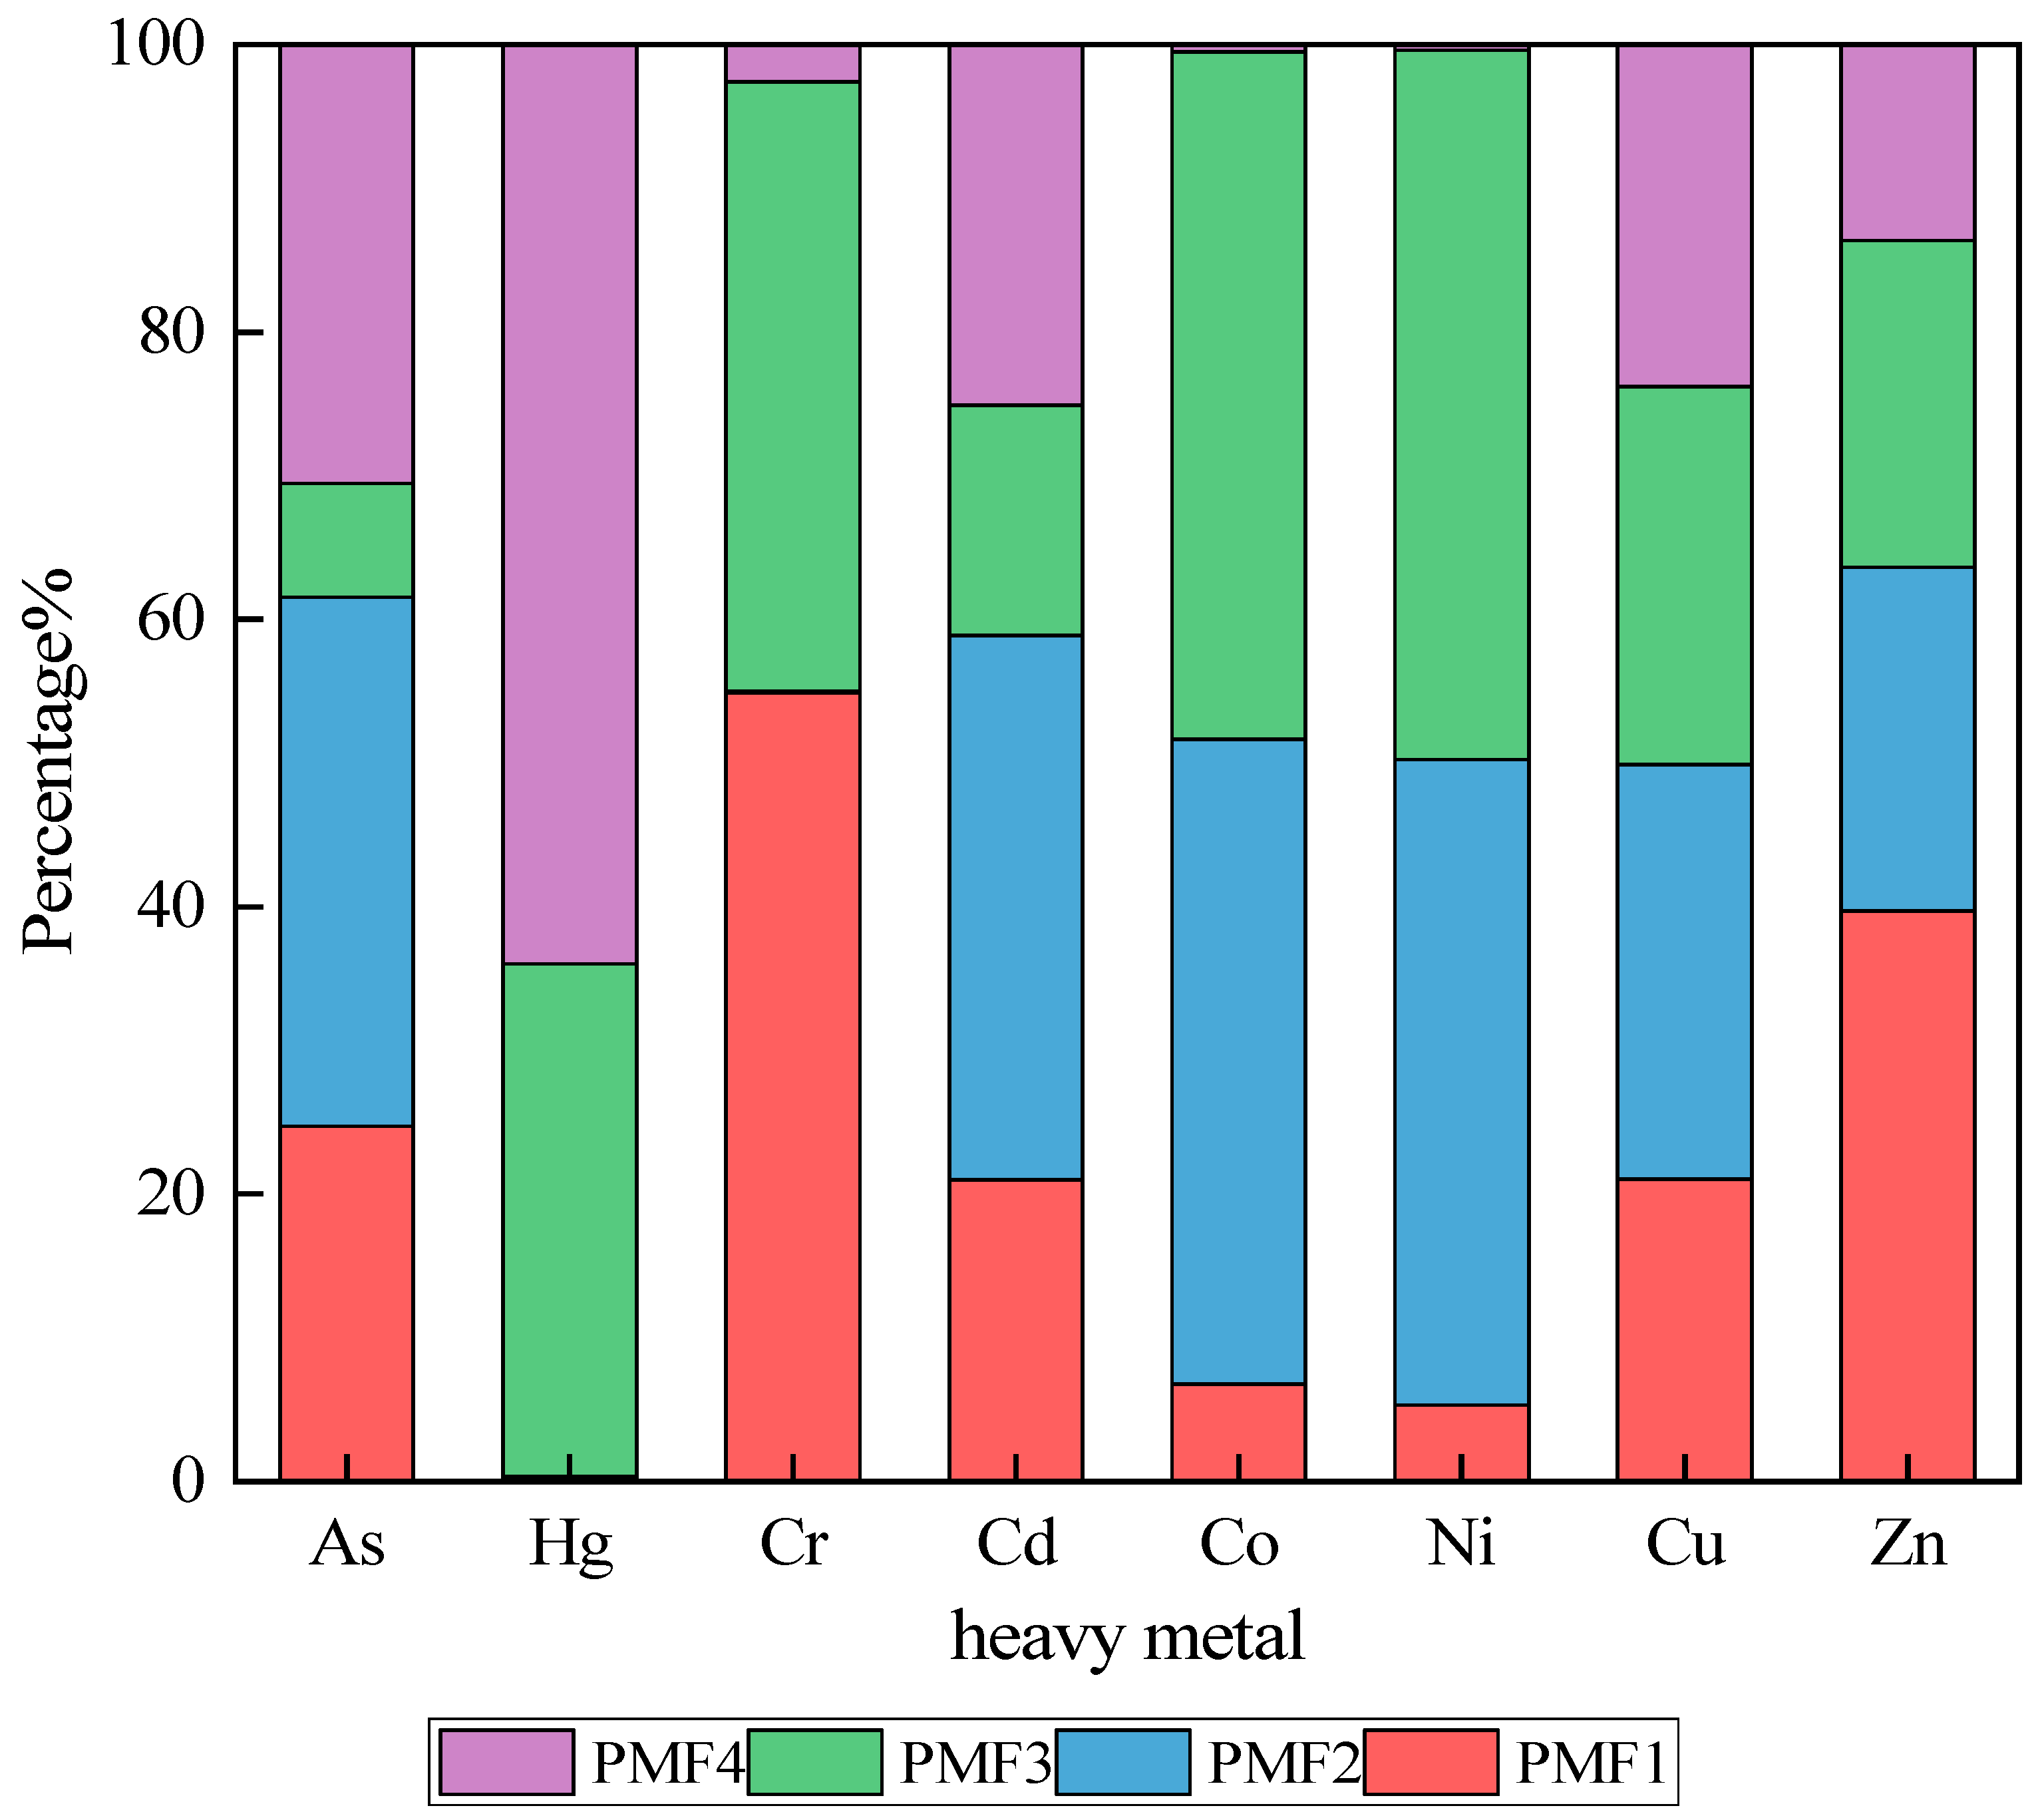
3.4. Source Apportionment of Heavy Metal Components in Groundwater

Combined with the PCA results, the PMF model was applied using EPA PMF 5.0 software to quantitatively analyze the sources of heavy metal elements in the study area. In the calculation of the uncertainty of heavy metal elements, the signal-to-noise ratios of Cd, Cu, and Zn were found to be small (S/N < 0.5). Therefore, these three heavy metals were classified as “weak”, and the remaining heavy metals were classified as “strong”. The number of factors was set to 3–6 and calculations were conducted 20 times. When the number of factors was 4, QRobust/Qtrue decreased rapidly, and the residuals of each sample were between − 3 and 3, indicating that the PCA model and the PMF model are reasonable. The fitting degree R2 of As, Cr, Co, Hg, and Ni was greater than 0.9, indicating good fitting of the source apportionment of the PMF model for As, Cr, Co, Hg, and Ni. In contrast, the fitting degree R2 of Cd, Cu, and Zn was below 0.7, indicating poor fitting for these three elements. This may be related to the large coefficient of variation among Cd, Cu, and Zn, which needs to be explained by combining the PCA and PMF models. The PMF model yielded four factors named PMF1, PMF2, PMF3, and PMF4, accounting for 21.7%, 27.2%, 31.0%, and 20.1% of the total contribution, respectively.
According to Figure 3, the weight of PMF1 is mainly attributable to Cr (54%), followed by Zn (39%). As Zn showed a strong coefficient of variation, its distribution in groundwater may be affected by humans. In the correlation analysis, no significant correlation was observed between Cr and Zn. Studies have shown that the main sources of Zn and Cu are automobile exhaust, livestock and poultry manure, and pesticides. In local farms with livestock, feed additives, pesticides, and fertilizers are frequently used. In the principal component analysis, Zn and Cu in PC3 showed strong positive loads. It can be considered that PMF1 and PC3 are attributable to agricultural sources. Considering the poor fitting of Zn and Cu in the PMF model, these two elements were excluded in other PMF factors [22,23].
The weights of As, Cd, Co, and Ni accounted for approximately 40% in PMF2. The study area includes mineral mining and smelting activities. Studies have shown that As, Cu, and Cd are mainly affected by human activities. For example, the development of metal minerals has caused serious pollution of heavy metals Cd and As in the mining area. PMF2 may be attributable to a variety of anthropogenic industrial sources, including industrial and agricultural activities and traffic emissions [24].
In PMF3, the weights of Cr, Co, and Ni contribute 42%, 48%, and 49%, respectively. A strong homology was observed between Cr and Co in soil, and the average values of Cr, Co, and Ni were lower than the background values of groundwater in Tengzhou City. In the correlation analysis, a certain correlation was found between Cr, Co, and Ni and other elements. In addition to industrial activities, Cr and Co are related to the mineral composition of the parent rock. Therefore, PMF3 can be primarily attributed to natural sources [25,26].
Hg presented high loading in PMF4. In urban areas, the main sources of soil Hg are atmospheric deposition and surface water. Chemical enterprises use oil and coal as the main fuel, resulting in the emission of Hg-containing gases. Studies have shown that Hg enrichment is mainly caused by the accumulation of microparticles released from surrounding metallurgy and coal combustion processes into the soil through atmospheric deposition. Therefore, PMF4 is considered to be attributable to industrial deposition sources [27].

4. Conclusions

Under water quality standard III, the single-factor pollution index of Ni was 1.07 at plot TS03, reflecting mild pollution, whereas the values of other heavy metal elements corresponded to the clean grade. The calculation results of the Nemerow comprehensive pollution index showed that the value reached 0.78 only at TS03, which corresponds to the pollution alert state. The Nemerow comprehensive pollution index of other plots was less than 0.7. Therefore, the groundwater in this area is in good condition and the water quality is high.
The non-carcinogenic risk values of heavy metals for adults followed the order As > Cr > Ni > Zn > Hg > Co > Cd > Cu. The non-carcinogenic risk value of As was 1.51, but the other heavy metals posed low risk. Under the oral intake pathway, the HI value for adults was 1.92. The non-carcinogenic risk values of heavy metals for children were much lower than the USEPA-recommended values, except for As (0.72) under the oral intake pathway.
As and Cr are the main contributors to carcinogenic health risks for adults and children, with oral intake as the main exposure pathway. As poses the greatest carcinogenic health risk to adults and children through both pathways. Cr poses a significant carcinogenic risk to both adults and children through drinking water, and Cd may pose carcinogenic risks to both adults and children through drinking water.
The main sources of heavy metals in shallow groundwater in Tengzhou City are agriculture, industrial activities, natural processes, and industrial deposition, with contribution rates of 21.7%, 27.2%, 31.0%, and 20.1%, respectively. Among them, natural sources contribute the most to the accumulation of heavy metals.

Author Contributions

Conceptualization, B.Y., Q.W., X.L. and X.S.; Data curation, B.Y., Q.W., X.L., X.S. and R.Z.; Formal analysis, X.S., Z.G., J.L., R.Z. and M.W.; Funding acquisition, Q.W.; Investigation, B.Y., Q.W., X.L., X.S. and Z.G.; Methodology, B.Y., Q.W. and X.S.; Project administration, Z.G.; Resources, B.Y., Q.W., X.S., Z.G. and J.L.; Software, Z.G., J.L., R.Z. and M.W.; Supervision, X.L., X.S., Z.G., J.L. and M.W.; Validation, B.Y., Q.W., X.L. and Z.G.; Visualization, Z.G., J.L. and M.W.; Writing—original draft, Q.W., Z.G. and M.W.; Writing—review and editing, B.Y., Q.W., X.S. and Z.G. All authors have read and agreed to the published version of the manuscript.

Funding

This research was supported by Bureau Research Special Project of Shandong Provincial Bureau of Coal Geological (LMDK(2022)47, LMDK(2023)10).

Data Availability Statement

Data are contained within the article.

Acknowledgments

This research was supported by Bureau Research Special Project of Shandong. We thank the editors and anonymous reviewers for their valuable suggestions regarding the manuscript.

Conflicts of Interest

The authors declare no conflict of interest.

References

  1. Ministry of Ecology and Environment of the People’s Republic of China. Report on the State of the Ecology and Environment in China 2020. Available online: https://www.mee.gov.cn/hjzl/sthjzk/zghjzkgb (accessed on 26 May 2021).
  2. Swaine, D.J. Why trace elements are important. Fuel Process. Technol. 2000, 65–66, 21–33. [Google Scholar] [CrossRef]
  3. Chowdhury, S.; Mazumder, M.J.; Al-Attas, O.; Husain, T. Heavy metals in drinking water: Occurrences, implications, and future needs in developing countries. Sci. Total Environ. 2016, 569–570, 476–488. [Google Scholar] [CrossRef]
  4. Wang, S.-L.; Xu, X.-R.; Sun, Y.-X.; Liu, J.-L.; Li, H.-B. Heavy metal pollution in coastal areas of South China: A review. Mar. Pollut. Bull. 2013, 76, 7–15. [Google Scholar] [CrossRef]
  5. Ahmed, S.; Khurshid, S.; Qureshi, F.; Hussain, A.; Bhattacharya, A. Heavy metals and geo-accumulation index development for groundwater of Mathura City, Uttar Pradesh. Desalin. Water Treat. 2019, 138, 291–300. [Google Scholar] [CrossRef]
  6. Wang, G.; Yinglan, A.; Jiang, H.; Fu, Q.; Zheng, B. Modeling the source contribution of heavy metals in surficial sediment and analysis of their historical changes in the vertical sediments of a drinking water reservoir. J. Hydrol. 2015, 520, 37–51. [Google Scholar] [CrossRef]
  7. Dwivedi, A.K.; Vankar, P.S. Source identification study of heavy metal contamination in the industrial hub of Unnao, India. Environ. Monit. Assess. 2014, 186, 3531–3539. [Google Scholar] [CrossRef] [PubMed]
  8. Deda, A.; Alushllari, M.; Mico, S. Measurement of heavy metal concentrations in groundwater. In Proceedings of the WOMEN IN PHYSICS: 6th IUPAP International Conference on Women in Physics, Birmingham, UK, 16–20 July 2017. [Google Scholar]
  9. Abdelhalim, A.; Howard, G.; Howden, N.J.K.; Ahmed, M.; Ismail, E. Carcinogenic and non-carcinogenic health risk assessment of heavy metals contamination in groundwater in the west of Minia area, Egypt. Hum. Ecol. Risk Assess. Int. J. 2023, 29, 571–596. [Google Scholar] [CrossRef]
  10. Fang, H.; Wang, X.; Xia, D.; Zhu, J.; Yu, W.; Su, Y.; Zeng, J.; Zhang, Y.; Lin, X.; Lei, Y.; et al. Improvement of Ecological Risk Considering Heavy Metal in Soil and Groundwater Surrounding Electroplating Factories. Processes 2022, 10, 1267. [Google Scholar] [CrossRef]
  11. Zhao, W.X. The Geochemical Characteristics of the Shallow Groundwater in Nansihu-Lake Basin: The Contribution of Water-Rock Interact and Anthropogenic Activities. Master’s Thesis, China University of Geosciences (Beijing), Beijing, China, 2023. [Google Scholar] [CrossRef]
  12. Ministry of Ecology and Environment of the People’s Republic of China. HJ 1019–2019 Technical Guidelines for Sampling Volatile Organic Compounds in Soil and Groundwater; Ministry of Ecology and Environment of the People’s Republic of China: Beijing, China, 2019.
  13. Ministry of Ecology and Environment of the People’s Republic of China. HJ 700–2014 Water Quality-Determination of 65 Elements-Inductively Coupled Plasma-Mass Spectrometry; Ministry of Ecology and Environment of the People’s Republic of China: Beijing, China, 2014.
  14. Ministry of Ecology and Environment of the People’s Republic of China. HJ 694–2014 Water Quality–Determination of Mercury, Arsenic, Selenium, Bismuth and Antimony–Atomic Fluorescence Spectrometry; Ministry of Ecology and Environment of the People’s Republic of China: Beijing, China, 2014.
  15. Li, M.-T.; Shen, C.; Wu, J.; Huang, S.-F.; Li, D.-Y.; Wang, M. Content and Ecological Risks of Heavy Metals in Soil with Different Land Uses in a Rapidly Urbanizing Area. Huan Jing Ke Xue 2021, 42, 4889–4896. [Google Scholar] [CrossRef] [PubMed]
  16. GB14848–2017; Standard for Groundwater Quality. Standardization Administration of the People’s Republic of China: Beijing, China, 2017.
  17. Maskooni, E.K.; Naseri-Rad, M.; Berndtsson, R.; Nakagawa, K. Use of Heavy Metal Content and Modified Water Quality Index to Assess Groundwater Quality in a Semiarid Area. Water 2020, 12, 1115. [Google Scholar] [CrossRef]
  18. Singaraja, C.; Chidambaram, S.; Srinivasamoorthy, K.; Anandhan, P.; Selvam, S. A Study on Assessment of Credible Sources of Heavy Metal Pollution Vulnerability in Groundwater of Thoothukudi Districts, Tamilnadu, India. Water Qual. Expo. Health 2015, 7, 459–467. [Google Scholar] [CrossRef]
  19. Wen, C.; Zhu, S.; Li, N.; Luo, X. Source apportionment and risk assessment of metal pollution in natural biofilms and surface water along the Lancang River, China. Sci. Total Environ. 2022, 843, 156977. [Google Scholar] [CrossRef] [PubMed]
  20. Chen, H.; Zhao, X.-Y.; Chang, S.; Song, Y.-M.; Lu, M.-Q.; Zhao, B.; Chen, H.-D.; Gao, S.; Wang, L.-J.; Cui, J.-S.; et al. Source Analysis and Health Risk Assessment of Heavy Metals in the Groundwater of Shijiazhuang, a Typical City in North China Plain. Huan Jing Ke Xue 2023, 44, 4884–4895. [Google Scholar] [CrossRef] [PubMed]
  21. Li, W.; Wang, M.-Y.; Liu, L.-Y.; Wang, H.-F.; Yu, S. Groundwater heavy metal levels and associated human health risk in the North China Plain. Arab. J. Geosci. 2015, 8, 10389–10398. [Google Scholar] [CrossRef]
  22. Belon, E.; Boisson, M.; Deportes, I.; Eglin, T.; Feix, I.; Bispo, A.; Galsomies, L.; Leblond, S.; Guellier, C. An inventory of trace elements inputs to French agricultural soils. Sci. Total Environ. 2012, 439, 87–95. [Google Scholar] [CrossRef] [PubMed]
  23. Qu, M.; Wang, Y.; Huang, B.; Zhao, Y. Source apportionment of soil heavy metals using robust absolute principal component scores-robust geographically weighted regression (RAPCS-RGWR) receptor model. Sci. Total Environ. 2018, 626, 203–210. [Google Scholar] [CrossRef] [PubMed]
  24. Sheng, D.; Wu, J.; Wen, X.; Wu, M.; Zhang, C. Contamination and ecological health risks of heavy metals in groundwater of a typical agricultural area in NW China. Geochem. Explor. Environ. Anal. 2020, 20, 440–450. [Google Scholar] [CrossRef]
  25. Nanos, N.; Martín, J.A.R. Multiscale analysis of heavy metal contents in soils: Spatial variability in the Duero river basin (Spain). Geoderma 2012, 189–190, 554–562. [Google Scholar] [CrossRef]
  26. Fei, X.; Lou, Z.; Xiao, R.; Ren, Z.; Lv, X. Contamination assessment and source apportionment of heavy metals in agricultural soil through the synthesis of PMF and GeogDetector models. Sci. Total Environ. 2020, 747, 141293. [Google Scholar] [CrossRef]
  27. Zhang, H.; Zhang, F.; Song, J.; Tan, M.L.; Kung, H.-T.; Johnson, V.C. Pollutant source, ecological and human health risks assessment of heavy metals in soils from coal mining areas in Xinjiang, China. Environ. Res. 2021, 202, 111702. [Google Scholar] [CrossRef] [PubMed]
Figure 1. Groundwater sampling sites in Tengzhou.
Water 15 04091 g001
Figure 2. Correlation coefficients between metal elements in groundwater.
Water 15 04091 g002
Figure 3. Contribution rates of heavy metal pollution sources in PMF.
Water 15 04091 g003
Table 1. Related parameters of the health risk assessment model [19,20].
ParameterReferenceUnit
AdultsChildren
R1.71.14L × d−1
EF350350d × a−1
T309a
SA16,0009300cm2
AF0.0010.001L × cm−3
BW5724kg
AT25,50025,500d
Table 2. ABS, RFD, and SF values for the health risk assessment model [19,20].
Heavy MetalsABS × 10−3/cm × d−1RFD/mg × (kg × d)−1SF/mg × (kg × d)−1
AdultsChildrenOralDerOralDer
As1.139940.750060.00030.00011.53.66
Cd0.63330.41670.00050.00056.10.36
Co0.253320.166680.020.016
Cr1.26660.83340.0030.0030.50.5
Cu0.379980.250020.040.012
Hg1.139940.750060.00030.0013
Ni0.063330.041670.020.0054
Zn0.379980.250020.30.01
Table 3. Statistical characteristics of heavy metals and conventional indicators of samples.
IndexAsHgCrCdCoNiCuZnpHTDSThCOD
Min1.16 0.005 0.67 0.005 0.51 4.43 0.14 3.20 7.64 366 269.5 0.78
Max2.13 0.056 3.61 0.167 2.54 21.36 3.13 194.5 8.38 1972 1258.5 2.82
Median1.54 0.025 1.545 0.005 1.18 9.735 0.37 10.1 8.04 770 550.15 0.92
Mean1.53 0.02 1.79 0.03 1.23 10.19 0.56 26.31 8.05 827.75 573.92 1.01
SD0.18 0.02 0.75 0.05 0.50 4.22 0.70 40.10 0.20 377.97 228.63 0.40
CV0.12 0.63 0.42 1.74 0.41 0.41 1.25 1.52 0.02 0.46 0.40 0.40
Skewness0.99 0.37 1.05 2.29 0.93 1.03 3.12 3.50 −0.22 1.80 1.61 4.26
Kurtosis4.80 −0.65 0.54 4.06 0.82 1.08 9.41 14.16 −0.73 3.41 3.04 19.59
the III criterion10 1 - 50 50 20 1000 1000 6.5–8.51000 450 3
Table 4. Results of the Nemerow comprehensive pollution index.
NumberSingle-Factor Pollution IndexNemerow Comprehensive Pollution
Index
AsHgCrCdCoNiCuZn
TS010.120.0050.0270.0030.0200.422.8 × 10−40.0250.31
TS020.160.0050.0260.0010.0240.481.4 × 10−40.0060.35
TS030.120.0230.0530.0330.0511.074.4 × 10−40.0240.78
TS040.130.0170.0410.0060.0100.234.9 × 10−40.0040.17
TS050.160.0130.0450.0330.0270.533.4 × 10−40.0050.39
TS060.160.0310.0720.0010.0190.342.1 × 10−40.0150.25
TS070.170.0340.0300.0250.0400.472.4 × 10−30.0490.35
TS080.160.0560.0370.0010.0170.372.5 × 10−40.0090.27
TS090.140.0430.0260.0010.0280.621.8 × 10−40.1950.46
TS100.150.0100.0250.0030.0200.473.1 × 10−30.0590.34
TS110.150.0050.0370.0010.0250.502.3 × 10−40.0180.37
TS120.160.0210.0270.0010.0140.292.1 × 10−40.0090.21
TS130.160.0290.0340.0010.0270.733.0 × 10−40.0140.53
TS140.150.0210.0130.0010.0160.323.4 × 10−40.0100.24
TS150.150.0300.0230.0010.0230.532.7 × 10−40.0070.39
TS160.150.0050.0240.0010.0220.501.8 × 10−40.0060.37
TS170.150.0300.0660.0020.0400.854.4 × 10−40.0100.62
TS180.150.0530.0310.0020.0280.584.5 × 10−40.0050.42
TS190.160.0370.0310.0010.0290.605.4 × 10−40.0030.44
TS200.170.0460.0350.0030.0130.285.9 × 10−40.0610.21
TS210.210.0320.0490.0010.0250.516.3 × 10−40.0400.38
TS220.140.0270.0590.0010.0410.916.0 × 10−40.0440.66
TS230.150.0140.0230.0010.0120.224.0 × 10−40.0100.16
TS240.160.0050.0210.0110.0220.424.7 × 10−40.0050.31
Table 5. HI and CR of heavy metals in groundwater of Tengzhou.
IndexHMAdultsChildren
OralDermalTotalOralDermalTotal
Non-carcinogenic RiskAs1.514.85 × 10−21.560.721.32 × 10−20.73
Cd1.67 × 10−29.97 × 10−51.68 × 10−27.99 × 10−32.72 × 10−58.02 × 10⁻³
Co1.82 × 10−25.42 × 10−51.82 × 10−28.68 × 10−31.48 × 10−58.70 × 10⁻³
Cr0.182.09 × 10−30.188.38 × 10−25.70 × 10−48.44 × 10−2
Cu4.14 × 10−34.94 × 10−54.19 × 10−31.98 × 10−31.35 × 10−51.99 × 10⁻³
Hg2.42 × 10−26.00 × 10−52.43 × 10−21.16 × 10−21.63 × 10−51.16 × 10⁻²
Ni0.153.31 × 10−40.157.17 × 10−29.03 × 10−57.18 × 10−2
Zn2.59 × 10−22.77 × 10−32.86 × 10−21.24 × 10−27.56 × 10−41.31 × 10⁻²
HI1.925.40 × 10−21.980.921.47 × 10−20.93
Carcinogenic RiskAs6.78 × 10−41.78 × 10−56.96 × 10−43.24 × 10−44.84 × 10−63.29 × 10⁻⁴
Cd5.1 × 10−51.79 × 10−85.10 × 10−52.44 × 10−54.89 × 10−92.44 × 10⁻⁵
Cr2.63 × 10−43.14 × 10−62.66 × 10−41.26 × 10−48.55 × 10−71.27 × 10⁻⁴
CR9.93 × 10−42.09 × 10−51.01 × 10−34.74 × 10−45.70 × 10−64.80 × 10⁻⁴
Table 6. Composition matrix table of principal component analysis.
HMPC1PC2PC3PC4
As−0.0820.396−0.0060.618
Hg0.0720.585−0.082−0.055
Cr0.2330.142−0.3780.195
Cd0.224−0.2490.2140.348
Co0.376−0.0160.0390.024
Ni0.359−0.019−0.089−0.158
Cu0.0530.0370.6440.289
Zn0.0720.3320.402−0.504
Disclaimer/Publisher’s Note: The statements, opinions and data contained in all publications are solely those of the individual author(s) and contributor(s) and not of MDPI and/or the editor(s). MDPI and/or the editor(s) disclaim responsibility for any injury to people or property resulting from any ideas, methods, instructions or products referred to in the content.

