Abstract
This work presents a case study accompanied by an analysis of potential reasons for fish mortality in the lower Oder River during an ecological disaster in August 2022. Changes in physicochemical water quality indicators indicate that fish and benthic organism death was likely due to the creation of hypoxia. The research also highlighted the trophic threats to the studied Oder River section linked to the disaster. The disaster occurred in the upper and middle Oder River, extending to the lower stretch. A physicochemical analysis of water samples revealed that the fish and organism death in the estuarine section was mainly due to reduced dissolved oxygen, caused by the decomposition of organic matter from the upper river sections. This was reinforced by high temperatures and low water levels. The negative trophic consequences of the described ecological disaster for the lower section of the Oder River may be long-term. Over thirty years of monitoring showed threats of excess biogenic compounds, organic matter, and bacterial contamination. Despite decreasing nitrogen and phosphorus, significant phytoplankton blooms implied internal nutrient sources. Considering climate change and the poor trophic status, recurrent disasters and deteriorating conditions are anticipated. Mitigation requires continuous monitoring, limiting the nutrient input (especially phosphorus), and preparing for extreme events. Geotechnical methods in the lower river can improve oxygen levels and fish survival.
1. Introduction
The river is not a separate ecosystem; in terms of both energy and the circulation of matter, it depends on the river basin from which it receives organic matter [1]. An important function of the basin is buffering disturbances in the functioning of a relatively large section of the watercourse. Therefore, the effects of these disturbances are usually observed only at a local scale. There are cases in which the buffer capacity of the ecosystem is exceeded. In such cases, changes in the functioning of both the upper and middle sections of the watercourse may affect its lower part [2]. In contrast to the aforementioned sections, the lower part of the river is characterized by much slower water movement, the predominance of accumulation over erosion, richer plankton, and a fine sandy and muddy substrate [3]. Additionally, it exhibits a longer water residence time [4,5], along with a greater accumulation of pollutants [4,6]. This matter is not circulated but transported downstream. Compounds released during its decomposition can be utilized by producers in the further course of the river. Furthermore, the process of regenerating inorganic compounds within the watercourse itself does not significantly contribute to them compared to the amount of inorganic substances transported from the river basin. It is assumed that disturbances in the functioning of a relatively large section of the watercourse are typically buffered by the river basin. The effects of these disturbances are usually observed only at a local scale. There are instances where the ecosystem’s buffering capacity is exceeded, and these disturbance factors negatively impact the rest of the watercourse [4,5].
These changes most often lead to pronounced eutrophication in the lower part of the river. This contributes to the side effects of eutrophication, including reduced dissolved oxygen levels leading to oxygen deficits and the promotion of the growth of harmful algae such as cyanobacteria [4,6,7,8]. Such phenomena are inherent in aquatic ecosystems, with eutrophication primarily associated with lakes. Riverine hypoxia and the resulting impacts on ecosystems may be more pervasive than previously assumed [9]. Conversely, accelerated eutrophication and frequent anoxia in rivers, estuaries, and coastal zones are commonly tied to anthropogenic activities causing excessive nutrient and organic matter loads in the environment [7,10].
The significant impact of changes in the river’s upper course on its lower segment leads to ecological disasters. Instances of such disasters have been documented in various river systems, including the Thurne, Brazos, Pecos, Colorado, Rio Grande, Dunkard Creek, Missouri, and Canadian Rivers [11,12,13,14,15,16,17,18,19].
A specific example of such an impact occurred in the Oder River during the summer of 2022 [20,21]. As the Oder River should be regarded as a continuum, similar to any other river, this means that a specific factor’s appearance in its upper course could result in a cumulative response downstream. The amount of dead fish observed alongside the river was tremendously high, increasing with each km of the river flow. The direct cause of fish mortality in the upper and middle sections of the Oder River was likely toxins, specifically excretions produced by Prymnesium parvum [20,21]. Southard et al. [16] identified Prymnesium parvum in the Pecos River in Texas during a fish killing investigation. Acosta et al. [22] found that Prymnesium parvum, despite being of marine origin, has successfully invaded and established itself in freshwater ecosystems in the United States. The study reports that Prymnesium parvum is currently present in inland systems in up to 20 states. This suggests that Prymnesium parvum has the ability to adapt and thrive in river environments [11,12,13,14,15,16,17,18,19,22]. According to Brooks et al. [8], Prymnesium parvum blooms can span over 80 km2 across entire lakes and propagate hundreds of kilometers downriver. The presence of Prymnesium parvum in rivers is of ecological importance, as highlighted by Jones et al. [23]. This globally distributed prymnesiophyte alga plays a significant role in aquatic ecosystems. Understanding the factors influencing the occurrence and abundance of Prymnesium parvum in rivers is also a topic of research. Vanlandeghem et al. [24] investigated the associations between water physicochemistry and the presence, abundance, and toxicity of Prymnesium parvum in West Texas reservoirs, indicating that nutrient conditions play a role in its occurrence. Also, Hambright et al. [25] suggest that the apparent range expansion of Prymnesium parvum in North America is driven by increasing availability of salty and nutrient-rich systems. The presence of Prymnesium parvum in rivers has been associated with changes in microbial communities. Acosta et al. [22] observed increased abundances of fungi and ciliates and decreased abundances of diatoms and cercozoans in successfully invaded microbial communities. These changes in the microbial community composition may create favorable conditions for Prymnesium parvum growth and establishment.
This work presents a case study along with an analysis of potential causes of fish mortality. During the disaster, research was conducted on changes in selected general physicochemical water quality indicators in the lower part of the Oder River. Based on these simple and quick tests of general water pollution indicators, attempts were made to demonstrate the differences in oxygen conditions occurring in the lower section of the river compared to its middle section.
These indicators suggest that the death of fish and benthic organisms was most likely caused by the formation of oxygen-depleted zones throughout the watercourse profile, characterized by minimal dissolved oxygen levels—a condition known as hypoxia. The novelty of the study lies in demonstrating trophic threats occurring in the lower section of the Oder River in connection with the described disaster and showing that oxygen depletion can play a significant role in determining the scale of the catastrophe. Furthermore, solutions aimed at mitigating negative effects in the future are proposed.
2. Materials and Methods
2.1. Description of the Oder River Disaster
The Oder River, the second-longest and a flowing watercourse in Poland, spans 840 km. Its watershed area of 119,092 km2 stretches across three countries: Poland, Germany, and the Czech Republic. An ecological disaster unfolded along the river’s entire length during July and August of 2022 [20]. The observation of deceased fish commenced on 14 July 2023. Initially sporadic, these occurrences grew in frequency, ultimately totaling over 249 tons of dead fish along the entire length of the Oder River. In the lower reaches of the river, specifically within the Zachodniopomorskie Voivodship, the first instances of fish mortality were observed nearly four weeks later, on 11 August 2022 [20]. By 30 August 2022, the mass of fish collected here accounted for nearly three-fourths (67.87%) of the total mass of fish mortality (Figure 1). This figure remains incomplete, as not all of the deceased fish were captured by dams and landing nets, with some sinking to the riverbed. The scale of this catastrophe was staggeringly extensive [21]. This disaster had profoundly negative repercussions on the biological life quality within the Oder. Prior to the 2022 summer disaster, the free-flowing river segment harbored one of Poland’s highest concentrations of protected fish species (e.g., rose and common goat). Besides fish, mollusks and crustaceans, the second group of organisms, faced near extinction across the river’s entire course [21]. Intensive actions and research undertaken on an unprecedented scale, driven by media pressure, public opinion, and the neighboring countries, contributed to identifying the cause behind this phenomenon and initiating systematic, in-depth research.
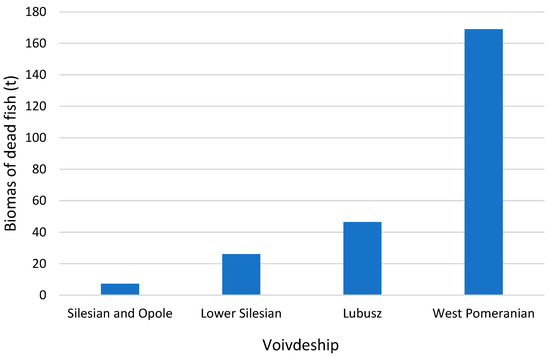
Figure 1.
The number of dead fish [t] observed in the Voivdeships Silesian, Opole, Lower Silesian, Lubuskie, and Zachodniopomorskie during the Oder River disaster in 2022. Self-prepared based on [20]. Location of voivodeships is presented in Figure 2.
The scientists discovered that the main reason for biota death in the Oder River was Prymensium parvum N Carter, which is a unicellular flagellated algae from the Haptophyta class.
Wagstaff et al. [26] report that the first blooms associated with P. parvum were reported in 1920. A detailed description of P. parvum based on evidence from a brackish pond at Bembridge, Isle of Wight, was published by Carter in 1937 [27]. This phytoflagellate has been implicated in fish killings around the world since the 1930’s [28].
Prymensium parvum is a mixotrophic organism, i.e., it employs several feeding strategies. It can behave like a producer—it feeds autotrophically (photosynthesis)—or a consumer—heterotrophically (dead organic matter). This alga is known for the production of toxins, the so-called ichthyotoxins, which are neurotoxic to gillfish [29,30].
According to the systematic classification [31], the taxonomic affiliation of this alga includes the following:
- Empire: Eukaryote
- Kingdom: Chromist
- Sub-kingdom: Hacrobia
- Phylum: Haptophyta
- Class: Coccolithophyceae
- Subclass: Prymnesiophycidae
- Order: Prymnesiales
- Family: Prymnesiaceae
- Genus: Primnesium
- Species: Prymnesium parvum
Many authors indicate that different strains of P. parvum have different requirements for environmental factors like water temperature, water pH, salinity, nutrient availability, and some elements [24,25,32,33].
Moreover, this alga characterizes a strong adaptability; it can live in a very wide range of salinity (1–35 PSU), temperature (2–32 °C), and other physicochemical parameters [24,34,35].
The ichthyotoxic effect of the haptophyte Prymnesium parvum, manifested, among others, by massive fish (and invertebrate) mortality, is attributed to prymnesins. These are compounds from the polyketide group, with a structure of polycyclic ethers. Studies of Prymnesium parvum strains originating from different geographical regions have shown the existence of at least three types of prymnesin compounds: A, B, and C. These compounds differ in their structural modifications such as the substitution of sugar residues or chlorine atoms, which influence the toxicity of these compounds. According to Binzer et al. [36], the group of B prymnesins has been observed so far in countries located in areas with a similar geographic longitude to Poland.
Toxicity of Prymnesium parvum in relation to ichthyofauna was most often observed at the number of this class at the level above 50–100 million cells/L, when mass fish kills were not carried out [37].
However, the high cell densities are not always an indicator of ichthyotoxicity, because P. parvum has both non-toxic and toxic strains, and as well as that, its toxins can be lethal in nanomolar concentrations, even when the cell density is low [36,38].
It is difficult to define unambiguously the environmental conditions conducive to the blooming of this algae and the production of toxins by it. Factors such as water temperature and salinity can help to predict future blooms. Brooks et al. [7,8] emphasize the role of high pH in both marine and inland waters. However, the most important factor in the toxicity of P. parvum blooms appears to be the relative amount of nitrogen and phosphorus in the water, with the toxicity increasing when both of these nutrients are limited. The presence of algal viruses has been suggested to play a role in the toxicity of P. parvum blooms by Wagstaff et al. [26]. Freitag et al. [39] have studied the effects of physiological shock treatments and different nutrient conditions to understand their impact on P. parvum toxicity. P. parvum blooms and associated fish kills in the south-central parts of the United States almost always occurred during the cooler winter and spring months, but this is not always the case as fish kills can also take place in the summer months, as was the case in Texas state and Poland. In 2022, the average annual total precipitation in Poland amounted to 534.4 mm, which is 87% of the normal determined based on measurements from 1991 to 2020. When ranked based on the area-averaged total precipitation since 1951, 2022 was only 59th [40,41]. In the year 2022, evaporation significantly outweighed precipitation, resulting in a considerable moisture loss from the active surface by the end of June [20]. The hydrological deficit of the area adjacent to the Oder River from its upper course exceeded 200 mm. July was thermally average, yet in the Oder River basin, air temperatures were among the highest, both in terms of daily averages and daily maxima. The rainfall in July within the Oder basin was distinctly below the norm. August was an extremely warm month with an average temperature of 20.5 °C in Poland. In 2022, we experienced more frequent and prolonged heatwaves than cold waves, with notable heatwaves in June and August. The year saw more frequent and prolonged episodes of heat waves, during which daily mean air temperatures exceeded the 95% quantile value, compared to cold waves, where temperatures dipped below the 5% quantile value. The Oder River basin was among the warmest regions in Poland, with extreme temperatures reaching up to 36.5 °C. August 2022 was the hottest month, with an average air temperature of 20.5 °C and a 2.1 °C anomaly compared to the normal [40,41]. From 1 June to 20 August 2022, water levels of the Oder River generally remained in the low-water zone or near the lower boundary of the average levels. A downward water level trend was observed, typically following a balanced course [20].
Two fish and mollusk killing events were observed in the Zachodniopomorskie Voivodeship. The first one was on 11–16 August, when the dead fish flowed in masses from the upper reaches of the river from the borders of the province to the bridge on the Regalica River [20,21]. The second episode, occurring mainly below Gryfino and also included the canals of Międzyodrze, took place later and resulted from the occurrence of the so-called suffocation and lack of oxygen in the water. Although the primary cause of fish mortality in the Oder’s upper and middle sections was likely toxins, specifically primnesins produced by Prymensium parvum, the deaths of fish initially, followed by mollusks and crustaceans in the lower section, were due to the formation of anoxic zones throughout the watercourse’s profile or with minimal dissolved oxygen, termed hypoxia [20,21]. This conclusion is supported by an analysis of changes in fundamental physicochemical indicators at designated measurement points within the Oder’s lower section, classified as a large lowland river in abiotic terms [42].
2.2. Characteristics of Measurement Points
The initial point represents the river’s boundary between its middle and lower sections, situated above the Warta’s mouth at the Kostrzyn level (52.575278, 14.637778) (Point O1) (Figure 2). The subsequent two points fall within the section from Warta to Western Oder; one is located below Krajnik Dolny at the Ognica level (N 53.08196, E 14.36791) (Point O2). Waters laden with pollutants from nearly the entire Oder basin converge at this point. Furthermore, this point is less susceptible to Baltic Sea water level fluctuations (known as backwater) compared to locations like Widuchowa and Szczecin [43]. Another measurement point, at km 701.8 in the village of Widuchowa (Point O3), has been equipped with an automated probe since June 2023, continuously monitoring the river for 24 h. Test results are routinely published on the portals https://www.gov.pl/web/odra/badania-odry (accessed on 25 October 2023) [44], and https://pomiary.gios.gov.pl/ (accessed on 25 October 2023) [45].

Figure 2.
The location of sampling points.
Below this point, the Oder divides into two streams. The first, known as the East Oder (Regalica), flows through Gryfino and the right-bank districts of Szczecin, eventually reaching Lake Dąbie. In this section, tests were conducted at two measurement points: 729 km, near the village of Radziszewo (OE1), and 737.6 km, at the level of the city of Szczecin (OE2). The second stream forms the West Oder, emptying into Roztoka Odrzańska. It flows as a border river with Germany, passing through Szczecin’s left-bank districts. In this section, tests were carried out at 14.6 km, near Mescherin (OW1), and 41.9 km, at the level of the city of Szczecin (OW2). In the vicinity of Szczecin, specifically in Międzyodrze, the Oder forms a complex hydrological system encompassing a network of numerous larger and smaller canals.
2.3. Physicochemical Analyses of Water
This study was conducted based on data provided by the Inspectorate for Environmental Protection [44] collected as part of intervention activities related to the disaster in the Oder River in August 2022 and follow-up examinations conducted in the summer of 2023. The research was carried out by an accredited laboratory of the Provincial Inspectorate of Environmental Protection in Szczecin (accreditation certificate No. AB 177 of 5 February 2021, accreditation cycle from 29 June 2021 to 15 July 2025), where the methods of sampling, performing field measurements, and water bubble methods meet the requirements of the international standard ISO/IEC 17025:2017 (general requirements for the competence, impartiality, and consistent operation of laboratories). Samples were taken half a meter below the water surface in accordance with the PN-EN ISO 5667-6:2016-12 standard. The study examined the results of the following parameters: dissolved oxygen (DO) concentration in the range of 0.5–20 mg/L O2 using the electrochemical method in accordance with the PN-EN ISO 5814:2013-04 standard, water temperature, pH in the range of 2.0–12.0 using the potentiometric method in accordance with the PN-EN ISO 10523:2012 standard, and specific conductivity in the range of 10.0–13,000 μS/cm using the conductometric method in accordance with the PN-EN 27888:1999 standard. These parameters were tested in situ, during the disaster (between 10 August and 3 September 2022) daily at the all measurement points and after the disaster (in the summer season of 2023) once a week at selected measurement points (O1, O3, OE1, OW2).
2.4. Statistical Analysis
For statistical calculations, the null hypothesis was adopted that the values of the tested water parameters at individual measurement points and in individual years of the study did not differ significantly. One-way analysis of variance (ANOVA) was carried out to determine statistically significant differences between means. The normality of data distribution was checked using the Shapiro–Wilk test; the non-normal distribution of data in most sets of the variables made us use the non-parametric analysis. The significance of differences were tested using the Kruskal–Wallis test and by a repeated comparison of mean ranks for all samples. Additionally, the significance of correlations between the tested water quality indicators at individual measurement points during the disaster period was assessed using Spearman’s rank correlation. The calculations were carried out at the level of significance of p < 0.0500 using the Statistica 13.3, StatSoft.
3. Results
3.1. Changes in Physicochemical Indicators of Water Quality during the Oder Disaster
Studies focusing on the water quality of the lower segment of the Oder River reveal that the dissolved oxygen concentration within the analyzed period of the ecological disaster consistently maintained a lower level compared to the river’s middle section (point O1). In most instances, it fell below the threshold value for a ‘good’ status, which, in the context of large lowland rivers, stands at 7.5 mgO2/L as per regulations [Figure 3].
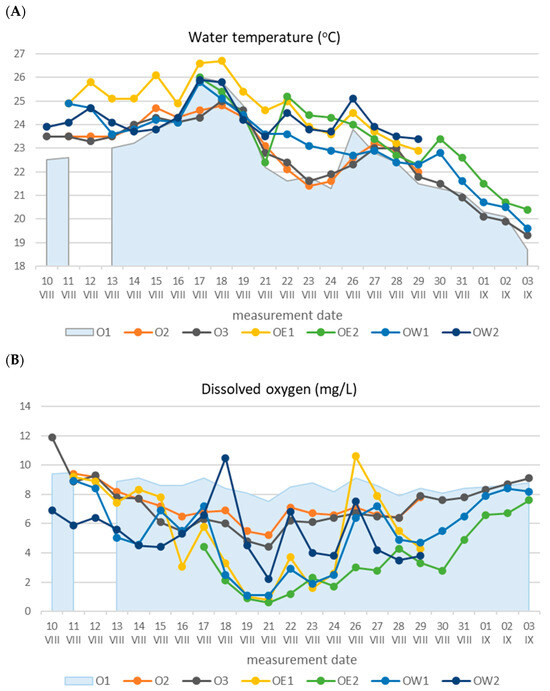
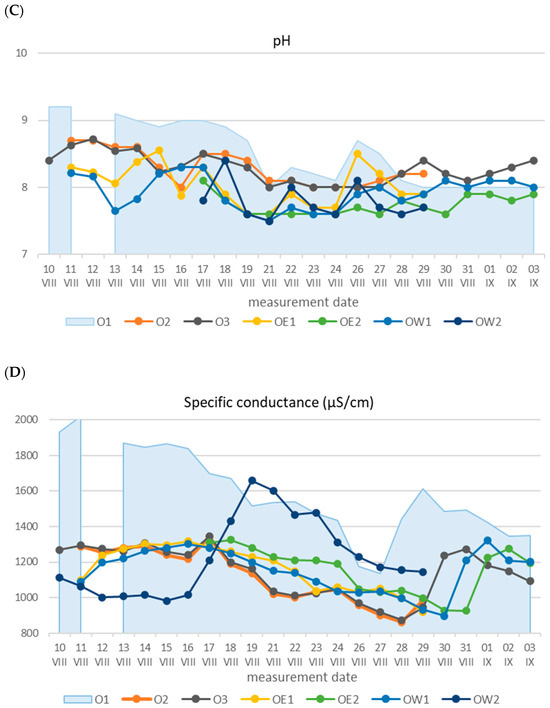
Figure 3.
Basic physicochemical indicators of the waters in the lower Oder River section during the ecological disaster from 10 August to 3 September: (A)—water temperature; (B)—dissolved oxygen; (C)—pH; (D)—specific conductance. Self-prepared based on the results of the emergency monitoring by the Chief Inspectorate of Environmental Protection [44].
In the East Oder, specifically, point OE2 recorded the lowest dissolved oxygen concentration of 3.5 ± 2.1 mg/L (Table 1). Notably, the minimum oxygen concentration of 0.6 mg/L was observed on 21 August. Following this point, the mortality of fish, mollusks, and crustaceans occurred subsequent to the removal of part of the carcasses that had formed in the river’s upper and middle sections, near the Krajnik location.

Table 1.
Descriptive statistics characterizing the distribution of the analyzed physicochemical indicators of the waters during disaster. Self-prepared based on the results of the emergency monitoring by the Chief Inspectorate of Environmental Protection [44].
In the remaining points of both the East and West Oder, the average oxygen concentrations proved comparable, measuring 5.4 mg/L. A notable trend across all points was the swift decrease in oxygen concentration from 17 August to 21 August, followed by a gradual rise extending to 3 September. On this date, the oxygen concentration in the Wschodnia Odra surpassed the ‘good’ status limit, reaching 7.6 mg/L. In stark contrast, the upper middle section of the river exhibited vastly different oxygen conditions during this timeframe, with oxygen levels consistently exceeding 7.5 mg/L [26]. In the summer of 2023, a year after the disaster, the concentration of dissolved oxygen was not lower than 4.6 mgO2/L in any of the examined points of the lower Oder River section, and the average concentration ranged from 6.6 mgO2/L at point OE1 to 9.9 mgO2/L at point O3 (Table 2).
Table 2.
Descriptive statistics characterizing the distribution of the analyzed physicochemical indicators of the waters one year after the disaster. Self-prepared based on the results of the emergency monitoring by the Chief Inspectorate of Environmental Protection [44].
During the disaster, the amount of dissolved oxygen in the branches of the Oder River (OE1, OE2, OW1, OW2) was significantly lower compared to points in its upper part (Table 3). In the summer season, in the year following the disaster, the amount of dissolved oxygen was significantly higher at each of the tested measurement points in the lower section of the Oder.
Table 3.
Median of water physicochemical indicators of the waters in the lower Oder River section in August 2022 and 2023.
Anoxia in the lower section of the Oder River was most likely induced by the decomposition of deceased biomass, which had flowed downstream from the upper and middle segments of the river, resulting in the depletion of oxygen resources. Another factor contributing to these adverse oxygen conditions was the exceptionally high water temperature. Similar to the case of dissolved oxygen, the least favorable thermal conditions were observed in the East and West Oder [Figure 3]. The highest mean and maximum water temperatures were recorded at point OE1, reaching 24.8 °C and 26.7 °C, respectively, indicating an average increase of 2 °C in comparison to the river’s middle section. Since gas solubility decreases with rising water temperatures, this factor unfavorably impacted the dissolution of atmospheric oxygen. Additionally, high temperatures resulted in an increase in the DO consumption coefficient.
3.2. Relationships between Physicochemical Indicators during the Disaster and in the Next Summer Season after It
The influence of temperature on the dissolved oxygen content is confirmed by significant negative correlations between the dissolved oxygen concentration and water temperature observed in certain river sections. A notable correlation was computed for the water sampled at the point where the Oder splits into two branches (O3) (Figure 4). Two relationships were derived, one for data collected from August 10 to 16 and another for the period spanning 17 August to 3 September, during which contaminated water containing deceased organic matter reached this point. A comparison of the slopes of these relationships indicates a substantially higher impact of water temperature on the dissolved oxygen content in the first period compared to the second, implying that dissolved oxygen was likely consumed during the breakdown of organic matter in the water.

Figure 4.
Relationships between the concentration of dissolved oxygen and the water temperature at point O3 calculated for the period before (from 10 August to 16 August) and after (from 17 August to 31 September) reaching this point by contaminated water containing dead organic matter. Self-prepared based on the results of the emergency monitoring by the Chief Inspectorate of Environmental Protection [44].
Another significant correlation was found at point OE2 (r = −0.58), characterized by the highest hypoxia (Table 3). No significant relationships were observed at the remaining measurement points, with the exception of findings in the West Oder at point OW2, where a positive strong relationship between the dissolved oxygen quantity and water temperature was calculated (r = 0.86). This point lies just before the Oder enters the Szczecin Lagoon, and its waters were likely better oxygenated due to inflow from this basin. This assertion is substantiated by salinity measurements, averaging 1225 µS/cm at this point, approximately 70 units higher than the other lower Oder section point, and the maximum salinity value of 1659 µS/cm was more than 300 units greater [Table 1].
The distinctiveness of the processes that occurred in the Eastern and Western Oder, in comparison to the section of the river above its bifurcation, was also reflected in the lower water pH. The waters of the lower Oder were characterized by stabilized pH values, with minor fluctuations ranging from 8 to 8.7 at points O2 and O3, from 7.6 to 8.5 in the Eastern Oder, and from 7.5 to 8.4 in the Western Oder [Table 1]. For all measuring points, significant dependencies between DO and pH were calculated [Table 4]. The Spearman correlations indicate that in points where the Oder flows in one trough, this relationship was moderate; r was in the range of 0 d 0.45 to 0.65. In the Eastern and Western Oder, this relationship between DO and pH was strong; r was in the range from 0.77 to 0.92. In addition, on this section of the river, unlike the points O1, O2, and O3, no significant relationships between the general mineral pollution indicators of water, which are conductivity and pH, were found.
Table 4.
Spearman’s correlation between the water parameters at the tested measuring points. Only significant correlations presented: p < 0.05. Self-prepared based on the results of the emergency monitoring by the Chief Inspectorate of Environmental Protection [44]. The number n of measurements on the basis of which the correlation was calculated was equal to n given in Table 1 and Table 2.
4. Discussion
4.1. The Impact of Hypoxia on Basic Water Quality Indicators
Low oxygen concentrations and significant positive correlations between dissolved oxygen levels and pH in the Eastern and Western Oder suggest that processes of organic matter decomposition occurred in these river sections, resulting in the release of carbon dioxide, organic acids, and polyphenols, leading to a reduced water pH [46,47]. Such correlations were not observed in measurement points located above the Oder bifurcation. The intensive decomposition of organic matter in the lower Oder section is also confirmed by several times higher concentrations of ammonium nitrogen in the Oder branches in comparison to the upper part of the examined section [26,48]. Ammonium nitrogen could also have contributed to the mortality of organisms. Research on patterns of fish mortality and associated physicochemical factors in a wetland canal along the lower Missouri River has shown that the mean dawn dissolved oxygen levels were lower and the mean un-ionized ammonia and turbidity levels were higher during the fish kill event than before or after, or compared to a nearby wetland canal where no fish kills occurred [17]. Fish excrete ammonia during feeding through diffusion; if the concentration of ammonia in water is higher, it prevents its removal from the organism. Mass mineralization of organic matter (OM) is the primary driver of CO2 generation in bottom waters [49].
Hypoxia is a highly negative phenomenon as it disrupts the biochemical processes in water and reduces the biodiversity, potentially leading to lethal and sub-lethal impacts on aquatic fauna and flora [50,51]. According to the definition provided by the American Ecological Society on the United States Geological Survey website [52], hypoxia in aquatic ecosystems denotes low oxygen concentrations, i.e., less than 2–3 mg per liter of water (mg/L). Some studies suggest that hypoxia is a condition occurring when dissolved oxygen (DO) falls below the 2 mg/L level required to sustain most animal life [9,53]. Other literature sources define hypoxia at oxygen concentrations even twice as high, around 4–6 mg/L [54]. Based on a literature review, in most experiments, hypoxia is considered to occur at oxygen concentrations up to 70% of saturation, while normoxia and hyperoxia are at 100% and above, respectively. Mild hyperoxia is defined at oxygen concentrations of 130–189% (11–19.5 mg/L at 10–28 °C), while severe hyperoxia is defined at 350–590% saturation [54,55,56,57]. A complete oxygen absence is termed anoxia.
The study of water quality in the lower Oder section indicates that the dissolved oxygen concentration throughout the analyzed period of the ecological disaster remained at a lower level compared to the middle Oder section (point O1). In most cases, it was below the threshold value for good conditions, which for large lowland rivers is 7.5 mgO2/L (regulation). The lowest values were recorded in the Eastern Oder at point OE2, with an average oxygen concentration of 3.5 ± 2.1 mg/L (Table 1). The lowest oxygen concentration was observed on 21 August, at 0.6 mg/L. Fish, mollusks, and crustaceans were observed to die after the removal of some of the carcasses that had formed in the upper and middle sections of the river near Krajnik. In other points of the Eastern and Western Oder, average oxygen concentrations were comparable and amounted to 5.4 mg/L. A rapid decrease in the oxygen concentration occurred at all points from 17 August to 21 August, followed by a slow increase until 3 September, when the oxygen concentration in the Eastern Oder exceeded the good condition limit, reaching 7.6 mg/L. In contrast, the upper-middle section of the river during this period maintained oxygen levels above 7.5 mg/L [26].
4.2. Hypoxia and Trophic Threats in Waters
4.2.1. Role of Hypoxia in Phosphorus and Nitrogen Content in Water and Sediments
A frequently observed manifestation within eutrophic aquatic environments is the occurrence of chronic hypoxia, a consequence of autochthonous processes transpiring within the aquatic milieu. Hypoxia, as a process, serves to expedite the progression of ecosystem eutrophication. Under conditions devoid of molecular oxygen, a considerable liberation of elements amassed in bottom sediment transpiration, including the biogenic compounds integral to this process—namely, phosphorus and nitrogen. Laboratory investigations delving into the influence of dissolved oxygen on nutrient concentrations at the sediment–water interface have divulged that concentrations of phosphorus (including total phosphorus, dissolved reactive phosphorus, and soluble reactive phosphorus) and nitrogen (total nitrogen) in an anoxic setting are approximately twofold those encountered in their aerobic counterparts, and the N-NH4+ concentration increased by up to 12 times [58]. Furthermore, in riverine ecosystems, phosphorus emerges as the predominant limiting factor governing the proliferation of algal blooms.
In river ecosystems, phosphorus is usually the main factor limiting algal blooms [59]. Observed studies pertaining to the total nitrogen (TN) and total phosphorus (TP) content within Chinese rivers reveal that, according to four distinct criteria based on the nitrogen-to–phosphorus (N:P) ratio, a substantial 70.8% of sampling sites are ascribed to phosphorus limitation, significantly surpassing the instances of nitrogen constraint (4.1%), as dictated by N:P stoichiometry [60].
Notably, the sediment deposits of the lower reaches of rivers accumulate an array of diverse pollutants alongside phosphorus compounds [3]. In riverine environments, akin to their lacustrine counterparts, with the elevation of water and sediment temperatures under reducing conditions, the proportional contribution of internally sourced phosphorus discharge from sediments may be augmented. Substantiated by examinations conducted upon the western basin of Lake Erie, nourished by the extrinsic phosphorus loading from the primary tributary, the Maumee River, it becomes apparent that under anoxic circumstances, the flux of phosphorus exhibits augmentation concomitant with a temperature rise. Specifically, in the scenario of four days of oxygen depletion at a temperature of 30 °C, bottom sediment deposits contribute approximately 415 metric tons of dissolved phosphorus—an approximation corresponding to the vernal phosphorus loading from the Maumee River [61].
In contradistinction to nitrogen, phosphorus solely exists within the aqueous and solid phases, excluding the gaseous phase. The interplay of phosphorus migration between bottom sediments and water is emblematic of an equilibrium process [61]. This dynamic equilibrium governs the buffering effect exerted by sediment deposits upon variations in bioavailable phosphorus fractions within the water. Should the vigor of binding exceed that of release, the concentration of phosphorus in the overlying water column remains diminished. Conversely, if the intensity of binding pales in comparison to that of release, the sediment becomes predisposed to phosphorus discharge. On lengthier temporal scales, phosphorus release exemplifies a disconcerting lack of equilibrium between the phosphorus sedimentation and the capacity for phosphorus retention within anaerobic sediment strata. Anaerobic conditions amplify the efflux of this element from autochthonous sources, primarily emanating from inorganic sediment forms [58], as well as organic matter [62].
Remarkably, the release primarily pertains to phosphorus complexes with iron, as opposed to phosphorus complexes linked to calcium [58]. Within anaerobic sediment, iron experiences reduction into divalent ions, thereby instigating enhanced solubility of inorganic iron–phosphorus compounds, thereby facilitating the liberation of phosphate ions into pore water. These ions subsequently undergo diffusion into the overlying water column [58]. This process chiefly transpires within the uppermost 10 cm stratum of the bottom sediment layer [63,64].
Conventionally, overlying water harbors dissolved oxygen, and at the sediment–water interface, an oxidized sediment layer extending several millimeters impedes the diffusion of phosphorus dissolved within pore water into the overlying water column. Upon the advent of oxygen depletion, the upper sediment stratum succumbs to oxygen exhaustion, allowing pore water with elevated phosphorus concentrations to infiltrate the overlying water column [65].
4.2.2. The Impact of Reducing Conditions upon Phosphorus Behavior
Elaborate mechanistic insights into the impact of reducing conditions upon phosphorus behavior at the sediment–water interface are gleaned from prognostic modeling endeavors involving the diagenetic model for the lower St. Lawrence River Estuary. This model demonstrates that the dwindling concentration of oxygen at a rate of 1 µmol/L/yr leads to modifications in the distribution and fluxes of iron, manganese, phosphorus, nitrogen, and sulfur. A gradual decrement in the oxygen concentration within the bottom water engenders escalated fluxes of reduced substances from the sediment, depletes reactive iron and manganese oxides, and enriches the sediment with iron sulfides [66]. This mechanism is recurrently discerned within lakes, where the formation of the recalcitrant compound—iron sulfide—engenders the enduring withdrawal of iron. This iron, which primarily oversees the deposition of phosphorus within bottom sediments, is predominantly responsible for this function.
The mechanism elucidated above—pertaining to the migration of biogenic compounds, specifically phosphorus, within the sediment–water interface—is not governed solely by alterations in oxygenation conditions. Several mechanisms release insensitive phosphorus, independent of changes in the redox potential, such as P binding systems with Al or Ca [58], whose solubility depends on pH, or the formation of irreducible Fe(III) minerals that are able to increase P retention and completely prevent P release even in anaerobic conditions [67].
Another significant source of phosphorus, potentially affecting the prolonged release of this element, is organic matter, from which phosphorus is liberated through microbial decomposition [62,68] and enzymatic orthophosphate regeneration involving phosphohydrolytic enzymes [69,70]. Organic matter in rivers may stem from both allochthonous and autochthonous sources, given that eutrophication is often linked to algal blooms [71].
The described mechanisms of phosphorus release are interconnected. For instance, during anaerobic organic matter metabolism, iron is microbially reduced to Fe2+, releasing additional loads of phosphorus [72]. Given that microbial processes consume oxygen and release P, discerning whether oxygen deficiency is a result or a cause of P release proves challenging [67].
4.2.3. Nutrient Concentration and Chlorophyll_a Content
The organic matter accumulated in the lower part of the Oder River during the ecological catastrophe may lead not only to oxygen deficits but also to re-eutrophication in subsequent growing seasons. Phytoplankton production will further generate organic matter loads in this river section. The lower trophic state of the Oder River’s lower section has been emphasized for over three decades in reports from Polish and German environmental authorities, as well as in scientific studies [73,74,75,76,77]. Nutrient concentration and chlorophyll_a content variability across the hydrological yearly cycle resembled changes seen in heavily eutrophicated stagnant waters [75]. Weekly examinations of the waters of the Oder River near Krajnik Dolny over three years (1994–1996) highlighted significant nitrogen compound pollution from runoff. The nitrate(V) form accounted for the largest percentage share of the total nitrogen pool, averaging 55.1%. The mean total nitrogen concentration was 4.15 mg/L, and total phosphorus concentration was 0.32 mg/L. Phosphate phosphorus constituted, on average, 34% of the total phosphorus [76]. In all years of study, two algal blooms were observed: spring (March–May) and summer (June–September). Criteria for designating waters sensitive to nitrogen compound pollution from agricultural sources classified the Oder River’s waters as eutrophic. The chlorophyll a content even reached up to 250 mg/L. Comparisons of the total phosphorus concentrations and chlorophyll_a content with trophic category limit values and OECD lake eutrophication models, as well as the Dillon and Rigler eutrophication model, indicated that the Oder River’s trophic state was comparable to hypertrophic lakes [75]. During the spring bloom, ammonium nitrogen and phosphate phosphorus concentrations primarily impacted phytoplankton biomass development, while during the summer bloom, nitrate nitrogen(V) concentration had the most influence [76]. The ratio of the total nitrogen to phosphorus concentrations revealed phosphorus as the limiting element for phytoplankton biomass development in the estuarine section of the Oder River [78]. These significant algal blooms contributed excessive organic matter levels in the water, directly proportional to phytoplankton quantities [77].
Water quality studies conducted in the Oder River in Krajnik Dolny from 2001 to 2011 by the Voivodship Inspectorate for Environmental Protection (WIOŚ) in Szczecin indicated that organic pollutant concentrations remained consistently high, ranging from 3.09 to 5.42 mg O2/L. Total forms of nitrogen and phosphorus nutrients were within class II and averaged 2.77 mg N/L and 0.21 mg P/L [73]. Water quality assessments conducted in the following decade by VIEP based on years of research showed stable biogenic pollutant indicators. At the height of Krajnik Dolny, the Oder River’s waters were classified as class I for the phosphorus amount and class II for the nitrogen amount [74]. Despite this, in the first two decades of the 21st century, the ecological status of the Oder River was assessed as moderate or poor due to excessive phytoplankton levels, indicating a high likelihood of internal nutrient supply to the river. The consequence of heavy pollution of the waters of the Oder River with biogenic compounds is the eutrophication of the Baltic Sea, which has been observed for years [79].
4.3. Anoxia and Climate Changes
The ecological disaster was intensified by high air and water temperatures and low water levels. Long-term studies on the frequency of river hypoxia in the North Carolina Piedmont have shown significant potential for hypoxia even in well-aerated reaches during particularly warm, low flow periods [80]. Such conditions were observed in the lower section of the Oder River in the first two weeks of August 2023.
There exists a significant reciprocal relationship between anoxia and climate change. The observed climatic changes, particularly the temperature rise, are likely to exacerbate and intensify this negative phenomenon. These changes will not only diminish its alleviation but also escalate the occurrence of hypoxia in rivers and their estuaries. A 3D model that couples hydrodynamic, sediment transport, and biogeochemical processes simulates an augmentation of summer hypoxia in the Garonne River as a response to increased temperatures, diminished river flow, or elevated local population, while sea level rise, having minimal effect on dissolved oxygen, remains a non-contributing factor [81,82]. Climatic alterations make extreme events more likely to lead to the formation of hypoxic blackwater [51]. Conversely, studies indicate that the expansion of hypoxic zones in estuarine waters significantly amplifies the emission of greenhouse gases, including carbon dioxide (CO2), nitrous oxide (N2O), and methane (CH4) [49,50]. An analysis of greenhouse gases in the water column at the mouth of the Pearl River, characterized by recurrent hypoxia, demonstrated air–water fluxes of N2O, CH4, and CO2 during the summer to be 31.9 ± 7.5 μmol m−2 d−1, 192.5 ± 229.4 μmol m−2 d−1, and 51.9 ± 14.1 mmol m−2 d−1, respectively. In this river, the dominant mechanisms for N2O production in bottom waters include robust nitrification, while CH4 stems from sediment surface resuspension, and CO2 from mass mineralization of organic matter [49].
The increased appropriation of water resources by the human population could be further exacerbated by climate change, which projects a 60% decrease in tributary flow solely in the South Central US [60]. Furthermore, escalated evaporation rates linked to regional warming are likely to elevate the salinity. Consequently, the compounded hydrological stresses stemming from climate change, natural resource extraction, and burgeoning human populations might lead to a heightened occurrence of P. parvum and harmful algal blooms in general, thereby inducing more instances of anoxia.
4.4. Counteracting Hypoxia
4.4.1. Reducing Pollution Inflow
Addressing hypoxia and its downstream effects requires categorizing actions based on its underlying causes. In all instances of hypoxia, a fundamental measure should be the restriction of pollutant inflow into the river, both from point and diffuse sources, primarily linked to agricultural activities [83]. The best management practices should focus on phosphorus as it is more likely to maintain a balanced nutrient distribution in rivers, promoting healthy aquatic ecosystems [59] and indirectly improving aerobic conditions. Analyses of historical data from the European and North American coastal systems suggest that strategies to reduce hypoxia by reducing the nutrient load—based on the assumption that this action will reverse eutrophication—tend to follow non-linear trends that may include hysteresis and time lags [84].
A comprehensive evaluation of three factors, climate, agriculture, and point source inputs of domestic and industrial origin, on the long-term prospects of the Seine River system (France) exhibited that the primary driving force influencing water quality in the 21st century is the anticipated reduction in point source pollution. This reduction induces a noticeable decline in eutrophication and oxygen depletion downstream from Paris [85]. The simulation assumes future point source pollution reductions of 30% to 75% compared to 2000, depending on the pollutants, along with an average warming of +3.3 degrees C across the watershed. This is accompanied by a pronounced winter increase and a summer decrease in precipitation. An examination of published case studies, which focused on the temporal trajectories of hypoxia responses to shifts in nutrient loading in various coastal systems, revealed that oxygen conditions improved rapidly and linearly in systems where the remediation concentrated on organic inputs from sewage treatment plants—the primary drivers of hypoxia. In vertically well-mixed coastal systems, hypoxia has generally responded robustly along linear or threshold trajectories to substantial reductions in labile dissolved organic matter loading. While other shallow well-mixed systems also demonstrated declines in hypoxia following the reduced loading of inorganic nutrients, responses were sometimes delayed by 5–10 years [84].
In the case of heavily eutrophicated waters, strategies to alleviate hypoxia should be grounded in nutrient input reduction. The best management practices should center on phosphorus, as it is more likely to sustain a balanced nutrient distribution in rivers, promoting healthy aquatic ecosystems [59], and indirectly improving oxygen conditions. Analyses of historical data from the European and North American coastal systems suggest that strategies aiming to decrease hypoxia by reducing nutrient load—based on the assumption that this action will reverse eutrophication—tend to follow non-linear trends that may involve hysteresis and time lags [85].
4.4.2. Oxygenation of Water by Physicochemical Methods
Ecological catastrophes, resulting in fish mortality in the upper and middle sections of the river, substantially impacted oxygen conditions in the lower section with a certain delay. In the case of the Oder River, this occurred over several days. Despite removing significant carcass amounts, large quantities of organic matter entered the lower stretch, leading to hypoxia due to decomposition, thereby creating a dead zone. The effects of extreme events in the upper and middle sections can be mitigated by implementing measures in the lower region to augment oxygen levels in the water column and sediment–water interface, establishing oxygen refuges for fish.
Water aeration methods have been utilized for years, yielding varying degrees of success in restoring eutrophicated lakes [86,87] and in aquaculture [88]. For rivers, both aeration and mixing approaches warrant attention. Boys et al. [89] compared and discussed two chemical treatments—calcium peroxide and sodium percarbonate—along with various mechanical mixing and aeration techniques, such as bubble diffusers, ultrafine oxygen bubbles, Venturi pumps, paddle wheels, downward-facing propellers, and water fountains. The factors considered encompassed their readiness, effectiveness, potential environmental impact, deployment feasibility in remote areas (with limited electrical power), resilience under extreme environmental conditions (heat, dust, vermin, vandalism), cost-effectiveness, technical expertise requirement, treated area size, and duration of reoxygenation.
An improvement of aerobic conditions at the sediment–bottom water interface can also be achieved using geoengineering materials like oxygen nanobubble-modified zeolites or soil [90]. Laboratory tests demonstrated that employing the “flock-lock” geoengineering technique based on oxygen nanobubble technology significantly elevated dissolved oxygen levels (4–7.5 mg/L) over a 127-day experimental period compared to control systems (around 1 mg/L). Furthermore, the oxidation–reduction potential shifted from −200 mV to 180–210 mV, sustaining positive values for 89 days. Further experimental studies conducted in lakes indicated that this technology also curtailed the release of labile phosphorus into the water column, thus mitigating water eutrophication [91,92].
In the lower section of the Oder River, measures to address hypoxia and prevent future catastrophes should be implemented. This can be achieved by familiarizing yourself with available aeration and mixing technologies, considering their costs, environmental risks, and obtaining necessary permits. The choice of approach should be based on prior monitoring studies of the river, taking into account its aerobic profile, potential fish refuges, and other factors. For example, if the river exhibits aerobic stratification, preventive mixing can be employed throughout the summer, particularly in selected fish refuges. However, in cases where the river is already oxygen stratified, using mixing during rapid aerobic deterioration could have an adverse effect by mixing hypoxic bottom waters with epilimnion and depleting the oxygenated upper water layer [89].
During acute hypoxia, actions should be taken to directly increase the oxygen content at the sediment–water interface, leading to a significant improvement in aerobic conditions throughout the water column.
Another crucial action involves the monitoring of fundamental physicochemical water quality indicators, as anaerobic conditions pose numerous uncertainties. In rivers, as in other aquatic ecosystems, both seasonal and daily variations in oxygen concentrations are observed. Field surveys of dissolved oxygen in the upper estuarine zone of the Daliaohe River during the spring and summer of 2009 revealed typical spatial and temporal distribution patterns of this indicator. Dissolved oxygen concentrations were higher in surface layers during the daytime and in spring, whereas they were lower in bottom layers, at night, and during summer [93].
4.4.3. Monitoring and Modeling
The results presented in this paper indicate how much information we can obtain about changes occurring in a watercourse based on measurements of general water quality indicators such as pH, oxygen content, or conductivity and how different relationships exist between them in various sections of the river. The current state of technology allows for continuous monitoring of these parameters at relatively low costs. The results of these studies can serve as the basis for creating specific models of hydrochemical processes for the lower section of the river and their responses to extreme changes, such as those occurring during ecological disasters upstream of this section. To obtain the extensive databases necessary for studying oxygen condition changes in the river, permanent monitoring stations need to be installed. A noteworthy example is the system of four monitoring stations in the Girron estuary section, contributing to the MAGEST (MArel Gironde ESTuary) monitoring program [53,81]. This program offers the chance to describe specific events that conventional sampling methods might miss. The stations measure four parameters every 10 min: temperature, salinity, turbidity, and dissolved oxygen. Such a database allows for the identification of environmental factors triggering critical hypoxia events and predicting potential trends in future hypoxia occurrences. Armed with an appropriate database and models combining hydrodynamic processes, sediment transport, and biogeochemical processes, it is possible to simulate the influence of factors influenced by global and regional climate change on oxygenation in the most vulnerable river zones [82]. Monitoring forms the foundation for further protective and reclamation measures. Only continuous monitoring stations can provide a reliable database that identifies the primary causes of poor water quality and guides decisions to enhance it.
Years of reclamation experience emphasize that the most effective approach combines multiple actions. The consequences of global warming and climate change are currently difficult to control, at least in the near term. However, the outcomes of eutrophication-induced hypoxia can be reversed with sustained, long-term efforts to significantly reduce nutrient loads [94].
5. Conclusions
This work constitutes a case study of the consequences of an ecological disaster that occurred in the upper and middle sections of the Oder River, extending to its lower stretch. The analysis of physicochemical results revealed that the fish kill (169 t) and benthic organism mortality in the estuarine section of the Oder in August 2022 could largely be attributed to a reduction in the amount of dissolved oxygen in the water. The observed oxygen depletion was a secondary phenomenon caused by the decomposition of large quantities of organic matter originating from carcasses flowing down from earlier sections of the river. This process was further intensified by high water temperatures and low water levels. A significant correlation was found at point OE2 (r = −0.58), characterized by the highest hypoxia. No significant relationships were observed at the remaining measurement points, with the exception of findings in the West Oder at point OW2, where a positive strong relationship between the dissolved oxygen quantity and water temperature was calculated (r = 0.86). Long-term monitoring studies indicate that the main threats to the estuarine section of the Oder River are an excess of biogenic compounds, organic matter, and bacterial contamination. Significant phytoplankton blooms in the Oder River, despite the decreasing concentrations of nitrogen and phosphorus compounds, suggest a high likelihood of the river being supplied with nutrients from internal sources. Understanding these factors is crucial for assessing the impact of P. parvum and the other algal blooms on aquatic ecosystems and developing strategies for their management and control.
Considering climate change and the poor trophic state of the lower Oder River, the recurrence of an ecological disaster and a gradual deterioration of the trophic and oxygen conditions in the lower stretch of the Oder can be expected. Actions should be taken to mitigate these adverse changes through continuous monitoring and by limiting the allochthonous and autochthonous nutrient input to the river, especially phosphorus. Solutions should also be prepared for the possibility of extreme events in the upper and middle parts of the river. In the lower stretch of the river, these solutions can be alleviated through the implementation of various geotechnical engineering techniques aimed at improving oxygen conditions in strategic locations for fish survival. Therefore, intensive physicochemical, biological, and hydrological research of this complex and sensitive river section should be conducted to optimize protective and remedial actions. The continuous monitoring of the Oder River began on 31 March 2023, with nine measuring stations with devices installed along the river’s course in important locations. These devices continuously monitor the physical and chemical water parameters, such as water temperature, dissolved oxygen, conductivity, and pH.
Possible directions for future research in the context of this study could be as follows:
- A.
- Long-term ecological monitoring: The continuation of long-term ecological monitoring in the Oder River and expanding the research to other rivers with similar ecological vulnerabilities. This will help in tracking changes in water quality, oxygen levels, and nutrient concentrations over time, especially in response to climate change and other external factors.
- B.
- Ecological risk asssessment: Conducting detailed ecological risk assessments to identify potential ecological disasters and their underlying causes. This could involve a comprehensive study of the interactions between various environmental factors, pollutants, and aquatic organisms to predict and prevent ecological crises.
- C.
- Advanced water quality analysis: The development and implementation of advanced analytical techniques to assess water quality, including the detection of specific pollutants, microbial contamination, and harmful algal blooms. This can provide more precise and early warning systems for potential ecological disasters.
- D.
- Ecosystem management and restoration: Developing strategies and action plans for ecosystem management and restoration. This includes identifying ways to mitigate the adverse effects of ecological disasters and restore damaged aquatic ecosystems, such as introducing measures to control nutrient input and improve oxygen levels.
- E.
- Adaptive management: Implementing adaptive management strategies to respond to changing environmental conditions and uncertainties related to ecological disasters. This approach involves continuous monitoring, assessment, and adjusting management practices accordingly.
- F.
- Interdisciplinary research: encouraging interdisciplinary research collaboration between ecologists, hydrologists, environmental engineers, and policy experts to address complex ecological issues comprehensively.
We should also consider the research limitations, which could be as follows:
- A.
- Data availability: The study’s findings and future research may be limited by the availability of historical data and the need for long-term data collection. Data gaps or inconsistencies could affect the accuracy of ecological assessments.
- B.
- Scope: the study’s scope is limited to the Oder River, and extrapolating the findings to other regions or rivers may require caution due to variations in environmental conditions and anthropogenic factors.
- C.
- Complexity: Ecological systems are inherently complex, and the study may not capture all the intricate interactions between different components of the ecosystem. Further research may need to account for this complexity.
- D.
- Resource constraints: The research may be limited by resource constraints, including funding, equipment, and expertise. Expanding research efforts may require additional resources.
The findings of this study have universal implications for the management and protection of aquatic ecosystems in regions facing similar ecological challenges. The potential for ecological disasters due to oxygen depletion, nutrient loading, and temperature fluctuations is not unique to the Oder River but is a concern for many river systems globally. Therefore, the disaster study, lessons learned, and proposed solutions can serve as a valuable reference for researchers and environmental management authorities worldwide who are dealing with similar issues in their respective water bodies. Collaboration and knowledge-sharing on a global scale can help to develop effective strategies for the protection and sustainable management of aquatic ecosystems.
Author Contributions
Conceptualization, H.S. and J.P.; methodology, H.S. and J.P.; software, H.S. and J.P.; investigation, H.S. and J.P.; resources, H.S. and J.P.; data curation, H.S. and J.P.; writing—original draft preparation, H.S. and J.P.; writing—review and editing, H.S. and J.P.; visualization, H.S. and J.P. All authors have read and agreed to the published version of the manuscript.
Funding
This research received no external funding.
Institutional Review Board Statement
Not applicable.
Data Availability Statement
https://www.gov.pl/web/odra/badania-odry (accessed on 25 October 2023).
Conflicts of Interest
The authors declare no conflict of interest.
References
- Lampert, W.; Sommer, U. Limnoecology: The Ecology of Lakes and Streams, 2nd ed.; Oxford University Press: Oxford, UK, 2007; p. 13. ISBN 9780199213931. [Google Scholar]
- Piatka, D.; Wild, R.; Hartmann, J.; Kaule, R.; Kaule, L.; Gilfedder, B.S.; Peiffer, S.; Geist, J.; Beierkuhnlein, C.; Barth, J.A. Transfer and transformations of oxygen in rivers as catchment reflectors of continental landscapes: A review. Earth Sci. Rev. 2021, 220, 103729. [Google Scholar] [CrossRef]
- Kajak, Z. Hydrobiologia-Limnologia. Ekosystemy Wód Śródlądowych; PWN: Warszawa, Poland, 1998; pp. 74–87. [Google Scholar]
- Zhang, P.; Wang, B.; Wang, Y.; Pang, Y.; Shi, C.; Xie, R. Causes of continuous and short-term hypoxia in rivers entering the sea: A case of Minjiang River in Fujian. Hydrol. Res. 2023, 54, 65–81. [Google Scholar] [CrossRef]
- Li, X.; Lu, C.; Zhang, Y.; Zhao, H.; Wang, J.; Liu, H.; Yin, K. Low dissolved oxygen in the Pearl River estuary in mmer: Long-term spatio-temporal patterns, trends, and regulating factors. Mar. Pollut. Bull. 2020, 151, 110814. [Google Scholar] [CrossRef]
- Yang, A.L.; Yang, F.; Li, S.B.; Yu, Q.B.; Chen, N.W. Spatiotemporal Characteristics of Dissolved Oxygen and Control Mechanism of Hypoxia (Low Oxygen) in the Watershed-Coastal System in Fujian Province. Huan Jing Ke Xue 2022, 43, 4950–4960. [Google Scholar]
- Brooks, B.; Grover, J.; Roelke, D. Prymnesium parvum: An emerging threat to inland waters. Environ. Toxicol. Chem. 2011, 30, 1955–1964. [Google Scholar] [CrossRef]
- Brooks, B.W.; James, S.V.; Valenti, T.W., Jr.; Urena-Boeck, F.; Serrano, C.; Berninger, J.P.; Schwierzke, L.; Mydlarz, L.D.; Grover, J.P.; Roelke, D.L. Comparative toxicity of Prymnesium parvum in inland waters. J. Am. Water Resour. Assoc. 2010, 46, 45–62. [Google Scholar] [CrossRef]
- Blaszczak, J.R.; Koenig, L.E.; Mejia, F.H.; Gómez-Gener, L.; Dutton, C.L.; Carter, A.M.; Grimm, N.B.; Harvey, J.W.; Helton, A.M.; Cohen, M. Extent, patterns, and drivers of hypoxia in the world’s streams and rivers. LO Lett. 2022, 8, 453–463. [Google Scholar] [CrossRef]
- Misra, A.K. A River about to Die: Yamuna. J. Water Resour. Prot. 2010, 2, 489–500. [Google Scholar] [CrossRef]
- Holdway, P.A.; Watson, R.A.; Moss, B. Aspects of the ecology of Prymnesium parvum (Haptophyta) and water chemistry in the Norfolk Broads, England. Freshw. Biol. 1978, 8, 295–311. [Google Scholar] [CrossRef]
- Glass, J.; Linam, G.; Ralph, J. The Association of Prymnesium parvum with Fish Kills in Texas. Tex. Parks Wildl., 1991. Available online: https://tpwd.texas.gov/landwater/water/environconcerns/hab/ga/news/toxicblooms.phtml (accessed on 25 October 2023).
- James, T.; De La Cruz, A. Prymnesium parvum Carter (Chrysophyceae) as a suspect of mass mortalities of fish and shellfish communities in western Texas. Tex. J. Sci. 1989, 41, 429–430. [Google Scholar]
- Rhodes, K.; Hubbs, C. Recovery of the Pecos River fishes from a red tide fish kill. Southwest. Nat. 1992, 37, 178–187. [Google Scholar] [CrossRef]
- VanLandeghem, M.; Farooqi, M.; Farquhar, B.; Patiño, R. Impacts of golden alga Prymnesium parvum on fish populations in reservoirs of the upper Colorado river and Brazos river basins, texas. Trans. Am. Fish. Soc. 2013, 142, 581–595. [Google Scholar] [CrossRef]
- Southard, G.; Fries, L.; Barkoh, A. Prymnesium parvum: The Texas experience1. JAWRA J. Am. Water Resour. Assoc. 2010, 46, 14–23. [Google Scholar] [CrossRef]
- Sargent, J.C.; Galat, D.L. Fish mortality and physicochemistry in a managed floodplain wetland. Wetl. Ecol. Manag. 2002, 10, 113–119. [Google Scholar] [CrossRef]
- Roelke, D.L.; Grover, J.P.; Brooks, B.W.; Glass, J.; Buzan, D.; Southard, G.M.; Fries, L.; Gable, G.M.; Schwierzke-Wade, L.; Byrd, M.; et al. A decade of fish-killing Prymnesium parvum blooms in Texas: Roles of inflow and salinity. J. Plankton Res. 2011, 33, 243–253. [Google Scholar] [CrossRef]
- Roelke, D.L.; Barkoh, A.; Brooks, B.W. A chronicle of a killer alga in the west: Ecology, assessment, and management of Prymnesium parvum blooms. Hydrobiologia 2016, 764, 29–50. [Google Scholar] [CrossRef]
- IOŚ PIB. Wstępny Raport Zespołu ds. Sytuacji na Rzece Odrze; Instytut Ochrony Środowiska-Państwowy Instytut Badawczy: Warszawa, Poland, 2022; p. 260. Available online: https://ios.edu.pl/aktualnosci/wstepny-raport-zespolu-ds-sytuacji-na-rzece-odrze/ (accessed on 19 June 2023).
- IOŚ PIB. Raport Kończący Prace Zespołu ds. Sytuacji w Odrze; Instytut Ochrony Środowiska—Państwowy Instytut Badawczy: Warszawa, Poland, 2023; p. 191. Available online: https://ios.edu.pl/wp-content/uploads/2022/12/raport-konczacy-prace-zespolu-ds-sytuacji-w-odrze-2.pdf (accessed on 12 August 2023).
- Acosta, F.; Zamor, R.; Najar, F.; Roe, B.; Hambright, K. Dynamics of an experimental microbial invasion. Proc. Natl. Acad. Sci. USA 2015, 112, 11594–11599. [Google Scholar] [CrossRef]
- Jones, A.; Campbell, V.; Hambright, K.; Heidelberg, K.; Caron, D. Gene expression in the mixotrophic prymnesiophyte, Prymnesium parvum, responds to prey availability. Front. Microbiol. 2015, 6, 319. [Google Scholar] [CrossRef]
- VanLandeghem, M.; Farooqi, M.; Southard, G.; Patiño, R. Associations between water physicochemistry and Prymnesium parvum presence, abundance, and toxicity in west texas reservoirs. JAWRA J. Am. Water Resour. Assoc. 2014, 51, 471–486. [Google Scholar] [CrossRef]
- Hambright, K.; Easton, J.; Zamor, R.; Beyer, J.; Easton, A.; Allison, B. Regulation of growth and toxicity of a mixotrophic microbe: Implications for understanding range expansion in Prymnesium parvum. Freshw. Sci. 2014, 33, 745–754. [Google Scholar] [CrossRef]
- Wagstaff, B.A.; Hems, E.S.; Rejzek, M.; Pratscher, J.; Brooks, E.; Kuhaudomlarp, S.; O’Neill, E.C.; Donaldson, M.I.; Lane, S.; Currie, J.; et al. Insights into toxic Prymnesium parvum blooms: The role of sugars and algal viruses. Biochem. Soc. Trans. 2018, 46, 413–421. [Google Scholar] [CrossRef]
- Carter, N. New or interesting algae from brackish water. Arch. Protistemk 1937, 90, 1–68. [Google Scholar]
- Reichenbach-Klinke, H. Fish Pathology; T. F. H. Publications: Neptune City, NJ, USA, 1973; 512p. [Google Scholar]
- Manning, S.R.; La Claire, J.W., II. Prymnesins: Toxic Metabolites of the Golden Algae, Prymnesium parvum Carter (Haptophyta). Mar. Drugs 2010, 8, 678–704. [Google Scholar] [CrossRef]
- Wagstaff Ben, A.; Pratscher, J.; Rivera, P.P.L.; Hems, E.S.; Brooks, E.; Rejzek, M.; Todd, J.D.; Colin Murrell, J.C.; Field, R.A. Assessing the Toxicity and Mitigating the Impact of Harmful Prymnesium Blooms in Eutrophic Waters of the Norfolk Broads. Environ. Sci. Technol. 2021, 55, 16538–16551. [Google Scholar] [CrossRef] [PubMed]
- Guiry, M.D.; Guiry, G.M.; AlgaeBase. World-Wide Electronic Publication, National University of Ireland, Galway. Available online: https://www.algaebase.org (accessed on 17 May 2023).
- Yin, J.; Sun, X.; Zhao, R.; Qiu, X.; Eeswaran, R. Application of uniform design to evaluate the different conditions on the growth of algae Prymnesium parvum. Sci. Rep. 2021, 11, 12672. [Google Scholar] [CrossRef] [PubMed]
- Lysgaard, M.L.; Eckford-Soper, L.; Daugbjerg, N. Growth rates of three geographically separated strains of the ichthyotoxic Prymnesium parvum Prymnesiophyceae) in response to six different pH levels. Estuar. Coast. Shelf Sci. 2018, 204, 98–102. [Google Scholar] [CrossRef]
- Roelke, D.L.; Manning, S.R. Chapter 16q Harmful Algal Species Fact Sheet: Prymnesium parvum (Carter) “Golden Algae”. In Harmful Algal Blooms; Shumway, S.E., Burkholder, J.M., Morton, S.L., Eds.; Wiley: Hoboken, NJ, USA, 2018; pp. 629–632. ISBN 978-1-118-99467-2. [Google Scholar] [CrossRef]
- Fistarol, G.O.; Legrand, C.; Granéli, E. Allelopathic effect of Prymnesium parvum on a natural plancton community. Mar. Ecol. Prog. 2003, 255, 115–125. [Google Scholar] [CrossRef]
- Binzer, S.B.; Svenssen, D.K.; Daugbjerg, N.; Alves-de-Souza, C.; Pinto, E.; Hansen, P.J.; Larsen, T.O.; Varga, E. A-, B- and C-type prymnesins are clade specific compounds and chemotaxonomic markers in Prymnesium parvum. Harmful Algae 2019, 81, 10–17. [Google Scholar] [CrossRef]
- Aquatic Invasive Species Control Plan Division of Environmental Services, Golden Alga 2021. Available online: https://www.fishandboat.com/Resource/AquaticInvasiveSpecies/Documents/ais-control-plan-golden-alga.pdf (accessed on 25 October 2023).
- Hartman, K.J.; Wellman, D.S.; Kingsbury, J.B.; Cincotta, D.A.; Clayton, J.L.; Eliason, K.M.; Jernejcic, F.A.; Owens, N.V.; Smith, D.C. A case study of a Prymnesium parvum harmful algae bloom in the Ohio river drainage: Impact, recovery and potential for future invasions/range expansion. Water 2021, 13, 3233. [Google Scholar] [CrossRef]
- Freitag, M.; Beszteri, S.; Vogel, H.; John, U. Effects of physiological shock treatments on toxicity and polyketide synthase gene expression in Prymnesium parvum (prymnesiophyceae). Eur. J. Phycol. 2011, 46, 193–201. [Google Scholar] [CrossRef]
- Climate of Poland 2022. IMGW-PIB. Available online: https://imgw.pl/sites/default/files/inline-files/climate-of-poland-2023_report.pdf (accessed on 25 October 2023).
- Characteristics of Selected Climate Elements in Poland in 2022–Summary. 31.01.2023. IMGW-PIB. Available online: https://imgw.pl/wydarzenia/charakterystyka-wybranych-elementow-klimatu-w-polsce-w-2022-roku-podsumowanie (accessed on 25 October 2023).
- Stan Środowiska w Województwie Zachodniopomorskim w Roku 2010. Wojewódzki Inspektorat Ochrony Środowiska w Szczecinie; Biblioteka Monitoringu Środowiska: Szczecin, Poland, 2011; pp. 33–82. [Google Scholar]
- Atroszko, M.; Zbucki, Ł. Zmienność zjawisk hydrologicznych na Dolnej Odrze w latach 1947–2003. Rozpr. Społeczne/Soc. Diss. 2011, 5, 38–55. [Google Scholar]
- Available online: https://www.gov.pl/web/odra/badania-odry (accessed on 12 August 2023).
- Available online: https://pomiary.gios.gov.pl/ (accessed on 12 August 2023).
- Howitt, J.A.; Baldwin, D.S.; Rees, G.N.; Williams, J.L. Modelling blackwater: Predicting water quality during flooding of lowland river forests. Ecol. Model. 2007, 203, 229–242. [Google Scholar] [CrossRef]
- Whitworth, K.L.; Baldwin, D.S.; Kerr, J.L. Drought, floods and water quality: Drivers of a severe hypoxic blackwater event in a major river system (the southern MurrayeDarling Basin, Australia). J. Hydrol. 2012, 450–451, 190–198. [Google Scholar] [CrossRef]
- Sługocki, Ł.; Czerniawski, R. Water Quality of the Odra (Oder) River before and during the Ecological Disaster in 2022: A Warning to Water Management. Sustainability 2023, 15, 8594. [Google Scholar] [CrossRef]
- Liu, S.; Gao, Q.; Wu, J.; Xie, Y.; Yang, Q.; Wang, R.; Zhang, J.; Liu, Q. Spatial distribution and influencing mechanism of CO2, N2O and CH4 in the Pearl River Estuary in summer. Sci. Total Environ. 2022, 846, 157381. [Google Scholar] [CrossRef]
- Small, K.; Kopf, R.K.; Watts, R.J.; Howitt, J. Hypoxia, blackwater and fish kills: Experimental lethal oxygen thresholds in juvenile predatory lowland river fishes. PLoS ONE 2014, 9, 94524. [Google Scholar] [CrossRef]
- Kerr, J.L.; Baldwin, D.S.; Whitworth, K.L. Options for managing hypoxic blackwater events in river systems: A review. J. Environ. Manag. 2013, 114, 139–147. [Google Scholar] [CrossRef]
- American Ecological Society on the United States Geological Survey. Available online: http://toxics.usgs.gov/definitions/hypoxia.html (accessed on 12 August 2023).
- Lanoux, A.; Etcheber, H.; Schmidt, S.; Sottolichio, A.; Chabaud, G.; Richard, M.; Abril, G. Factors contributing to hypoxia in a highly turbid, macrotidal estuary (the Gironde, France). Environ. Sci. Process Impacts 2013, 15, 585–595. [Google Scholar] [CrossRef]
- Foss, A.; Evensen, T.H.; Øiestad, V. Effects of hypoxia and hyperoxia on growth and food conversion efficiency in the spotted wolfish Anarhichas minor (Olafsen). Aquacult. Res. 2002, 33, 437–444. [Google Scholar] [CrossRef]
- Person-Le Ruyet, J.; Pichavant, K.; Vacher, C.; Le Bayon, N.; Sévère, A.; Boeuf, G. Effects of O2 supersaturation on metabolism and growth in juvenile turbot (Scophthalamus maximus L.). Aquaculture 2002, 205, 373–383. [Google Scholar] [CrossRef]
- Pichavant, K.; Person-Le-Ruyet, J.; Le Bayon, N.; Sévère, A.; Le Roux, A.; Quéméner, L.; Maxime, V.; Nonnotte, G.; Boeuf, G. Effects of hypoxia on growth and metabolism of juvenile turbot. Aquaculture 2000, 188, 103–114. [Google Scholar] [CrossRef]
- Saroglia, M.; Cecchini, S.; Terova, G.; Caputo, A.; De Stradis, A. Influence of environmental temperature and water oxygen concentration on gas diffusion distance in sea bass (Dicentrarchus labrax, L.). Fish Physiol. Biochem. 2000, 23, 55–58. [Google Scholar] [CrossRef]
- Kang, M.; Peng, S.; Tian, Y.; Zhang, H. Effects of dissolved oxygen and nutrient loading on phosphorus fluxes at the sediment-water interface in the Hai River Estuary, China. Mar. Pollut. Bull. 2018, 130, 132–139. [Google Scholar] [CrossRef] [PubMed]
- Chen, Y.; Chen, J.; Xia, R.; Li, W.; Zhang, Y.; Zhang, K.; Tong, S.; Jia, R.; Hu, Q.; Wang, L.; et al. Phosphorus-The main limiting factor in riverine ecosystems in China. Sci. Total Environ. 2023, 870, 161613. [Google Scholar] [CrossRef]
- Gibbons, K.J.; Bridgeman, T.B. Effect of temperature on phosphorus flux from anoxic western Lake Erie sediments. Water Res. 2020, 182, 116022. [Google Scholar] [CrossRef] [PubMed]
- Chen, X.; Li, H.; Hou, J.; Cao, X.; Song, C.; Zhou, Y. Sediment–water interaction in phosphorus cycling as affected by trophic states in a Chinese shallow lake (LakeDonghu). Hydrobiologia 2016, 776, 19–33. [Google Scholar] [CrossRef]
- Katsev, S.; Dittrich, M. Modeling of decadal scale phosphorus retention in lake sediment under varying redox conditions. Ecol. Modell. 2013, 251, 246–259. [Google Scholar] [CrossRef]
- Sundby, B.C.; Gobeil, N.; Silverberg, N.; Mucci, A. The phosphorus cycle in coastal marine sediments. Limnol. Oceanogr. 1992, 37, 1129–1145. [Google Scholar] [CrossRef]
- Anschutz, P.; Sundby, B.; Lefrançois, L.; Luther, G.W.; Mucci, A. Interactions between metal oxides and species of nitrogen and iodine in bioturbated marine sediments. Geochim. Cosmochim. Acta 2000, 64, 2751–2763. [Google Scholar] [CrossRef]
- Boström, B.; Andersen, J.M.; Fleischer, S.; Jansson, M. Exchange of phosphorus across the sediment-water interface. Hydrobiologia 1988, 170, 229–244. [Google Scholar] [CrossRef]
- Katsev, S.; Chaillou, G.; Sundby, B.; Mucci, A. Effects of progressive oxygen depletion on sediment diagenesis and fluxes: A model for the lower St. Lawrence River Estuary. Limnol. Oceanogr. 2007, 52, 2555–2568. [Google Scholar] [CrossRef]
- Hupfer, M.; Lewandowski, J. Oxygen Controls the Phosphorus Release from Lake Sediments—A Long-Lasting Paradigm in Limnology. Int. Rev. Hydrobiol. 2008, 93, 415–432. [Google Scholar] [CrossRef]
- Katsev, S.; Tsandev, I.; L’Heureux, I.; Rancourt, D.G. Factors controlling long-term phosphorus efflux 570 from lake sediments: Exploratory reactive-transport modeling. Chem. Geol. 2006, 234, 127–147. [Google Scholar] [CrossRef]
- Siwek, H. Activity of alkaline phosphatase in rivers located in agricultural areas on the background of selected physicochemical indexes of water quality. Acta Agrophysica 2009, 13, 237–244. [Google Scholar]
- Yadav, A.; Pandey, J. Water Quality Interaction with Alkaline Phosphatase in the Ganga River: Implications for River Health. Bull. Environ. Contam. Toxicol. 2017, 99, 75–82. [Google Scholar] [CrossRef]
- Funkey, C.P.; Conley, D.J.; Reuss, N.S.; Humborg, C.; Jilbert, T.; Slomp, C.P. Hypoxia sustains cyanobacteria blooms in the Baltic Sea. Environ. Sci. Technol. 2014, 48, 2. [Google Scholar] [CrossRef] [PubMed]
- Katsev, S. Phosphorus Effluxes from Lake Sediments. In Book: Soil Phosphorus, 1st ed.; Rattan Lal, B.A., Stewart, S., Eds.; CRC Press, Taylor & Francis: Boca Raton, FL, USA, 2016. [Google Scholar]
- Raport o Stanie Środowiska w Województwie Zachodniopomorskim w Latach 2010–2011 Roku. In Wojewódzki Inspektorat Ochrony Środowiska w Szczecinie; Biblioteka Monitoringu Środowiska: Szczecin, Poland, 2013; pp. 47–67.
- Stan Środowiska w Województwie Zachodniopomorskim. In Raport 2018. Wojewódzki Inspektorat Ochrony Środowiska w Szczecinie; Biblioteka Monitoringu Środowiska: Szczecin, Poland, 2018; pp. 52–69.
- Siwek, H.; Wybieralski, J.; Gałczyńska, M. Porównanie stanu troficznego rzek Przymorza województwa szczecińskiego z ilościowym modelem eutrofizacji jezior. Chem. Inż. Ekolog. 1999, 6, 181–186. [Google Scholar]
- Siwek, H.; Wybieralski, J.; Gałczyńska, M. Ocena stanu troficznego wód rzeki Odry z uwzględnieniem różnych form związków biogennych. Ekol. I Tech. 2000, 8, 42–47. [Google Scholar]
- Siwek, H.; Wybieralski, J.; Gałczyńska, M. Wpływ biomasy fitoplanktonu na ogólne zanieczyszczenie rzek substancjami organicznymi. Zesz. Probl. Post Nauk Roln. 2003, 492, 295–302. [Google Scholar]
- Siwek, H.; Włodarczyk, M.; Waszak, M. Activity of alkaline phosphatase in the waters of Odra river estuary. Przem. Chem. 2009, 5, 565–567. [Google Scholar]
- Zalewska, T.; Kraśniewski, W. Ocena Stanu Środowiska Polskich Obszarów Morskich Bałtyku na Podstawie Danych Monitoringowych z Roku 2020 na tle Dziesięciolecia 2010–2019; Inspekcja Ochrony Środowiska: Warszawa, Poland, 2021; pp. 130–144. [Google Scholar]
- Carter, A.M.; Blaszczak, J.R.; Heffernan, J.B.; Bernhardt, E.S. Hypoxia dynamics and spatial distribution in a low gradient river. Limnol Ocean. 2021, 66, 2251–2265. [Google Scholar] [CrossRef]
- Schmidt, S.; Bernard, C.; Escalier, J.M.; Etcheber, H.; Lamouroux, M. Assessing and managing the risks of hypoxia in transitional waters: A case study in the tidal Garonne River (South-West France). Environ. Sci. Pollut. Res. Int. 2017, 24, 3251–3259. [Google Scholar] [CrossRef] [PubMed]
- Lajaunie-Salla, K.; Sottolichio, A.; Schmidt, S.; Litrico, X.; Binet, G.; Abril, G. Future intensification of summer hypoxia in the tidal Garonne River (SW France) simulated by a coupled hydro sedimentary-biogeochemical model. Environ. Sci. Pollut. Res. Int. 2018, 25, 31957–31970. [Google Scholar] [CrossRef] [PubMed]
- Atwell, A.K.; Bouldin, J.L. Effects of Agricultural Intensity on Nutrient and Sediment Contributions within the Cache River Watershed, Arkansas. Water 2022, 14, 2528. [Google Scholar] [CrossRef]
- Kemp, W.M.; Testa, J.M.; Conley, D.J.; Gilbert, D.; Hagy, J.D. Temporal responses of coastal hypoxia to nutrient loading and physical controls. Biogeosciences 2009, 6, 2985–3008. [Google Scholar] [CrossRef]
- Ducharne, A.; Baubion, C.; Beaudoin, N.; Benoit, M.; Billen, G.; Brisson, N.; Garnier, J.; Kieken, H.; Lebonvallet, S.; Ledoux, E.; et al. Long term prospective of the Seine River system: Confronting climatic and direct anthropogenic changes. Sci. Total Environ. 2007, 375, 292–311. [Google Scholar] [CrossRef]
- Siwek, H.; Wesołowski, P.; Brysiewicz, A. Content of phosphorus and selected metals in bottom sediments of Starzyc Lake under conditions of pulverizing water aeration. J. Elem. 2014, 19, 1099–1108. [Google Scholar]
- Niemistö, J.; Silvonen, S.; Horppila, J. Effects of hypolimnetic aeration on the quantity and quality of settling material in a eutrophied dimictic lake. Hydrobiologia 2020, 847, 4525–4537. [Google Scholar] [CrossRef]
- Roy, S.M.; Jayraj, P.; Machavaram, R.; Pareek, C.M.; Mal, B. Diversified aeration facilities for effective aquaculture systems—A comprehensive review. Aquac. Int. 2021, 29, 1181–1217. [Google Scholar] [CrossRef]
- Boys, C.A.; Baldwin, D.S.; Ellis, I.; Pera, J.B.; Cheshire, K.J. Review of options for creating and maintaining oxygen refuges for fish during destratification-driven hypoxia in rivers. Mar. Freshw. Res. 2022, 73, 200–210. [Google Scholar] [CrossRef]
- Zhang, H.; Lyu, T.; Bi, L.; Tempero, G.; Hamilton, D.P.; Pan, G. Combating hypoxia/anoxia at sediment-water interfaces: A preliminary study of oxygen nanobubble modified clay materials. Sci. Total Environ. 2018, 637–638, 550–560. [Google Scholar] [CrossRef] [PubMed]
- Zhang, H.; Fennel, K.; Laurent, A.; Bian, C. A numerical model study of the main factors contributing to hypoxia and its interannual and short-term variability in the East China Sea. Biogeosciences 2020, 17, 5745–5761. [Google Scholar] [CrossRef]
- Ali, J.; Yang, Y.; Pan, G. Oxygen micro-nanobubbles for mitigating eutrophication induced sediment pollution in freshwater bodies. J Environ. Manag. 2023, 331, 117281. [Google Scholar] [CrossRef] [PubMed]
- Yang, L.N.; Li, Z.Y.; Zhang, X.Q. Distribution characteristics of dissolved oxygen and mechanism of hypoxia in the upper estuarine zone of the Daliaohe River. Huan Jing Ke Xue 2011, 32, 51–75. [Google Scholar] [PubMed]
- Rabalais, N.N.; Díaz, R.J.; Levin, L.A.; Turner, R.E.; Gilbert, D.; Zhang, J. Dynamics and distribution of natural and human-caused hypoxia. Biogeosciences 2010, 7, 585–619. [Google Scholar] [CrossRef]
Disclaimer/Publisher’s Note: The statements, opinions and data contained in all publications are solely those of the individual author(s) and contributor(s) and not of MDPI and/or the editor(s). MDPI and/or the editor(s) disclaim responsibility for any injury to people or property resulting from any ideas, methods, instructions or products referred to in the content. |
© 2023 by the authors. Licensee MDPI, Basel, Switzerland. This article is an open access article distributed under the terms and conditions of the Creative Commons Attribution (CC BY) license (https://creativecommons.org/licenses/by/4.0/).